mooc - eld final project draft - soil regeneration group - deepak sharma
TRANSCRIPT

Economics of Land Degradation in Catchments of Jaisamand Lake, Udaipur,
Rajasthan, India
Commissioner Tribal Development and Udaipur Division, Government of
Rajasthan, India
Presentation to
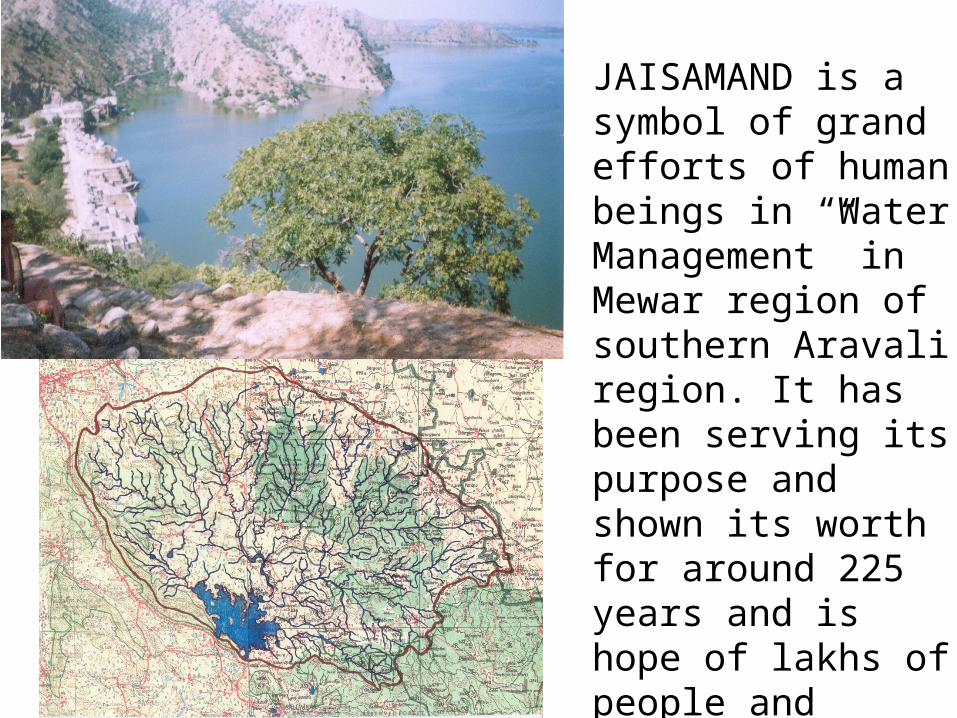
JAISAMAND is a symbol of grand efforts of human beings in “Water Management” in Mewar region of southern Aravali region. It has been serving its purpose and shown its worth for around 225 years and is hope of lakhs of people and millions of other form of life in the region

What We will be Discussing
• Land Use pattern and poor economic conditions of community in Jaisamand Catchments
• How ignorance of land particularly non-arable and Culturable wastelands 112317 Ha land is undergoing degradation
• Work done and benefits reared at Kadesha Pastureland (20 ha) by a group of 50 families under pilot support of GEF-SGP
• Cost-Benefit Calculation for 5 ha land if developed properly and applying principles of ELD with Net Present Value with discounted factor of 10%
• Marketable and non marketable services of properly developed form of these lands in the form of VBGPL
• Environmental services that investment in this area can provide
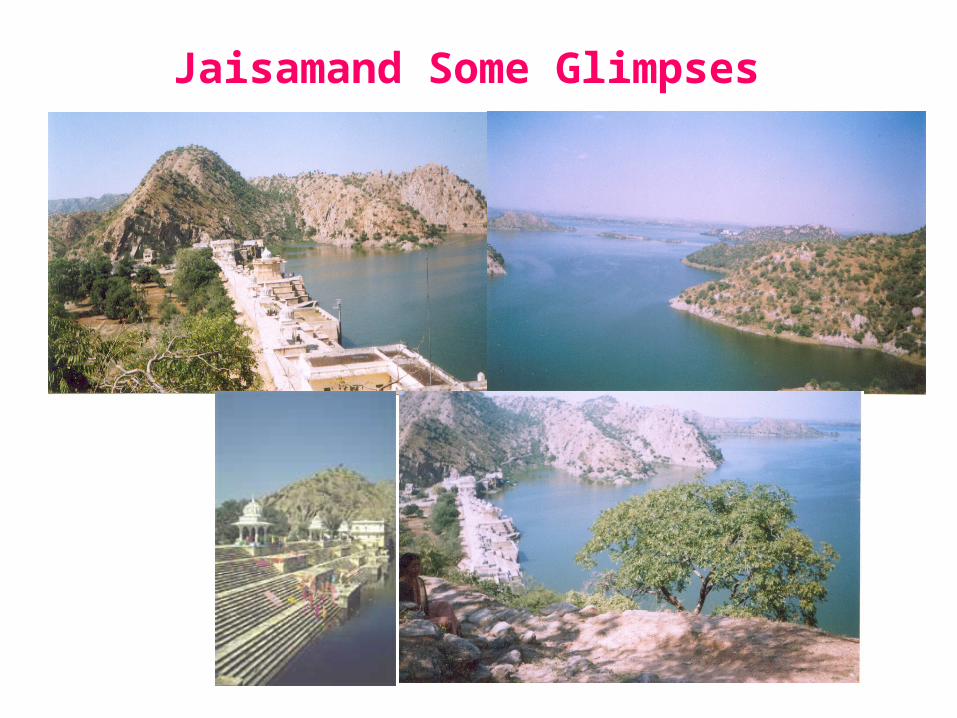
Jaisamand Some Glimpses

Jaisamand Catchments
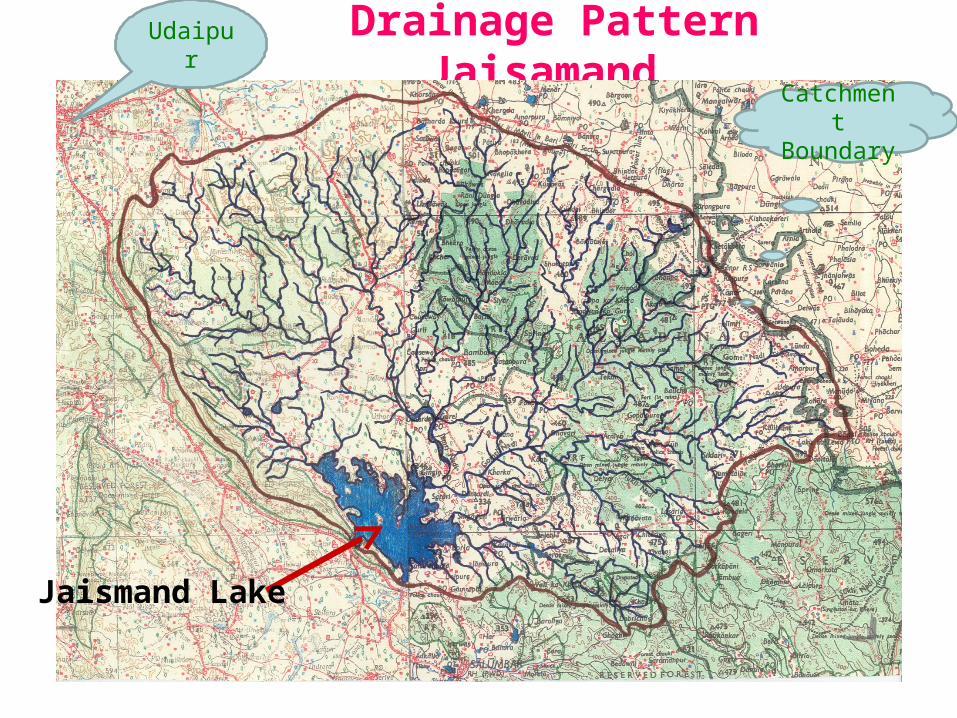
Drainage Pattern Jaisamand Udaipur
Catchment Boundary
Jaismand Lake
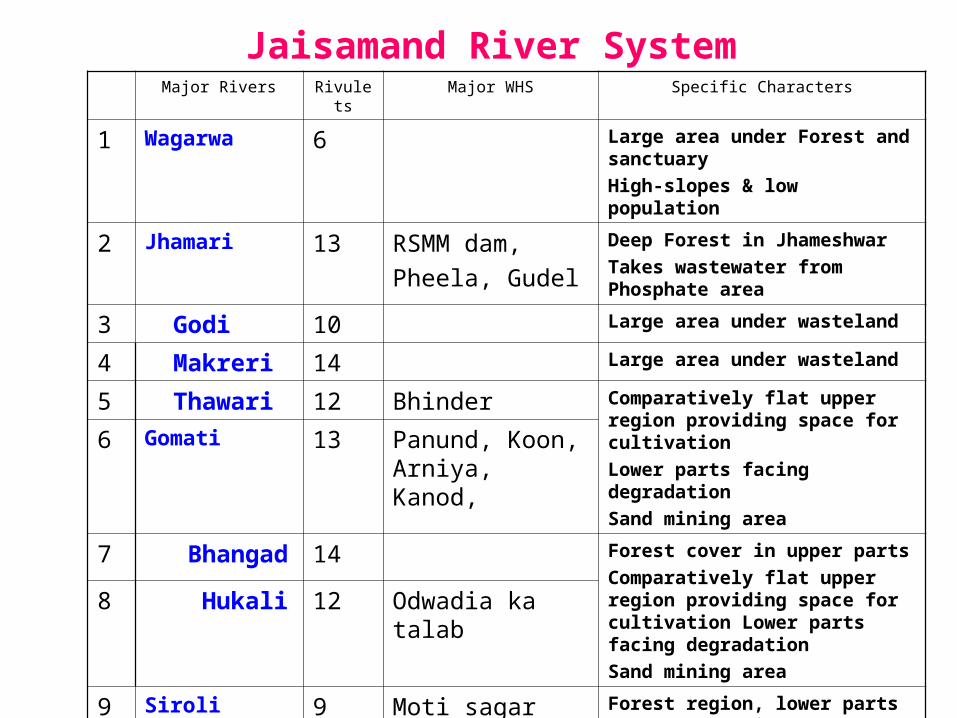
Jaisamand River SystemMajor Rivers Rivulets Major WHS Specific Characters
1 Wagarwa 6 Large area under Forest and sanctuary
High-slopes & low population
2 Jhamari 13 RSMM dam,
Pheela, Gudel
Deep Forest in Jhameshwar
Takes wastewater from Phosphate area
3 Godi 10 Large area under wasteland
4 Makreri 14 Large area under wasteland
5 Thawari 12 Bhinder Comparatively flat upper region providing space for cultivation
Lower parts facing degradation
Sand mining area
6 Gomati 13 Panund, Koon, Arniya, Kanod,
7 Bhangad 14 Forest cover in upper parts
Comparatively flat upper region providing space for cultivation Lower parts facing degradation
Sand mining area
8 Hukali 12 Odwadia ka talab
9 Siroli 9 Moti sagar Forest region, lower parts are flat cultivable
Direct rivulets 6 Forest region, lower parts are flat cultivable
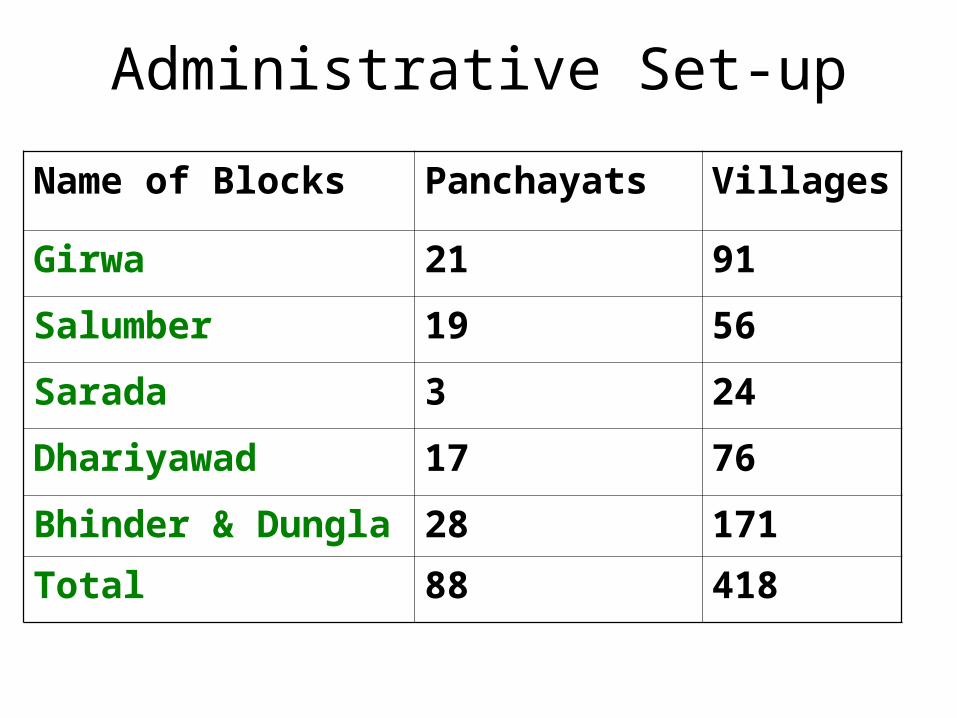
Administrative Set-up
Name of Blocks Panchayats Villages
Girwa 21 91
Salumber 19 56
Sarada 3 24
Dhariyawad 17 76
Bhinder & Dungla 28 171
Total 88 418

Land use pattern in Jaisamand - Census Record 2011
Forest 16%
Irrigated 6%
Rainfed 16% Culturabl
e Waste 25%
Non Arable
37%
Targeted Land
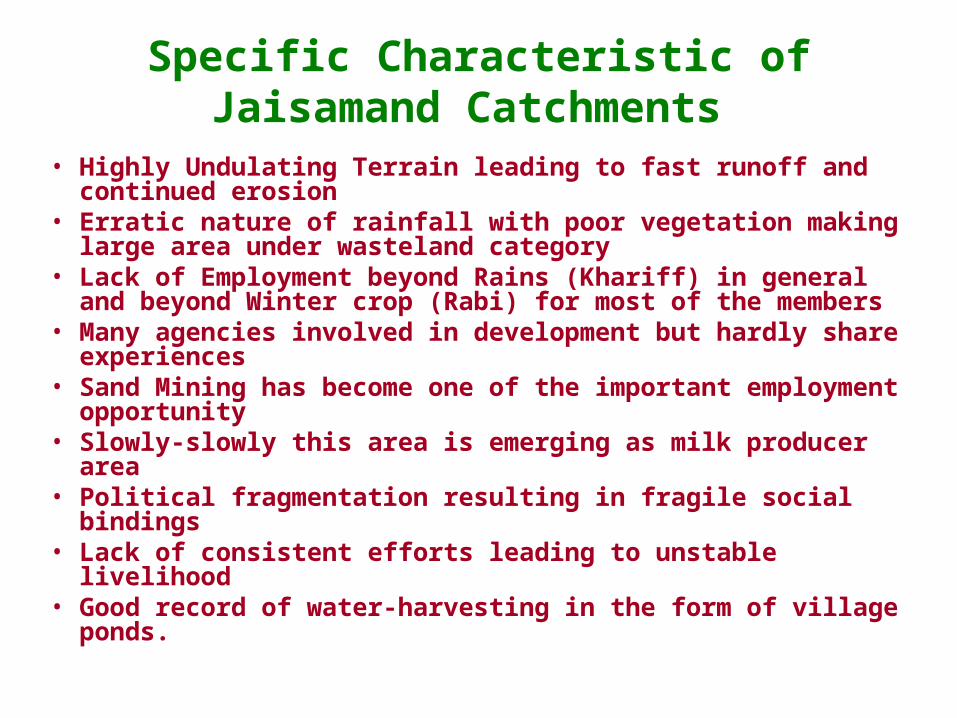
Specific Characteristic of Jaisamand Catchments
• Highly Undulating Terrain leading to fast runoff and continued erosion
• Erratic nature of rainfall with poor vegetation making large area under wasteland category
• Lack of Employment beyond Rains (Khariff) in general and beyond Winter crop (Rabi) for most of the members
• Many agencies involved in development but hardly share experiences
• Sand Mining has become one of the important employment opportunity
• Slowly-slowly this area is emerging as milk producer area• Political fragmentation resulting in fragile social bindings• Lack of consistent efforts leading to unstable livelihood• Good record of water-harvesting in the form of village
ponds.
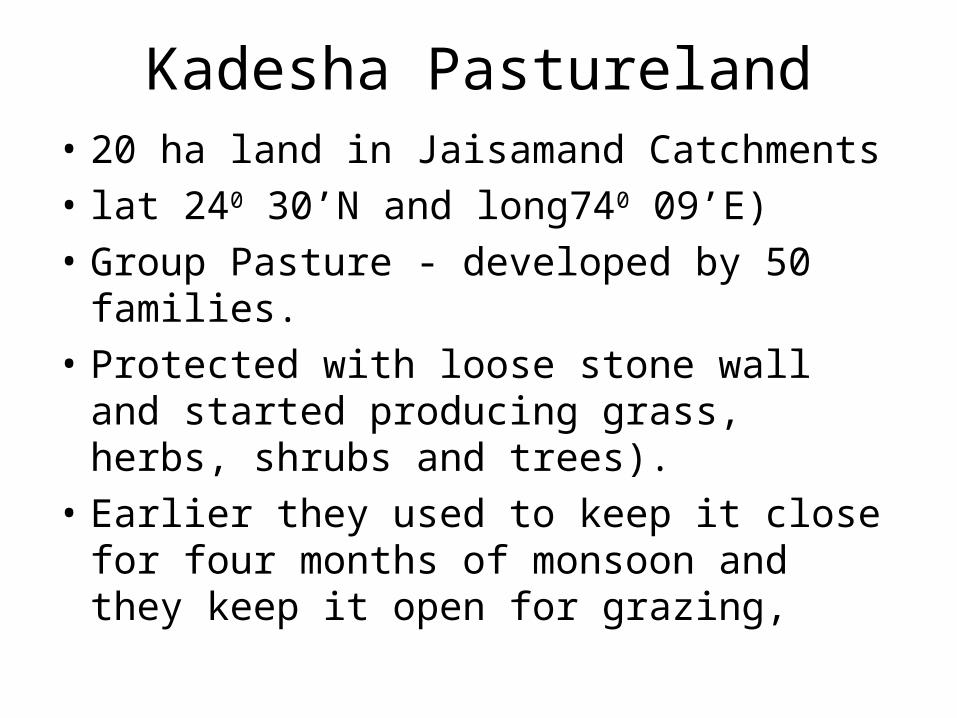
Kadesha Pastureland• 20 ha land in Jaisamand Catchments
• lat 240 30’N and long740 09’E)
• Group Pasture - developed by 50 families.
• Protected with loose stone wall and started producing grass, herbs, shrubs and trees).
• Earlier they used to keep it close for four months of monsoon and they keep it open for grazing,
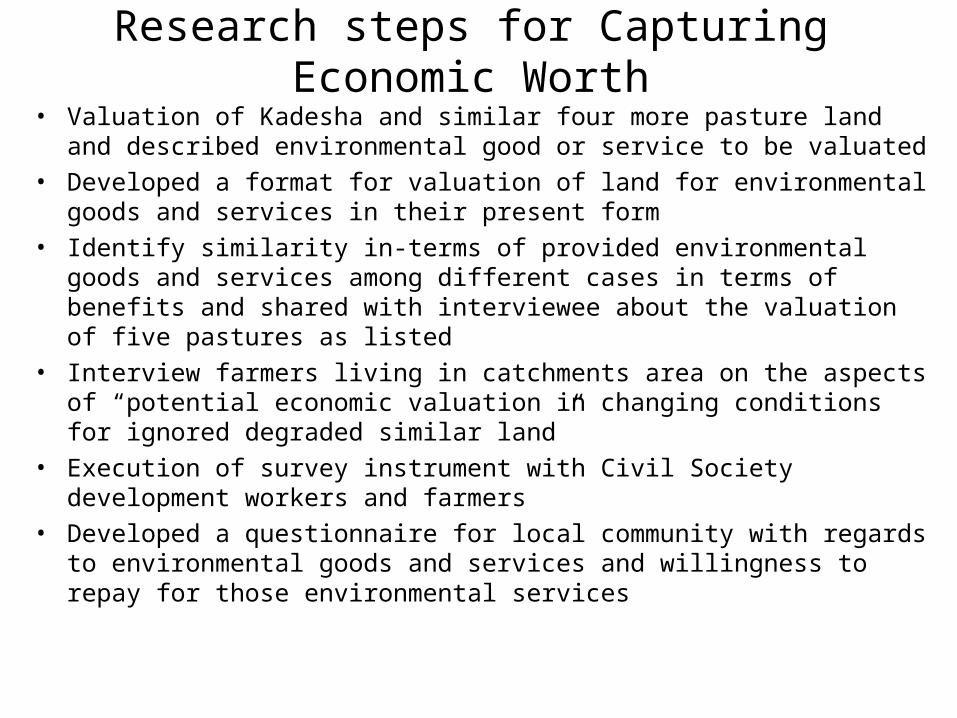
Research steps for Capturing Economic Worth• Valuation of Kadesha and similar four more pasture land and described
environmental good or service to be valuated• Developed a format for valuation of land for environmental goods and
services in their present form• Identify similarity in-terms of provided environmental goods and services
among different cases in terms of benefits and shared with interviewee about the valuation of five pastures as listed
• Interview farmers living in catchments area on the aspects of “potential economic valuation in changing conditions for ignored degraded similar land”
• Execution of survey instrument with Civil Society development workers and farmers
• Developed a questionnaire for local community with regards to environmental goods and services and willingness to repay for those environmental services
Environmental services
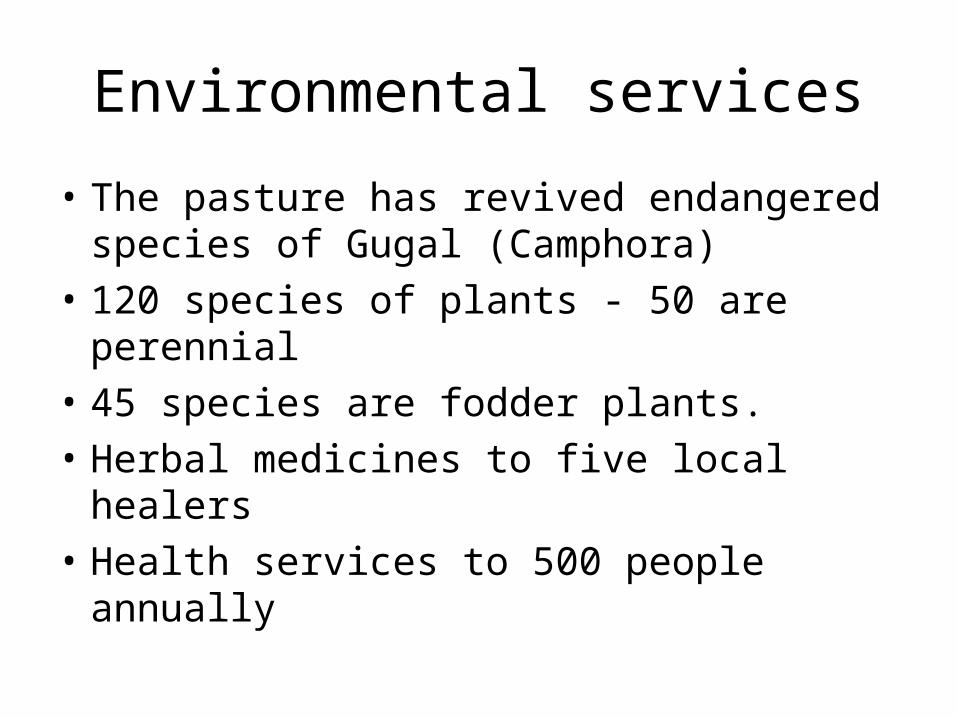
• The pasture has revived endangered species of Gugal (Camphora)
• 120 species of plants - 50 are perennial
• 45 species are fodder plants.
• Herbal medicines to five local healers
• Health services to 500 people annually
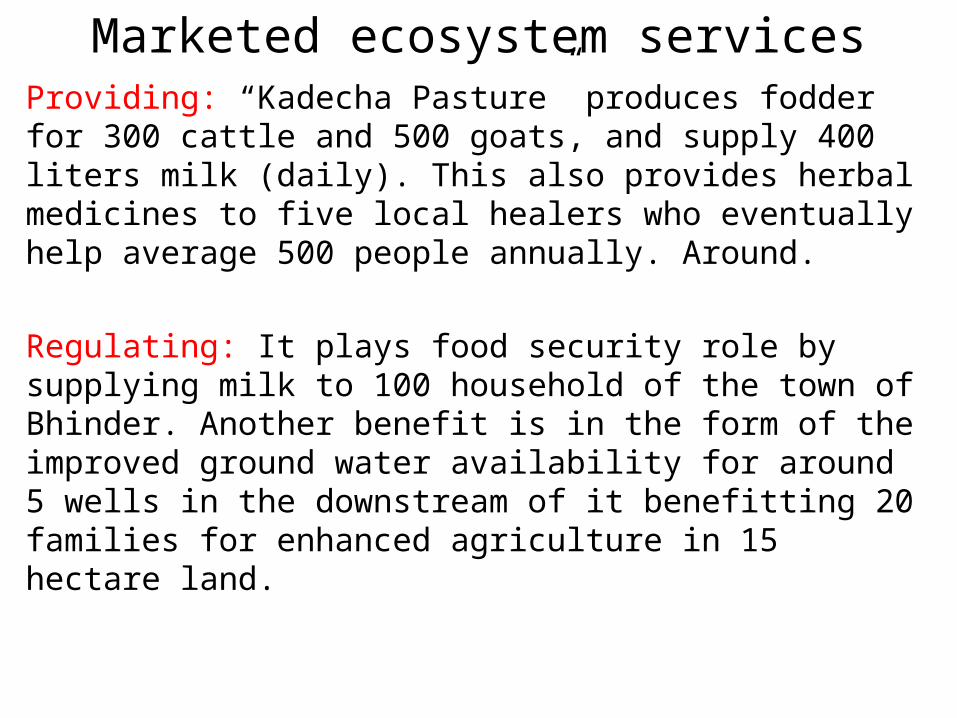
Marketed ecosystem servicesProviding: “Kadecha Pasture” produces fodder for 300 cattle and 500 goats, and supply 400 liters milk (daily). This also provides herbal medicines to five local healers who eventually help average 500 people annually. Around.
Regulating: It plays food security role by supplying milk to 100 household of the town of Bhinder. Another benefit is in the form of the improved ground water availability for around 5 wells in the downstream of it benefitting 20 families for enhanced agriculture in 15 hectare land.
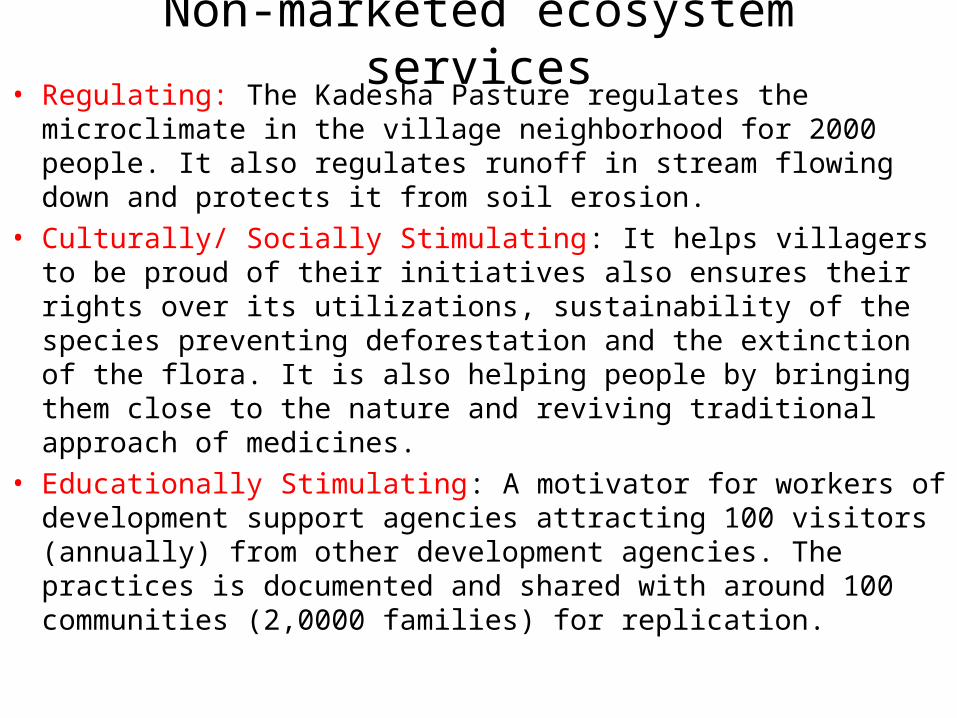
Non-marketed ecosystem services• Regulating: The Kadesha Pasture regulates the microclimate in
the village neighborhood for 2000 people. It also regulates runoff in stream flowing down and protects it from soil erosion.
• Culturally/ Socially Stimulating: It helps villagers to be proud of their initiatives also ensures their rights over its utilizations, sustainability of the species preventing deforestation and the extinction of the flora. It is also helping people by bringing them close to the nature and reviving traditional approach of medicines.
• Educationally Stimulating: A motivator for workers of development support agencies attracting 100 visitors (annually) from other development agencies. The practices is documented and shared with around 100 communities (2,0000 families) for replication.
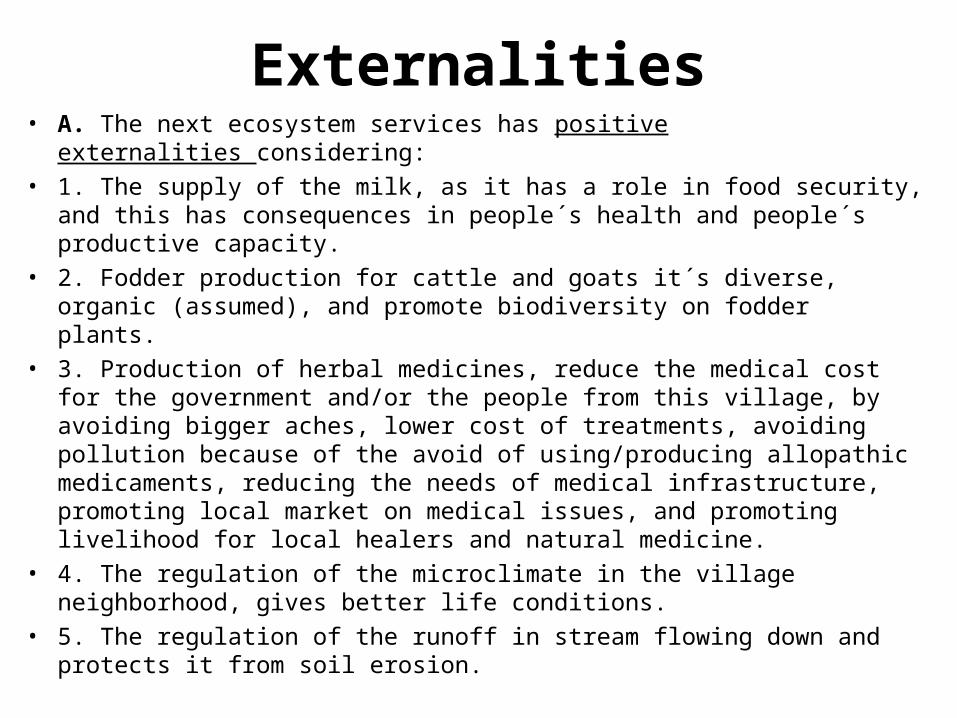
Externalities• A. The next ecosystem services has positive externalities considering:• 1. The supply of the milk, as it has a role in food security, and this has
consequences in people´s health and people´s productive capacity.• 2. Fodder production for cattle and goats it´s diverse, organic (assumed),
and promote biodiversity on fodder plants. • 3. Production of herbal medicines, reduce the medical cost for the
government and/or the people from this village, by avoiding bigger aches, lower cost of treatments, avoiding pollution because of the avoid of using/producing allopathic medicaments, reducing the needs of medical infrastructure, promoting local market on medical issues, and promoting livelihood for local healers and natural medicine.
• 4. The regulation of the microclimate in the village neighborhood, gives better life conditions.
• 5. The regulation of the runoff in stream flowing down and protects it from soil erosion.
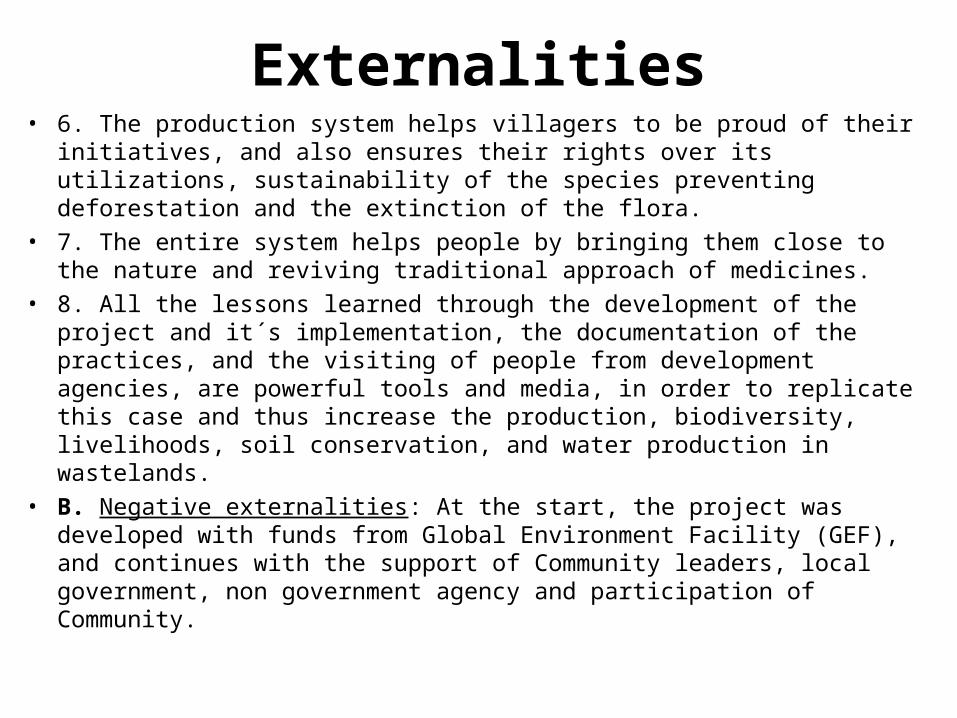
Externalities• 6. The production system helps villagers to be proud of their initiatives,
and also ensures their rights over its utilizations, sustainability of the species preventing deforestation and the extinction of the flora.
• 7. The entire system helps people by bringing them close to the nature and reviving traditional approach of medicines.
• 8. All the lessons learned through the development of the project and it´s implementation, the documentation of the practices, and the visiting of people from development agencies, are powerful tools and media, in order to replicate this case and thus increase the production, biodiversity, livelihoods, soil conservation, and water production in wastelands.
• B. Negative externalities: At the start, the project was developed with funds from Global Environment Facility (GEF), and continues with the support of Community leaders, local government, non government agency and participation of Community.
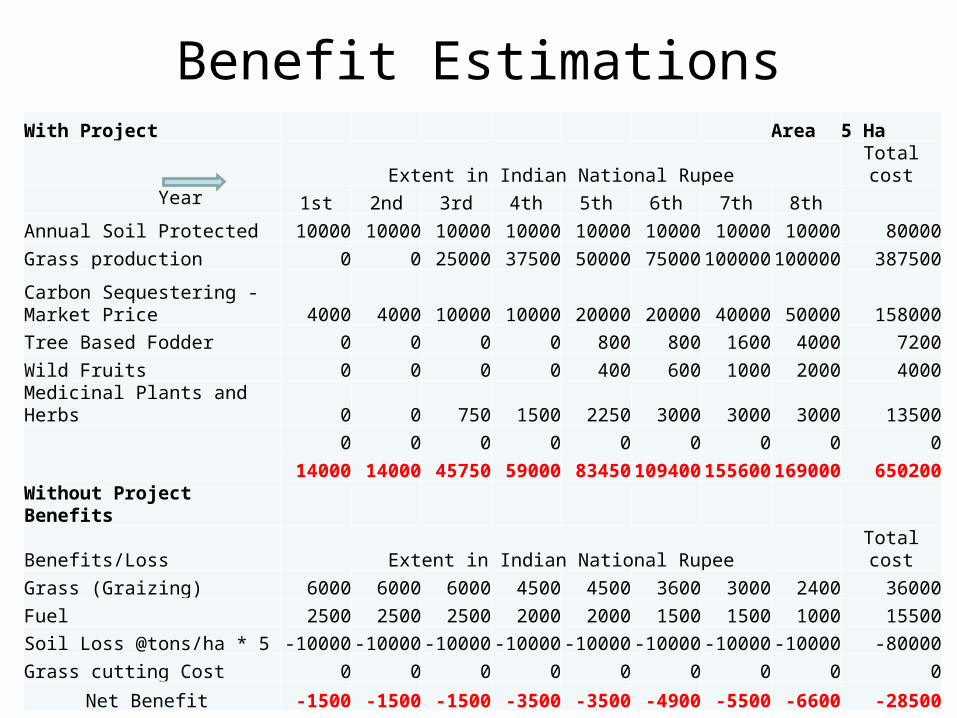
Benefit EstimationsWith Project Area 5 Ha
Extent in Indian National Rupee Total cost Year 1st 2nd 3rd 4th 5th 6th 7th 8th
Annual Soil Protected 10000 10000 10000 10000 10000 10000 10000 10000 80000
Grass production 0 0 25000 37500 50000 75000 100000 100000 387500
Carbon Sequestering - Market Price 4000 4000 10000 10000 20000 20000 40000 50000 158000
Tree Based Fodder 0 0 0 0 800 800 1600 4000 7200
Wild Fruits 0 0 0 0 400 600 1000 2000 4000
Medicinal Plants and Herbs 0 0 750 1500 2250 3000 3000 3000 13500
0 0 0 0 0 0 0 0 0
14000 14000 45750 59000 83450 109400 155600 169000 650200
Without Project Benefits
Benefits/Loss Extent in Indian National Rupee Total cost
Grass (Graizing) 6000 6000 6000 4500 4500 3600 3000 2400 36000
Fuel 2500 2500 2500 2000 2000 1500 1500 1000 15500
Soil Loss @tons/ha * 5 -10000 -10000 -10000 -10000 -10000 -10000 -10000 -10000 -80000
Grass cutting Cost 0 0 0 0 0 0 0 0 0
Net Benefit -1500 -1500 -1500 -3500 -3500 -4900 -5500 -6600 -28500
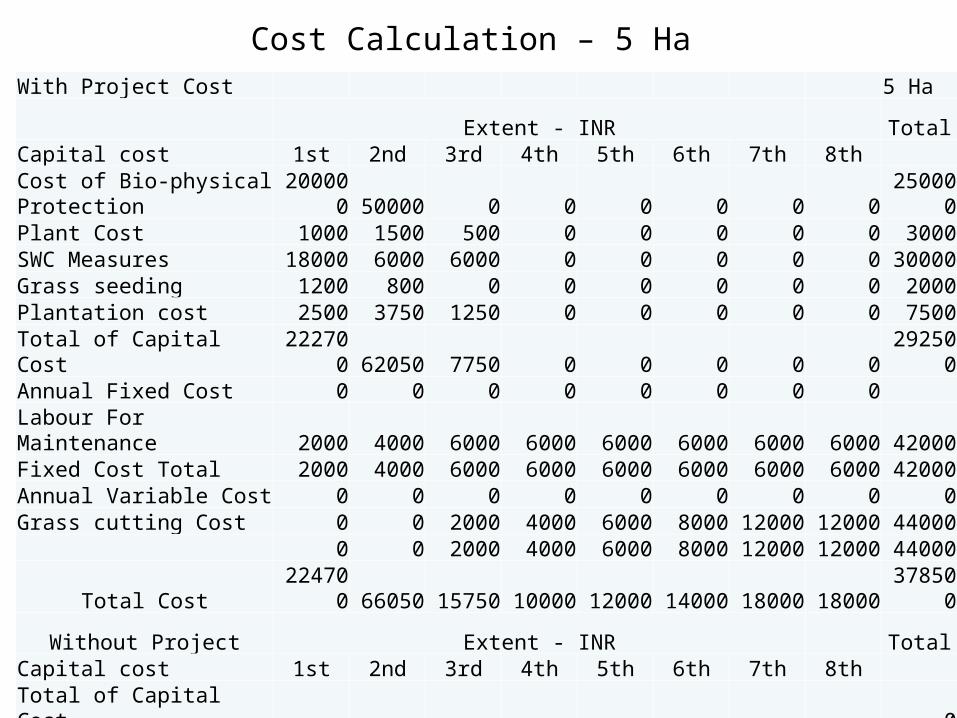
Cost Calculation – 5 HaWith Project Cost 5 Ha
Extent - INR TotalCapital cost 1st 2nd 3rd 4th 5th 6th 7th 8th Cost of Bio-physical Protection 200000 50000 0 0 0 0 0 0 250000Plant Cost 1000 1500 500 0 0 0 0 0 3000SWC Measures 18000 6000 6000 0 0 0 0 0 30000Grass seeding 1200 800 0 0 0 0 0 0 2000Plantation cost 2500 3750 1250 0 0 0 0 0 7500Total of Capital Cost 222700 62050 7750 0 0 0 0 0 292500Annual Fixed Cost 0 0 0 0 0 0 0 0 Labour For Maintenance 2000 4000 6000 6000 6000 6000 6000 6000 42000Fixed Cost Total 2000 4000 6000 6000 6000 6000 6000 6000 42000Annual Variable Cost 0 0 0 0 0 0 0 0 0Grass cutting Cost 0 0 2000 4000 6000 8000 12000 12000 44000 0 0 2000 4000 6000 8000 12000 12000 44000
Total Cost 224700 66050 15750 10000 12000 14000 18000 18000 378500
Without Project Extent - INR TotalCapital cost 1st 2nd 3rd 4th 5th 6th 7th 8th Total of Capital Cost 0Annual Fixed Cost Annual Variable Cost 0
Total Cost 0 0 0 0 0 0 0 0
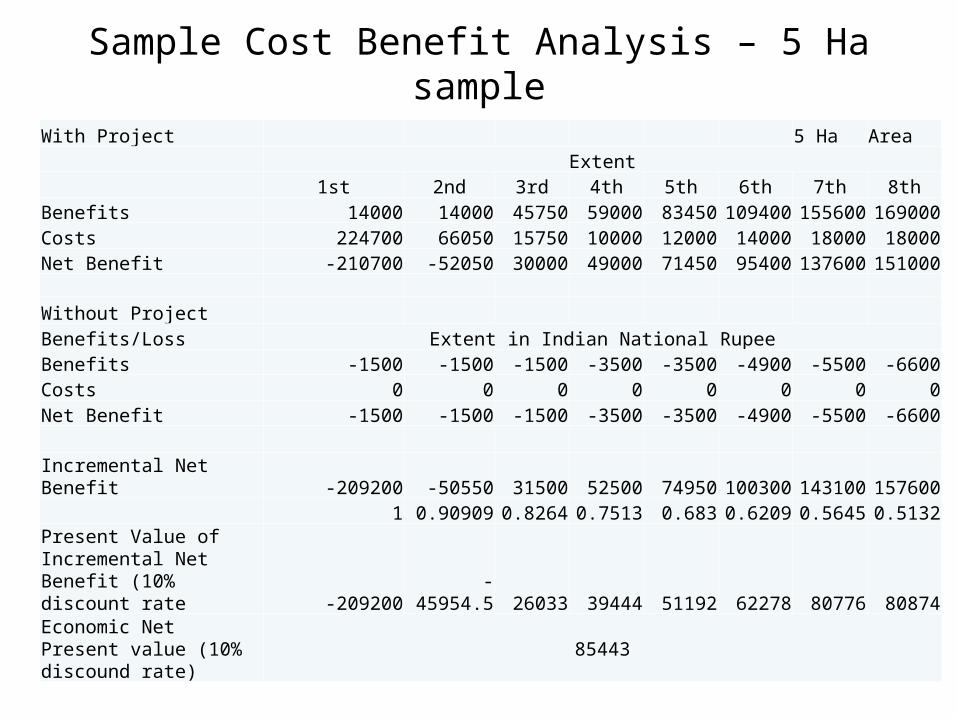
Sample Cost Benefit Analysis – 5 Ha sample
With Project 5 Ha Area Extent
1st 2nd 3rd 4th 5th 6th 7th 8thBenefits 14000 14000 45750 59000 83450 109400 155600 169000Costs 224700 66050 15750 10000 12000 14000 18000 18000Net Benefit -210700 -52050 30000 49000 71450 95400 137600 151000
Without ProjectBenefits/Loss Extent in Indian National RupeeBenefits -1500 -1500 -1500 -3500 -3500 -4900 -5500 -6600Costs 0 0 0 0 0 0 0 0Net Benefit -1500 -1500 -1500 -3500 -3500 -4900 -5500 -6600
Incremental Net Benefit -209200 -50550 31500 52500 74950 100300 143100 157600 1 0.90909 0.8264 0.7513 0.683 0.6209 0.5645 0.5132
Present Value of Incremental Net Benefit (10% discount rate -209200 -45954.5 26033 39444 51192 62278 80776 80874
Economic Net Present value (10% discound rate)
85443
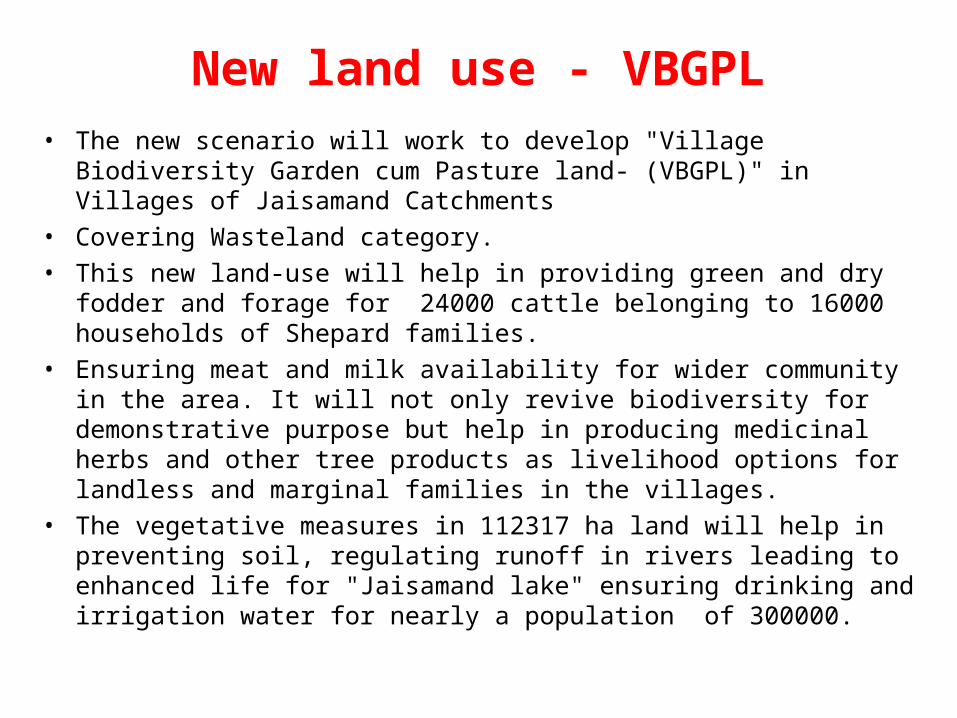
New land use - VBGPL• The new scenario will work to develop "Village Biodiversity Garden cum
Pasture land- (VBGPL)" in Villages of Jaisamand Catchments• Covering Wasteland category. • This new land-use will help in providing green and dry fodder and
forage for 24000 cattle belonging to 16000 households of Shepard families.
• Ensuring meat and milk availability for wider community in the area. It will not only revive biodiversity for demonstrative purpose but help in producing medicinal herbs and other tree products as livelihood options for landless and marginal families in the villages.
• The vegetative measures in 112317 ha land will help in preventing soil, regulating runoff in rivers leading to enhanced life for "Jaisamand lake" ensuring drinking and irrigation water for nearly a population of 300000.
0
10000
20000
30000
40000
50000
60000
Are
a in
Hect
are
s
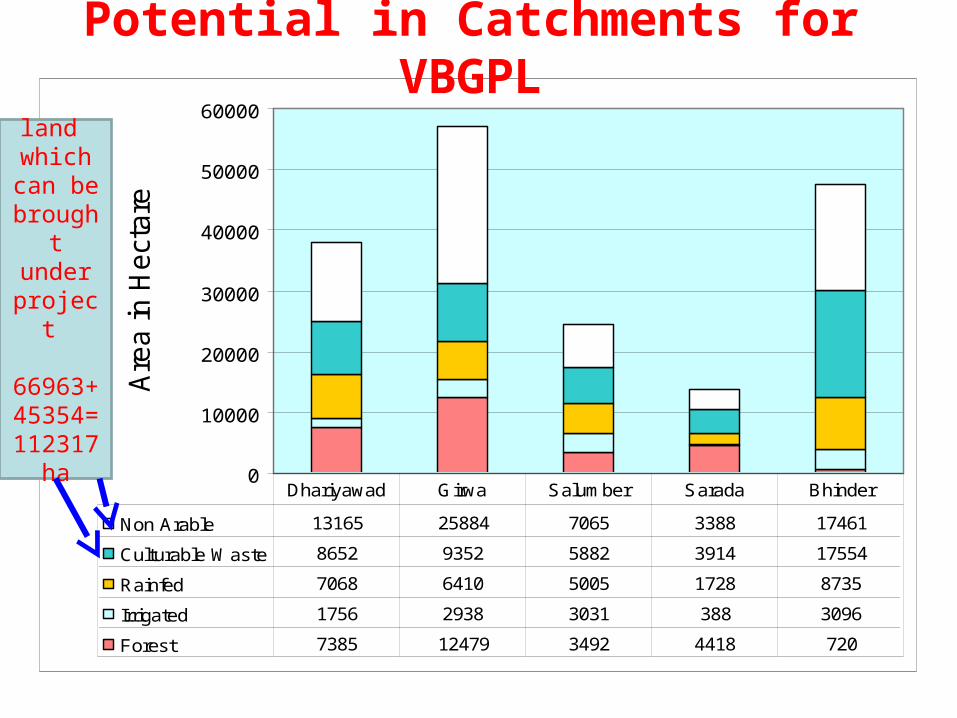
Non Arable 13165 25884 7065 3388 17461
Culturable Waste 8652 9352 5882 3914 17554
Rainfed 7068 6410 5005 1728 8735
Irrigated 1756 2938 3031 388 3096
Forest 7385 12479 3492 4418 720
Dhariyawad Girwa Salumber Sarada Bhinder
land which can be brought under
project
66963+45354= 112317
ha
Potential in Catchments for VBGPL

Community Recommendation from Research Survey
• Almost all people indicated that such land should not be ignored; rather they should be protected properly.
• 85% farmers informed that ignored land belongs to revenue department• Each village/hamlet should be assigned some land based on number of
households/families. • This will require a separate institution for controlling ecological and
environmental conditions in the area.• 100% farmer’s recommended government to put initial investment for
protection and soil and water conservation measures and agreed on taking fodder plantation drive and grass rejuvenation work in groups
• Though local healer was little hesitated on the aspects of payment for what he harvest from Kadesha Pasture initially.
• This pilot survey has given us process to take this learning forward, once we get some allocations we will be taking-it up soon.

Institutional structure• Village Biodiversity Protection and
Management Committee -VBPMC
• Jaisamand Herbal Heelers Forum (JHHF) and
• Jaisamand Minor Forest Produce Forum (JMFPF) etc.
• Jaisamand Biodiversity Management Stakeholders Forum (JBMSF)
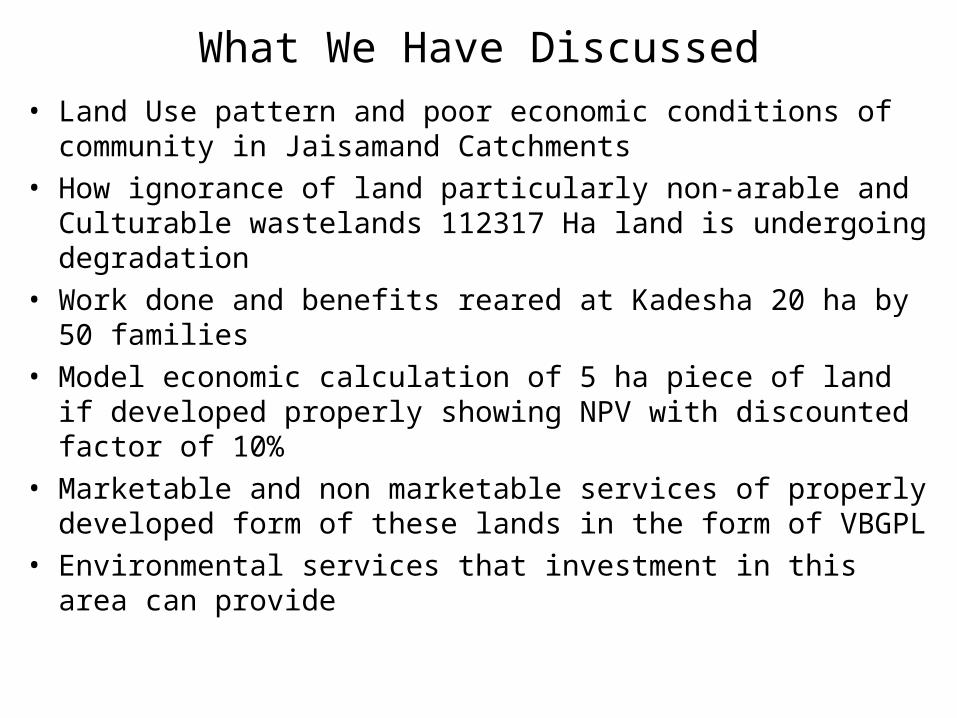
What We Have Discussed
• Land Use pattern and poor economic conditions of community in Jaisamand Catchments
• How ignorance of land particularly non-arable and Culturable wastelands 112317 Ha land is undergoing degradation
• Work done and benefits reared at Kadesha 20 ha by 50 families
• Model economic calculation of 5 ha piece of land if developed properly showing NPV with discounted factor of 10%
• Marketable and non marketable services of properly developed form of these lands in the form of VBGPL
• Environmental services that investment in this area can provide
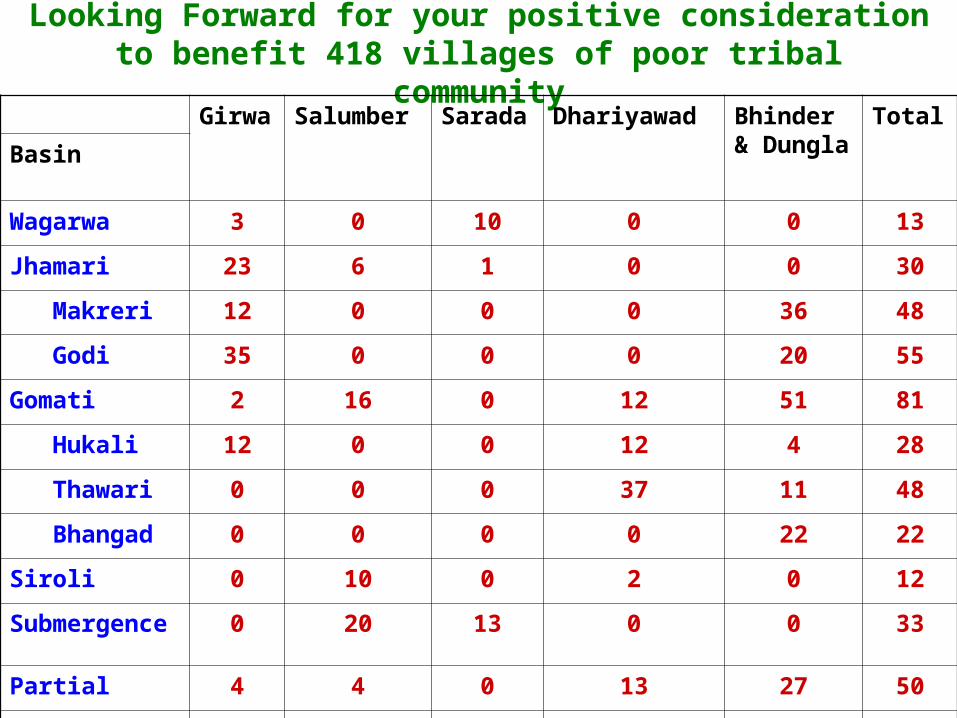
Looking Forward for your positive consideration to benefit 418 villages of poor tribal communityGirwa Salumber Sarada Dhariyawad Bhinder &
DunglaTotal
Basin
Wagarwa 3 0 10 0 0 13
Jhamari 23 6 1 0 0 30
Makreri 12 0 0 0 36 48
Godi 35 0 0 0 20 55
Gomati 2 16 0 12 51 81
Hukali 12 0 0 12 4 28
Thawari 0 0 0 37 11 48
Bhangad 0 0 0 0 22 22
Siroli 0 10 0 2 0 12
Submergence 0 20 13 0 0 33
Partial 4 4 0 13 27 50
Total 91 56 24 76 171 418
FLD-MOOC online Training Course