multiplexed protein quantitation in saccharomyces ...multiplexed protein quantitation in...
TRANSCRIPT

Multiplexed Protein Quantitation inSaccharomyces cerevisiae UsingAmine-reactive Isobaric Tagging Reagents*□S
Philip L. Ross‡, Yulin N. Huang‡, Jason N. Marchese‡, Brian Williamson‡,Kenneth Parker‡, Stephen Hattan‡, Nikita Khainovski‡, Sasi Pillai‡, Subhakar Dey‡,Scott Daniels‡, Subhasish Purkayastha‡, Peter Juhasz‡, Stephen Martin‡,Michael Bartlet-Jones§, Feng He¶, Allan Jacobson¶, and Darryl J. Pappin‡�**
We describe here a multiplexed protein quantitation strat-egy that provides relative and absolute measurements ofproteins in complex mixtures. At the core of this method-ology is a multiplexed set of isobaric reagents that yieldamine-derivatized peptides. The derivatized peptides areindistinguishable in MS, but exhibit intense low-massMS/MS signature ions that support quantitation. In thisstudy, we have examined the global protein expression ofa wild-type yeast strain and the isogenic upf1� and xrn1�mutant strains that are defective in the nonsense-medi-ated mRNA decay and the general 5� to 3� decay path-ways, respectively. We also demonstrate the use of 4-foldmultiplexing to enable relative protein measurements si-multaneously with determination of absolute levels of atarget protein using synthetic isobaric peptide standards.We find that inactivation of Upf1p and Xrn1p causes com-mon as well as unique effects on protein expression.Molecular & Cellular Proteomics 3:1154–1169, 2004.
An initial step in the systematic investigation of cellularprocesses is the identification and measurement of expres-sion levels of relevant sets of proteins. Recently, quantitativeapproaches utilizing MS and a host of stable isotope-labelingchemistries have emerged (reviewed in Refs. 1 and 2), offeringa departure from traditional techniques employing compara-tive two-dimensional gel electrophoresis. The ICAT quantita-tive labeling strategy (3, 4) is perhaps the best-characterizedmethod for relative protein quantitation using MS. Other ele-gant approaches use cell-culture enrichment with a stableisotope-labeled amino acid, including arginine (5), lysine (6),tyrosine (7), and leucine (8), for in vivo incorporation of a mass
difference to support relative quantitation. This circumventspotential difficulties surrounding chemical labeling down-stream in a comparative experiment. All of these methodsimpart a mass difference as the basis for quantitation bymeasurement of relative peak areas of MS and/or MS/MSmass spectra. There are, however, a number of limitationsimposed by mass-difference labeling. The mass-differenceconcept for many practical purposes is limited to a binary(2-plex) set of reagents, and this makes comparison of mul-tiple states (e.g. several experimental controls or time-coursestudies) difficult to undertake. Multiple 2-plex datasets can becombined after separate analyses, but there is a high likeli-hood that different sets of peptides and proteins will be iden-tified between each experiment. In addition, the use of mass-difference labels increases MS complexity, and this problemincreases with numbers of a multiplexed set. Finally, the cys-teine-selective affinity strategy for reduction of sample com-plexity (ICAT) is not amenable to identification of post-trans-lationally modified peptides, as the majority of post-translational modification (PTM)1-containing peptides arediscarded at the affinity step.
We have developed a multiplexed set of reagents for quan-titative protein analysis that place isobaric mass labels at theN termini and lysine side chains of peptides in a digest mix-ture. The reagents are differentially isotopically labeled suchthat all derivatized peptides are isobaric and chromatograph-ically indistinguishable, but yield signature or reporter ionsfollowing CID that can be used to identify and quantify indi-vidual members of the multiplex set. Absolute quantitation oftargeted proteins can also be achieved using synthetic pep-tides tagged with one of the members of the multiplex reagentset.
In this study, we make use of a 4-fold (4-plex) multiplexstrategy to simultaneously determine relative protein levels inthree yeast strains and provide a demonstration of the abilityto measure the absolute quantity of specific target proteins
From ‡Applied Biosystems, Framingham, MA 01701; §Cancer Re-search UK, London WC2A 3PX, United Kingdom; ¶Department ofMolecular Genetics and Microbiology, University of Massachusetts,Medical School, Worcester, MA 01655; and �Section of Proteomics,Imperial College, Hammersmith Campus, London W12 ONN, UnitedKingdom
Received, September 16, 2004, and in revised form, September 22,2004
Published, MCP Papers in Press, September 22, 2004, DOI10.1074/mcp.M400129-MCP200
1 The abbreviations used are: PTM, post-translational modification;TCEP, Tris-(2-carboxyethyl)phosphine; TEAB, triethylammonium bi-carbonate; NHS, N-hydroxy succinimide; SCX, strong cationexchange.
Research
© 2004 by The American Society for Biochemistry and Molecular Biology, Inc.1154 Molecular & Cellular Proteomics 3.12This paper is available on line at http://www.mcponline.org
by on February 9, 2007
ww
w.m
cponline.orgD
ownloaded from
/DC1http://www.mcponline.org/cgi/content/full/M400129-MCP200Supplemental Material can be found at:

through the use of internal peptide standards. Of particularinterest is validation of quantitation via a peptide-based work-flow whereby protein extraction, digestion, and labeling areperformed in parallel, prior to mixing labeled samples forchromatography and MS. A well-characterized system suchas yeast provides the opportunity to validate some novelaspects of this quantitative methodology. In this study, wehave examined the global protein expression of a wild-typeyeast strain and the isogenic upf1� and xrn1� mutant strainsthat are defective in the nonsense-mediated mRNA decay andthe general 5� to 3� decay pathway, respectively (9, 10). Avariety of global changes are observed, including consistentup-regulation of a common set of proteins involved in aminoacid biosynthetic pathways in both upf1� and xrn1� strains,and specific down-regulation of proteins of the translationapparatus in the xrn1� strain.
MATERIALS AND METHODS
Protein Mixture—A protein mix consisting of equimolar amounts ofBSA, �-casein, alcohol dehydrogenase, lysozyme, �-galactosidase,and serotransferrin (all from Sigma, Milwaukee, WI) was reduced (2mM Tris-(2-carboxyethyl)phosphine (TCEP), 37 °C, 1 h), alkylated (5mM iodoacetamide, 37 °C, 2 h) and digested with trypsin (1:20 w/w,50 mM triethylammonium bicarbonate (TEAB), 37 °C, 18 h). Four equalaliquots were treated each with one of the four isotopically enrichedmethylpiperazine acetic acid N-hydroxy succinimide (NHS) ester re-agents by adding 0.5 mg of reagent in ethanol to 50 �l of peptidesolution (70% v/v final ethanol) and allowed to react for 30 min atroom temperature. The four reactions were combined in various pro-portions, evaporated to dryness, and quantities representing 500 fmolof each component analyzed by LC-MS/MS as described below.
Yeast Protein Extraction and Labeling—Log phase cells (75% log;2.1 � 107 cells/ml) were harvested, frozen, and mechanically lysed bygrinding over dry ice. Crude cell lysate was prepared by suspendingfrozen cellular material (100 mg wet weight) in 1 ml of lysis buffer (0.1M TEAB, 0.1% v/v Triton X-100, 6 M guanidine), vortexing (1 min),sonicating (5 � 30 s), and pelleting insoluble debris by centrifugationat 13,000 � g for 5 min. Final measured protein concentrations were3–3.4 mg/ml. Protein was reduced (2 mM TCEP, 37 °C, 1 h), alkylated(5 mM iodoacetamide, 37 °C, 2 h), and precipitated by the addition of6 volumes of cold acetone (dry ice 20 min). Protein was collected bycentrifugation (13,000 � g, 5 min), dried in air, and frozen at �80 °C.For digestion, protein was resuspended in digestion buffer (100 mM
TEAB, 0.05% w/v SDS) to a final concentration of 1 mg/ml (totalprotein measured by bicinchonic acid assay (Sigma, St. Louis, MO)).Equal aliquots (500 �g) from each lysate were then digested withtrypsin overnight at 37 °C (Sigma; 1:40 w/w added at 0 and 2 h) andlyophilized.
Labeling with Multiplex Reagents—Synthesis of the four derivatiza-tion reagents is discussed elsewhere (11). For each yeast strain, 150�g of total protein was resuspended in 100 �l of labeling buffer (0.25M TEAB, 75% ethanol), after which 1 mg of each isotopically enrichedmethylpiperazine acetic acid NHS ester was added (1% w/v final) andallowed to react at room temperature for 30 min. Residual reagentwas quenched by adding 300 �l of water and allowing excess reagentto completely hydrolyze over an additional 30 min, then the threelabeled samples were mixed and lyophilized.
Cation Exchange Chromatography—The combined peptide mix-ture was separated by strong cation exchange (SCX) chromatographyon an Agilent 1100 HPLC system using a PolySulfoethyl A column(4.6 � 100 mm, 5 �m, 300 Å). Sample was dissolved in 4 ml of SCX
loading buffer (25% v/v ACN, 10 mM KH2PO4, pH 3, with phosphoricacid) and loaded and washed isocratically for 20 min at 0.5 ml/min toremove excess reagent. Peptides were eluted with a linear gradient of0–500 mM KCl (25% v/v ACN, 10 mM KH2PO4, pH 3) over 15 min ata flow rate of 1 ml/min, with fractions collected at 1-min intervals.
LC-MS Analysis—Peptide separation was performed on an Ulti-mate™ chromatography system (Dionex-LC Packings, Hercules, CA)equipped with a Probot MALDI spotting device. Individual SCX frac-tions containing �10 �g of protein material were injected and cap-tured onto a 0.3 � 5-mm trap column (3-�m C18 (Dionex-LC Pack-ings, Hercules, CA)) and then eluted onto a 0.1 � 150-mm analyticalcolumn (3-�m C18 (Dionex-LC Packings)) using an automated binarygradient (800 nl/min) from 95% buffer A (2% ACN, 0.1% TFA) to 45%buffer B (85% ACN, 5% isopropanol, 0.1% TFA) over 35 min, then45–90% B in 5 min. For MALDI MS/MS analysis, column effluent wasmixed in a 1:2 ratio with MALDI matrix (7 mg/ml-�-cyano-4-hydroxy-cinnamic acid) through a 25-nl mixing tee (Upchurch Scientific, OakHarbor, WA) and spotted in 16 � 16 spot arrays. MALDI plates wereanalyzed on an ABI 4700 (Applied Biosystems, Framingham, MA)proteomics analyzer. Peptide CID was performed at a collision energyof 1 kV and a collision gas pressure of �1.5 � 10�6 Torr. Forelectrospray analysis, an Ultimate LC system interfaced to a QstarPulsar™ (Applied Biosystems-MDS Sciex) mass spectrometer wasused. The LC conditions were similar to those used for LC-MALDI,with peptides separated at a flow rate of 300 nl/min over a 75-�m �150-mm C18 column (Pepmap; Dionex) using a 2-h gradient of5–35% B (A, 2% ACN/0.1% formic acid; B, 98% ACN/0.1% formicacid). Survey scans were acquired from m/z 300–1,500 with up tothree precursors selected for MS/MS from m/z 90–2,000 usingdynamic exclusion. A rolling collision energy was used to promotefragmentation, typical average values for doubly charged ions were41 and 56 V for m/z 600 and 900, respectively, and for triplycharged ions typical average values were 29 and 43 V for m/z 600and 900, respectively. The collision energy range was �20% higherthan that used for unlabeled peptides to overcome the stabilizingeffect of the basic N-terminal derivative and achieve equivalentfragmentation.
Data Analysis and Interpretation—Peptide and protein identifica-tions were performed using the Mascot search engine (ver. 1.9; MatrixScience, London, United Kingdom) (12). Database searching wasrestricted to tryptic peptides of yeast (Swiss-Prot version 42.5; 4,924Saccharomyces cerevisiae sequences; 138,922 total sequences). S-acetamido, N-terminal, and lysine modifications were selected asfixed, methionine oxidation as variable, one missed cleavage allowedand precursor error tolerance at �50 ppm. Full trypsin specificity (N-and C-terminal was also applied. Signature-ion peak areas from theisobaric tags were extracted from the 4700 or QSTAR raw data andmatched to identified peptides using prototype software tools. Thecomplete list of identified peptides was then housed in an Access(Microsoft, Redmond, WA) database for grouping of results into pro-teins and calculation of ratios and standard deviation. Abundanceratio calculations included corrections for overlapping isotopic con-tributions (both natural and enriched 13C components).
RESULTS AND DISCUSSION
Features of Multiplexed Tagging Chemistry—The compo-nents of the multiplexed derivatization chemistry are intro-duced in Figs. 1 and 2. In preliminary studies, we used areduced and alkylated protein digest mixture as a simplemodel system to validate the labeling protocol and the usageof MS/MS signature ions for quantitation. A digest mixture ofsix proteins was split into four identical aliquots. Each was
Multiplexed Quantitation Using Isobaric Reagents
Molecular & Cellular Proteomics 3.12 1155
by on February 9, 2007
ww
w.m
cponline.orgD
ownloaded from

then labeled with one of the four isotopically labeled tags, andthe derivatized digests combined in mixtures of varying pro-portions. The multiplex isobaric tags produce abundantMS/MS signature ions at m/z 114.1, 115.1, 116.1, and 117.1,and the relative areas of these peaks correspond with theproportions of the labeled peptides. We have found that thismass range also has minimal contamination with backgroundlow-mass fragments produced from CID fragmentation of
peptides using either MALDI or ESI-based tandem massspectrometers.
The mass shift imposed by isotopic enrichment of eachsignature ion is balanced with isotopic enrichment at thecarbonyl component of the derivative, such that the totalmass of each of the four tags is identical. Thus any givenpeptide labeled with each of the four tags has the samenominal mass, an important characteristic that provides a
FIG. 1. A, diagram showing the components of the multiplexed isobaric tagging chemistry. The complete molecule consists of a reportergroup (based on N-methylpiperazine), a mass balance group (carbonyl), and a peptide-reactive group (NHS ester). The overall mass of reporterand balance components of the molecule are kept constant using differential isotopic enrichment with 13C, 15N, and 18O atoms (B), thusavoiding problems with chromatographic separation seen with enrichment involving deuterium substitution. The number and position ofenriched centers in the ring has no effect on chromatographic or MS behavior. The reporter group ranges in mass from m/z 114.1 to 117.1,while the balance group ranges in mass from 28 to 31 Da, such that the combined mass remains constant (145.1 Da) for each of the fourreagents. B, when reacted with a peptide, the tag forms an amide linkage to any peptide amine (N-terminal or � amino group of lysine). Theseamide linkages fragment in a similar fashion to backbone peptide bonds when subjected to CID. Following fragmentation of the tag amidebond, however, the balance (carbonyl) moiety is lost (neutral loss), while charge is retained by the reporter group fragment. The numbers inparentheses indicate the number of enriched centers in each section of the molecule. C, illustration of the isotopic tagging used to arrive atfour isobaric combinations with four different reporter group masses. A mixture of four identical peptides each labeled with one member of themultiplex set appears as a single, unresolved precursor ion in MS (identical m/z). Following CID, the four reporter group ions appear as distinctmasses (114–117 Da). All other sequence-informative fragment ions (b-, y-, etc.) remain isobaric, and their individual ion current signals (signalintensities) are additive. This remains the case even for those tryptic peptides that are labeled at both the N terminus and lysine side chains,and those peptides containing internal lysine residues due to incomplete cleavage with trypsin. The relative concentration of the peptides isthus deduced from the relative intensities of the corresponding reporter ions. In contrast to ICAT and similar mass-difference labelingstrategies, quantitation is thus performed at the MS/MS stage rather than in MS.
Multiplexed Quantitation Using Isobaric Reagents
1156 Molecular & Cellular Proteomics 3.12
by on February 9, 2007
ww
w.m
cponline.orgD
ownloaded from

sensitivity enhancement over mass-difference labeling. Withisobaric peptides, the MS ion current at a given peptide massis the sum of ion current from all samples in the mixture, sothere is no splitting of MS precursor signal and no increase inspectral complexity by combining two or more samples (Figs.1 and 2). The use of isobaric peptides circumvents the ambi-guity encountered when trying to identify differentially labeledpeptide pairs (e.g. with ICAT), a task which is further compli-cated by the fact that many such pairs will be separated inmass by more than one labeled residue. The sensitivity en-hancement is carried over into MS/MS spectra, because all ofthe peptide backbone fragments ions are also isobaric (Fig. 2).One potential drawback of this approach is that MS/MS spec-tra must be acquired, which requires more analysis time thanperforming result-dependent analysis only on differentially ex-
pressed peptide pairs in MS (e.g. with ICAT). We feel, how-ever, that the ability to identify more proteins with increasedconfidence and greater peptide coverage outweighs thisdisadvantage.
Strategies have been described that employ isobaric pep-tide derivatives (13). To date, reaction of these reagents withcomplex peptide mixtures has not been shown. The use of adiscreet, highly abundant, low-mass MS/MS signature ion asdescribed in this work provides an unambiguous coding sys-tem without introducing additional sources of complexity intothe mass spectrum. Finally, we use tags that generate abun-dant signature ions under MS/MS conditions optimal for pep-tide fragmentation.
The reagents described here contain N-methylpiperazine, amoderately strong base that conveys useful properties to the
FIG. 2. Example MS/MS spectrum of peptide TPHPALTEAK from a protein digest mixture prepared by labeling four separate digestswith each of the four isobaric reagents and combining the reaction mixtures in a 1:1:1:1 ratio. Components of the spectrum illustratedare (i) isotopic distribution of the precursor ([M�H]�, m/z 1352.84), (ii) low mass region showing the signature ions used for quantitation, (iii)isotopic distribution of the b6 fragment, and (iv) isotopic distribution of the y7 fragment ion. The peptide is labeled by isobaric tags at both theN terminus and C-terminal lysine side chain. The precursor ion and all the internal fragment ions (e.g. type b- and y-) therefore contain all fourmembers of the tag set, but remain isobaric. The example shown is the spectrum obtained from the singly charged [M�H]� peptide using a4700 MALDI TOF-TOF analyzer, but the same holds true for any multiply charged peptide analyzed with an ESI-source mass spectrometer.
Multiplexed Quantitation Using Isobaric Reagents
Molecular & Cellular Proteomics 3.12 1157
by on February 9, 2007
ww
w.m
cponline.orgD
ownloaded from

tagged peptides. The use of cyclic amines as N-terminalpeptide derivatives to simplify the interpretation of MS/MSspectra has been described previously (14,15). We find thatthe tags behave similarly in both MALDI and ESI, with atendency to form more abundant and complete b- and y-ionseries, while also reducing the proportion of ion current goinginto less informative fragmentation pathways.
Our findings with the six-protein digest mixture show thatthe derivatization reaction itself is quite straightforward, re-quiring a simple room temperature reaction of �30 min. Re-sidual reagent is easily quenched by the addition of one ormore volumes of water prior to mixing, as decreasing theorganic (ethanol) concentration accelerates hydrolysis of re-sidual reagent. Hydrolysis is essentially complete within anadditional 30 min at room temperature. Comparison of protein
digest mixtures of known proportions (Fig. 3) gave accurateratios (�6% error) and standard deviations less than 23%across two orders of magnitude. All observed peptides wereconfirmed as fully derivatized at N termini and lysine sidechains.
Multiplex Analysis of Whole-Yeast Lysate—The protocol forlabeling the tryptic peptides from whole-yeast lysate is out-lined in Fig. 4. They consist of total protein reduction andalkylation, digestion with trypsin, and derivatization of totalpeptide with the isobaric reagents. These steps are performedseparately (in parallel) before sample mixing and analysis bySCX chromatography and capillary reverse-phase LC-MS.Because the N-hydroxysuccinimide-reactive group used forderivatization reacts rapidly with primary or secondary amines(such as Tris buffer), TEAB was chosen as the reaction buffer.
FIG. 3. Summary of relative protein measurements for (i) 1:1:1:1 and (ii) 1:5:2:10 mixtures of a six-protein digest. Ratios were expressedrelative to the peak area at 117.1. Insets show examples of the signature ion regions from peptides mixed 1:1:1:1 and 1:5:2:10. Intra-proteinaverages are compiled from the top-ranked significant peptides labeled at N termini and lysine side chains (Mascot score � 95% confidence,rank 1).
Multiplexed Quantitation Using Isobaric Reagents
1158 Molecular & Cellular Proteomics 3.12
by on February 9, 2007
ww
w.m
cponline.orgD
ownloaded from

As with any protein or peptide derivatization strategy, com-pleteness of reaction and elimination of side reactions are aprimary concern. Conditions were optimized using standardprotein mixes as described above to drive the derivatization ofN termini and lysine �-amines to completion. We made use ofdatabase searching (Mascot) (12) with variable modificationsat N termini, lysine, and tyrosine to explore the extent ofpossible side reactions and establish completeness of reac-tion. Under optimal conditions, we observed a minimal degree(�3%) of tyrosine derivatization and a similar percentage(�3%) of unlabeled N termini or lysine �-amino groups. Re-action with serine or threonine was not observed, and anypossible reaction with cysteine was blocked by prior reduc-tion and alkylation.
For SCX chromatography, we observed a minor increase ingeneral retention time of peptides compared with similar,unlabeled yeast digests, indicating a small increase in pI.Excess hydrolyzed reagent is not retained by the SCX columnand can be efficiently removed by isocratic washing prior toeluting peptides with a salt gradient. No other complicationswere apparent in either SCX or reverse-phase chromatogra-phy. An important attribute is that peptides differentially la-beled with each member of the multiplex set must perfectlyco-elute to preserve the quantitative relationship. Using LC-MALDI, we monitored signature ion patterns across the elu-tion profiles of a variety of peptides varying by length andextent of derivatization (i.e. one or more lysines). There was noobserved discrepancy in any of the ratios across the elutionprofile in any of the peptides studied.
Protein Identification—Proteins were identified on the basisof having at least one peptide whose individual ion score wasabove the 95% confidence threshold (p � 0.05) and alsoidentified as the top-ranked matching sequence for that spec-trum (12). We further restricted the number of identificationsmade by imposing spectrum and peptide-level nonredun-dancy such that any given peptide and any given MS/MS
spectrum was linked to only one protein. Using these criteria,1,217 unique proteins were identified from �4,500 peptides.More importantly, 685 of these proteins were identified by twoor more of these significant peptides. Further statistical anal-ysis for determining up- or down-regulation of protein expres-sion levels was performed only on this latter group of 685proteins (i.e. protein identifications made on single, uniquepeptides were discarded).
Protein Quantitation—The individual ratios of identifiedpeptides from the upf1� and xrn1� strains compared with thewild-type strain were computed from signature ion peak areasusing the formula: area(mutant)/(area(mutant) � area(wildtype)). All protein expression values thus fall between 0 and 1,with a “no-change” 1:1 ratio 0.5. The global all-peptideaverage and standard deviations were 0.503 (0.084) and0.485 (0.044) for the xrn1� and upf1� strains, respectively.These values indicate a high degree of consistency betweenthese three strains, suggesting that the parallel, peptide-based workflow did not introduce significant variability intothe measurements. Peptide ratios were also grouped intoproteins and averaged to arrive at protein-level ratios forthose 685 proteins having two or more significant scoringpeptides. The average of the protein-level standard deviationswas 0.055 and 0.034 for the xrn1� and upf1� strains, respec-tively. In other words, there was a high degree of concordancebetween individual peptides contributing to the relative quan-titation of any given protein.
From the global mean and standard deviation for eachstrain we identified proteins whose average expression ratiosfell outside of 1 standard deviation from the global mean.We further excluded proteins whose individual standard de-viation (i.e. between peptides) was greater than 0.1. From this,a list of up- and down-regulated proteins was generated forthe xrn1� and upf1� strains (Table I). Using these criteria, 62and 48 proteins were considered up-regulated and 23 and 39proteins down-regulated in upf1� and xrn1�, respectively
FIG. 4. Depiction of overall workflowused for multiplexed comparativeanalysis of the wild-type, upf1�, andxrn1� strains. Equivalent amounts ofwhole-cell lysates were treated in paral-lel workflows employing standard proto-cols for reduction and alkylation, trypsindigestion, and derivatization (see “Mate-rials and Methods”). A number of internalstandards were derivatized with a fourthreagent, and the four samples weremixed, combined with cation exchangeloading buffer and subjected to SCXchromatography followed by capillaryreverse-phase HPLC coupled to MALDI-MS/MS or ESI-MS/MS.
Multiplexed Quantitation Using Isobaric Reagents
Molecular & Cellular Proteomics 3.12 1159
by on February 9, 2007
ww
w.m
cponline.orgD
ownloaded from

TABLE ISummary of significant protein expression changes in multiplex Xrn1�-Upf1�-WT comparative study
Protein name CountaXrn1�ratiob
Xrn1�S.D.
Upf1�ratiob
Upf1�S.D.
Xrn1� foldchangec Repd,e
Xrn1�-up(P22943) 12-kDa heat shock protein (glucose and lipid-regulated protein) 5 0.792 0.069 0.453 0.084 3.806 Yes(P23776) Glucan 1,3-�-glucosidase I/II precursor (EC 3.2.1.58) 4 0.732 0.021 0.536 0.066 2.738 Yes(P03965) Carbamoyl-phosphate synthase, arginine-specific, large chain
(EC 6.3.5.5)11 0.682 0.041 0.546 0.049 2.148 Yes
(P56628) 60S ribosomal protein L22-B 2 0.681 0.078 0.526 0.044 2.138 Yes(P06208) 2-isopropylmalate synthase (EC 2.3.3.13) (�-isopropylmalate
synthase)15 0.68 0.047 0.546 0.038 2.125 Yes
(P49334) Mitochondrial import receptor subunit TOM22 2 0.679 0.037 0.584 0.11 2.118 Yes(P04806) Hexokinase A (EC 2.7.1.1) (Hexokinase PI) 3 0.67 0.075 0.466 0.053 2.031 Yes(P00890) Citrate synthase, mitochondrial precursor (EC 2.3.3.1) 2 0.66 0.048 0.528 0.036 1.969 Yes(P17709) Glucokinase (EC 2.7.1.2) (glucose kinase) (GLK) 2 0.656 0.082 0.494 0.067 1.906 Yes(P39726) Glycine cleavage system H protein, mitochondrial precursor 2 0.654 0.099 0.576 0.12 1.892 Yes(Q00055) Glycerol-3-phosphate dehydrogenase [NAD�] 1 (EC 1.1.1.8) 2 0.651 0.018 0.459 0.053 1.868 Yes(P46992) Hypothetical 43.0-kDa protein in CPS1-FPP1 intergenic region 2 0.649 0.011 0.537 0.0074 1.85(Q12019) Midasin (MIDAS-containing protein) 2 0.646 0.044 0.512 0.052 1.826(P04076) Argininosuccinate lyase (EC 4.3.2.1) (arginosuccinase) (ASAL) 4 0.642 0.054 0.569 0.061 1.797 Yes(P00498) ATP phosphoribosyltransferase (EC 2.4.2.17) 5 0.628 0.054 0.537 0.037 1.689 Yes(Q08965) Ribosome biogenesis protein BMS1 2 0.625 0.016 0.521 0.014 1.665 Yes(P40482) Protein transport protein Sec24 (abnormal nuclear morphology 1) 2 0.615 0.075 0.525 0.05 1.595 Yes(P00812) Arginase (EC 3.5.3.1) 3 0.614 0.019 0.567 0.032 1.59 Yes(P06168) Ketol-acid reductoisomerase, mitochondrial precursor
(EC 1.1.1.86)18 0.613 0.099 0.525 0.057 1.587 Yes
(Q04182) ATP-dependent permease PDR15 2 0.563 0.045 0.535 0.016 1.293 Yes(P33416) Heat shock protein 78, mitochondrial precursor 2 0.614 0.015 0.515 0.044 1.581(P31539) Heat shock protein 104 10 0.612 0.041 0.534 0.03 1.579(P37291) Serine hydroxymethyltransferase, cytosolic (EC 2.1.2.1) (serine
methylase)14 0.612 0.063 0.515 0.04 1.578 Yes
(P22768) Argininosuccinate synthase (EC 6.3.4.5) (citrulline-aspartate ligase) 3 0.611 0.0053 0.572 0.015 1.574 Yes(P07273) Transcription elongation factor S-II (DNA strand transfer protein �) 3 0.61 0.094 0.531 0.011 1.563 Yes(P38777) Hypothetical 27.3-kDa protein in AAP1-SMF2 intergenic region 4 0.609 0.069 0.534 0.027 1.561(P39522) Dihydroxy-acid dehydratase, mitochondrial precursor (EC 4.2.1.9)
(DAD)10 0.606 0.061 0.505 0.037 1.54 Yes
(Q04869) Hypothetical 38.2-kDa protein in PRE5-FET4 intergenic region 3 0.606 0.041 0.493 0.028 1.536 Yes(P40215) Hypothetical 62.8-kDa protein in RPS16A-TIF34 intergenic region 3 0.605 0.078 0.457 0.057 1.534 Yes(P47119) HAM1 protein 3 0.603 0.050 0.488 0.011 1.516 Yes(P00937) Anthranilate synthase component II (EC 4.1.3.27) 2 0.602 0.008 0.49 0.008 1.515 Yes(P53332) Hypothetical 34.3-kDa protein in TAF145-YOR1 intergenic region 2 0.602 0.0047 0.475 0.007 1.512(P42940) Probable electron transfer flavoprotein �-subunit (�-ETF) 2 0.601 0.043 0.553 0.087 1.509 Yes(P17505) Malate dehydrogenase, mitochondrial precursor (EC 1.1.1.37) 5 0.600 0.03 0.491 0.035 1.504 Yes(P00128) Ubiquinol-cytochrome C reductase complex 14-kDa protein
(EC 1.10.2.2)4 0.60 0.034 0.476 0.055 1.5 Yes
(P18239) ADP,ATP carrier protein 2 (ADP/ATP translocase 2) 3 0.6 0.049 0.479 0.054 1.5 Yes(P06634) Probable ATP-dependent RNA helicase DED1 25 0.598 0.052 0.491 0.037 1.49 Yes(P32454) Aminopeptidase II (EC 3.4.11.-) (YscII) 2 0.598 0.061 0.532 0.027 1.487 Yes(P00427) Cytochrome c oxidase polypeptide VI, mitochondrial precursor
(EC 1.9.3.1)2 0.593 0.021 0.478 0.02 1.457 Yes
(Q04636) Hypothetical 63.0-kDa protein in DAK1-ORC1 intergenic region 2 0.591 0.029 0.563 0.048 1.445 Yes(P38715) Probable oxidoreductase GRE3 (EC 1.-.-.-) 2 0.591 0.008 0.475 0.011 1.443 Yes(P27616) Phosphoribosylamidoimidazole-succinocarboxamide synthase
(EC 6.3.2.6)3 0.587 0.079 0.517 0.047 1.421
(P04046) Amidophosphoribosyltransferase (EC 2.4.2.14) 2 0.586 0.023 0.54 0.0097 1.418 Yes(P23542) Aspartate aminotransferase, cytoplasmic (EC 2.6.1.1)
(transaminase A)5 0.585 0.044 0.523 0.021 1.407 Yes
(P33734) Imidazole glycerol phosphate synthase hisHF (IGP synthase) 3 0.584 0.046 0.533 0.019 1.403 Yes(P07256) Ubiquinol-cytochrome c reductase complex core protein I, mito
precurs.)2 0.582 0.027 0.46 0.036 1.393 Yes
(P10591) Heat shock protein SSA1 (heat shock protein YG100) 6 0.581 0.075 0.54 0.038 1.384 Yes(P34227) Hypothetical 29.5-kDa protein in SEF1-KIP1 intergenic region 2 0.58 0.038 0.524 0.033 1.383 Yes
Multiplexed Quantitation Using Isobaric Reagents
1160 Molecular & Cellular Proteomics 3.12
by on February 9, 2007
ww
w.m
cponline.orgD
ownloaded from

TABLE I—continued
Protein name CountaXrn1�ratiob
Xrn1�S.D.
Upf1�ratiob
Upf1�S.D.
Xrn1� foldchangec Repd,e
Xrn1�-down(P40029) Peptide methionine sulfoxide reductase (EC 1.8.4.6) 2 0.299 0.0244 0.454 0.0089 0.446 Yes(P05747) 60S ribosomal protein L29 (YL43) 11 0.342 0.036 0.471 0.02 0.546 Yes(P07215) Metallothionein precursor (Cu-MT) (copper chelatin) 3 0.35 0.056 0.562 0.024 0.565 Yes(P14796) 60S ribosomal protein L40 (CEP52) 4 0.354 0.046 0.441 0.022 0.576 Yes(P05748) 60S ribosomal protein L15-A (YL10) (L13) (RP15R) (YP18) 12 0.37 0.056 0.47 0.028 0.618 Yes(P05755) 40S ribosomal protein S9-B (S13) (YS11) (RP21) (YP28) 2 0.373 0.015 0.463 0.0056 0.625(P02293) Histone H2B.1 2 0.378 0.029 0.431 0.044 0.64 Yes(Q12213) 60S ribosomal protein L7-B (L6B) (YL8B) 8 0.382 0.094 0.457 0.016 0.696 Yes(P53297) PAB1-binding protein 1 6 0.383 0.092 0.457 0.025 0.653 Yes(P87262) 60S ribosomal protein L34-A 2 0.385 0.076 0.489 0.003 0.706 Yes(P41057) 40S ribosomal protein S29-A (S36) (YS29) 6 0.388 0.07 0.47 0.013 0.668 Yes(P04650) 60S ribosomal protein L39 (L46) (YL40) 2 0.389 0.019 0.445 0.0017 0.67 Yes(P14126) 60S ribosomal protein L3 (YL1) (RP1) (trichodermin resistance
protein)25 0.389 0.069 0.472 0.031 0.671 Yes
(P10614) Cytochrome P450 51 (EC 1.14.13.70) (CYPLI) (P450-LIA1) 6 0.39 0.066 0.497 0.03 0.671 Yes(P47100) Transposon Ty1 protein B 16 0.399 0.077 0.514 0.023 0.672 Yes(P26786) 40S ribosomal protein S7-A (RP30) 2 0.399 0.013 0.474 0.009 0.672 Yes(P05743) 60S ribosomal protein L26-A (YL33) 5 0.399 0.060 0.44 0.038 0.722 Yes(P46784) 40S ribosomal protein S10-B 6 0.393 0.081 0.461 0.025 0.731 Yes(Q03834) MUTS protein homolog 6 2 0.3937 0.075 0.513 0.12 0.734 Yes(P41805) 60S ribosomal protein L10 (L9) 23 0.394 0.061 0.463 0.017 0.684 Yes(P40150) Heat shock protein SSB2 2 0.397 0.015 0.442 0.011 0.693 Yes(P54780) 60S ribosomal protein L15-B (YL10) (L13) (RP15R) (YP18) 3 0.403 0.034 0.51 0.023 0.764 Yes(P47098) Transposon Ty1 protein B 4 0.403 0.055 0.527 0.057 0.765 Yes(Q01855) 40S ribosomal protein S15 (S21) (YS21) (RP52) (RIG protein) 5 0.404 0.045 0.474 0.041 0.714 Yes(Q02753) 60S ribosomal protein L21-A 3 0.405 0.056 0.471 0.012 0.716 Yes(P23301) Eukaryotic translation initiation factor 5A-2 (eIF-5A 2) (eIF-4D) 5 0.405 0.078 0.468 0.024 0.718 Yes(P29547) Elongation factor 1-� 1 (EF-1-� 1) 5 0.41 0.064 0.445 0.032 0.733 Yes(P07282) 40S ribosomal protein S25 precursor (S31) (YS23) (RP45) 5 0.412 0.066 0.452 0.021 0.739 Yes(P38693) Acid phosphatase PHO12 precursor (EC 3.1.3.2) 4 0.414 0.098 0.416 0.05 0.744(P39939) 40S ribosomal protein S26-B 4 0.415 0.049 0.477 0.0055 0.749 Yes(P06106) MET17 protein [includes O-acetylhomoserine sulfhydrylase
(EC 2.5.1.49)]8 0.416 0.085 0.474 0.024 0.75 Yes
(P14832) Peptidyl-prolyl cis-trans isomerase (EC 5.2.1.8) (PPIase) (rotamase) 9 0.416 0.055 0.524 0.05 0.751 Yes(P23254) Transketolase 1 (EC 2.2.1.1) (TK 1) 11 0.417 0.055 0.478 0.04 0.753 Yes(P46990) 60S ribosomal protein L17-B (YL17-B) 3 0.418 0.043 0.487 0.027 0.757 Yes(P05740) 60S ribosomal protein L17-A (YL17-A) 9 0.419 0.037 0.458 0.035 0.761 Yes(P07281) 40S ribosomal protein S19-B (S16B) (YS16) (RP55) 2 0.419 0.0082 0.455 0.012 0.762 Yes(P04912) Histone H2A.2 2 0.42 0.005 0.379 0.051 0.763 Yes(P25631) Hypothetical 24.7-kDa protein in ARE1-THR4 intergenic region 3 0.42 0.06 0.509 0.014 0.763 Yes
Upf1�-up(P22768) Argininosuccinate synthase (EC 6.3.4.5) (citrulline-aspartate ligase) 3 0.611 0.005 0.572 0.016 1.435 Yes(P04076) Argininosuccinate lyase (EC 4.3.2.1) (arginosuccinase) (ASAL) 4 0.642 0.054 0.569 0.061 1.417 Yes(P00812) Arginase (EC 3.5.3.1) 3 0.614 0.019 0.567 0.032 1.404 Yes(P30822) Exportin 1 (chromosome region maintenance protein 1) 2 0.57 0.074 0.565 0.068 1.397 Yes(Q04636) Hypothetical 63.0-kDa protein in DAK1-ORC1 intergenic region 2 0.591 0.029 0.563 0.048 1.383(P00815) Histidine biosynthesis trifunctional protein 4 0.672 0.121 0.562 0.044 1.377 Yes(P07215) Metallothionein precursor (Cu-MT) (copper chelatin) 3 0.35 0.056 0.562 0.024 1.376 Yes(P53337) Hypothetical 35.0-kDa protein in BGL2-ZUO1 intergenic region 2 0.563 0.056 0.557 0.034 1.348(P38886) 26S proteasome regulatory subunit RPN10 4 0.533 0.084 0.555 0.055 1.34 Yes(P53111) Hypothetical 38.1-kDa protein in RCK1-AMS1 intergenic region 2 0.582 0.155 0.554 0.043 1.33 Yes(P42940) Probable electron transfer flavoprotein �-subunit (�-ETF) 2 0.601 0.043 0.553 0.087 1.326(P13587) Sodium transport ATPase 1 (EC 3.6.3.7) 2 0.549 0.017 0.548 0.022 1.301(P03965) Carbamoyl-phosphate synthase, arginine-specific, large chain
(EC 6.3.5.5)11 0.682 0.041 0.546 0.05 1.29 Yes
(P06208) 2-isopropylmalate synthase (EC 2.3.3.13) (�-isopropylmalatesynthase)
15 0.68 0.047 0.546 0.038 1.287 Yes
(P14906) Translocation protein (NPL1 protein) 2 0.535 0.039 0.546 0.046 1.285 Yes(P49089) Asparagine synthetase [glutamine-hydrolyzing] 1 (EC 6.3.5.4) 11 0.561 0.054 0.542 0.025 1.268 Yes
Multiplexed Quantitation Using Isobaric Reagents
Molecular & Cellular Proteomics 3.12 1161
by on February 9, 2007
ww
w.m
cponline.orgD
ownloaded from

TABLE I—continued
Protein name CountaXrn1�ratiob
Xrn1�S.D.
Upf1�ratiob
Upf1�S.D.
Xrn1� foldchangec Repd,e
(P32179) 3�(2�),5�-bisphosphate nucleotidase 2 0.564 0.071 0.541 0.049 1.264 Yes(P10591) Heat shock protein SSA1 (heat shock protein YG100) 6 0.581 0.075 0.54 0.038 1.257(P04046) Amidophosphoribosyltransferase (EC 2.4.2.14) 2 0.586 0.023 0.54 0.01 1.257 Yes(P38066) GTP cyclohydrolase II (EC 3.5.4.25) 3 0.515 0.085 0.539 0.067 1.249(P38891) Branched-chain amino acid aminotransferase, mitochondrial
precursor11 0.527 0.057 0.538 0.031 1.246 Yes
(P07274) Profilin 2 0.575 0.019 0.538 0.039 1.244 Yes(P00498) ATP phosphoribosyltransferase (EC 2.4.2.17) 5 0.628 0.054 0.537 0.037 1.243 Yes(P46992) Hypothetical 43.0-kDa protein in CPS1-FPP1 intergenic region 2 0.649 0.011 0.537 0.007 1.242(P38009) Bifunctional purine biosynthesis protein ADE17 2 0.701 0.127 0.537 0.048 1.241(P23776) Glucan 1,3-�-glucosidase I/II precursor (EC 3.2.1.58) 4 0.732 0.021 0.536 0.066 1.235 Yes(P38080) Probable serine/threonine-protein kinase YBR059C (EC 2.7.1.-) 3 0.546 0.019 0.535 0.056 1.232(Q04182) ATP-dependent permease PDR15 2 0.564 0.045 0.535 0.016 1.23(P25294) SIS1 protein 2 0.442 0.019 0.535 0.046 1.229(P38765) Hypothetical 32.6-kDa protein in DAP2-SLT2 intergenic region 2 0.523 0.005 0.534 0.058 1.227 Yes(P48353) HLJ1 protein 3 0.544 0.059 0.534 0.02 1.226(P38777) Hypothetical 27.3-kDa protein in AAP1-SMF2 intergenic region 4 0.609 0.069 0.534 0.027 1.225(P39676) Flavohemoprotein (hemoglobin-like protein) (flavohemoglobin) 8 0.513 0.083 0.534 0.013 1.223 Yes(P31539) Heat shock protein 104 10 0.612 0.041 0.534 0.03 1.223 Yes(P33734) Imidazole glycerol phosphate synthase hisHF (IGP synthase) 3 0.584 0.046 0.533 0.019 1.219(P41895) Transcription initiation factor IIF, � subunit (TFIIF-�) 2 0.512 0.039 0.533 0.064 1.219(P32454) Aminopeptidase II (EC 3.4.11.-) (YscII) 2 0.598 0.061 0.532 0.027 1.215 Yes(P36013) Probable NAD-dependent malic enzyme (EC 1.1.1.38) (NAD-ME) 7 0.56 0.042 0.531 0.047 1.211 Yes(P07273) Transcription elongation factor S-II (DNA strand transfer protein �) 3 0.61 0.094 0.531 0.011 1.208 Yes(P38998) Saccharopine dehydrogenase [NAD�, L-lysine forming]
(EC 1.5.1.7)2 0.55 0.018 0.53 0.007 1.205 Yes
(P13663) Aspartate-semialdehyde dehydrogenase (EC 1.2.1.11) 12 0.533 0.046 0.53 0.025 1.204 Yes(P10962) MAK16 protein 2 0.533 0.016 0.529 0.084 1.2 Yes(P07264) 3-isopropylmalate dehydratase (EC 4.2.1.33) (isopropylmalate
isomerase)26 0.486 0.061 0.529 0.027 1.199 Yes
(Q06142) Importin �-1 subunit (karyopherin �-1 subunit) (importin 95) 4 0.548 0.045 0.529 0.026 1.198(P36112) Hypothetical 61.1-kDa protein in YPT52-DBP7 intergenic region 2 0.524 0.021 0.528 0.053 1.195 Yes(P10659) S-adenosylmethionine synthetase 1 (EC 2.5.1.6) 13 0.502 0.053 0.528 0.023 1.193 Yes(P32381) Actin-like protein ARP2 2 0.523 0.014 0.528 0.05 1.193 Yes(P15891) Actin binding protein 7 0.563 0.061 0.528 0.067 1.192 Yes(P51401) 60S ribosomal protein L9-B (L8) (YL11) (RP25) 2 0.518 0.009 0.527 0.008 1.191 Yes(P47079) T-complex protein 1, � subunit (TCP-1-�) (CCT-�) 5 0.548 0.063 0.527 0.048 1.189 Yes(P40482) Protein transport protein Sec24 (abnormal nuclear morphology 1) 2 0.615 0.075 0.525 0.05 1.179 Yes(P06168) Ketol-acid reductoisomerase, mitochondrial precursor
(EC 1.1.1.86)18 0.613 0.099 0.525 0.057 1.177 Yes
(P34227) Hypothetical 29.5-kDa protein in SEF1-KIP1 intergenic region 2 0.58 0.038 0.524 0.033 1.176(P14832) Peptidyl-prolyl cis-trans isomerase (EC 5.2.1.8) (PPIase) (rotamase) 9 0.416 0.055 0.524 0.051 1.173(P07342) Acetolactate synthase, mitochondrial precursor (EC 2.2.1.6) 10 0.556 0.045 0.523 0.025 1.172(Q06252) Hypothetical 22.2-kDa protein in TFS1-SAM1 intergenic region 2 0.459 0.087 0.523 0.027 1.17 Yes(P32563) Vacuolar ATP synthase 95-kDa subunit (vacuolar ATPase 95-kDa
subunit)6 0.55 0.056 0.523 0.05 1.169
(P23542) Aspartate aminotransferase, cytoplasmic (EC 2.6.1.1)(transaminase A)
5 0.585 0.044 0.523 0.021 1.169 Yes
(P43555) 47-kDa endomembrane protein precursor (endosomal P44 protein) 2 0.534 0.043 0.523 0.038 1.168(P47176) Branched-chain amino acid aminotransferase, cytosolic
(EC 2.6.1.42)6 0.521 0.073 0.522 0.027 1.165 Yes
(Q08965) Ribosome biogenesis protein BMS1 2 0.625 0.016 0.521 0.014 1.159Upf1�-down
(Q03667) Hypothetical 16.7-kDa protein in CDC5-MVP1 intergenic region 2 0.469 0.18 0.344 0.084 0.549 Yes(P43579) Hypothetical 78.8-kDa protein in HSP12-HXT10 intergenic region 2 0.577 0.027 0.376 0.032 0.634(P04912) Histone H2A.2 2 0.42 0.005 0.379 0.051 0.642(P87108) Mitochondrial import inner membrane translocase subunit TIM10 2 0.502 0.044 0.41 0.012 0.732 Yes(P38693) Acid phosphatase PHO12 precursor (EC 3.1.3.2) 4 0.414 0.098 0.416 0.05 0.751 Yes(P15565) N(2),N(2)-dimethylguanosine tRNA methyltransferase, mitochondrial
prec.2 0.516 0.125 0.417 0.005 0.753 Yes
Multiplexed Quantitation Using Isobaric Reagents
1162 Molecular & Cellular Proteomics 3.12
by on February 9, 2007
ww
w.m
cponline.orgD
ownloaded from
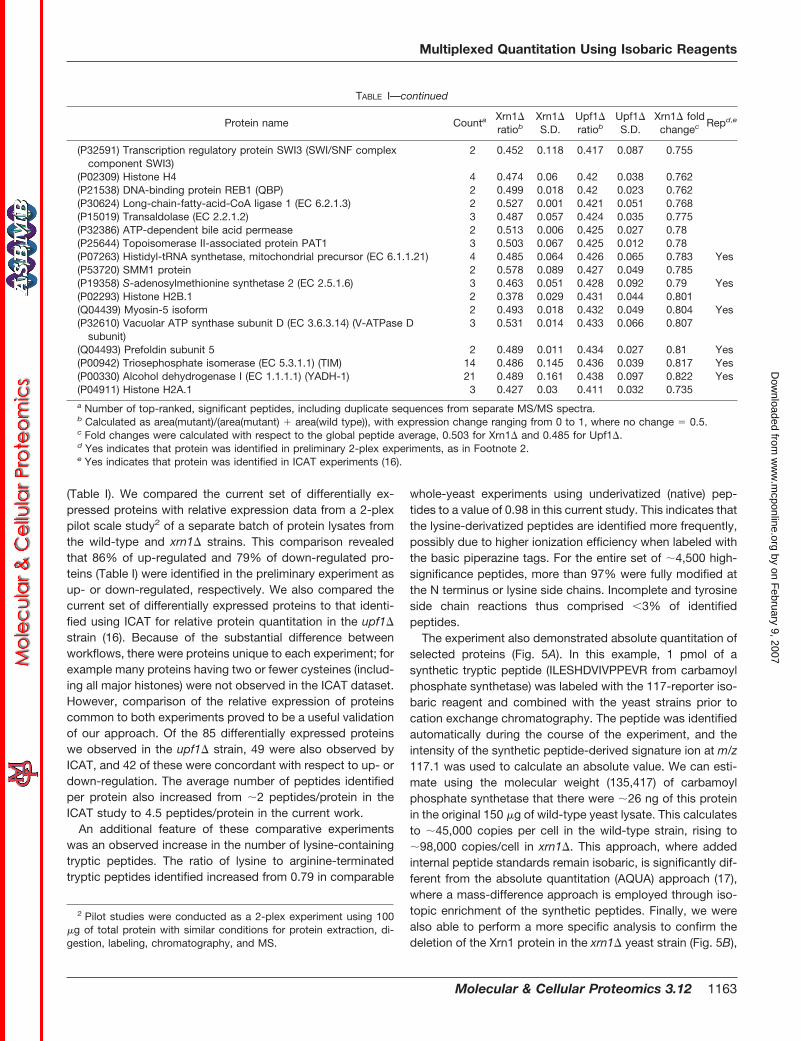
(Table I). We compared the current set of differentially ex-pressed proteins with relative expression data from a 2-plexpilot scale study2 of a separate batch of protein lysates fromthe wild-type and xrn1� strains. This comparison revealedthat 86% of up-regulated and 79% of down-regulated pro-teins (Table I) were identified in the preliminary experiment asup- or down-regulated, respectively. We also compared thecurrent set of differentially expressed proteins to that identi-fied using ICAT for relative protein quantitation in the upf1�
strain (16). Because of the substantial difference betweenworkflows, there were proteins unique to each experiment; forexample many proteins having two or fewer cysteines (includ-ing all major histones) were not observed in the ICAT dataset.However, comparison of the relative expression of proteinscommon to both experiments proved to be a useful validationof our approach. Of the 85 differentially expressed proteinswe observed in the upf1� strain, 49 were also observed byICAT, and 42 of these were concordant with respect to up- ordown-regulation. The average number of peptides identifiedper protein also increased from �2 peptides/protein in theICAT study to 4.5 peptides/protein in the current work.
An additional feature of these comparative experimentswas an observed increase in the number of lysine-containingtryptic peptides. The ratio of lysine to arginine-terminatedtryptic peptides identified increased from 0.79 in comparable
whole-yeast experiments using underivatized (native) pep-tides to a value of 0.98 in this current study. This indicates thatthe lysine-derivatized peptides are identified more frequently,possibly due to higher ionization efficiency when labeled withthe basic piperazine tags. For the entire set of �4,500 high-significance peptides, more than 97% were fully modified atthe N terminus or lysine side chains. Incomplete and tyrosineside chain reactions thus comprised �3% of identifiedpeptides.
The experiment also demonstrated absolute quantitation ofselected proteins (Fig. 5A). In this example, 1 pmol of asynthetic tryptic peptide (ILESHDVIVPPEVR from carbamoylphosphate synthetase) was labeled with the 117-reporter iso-baric reagent and combined with the yeast strains prior tocation exchange chromatography. The peptide was identifiedautomatically during the course of the experiment, and theintensity of the synthetic peptide-derived signature ion at m/z117.1 was used to calculate an absolute value. We can esti-mate using the molecular weight (135,417) of carbamoylphosphate synthetase that there were �26 ng of this proteinin the original 150 �g of wild-type yeast lysate. This calculatesto �45,000 copies per cell in the wild-type strain, rising to�98,000 copies/cell in xrn1�. This approach, where addedinternal peptide standards remain isobaric, is significantly dif-ferent from the absolute quantitation (AQUA) approach (17),where a mass-difference approach is employed through iso-topic enrichment of the synthetic peptides. Finally, we werealso able to perform a more specific analysis to confirm thedeletion of the Xrn1 protein in the xrn1� yeast strain (Fig. 5B),
2 Pilot studies were conducted as a 2-plex experiment using 100�g of total protein with similar conditions for protein extraction, di-gestion, labeling, chromatography, and MS.
TABLE I—continued
Protein name CountaXrn1�ratiob
Xrn1�S.D.
Upf1�ratiob
Upf1�S.D.
Xrn1� foldchangec Repd,e
(P32591) Transcription regulatory protein SWI3 (SWI/SNF complexcomponent SWI3)
2 0.452 0.118 0.417 0.087 0.755
(P02309) Histone H4 4 0.474 0.06 0.42 0.038 0.762(P21538) DNA-binding protein REB1 (QBP) 2 0.499 0.018 0.42 0.023 0.762(P30624) Long-chain-fatty-acid-CoA ligase 1 (EC 6.2.1.3) 2 0.527 0.001 0.421 0.051 0.768(P15019) Transaldolase (EC 2.2.1.2) 3 0.487 0.057 0.424 0.035 0.775(P32386) ATP-dependent bile acid permease 2 0.513 0.006 0.425 0.027 0.78(P25644) Topoisomerase II-associated protein PAT1 3 0.503 0.067 0.425 0.012 0.78(P07263) Histidyl-tRNA synthetase, mitochondrial precursor (EC 6.1.1.21) 4 0.485 0.064 0.426 0.065 0.783 Yes(P53720) SMM1 protein 2 0.578 0.089 0.427 0.049 0.785(P19358) S-adenosylmethionine synthetase 2 (EC 2.5.1.6) 3 0.463 0.051 0.428 0.092 0.79 Yes(P02293) Histone H2B.1 2 0.378 0.029 0.431 0.044 0.801(Q04439) Myosin-5 isoform 2 0.493 0.018 0.432 0.049 0.804 Yes(P32610) Vacuolar ATP synthase subunit D (EC 3.6.3.14) (V-ATPase D
subunit)3 0.531 0.014 0.433 0.066 0.807
(Q04493) Prefoldin subunit 5 2 0.489 0.011 0.434 0.027 0.81 Yes(P00942) Triosephosphate isomerase (EC 5.3.1.1) (TIM) 14 0.486 0.145 0.436 0.039 0.817 Yes(P00330) Alcohol dehydrogenase I (EC 1.1.1.1) (YADH-1) 21 0.489 0.161 0.438 0.097 0.822 Yes(P04911) Histone H2A.1 3 0.427 0.03 0.411 0.032 0.735a Number of top-ranked, significant peptides, including duplicate sequences from separate MS/MS spectra.b Calculated as area(mutant)/(area(mutant) � area(wild type)), with expression change ranging from 0 to 1, where no change 0.5.c Fold changes were calculated with respect to the global peptide average, 0.503 for Xrn1� and 0.485 for Upf1�.d Yes indicates that protein was identified in preliminary 2-plex experiments, as in Footnote 2.e Yes indicates that protein was identified in ICAT experiments (16).
Multiplexed Quantitation Using Isobaric Reagents
Molecular & Cellular Proteomics 3.12 1163
by on February 9, 2007
ww
w.m
cponline.orgD
ownloaded from

where the absence of a signature ion at m/z 114.1 establishedthe loss of this protein.
Proteins Up-regulated in the upf1� and xrn1� Strains—Thedata clearly indicate that deletion of the Xrn1 and Upf1 pro-teins produces similar changes to the protein phenotype (Fig.6). Of the 48 proteins considered to be up-regulated in thexrn1� strain, 23 are seen to be also up-regulated in the upf1�
strain. The magnitude of increases is, however, two to threetimes greater in the xrn1� strain. Similarity in protein up-regulation also extends to ontological comparison of thesetwo mutant strains (Fig. 6). Up-regulated proteins weregrouped according to biological function as described (18).Significant groups were chosen by comparison with thoseidentified proteins that were not significantly up- or down-regulated (p � 0.05). Closer inspection reveals that many of
the proteins are involved in amino acid biosynthesis (includingmany aspects of amine and nitrogen metabolism). Enzymesinvolved in the biosynthesis of each of the 20 common aminoacids as well as enzymes involved in general nitrogen andamine metabolism (e.g. urea cycle and general metabolism ofamine groups) are up-regulated in both xrn1� and upf1�
strains. This confirms the findings of the earlier ICAT studycomparing the wild-type and upf1� strains, where up-regula-tion of proteins involved in the urea cycle and amino acidmetabolism (particularly arginine) was noted (16). Other met-abolic changes seen in both upf1� and xrn1� strains includeup-regulation of enzymes involved in pantothenate and CoAbiosynthesis, starch and sucrose metabolism, and purine andpyrimidine metabolism.
Our data indicated that deletion of the Xrn1 and Upf1 pro-
FIG. 5. Example signature ion regions from four MS/MS spectra illustrating the degree of consistency in relative quantitative measurementof (A) an up-regulated protein (carbamoyl phosphate synthetase). Illustrated are the signature ion regions of four identified tryptic peptides (froma total of 11) that show consistency of measurement between the three strains. For all 11 peptides identified, the fold increase of this proteinin the xrn1� strain was 2.15 relative to wild type, with an S.D. of �12%. This protein was also used to demonstrate an absolute quantitativemeasurement using an internal spiked synthetic tryptic peptide (ILESHDVIVPPEVR) labeled with the 117-reporter isobaric reagent. B,highlighted signature ion region showing confirmation of deletion of the Xrn1p protein in the xrn1� yeast strain by quantitative measurementof the identified tryptic peptide IGPMEAIATVFPVTGLVR (derivatized m/z 2015.1) that corresponds to residues 861–878 of the native Xrn1protein. This peptide (and hence protein) is clearly absent only in the xrn1� strain.
Multiplexed Quantitation Using Isobaric Reagents
1164 Molecular & Cellular Proteomics 3.12
by on February 9, 2007
ww
w.m
cponline.orgD
ownloaded from

teins also yields distinct protein phenotypes. Previous xrn1�
and upf1� deletion or mutation studies have shown that re-moval or inhibition of the activities of these two proteinsresulted in significantly increased levels of cellular mRNA (19).One pathway of mRNA decay in yeast involves poly(A) short-ening followed by decapping and then 5� to 3� decay. Cellsdevoid of Xrn1p therefore accumulate mRNAs that haveshortened or no poly(A) tails and which may lack the 5� capstructure (20). We find that the xrn1� strain showed specificup-regulation of the ribosome biogenesis protein BMS1 re-quired for the maturation of the 40S ribosomal subunit (21),the SC24 protein required to promote the transport of secre-tory, membrane, and vacuolar proteins from the endoplasmicreticulum to the Golgi complex (22), and the RNA polymeraseII transcription elongation factor TFS2 required for efficienttranscription elongation past template-encoded arrestingsites. The upf1� strain showed up-regulation of proteins such
as the Sec63 protein important for protein assembly in thenucleus and endoplasmic reticulum (23), the Sis1 protein re-quired for normal initiation of translation (24), the polymeraseII transcription factor TFIIF that promotes transcriptional elon-gation (25), and the t-complex protein 1 that acts as a molec-ular chaperone for protein folding.
Proteins Down-regulated in the xrn1� and upf1� Strains—In contrast to the general similarity of proteins up-regulated inthe xrn1� and upf1� strains, those proteins that are signifi-cantly down-regulated appear to be quite different. Of the 39proteins down-regulated in the xrn1� strain, only three arecommon to the upf1� strain. Ontological classification (18)also indicates that the effects of these two mutant strains aresubstantially different (Table I, Fig. 6). More than half of theproteins down-regulated in xrn1� cells are structural compo-nents of the ribosome or are factors involved in protein syn-thesis. These include the poly(A)-binding protein Pab1p that
FIG. 5—continued
Multiplexed Quantitation Using Isobaric Reagents
Molecular & Cellular Proteomics 3.12 1165
by on February 9, 2007
ww
w.m
cponline.orgD
ownloaded from

also serves as a scaffold for a series of post-transcriptionalregulatory factors involved in mRNA 3� processing, export,translation, and turnover (26), the initiating factor eIF-5A(which may have a role in regulating exonucleolytic decay(27)), and the elongation factor-1� subunit.
In contrast, many of the down-regulated proteins in theupf1� strain are involved in DNA replication or RNA transcrip-tion. Approximately one-third of the proteins down-regulatedin upf1� cells are involved in chromosome and chromatinstructure (histones) or transcriptional regulation. These includethe Swi3 protein, which is a global activator of transcriptionrequired for the induced expression of a large number ofgenes (28), and Reb1 (29), a sequence-specific DNA-bindingprotein that recognizes sites within both the enhancer and thepromoter regions of the rRNA genes as well as sites upstreamof many genes transcribed by RNA polymerase II. Also down-regulated are the Trm1 and METL (S-adenosyl methioninesythetase) proteins, which are required for methylation of
cellular tRNAs (30). While the basis for these observations isunclear, it is possible that the down-regulation of proteinsinvolved in protein translation in xrn1� cells reflects a regula-tory circuit responding to the loss of Xrn1p’s role in pre-rRNAprocessing (31, 32) and that the up-regulation of proteinsinvolved in amino acid biosynthesis in both mutant strainsmay occur in these strains as a consequence of restoringfunctional translation of several endogenous nonsense-con-taining mRNAs encoding enzymes in histidine, arginine, andleucine biosynthesis (33).
Relative Changes in mRNA and Protein Levels—He et al.(19) have previously used high-density oligonucleotide mi-croarray analysis to assess global changes in mRNA abun-dance in the upf1� and xrn1� strains. We have utilized thisdata to determine whether there is a correlation between therelative changes in protein and mRNA levels in the upf1� andxrn1� strains. Fig. 7 compares average fold changes in RNAabundance (from four independent experiments) to the rela-
FIG. 6. Display of ontology profile from an ontology search (18) of significant up- and down-regulated proteins observed in themultiplex yeast experiment. Protein classification groups were identified as significant by comparison with the remaining identified proteinsthat were not significantly up- or down-regulated (p � 0.05). This approach determines whether the chosen up- or down-regulated proteinsare distributed randomly with respect to the classification of the remaining (�600) identified proteins whose expression levels do not change.
Multiplexed Quantitation Using Isobaric Reagents
1166 Molecular & Cellular Proteomics 3.12
by on February 9, 2007
ww
w.m
cponline.orgD
ownloaded from

tive changes in protein levels determined in our analyses ofthe wild-type, upf1�, and xrn1� extracts. Fig. 7A shows that,for those proteins showing significant changes in levels inupf1� cells, there is no significant correlation between mRNAand protein levels (r 0.19). Likewise, in xrn1� cells, proteinsshowing significant increases or decreases in levels also showno significant correlation with the levels of their respectivemRNAs (Fig. 7B; r 0.20). These comparisons indicate thatthe levels of a small number of proteins in the upf1� andxrn1� strains are regulated post-transcriptionally, i.e. forsome proteins there are substantive differences between therespective changes in mRNA and protein levels. In agreementwith previous studies (34, 35), these measurements of proteinand mRNA levels are revealing quite different and nonover-lapping aspects of the overall phenotypic changes induced bythe deletion of these factors.
CONCLUSIONS
We have used a multiplexed peptide quantitation method-ology to identify global protein expression trends in a set ofisogenic yeast strains. This approach made use of a set offour isobaric peptide derivatization reagents that yield inform-ative MS/MS spectra for peptide identification and quantita-tion. The derivatized peptides are indistinguishable by theirMS spectra or MS/MS ion series, but exhibit intense, low-mass MS/MS signature ions that permit quantitation of mem-
bers of the multiplex set. The reagents have been incorpo-rated into a simple workflow consisting of protein extraction,tryptic digestion, and peptide labeling followed by cation ex-change fractionation. Samples are then analyzed by conven-tional capillary reversed-phase LC-MS/MS using MALDI orelectrospray-based MS. We also demonstrated the use of4-fold multiplexing to enable relative protein measurements inseveral samples simultaneously with determination of abso-lute levels of a target protein using synthetic isobaric peptidestandards.
In this study, we used the reagents to compare globalprotein expression in wild-type yeast and the isogenic upf1�
and xrn1� mutant strains that are defective in the nonsense-mediated mRNA decay and the 5� to 3� decay pathway. Wefind that inactivation of Upf1p and Xrn1p cause both commonas well as distinct effects on protein expression. Both mutantstrains show increased expression of a common set of pro-teins involved in amino acid biosynthesis and general nitrogenmetabolism. The upf1� strain showed specific down-regula-tion of proteins involved in DNA replication and RNA tran-scription, whereas the xrn1� strain exhibited specific down-regulation of components of the translation apparatus,including ribosomal proteins and translation factors. Compar-ison between mRNA changes and protein changes of theseyeast strains showed no significant correlation.
The isobaric nature of the tags permitted the simultaneous
FIG. 7. Changes in mRNA levels do not correlate with changes in protein levels in upf1� and xrn1� cells. Scatter plots were used tocompare the average mRNA and protein expression ratios in upf1� (A) and xrn1� (B) cells. Expression ratios are defined as the fold-changein mutant versus wild-type cells. Average mRNA expression ratios are from He et al. (19). Protein expression ratios are derived from the upf1�data (85 proteins) and xrn1� data (87 proteins) listed in Table I. Pair-wise comparisons are plotted on a logarithmic scale, with the middle lineindicating the line of equivalence and the outer two lines indicating 2-fold differences in expression.
Multiplexed Quantitation Using Isobaric Reagents
Molecular & Cellular Proteomics 3.12 1167
by on February 9, 2007
ww
w.m
cponline.orgD
ownloaded from

comparison of multiple yeast strains and added syntheticpeptide internal standards in a single two-dimensional-LC-MS experiment, with no increase in chromatographic orMS complexity. Importantly, ratio measurements for all theidentified peptides was 100% for all strains. Measured ex-pression ratios demonstrated high consistency, and intra-protein peptide mean and standard deviations were highlyreproducible (15–17%). The mixed, multiplex nature of theexperiment removes any quantitative variability from chroma-tography that may be seen in sequential two-dimensionalLC-MS analyses of individual peptide mixtures (36), and pep-tide coverage is significantly increased relative to ICAT. Thetagging chemistry is global in that any peptide with a freeamine can be labeled and measured. This should enablestrategies that seek to isolate and quantify specific classes ofpeptides (e.g. phosphopeptides) that were essentially impos-sible using the ICAT cysteine-selective chemistry.
Acknowledgments—We gratefully acknowledge the contributionsof Ralph Casale, Ivar Jensen, and Jim Coull for help and advice. Wewould also like to thank Dan Knapp for his efforts in deciphering thestrategy used for isotope coding.
* Part of this work was supported by National Institutes of HealthGrant GM27757 (to A. J.). The costs of publication of this article weredefrayed in part by the payment of page charges. This article musttherefore be hereby marked “advertisement” in accordance with 18U.S.C. Section 1734 solely to indicate this fact.
□S The on-line version of this manuscript (available at http://www.mcponline.org) contains supplemental material.
** To whom correspondence should be addressed: Applied Biosys-tems, 500 Old Connecticut Path, Framingham, MA 01701. Tel.: 508-383-7484; Fax: 508-383-7813; E-mail: [email protected].
REFERENCES
1. Goshe, M. B., and Smith, R. D. (2003) Stable isotope-coded proteomicmass spectrometry. Curr. Opin. Biotechnol. 14, 101–109
2. Tao, W. A., and Aebersold, R. (2003) Advances in quantitative proteomicsvia stable isotope tagging and mass spectrometry. Curr. Opin. Biotech-nol. 14, 110–118
3. Gygi, S. P., Rist, B., Gerber, S. A., Turecek, F., Gelb, M. H., and Aebersold,R. (1999) Quantitative analysis of complex protein mixtures using iso-tope-coded affinity tags. Nat. Biotechnol. 17, 994–999
4. Han D. K., Eng J., Zhou H., and Aebersold R. (2001) Quantitative profilingof differentiation-induced microsomal proteins using isotope-coded af-finity tags and mass spectrometry. Nat. Biotechnol. 19, 946–951
5. Ong, S. E., Kratchmarova, I., and Mann, M. (2003) Properties of 13C-substituted arginine in stable isotope labeling by amino acids in cellculture (SILAC). J. Proteome Res. 2, 173–181
6. Martinovic, S., Veenstra, T. D., Anderson, G. A., Pasa-Tolic, L., and Smith,R. D. (2002) Selective incorporation of isotopically labeled amino acidsfor identification of intact proteins on a proteome-wide level. J. MassSpectrom. 37, 99–107
7. Ibarrola, N., Molina, H., Iwahori, A., and Pandey, A. (2004) A novel pro-teomic approach for specific identification of tyrosine kinase substratesusing 13C-labeled tyrosine. J. Biol. Chem. 279, 15805–15813
8. Ong, S. E., Blagoev, B., Kratchmarova, I., Kristensen, D. B., Steen, H.,Pandey, A., and Mann, M. (2002) Stable isotope labeling by amino acidsin cell culture, SILAC, as a simple and accurate approach to expressionproteomics. Mol. Cell. Proteomics 1, 376–386
9. Gonzalez, C. I., Battacharya, A., Wang W., and Peltz, S. W. (2001) Non-sense-mediated mRNA decay in Saccharomyces cerevisiae. Gene 274,15–25
10. Hentze, M. W., and Kulozik A. E. (1999) A perfect message: RNA surveil-lance and nonsense-mediated decay. Cell 96, 307–310
11. Pappin, D. J. C., and Bartlet-Jones, M. (2003) Methods, mixtures, kits andcompositions pertaining to analyte determination. PCT Intl. Appl. Appli-cation No. WO 2004-US2077
12. Perkins, D. N., Pappin, D. J., Creasy, D. M., and Cottrell, J. S. P. (1999)Probability-based protein identification by searching sequence data-bases using mass spectrometry data. Electrophoresis 20, 3551–3567
13. Thompson, A., Schafer J., Kuhn, K., Kienle, S., Schwarz, J., Schmidt G.,Johnstone, R., Neumann, T., Hamon, C. (2003) Tandem mass tags: Anovel quantification strategy for comparative analysis of complex proteinmixtures by MS/MS. Anal. Chem. 75, 1895–1904
14. Karimi-Busheri, F. Daly, G., Robins, P., Canas, B., Pappin, D. J., Sgouros,J., Miller, G. G., Fakhrai, H., Davis, E. M., Le Beau, M. M., and Weinfeld,M. (1999) Molecular characterization of a human DNA kinase. J. Biol.Chem. 274, 24187–24194
15. Hoss, M., Robins, P., Naven, T. J. P., Pappin, D. J. C., Sgouros, J., andLindahl, T. A. (1999) human DNA editing enzyme homologous to theEscherichia coli DnaQ/MutD protein. EMBO J. 18, 3868–3875
16. Parker, K.C., Patterson D., Williamson, B. Marchese, J., Graber, A., He, F.,Jacobson, A., Juhasz, P., and Martin S. (2004) Depth of proteome issues:A yeast ICAT reagent study. Mol. Cell. Proteomics 3, 625–659
17. Gerber, S. A., Rush, J., Stemman, O., Kirschner, M. W., and Gygi, S. P.(2003) Absolute quantification of proteins and phosphoproteins from celllysates by tandem MS. Proc. Natl. Acad. Sci. U. S. A. 100, 6940–6945
18. Al-Shahrour, F., Dıaz-Uriarte, R., and Dopazo, J. (2004) FatiGO: A web toolfor finding significant associations of Gene Ontology terms with groupsof genes (fatigo.bioinfo.cnio.es). Bioinformatics 20, 578–580
19. He, F., Li, X., Spatrick, P., Casillo, R., Dong, S., and Jacobson, A. (2003)Genome-wide analysis of mRNAs regulated by the nonsense-mediatedand 5� to 3� mRNA decay pathways in yeast. Mol. Cell. 12, 1439–1452
20. Hsu, C. L., and Stevens, A. (1993) Yeast cells lacking 5�-3� exoribonuclease1 contain mRNA species that are poly(A) deficient and partially lack the5� cap structure. Mol. Cell. Biol. 13, 4826–4835
21. Wegierski, T., Billy, E., Nasr, F., and Filipowicz, W. (2001) Bms1p, a G-domain-containing protein, associates with Rcl1p and is required for 18SrRNA biogenesis in yeast. RNA 7, 1254–1267
22. Kurihara, T., Hamamoto, S., Gimeno, R. E., Kaiser, C. A., Schekman, R.,and Yoshihisa, T. (2000) Sec24p and Iss1p function interchangeably intransport vesicle formation from the endoplasmic reticulum in Saccha-romyces cerevisiae. Mol. Biol. Cell 11, 983–998
23. Sadler, I., Chiang, A., Kurihara, T., Rothblatt, J. A., Way, J., and Silver, P. A.(1989) A yeast gene important for protein assembly into the endoplasmicreticulum and the nucleus has homology to DnaJ, an Escherichia coliheat shock protein. J. Cell Biol. 109, 2665–2675
24. Zhong, T., and Arndt, K. T. (1993) The yeast SIS1 protein, a DnaJ homolog,is required for the initiation of translation. Cell 73, 1175–1186
25. Henry, N. L., Sayre, M. H., and Kornberg, R. D. (1992) Purification andcharacterization of yeast RNA polymerase II general initiation factor �.J. Biol. Chem. 267, 23388–23392
26. Mangus, D. A., Amrani, N., and Jacobson, A. (1998) Pbp1, a factor inter-acting with Saccharomyces cerevisiae poly(A)-binding protein, regulatespolyadenylation. Mol. Cell. Biol. 18, 7383–7396
27. Zuk, D., and Jacobson, A. (1998) A single amino acid substitution in yeasteIF-5A results in mRNA stabilization. EMBO J. 17, 2914–2925
28. Peterson, C. L., and Herskowitz, I. (1992) Characterization of the yeastSWI1, SWI2, and SWI3 genes, which encode a global activator of tran-scription. Cell 68, 573–583
29. Ju, Q., Morrow, B. E., and Warner, J. R. (1990) REB1, a yeast DNA-bindingprotein with many targets, is essential for growth and bears some re-semblance to the oncogene myb. Mol. Cell. Biol. 10, 5226–5234
30. Thomas, D., Rothstein, R., Rosenberg, N., and Surdin-Kerjan, Y. (1988)SAM2 encodes the second methionine S-adenosyl transferase in Sac-charomyces cerevisiae: Physiology and regulation of both enzymes. Mol.Cell. Biol. 8, 5132–5139
31. Fatica, A., and Tollervey, D. (2002) Making ribosomes. Curr. Opin. Cell Biol.14, 313–318
32. Stevens, A. Hsu, C. L., Isham, K. R., and Larimer, F. W. (1991) Fragmentsof the internal trsanscribed spacer 1 or pre-rRNA accumulate in Saccha-romyces cerevisiae lacking 5�-3� exoribonuclease 1. J. Bacteriol. 173,7024–7028
Multiplexed Quantitation Using Isobaric Reagents
1168 Molecular & Cellular Proteomics 3.12
by on February 9, 2007
ww
w.m
cponline.orgD
ownloaded from

33. Maderazo, A. B., He, F., Mangus, D. A., and Jacobson, A. (2000) Upf1pcontrol of nonsense mRNA translation is regulated by Nmd2p and Upf3p.Mol. Cell. Biol. 20, 4591–4603
34. Griffin, T. J., Gygi, S. P., Ideker, T., Rist, B., Eng, J., Hood, L., and AebersoldR. (2002) Complementary profiling of gene expression at the transcrip-tome and proteome levels in Saccharomyces cerevisiae. Mol. Cell. Pro-teomics 1, 323–333
35. Gygi, S. P., Rochon, Y., Franza, B. R., and Aebersold, R. (1999) Correlationbetween protein and mRNA abundance in yeast. Mol. Cell. Biol. 19,1720–1730
36. Washburn, M. P., Ulaszek, R. R., and Yates, J. R. III (2003) Reproducibilityof quantitative proteomic analyses of complex biological mixtures bymultidimensional protein identification technology. Anal. Chem. 75,5054–5061
Multiplexed Quantitation Using Isobaric Reagents
Molecular & Cellular Proteomics 3.12 1169
by on February 9, 2007
ww
w.m
cponline.orgD
ownloaded from