nbrl 48th tpr, april 1973 - nasa · · 2013-08-31this study we have used a metal vessel...
TRANSCRIPT

NBRL 48th TPR, April 1973
o
ULtA
*
o
(d an
C,
".4 ·0 V
W- E-4W4s r X XH 0 N(
U Ed44> Hmoco oun
v OUP4 M E X
HU aM
rN~ u z;
As PQ c;~XQ q us3 a5
Eno 4c
Pq C4 n cod
WmX H
4WHW a~
E0 fjtl m 4
Z: Pa Z > eC a uW Ad
RELEASE OF BACTERIAL SPORES FROM THE INNER WALLS OF ASTAINLESS STEEL CUP SUBJECTED TO THERMAL STRESSES
AND MECHANICAL SHOCK
H. Wolochow, M. Chatigny and J. Hebert
The release and fallout of particulates from sur-faces afforded thermal or impact stress is of con-cern to workers responsible for control of contami-hation of Mars from planetary landing vehicles. Inthis study we have used a metal vessel contaminatedby aerosols of spores as a model system and have ex-amined the fallout of spores as affected by variousmechanisms. Thermal stresses simulating those ex-pected on the Mars lander dislodged approximately.01% of the aerosol deposited surface burden as dida "landing" shock of 8 to lOG deceleration. Sporesimprinted by finger or swab contact yielded similarresults. In all cases where repeated cycling oftemperature, motion, or shock were employed the ma-jority of fallout occurred in the first cycle. Par-ticles released from the surface were predominantlyin the size range 1 to 5im.
One of the major experiments in the planetary exploration programwill be the soft landing of a spacecraft on the planet Mars. Includedin the lander module will be various pieces of equipment designed-toassess the presence of living entities (microbial cells) on this planet.Experimental equipment will be contained in metal vessels. Although itis planned to use thermal processed terminal sterilization of the space-craft and a high degree of assurance of sterility will be attached tothe entire process, there still remains a chance for viable microbialcells to be residual on inner surfaces on the containment vessels. Ifcells are dislodged during spacecraft landing, then residence on Marswould be a threat to the planetary quarantine and the integrity of thelife-detection system. Stresses which might encourage dislodgement ofcells deposited on surfaces include minute changes in vessel dimensionsresulting from thermal gradients and deceleration distortion from land-ing shock. Furthermore, dimensional changes of the container (openedon Mars) would induce atmosphere flows through small openings; theseflows could carry with them cells rendered airborne during surfacedeformation. The ease with which cells could be dislodged may well bea function of how they were deposited initially.
The experiments to be described were undertaken to investigatethe potential for dislodgement of microbial spores deposited on stain-
6Fb (&2 Rt.
IA I 3 q-O- 3363
https://ntrs.nasa.gov/search.jsp?R=19730022255 2018-06-26T21:07:50+00:00Z

NBRL 48th TPR, April 1973
less steel surfaces subjected to thermal and deceleration stresses.The stresses were those derived from preliminary data on Mars surfaceconditions and planned soft landing deceleration (ca. 1250 C temp.variation diurnally, 8 to 12g deceleration). The data presented here-in do not consider the aerosol fall rate effects of Martian gravityand "thin" atmosphere, nor do they consider the thermal insulation ofthe enclosed spaces.
Bacterial spores, deposited from aerosols, were dislodged bythermal stresses. The "yield" was less than 10-2% of the burden.Deceleration of 8-12 g dislodged 0.6 x 10⁻² to 3 x 10⁻²% of aerosoldeposited spores. Spores "imprinted" on surfaces by swabs or coatedfinger were dislodged in 2 x 10⁻² to 1 x 10⁻² of spore burden bythermal stress.
MATERIALS AND METHODS
1. Test vessel. Fig. 1 is a dimensional sketch of the testfixture. The vessel is made of type 304 stainless, helium arc welded,with smooth inner joints and a tapered interior with no re-entrantsurfaces. Fluids or gases can be circulated through the jacket.
A metal band on which a rod (½" dia.) is welded at right angleswas clamped around the test vessel. The test vessel can be held on aring stand in the desired orientation.
In order to maximize collection of particles dislodged from thetest vessel, a circular metal disk was supported on another disk withfriction fingers which gripped the test vessel on its outer surfacenear the open end. A gap of about 1/8" existed between plate andvessel. A one-holed rubber stopper was inserted into centrally loca-ted holes through these plates.
In some experiments designed to simulate "thermal breathing" out-put from larger volume vessels, a small bore metal tube was insertedinto the vessel so that tube end was about 2-3 cm from the closed endof the vessel. Sterile dry air (in-line filters Pall Mfg. Co.) wasblown into the test vessel at various volumetric rates measured by arotameter. This arrangement was not used in all experiments.
Two other versions of this disk system were used; these will bementioned below.
2. "Contamination" of test vessel.
a. An aerosol of washed spores of Bacillus subtilis varniger (BG spores) was generated for 10 min by a Chicago-type (two-fluid
364

NBRL 48th TPR, April 1973
non-refluxing) atomizer (ca. 0.75 cfm), fed by a motorized syringepump which delivered ca. 0.75 ml per min of an absolute alcohol sus-pension (ca. 3 x 10¹⁰ ml) of washed lyophilized spores. A suspensionof this concentration sprayed from this type atomizer will be pro-duced with a nominally log-normal particle size distribution with thenumber mean diameter approximately 5-81. Each particle will containfrom 1 to 5 spores. The aerosol was directed into a length of sheetmetal pipe, with about 1.15 cfm secondary air drawn through by avacuum source at the distal end of the tube. The secondary air wassupplied from laboratory dry air mains (ca. -30 C dewpoint) redriedthrough tandem activated alumina beds (Pittsburgh "Lectrodryer").The test vessel was held on a "T" joint, some 50 cm from the aerosolinlet, in such a manner that the inside of the vessel faced up, normalto the air flow (Fig. 2). The entire apparatus was held in a largetank (Fig. 3) held at a moisture level of ca. 50-100 ppm H20. Manipu-lations were carried out through rubber gloves. After the inside ofthe vessel was "contaminated", a gasketed lid was placed over itsopening (and held by rubber bands) prior to removal to a "dry box",which served as a test chamber, in which subsequent manipulations andsampling were carried out. A thin film of silicone grease was spreadon the rim of the opening of the test vessel. The outside of the"contaminated" test vessel was decontaminated with dilute (25 to 100ppm) hypochlorite solution and air-dried prior to removal to the drybox.
b. Contamination by swab or fingers. Washed suspensions ofspores were swabbed onto inner surfaces with a cotton-tipped stick. Inanother trial, tips of fingers were dipped in this suspension and im-prints made on several locations within the vessel. In both cases, thetest vessel was equilibrated with the atmosphere inside the dry boxprior to subsequent thermal cycling.
3. Dry Box. A section of a Class III hood system was used(Fig. 4). This section, about 30 in. long, had gasketed doors oneither end and dual glove ports on the front. The box was flushedwith air which was dried by an Electrodrier, until the water vaporlevel was below 100 ppm. Penetrations into the box were available forsupply of flushing air, vacuum and other services.
Between trials the inside of this box was decontaminated by ato-mizing formalin. After an air-wash, ammonium hydroxide solution wasatomized for neutralization of deposited paraformaldehyde and air-wash continued.
4. Assay of Bacillus spores. Washed spores of Bacillus sub-tilis var niger were used throughout. Counting of viable spores wasdone on Trypticase Soy Agar (BBL) (TSA). This medium was used in allthe collections. Plates were incubated at 37 C for 24 hr prior tocounting. Distilled water was used for dilution purposes.
365

NBRL 48th TPR, April 1973
a. Aerosols
i) All glass impingers (AGI-30) sampling at 12.5
1/min were used, operated with short sections of tubing intruding
into the dry box. The collecting fluid, water, was assayed for
spores.
ii) Setting plates. Sterile, 100 mm petri dishes
were placed on the bottom of the dry box (Fig. 5). Just before a
trial, the lids were removed. After the desired time interval, the
lids were replaced, the dishes removed and 20-25 ml molten (50-60C)
TSA was added.
Settling plates containing TSA were used in several early experi-
ments, where low humidity was not a requirement.
iii) Slit samplers. One cfm air was sampled onto TSA
plates which rotated at 2 rpH. By noting starting location, time of
arrival of spores could be determined as a function of manipulations.
iv) Andersen sampler. A six-stage unit was used to
estimate both colony forming unit (CFU) concentration and particle
size distribution. Unit operated at 1 cfm.
v) Stainless steel disc. For spore assay, plates
were immersed in distilled water and sonicated for 10 min. Aliquotswere filtered through a 0.45im membrane filter, which was placed on
freshly poured TSA.
vi) Gelman glass fiber filter discs (13 mm). Thesediscs were blended (Waring) in 100 ml H20 for 3 min. Suspension
filtered through 0.45 im pore MF, which was treated as in (v) above.
b. Total surface burden. The test vessel was filled(350 ml) with sterile water. The probe of a Branson sonifier was
immersed and power set at 100 watts. Immersed depth was adjustedfor optimal action for 1.0 minute of sonication. Viable counts ofspores were made as above.
5. Measurement of water vapor. A Beckman electrolytic hygro-meter (Model 179) was used. Moisture contents are expressed as parts
per million water vapor (w/v).
366

NBRL 48th TPR, April 1973
6. Thermal cycling of test vessel.
a. A temperature above ambient. A steam generator (resis-tance wire in water contained in a 2 1 heavy wall filter flask, 20-30 volts) external to the dry box, delivered steam at essentiallyatmospheric pressure to the test vessel jacket, the return tubing fromwhich was external to the dry box. A metal thermometer was placed inan unused inlet to the test vessel. Alternatively, a 24 ga iron-constantin thermocouple was taped to the vessel wall and a 0-10 mvdigital voltmeter (Digitec) was used for EMF measurement, with a water-ice mixture containing the cold junction. Warm water, generated bypassage of tap water through a section of pipe containing an electricheater, was also used in some trials.
b. Temperature below ambient.
i) Ice water circulated through test vessel jacketby a small pump.
ii) Ethylcellusolve, cooled by dry-ice was circulatedas above.
iii) Liquid nitrogen was pulled into the test vesselby a vacuum line connected to one of the openings into the jacket ofthe vessel.
7. Deceleration. Dropping the test vessel from a height ofabout 25 cm onto a 3 cm thick pad of sponge gave about 10-12 g de-celeration force as measured by a calibrated accelerometer. Droppingapproximately 12 in. onto a metal surface yielded measured decelera-tion forces in excess of 100 g. The spores dislodged were caught ona metal plate (no central hole) covering the open end of the testvessel.
RESULTS
1. Spore burden in test vessel. Deposition from aerosol gave1 to 30 x 107 spores, as did cotton swab. Approximately 2.7 x 10⁸spores were recovered following "inoculation" by contaminated fingers(Table 1).
2. Dislodgement of aerosol-deposited spores.
a. Air flow alone (spores recovered on petri plates). In2 trials, air flow into the vessel (opening down) was changed from 0to 85 1/min (Table 2). At the highest flow, over 1000 CFU were co-llected directly below the test vessel; at 10 1/min or less the numbers
367

NBRL 48th TPR, April 1973
were somewhat smaller, and did not parallel air flow change. At thehighest flow rate, it is probable that many large particles were dis-lodged (note higher central plate count) and that the small particleswere rendered airborne and did not reach the settling plates in theshort sampling period used.
At 24 C, over a 1 hr period, a total of 54 CFU were recoveredwith no air flowing. When air at 150 ml/min was admitted, over a 20hr period, 70 CFU were recovered (Table 3). Thus, it is concludedthat a small air flow was found to be ineffective, of itself, in dis-lodging particles.
b. Thermal shifts.
i) With no air flow, no measurable effect on depositedBG spores was found when test vessel, laden with 2.6 x 10⁸ spores washeld for 2 hrs at 100 C (Table 4). During this time, a total of 159CFU were recovered on settling plates below and near the test unit.
During a 2 hr period, at approximately 24 C, 43 CFU were recoveredon 12 settling plates after putting the test unit in place in the drybox. Without disturbing the vessel, the temperature was cycled 4 timesbetween 4 C and 100 C over a 2 hr period. A total of 26 CFU was re-covered on 12 settling plates (Table 5). Similar results were obtainedwhen temperature was shifted from 24 C to 95 C and then down to 5 C(Table 6). In another trial in a 2 hr "pre-thermal period", 18 CFUwere recovered on 8 plates. When temperature was raised to 100 C,lowered to 2 C and raised to 24 C, 91 CFU were recovered on 11 plates,62 being found on the plate immediately below the vessel (Table 7).
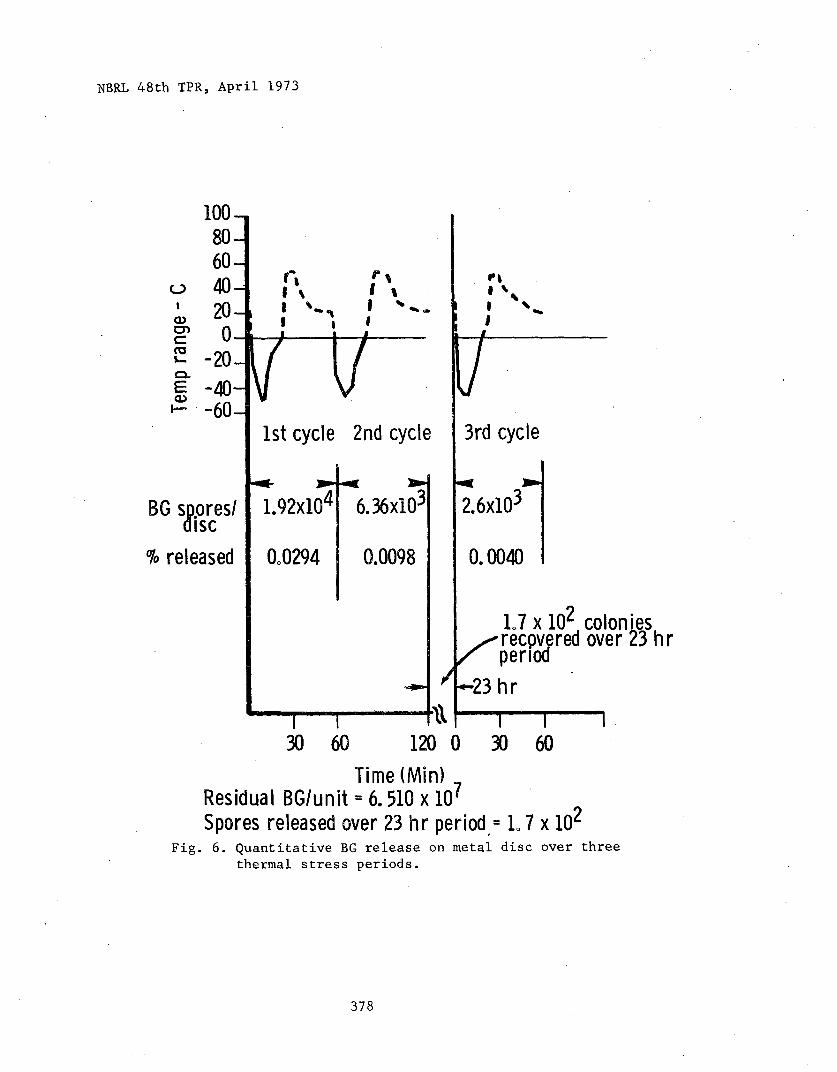
ii) Spores recovered by means of the metal disc. Itwas recognized that the distributed plates did not collect all par-ticles released from the unit and the cover plate and disc were added.With the vessel in the vertical position (opening down) temperaturewas cycled as shown in Fig 6. Number of CFU caught during each cycleand in the 23 hrs between cycles 2 and 3 is also shown. It is evidentthat heat-treatment released spores, which fell on the sampling plate;building vibration probably accounted for spores released at almostthe same rate over the 23 hr period between cycles 2 and 3.
Placing the vessel in the horizontal position yielded data asshown in Fig. 7. All attempts were made to minimize mechanical dis-lodgement during sample disc placement. It would seem that evenunder this orientation of the unit, spores were caught on the sampledisc, although in numbers smaller than in the previous trial. It isalso noted that holding the test unit for 17 hours in this positionyielded 80 CFU (about 3x the output from the second cycle).
368

NBRL 48th TPR, April 1973
iii) Collection of spores on metal disc and from aero-sol by slit sampler and AGI-30. One thermal cylce, with vessel ver-tical, was carried out. Temperatures ranging form room to -65 C to100 C and back to room. The profile of aerosol concentration vs.time is shown in Fig. 8. Virtually all the spores, as aerosol werecollected during the first cooling from room temperature and thenheating to 100 C phase. Very few were recovered during cooling from100 C to room temperature. Most spores were dislodged during thefirst cooling phase, indicating that the first dimensional change ofthe vessel is of primary importance in particle dislodgement.
The slit sampler collected 33 CFU per liter of air, while theAGI-30 collected 42/1. Thus, there were about 1.3 spores per particle,since the slit device enumerates particles (regardless of spore num-bers per particle) while the count from the AGI-30 more nearly repre-sents individual spores. The test disc had 604 colonies on it.
In a somewhat similar experiment, 3 temperature cycles werecarried out, ranging from ca. 70 C to 40 C, over a 90 min period(Fig. 9). With a further 18 hr period at 22 C, 1 more temperaturecycle was imposed (liquid N2, to 85C, to 22 C). Aerosol concentrationratios were measured with a slit sampler and fallout on a petri dishimmediately below the vessel. In one instance an Andersen sampler wasused. CFU were recovered in small numbers (less than 30) on all stages.Most of the spores were released during the initial cooling phase, bothas aerosol and as fallout particles. The number of spores, obtainedin the fourth cycle, was greater than in the previous 3, where thetemperature gradients were smaller. During the last cooling cycle,the temperature was reduced to the point where liquid oxygen dropletscollected on the surface of the vessel and ran down, onto the falloutplate, where they evaporated. It is quite likely that these dropletscarried with them the spores which appeared in the fallout plates andin the aerosol. With the test vessel open end up at a temperature of-196 C (LN2) ca. 5 ml of liquid 02 collected over 15 min. This liquidevaporated rapidly when the LN2 supply was closed off.
The test vessel, held in the horizontal position, was fitted withthe metal collection plate which supported an air inlet at 125 ml/min(0.3 volumes/min) and an outlet (Figs. 10, 11). The latter wasconnected to an in-line filter holder which held a 13 mm glass fiberfilger pad (Gelman). This filter was assayed as described above.Two trials were carried out, with 3 temperature cycles each ( ca. 40min. per cycle (Fig. 12, 13)). From the results in Table 8, it can beseen that spores were released onto the collection plate and as aero-sol. From ca. 10'2% to 10-4% of the total burden were dislodged, andaerosol concentration ranged from 6 to 350 CFU/1 of air.
369

NBRL 48th TPR, April 1973
Deceleration. The test vessel (spore burden deposited from aero-sol) with metal collection plate over the open end was dropped (openend down) about 30.5 cm onto a polyurethane pad (acc = 8 to 12 G). In4 trials, the fraction of the total burden recovered on the platevaried from 0.6 x 10⁻⁴ to 2.8 x 10⁻⁴ (Table 9). When test vessel wassubjected to deceleration of over 100 G, a maximum of 3.9% of the sporeburden (aerosol deposited) was recovered on the test disc (Table 10).
Release of spores deposited by swab or fingerprint. These modesof contamination deposited spores which were released in the sameorder of magnitude as when spores were deposited from an aerosol(Table 11).
DISCUSSION
In limited-scope trials as are described in this report, it isdifficult to compute significance of the data and it is required thatresults be clear-cut and without great reservations concerning thetest method. With a few exceptions, these tests showed an increased(compared to quiescent) rate of fallout of particles from the testunit when it was thermally cycled or afforded physical shock. How-ever, the simple act of handling or even holding the test unit alsodislodged particles indicating that the particles were not very firmlyattached. A scanning electron-microscope photo of a spore particle (Fig. 14)deposited on a stainless steel slide in this system showed that theparticles had little material around them. It is likely that the testconditions provided near "worst case" as far as secure attachment ofthe particles was concerned.
The aerosol depositing system used provides a "log-normal" par-ticle size distribution under normal conditions. From the results,it appears that these sprays had many particles in sizes below 5p.These indeed appeared to be responsible for most of the fallout.This is shown by the ratio of AGI-30 to slit sampler counts (ca. 1.33)and by Andersen sampler counts. This particle size distribution isfortuitously, probably a good simulation of that occurring on "cleaned"surfaces.
The thermal deformation of the test vessel provided a rathersmall dimensional change which is on the order of 1.3 x 10⁻³ cm/cmlinearly for a 100° C change in the temperature range used. It isnot likely that this would provide simple shear forces exceeding theparticle to surface adhesion forces but that a more complex relation-ship exists. In at least one test where LN2 was used for coolant,the precipitation of liquid 02 on the test surface provided a verylarge increase in particle removal.
370

NBRL 48th TPR, April 1973
The question of thermal "pumping" of the atmosphere in an enclo-sure is not clearly resolved by these experiments. However, the dataof Table 8 do show that a considerable increase (as high as 4x) inparticles per unit time collected occurred with a "low" (0.3 vesselvolume/mixture) volume air flow. It should be noted that consideringonly dimensional terms for a cubical box, the change in volume is onthe order of 4 x 10⁻³ cm3/cm3/100° C (or 1.7 cm3). The aerosol con-centration shown in Table 8 exceeds that expected from thermal changeby a very large factor which could be computed only with additionalinformation regarding the temperature change rate, which is notexpected to be of the order of magnitude to make the pumping actionequivalent to that tested here.
CONCLUSIONS
Spores deposited on interior surfaces of a stainless steel con-tainer from aerosol, swab or finger imprinting are released at lowlevels by minute vibrations, thermal cycling and sharp shock. Releasefractions appear to be on the order of 0.6 to 3.0 x 10⁻²% of originaldeposits. The released particles are small (< 3 pm) and are readilytransportable. The majority of release occurs in the first cycle oftemperature change, physical shock or even handling. Thereafter, therelease rate diminished slowly.
Table 1. Spore burden, inner surface of test vessel
Contamination by # of trials Spores/vessel (x107)
Aerosol deposition 17 8.0 (a- = 9.0)
Cotton Swab 1 3.4
Finger 1 27
371

NBRL 48th TPR, April 1973
Table 2. Effect of varied air flow within test vessel on spore release(Vertical position)
air flow time, ; *spores/test **CFU/plate radiallytrial l/min min plate located plates total
1 0 5 43 5,3,0 81 5 28 2,9,3 145 5 10 4,2,4 10
10 5 1000 1,2 385 5 1000+ 7.15.6 28
2 0 5 11 3,6,4 131 5 Contam. 3,8,6 175 5 25 11,5,7 23
10 5 10 5,9,3 1785 5 Ca 3000 12,12,19 43
* Directly below unit TSA filled plates
**10 in. away from base of unit
1 =2.96 x 10⁷Residual BG spores/unit
2 =1.83 x 10⁷
2 =300 ppm w/v
Table 3. Effect of 150 ml/min air flow for 20 hrso on release of BG spores.
0 water air flow ¢.Testtemp. C vapor ppm time hr. ml/min. plate ** radially located plates total
1 0 42 0,7,3,2,0,1,0 5424 125
20 150 2 3,0,1,1,10,1,27;5,3,17 70
* immediately below unit** 10 in. away from base of unit
Table 4. Effect of 2 hr hold period at 100 C on dislodgement of BG spores
test plate CFU Radially located plates CFU
372
11 3,4,34,26,19,6,3,1,3,7,15,19,8 159
270 ppm w/v watervaporResidual BG spores/unit = 2.55 x 10
total

NBRL 48th TPR, April 1973
Table 5. Effect of repeated temperature shifts from 4C to 100Cdislodgement of BG spores
**CFU/radiallytemp. *CFU/test locatedrange C temp.,hr plate plates total
pre stressperiod 24 2 7 1,3,3,8,5,7,5,4 43
stressperiod 4-100 x 4 2 8 2,1,2,3,4,0,1,1,1,1,2 26
* Directly below unit** 10 in. from base of unit275 ppm watervaporResidual BG/unit = 4.2 x 10⁷
Table 6. Effect of thermal shift from 5 to 95 Con release of BG spores
temp.oc
samplet imemin.
*CFU/testplate
**CFU/radiallylocatedplates
totalCFU
24 15 4 7,0,0,1 12
95 15 30 0,7,5,8 50
5 15 54 11,2,1,0 68
* Directly below unit** 10 in. from unit base180 ppm watervaporBG spores/unit = 2.2 x 10
Table 7. Recovery of BG spores, allowing 2 hr settling timefollowing a rapid temp. shift
temp. range C time/hr *CFU/plate **CFU/radially located plate total
24° (steady) 2 2 0-4,2,1,8,, 1,0 16
24 to 100 to2 62 1,2,4,1,6,4,5,3,1,2 29
2 to 24
* Directly below unit** 10 in. away from base of unit150 ppm water vapor 7Residual BG/unit 2.27 x 10
373

NBRL 48th TPR, April 1973
Table 8. BG release from horizontal positioned test vesselunder thermal stress and low air flow. (.3 Vpm)(l)
thermal BG Collector Fraction Collectedstress temp. BG/ltr. of
Residual period gradient Mletal Glass Metal Glass EffluentTrial BG/unit (sequential) C Disc Filter Disc Filter Aerosol
1 -47 to +57 4.74 x 10³ 7.17 x 10³ 1.56 x 10⁻⁴
3.86 x 10' 5
2.21 x 10²
1 3.03 x 10⁷ 2 -55 to +55 1.27 x 10² 3.07 x 10² 4.19 x 10⁻⁶
1.94 x 10⁻⁵
2.40 x 101
3 -59 to +57 8.00x 101 3.33 x 101 2.64 x 10⁶ 1.10 x 10⁶ 6.28 x 100-0 -5 -5
1 -57 to +57 1.26 x 10³ 1.48 x 10³ 3.49 x 10⁻⁵
4.10 x 10- 5
3.55 x 10²
22 3 -6 1 -6 102 3.61 x 10⁷ 2 -61 to +59 2.40 x 10² 1.83 x 10² 6.65 x 10⁻⁶
5.07 x 10⁻⁶ 4.39 x 10
3 -61 to +60 7.76 x 10² 1.30 x 10² 2.15 x 10⁻⁵ 3.60 x 10⁻⁶ 3.12 x 10·UmhJ *CU UrI5o - -t ----> -t -- ... t/n ·fn.
(l)Volumes of Vessel/minute
Table 9. Effect of deceleration at 8-12G ofon release of sporeso
Residual BG CollectedBG/unit per disc
Trial (x107) (x103)
test vessel
Fractionreleased(x 10-4)
1 31.3 88.4 2.82
2 4.59 2.80 0.61
3 22.8 26.6 1.17
4 10o7 17.0 1.59
125 ppm water vaporTemp. 22 CSettling time 1 hr.
Table 10. BG release due to 12" drop to hard surface. (G 100)
RHTest Fall - ppm Residual BG recovered Initial % .
Number Dist. Temp. w v BG/unit /Disc BG/unit Recovered
1 12" 22 80 1.06 x 10⁷ 4.32 x 10⁵ 1.10 x 10⁷ 3.93
2 12" 22 80 5.36 x 10⁷
1.70 x 10⁶ 5.33x 10
7 3.07
3 12" 22 80 9.10 x 10 7 2.34 x 10⁶ 9.33 x 10⁷ 2.51
374
i p.rZ&u %U mlnl

NBRL 48th TPR, April 1973
Table 11. Release of spores from test vessel by thermal cycling.Contamination by fingers on cotton swab.
Temperature Spores Fraction released
Deposition °C Collected (x 10 )
Cotton swab -54 to +57 7.3 x 10² 2.2
Fingerprint -57 to +57 4.1 x 10⁴ 15.4
HeliarcConstructionWater Tight
Fig. 1. Fallout test vessel; cross section andplan.
375

NBRL 48th TPR, April 1973
Fig. 2. Aerosol transit tube, shown inside the large tank. Thetest vessel is shown attached to the T-section. Aerosolgenerator is on the right hand end of the transit tube.
Fig. 3.Exterior view of large tank.Transit tube may be seen throughthe central view port. Thehygrometer and motorized syringeare on the towel-covered table.
376

NBRL 48th TPR, April 1973
Fig. 4. Test chamber, just to left of open-faced hood. Varioustest equipment is on cart (liquid N2 container and steamgenerator) and on table (hygrometer, impinger, slitsampler and millivoltmeter).
Fig. 5. View inside test chamber. Test vessel is in center, openend down. Petri plates are on a circle below and to theside of the test vessel. One petri dish is directly below.Thermocouple is seen attached to vessel side.
377
NBRL 48th TPR, April 1973
lI
C-)C:
I-
Ea)
10080-60 -40-;20-0 -
-20--40--60-
BG spores/disc
% released
I %
U I
V1st cycle
1.92x10⁴
0°0294
I30
%I -
V2nd cycle
6.36x10³
0.0098
660
'/
II 2S
120 C
I
3rd cycle
3rd cycle
2.6x10³
O. 0040
1.7 x 10²recovered
/ period
coloniesover 23 hr
-23 hr
I I) 30 60
Time (Min)Residual BG/unit = 6. 510 x 107Spores released over 23 hr period = 1o 7 x 10²
Fig. 6. Quantitative BG release on metal disc over threethermal stress periods.
378
II

NBRL 48th TPR, April 1973
0,
II
~II* 41
v!
806040
200-
-20--40'
-60-
-80
IIII
-
2nd cycle
*-1.2x10³ BG/Disc 3.0x101 BG/Disc--
release=. 62x10-2 release=16xl10- 5
Residual BG/Unit after stress=1.93x10 7
80 BG/Disc for 17 hr static settling% Release 17 hr static = 0.00041
I
12224 3636
I
48UU I
6060
I I I6
72 84 96 108
'8W.-
CaC
.-.--
i)r.)
4--
4-I
120Time (min)
Fig. 7. BG release onto metal disc over two thermal stress
periods. Test vessel in horizontal position - no
air flow.
379
100.
1st cycle
I
cm,
a)
CLrn
Ei.
._ - --
k

NBRL 48th TPR, April 1973
100
60 f ",40 I'
200I
E-20'1I-4
-60-80
NOTE: Total BG Collected:103 Slit Sampler - 914/28 CF Sample (32.611)
AG I - 30 - 523/12.4 CF Sample (42/1)Eto A Test disk - 604
.~i2
> C 10
~ ~.o' rio colon iesl]L, ~-for 30 min
sample period
100 ,,0 10.20 30 60 90 120
Time (min)
temp.o---o colony counts during sample period
RH 125 ppmFig. 8. BG collection in relation to time during one cooling
and heating cycle of test vessel. Vertical position.
380

NBRL 48th TPR, April 1973
100.
n
'-20E -40 .u V V
-60-80 (Methyl Cellusolve inmE (Liquid Nitrogen)
0 dry ice)
l-10 30 60 9 0 6
-120 -
-140103 1l0o
Experimental Time (minW
- CFU/Slit Sample Period (ICFM)* CFU/Settling plate per time period
*Collected with I CFM Andersen multistage sampler(nmd = )
Fig. 9. BG collection in relation to time during coolingand heating cycle.
381
0)
C-,I
-0
I · ·

NBRL 48th TPR, April 1973
vac
Rotameter
Clamp Go I ectiondevice disk
FilterAirinlet
Fig. 10. Schematic of set-up for testing for spore releasefrom test vessel in horizontal position.
382

NBRL 48th TPR, April 1973
Fig. 11. Test arrangement for study of spore dislodgement withtest vessel in horizontal position. Upper-assembled;bottom - filter, collecting disc, support disc andO-ring.
383

NBRL 48th TPR, April 1973
Trial #110080 1st cycle 2nd cycle 3rd cycle6040
20 %l so20I
E -20~-40
-60-80
BG Collection BG Collection BG CollectionMetal Glass Metal Glass 2 Metal GlassDisk Filter c iDisk Filter Disk Filter4.74x103 3 1. 22xiO 5087xl02 8-x)O1 3.33x101
1( 17x103O4total 5o91X103 tota LXO3 - total 1.13x10 2
!' " I ' al0 12 24 36420 12 24 36 .480 12 24 3642
Thermal Stress Time (min)Fig. 12. Collection of spores with test vessel in horizontal
position. Temperature sequences.
384

NBRL 48th TPR, April 1973
Trial #2
1st cycle
I,'I %I * tI
I-
BG CollectioiMetal Disk1.26xO03Glass Filter1.48x1O
total2o94x10 3
12I aI24 36
ciCD
U-
2nd cycle
I I
IIR
BG CollectionMetal Disk2o4x102
Glass Filter1.83x10
total4.23x102
ao
.-
C
ci)WQF
3rd cycle
,9 %1%
II I
R %-
BG CollectionMetal Disk7.76x102
Glass Fijter1.30x10Ototal9.06x102
T --- I ·- - iI0 12
. . II24 36 42 00
Thermal Stress Time (min)12 I 624 36
Fig. 13. Collection of spores with test vessel in horizontalposition. Temperature sequences.
385
100.
80-60.40.20.
-20
C-)
Eai)
-40,-60-80.
I0
W
%a

NBRL 48th TPR, April 1973
Fig. 14. Spore bearing particle deposited from aerosol ontostainless steel.
386

0
·. ATTENTION ?EPRO:
.BE-O- PRItTI1,., CONTACT INPUT FOR PAGINATION
,:
PROCESSOR ,
W NA S' FHOAPM ,INI1�HSi PAG.E'
'AE FlEC"~S.E FiLE
,,I c'.'oC - cr (r ( 'I Gar