ncsx project risk management & contingency analysis chris gruber march 13, 2008
TRANSCRIPT

NCSX ProjectRisk Management
&Contingency Analysis
Chris GruberMarch 13, 2008

Topics Addressed
• Background -- History and Current Status of NCSX Risk Identification and Analysis
• NCSX Risk Management Process• NCSX Contingency Analysis Process and Model• Draft Contingency Analysis Results to Support
BCP Submittal for NCSX Project
2

Background - 1
• Earlier practice on project was somewhat informal – “Critical Issues List” – All risks not identified, assessed, and tracked– Risk Mitigation not formally identified/managed– Near term and even real time focus on risk mitigation as
compared to project life cycle perspective• Increased focus on formal Risk Management during 2007
– Initial Risk Register developed and used to estimate contingency in August 2007 estimate. (Risk contribution was small compared to uncertainty contribution.)
– Risk register evolved for last ~6 months (e.g., risks were added, downgraded, and retired) but did not play a strong central role as a management tool. Failed to avoid large delays and cost growth as some risks were realized.
– Root cause: inadequate initial risk identification.
3

Background - 2
• Much more emphasis on Risk Management in 2008– Revised Risk Management Plan– More focused risk identification and assessment process
was completed.• Analyzed causes of past cost and schedule problems in considering
future risks.• More systematic approach to ensure that all important risks are
identified and “owned” by job managers and project office.• More attention to mitigation. Tasks identified, planned and
tracked.• Result: risk register better captures project risks and mitigation
plans. Will be more useful as a management tool.– Quantitative Analysis to support contingency estimate
• Risk element is larger contributor to contingency now– Project management team committed to keeping focus on
risks as project moves forward
4

Problems already encountered on NCSX (or previous Projects)Risk
Procurement issuesMajor procurement vendor delays MCWF: 24-->33 mos. (38%) VVSA: 14 --> 24 mos. (71%) TF: 18-->30 mos. (67%)Assembly held up by delayed or non-conforming parts Chill plates Alumina shims MCWF PF coils out-of-round (NSTX, TFTR)
Design issuesDesigns had to change Hard tubing on VV Inboard shim design Alumina shims.Assembly cost and schedule grew as assembly sequence plan matured:Steady trend in 2007-08
Manufacturing operations issuesMetrology delays due to equipment problems or anomalous results MC metrology anomalies- Feb. '07 MC Romer arm problems- Nov '07 FPA laser tracker anomalies- Oct. '07
Modular coil fabrication costs grew even after FDR and completion of twisted racetrack R&D coil.
Machine operations IssuesCooldown problems during cold test of TRC and C1 modular coil.
Vacuum leaks (e.g., ATF)Field Errors detected in e-beam testsATF (~6 months delay)
Organizational IssuesLoss of key indviduals from leadership positions has impacted schedule. Delayed critical design tasks. 5
Past problems were analyzed for relevance to future risks.• Cost & schedule growth as
assembly sequence plan matures is still a risk.
• Cost growth in mfg. operations is now better appreciated and included in base estimates and uncertainty.
• Future procurements have more float, making critical path impacts less of a risk than in the past.

Risk Management Process
• Generally follows standard DOE guidance and practice– Evaluates events or conditions that may or may not
happen or be realized over the life of the project– Both Threats and Opportunities addressed
• Key Elements:– Establish Bounding Assumptions– Risk Identification– Risk Assessment– Risk Mitigation– Quantitative Analysis– Risk Documentation and Tracking/Reporting
6

Bounding Assumptions
• Funding Availability • Constant PPPL state of operations/overheads• No extraordinary incidents, stand downs or
lab shutdown• No change to CD-4 Completion Criteria• Risks with very low likelihood of occurrence
but high impacts/consequences excluded
7

Currently Excluded Risks
• Major technical events requiring disassembly of the machine or a field period.
• Damage requiring re-fabrication of a coil. (But damage requiring re-work in accessible areas, e.g. cooling tubes and leads, is covered.)
• Damage requiring major disassembly and reassembly of a field period. (But disassembly / reassembly of individual joints during assembly is covered.)
• Failure of a key component or system during integrated system testing.
• Large islands detected during e-beam mapping requiring extensive troubleshooting and remediation.
8

Risk Identification
• Collective effort by key members of NCSX Project Team, coordinated by NCSX Integration Manager and System Engineering Support Manager
• Risks identified by groupings:– Management and Organizational Risks– General Assembly Risks– Technical Risks, subdivided by Assembly Station– Start-up Risks– Technical Risks – components and systems
9

Risk Assessment
• Qualitative Risk Ranking based on assessments of likelihood of occurrence and estimated impacts or consequences
• Current Number of Risks– 2 High Risks– 16 Moderate Risks– 62 Low Risks
10

Likelihood of Risk Occurrence
Classification Probability of Occurrence
Very Likely (VL) P≥ 80%
Likely (L) 80%< P ≥ 40%
Unlikely (U) 40% < P ≥ 10%
Very Unlikely (VU) 10% < P ≥ 1%
Not Credible (NC) P < 1%
11

Risk Consequences
Impacts Negligible Marginal Significant Critical Crisis
Technical No impact of performance
Minor degradation
of performance
Moderate degradation
of performance
Moderate degradation
of performance
Desired performance in
doubt
Cost < $100K ≥$100K ≥$500K ≥$1M ≥$5M
Schedule <0.5 Months ≥0.5 Months ≥1 Months ≥3 Months≥ 6 Months
and will impact CD-4
12

Risk Ranking Matrix
Negligible Marginal Significant Critical Crisis
Very Likely Low Moderate High High High
Likely Low Moderate Moderate High High
Unlikely Low Low Moderate Moderate High
Very Unlikely Low Low Low Moderate High
Non Credible Low Low Low Low Low
13

Risk Mitigation
• Mitigation strategies identified for all risks, to extent feasible and practical
• Risk mitigation activities included in Cost Estimates and Resource Loaded Schedule
• Schedule logic adjusted as appropriate to accomplish mitigation (e.g., accelerated design activities)
• Risk mitigation status tracked regularly and updated status reported periodically
14

High RisksRisk No.
Affected Jobs
Description Mitigation PlanAssy-2 1815 Station 5: cost and schedule grows
when Assembly Sequence Plan fully matures
Expedite Component Designs and Assembly Sequence PlanJobs 1354, 1501, 1601, 8203
Assy-3 7503 Station 6: cost and schedule grows when Assembly Sequence Plan fully matures
Expedite Component Designs, Plant Layout, and Assembly Sequence PlanJobs 1701, 1702, 1803, 8215
15

Quantitative Analysis
• Estimates made of risk impacts – increased costs and critical path extensions
• Risk likelihood and impacts used in probabilistic risk analysis model and results incorporated into contingency analysis and estimates
16
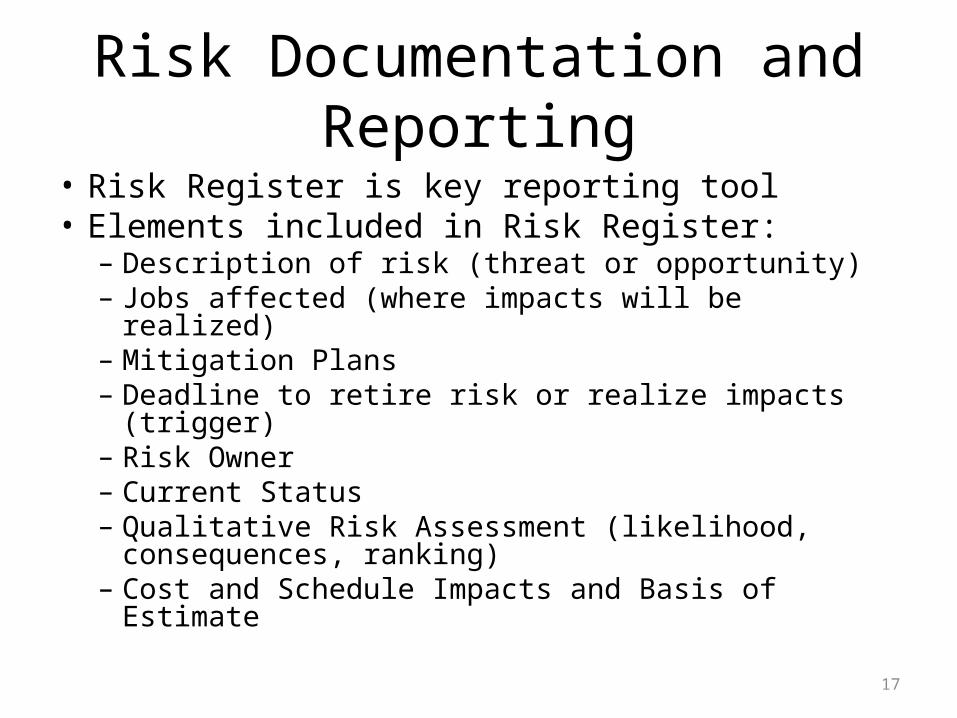
Risk Documentation and Reporting• Risk Register is key reporting tool• Elements included in Risk Register:
– Description of risk (threat or opportunity)– Jobs affected (where impacts will be realized)– Mitigation Plans– Deadline to retire risk or realize impacts (trigger)– Risk Owner– Current Status– Qualitative Risk Assessment (likelihood,
consequences, ranking)– Cost and Schedule Impacts and Basis of Estimate
17

Contingency Analysis
18
Probabilistic Contingency Analysis Model (Crystal Ball®)

Estimate Uncertainty
• Inherent uncertainty in cost and schedule estimates based on– Design Maturity– Design Complexity
• Evaluated for all job estimates (WAFs)– Estimated Costs– Critical Path Schedule Activities
• Includes factor for overall process errors and omissions (ranged from -1% to +3%)
19

Design Maturity
High
Final design available. All design features/requirements well known. No further design development or evolution expected that will impact estimate
Medium
Preliminary design available. Some additional design evolution likely. Further developments can be somewhat expected or anticipated and reflected in estimate
Low
No better than conceptual design basis currently available. Design details, procedures, etc. still need much development and evolution of requirements beyond estimate basis is likely and expected
20

Design Complexity
Low
Work is fairly well understood -- either standard construction or repetition of activities performed in past. Little likelihood of estimate not being well understood and requirements not being well defined
Medium
More complex work requirements that have potential to impact cost and schedule estimates. Limited experience performing similar tasks, so ability to estimate accurately is somewhat suspect
High
Extremely challenging tasks and/or requirements. Unique or first-of-a-kind assembly or work tasks. No good basis for estimating work exists so there is a high degree of estimate uncertainty
21
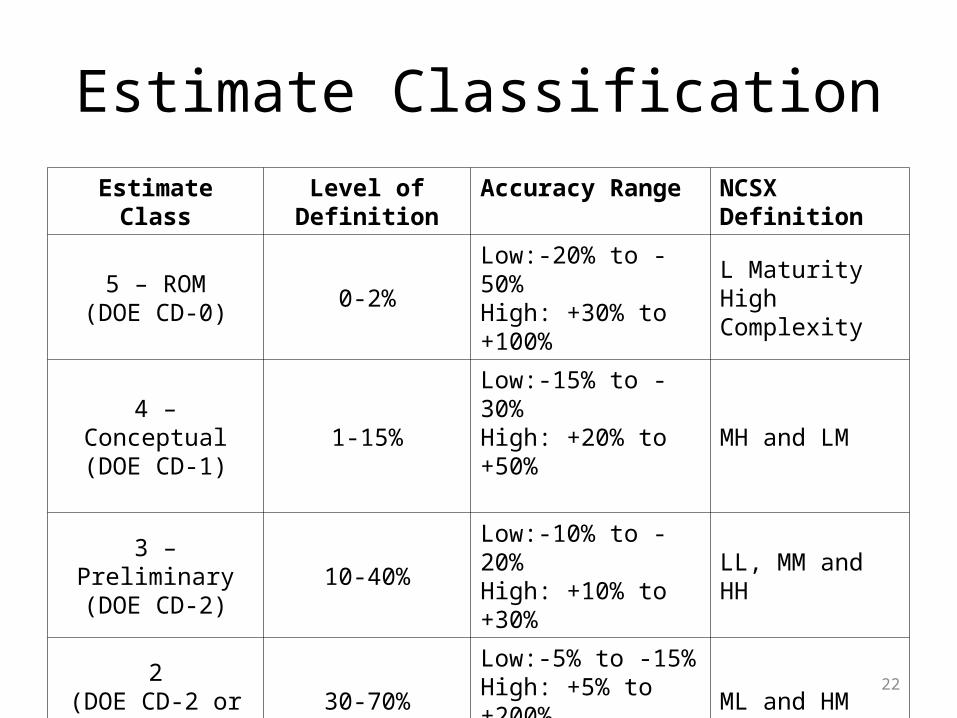
Estimate ClassificationEstimate Class Level of Definition Accuracy Range NCSX Definition
5 – ROM(DOE CD-0) 0-2% Low:-20% to -50%
High: +30% to +100%L MaturityHigh Complexity
4 – Conceptual(DOE CD-1) 1-15%
Low:-15% to -30%High: +20% to +50% MH and LM
3 – Preliminary(DOE CD-2) 10-40% Low:-10% to -20%
High: +10% to +30% LL, MM and HH
2(DOE CD-2 or 3) 30-70%
Low:-5% to -15%High: +5% to +200% ML and HM
1 – Definitive(DOE CD-3) 50-100%
Low:-3% to -10%High: +3% to +15% H Maturity
L Complexity
22

NCSX Estimate Ranges
23

Risk Analysis
• Probability of Occurrence used to determine if events occur or risks/opportunities realized
• When simulation determines a risk will occur, uses Estimated Cost and Schedule (Critical Path) Impacts
24
Category Uniform Probability Distribution Range
Non-Credible 0 to 0.01
Very Unlikely 0.01 to 0.1
Unlikely 0.1 to 0.4
Likely 0.4 to 0.8
Very Likely 0.8 to 1.0

Schedule Impact Mitigation
• Model assumes 2nd shift operations when possible and needed (if simulation determines schedule needs to be extended)
• Schedule Contingency results reduced by assuming work on Saturdays
• Mitigation Costs added to contingency requirements– 2nd Shift and Saturdays Oversight and Support
differential
25

Costs of Schedule Extension
26
JOB Description Cost/yr Cost/mo.
1802/1810/7401/7501Field Period Assy & Machine assy(average of 2 assembly ops) 2376 198
1901 Stellarator core management 504 428101 PPPL Management 912 768102 ORNL Management 312 268202 Engineering mgt 792 668203 Design Integration 660 558204 Systems Analysis 132 118205 Dimensional control 60 58215 Plant Design 60 58998 Allocations 492 41
Total ($k/month) 525

NCSX Critical Path
27
Schedule Activity
Base Duration (mos) on
Critical Path
CP (within 1/2 month of CP) start finishJob -1810 Field Period Assembly Stations 1,2,3
Station 2 MC Sub-assy A1/B1/C1 2/1/2008 11/18/2008 9.6Station 2 MC Sub-assy A3/B3/C3 11/18/2008 4/13/2009 4.8Station 2 MC Sub-assy A6/B6/C6 4/13/2009 11/3/2009 6.7Station 3 Assemble Mod Coils and VVSA FP#3 11/3/2009 3/24/2010 4.6
Job - 1815 Field Period Assembly Station 5 Station 5 Final Assembly FP#3 3/24/2010 8/11/2010 4.6Job 7503 Final Machine Assembly (Station 6) 8/11/2010 11/11/2011 15.0Job 8501 - Integrated System Testing 11/11/2011 12/13/2011 1.1
46.4

Contingency Analysis Results
28
90% Confidence 80% ConfidenceBase Schedule 46.4 months 46.4 months
Schedule Uncertainty Contingency 8.1 6.5Risk Schedule Contingency 11.3 10.0
Total Schedule Contingency (90%) 19.4 months 16.5 months
Base ETC 61,647 61,647
Contingency (Std Uncertainty) 9,140 15% 8,360 14%Cost of Schedule Uncertainty Contingency 4,260 7% 3,410 6%Cost of Schedule Mitigation (incl. 2nd Shift & Saturdays) 260 0% 230 0%
Total Uncertainty Contingency 13,660 22% 12,000 19%
Risk Cost Contingency (from Risk Model) 2,880 5% 2,630 4%Risk Schedule Contingency (cost of stretch) 7,130 12% 5,240 9%
Total Risk Contingency 10,010 16% 7,870 13%
Total Cost Contingency 23,670 38% 19,870 32%
ETC with Contingency 85,317 81,517

Contingency by Year
• Spread cost contingency based on schedule for jobs that contribute to most uncertainty and based on jobs where most risk impacts will be realized (used sensitivity analysis)
• Assigned all cost associated with schedule contingency to 2012
• Slightly more conservative (i.e., front loaded) than analysis indicates as appropriate
29

Proposed Spread of Contingency
30
$M $M
90% 80%
2008 10% 2.37 10% 1.992009 15% 3.55 15% 2.982010 15% 3.55 15% 2.982011 15% 3.55 15% 2.982012 45% 10.65 45% 8.94
Total 23.67 19.87
Contingency Spread by Year

Concluding Observations
• NCSX Project Team now “gets it” – really focused on identifying, mitigating and managing risks
• Contingency requirements derived from analysis of both estimate uncertainties and impacts of identified risks
• Probably need some guidance from DOE (OFES and Lehman) as to desired confidence level (80% or 90%) – recent projects use both
31