network dynamics and cell physiology john j. tyson dept. biological sciences virginia tech
TRANSCRIPT

Network Dynamics andNetwork Dynamics andCell PhysiologyCell Physiology
John J. Tyson John J. Tyson
Dept. Biological Sciences Dept. Biological Sciences
Virginia TechVirginia Tech

Budapest Univ. Techn. & Econ.Budapest Univ. Techn. & Econ.
Bela NovakBela Novak
Attila Csikasz-NagyAttila Csikasz-Nagy
Andrea CilibertoAndrea Ciliberto
Virginia TechVirginia Tech
Kathy ChenKathy Chen
Dorjsuren BattogtokhDorjsuren Battogtokh
CollaboratorsCollaborators
FundingFunding
James S. McDonnell FoundationJames S. McDonnell Foundation
DARPADARPA

Computational Molecular BiologyComputational Molecular Biology
DNA
mRNA
Protein
Enzyme
Reaction Network
Cell Physiology
…TACCCGATGGCGAAATGC...
…AUGGGCUACCGCUUUACG...
…Met -Gly -Tyr -Arg -Phe -Thr...
ATP ADP
-P
X Y ZE1
E2
E3E4
Last Step

S
G1
DNAreplication
G2Mmitosis
cell division
The cell cycle is thesequence of events wherebya growing cell replicates allits components and dividesthem more-or-less evenly
between two daughter cells...

Cdk1
S
G1
DNAreplication
G2Mmitosis
cell division
CycB
P P
Cyclin-dependentkinase
Cyclin B

P
Cdc25
Wee1
Wee1P
Cdc25
CycB
PCdc20
Cdc20
Cdh1
CK
I
CycB
CycBCK
I
CK
I
CycA
CycA
APC-PAPCTFBI
TFBA
CycE
CycD
TFEA
TFEI
Cyc E,A,B
CycE
TFIA
TFII
Cdc20
CK
I
CycE
Cdc14
Cdc14
Cdc14
CycA
CycA
CycB
CycD
Cdh1CycD
Coupled Intra-cellular Networks !

R
S
0
0.5
0 1 2 3
res
po
ns
e (
R)
signal (S)
linear
0
5
0 0.5 1
S=1
R
rate
(d
R/d
t)
rate of degradation
rate of synthesis
S=2
S=3
Gene Expression
Signal-ResponseCurve
1 2
d,
d
Rk S k R
t 1
ss2
k SR
k

R
Kinase
RP
ATP ADP
H2OPi
Protein Phosphorylation
0
1
2
0 0.5 1
RP
rate
(d
RP
/dt)
0.25
0.5
1
1.5
2
Phosphatase 0
0.5
1
0 1 2 3
res
po
ns
e (
RP
)
Signal (Kinase)
“Buzzer”
Goldbeter & Koshland, 1981
1 R 0

R
S
EP E0
0.1
0.2
0.3
0.4
0.5
0.6
0 0.5R
rate
(d
R/d
t) S=0
S=8
S=16
0
0.5
0 10
res
po
ns
e (
R)
signal (S)
Protein Synthesis:Positive Feedback
“Fuse”Bistability
Closed
Open
Griffith, 1968

Example: Fuse
0
0.5
0 10
resp
on
se (
R)
signal (S)
dying
Apoptosis(Programmed Cell Death)
living

R
S
EP E0
0.05
0.1
0 0.5 1 1.5
0
0.5
1
0 1 2R
rate
(d
R/d
t)
res
po
ns
e (
R)
signal (S)
S=0.6
S=1.2
S=1.8
SN
SN
Protein Degradation:Mutual Inhibition
“Toggle”Bistability

R
S
EP E
X
0 50
1
X
R
Positive Feedback & Substrate Depletion
positive
substrate
0.0 0.5
0
1
signal (S)
Hopf Hopf
res
po
ns
e (
R)
“Blinker”
Glycolytic Oscillations
Oscillation
sss
sssuss
Higgins, 1965; Selkov, 1968

S
X
Y YP
R RP
0
5
0 25 50
0
0.5
1
0 2 4 6
0.0
0.1
0.2
0.3
0.4
0.5
time
XYP
RP
res
po
ns
e (
RP
)
signal (S)
HopfHopf
Negative Feedback Loop
Goodwin, 1965
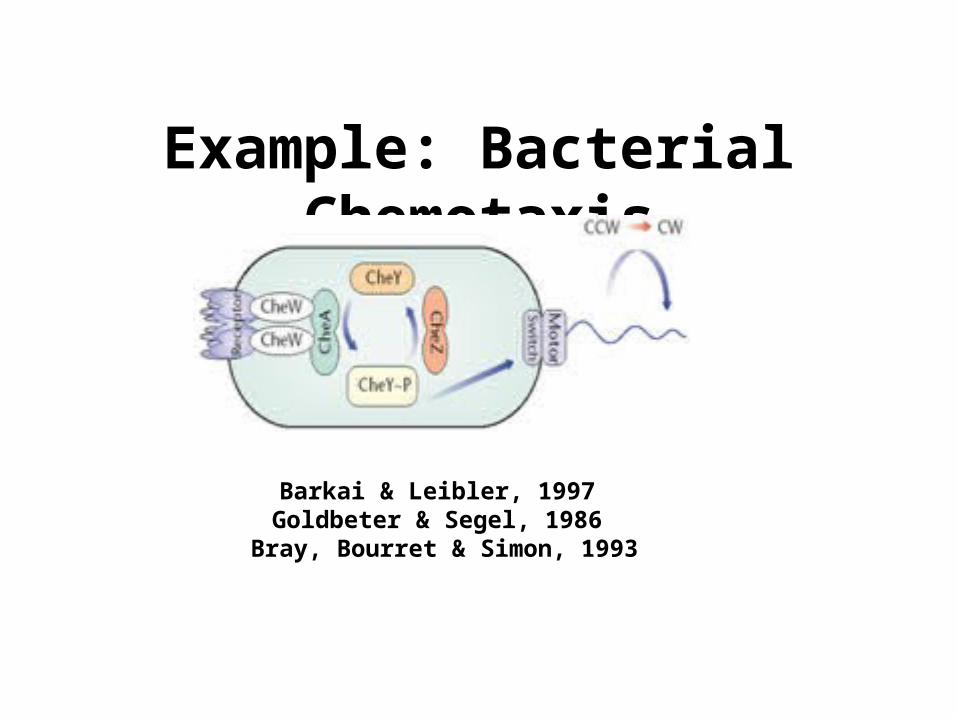
Example: Bacterial Chemotaxis
Barkai & Leibler, 1997 Goldbeter & Segel, 1986
Bray, Bourret & Simon, 1993

R
S X
0
5
0 1 2R
rate
(d
R/d
t)
S=1
S=3
S=2
0.9
1.4
1.9
0 10 20
-1
0
1
2
3
4
5
S
X
R
time
Sniffer
Response isindependent
of Signal
1 2
3 4
d
dd
d
Rk S k XR
tX
k S k Xt
(Levchenko & Iglesias, 2002)

primed RC
fired RC primed MEN
fired MEN
Cdk1
CycB
high MPF
low MPF
high SPF
low SPF
Cdk2
CycA
Example 2: Cell Cycle
(Csikasz-Nagy& Novak, 2005)

LA
Response = F
L
Signal = CDK
Cock-and-Fire
LAL
+
Cdk2
CycA
F+

Signal = MPF
Response = BA
TA T
TABAB
+
+
Cdk1
CycB
Cock-and-Fire-2

P Wee1
Wee1P
Cdc25
CycB
PCdc20
Cdc20
Cdh1
CK
I
CycB
CycBCK
I
CK
I
CycA
CycA
APC-PAPCTFBI
TFBA
CycE
CycD
TFEA
TFEI
Cyc E,A,B
CycE
TFIA
TFII
Cdc20
CK
I
CycE
Cdc14
Cdc14
Cdc14
CycA
CycA
CycB
CycD
Cdh1CycD
bistable switch
bistable switch
bistable switch
oscillator
oscillator
Cdc25

P
Cdc25
Wee1
Wee1P
Cdc25
CycB
PCdc20
Cdc20
Cdh1
CK
I
CycB
CycBCK
I
CK
I
CycA
CycA
APC-PAPCTFBI
TFBA
CycE
CycD
TFEA
TFEI
Cyc E,A,B
CycE
TFIA
TFII
Cdc20
CK
I
CycE
Cdc14
Cdc14
Cdc14
CycA
CycA
CycB
CycD
Cdh1CycD
mass/ DNA
0.0 0.5 1.0 1.5
Cdc2
/Cdc1
3
10-5
10-4
10-3
10-2
10-1
100
G1
Mmass/ DNA
0 1 2
Cdc2
/Cdc1
3
10-3
10-2
10-1
100
S/G2
M
mass/nucleus
mass/ DNA
0.0 0.5 1.0 1.5 2.0
Cdc2
/Cdc1
3
0.1
1
M
Fission Yeast

0 1 2 3 4 5
0
0.4
0.8
3.0
mass/nucleus
Cd
k1:C
ycB
G1S/G2
MWild type
SNIPER

Genetic control of cell size at cell division in yeastPaul NurseDepartment of Zoology, West Mains Road, Edinburgh EH9 3JT, UK
Nature, Vol, 256, No. 5518, pp. 547-551, August 14, 1975
wild-type wee1

P
Cdc25
Wee1
Wee1P
Cdc25
CycB
PCdc20
Cdc20
Cdh1
CK
I
CycB
CycBCK
I
CK
I
CycA
CycA
APC-PAPCTFBI
TFBA
CycE
CycD
TFEA
TFEI
Cyc E,A,B
CycE
TFIA
TFII
Cdc20
CK
I
CycE
Cdc14
Cdc14
Cdc14
CycA
CycA
CycB
CycD
Cdh1CycD

wee1
mass/nucleus
Cd
k1:C
ycB
0 1 2 3 4 5
0
0.4
0.8
1.2
G1
S/G2
M
wee1wee1 cells are about one-half the size of wild type cells are about one-half the size of wild type

0 1 2 3 4 5 60.0
0.2
0.4
0.6
0.8
1.0
cell mass (au.)
Wee
1 ac
tivity
wild-type
wee1-
0 0 50 100 150 200 250 300 350 400 450 500 550
30 60
90
120
150
180
210
240
270 300
period(min)
PHYSIOLOGY
GENETICS
Two-parameter Bifurcation Diagram
SNIPER

P
Cdc25
Wee1
Wee1P
CycB
PCdc20
Cdc20
Cdh1
CK
I
CycB
CycBCK
I
CK
I
CycA
CycA
APC-PAPCTFBI
TFBA
CycE
CycD
TFEA
TFEI
Cyc E,A,B
CycE
TFIA
TFII
Cdc20
CK
I
CycE
Cdc14
Cdc14
Cdc14
CycA
CycA
CycB
CycD
Cdh1CycD
Cdc25

mass/nucleus
Cd
k1:C
ycB
G1S/G2
M
0 1 2 3 4 5
0
0.4
0.8
3.0 cki
The Start module is not required during mitotic cyclesThe Start module is not required during mitotic cycles

P
Cdc25
Wee1
Wee1P
Cdc25
CycB
PCdc20
Cdc20
Cdh1
CK
I
CycBCK
I
CK
I
CycA
CycA
APC-PAPCTFBI
TFBA
CycE
CycD
TFEA
TFEI
Cyc E,A,B
CycE
TFIA
TFII
Cdc20
CK
I
CycE
Cdc14
Cdc14
Cdc14
CycA
CycA
CycB
CycD
Cdh1CycD
CycB

0
0.4
0.8
2.0
0 1 2 3 4 5
G1
S/G2
M
cki wee1ts1st
2nd
3rd
4th
mass/nucleus
Cd
k1:C
ycB
Cells become progressively smaller without size controlCells become progressively smaller without size control

P
Cdc25
Wee1
Wee1P
Cdc25
CycB
PCdc20
Cdc20
Cdh1
CK
I
CycB
CycBCK
I
CK
I
CycA
CycA
APC-PAPCTFBI
TFBA
CycE
CycD
TFEA
TFEI
Cyc E,A,B
CycE
TFIA
TFII
Cdc20
CK
I
CycE
Cdc14
Cdc14
Cdc14
CycA
CycA
CycB
CycD
Cdh1CycD

endoreplication
0 1 2 3 4
0.0001
0.001
0.01
0.1
1
Act
Cyc
A
cdc13
Fission yeast
0 1 2 3 4 5 6
0.000
0.005
0.010
0.015
0.020
0.025
0.030
2 param bifn diag for Cdc13
mitoticcycles
endoreplication
S
G2G1
M
mitotic cycle
mass
Pro
duc
tion
of
Cdc
13
XNo production of cyclin B (Cdc13)
Wild type
cdc13
cdc13 +/??

The Dynamical PerspectiveThe Dynamical Perspective
Molecular MechanismMolecular Mechanism
??
??
??
Physiological PropertiesPhysiological Properties

The Dynamical PerspectiveThe Dynamical Perspective
Molecular MechanismMolecular Mechanism
Kinetic EquationsKinetic Equations
Vector FieldVector Field
Stable AttractorsStable Attractors
Physiological PropertiesPhysiological Properties
d CycBT
dt = k1 . M - (k2' + k2" . Ste9 +k2'" . Slp1A) . CycBT
dSte9
dt = k3' .
1 - Ste9J3 + 1 - Ste9 - (k4'
. SK + k4 . CycB) .
Ste9J4 + Ste9
d Rum1T
dt = k11 - (k12 + k12' . SK + k12" . CycB) . RUM1T
dSlp1A
dt = k7 . IE .
Slp1T - Slp1A
J7 + Slp1T - Slp1A - k8
. Slp1A
J8 + Slp1A - k6
. Slp1A
dMdt = . M

References
• Tyson, Chen & Novak, “Network dynamics and cell physiology,” Nature Rev. Molec. Cell Biol. 2:908 (2001).
• Tyson, Csikasz-Nagy & Novak, “The dynamics of cell cycle regulation,” BioEssays 24:1095 (2002).
• Tyson, Chen & Novak, “Sniffers, buzzers, toggles and blinkers,” Curr. Opin. Cell Biol. 15:221 (2003).