neural mechanisms of speed perception: transparent motion · neural mechanisms of speed perception:...
TRANSCRIPT

Neural mechanisms of speed perception: transparent motion
Bart Krekelberg1 and Richard J. A. van Wezel2,3
1Center for Molecular and Behavioral Neuroscience, Rutgers University, Newark, New Jersey; 2Biomedical Signals andSystems, MIRA, Twente University, Enschede, The Netherlands; and 3Department of Biophysics, Donders Institute for Brain,Cognition and Behaviour, Radboud University, Nijmegen, The Netherlands
Submitted 8 May 2013; accepted in final form 1 August 2013
Krekelberg B, van Wezel RJ. Neural mechanisms of speedperception: transparent motion. J Neurophysiol 110: 2007–2018,2013. First published August 7, 2013; doi:10.1152/jn.00333.2013.—Visual motion on the macaque retina is processed by direction- andspeed-selective neurons in extrastriate middle temporal cortex (MT).There is strong evidence for a link between the activity of theseneurons and direction perception. However, there is conflicting evi-dence for a link between speed selectivity of MT neurons and speedperception. Here we study this relationship by using a strong percep-tual illusion in speed perception: when two transparently superim-posed dot patterns move in opposite directions, their apparent speed ismuch larger than the perceived speed of a single pattern moving atthat physical speed. Moreover, the sensitivity for speed discriminationis reduced for such bidirectional patterns. We first confirmed thesebehavioral findings in human subjects and extended them to a monkeysubject. Second, we determined speed tuning curves of MT neurons tobidirectional motion and compared these to speed tuning curves forunidirectional motion. Consistent with previous reports, the responseto bidirectional motion was often reduced compared with unidirec-tional motion at the preferred speed. In addition, we found that tuningcurves for bidirectional motion were shifted to lower preferred speeds.As a consequence, bidirectional motion of some speeds typicallyevoked larger responses than unidirectional motion. Third, we showedthat these changes in neural responses could explain changes in speedperception with a simple labeled line decoder. These data provide newinsight into the encoding of transparent motion patterns and providesupport for the hypothesis that MT activity can be decoded for speedperception with a labeled line model.
motion perception; speed coding; macaque monkey; middle temporalarea; labeled line
VISUAL MOTION PATTERNS strongly activate neurons in striate andextrastriate cortex both in macaques and humans. Single-cellrecordings in macaques have shown that neurons in the middletemporal cortex (MT) are not only highly responsive to motionbut also strongly tuned for motion direction and speed, andthere is compelling evidence that perceived direction can bedecoded from neural activity in MT based on a labeled linemodel (for review, see Born and Bradley 2005; Parker andNewsome 1998). In this decoding model each neuron repre-sents a certain direction of motion (its label, identified by itspreferred direction) and spikes from the neuron representevidence in favor of that direction of motion.
There is direct evidence that area MT is also involved inspeed perception. Lesions in area MT lead to impairments inspeed perception (Orban et al. 1995; Pasternak and Merigan1994), trial-to-trial variations in MT responses are related to
speed perception (Liu and Newsome 2005), and microstimu-lation of groups of neurons that prefer high speeds changesspeed perception (Liu and Newsome 2005). Further evidencecomes from the use of visual illusions that decrease or increasethe perceived speed of moving patterns. The behavioral effecton perceived speed of the step size in apparent motion(Churchland and Lisberger 2001), the contrast of movingsinusoidal gratings (Priebe 2004), motion adaptation (Krekel-berg et al. 2006a), acceleration (Schlack et al. 2007, 2008), aswell as stimulus size (Boyraz and Treue 2011) can all be linkedto firing rate changes in area MT via labeled line models.
Nevertheless, the link between speed-related firing ratechanges in area MT and perceived speed is not as clear-cut asfor perceived direction. The sensitivity of MT neurons forspeed is typically less than the sensitivity of the whole animal,and microstimulation effects on speed judgments are not asprominent as in direction discrimination tasks (Liu and New-some 2005). In addition, there appears to be an asymmetry inthe relationship between neural and behavioral responses thatdepends on the relationship between the stimulus and the speedpreference of the (group of) cells under study. Whereas stimuliwith speeds on the ascending flank of the tuning curve showthe expected influence of trial-to-trial variability and micro-stimulation, this association is much weaker (and statisticallynonsignificant) for stimuli on the descending flank (Liu andNewsome 2005). Such an asymmetry would not be expected ina labeled line model. Moreover, earlier studies have shown anunexpected monotonic relationship between microstimulationcurrent and perceived speed as measured by oculomotor re-sponse (Groh et al. 1997). Finally, we have previously reportedevidence against the labeled line model based on a visualillusion that leads to misperceptions in speed (Krekelberg et al.2006b). Notably, when the luminance contrast of movingrandom dot patterns is reduced, the subjective speed perceptdecreases dramatically, but the speed tuning of MT neuronsshifts in a direction that is opposite to that predicted by thelabeled line model.
While there can be little doubt that area MT plays some rolein speed perception, we believe that a better understanding ofthese discrepancies between changes in MT activity, the la-beled line model, and speed perception can provide importantinsight into the relation between neural activity and behavior.To further constrain this relationship, we investigated therepresentation of the speed of transparent motion in area MT.When two patterns move transparently in opposite directions,perceived visual speed increases dramatically (up to 50%)compared with the perceived speed of the individual compo-nents (De Bruyn and Orban 1999). Such a large perceptualeffect should have a clear neural signature.
Address for reprint requests and other correspondence: B. Krekelberg,CMBN, Rutgers Univ., 197 University Ave., Newark, NJ 07102 (e-mail: [email protected]).
J Neurophysiol 110: 2007–2018, 2013.First published August 7, 2013; doi:10.1152/jn.00333.2013.
20070022-3077/13 Copyright © 2013 the American Physiological Societywww.jn.org

In our study we first confirmed the behavioral findings byshowing a large overestimation of the speed of bidirectionalmotion patterns in both humans and the macaque monkey.Subsequently, we recorded neural responses to bidirectionalpatterns and their unidirectional components at differentspeeds. Finally, we performed a quantitative analysis of therelationship between these responses and behavioral measuresof sensitivity and bias in speed perception. Our findings pro-vide clear support for the hypothesis that speed perception islinked to neural activity in area MT via a labeled line decodermodel.
MATERIALS AND METHODS
Subjects
Two adult male rhesus monkeys (Macaca mulatta; monkeys M andS) were used in the electrophysiological experiments. Monkey Mperformed the behavioral experiments. Experimental and surgicalprotocols were in accordance with the National Institutes of Health(NIH)’s guidelines for humane care and use of laboratory animals andwere approved by the local animal use committee.
Five naive human subjects and one author participated in thehuman psychophysical experiments. All human subject procedureswere in accordance with international standards (Declaration of Hel-sinki) and NIH guidelines and were approved by the institutionalreview board, and participants gave their informed, written consent.All subjects had normal or corrected-to-normal visual acuity.
Visual Stimulation
All visual stimuli were generated with in-house OpenGL softwareusing a high-resolution graphics display controller (Quadro ProGraphics card, 1,024 � 768 pixels, 8 bits/pixel). In the experimentswith monkey subjects, stimuli were displayed on a 21-in. monitor
(Sony GDM-2000TC; 75 Hz, noninterlaced; 1,024 � 768 pixels); inthe experiments with human subjects we used a 19-in. Sony TrinitronE500 monitor (75 Hz, noninterlaced, 1,024 � 768 pixels). The outputof the video monitor was measured with a PR650 photometer (PhotoResearch, Chatsworth, CA), and the voltage/luminance relationshipwas linearized independently for each of the three guns in the CRT.Stimuli were viewed from a distance of 57 cm in a dark room (�0.5cd/m2).
Monkeys were seated in a standard primate chair (Crist Instru-ments, Germantown, MD) with the head post rigidly supported by thechair frame. Eye position was sampled at 60 Hz with an infraredvideo-based system (IScan, Burlington, MA), and the eye positiondata were monitored and recorded with the CORTEX program (Lab-oratory of Neuropsychology, National Institute of Mental Health;http://dally.nimh.nih.gov/), which was also used to implement thebehavioral paradigm and to control stimulus presentation.
Stimuli and Experimental Paradigms
We used random dot patterns consisting of 100 dots moving withina 10°-diameter circular aperture. The lifetime of the dots was infinite,and they were randomly repositioned after leaving the aperture. Dotswere 0.15° in diameter and had a luminance of 30 cd/m2. The graybackground was 5 cd/m2. In the physiological experiments, thedirection of motion was adjusted to match the axis of neuronalpreferred direction rounded to the nearest multiple of 45°.
Psychophysical paradigm. Figure 1A shows the paradigm we usedto investigate how transparent, bidirectional motion affected per-ceived speed in humans. Subjects fixated a small red dot at the centerof the screen. Two patches of dots appeared 10° left and right offixation. The subject’s task was to determine which of the two patchescontained the dots with the fastest speed.
In one patch (the reference), either all the dots moved rightward[“unidirectional condition” (uni)] or half of the dots moved rightwardand the other half moved leftward (bi). The speed of all dots in thereference was the same but varied across conditions (1, 2, 5, 10, 20,
A Psychophysics Response
Bi-BiBi-Uni
B Physiology
FixationFixation
sm 005
Uni-Uni
or
Tim
e
Fig. 1. Experimental paradigms. A: sequence of events in the paradigm used for the behavioral experiments. Subjects fixated a red dot, and 2 patterns appearedfor 500 ms. In the human behavioral experiments there were 2 conditions. In the first condition a bidirectional motion pattern (2 dot patterns transparently movingin opposite directions) and a unidirectional motion pattern were shown (bi-uni). In the second condition 2 unidirectional motion patterns were shown (uni-uni).In the monkey experiments there was a third condition in which 2 bidirectional motion patterns were shown (bi-bi). In the monkey experiments the bi-unicondition was only shown for a small subset of trials and rewarded randomly. Subjects were instructed to indicate the pattern that moved fastest by a key press(human) or an eye movement to 1 of 2 targets (monkey). B: in the physiological experiments 1 pattern was presented in the receptive field (indicated by dashedline). The only behavioral requirement for the monkey was to fixate the red spot for the duration of the trial.
2008 SPEED PERCEPTION IN MT
J Neurophysiol • doi:10.1152/jn.00333.2013 • www.jn.org

40°/s). In the other patch (the test), all dots moved rightward and theirspeed was slower or faster than the reference speed by 0%, 10%, 40%,or 80%. Human subjects performed the speed discrimination taskcomparing unidirectional tests and reference (uni-uni) or a bidirec-tional reference and a unidirectional test (bi-uni). The 84 test condi-tions (uni-uni/bi-uni � 6 reference speeds � 7 test speeds) wererandomly interleaved.
After the 500-ms stimulus presentation, the dot patterns wereextinguished and subjects answered the question “Which patternmoved faster?” by pressing one of two keys on the keyboard. Thehuman subjects received no feedback on their performance, and thenext trial started immediately after the subjects’ response. The posi-tions of test and reference stimuli were varied randomly across trials.Each comparison of reference speed and test speed was repeated 20times.
For monkey M we maintained the identical layout and stimuli, butthe animal reported which patch moved faster by making an eyemovement toward one of two small green dots that appeared 10° leftor right of fixation once the moving stimuli were extinguished.
In most trials, the monkey compared a unidirectional reference toa unidirectional test (uni-uni) or a bidirectional reference to a bidi-rectional test (bi-bi). Because any illusory speed percept would affectboth test and reference equally, we rewarded the animal for veridicalperformance on these trials. On a small subset of trials, the animalcompared a bidirectional reference with a unidirectional test of thesame physical speed (bi-uni). We expected a potentially large illusorychange in perceived speed; hence on these trials we rewarded theanimal on 60% of trials, independent of the animal’s response on thattrial. In our experience, including a large number of randomly re-warded conditions typically leads to random behavior; hence welimited the uni-bi conditions to the comparison of two physicallyequal speeds (and therefore did not measure the full psychometriccurve in this condition). The data reported here (�16,000 trials) wererecorded across 13 days immediately after training on uni-uni andbi-bi comparisons for several weeks.
Electrophysiological paradigm. We recorded the activity of singleunits in area MT with tungsten microelectrodes (FHC, 3–5 M�) intwo monkeys. Neurophysiological signals were filtered, sorted, andstored with the Plexon system (Plexon). We identified area MTphysiologically by its characteristically high proportion of cells withdirectionally selective responses, receptive fields (RFs) that weresmall relative to those of neighboring area MST, and its location onthe posterior bank of the superior temporal sulcus. The typicalrecording depth agreed well with the expected anatomical location ofMT determined from structural MR scans. For more details, seeHartmann et al. (2011) and Richert et al. (2013).
We used automated methods to determine cells’ directional selec-tivity and RF location (Krekelberg and Albright 2005). The approx-imate RF center and the preferred direction of motion revealed bythese methods were used to optimize stimuli for subsequent neuronalresponse measurements (i.e., we used the preferred direction asestimated by this method rounded to the nearest 45° to align thedirection of dot motion with the preferred-antipreferred axis and thelocation of the coarsely mapped RF to place the dot pattern on itscenter).
In the main paradigm, we measured speed tuning curves of MTcells, using random dot patterns that appeared 250 ms after themonkey started fixating a central red dot and were extinguished 500ms later. The range of speeds was 1, 2, 4, 8, 16, 32, and 64°/s, and foreach cell we measured the speed tuning curve with unidirectionalpatterns moving in the preferred direction (uni-pref), unidirectionalpatterns moving in the antipreferred direction (uni-anti), and bidirec-tional patterns in which half of the dots moved in the preferred andhalf of the dots moved in the antipreferred direction (bi). In thebidirectional condition the speed of all dots was always equal.
All conditions were randomly interleaved. Trials in which eyeposition deviated from a 2°-wide square window centered on the
fixation spot were aborted and excluded from analysis. Unless cellisolation was lost prematurely, each condition was repeated 15 times.
Data Analysis
Psychophysical data. Separately for each combination of referenceand test stimulus, we calculated the percentage of trials in whichsubjects responded that the test stimulus was faster. Using the psignifitMATLAB toolbox (Wichmann and Hill 2001a), we fit these data withcumulative Gaussians and obtained an estimate of the point of sub-jective equality (PSE), defined as the speed where the fitted curvecrossed 50% “test faster,” as well as the sensitivity, defined as theslope of the psychometric curve at the PSE. The Monte Carlosimulations of the pfcmp function in the psignifit toolbox were used todetermine whether two psychometric functions (e.g., corresponding todifferent motion patterns) were significantly different (Wichmann andHill 2001b).
To estimate the monkey’s PSE for uni-bi comparisons based onlyon the comparison of physically matched uni- and bidirectionalspeeds, we determined his psychometric curve based jointly on thetrials of the uni-uni and bi-bi comparisons and then determined byhow much this curve would have to be shifted to explain the perfor-mance on the single uni-bi comparison. In other words, for thisballpark estimate we assumed that the animal’s psychometric curve inthe uni-bi trials was shifted but that its slope was the same as theaverage slope on the uni-uni and bi-bi comparisons.
Physiological data. Our primary measure of the neural responsewas the spike count in the 500 ms following stimulus onset. Thiswindow was corrected for each neuron’s response latency, which wasdetermined by using a maximum likelihood estimator that assumesPoisson spiking statistics (Friedman and Priebe 1998). (We alsoperformed all analyses with a window starting 200 ms after stimulusonset and ending with stimulus offset; excluding onset transients inthis manner led to highly similar effects and did not change any of ourconclusions).
As has been shown before, speed tuning curves in MT are well-fitby log-Gaussians (Nover et al. 2005). We parameterized the tuningcurves separately for the uni-pref, uni-anti, and bi conditions as r �
� � ��exp��1
2��2�log2�s⁄���2� and used a Bayesian method to
determine the posterior probability distribution of all such log-Gauss-ian tuning functions based on the spike count data of all trials and theassumption of Poisson variability (Cronin et al. 2010). In this equa-tion, the parameter � is referred to as the offset (it reflects the part ofthe response that is not speed tuned), � is the amplitude (it reflects thestrength of the speed tuning), � is a unitless parameter that reflectsthe (scale invariant) tuning width, and � is the preferred speed. TheBayesian fitting procedure calculates the posterior probability distri-bution of all four parameters, which is useful to show the range oftuning curves that are compatible with the data (and the log-Gaussianmodel) (e.g., Fig. 3). For cell-by-cell comparisons (Fig. 4) and thesimulations of Fig. 8, we obtained a point estimate for each of theparameters by taking the median across each of the posterior distri-butions. We refer to this point estimate as the “best fit.”
We compared the log-Gaussian fits with a model in which the spikecount was independent of the speed (i.e., untuned) and denoted a cellas speed tuned if the Bayes factor comparing these two models was atleast 10 for both the uni-pref and bi conditions (i.e., the log-Gaussianmodel was at least 10 times more likely to explain the data than theuntuned model).
In the nonparametric analyses we determined the median firing rateacross trials per cell for each condition. We calculated the directionselectivity index (DSI) on the basis of the median firing rates for thepreferred (P) and antipreferred (A) directions per speed as (P � A)/(P � A). The preferred speed was defined as the unidirectional motionpattern that generated the largest median response. To generatepopulation responses, we normalized the firing rate of each cell by its
2009SPEED PERCEPTION IN MT
J Neurophysiol • doi:10.1152/jn.00333.2013 • www.jn.org

peak response and then determined the median across neurons. Togenerate a preferred-speed aligned population response, we binned theobserved median response across trials as a function of the difference(in octaves) between stimulus speed and preferred speed. In otherwords, we described the median response as a function of �speed �log2(speed) � log2(�) for each cell, binned this in octaves, and thendetermined the median across all neurons for every �speed bin wherewe had at least 25 observations (i.e., neurons).
Power-law summation. In the power-law summation model (Brit-ten and Heuer 1999), the response to a compound stimulus (thebidirectional pattern, rbi) is determined by a nonlinear summation ofthe response to the two components (runi-pref, the unidirectionalpreferred and runi-anti, the unidirectional antipreferred response):
rbi � a � ��runi-pref�g � �runi-anti�g�1g
� b
The gain (a), power (g), and offset (b) are free parameters, which weredetermined (per neuron) with least-squares optimization.
Decoding. We investigated the extent to which a simple labeledline decoding model could relate the neural responses with thebehavioral data. In this model a spike from a neuron is interpreted asa vote in favor of the base-2 logarithm of that neuron’s preferredspeed.
We used the parametric fits of each neuron together with theassumption of Poisson variability to generate simulated populationresponses for each of the displays that occurred in the behavioralparadigm. In other words, for each (simulated) behavioral trial wegenerated the response of the 103 speed-tuned neurons to the teststimulus and the response of the same 103 neurons to the referencestimulus.
Note that this relies on the common assumption that for eachspeed-tuned neuron that we recorded in one hemisphere there exists aneuron with identical properties in the opposite hemisphere (theanti-neuron) and that a perceptual decision is made by comparing theactivity in these two groups of neurons. Note also that, because wemapped speed tuning for each neuron in its preferred and antipreferreddirections only, our sample contained only neurons that respondedmaximally to at least one of the directions of motion in the bidirec-tional pattern. In other words, our decoder used only a slice throughthe two-dimensional space of neurons with all possible preferreddirections and speeds. An optimal decoder, and quite likely the brain,could also use the information provided by neurons whose preferreddirection is not matched to any of the directions in the bidirectionalstimulus, as well as knowledge about the variability and tuning widthof the neurons (Krekelberg et al. 2003; Morris et al. 2013). Given howwell the simple decoder worked (see Fig. 8), and because we recordedspeed tuning only in two directions, we did not pursue such ap-proaches here.
For each neuron, the response was normalized to its peak response(i.e., divided by the response to the neurons’ preferred speed). Thisresulted in two population vectors: t→, the response to the test, and r→,the response to the reference. Each neuron was assigned a label
defined by the 2-base log of its preferred speed ( l→
; see below). Wethen calculated the decoded speed as the inner product of the popu-
lation activity vector and the label vector, normalized by the sum (| t→|
or |r→|) of the population activity:
stest � t→ · l→
⁄ t→ , sreference � r→ · l→
⁄ r→We used this procedure to generate 1,000 synthetic trials for each
of the test speeds, and for each motion type, and then compared thedecoded test and reference speed to answer the same question that thesubjects answered: Was the test faster than the reference (stest sreference)? For each simulated trial this resulted in a binary decision,just like the outcome of a real behavioral trial. To generate psycho-
metric functions we analyzed those binary decisions with proceduresidentical to those used for the actual behavioral data (see above).
In the first decoder, the population vector of speed labels ( l→
) wasdefined as the base-2 log of each neuron’s preferred speed forunidirectional motion. For the second decoder we first used the sameBayesian fitting procedure as described above but now without taking
stimulus type (uni- or bidirectional) into account. The label ( l→
) wasthen defined by the preferred speed that resulted from this procedure.Loosely speaking, one can view this as an average preferred speedacross the uni- and bidirectional patterns. For the third decoder, weused the preferred speed for bidirectional motion as the label.
RESULTS
The results are divided into three parts. First, we documenthow transparent motion affected perceived speed in humansand monkeys. Second, we describe how bidirectional, trans-parent motion influenced responsivity and speed tuning of MTneurons. Third, we present a decoding analysis that links theneural and behavioral data via a labeled line model.
Speed Perception
Previously, De Bruyn and Orban (1999) have shown that thespeed of two transparently moving dot patterns is overesti-mated. To allow a direct comparison of behavioral with phys-iological data, we replicated their findings using the stimuli weused in the physiological recordings, investigated a widerrange of speeds, and obtained behavioral data in healthy humanvolunteers as well as a monkey. The details of the paradigm aredescribed in MATERIALS AND METHODS. Briefly, both the humanand monkey subjects viewed two patches of moving randomdots and reported which of the two moved faster (Fig. 1A).
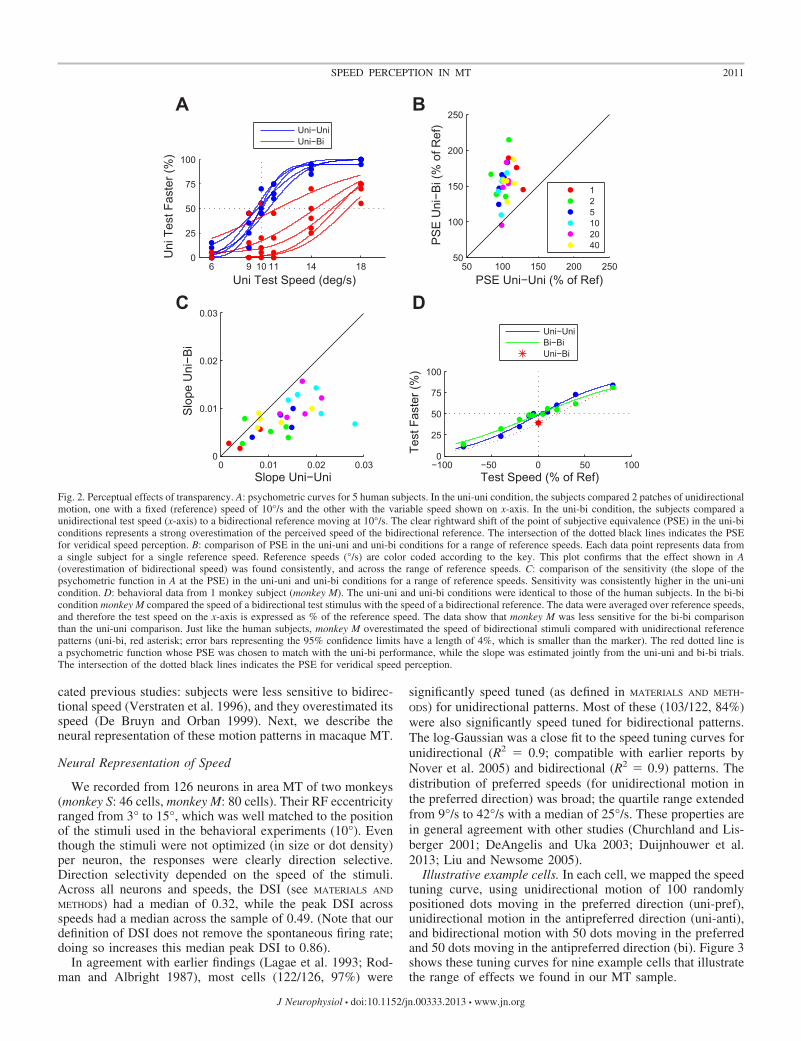
Figure 2 shows the results. The blue psychometric curves inFig. 2A demonstrate that the five subjects correctly comparedthe speed of two unidirectional patches while overestimatingthe speed of bidirectional patches (red curves), compared withunidirectional patches. The shallow slopes of the red curves inFig. 2A show that sensitivity was reduced for the bidirectionalpatches compared with the unidirectional patches. Both theincrease in PSE (P � 0.001) and the decrease in slope (P �0.005) were consistent across subjects and reference speeds(Fig. 2, B and C).
The monkey (Fig. 2D) compared two unidirectional patches(uni-uni; blue curve), two bidirectional patches (bi-bi; greencurve), or a unidirectional test with a bidirectional referencewhose physical speed was identical (uni-bi; red asterisk). Themonkey’s sensitivity for bidirectional patches was reducedcompared with unidirectional patches (P � 0.001), and, justlike the human subjects, he significantly overestimated thespeed of the bidirectional reference patch compared with aunidirectional test patch (red asterisk; the unidirectional testwas reported as faster in 39% of trials; P � 0.001, binomialtest). The red dotted curve in Fig. 2D shows a psychometriccurve with a slope determined from the pooled uni-uni andbi-bi comparison trials, while the PSE (20%) was chosen to fitthe performance on the uni-bi comparisons (see MATERIALS AND
METHODS). Hence, a ballpark estimate for the magnitude ofspeed overestimation by monkey M is 20%.
To summarize, the behavioral data were qualitatively con-sistent across subjects, species, reference speeds, and repli-
2010 SPEED PERCEPTION IN MT
J Neurophysiol • doi:10.1152/jn.00333.2013 • www.jn.org
cated previous studies: subjects were less sensitive to bidirec-tional speed (Verstraten et al. 1996), and they overestimated itsspeed (De Bruyn and Orban 1999). Next, we describe theneural representation of these motion patterns in macaque MT.
Neural Representation of Speed
We recorded from 126 neurons in area MT of two monkeys(monkey S: 46 cells, monkey M: 80 cells). Their RF eccentricityranged from 3° to 15°, which was well matched to the positionof the stimuli used in the behavioral experiments (10°). Eventhough the stimuli were not optimized (in size or dot density)per neuron, the responses were clearly direction selective.Direction selectivity depended on the speed of the stimuli.Across all neurons and speeds, the DSI (see MATERIALS AND
METHODS) had a median of 0.32, while the peak DSI acrossspeeds had a median across the sample of 0.49. (Note that ourdefinition of DSI does not remove the spontaneous firing rate;doing so increases this median peak DSI to 0.86).
In agreement with earlier findings (Lagae et al. 1993; Rod-man and Albright 1987), most cells (122/126, 97%) were
significantly speed tuned (as defined in MATERIALS AND METH-ODS) for unidirectional patterns. Most of these (103/122, 84%)were also significantly speed tuned for bidirectional patterns.The log-Gaussian was a close fit to the speed tuning curves forunidirectional (R2 � 0.9; compatible with earlier reports byNover et al. 2005) and bidirectional (R2 � 0.9) patterns. Thedistribution of preferred speeds (for unidirectional motion inthe preferred direction) was broad; the quartile range extendedfrom 9°/s to 42°/s with a median of 25°/s. These properties arein general agreement with other studies (Churchland and Lis-berger 2001; DeAngelis and Uka 2003; Duijnhouwer et al.2013; Liu and Newsome 2005).
Illustrative example cells. In each cell, we mapped the speedtuning curve, using unidirectional motion of 100 randomlypositioned dots moving in the preferred direction (uni-pref),unidirectional motion in the antipreferred direction (uni-anti),and bidirectional motion with 50 dots moving in the preferredand 50 dots moving in the antipreferred direction (bi). Figure 3shows these tuning curves for nine example cells that illustratethe range of effects we found in our MT sample.
A
C
B
D
6 9 10 11 14 180
25
50
75
100
Uni Test Speed (deg/s)
Uni
Tes
t Fas
ter (
%)
Uni−UniUni−Bi
50 100 150 200 25050
100
150
200
250
PSE Uni−Uni (% of Ref)
PS
E U
ni−B
i (%
of R
ef)
125102040
0 0.01 0.02 0.030
0.01
0.02
0.03
Slope Uni−Uni
Slo
pe U
ni−B
i
−100 −50 0 50 1000
25
50
75
100
Test Speed (% of Ref)
Test
Fas
ter (
%)
Uni−UniBi−BiUni−Bi
Fig. 2. Perceptual effects of transparency. A: psychometric curves for 5 human subjects. In the uni-uni condition, the subjects compared 2 patches of unidirectionalmotion, one with a fixed (reference) speed of 10°/s and the other with the variable speed shown on x-axis. In the uni-bi condition, the subjects compared aunidirectional test speed (x-axis) to a bidirectional reference moving at 10°/s. The clear rightward shift of the point of subjective equivalence (PSE) in the uni-biconditions represents a strong overestimation of the perceived speed of the bidirectional reference. The intersection of the dotted black lines indicates the PSEfor veridical speed perception. B: comparison of PSE in the uni-uni and uni-bi conditions for a range of reference speeds. Each data point represents data froma single subject for a single reference speed. Reference speeds (°/s) are color coded according to the key. This plot confirms that the effect shown in A(overestimation of bidirectional speed) was found consistently, and across the range of reference speeds. C: comparison of the sensitivity (the slope of thepsychometric function in A at the PSE) in the uni-uni and uni-bi conditions for a range of reference speeds. Sensitivity was consistently higher in the uni-unicondition. D: behavioral data from 1 monkey subject (monkey M). The uni-uni and uni-bi conditions were identical to those of the human subjects. In the bi-bicondition monkey M compared the speed of a bidirectional test stimulus with the speed of a bidirectional reference. The data were averaged over reference speeds,and therefore the test speed on the x-axis is expressed as % of the reference speed. The data show that monkey M was less sensitive for the bi-bi comparisonthan the uni-uni comparison. Just like the human subjects, monkey M overestimated the speed of bidirectional stimuli compared with unidirectional referencepatterns (uni-bi, red asterisk; error bars representing the 95% confidence limits have a length of 4%, which is smaller than the marker). The red dotted line isa psychometric function whose PSE was chosen to match with the uni-bi performance, while the slope was estimated jointly from the uni-uni and bi-bi trials.The intersection of the dotted black lines indicates the PSE for veridical speed perception.
2011SPEED PERCEPTION IN MT
J Neurophysiol • doi:10.1152/jn.00333.2013 • www.jn.org

Figure 3, A and B, show examples that match previousreports on transparent motion (Snowden et al. 1991; van Wezelet al. 1996); bidirectional motion evokes a response in betweenthe response evoked by the preferred and the antipreferreddirection of motion. A model in which the bidirectional re-sponse is the (weighted) average of the preferred and anti-preferred response would fit such cells well (see below for aquantitative treatment). Averaging, however, does not ade-quately describe the response pattern seen in the remainingpanels of Fig. 3. The neurons in Fig. 3, C–E, for instance,reduced their preferred speed when exposed to bidirectionalmotion. The neurons in Fig. 3, F and G, responded to all speedsof bidirectional patterns and lost their speed tuning. The neuronin Fig. 3H responded to antipreferred motion at high speedswhen presented in isolation but responded to the bidirectionalstimulus as if it was identical to the preferred stimulus and didnot contain any motion in the antipreferred direction (winner-take-all behavior; see below). Finally, the neuron in Fig. 3I wasnot direction sensitive (red and blue curves overlap), but at lowspeeds it responded better to bidirectional than unidirectionalmotion.
Cell-by-cell analysis. For each cell, we fit a log-Gaussiantuning curve to the responses to motion in the preferred di-rection and, separately, for bidirectional motion. Figure 4compares the four parameters of these fits on a cell-by-cellbasis for the 103 neurons with significant speed tuning for bothuni- and bidirectional patterns. Figure 4A shows that the offsetof the tuning curve, which represents the part of the responsethat is independent of the speed of the stimulus, generallyincreased for bidirectional motion. This effect was highly sig-nificant (sign test; P � 0.01). We used an orthogonal regres-sion to quantify the effect as a 60% increase in the untunedresponse. Figure 4B compares the amplitude of the speedtuning curves for uni- and bidirectional motion. The amplitudewas significantly reduced (sign test; P � 0.01), and, on aver-
age, the amplitude of the bidirectional response was 71% of theamplitude of the unidirectional response. Figure 4C shows thatthe preferred speed for bidirectional stimuli was typicallylower than the preferred speed of unidirectional stimuli (signtest; P � 0.01).
A B
C
E
G
I
D
F
H
0
100
0
20
0
25
0
20
0
20
Firin
g R
ate
(spk
/s)
0
5
0
10
0
25
1 2 4 8 16 32 640
20
Speed (deg/s)
Preferred
Anti−Preferred
Bidirectional
Fig. 3. Speed tuning curves of 9 example neurons fromarea MT. In all conditions the dot patterns (in bothpreferred and antipreferred directions) were moving atthe speed indicated on the x-axis. A–I: 9 cells that spanthe range of effects we found. Error bars on the datapoints indicate SE. The solid curves represent the bestfit; the colored areas around the curves represent thefamily of tuning curves consistent with the data (seeMATERIALS AND METHODS). Consistent with previousreports (Snowden et al. 1991), many cells respondedless to bidirectional motion than to unidirectionalmotion. This suppression, however, was not constantacross speeds, and most cells also showed enhancedresponses to bidirectional motion of certain speeds.
A B
C D0.1 1 10 100
0.1
1
10
100
Uni − Offset (spk/s)
Bi −
Offs
et (s
pk/s
)
1 10 1001
10
100
Uni − Amplitude (spk/s)
Bi −
Am
plitu
de (s
pk/s
)
0 20 40 600
20
40
60
Uni − Preferred Speed (deg/s)Bi −
Pre
ferr
ed S
peed
(deg
/s)
0 1 2 3 40
1
2
3
4
Uni − Tuning Width (deg/s)
Bi −
Tun
ing
Wid
th (d
eg/s
)
Fig. 4. Cell-by-cell comparison of tuning parameters. This plot contains onlysignificantly tuned cells (n � 103). A: comparison of the speed-independent(i.e., untuned) response for bidirectional stimuli vs. unidirectional stimulimoving in the preferred direction (offset parameter: � in Eq. 1). B: comparisonof the tuning amplitude (�). C: comparison of the preferred speed (�).D: comparison of the speed tuning width (�). This figure shows that when abidirectional stimulus was shown MT neurons typically responded more to allspeeds (A) but with a reduced amplitude (B). In addition, most cells preferredlower speeds in bidirectional motion patterns (C).
2012 SPEED PERCEPTION IN MT
J Neurophysiol • doi:10.1152/jn.00333.2013 • www.jn.org

These changes in the parameters of the log-Gaussian tuningfunction go a long way to describe the response changes of theexample cells in Fig. 3. For instance, the offset increase can beseen in Fig. 3, D, F, G, and I. A decrease in amplitude is seenin all example cells except Fig. 3, C and H, and a reducedpreferred speed is clearly noticeable in Fig. 3, C–E.
The tuning width was characterized by the unitless param-eter �. In our sample � ranged from 0 to 3 with a median of 1.5for unidirectional patterns, similar to the values reported byNover et al. (2005). The scatterplot in Fig. 4D shows that eventhough bidirectional patterns often induced relatively largechanges in tuning width, there was no consistent pattern (signtest; P 0.8) across the sample. We investigated whether apattern could be discerned when taking preferred speed intoaccount. For neurons with low preferred speeds tuning wastypically broader for bidirectional motion (i.e., � was reduced),while neurons with high preferred speeds often had narrowertuning for bidirectional motion (i.e., � was increased). How-ever, this correlation between the change in � and the preferredspeed of the neuron was weak (r � 0.23, P � 0.05); hencemost of the variance in tuning width changes induced bybidirectional patterns remains unexplained.
Normalization. We investigated whether a simple normal-ization model could describe the relation between the responseto the two unidirectional patterns and the response to thebidirectional pattern. Specifically, we used least-squares opti-mization to fit a power law model to the responses to thebidirectional patterns (see MATERIALS AND METHODS). Across oursample of 126 cells this power law model explained little of thevariance in the response to bidirectional motion (median ex-plained variance 46%). The model failed entirely (explainedvariance �10%) for 49 of the neurons (� 39%). Figure 3, Aand E–G, show example neurons from this category. For thesubset of 37 neurons (� 29%) where the model workedreasonably well (explained variance 75%), the power pa-rameter (g) was typically above 20, which means that thepower-law summation was essentially winner-take-all. Figure3H shows the speed tuning curves for one of these neurons.This fitting exercise shows that the interaction between thecomponents of bidirectional patterns could in general not becaptured by power-law summation. To understand why, weinvestigated how this interaction was affected by firing rate,direction selectivity, and speed tuning.
Suppression and facilitation. The first study to investigatebidirectional transparent motion in the macaque brain reportedmainly suppressive effects (Snowden et al. 1991), which thoseauthors defined as a response to bidirectional motion that wasreduced compared with unidirectional preferred motion. Wefollowed their convention and defined an index [suppressionindex (SI)] as 1 � B/P, where B corresponds to the bidirec-tional response and P to the unidirectional preferred directionresponse. We calculated SI for each �speed as well as the DSIfor each �speed. Figure 5 represents the median SI acrossneurons as a function of DSI (x-axis), while maintaining thedependence on �speed (shown as a label near the data point).Clearly, SI typically increased with DSI. (Note that DSI ap-pears relatively low due to the fact that it is an average over thevariability induced by different test speeds and because spon-taneous firing rate is included in our definition of DSI. The firstparagraph of RESULTS documents the direction selectivity ofthese cells.) The fact that the SI depended on DSI is not
surprising, as motion opponency increases direction selectivity(Adelson and Bergen 1985; Krekelberg 2008; Krekelberg andAlbright 2005) and should increase suppression for bidirec-tional motion stimuli.
However, the mapping from DSI to SI is not one-to-one,which implies that stimulus speed also affected the SI. Forexample, given approximately equal DSI (e.g., 0.2), responsesto bidirectional patterns with speeds below the preferred speed(�speed � �2) were facilitated (SI � 0), while responses tobidirectional patterns above the preferred speed (�speed � 2)were suppressed (SI 0). This effect is partially captured bythe statement that suppression is larger near the preferred speed(�speed �0) and drops off for speeds above (�speed 0) orbelow (�speed � 0) the preferred speed. For speeds wellbelow the preferred speed the suppression turns into facilita-tion. A third effect can be inferred from Fig. 5 and Fig. 6:suppression was weaker when firing rates for the preferred andantipreferred motions were lower.
To quantify these three relationships we determined thelinear partial correlation between SI, DSI, �speed, and the sumof the response to the preferred and antipreferred stimulus.Suppression was primarily determined by DSI (r � 0.47, P �0.001), next by the summed firing rate (r � 0.36, P � 0.001),and to a lesser, but statistically significant extent by thedifference between the test speed and the preferred speed (r �0.11, P � 0.005). In words, the data show that the response tobidirectional patterns was suppressed more when they movedat speeds for which the neuron had high direction selectivity,more for speeds that evoked a high firing rate, and more forspeeds near the preferred speed. These effects can also be seenin the averaged responses, which we present next.
Average responses. Figure 6A shows the median normalizedresponse of our sample of MT neurons (all neurons; n � 126)for each speed and in the three motion conditions (uni-pref,uni-anti, bi). This confirms that for some speeds the response to
0 0.1 0.2 0.3 0.4−0.75
−0.5
−0.25
0
0.25
−5
−4
−3−2
−1
01
2
3
Direction Selectivity Index
Sup
pres
sion
Inde
x
Fig. 5. Suppression and enhancement. Data points show the median suppres-sion index (SI; y-axis) as a function of the median direction selectivity index(DSI; x-axis). These averages were determined after aligning the tuning curvesto the preferred speed (i.e., based on the data shown in Fig. 6B); this allows usto label each data point with the difference between stimulus speed andpreferred speed (�speed). Error bars show SE across the population. Thisfigure shows that SI depends both on DSI and on �speed: suppressionincreased with direction selectivity but, in addition, decreased for speedsfurther from the preferred speed.
2013SPEED PERCEPTION IN MT
J Neurophysiol • doi:10.1152/jn.00333.2013 • www.jn.org

bidirectional patterns is suppressed compared with unidirec-tional motion in the preferred direction. At low speeds, how-ever, the population response was enhanced in the bidirectionalcondition.
The speed dependence of suppression is seen more clearly inFig. 6B, which shows the sample average after aligning thepreferred speeds of all cells. Note that, to use the entirepopulation, we defined preferred speed here nonparametricallyas the speed that induced the largest response. Using theparametric definition (i.e., Fig. 4C) on the subset of cells thatwere significantly tuned resulted in a qualitatively similargraph (not shown). Here, we clearly see an enhanced responseat low speeds and a suppressed response near the preferredspeeds. However, it is also clear from these figures that DSIvaried considerably across speeds. Typically DSI was small atlow speeds and peaked near the preferred speed. Hence anothervalid description of the responses to bidirectional patterns isthat they are suppressed when neurons are strongly directionselective and enhanced when they are weakly direction selec-tive. The cell-by-cell analysis above quantifies the relativestrength of speed tuning, direction selectivity, and the strengthof the response on suppression.
Linking Neural and Behavioral Data
Qualitatively, the reduced dynamic range for bidirectionalstimuli (Fig. 4B) should result in a loss of sensitivity, and thelabeled line decoder predicts that a reduction of the preferredspeed for bidirectional stimuli (Fig. 4C) results in an increaseof perceived speed. The goal of this section is to make theselinks quantitative by using a labeled line population decodingalgorithm in which each neuron votes for its preferred speedwith a weight proportional to its firing rate (see MATERIALS AND
METHODS).Figure 7 shows the population activity that the decoder used
to determine stimulus speed. Specifically, Fig. 7 shows the
response of our MT sample to uni- and bidirectional stimuli atseven different speeds. In terms of the decoder, the numberalong the x-axis corresponds to the label and the length of thevertical lines represents the vote for that label. Clearly, at slowstimulus speeds there were many votes for slow labels (Fig. 7,bottom left), while at high stimulus speeds the votes werepredominantly for fast labels (Fig. 7, top right). The circles inFig. 7 represent the decoded speed for each stimulus speed forunidirectional (black) and bidirectional (red) patterns. Thedecoder generally overestimated the speed of slow stimuli,while it underestimated the speed of fast stimuli. This is aconsequence of the boundaries (e.g., none of our neurons hada preferred speed above 64°/s or below 1°/s; hence our decodercould never decode a speed above 64°/s or below 1°/s) and thefact that more neurons in our sample preferred fast speeds thanslow speeds. These decoding biases are well known (Krekel-berg et al. 2006b; Priebe and Lisberger 2004); we ignore themhere by focusing on decoding relative speeds mainly from thecenter of the speed range (see DISCUSSION).
In our first decoder, we equated a neuron’s label with itspreferred speed for unidirectional motion, generated popula-tion responses like those shown in Fig. 7, decoded the speed fora test and a 10°/s reference stimulus, and compared those twodecoded speeds to answer the question “Which was faster, thetest or the reference?” In terms of Fig. 7 this corresponds to acomparison of two of the circles at different speeds (y-axis),e.g., a black and a red circle for a comparison of uni- andbidirectional motion and two black circles for a uni-uni com-parison. Repeating this procedure in 1,000 simulated trials withindependent Poisson noise for each neuron resulted in the datapoints shown as solid circles in Fig. 8. The solid curves showthe neurometric curves fitted to these data points. The neuro-metric curve for bi-bi comparisons (green) was shallower thanthe curve for uni-uni comparisons (blue). This demonstrates alower sensitivity for bidirectional than unidirectional motion.
A B1
0.75
0.5
0.25
0
1
0.75
0.5
0.25
01 2 4 8 16 32 64 -4 -2 0 2
Preferred
Anti-Preferred
Bidirectional
Nor
mal
ized
Res
pons
e
Nor
mal
ized
Res
pons
e
Speed (deg/s) Speed (octaves from ps)
Fig. 6. Population average speed tuning. A: normalizedfiring rate averaged over all cells (n � 126). Consistentwith the cell-by-cell comparison, bidirectional patchessometimes evoke reduced responses (especially nearthe preferred speed) but sometimes enhanced re-sponses (at low speeds). B: normalized firing rate afteraligning the preferred speeds of each cell. The responseto bidirectional patterns was suppressed near the pre-ferred speed and enhanced at lower speeds and showeda reduction in preferred speed.
2014 SPEED PERCEPTION IN MT
J Neurophysiol • doi:10.1152/jn.00333.2013 • www.jn.org

Numerically, the slope at the PSE was 0.007 for uni-uni and0.005 for bi-bi, a 29% loss in sensitivity.
Next, we compared the PSEs. For uni-uni comparisons thePSE was at 101% and for bi-bi comparisons 102%, indicatingthat the decoder had no bias for such comparisons. For the
uni-bi comparisons, however, (red solid line in Fig. 8), the PSEwas 189%, showing a large overestimation of the speed ofbidirectional motion. (A unidirectional pattern would have tomove 89% faster to be decoded as the same speed as a bidi-rectional pattern).
The choice of each neuron’s label in this labeled linedecoder is somewhat arbitrary. For instance, one could arguethat in a visual system exposed to natural motion, whichincludes bidirectional motion, the labels should not only bedetermined by unidirectional motion. As a simple explorationof this possibility, we investigated what would happen if thelabels were instead determined by the average of the twomotion types (see MATERIALS AND METHODS). This decoder stillhad less sensitivity for bi-bi comparisons than for uni-unicomparisons (10% loss in sensitivity; not shown), and thedecoder’s PSE for the uni-bi comparison was 163% (dashed-dotted red line in Fig. 8). Finally a decoder based on labelsdefined by the preferred speed to bidirectional patterns had aslightly increased sensitivity for bi-bi comparisons (5%; notshown) but nevertheless overestimated the speed of bi- com-pared with unidirectional patterns (PSE 132%; dotted red linein Fig. 8).
Taken together, these decoder simulation results show thatreasonable assumptions about the labels used to decode MT arecompatible with a loss of sensitivity for bidirectional motion onthe order of 25% and an overestimation of the speed ofbidirectional patterns on the order of 50%. These estimates arecompatible with the measured perceptual effects in Fig. 2. Themonkey’s sensitivity loss was 23%, and we estimated hisoverestimation of bidirectional speeds to be 20%. For thehuman subjects, the sensitivity loss varied between 18% and50% (quartile range across all data in Fig. 2C) and the over-estimation of the speed of bidirectional motion varied between43% and 76% (quartile range across all data in Fig. 2B). As canbe inferred from Fig. 7, however, the decoder predicted that theperceived speed difference between uni- and bidirectional
1 2 4 8 16 32 64
1
2
4
8
16
32
64
Preferred Speed (deg/s)
Stim
ulus
Spe
ed (d
eg/s
)
Fig. 7. MT population activity in response to uni- andbidirectional motion patterns. Each vertical line repre-sents the activity of a single neuron in our sample.Black lines represent the response to unidirectionalmotion and red lines the response to bidirectionalmotion. Neurons are sorted by their preferred speedalong the x-axis, and stimulus speed is representedalong the y-axis. As an example, the arrowhead high-lights the response of a neuron with a preferred speedjust above 2°/s to stimuli moving at 64°/s. Its responseto unidirectional motion (black vertical line) is muchless than its maximum response (indicated by horizon-tal dashed lines). The vertical red line shows that thisneuron responds more strongly to bidirectional motion(at 64°/s). (Black lines are thick only to allow us tooverlay the response to bidirectional motion with thethin red lines). The circles indicate the decoded speedfor each stimulus as determined by the labeled linemodel (black, unidirectional motion; red, bidirectionalmotion). This graph shows how increasing the stimulusspeed (bottom to top along y-axis) shifts the populationactivity from low-speed-preferring neurons to high-speed-preferring neurons (left to right along x-axis).This underlies the model’s ability to decode speed fromthe population.
50 100 150 200 250 0
25
50
75
100
Test Speed (% of Ref)
Test
Fas
ter (
%)
Uni−UniUni−BiBi−Bi
Fig. 8. Speed discrimination based on a labeled line model and MT responses.The model used only the responses of 126 MT neurons to determine whetherthe test patch (moving at speed represented on x-axis) moved faster than thereference patch (moving at a fixed speed of 10°/s). These simulated behavioralexperiments match the behavioral experiments shown in Fig. 2. The figureshows that the decoder performed the uni-uni task at a high level of perfor-mance. The same decoder, however, had reduced sensitivity for bidirectionalstimuli and overestimated the speed of bidirectional patterns compared withunidirectional patterns (red solid line). The dotted and dashed red lines showthe results of the bi-uni task when the label of the neurons was based on thepreferred speed for bidirectional patterns or the average of the 2 motion types,respectively. These results are in good qualitative agreement with the humanand monkey behavioral data of Fig. 2 and support the view that MT responses,decoded with a labeled line decoder, could indeed underlie the perception ofspeed in uni- and bidirectional patterns.
2015SPEED PERCEPTION IN MT
J Neurophysiol • doi:10.1152/jn.00333.2013 • www.jn.org

patterns diminishes with increases in the test speed. Thebehavioral data did not show this effect (Fig. 2B). We return tothis issue in DISCUSSION.
DISCUSSION
Our behavioral data confirm earlier findings that the speed ofbidirectional motion is more difficult to discriminate (Ver-straten et al. 1996) and perceived to be faster (De Bruyn andOrban 1999) than unidirectional motion. The speed tuning ofneurons in macaque area MT also differed greatly when mea-sured with unidirectional motion or bidirectional motion. No-tably, the neurons had a reduced dynamic range and generallypreferred lower speeds in the bidirectional motion patterns.Unlike previous reports, we found that the response to bidirec-tional patterns could be suppressed or enhanced compared withthe unidirectional preferred pattern and that this depended onthe neurons’ direction selectivity, speed preference, and overallfiring rate. We were able to link these complex neural re-sponses to our behavioral characterization of perceived speedby a simple labeled line decoder. Just like the human andmonkey observers, the decoder performed with high sensitivityfor unidirectional patterns, was less sensitive for bidirectionalmotion, and overestimated the speed of bidirectional motion.
After discussing low-level confounds and alternative inter-pretations, we discuss the novel insights that our data provideinto the processing of transparent motion per se, as well as therelationship between neural activity in MT and the perceptionof speed.
Alternative Interpretations
Under some conditions—for instance, to make sense of theoptic flow created by self-motion—relative motion is moreinformative than absolute motion. If a neuron encoded relativespeed, then the response to a 2°/s bidirectional stimulus shouldcorrespond to a 4°/s unidirectional stimulus. In other words,the relative speed assumption predicts a leftward shift of thespeed tuning curve by precisely 1 octave. Figure 3C is anexample of a neuron that matches this prediction. The over-view in Fig. 4C, however, shows that while shifts in preferredspeed are predominantly leftward their magnitude is quitevariable across the population and the 1-octave shift predictedby the relative speed model does not appear to be particularlycommon. Hence, our data do not support the idea that MT cellsgenerally respond to relative speed. Determining whether a subsetof cells (such as the example cell in Fig. 3C) do represent relativemotion would require a more extensive sampling of differentcombinations of stimulus speeds and directions.
In principle, the substantial inhomogeneities in directionalpreference across the RF we recently reported (Richert et al.2013) could contribute to differences in the response to unidi-rectional and bidirectional stimuli. However, because we re-peated each condition on average 12 times, and each repeatconsisted of a new set of dots whose starting positions wererandomized within the 10° aperture, such variability shouldaverage out across multiple trials.
Competitive Interactions in Transparent Motion
Previous work has shown that the percept of transparentmotion does not require multiple activity peaks (correspondingto the directions of motion) in the MT population. Instead, the
percept of transparent motion can be extracted from the overallpattern of population activity without the need for distinctpeaks (Treue et al. 2000). Generation of such patterns ofactivity can be achieved in models that rely on a local compe-tition between the neurons representing multiple directions ofmotion (Qian and Andersen 1994; Qian et al. 1994). Neuralsignatures of competition have been described as a suppressionof the neural response to bidirectional motion patterns com-pared with unidirectional motion in the preferred direction(Snowden et al. 1991; van Wezel et al. 1996). Our examinationof bidirectional motion across a range of speeds, however,revealed a much richer repertoire of interactions betweenopposing directions of motion. These could be understood asthe competitive interaction among multiple components thatpresumably arises as an emergent property of the recurrentlyconnected neural network for motion detection (Grossberg1973; Krekelberg and Albright 2005).
Our finding that suppression was mainly found near thepreferred speed, while enhancement dominated for suboptimalspeeds, is reminiscent of the contrast dependence of normal-ization (Heuer and Britten 2002): two stimuli that each provideweak drive to a neuron sum supralinearly, while stimuli thatprovide strong drive interact sublinearly. Our analysis of power-law summation, however, shows that a model based solely onuntuned normalization cannot capture the complexity found here.The partial correlation analysis clarifies that the response tobidirectional motion of a given speed is determined by the direc-tion selectivity, the total response to each of the unidirectionalcomponents, as well as the speed tuning. Hence, a model tocapture this complexity would have to be tightly linked with amodel for direction selectivity (to explain the dependence onDSI), normalization (to explain the dependence on the total firingrate), and speed tuning (to explain the explicit dependence on thetest speed).
Linking with Perception
Our findings add support to the claim that speed perceptionand neural activity in area MT are causally related via a labeledline decoder. This decoder, however, is far from perfect.Notably, taken at face value, the decoder incorrectly predictedbiases in decoding absolute speed (none of the circles in Fig. 7matches the stimulus speed) and a decrease of the perceivedrelative speed of uni- and bidirectional patterns with stimulusspeed (black and red circles in Fig. 7 move closer together withincreasing stimulus speed). At least in part, these decodingerrors are due to the overabundance of neurons with highpreferred speeds and the absence (in our sample) of neuronswith preferred speeds above 64°/s. Such unequal distributionsof the label necessarily introduce biases in labeled line decod-ing (Krekelberg et al. 2006b; Priebe and Lisberger 2004),although they can be reduced by using a weighted and/ornonlinear average across the population (Salinas and Abbott1994). By focusing our decoding analysis on the center of therange of preferred speeds in our sample, we minimized theinfluence of these effects and found a good match withthe behavioral data in that same range. The visual system,however, has to cope with the full range of speeds in theenvironment, and it is not clear how it avoids boundary effects(if it uses labeled line decoding). This highlights a conceptualdifference between labeled line decoding of a sensory variable
2016 SPEED PERCEPTION IN MT
J Neurophysiol • doi:10.1152/jn.00333.2013 • www.jn.org

that has no boundaries (e.g., direction) and one that hasboundaries (e.g., speed has boundaries at zero and at thehighest preferred speed in the population). Labeled line aver-aging works well in the former but can be problematic in thelatter sensory domain.
In previous work we have shown that the change in per-ceived speed induced by manipulating stimulus contrast ofrandom dot patterns is not captured by a labeled line model inarea MT (Krekelberg et al. 2006b). Although it is far from theonly argument against a labeled line for speed (see introduc-tion), it is clearly the odd one out of studies based on visualillusions. The present study does not resolve this discrepancy,but it does suggest that the influence of stimulus contrast onspeed perception may be a special case.
In this context, we note that a striking effect of luminancecontrast on neural responses in the visual system is the increasein response latency at low contrasts. Such response latencydifferences are typically not found in the other manipulationsthat lead to speed misperceptions (e.g., adaptation, stimulussize, or bidirectional motion). Hence it seems possible that anextension of the labeled line model that takes the latency of theresponse into account could be fruitful (Chase and Young2007; Gawne et al. 1996). We note, however, that responselatency depends not only on contrast but also on speed anddirection tuning, surround interactions, and the magnitude ofthe response (Raiguel et al. 1989, 1999). Experimentally it isnot feasible to control each of these variables independently,which hampers the isolation of a single underlying quantitythat identifies perceived speed. Of course, this raises thequestion of how the brain manages to do so, given that thesesame confounds exist in everyday life as well. Our findingsshow that the labeled line model fares well under very con-strained conditions (the comparison of bi- and unidirectionalpatterns of moving dots). Similarly, variants of the labeled linemodel have been shown to explain the influence of otherisolated stimulus manipulations [e.g., apparent motion(Churchland and Lisberger 2001), adapted motion (Krekelberget al. 2006a), accelerated motion (Schlack et al. 2007), stimulussize (Boyraz and Treue 2011)]. Even though each of thesestudies used a labeled line model, they are subtly different inthe definition of the label, as well as the measure of neuralactivity that is used in the decoder. Hence it is not clear that asingle model could explain all of these data sets in a quantita-tive manner. The true challenge remains to develop a singlemodel that relates neural activity (in MT or elsewhere) to theperceived speed of natural stimuli in a manner that explainshow nuisance features such as luminance, contrast, size, mo-tion direction, and transparency affect the percept of speed.
ACKNOWLEDGMENTS
We thank Tom Albright for his early support of this project, JenniferCostanza, Dinh Diep, and Doug Woods for technical assistance, and RogerBours for his help with data analysis.
GRANTS
This research was supported by the National Eye Institute under awardnumber R01 EY-017605.
DISCLOSURES
No conflicts of interest, financial or otherwise, are declared by the author(s).
AUTHOR CONTRIBUTIONS
Author contributions: B.K. and R.J.A.v.W. conception and design ofresearch; B.K. and R.J.A.v.W. performed experiments; B.K. and R.J.A.v.W.analyzed data; B.K. and R.J.A.v.W. interpreted results of experiments; B.K.and R.J.A.v.W. prepared figures; B.K. drafted manuscript; B.K. andR.J.A.v.W. edited and revised manuscript; B.K. and R.J.A.v.W. approved finalversion of manuscript.
REFERENCES
Adelson EH, Bergen JR. Spatiotemporal energy models for the perception ofmotion. J Opt Soc Am A 2: 284–299, 1985.
Born RT, Bradley DC. Structure and function of visual area MT. Annu RevNeurosci 28: 157–189, 2005.
Boyraz P, Treue S. Misperceptions of speed are accounted for by theresponses of neurons in macaque cortical area MT. J Neurophysiol 105:1199–1211, 2011.
Britten KH, Heuer HW. Spatial summation in the receptive fields of MTneurons. J Neurosci 19: 5074–5084, 1999.
Chase SM, Young ED. First-spike latency information in single neuronsincreases when referenced to population onset. Proc Natl Acad Sci USA 104:5175–5180, 2007.
Churchland MM, Lisberger SG. Shifts in the population response in themiddle temporal visual area parallel perceptual and motor illusions producedby apparent motion. J Neurosci 21: 9387–9402, 2001.
Cronin B, Stevenson IH, Sur M, Kording KP. Hierarchical Bayesianmodeling and Markov chain Monte Carlo sampling for tuning-curve anal-ysis. J Neurophysiol 103: 591–602, 2010.
De Bruyn B, Orban GA. What is the speed to transparent and kinetic-boundary displays? Perception 28: 703–709, 1999.
DeAngelis GC, Uka T. Coding of horizontal disparity and velocity by MTneurons in the alert macaque. J Neurophysiol 89: 1094–1111, 2003.
Duijnhouwer J, Noest AJ, Lankheet MJ, van den Berg AV, van Wezel RJ.Speed and direction response profiles of neurons in macaque MT and MSTshow modest constraint line tuning. Front Behav Neurosci 7: 22, 2013.
Friedman HS, Priebe CE. Estimating stimulus response latency. J NeurosciMethods 83: 185–194, 1998.
Gawne TJ, Kjaer TW, Richmond BJ. Latency: another potential code forfeature binding in striate cortex. J Neurophysiol 76: 1356–1360, 1996.
Groh JM, Born RT, Newsome WT. How is a sensory map read out? Effectsof microstimulation in visual area MT on saccades and smooth pursuit eyemovements. J Neurosci 17: 4312–4330, 1997.
Grossberg S. Contour enhancement, short-term memory, and constancies inreverberating neural networks. Stud Appl Math 52: 213–257, 1973.
Hartmann TS, Bremmer F, Albright TD, Krekelberg B. Receptive fieldpositions in area MT during slow eye movements. J Neurosci 31: 10437–10444, 2011.
Heuer HW, Britten KH. Contrast dependence of response normalization inarea MT of the rhesus macaque. J Neurophysiol 88: 3398–3408, 2002.
Krekelberg B. Motion detection mechanisms. In: The Senses: A Comprehen-sive Reference, edited by Basbaum A. Oxford, UK: Elsevier, 2008.
Krekelberg B, Albright TD. Motion mechanisms in macaque MT. J Neuro-physiol 93: 2908–2921, 2005.
Krekelberg B, Kubischik M, Hoffmann KP, Bremmer F. Neural correlatesof visual localization and perisaccadic mislocalization. Neuron 37: 537–545,2003.
Krekelberg B, van Wezel RJ, Albright TD. Adaptation in macaque MTreduces perceived speed and improves speed discrimination. J Neurophysiol95: 255–270, 2006a.
Krekelberg B, van Wezel RJ, Albright TD. Interactions between speed andcontrast tuning in the middle temporal area: implications for the neural codefor speed. J Neurosci 26: 8988–8998, 2006b.
Lagae L, Raiguel S, Orban GA. Speed and direction selectivity of macaquemiddle temporal neurons. J Neurophysiol 69: 19–39, 1993.
Liu J, Newsome WT. Correlation between speed perception and neuralactivity in the middle temporal visual area. J Neurosci 25: 711–722, 2005.
Morris AP, Bremmer F, Krekelberg B. Eye position signals in the dorsalvisual system are accurate and precise on short time-scales. J Neurosci 33:12395–12406, 2013.
Nover H, Anderson CH, DeAngelis GC. A logarithmic, scale-invariantrepresentation of speed in macaque middle temporal area accounts for speeddiscrimination performance. J Neurosci 25: 10049–10060, 2005.
2017SPEED PERCEPTION IN MT
J Neurophysiol • doi:10.1152/jn.00333.2013 • www.jn.org

Orban GA, Saunders RC, Vandenbussche E. Lesions of the superiortemporal cortical motion areas impair speed discrimination in the macaquemonkey. Eur J Neurosci 7: 2261–2276, 1995.
Parker AJ, Newsome WT. Sense and the single neuron: probing the physi-ology of perception. Annu Rev Neurosci 21: 227–277, 1998.
Pasternak T, Merigan W. Motion perception following lesions of the supe-rior temporal sulcus in the monkey. Cereb Cortex 4: 247–259, 1994.
Priebe NJ. Estimating target speed from the population response in visual areaMT. J Neurosci 24: 1907–1916, 2004.
Priebe NJ, Lisberger SG. Estimating target speed from the populationresponse in visual area MT. J Neurosci 24: 1907–1916, 2004.
Qian N, Andersen RA. Transparent motion perception as detection of unbalancedmotion signals. II. Physiology. J Neurosci 14: 7367–7380, 1994.
Qian N, Andersen RA, Adelson EH. Transparent motion perception as detection ofunbalanced motion signals. III. Modeling. J Neurosci 14: 7381–7392, 1994.
Raiguel S, Lagae L, Gulyás B, Orban GA. Response latencies of visual cellsin macaque area V1, V2 and V5. Brain Res 493: 155–159, 1989.
Raiguel SE, Xiao DK, Marcar VL, Orban GA. Response latency ofmacaque area MT/V5 neurons and its relationship to stimulus parameters. JNeurophysiol 82: 1944–1956, 1999.
Richert M, Albright TD, Krekelberg B. The complex structure of receptivefields in the middle temporal area. Front Syst Neurosci 7: 2, 2013.
Rodman HR, Albright TD. Coding of visual stimulus velocity in area MT ofthe macaque. Vision Res 27: 2035–2048, 1987.
Salinas E, Abbott LF. Vector reconstruction from firing rates. J ComputNeurosci 1: 89–107, 1994.
Schlack A, Krekelberg B, Albright TD. Recent history of stimulus speedsaffects the speed tuning of neurons in area MT. J Neurosci 27: 11009–11018, 2007.
Schlack A, Krekelberg B, Albright TD. Speed perception during accelerationand deceleration. J Vis 8: 9–11, 2008.
Snowden RJ, Treue S, Erickson RG, Andersen RA. The response of areaMT and V1 neurons to transparent motion. J Neurosci 11: 2768–2785,1991.
Treue S, Hol K, Rauber HJ. Seeing multiple directions of motion-physiologyand psychophysics. Nat Neurosci 3: 270–276, 2000.
van Wezel RJ, Lankheet MJ, Verstraten FA, Maree AF, van de GrindWA. Responses of complex cells in area 17 of the cat to bi-vectorialtransparent motion. Vision Res 36: 2805–2813, 1996.
Verstraten FA, Fredericksen RE, van Wezel RJ, Boulton JC, van deGrind WA. Directional motion sensitivity under transparent motion condi-tions. Vision Res 36: 2333–2336, 1996.
Wichmann FA, Hill NJ. The psychometric function. I. Fitting, sampling, andgoodness of fit. Percept Psychophys 63: 1293–1313, 2001a.
Wichmann FA, Hill NJ. The psychometric function. II. Bootstrap-basedconfidence intervals and sampling. Percept Psychophys 63: 1314–1329,2001b.
2018 SPEED PERCEPTION IN MT
J Neurophysiol • doi:10.1152/jn.00333.2013 • www.jn.org