neuritequant: an open source toolkit for high content
TRANSCRIPT

NeuriteQuant: An open source toolkit for highcontent screens of neuronal MorphogenesisDehmelt et al.
Dehmelt et al. BMC Neuroscience 2011, 12:100http://www.biomedcentral.com/1471-2202/12/100 (11 October 2011)

SOFTWARE Open Access
NeuriteQuant: An open source toolkit for highcontent screens of neuronal MorphogenesisLeif Dehmelt1*, Gunnar Poplawski2, Eric Hwang3 and Shelley Halpain2*
Abstract
Background: To date, some of the most useful and physiologically relevant neuronal cell culture systems, such ashigh density co-cultures of astrocytes and primary hippocampal neurons, or differentiated stem cell-derivedcultures, are characterized by high cell density and partially overlapping cellular structures. Efficient analyticalstrategies are required to enable rapid, reliable, quantitative analysis of neuronal morphology in these valuablemodel systems.
Results: Here we present the development and validation of a novel bioinformatics pipeline called NeuriteQuant.This tool enables fully automated morphological analysis of large-scale image data from neuronal cultures or brainsections that display a high degree of complexity and overlap of neuronal outgrowths. It also provides an efficientweb-based tool to review and evaluate the analysis process. In addition to its built-in functionality, NeuriteQuantcan be readily extended based on the rich toolset offered by ImageJ and its associated community of developers.As proof of concept we performed automated screens for modulators of neuronal development in cultures ofprimary neurons and neuronally differentiated P19 stem cells, which demonstrated specific dose-dependent effectson neuronal morphology.
Conclusions: NeuriteQuant is a freely available open-source tool for the automated analysis and effective review oflarge-scale high-content screens. It is especially well suited to quantify the effect of experimental manipulations onphysiologically relevant neuronal cultures or brain sections that display a high degree of complexity and overlapamong neurites or other cellular structures.
BackgroundHigh content screening (HCS) of cells based on morpholo-gical parameters is increasingly used to identify novelmolecular pathways in disease or potential new therapeu-tic treatments. Screens targeting neuronal development orneurodegeneration in particular aim to quantify neurites(axons and dendrites). Manual analysis of neuronal mor-phology is time consuming and becomes impractical forlarge datasets. While specialized commercial softwareapplications are available to measure neurite outgrowth,such tools are usually not openly available for user custo-mization beyond the supplied standard interface. On theother hand, free software tools for quantitative analysis of
neuronal morphology do not offer convenient automatedanalysis of large-scale data sets (such as those produced bygenome-wide RNA interference-based screens or extensivecompound library screens), and often require a significantlevel of user interaction [1,2].Here, we describe and make freely available a bioinfor-
matics toolkit we term “NeuriteQuant” to perform auto-mated analysis of neurite outgrowth and branching. Thetoolkit is open-source and based on the free image analysissoftware program ImageJ. Unlike other non-commercialapproaches for neuronal analysis, the NeuriteQuant pipe-line provides a complete, integrated routine to facilitategenome-wide high-content analysis as well as small-scaleexperiments. NeuriteQuant is easily configured to processlarge, complex datasets produced by automated screeningmicroscopes (Figure 1). Results are automatically orga-nized into a web-based data browser, which providesdetailed graphical representations of neuronal morphologi-cal measurements, as well as links to the raw images.
* Correspondence: [email protected]; [email protected] of Molecular Physiology, Otto-Hahn-Str. 11, 44227Dortmund, Germany and Dortmund University of Technology, Otto-Hahn-Str.6, 44227, Dortmund, Germany2Division of Biological Sciences, University of California, San Diego, La Jolla,CA 92093, USAFull list of author information is available at the end of the article
Dehmelt et al. BMC Neuroscience 2011, 12:100http://www.biomedcentral.com/1471-2202/12/100
© 2011 Dehmelt et al; licensee BioMed Central Ltd. This is an Open Access article distributed under the terms of the CreativeCommons Attribution License (http://creativecommons.org/licenses/by/2.0), which permits unrestricted use, distribution, andreproduction in any medium, provided the original work is properly cited.
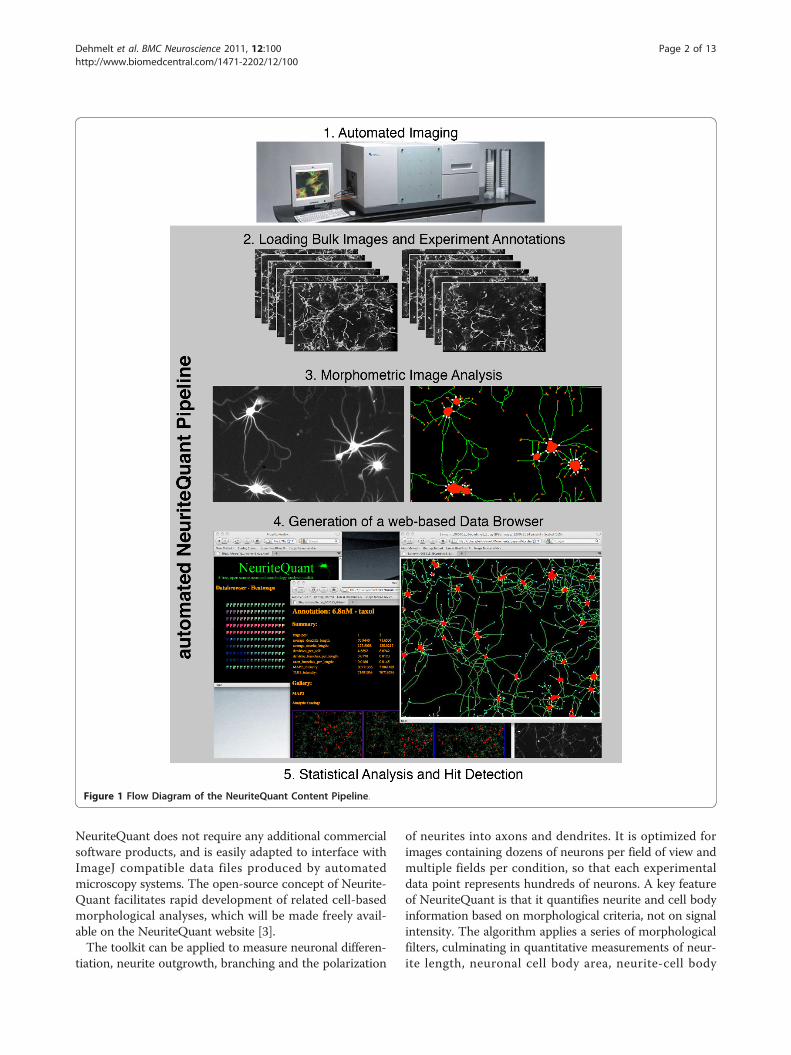
NeuriteQuant does not require any additional commercialsoftware products, and is easily adapted to interface withImageJ compatible data files produced by automatedmicroscopy systems. The open-source concept of Neurite-Quant facilitates rapid development of related cell-basedmorphological analyses, which will be made freely avail-able on the NeuriteQuant website [3].The toolkit can be applied to measure neuronal differen-
tiation, neurite outgrowth, branching and the polarization
of neurites into axons and dendrites. It is optimized forimages containing dozens of neurons per field of view andmultiple fields per condition, so that each experimentaldata point represents hundreds of neurons. A key featureof NeuriteQuant is that it quantifies neurite and cell bodyinformation based on morphological criteria, not on signalintensity. The algorithm applies a series of morphologicalfilters, culminating in quantitative measurements of neur-ite length, neuronal cell body area, neurite-cell body
Figure 1 Flow Diagram of the NeuriteQuant Content Pipeline.
Dehmelt et al. BMC Neuroscience 2011, 12:100http://www.biomedcentral.com/1471-2202/12/100
Page 2 of 13

attachment points, and neurite endpoints per field. Fromthese primary measurements, average measurements perneuron are derived for neurite length, cell body area,branch points, and neurite count.
ImplementationThe majority of the NeuriteQuant tool is implemented asan ImageJ macro, and can be easily manipulated using asimple text editor. Reference for the ImageJ macro lan-guage is available online [4]. Additional functionality thatcould not be implemented as an ImageJ macro was addedin the form of ImageJ plugins using the programminglanguage Java. The source code for these custom-madeplugins is also included in the NeuriteQuant package.
Overview of the NeuriteQuant Analysis PipelineA particular strength of NeuriteQuant is its flexibility dueto open source implementation. This flexibility allowseasy adaptation of different data sources from variousimaging platforms. In addition, the toolkit is already con-figured with a powerful content pipeline, which facilitatesstreamlined management of image and annotation data(Figure 1).In general, image data must be provided according to a
naming convention that identifies individual experimentalconditions (for example by well position, plate identifierand/or other classifiers). For this study we controlled astandard inverted light microscope equipped with auto-mated filter-cube turret and automated x-y-z stage posi-tioning using custom Metamorph journals (available uponrequest) to automatically generate sets of images.It is advantageous, especially for large-scale experiments,
to evaluate and review automated analysis data rapidly andefficiently. NeuriteQuant fills this need by automaticallycreating an autonomous, web-based data browser for eachanalysis run (see [5] for an example) that facilitates reviewby a human observer. This data browser serves as a plat-form for visualization and sharing of experimental results.It provides easy access to compressed versions of the origi-nal image data, incorporates user-defined experimentannotations, tracing of morphological image features, acustomizable, interactive three-colour graphical represen-tation of quantitative analysis in the form of so-calledheatmaps, and interactive 2-D graphical plots. Finally,NeuriteQuant exports all measurement data into tab-delimited text files, which can be easily imported into sta-tistics packages for subsequent analysis and hit detection(see [6] for detailed instructions).
Neuromorphometric Measurement AlgorithmOur method for morphological analysis is highly sensitiveand largely independent of signal intensities, and thusdetects both neurites that contain abundant signal as wellas those that are barely detectable above background.
This minimal signal dependence for neurite detection isachieved by using the public domain Greyscale Morphol-ogy filter by Dimiter Prodanov (Université catholique deLouvain, Brussels), which can be used to selectivelyenhance either small, neurite-like structures or globular,cell body-like structures in the image (Figure 2). First,circular objects, which usually represent cell bodies, areamplified using an open filter (step 1) and isolated bybinarization (step 2). Fiber-like structures, such as neur-ites, are identified by subtraction (step 3) of the open fil-tered image from the original image and subsequentbinarization (step 4). Due to the strong enhancement ofneurite or cell body structures, variations of stainingintensities minimally affect the detection procedure andtherefore a single, preset threshold can be used for binar-ization of all images of an individual set of experiments.This threshold can either be obtained interactively via aguided procedure provided in NeuriteQuant or setmanually for a given set of images.Small structures, which usually represent debris or ima-
ging artefacts, are excluded by rapid size filtering (step 5),which was implemented by an altered flood-fill algorithmoriginally included in the ImageJ package. In contrast tothe standard particle analyzer built in ImageJ, this modi-fied filter is able to filter objects enclosed by larger objects(for example small objects enclosed by neurite loops). Sub-sequently, a well defined, one pixel wide representation ofthe fibrous structure is obtained by the skeletonizationfunction of ImageJ (step 6). Skeletonized fibrous structuresthat do not belong to neurites are often also found withinneuronal cell bodies - therefore, the overlap between fibrestructures and neuronal cell bodies is determined (step 7)and subtracted (step 8) to yield a clean, one pixel-widerepresentation of neurites. Due to this filter, neurites thatgrow on top of neuronal cell bodies are also excludedfrom our analysis.To identify the number of neurite endpoints, the single
terminal pixel of the skeletonized fiber structures areeroded (step 9) and subtracted from the original skeleton(step 10). By subsequent subtraction (step 12) of the ske-leton/cell body overlap (step 11), the neurite endpointsare derived. Neurite-cell body attachment points areidentified by first applying a mask generated by dilationof the binary cell body image (step 13) to identify theproximal neurite segments (step 14). The endpoints ofthese proximal neurite segments are determined by ero-sion (step 15) and subtraction (step 16). Endpoints withinthe original cell body mask are removed by subtraction(step 17) to yield the majority of neurite-cell body attach-ment points. Since this procedure depends on the pre-sence of endpoints in the overlap region between thedilated cell bodies and neurite skeleton, it does not iden-tify the rare events whereby two neurites emerge veryclose together from a single cell body, forming V-shaped
Dehmelt et al. BMC Neuroscience 2011, 12:100http://www.biomedcentral.com/1471-2202/12/100
Page 3 of 13

attachments. Such attachments are morphologically simi-lar to unattached neurites that contact neuronal cellbodies tangentially, and are interpreted by our analysis asno attachment, rather than two. Our analysis also doesnot track neurites that grow on top of neuronal cell
bodies. Thus, unattached neurites that cross neuronalcell bodies are incorrectly interpreted as two attachmentpoints.The resulting binary images of neurites, neuronal cell
bodies and neurite endpoints are quantified per field, and
Figure 2 Image Processing Algorithm for Quantification of Neuronal Morphology. a) Flow diagram that illustrates the extraction of keymorphological features from single colour images of neurons stained with antibodies to either the neuron-specific marker betaIII-tubulin or thedendrite-specific marker MAP2. Numbers refer to steps in the algorithm description (Main Text: Implementation). A summary of the analysisalgorithm is provided in the Additional File 1. b) Example of feature extraction from cultured primary hippocampal neurons. The majority ofneuronal structures are identified accurately by this procedure. The analysis algorithm quantifies total neurite length by counting pixels of theskeletonized neurites (green) and total neuronal cell body area per field of view (red). In addition, the algorithm identifies and counts themajority of cell bodies, neurite endpoints (cyan) and neurite-cell body attachment points (yellow), as well as the total staining intensities perfield. These values are used to deduce additional measurements (see text for details).
Dehmelt et al. BMC Neuroscience 2011, 12:100http://www.biomedcentral.com/1471-2202/12/100
Page 4 of 13
the following specific neuromorphological parameters arereported: total neurite length, total neuronal cell bodyarea, average cell body cluster size, total number of cellbodies, number of neurite-cell body attachment points,and number of neurite endpoints. Quantification of theaverage signal intensity is also reported.If neuronal cell body overlap is negligible (as is the case
for low density primary hippocampal neurons) thereported neuronal cell body count should provide suffi-cient accuracy for most applications. However, if neuronalcell bodies form higher order clusters, as is commonlyobserved for neurons derived from P19 cells, the averageneuronal cell body number can be estimated by dividingthe total neuronal cell body area by a user-defined refer-ence size of typical neuronal cell bodies. The ratio betweenthe average cell body structure area and the measured areaof individual cell bodies can serve as an approximate mea-sure of neuronal cell body clustering.The primary measurements generated by the Neurite-
Quant tool are used to derive additional neuromorpholo-gical features, including total branch number, branchdensity along the neurite length, average neurite lengthper neuron and average length of individual neurites. Forthis purpose, numbers of branch points are deduced as thedifference between neurite endpoints and neurite attach-ment points. This is valid as long as neurite and neuronalcell body detection is robust, as interrupted neurite seg-ments or neurites that are separated from neuronal cellbodies also give rise to an increased difference betweenneurite endpoints and neurite attachment points. All mea-surements can be set up for multiple colour channels,facilitating parallel analysis of, for example, neuronal sub-type morphologies or individual measurements for axonsversus dendrites.An increase in the ratio between total neurite length and
neuronal cell body area can result from either increases inneurite outgrowth (increased total neurite length withconstant neuronal cell body area) or from shrinkage ofneuronal cell bodies (decreases in neuronal cell body areawith constant neurite length), or both in combination. Inour experiments, changes in the ratio between total neur-ite length and neuronal cell body area usually resultedfrom altered neurite outgrowth. Interestingly, taxol appli-cation to primary hippocampal neurons resulted in anincrease in total neurite length and an apparent decreasein neuronal cell body area (see [7]). The apparent decreasein neuronal cell body area seemed to originate fromincreased microtubule bundling, resulting in a smaller cellbody area as detected by antibodies against neuronal tubu-lin. Thus, careful review of experimental data by a humanobserver is essential to detect and interpret unexpectedchanges in neuronal morphology and their effect on auto-mated analysis. The efficient web-browser based datareview feature facilitates such post hoc data analyses.
ResultsMeasurement of Neurite Outgrowth in high densitycultures of differentiating P19 stem cellsWe first tested whether the neuronal morphology mea-surement algorithm in NeuriteQuant can extract neuro-morphological features from differentiating mouse P19cells, a valuable pluripotent, stem cell-like model forneuronal differentiation and neuritogenesis [8]. Thesecultures are usually grown at very high cell densitiesand they display a high degree of neurite overlap. Wecultured P19 cells in plastic bottom, 384-well plates andinduced their differentiation by transfection with theneurogenic transcription factor NeuroD2 [9]. In theseconditions P19 cells form a dense population of neuro-nal cells, which extend neurites on top of a monolayerof non-neuronal cells. Cells were fixed 4 days after plat-ing, stained for neuron-specific bIII-tubulin (using anti-body TuJ1) and were imaged using an epifluorescencemicroscope.Multicolour labelling could obviously facilitate mor-
phological analysis of neurite length and neuronal cellbody area (e.g. by using HuC/HuD as a marker for neu-ronal cell bodies [10]). However, our goal was to extractthe maximal information from images captured using asingle fluorophore. With this strategy, we retain maxi-mum flexibility to multiplex markers of additional biolo-gical interest as shown in the next section on selectivemeasurements on axons vs. dendrites. Therefore, werestricted our analysis in these initial experiments to asingle fluorescence channel (using secondary Alexa 568-labeled antibodies to detect neuronal tubulin with anti-body TuJ1).In order to compare objective automatic analysis to
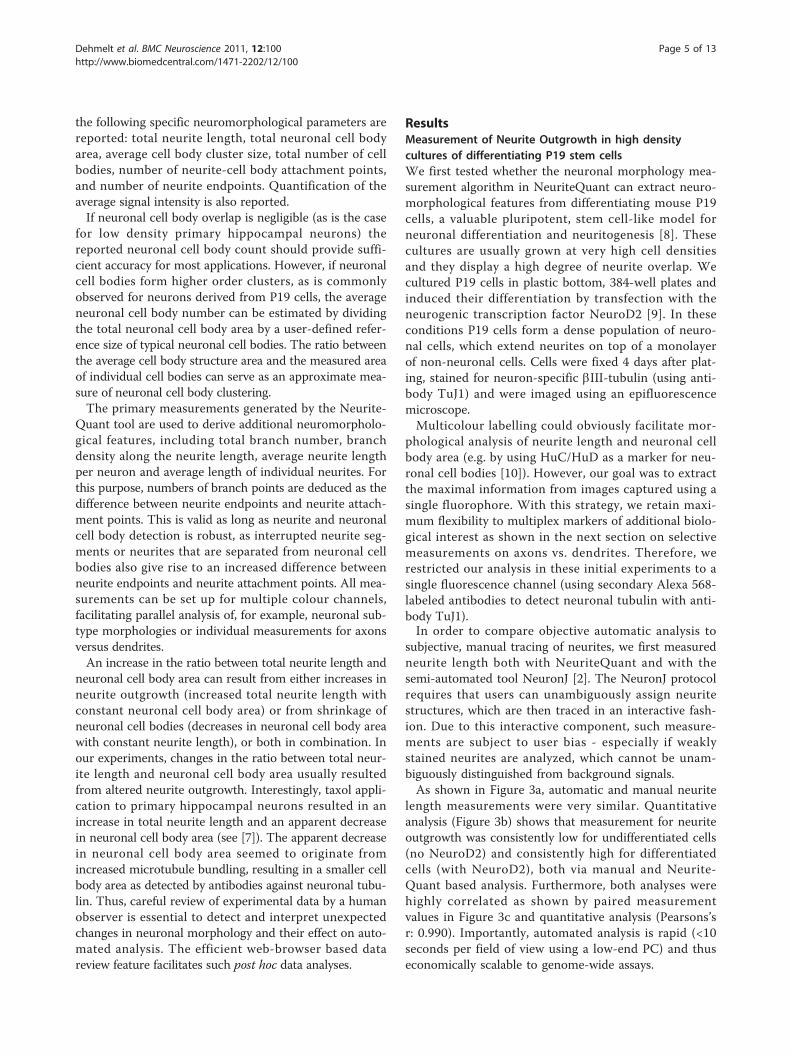
subjective, manual tracing of neurites, we first measuredneurite length both with NeuriteQuant and with thesemi-automated tool NeuronJ [2]. The NeuronJ protocolrequires that users can unambiguously assign neuritestructures, which are then traced in an interactive fash-ion. Due to this interactive component, such measure-ments are subject to user bias - especially if weaklystained neurites are analyzed, which cannot be unam-biguously distinguished from background signals.As shown in Figure 3a, automatic and manual neurite
length measurements were very similar. Quantitativeanalysis (Figure 3b) shows that measurement for neuriteoutgrowth was consistently low for undifferentiated cells(no NeuroD2) and consistently high for differentiatedcells (with NeuroD2), both via manual and Neurite-Quant based analysis. Furthermore, both analyses werehighly correlated as shown by paired measurementvalues in Figure 3c and quantitative analysis (Pearsons’sr: 0.990). Importantly, automated analysis is rapid (<10seconds per field of view using a low-end PC) and thuseconomically scalable to genome-wide assays.
Dehmelt et al. BMC Neuroscience 2011, 12:100http://www.biomedcentral.com/1471-2202/12/100
Page 5 of 13
Comparison to existing SoftwareWe next compared the performance of NeuriteQuantwith other related analysis toolkits. A recently developedsoftware tool [11] by Wu et al follows a similar strategyas our approach, by focusing on extracting neurite and
neuronal cell body structures on a per frame basis. How-ever, that tool does not provide analysis of neuritebranching. The published approach, which is tailoredtowards analysis of neuronal cultures from Drosophila, isavailable from the authors upon request. The analysis
Figure 3 Comparison of automated analysis with NeuriteQuant to manual analysis and existing software. a) P19 cells were cultured withor without transfection of the neurogenic transcription factor NeuroD2. Neurite length was measured either by manual tracing using the semi-automated NeuronJ program [2], the NeuriteQuant package, the method by Wu et al. [11] or the NeuriteIQ software. b) Box and Whisker graphsfrom quantitative measurements of neurite length from 8 microscopic fields per condition. c) Corresponding automated and manual analyses ofneurite length of identical images are symbolized by a connecting line.
Dehmelt et al. BMC Neuroscience 2011, 12:100http://www.biomedcentral.com/1471-2202/12/100
Page 6 of 13

algorithm of Wu et al is optimized to detect neurites withhigh accuracy, but it also requires more computationalpower (approximately four-fold slower than Neurite-Quant), which might be disadvantageous for large-scaleanalysis, such as in high-content screening campaigns.For quantitative comparisons, a modified neuronal somadetection method was applied (Pengyu Hong, personalcommunication). Although individual neurites that werenot attached to the detected neuronal cell bodies weremissed, neurite tracings of P19 cells obtained by the Wuet al. [11] method were highly accurate (Figure 3a) andquantitative measurements were similar to manual analy-sis (Figure 3b). Overall correlation with manual analysiswas slightly improved compared to the faster Neurite-Quant method (Pearsons’s r: 0.998).Pool et al [12] developed a software tool called Neurite-
Tracer that is freely available. In contrast to Neurite-Quant, NeuriteTracer requires images of separated nucleifor quantification of average neurite length, and is thusless reliable at high densities of non-neuronal cells, suchas in cultures of differentiating P19 cells. Huang et al [13]developed a related tool, called NeuriteIQ. This tool hassimilar features to NeuriteTracer, but is reported to bemore accurate [13]. As shown in Figure 3a, the majorityof neurites of P19 cells was detected by NeuriteIQ, how-ever, using the settings available for the publicly availablesoftware package, false positive neurite segments werealso frequently encountered, leading to consistentlyhigher neurite length measurements even for undifferen-tiated cells (Figure 3b). Overall correlation between man-ual analysis and NeuriteIQ-based analysis was acceptable(see Figure 3c, Pearsons’s r: 0.987), however, computationspeed was much slower compared to NeuriteQuant (3min per image for NeuriteIQ, vs. 10 sec/image forNeuriteQuant).The Z-factor [14] is a measure for the dynamic range of
quantitative measurements and therefore often used toevaluate assay quality. A Z-factor higher than 0.5 is char-acteristic of a robust assay, an assay with Z-factor below0 is considered poor or unusable, and an intermediatevalue corresponds to a marginally useful assay. Neurite-Quant-based measurements of both undifferentiated anddifferentiated cells have a low standard deviation and thedifference between the respective means is large. Thishigh dynamic range is reflected in a high Z-factor of 0.53.The Z-factor of the measurements via the method by Wuet al. or obtained via manual analysis was slightly lowerat 0.29, due to the smaller difference in means and largerstandard deviations. In the case of NeuriteIQ-basedmeasurements, the negative controls have a very highstandard deviation and, therefore, the correspondingZ-factor is fairly low, at 0.087.Taken together, NeuriteQuant trades off accuracy for
speed as compared to the method of Wu et al. [11].
In comparison to NeuriteIQ, NeuriteQuant is bothfaster and more accurate. Importantly, in contrast toNeuriteIQ and the method by Wu et al [11], which arebased on the commercial software package MATLAB,NeuriteQuant is based on the free software tool ImageJ.In addition, NeuriteQuant offers basic analysis of neuritebranching, which is neither included in the method ofWu et al., nor part of the publically available version ofNeuriteIQ. Finally, as compared to other free solutions,NeuriteQuant is unique due to the automatically gener-ated, web-browser data review feature.In comparison to freely available tools, commercial
software solutions, such as HCA-Vision [15] can offermore detailed analysis on the basis of single cell measure-ments, and report detailed branch patterns in individualneurons. Such analysis can be beneficial for studyinglow-density cultures, in which neurite arbors are wellseparated between individual neurons. However, in denseneuronal cell populations, separation of individual cells isoften not possible even by a trained, careful, humanobserver. In such situations, the association of measure-ments with individual cells is often arbitrary and mighteven be misleading. A summary of the quantitative mea-surements we performed on high-density differentiatedP19 cells is given in Table 1.Analysis speed is of particular interest, given the
increasing availability of genome-wide libraries thatenable functional assays amenable to high throughputautomation. Therefore, as a proof of principle, we appliedour automated assay in P19 cells to a focused pilot screenusing RNA interference mediated gene knock-down [16].In this focused screen, NeuriteQuant was able to identifysiRNA oligonucleotides that in a dose dependent mannereither a) increased neurite outgrowth (as seen withknockdown of WASP family protein Wasf1), b) decreasedneurite outgrowth (as seen with knockdown of dyneinsubunit Dctn1) or c) decreased neuronal differentiation(as seen with knockdown of the small GTPase RhoA)(data not shown). These results are in agreement withearlier studies in which these isoforms or related geneswere inhibited [17-23], and thus validate NeuriteQuant’sapplication for genomic screens.
Measurement of Axon and Dendrite Outgrowth andBranching from Primary Hippocampal NeuronsNext we tested whether our analysis protocol is applicableto quantification of more complex morphology of primaryneurons. Hippocampal neurons are a well-establishedmodel system for studying neuronal development andfunction [24]. They form two functionally distinct neuritetypes, axons and dendrites, both of which display complex,branching arbors. We grew mixed neuron/glia culturesfrom rat hippocampus in plastic bottom 384-well platesand applied a series of drugs to examine how primary
Dehmelt et al. BMC Neuroscience 2011, 12:100http://www.biomedcentral.com/1471-2202/12/100
Page 7 of 13

neurons are affected by disruption of cytoskeletal compo-nents. We also applied the transcriptional inhibitor actino-mycin D to determine how assay measurements areaffected by a generally toxic compound that potentiallygenerates cell debris and dystrophic structure. To extractadditional information regarding axon and dendrite speci-fication, we double-stained neurons with antibody TuJ1,which labels both axons and dendrites, and antibody toMAP2, which specifically labels only dendrites [25].Figure 4a shows an integrative graphical representation
of multiple measurements from this small-scale com-pound screen in the form of a heatmap. Such heatmapsare displayed in the NeuriteQuant data-browser and offeran easily accessible mode to visualize, compare, and dis-play experimental results. The individual colour compo-nents in our heatmaps represent the magnitude ofcorresponding signal measurements and are displayed asnormalized shades of gray: Black represents no signal, grey(colour value 128) represents the average measurementvalue of the given plate and white (colour value 255)represents 2x average of the given plate. The shades ofgrey from three quantitative measurements are then com-bined as colour components red, green, and blue into eachheatmap cell. In this example, each of the two heatmapsdisplay measurements of total neurite length in red, totalneuronal cell body area in green and the mean markerintensity in blue - either measured via the dendrite markerMAP2 or via the total neurite marker TuJ1.A dose-dependent stimulatory effect of cytochalasin D
on dendrite outgrowth, which is consistent with an earlierreport [26] is clearly visualized in the heatmap for dendritemeasurements as a change in the colour component ratiofrom green towards red (Figure 4a). This change in colourcomponent ratio is not seen in the heatmap for measure-ments of axons and dendrites. Figure 4c shows that exten-sive dose response curves with small error bars can begenerated from these measurements - a feature that isessential for HCS, and that would be laborious withmanual methods.In agreement with previous studies [27,28], we also
detected a dose dependent decrease in branch densitywith taxol (not shown) and an increase in neurite branchdensity with intermediate concentrations (61-185 nM) of
nocodazole (Figure 5). Manual counting of branch pointsusing the cell counter tool of ImageJ and NeuriteQuantanalysis both detect an approximately two-fold increase inbranch density after treatment with 185 nM nocodazole(manual counting, control = 0.0094 ± 0.0009 branches/pixel; manual counting, 185 nM nocodazole = 0.0202 ±0.0033 branches/pixel; NeuriteQuant, control = 0.0200 ±0.0019 branches/pixel; NeuriteQuant, 185 nM nocodazole= 0.0351 ± 0.0045 branches/pixel; n = 3 images per condi-tion; only branches were counted and neurite crossingswere ignored in manual analysis). Although NeuriteQuantanalysis consistently detects a higher total number ofbranches, automated measurements were reproducible asseen by the small error bars (Figure 5b) and thereforeNeuriteQuant is able to detect overall changes in branchdensity on a per field basis. Correlation between manualcounting and automated analysis was weaker (Pearsons’s r:0.8405) compared to the simpler neurite length analysis,but it was nevertheless statistically significant (p = 0.036).The higher number of branches detected by NeuriteQuantis mostly due to interrupted neurite segments, which giverise to false positive branch detection, as well as dimbranches that are easily missed in manual analysis. At highconcentrations of nocodazole or actinomycin D, quantifi-cation of branch density was not accurate, as overall cellviability and neurite outgrowth declined drastically, givingrise to many detected neurite fragments, which were dis-connected from detected cell bodies. The complete, auto-matically generated browser for this dataset, which can benavigated via several interactive heatmap variants andinteractive 2D-plots, is available on the NeuriteQuantwebsite [5].Finally, we tested whether NeuriteQuant was compati-
ble with analysis of neurons in brain sections. Figure 6shows automated analysis of an inverted image of aGolgi-stained section from mouse cortex. Most neuronalcell bodies and neurites were reliably detected, despitethe relatively large variation in background stainingwithin these sections.
Limitations of NeuriteQuantIn the design of NeuriteQuant, our aim was not to build atool that corrects all potential problems that might occur
Table 1 Summary of comparison to manual analysis and existing software
manual analysis NeuriteQuant Wu et al. NeuriteIQ
correlation to manual analysis (Pearson’s r) N/A 0.990 0.998 0.987
Z-factor 0.29 0.53 0.29 0.087
analysis time (one 1k × 1k image) >1 h 10 sec1 8 sec2 40 sec2 3 min1
software requirements ImageJ (free) NeuronJ(free)
ImageJ (free) MATLAB (commercial) MATLAB (commercial)
availability free free, open-source
upon request toauthor
compiled program availableonline
1: 32-bit WindowsXP on low-level Pentium notebook. 2: 64-bit Windows 7 on intermediate-level quad-core desktop.
Dehmelt et al. BMC Neuroscience 2011, 12:100http://www.biomedcentral.com/1471-2202/12/100
Page 8 of 13

during data acquisition. We rather aimed for a simple,straightforward implementation that offers robust and fastanalyses. Due to this simplicity, NeuriteQuant has clearlydefined limitations that need to be kept in mind concern-ing the interpretation of measurements:1) Image analysis is optimal at high signal-to-noise
levels, which enable detection of weak neurite structuresby setting low detection thresholds. Therefore, markersthat are highly expressed in neurons, such as the neuro-nal bIII tubulin isoform (antibody TuJ1) or the dendriticmarker MAP2 are preferable. Measurements via markersthat stain neurites barely above noise levels are lessaccurate and in such suboptimal conditions, weakerneurite structures might be excluded from analysis bythe thresholding procedure.
2) At high cell densities, if neuronal cell bodies are notseparated from each other, the neuronal cell body num-ber can only be estimated by dividing the total neuronalcell body area by a user-defined reference size of typicalneuronal cell bodies. In extreme cases (for example, ifunusually large cell aggregates are encountered) thisestimation may become inaccurate. NeuriteQuant alsocannot distinguish individual neurites within fasciculatedbundles and reports only on the length of apparentneurite structures, whether they are made of a single ormultiple, bundled neurites.3) More complex morphometric measurements, which
are derived from and/or dependent on the ratios of mul-tiple primary morphological measurements, such as theaverage branch density, are less accurate if only few
Figure 4 Measurement of axonal and dendritic outgrowth from primary neurons. Dissociated hippocampal neurons were cultured in 384-well plates and incubated with the indicated compounds for 3 days, starting one day after plating. a) Heatmaps were automatically generatedby NeuriteQuant to summarize the main measurements: neurite length (red), neuronal cell body area (green) and mean neuronal marker signalintensity (blue). The left heatmap shows these measurements for dendrites only, detected using MAP2, and the right heatmap shows thecorresponding measurements for total neurites (axons plus dendrites) using the general neurite marker TuJ1. The shift in colour hue from greento red with increasing cytochalasin D concentrations in the left heatmap indicates a dose-dependent shift in the ratio between neurite lengthand neuronal cell body area. b) Representative automatically acquired images of neurons incubated with either vehicle (DMSO) or cytochalasin Dprior to staining with TuJ1 (axons plus dendrites; red) and MAP2 (dendrites only, green); yellow indicates regions of overlap in the mergedimage. c) Quantitative analysis of cytochalasin D dose response curves demonstrates a >50% increase in the normalized neurite length (the ratioof total neurite length to total neuronal cell body area per field), as based on the dendritic marker MAP2. In contrast, analysis based on thegeneral neurite marker TuJ1 shows a slightly opposite trend, because axon length decreased in response to cytochalasin D (not shown).Corresponding amounts of vehicle had no significant effect on neuronal morphology as detected using either marker. Data represent mean ±standard error of 9 image fields from three independent repetitions per condition.
Dehmelt et al. BMC Neuroscience 2011, 12:100http://www.biomedcentral.com/1471-2202/12/100
Page 9 of 13

Figure 5 Measurement of axonal and dendritic branch density from primary hippocampal neurons. Neurons were treated with vehicle(DMSO), or nocodazole for three days starting one day after plating. Neurons were stained with the neuronal marker TuJ1. To quantify theaverage density of neurite branches, the following formula was used: (neurite cell body attachment points - neurite endpoints)/neurite length. a)Representative images and analysis traces of control and treated neurons show decreased neurite length and increased branch density in thepresence of nocodazole. b) Quantification of nocodazole titration shows a dose-dependent decrease in total neurite length but an increase inbranch density of TuJ1-positive neurites. In our experimental regime, we detected increases in neurite branching at concentrations between 61-185 nM. Measurements from higher concentrations were not included in our analysis, as cell viability and neurite outgrowth decreaseddrastically, and measurement artefacts from cell debris prevented reliable determination of branch density.
Dehmelt et al. BMC Neuroscience 2011, 12:100http://www.biomedcentral.com/1471-2202/12/100
Page 10 of 13

cells or few, small neurite fragments are analyzed perfield. For example, if cell viability and neurite outgrowthis drastically reduced, any falsely identified neurite seg-ment that is disconnected from a neuronal cell bodygives rise to false positive detection of neuronalbranches and can therefore strongly influence the mea-surement of neuronal branch density, as seen in primaryhippocampal neurons treated with high doses (>185nM) of nocodazole. It is therefore imperative that suchcomplex measurements are always interpreted in thecontext of successful and reliable primary measure-ments, and verified carefully by the user via the web-based data browser.It should be noted that many conditions that are not
readily quantified by the existing NeuriteQuant softwarecan nonetheless be identified on the basis of primarymeasurements. Uninterpretable images could then eitherbe excluded, or analysis settings could be refined toextract biologically useful information. For example, large
cell aggregates can be detected by measuring the averagecell size. By setting an appropriate threshold, such poten-tially misleading images could be identified. Subsequentlythey could be removed if deemed an artefact, or, if theyare of interest to the user, NeuriteQuant based proces-sing could be used to capture such features for quantita-tive analysis.
Ongoing DevelopmentNeuriteQuant is implemented as an ImageJ macro, andtherefore easily accessible for extension. Updates to theNeuriteQuant tool will be made available on the Neurite-Quant website [3]. The current version already supportsimport of large, complex datasets produced by automatedscreening microscopes. For example, import routines todirectly access images produced by the ScanR system(Olympus, Hamburg) or custom journals implemented inthe microscopy control software Metamorph (MolecularDevices, Inc.) are implemented in the current version of
Figure 6 Analysis of neuronal morphology in Golgi-stained mouse brain sections. Wild-type P26 mouse brains were stained usingmodified Golgi-Cox impregnation (FD NeuroTechnologies). NeuriteQuant is able to extract most features in images of silver-stained neurons thatdisplay a clearly defined soma and dendritic arbor (see enlarged region). During sectioning, neurites are often separated from their parent cell,therefore branching was not evaluated.
Dehmelt et al. BMC Neuroscience 2011, 12:100http://www.biomedcentral.com/1471-2202/12/100
Page 11 of 13
NeuriteQuant. Due to its open-source implementation, theNeuriteQuant image analysis pipeline can be adapted toany well-defined naming convention and it can use anyinput format that is supported by ImageJ. Similarly, furtherimage pre-processing can be performed, or additionalmorphological features can be analysed by combining thestreamlined image and data management aspects of theNeuriteQuant toolset with the varied and extendable cap-abilities of ImageJ. Thereby, NeuriteQuant not only repre-sents a framework for the specialized morphometricanalysis of neuronal development as shown here, but alsoprovides a valuable starting point for development ofother morphometric analyses. Detailed instructions for themodification and extension of NeuriteQuant are given inthe NeuriteQuant script file.
ConclusionsIn conclusion, we offer NeuriteQuant as a free, open-source toolkit for rapid analysis of neuronal morphology.NeuriteQuant measurements provide a meaningful char-acterization of neuronal morphology and they can beused to identify a wide range of morphological changeswith high sensitivity. By explicitly focusing on a “per-field” analysis strategy, our method avoids ambiguities indefining single neurons and their respective neuronalarbors within a dense population of neurons, which is atypical situation for many neuronal culture systems.NeuriteQuant is especially effective in deducing neuronalparameters from relatively low-resolution images (10x)and is thus able to rapidly quantify neuronal morphologyfrom large neuronal populations. We anticipate thatNeuriteQuant will facilitate the discovery of new path-ways and molecular targets in neuronal development andregeneration.
Availability and requirementsProject nameNeuriteQuant
Project home pagehttp://www.chemie.uni-dortmund.de/groups/CB/bas-tiaens/dehmelt/NeuriteQuant/
Operating system(s)Windows/PC, MacOS
Programming languageJava/ImageJ script
Other requirementsImageJ 1.38 or higher (see documentation for details)
LicenseGNU GPL
Any restrictions to use by non-academicsGNU GPL (no additional restrictions)
Additional material
Additional file 1: Text file containing a summary of the imageprocessing algorithm and Experimental Procedures.
Acknowledgements and FundingWe thank Julia Braga and Barbara Calabrese (UCSD) for assistance withcultured primary hippocampal neurons, and Kathryn Spencer (TSRI, La Jolla)for expert microscopy assistance, Anthony Frankfurter (University of Virginia)for generously providing purified antibody TuJ1 against bIII-tubulin, ClaudiaBarros (Bangor University) and Ulrich Müller (TSRI, La Jolla) for supplyingimages of Golgi-stained brain sections, Pengyu Hong (Brandeis University)for generously performing quantitative analysis according to the method byWu et al and Tomas Mazel and Abram Calderon (MPI Dortmund) forassistance in automated data analysis. This work was supported in part by U.S. National Institutes of Health grants MH50861 and NS70297 to S.H. and theFORSYS partner initiative of the German Federal Ministry of Education andResearch (BMBF, grant 0315258) to L.D.
Author details1Max-Planck-Institute of Molecular Physiology, Otto-Hahn-Str. 11, 44227Dortmund, Germany and Dortmund University of Technology, Otto-Hahn-Str.6, 44227, Dortmund, Germany. 2Division of Biological Sciences, University ofCalifornia, San Diego, La Jolla, CA 92093, USA. 3Department of BiologicalScience and Technology, National Chiao Tung University, Hsinchu, Taiwan30068.
Authors’ contributionsSH supervised the study. LD and SH designed and interpreted experimentsand wrote the manuscript. LD conceived the analysis strategy; LD, GP, andEH performed experiments and analyzed data. All authors have read andapproved the final manuscript.
Received: 8 December 2010 Accepted: 11 October 2011Published: 11 October 2011
References1. Narro ML, Yang F, Kraft R, Wenk C, Efrat A, Restifo LL: NeuronMetrics:
software for semi-automated processing of cultured neuron images.Brain Res 2007, 1138:57-75.
2. Meijering E, Jacob M, Sarria JC, Steiner P, Hirling H, Unser M: Design andvalidation of a tool for neurite tracing and analysis in fluorescencemicroscopy images. Cytometry A 2004, 58:167-176.
3. NeuriteQuant website. [http://www.chemie.uni-dortmund.de/groups/CB/bastiaens/dehmelt/NeuriteQuant/].
4. ImageJ macro language documentation. [http://rsb.info.nih.gov/ij/developer/macro/macros.html].
5. NeuriteQuant example database. [http://www.chemie.uni-dortmund.de/groups/CB/bastiaens/dehmelt/NeuriteQuant/hippocampal_drug_screen/screen.html].
6. NeuriteQuant Documentation. [http://www.chemie.uni-dortmund.de/groups/CB/bastiaens/dehmelt/NeuriteQuant/instructions.doc].
7. NeuriteQuant example database - Effect of drugs on neurites of primaryhippocampal neurons. [http://www.chemie.uni-dortmund.de/groups/CB/bastiaens/dehmelt/NeuriteQuant/hippocampal_drug_screen/5a-norm-2plot.html].
8. Gottlieb DI: Large-scale sources of neural stem cells. Annu Rev Neurosci2002, 25:381-407.
9. Farah MH, Olson JM, Sucic HB, Hume RI, Tapscott SJ, Turner DL: Generationof neurons by transient expression of neural bHLH proteins inmammalian cells. Development 2000, 127:693-702.
10. Marusich MF, Furneaux HM, Henion PD, Weston JA: Hu neuronal proteinsare expressed in proliferating neurogenic cells. J Neurobiol 1994,25:143-155.
Dehmelt et al. BMC Neuroscience 2011, 12:100http://www.biomedcentral.com/1471-2202/12/100
Page 12 of 13

11. Wu C, Schulte J, Sepp KJ, Littleton JT, Hong P: Automatic robust neuritedetection and morphological analysis of neuronal cell cultures in high-content screening. Neuroinformatics 2010, 8:83-100.
12. Pool M, Thiemann J, Bar-Or A, Fournier AE: NeuriteTracer: a novel ImageJplugin for automated quantification of neurite outgrowth. J NeurosciMethods 2008, 168:134-139.
13. Huang Y, Zhou X, Miao B, Lipinski M, Zhang Y, Li F, Degterev A, Yuan J,Hu G, Wong ST: A computational framework for studying neuronmorphology from in vitro high content neuron-based screening. JNeurosci Methods 2010, 190:299-309.
14. Zhang JH, Chung TD, Oldenburg KR: A Simple Statistical Parameter forUse in Evaluation and Validation of High Throughput Screening Assays.J Biomol Screen 1999, 4:67-73.
15. Wang D, Lagerstrom R, Sun C, Bishof L, Valotton P, Gotte M: HCA-vision:Automated neurite outgrowth analysis. J Biomol Screen 2010,15:1165-1170.
16. Yu JY, DeRuiter SL, Turner DL: RNA interference by expression of short-interfering RNAs and hairpin RNAs in mammalian cells. Proc Natl Acad SciUSA 2002, 99:6047-6052.
17. Laplante I, Beliveau R, Paquin J: RhoA/ROCK and Cdc42 regulate cell-cellcontact and N-cadherin protein level during neurodetermination of P19embryonal stem cells. J Neurobiol 2004, 60:289-307.
18. Ahmad FJ, He Y, Myers KA, Hasaka TP, Francis F, Black MM, Baas PW: Effectsof dynactin disruption and dynein depletion on axonal microtubules.Traffic 2006, 7:524-537.
19. Dehmelt L, Nalbant P, Steffen W, Halpain S: A microtubule-based, dynein-dependent force induces local cell protrusions: Implications for neuriteinitiation. Brain Cell Biol 2006, 35:39-56.
20. Tahirovic S, Hellal F, Neukirchen D, Hindges R, Garvalov BK, Flynn KC,Stradal TE, Chrostek-Grashoff A, Brakebusch C, Bradke F: Rac1 regulatesneuronal polarization through the WAVE complex. J Neurosci 2010,30:6930-6943.
21. Dahl JP, Wang-Dunlop J, Gonzales C, Goad ME, Mark RJ, Kwak SP:Characterization of the WAVE1 knock-out mouse: implications for CNSdevelopment. J Neurosci 2003, 23:3343-3352.
22. Strasser GA, Rahim NA, VanderWaal KE, Gertler FB, Lanier LM: Arp2/3 is anegative regulator of growth cone translocation. Neuron 2004, 43:81-94.
23. Korobova F, Svitkina T: Arp2/3 complex is important for filopodiaformation, growth cone motility, and neuritogenesis in neuronal cells.Mol Biol Cell 2008, 19:1561-1574.
24. Goslin K, Banker G: Rat Hippocampal Neurons in Low-Density Culture. InCulturing Nerve Cells.. 2 edition. Edited by: Banker G, Goslin K. Cambridge:MIT Press; 1991:207-226.
25. Huber G, Matus A: Differences in the cellular distributions of twomicrotubule-associated proteins, MAP1 and MAP2, in rat brain. J Neurosci1984, 4:151-160.
26. Bradke F, Dotti CG: Differentiated neurons retain the capacity to generateaxons from dendrites. Curr Biol 2000, 10:1467-1470.
27. Letourneau PC, Shattuck TA, Ressler AH: Branching of sensory andsympathetic neurites in vitro is inhibited by treatment with taxol. JNeurosci 1986, 6:1912-1917.
28. Gallo G, Letourneau PC: Different contributions of microtubule dynamicsand transport to the growth of axons and collateral sprouts. J Neurosci1999, 19:3860-3873.
doi:10.1186/1471-2202-12-100Cite this article as: Dehmelt et al.: NeuriteQuant: An open source toolkitfor high content screens of neuronal Morphogenesis. BMC Neuroscience2011 12:100. Submit your next manuscript to BioMed Central
and take full advantage of:
• Convenient online submission
• Thorough peer review
• No space constraints or color figure charges
• Immediate publication on acceptance
• Inclusion in PubMed, CAS, Scopus and Google Scholar
• Research which is freely available for redistribution
Submit your manuscript at www.biomedcentral.com/submit
Dehmelt et al. BMC Neuroscience 2011, 12:100http://www.biomedcentral.com/1471-2202/12/100
Page 13 of 13