new orleans sewerage and water board - legislative auditor
TRANSCRIPT

3D^^
Sewerage and Water Board OF NEW ORLEANS, LOUISIANA
f? r i i i i i i i
Under provisions of state law, this report is a oublic
the entity and other appropriate public officials ThP report IS available for public inspection at the L on Rouge Office of the Legislative A u S r a ' d S e appropnate, at the office of the pansh clerk of^uf t
Release Date J ^ N 0 5 2013
COMPREHENSIVE ANNUAL FINANCIAL REPORT
FOR THE YEAR ENDED DECEMBER 31. 2012

Aboul The Cover
The Facility Maintenance Department fabricates, in-house, gears oJ various diiT-cnsions and specifications to accommodate the many different size valves thai are used throughout the water and sewer systems. Valves are used to Isolate leaks or reroute water or sewage while repairs are being done to the piping system. The fabricated set ot gears are mounted on the exterior of a valve to aid operation of the valve. The small gear driving the large gear provides a torque ratio that enables the valve to be opened or closed using different means, such as a hand wheel or an electric or hydraulic automatic valve machine like those mounted on the Board's valve trucks. The staff fabricates many parLs no longer manufactured or too expensive to out-sourcc.
SEWERAGE AND WATER BOARD OF NEW ORLEANS
Comprehensive Annual Financial Report For The Year Ended December 31,2012
Prepared by: Finance Administration
Ethel H. Williams Finance Administrator

Mission, Vision, and Values
Our mission is to provide safe drinking water to everyone in New Orleans; to remove waste water for safe return to the envh^onment; to
drain away storm water; to provide water for fire protection; to provide mformation about products and services; and to do all of this
continuously at a reasonable cost to the community.
Our vision is to have the trust and confidence of our customers for reliable and sustainable water services.
We believe in these values as the foundation for how we will perform our mission and pursue our vision:
• We will focus on our customers and stakeholders. • We will treat each customer and employee with dignity and
respect. • We will value each employee, their work, and then: commitment. • We will be truthful, trustworthy and transparent. • We will be knowledgeable and diligent m the performance of our
duties. • We will use financial resources prudently. • We will be accountable for our performance. • We will continuously improve our performance. • We will ensure that the systems that provide our services remain
viable for future generations. • We will remain on the job and will be prepared for storms and
other risks.

S E W E R A G E AND W A T E R BOARD O F N E W ORLEANS
Comprehensive Annual Financial Report Year ended December 31 j 2012
TABLE OF CONTENTS
l . INTRODUCTORY SELECTION
Transmittal Letter
Graph
Certificate of Achievement for Excellence in Financial Report
OfTicers of the Sewerage and Water Board of New Orleans
Members of Sewerage and Water Board of New Orleans
Committees of the Sewerage and Water Board of New Orleans
Organizational Chart Division Heads of Deputy Direaor Division Heads of General Superintendent
PAGEfSl
I-l-
l-ll
1-12
1-13
1-14
I-IS
1-16 1-17 1-18
n . FINANCUL SECTION
Independent Auditors' Report
Management's Discussion and Analysis Required Suppiementaty Information)
Basic Financial Statements: Government- Wide Financial Statements - Enterprise Fund:
Statements of Net Position Statements of Revenues, BKpenses and Changes in Net Position Statements of Cash Flows
Fund Financial Statements - Fiduciary Fund Statements of Net Position - Pension Trust Statements of Changes in Plan Net Position - Pension Trust Fund
Notes to Financial Statements
Required Supplementaty Information under GASH Statement No. 25 GASB Statement No. 45
Supplementary Information: Net Assets by Department
Enterprise Fund - Schedule 1
Revenues, Expenses, and Changes in Net Assets by Department Enterprise Fund - Schedule 2
Schedule of Property, Plant, and Equipment in Service by Department Schedule 3
Schedule of Bonds Payable Schedule 4
Supplementar>' Information (continued): Schedule of Cash Receipts and Disbursements -Debt Service and Debt Service Reserve Required by Bond Resolution Schedule S
Schedule of Changes in Self-Insurance Liabilities by Department Schedule 6
U-1
U-4
IMS n-20 11-21
11-23 11-24
U-2S
11-62 11-63
11-64
11-66
11-67
U-68
11-69
U-70

SEWERAGE AND WATER BOARD OF NEW ORLEANS
Comprehensive Annual Financial Report Year ended December 31,2012
TABLE OF CONTENTS
m . STATISICAL INFORMATION (UNAUDITED) PAGEfS>
This part of the Board's comprehensive annual fmancial report presents detailed information as a context for understanding what the information in the financial statements, note disclosures, and required supplementary information says about the Board's overall fmancial health.
' Summary of Statistical Information IU-0
Financial Trends These schedules contain trend information t o help the reader understand how the Board's fmancial performance and well-being have changed over time.
Net Assets by Component - Last Ten Years Ill-l
Changes in Net Assets by Component - Last Ten Fiscal Years 111-2
Revenues and Expenses by Source - Enterprise Fund Last Ten Fiscal Years ni-3
Revenue Capacity These schedules contain information to help the reader assess the Board's most significant local revenue source, the property tax.
Assessed and Estimated Actual Vahie of Taxable Property -Last Ten Fiscal Years III-4
Property Tax Rates - Direct and Overlapping Governments
Number of Mills - Last Ten Years 1II-5
Ten Largest Taxpayers - De::ember 31,2012 and Nine Years Ago III-6
Property Tax Levies and Collections by the City of New Orleans Last Ten Fiscal Years II1-7
Water and Sewer Rates - Last Six Fiscal Years 111-8
Debt Capacity Tftese schedules present information to help the reader assess the qffbrdability of the Board's current levels of understanding debt and ike Board's ability to issue additional debt in the future.
Ratio of Outstanding Debt by Type - Last Six Fiscal Years 111-9
Computation of Direct and Overlapping Debt - December 31,2012 III-10
Revenue Bonds Debt Service Coverage: Water Bonds - Last Ten Fiscal Years HI-11 Sewer Bonds - Last Ten Fiscal Years HI-]2
Demographic and Economic Information These schedules offer detnographic and economic indicators to help the reader
understand the environment within which the Board's financial activities take place.
Demographic Statistics - Last Five Fiscal Years 111-13 New Orleans Area Principal Employers (Non-Public) -
Last Ten Fiscal Years III-14

S E W E R A G E A N D W A T E R B O A R D O F N E W O R L E A N S
Comprehensive Annual Financial Report Year ended December 31,2012
T A B L E O F CONTENTS
I I I . S T A T I S I C A L I N T O R M A T I O N ( U N A U D I T E D ) (cont inued) P A G E ( S )
Operating Infonnation These schedules contain service and infrastructure data to help the reader understand how the information in the Board's financial report relates to the services the Boa-dprovides and the activities it performs.
Capital Expenditures by Department - Enterprise Fund Last Ten Fiscal Years in-15
Schedule of Fimire Debt Payments: Water in-16 Sewer III-] 7 Drainage 111-18 Total 111-19
Property Value, New Construction and Bank Deposits
Last Ten Fiscal Years III-20
Capital Asset Statistics by Function ~ Last Six Fiscal Years 01-21
Active Government Employees - Last Five Fiscal Years in-22
IV. SUPPLEMENTAL INFORMATION (UNAUDITED) PAGEfS^ 2012 Actual Capital Expenditures-Water Department IV-1
2012 Actual Capitsd Expendion-es - Sewerage Depaitment IV-2
2012 Acmal Capital Expenditures - Drainage Department IV-3
2012 Actual Capital Expenditures - Power Projects IV-4
2012 Actual Capital Expenditures - General Budget Items IV-S
Analysis of Pumping and Power Department
Power Purchased and Produced - 2002 through 2012 IV-6
Pumping and Power Departoient - 2012 rV-7
Water Pumped and Consumed - 2012 IV-8
Gallons Metered - Pay Water Consumption - 2012 rV-9
MonUily Water and Sewerage Rate Collections-2012 lV-10
Table of Water Purification Operations and Table of Water and Sewerage Distribution System FV-l I thru IV-33
Table of Rainfall in New Orieans - Last Ten Years IV-34
Benchmarking IV-35
Ui
(This page intentionally left blank)

New Orleans' ordy source of potable water is the Mighty Miseissippi River. Raw v/atcr is brought into bA'O treatment plants by four intakes like the one sho\vn here, The infcikes are protected from ships and barges by concrete barriers and wooden pilings. The water is then treated via a complex punficalion process at the Currollton Water Purification Plant for East Bank customers and at the .Algiers Water Treatment Plant for West Bank customers.
In 2012. the Carrollton Plant provided an average of 138 million gallons of drinking water per day to a population estimated to be about 304 474 people. The Algiers Water Plant provided an average of 11 nnillion gallons to a population tetimated to be about 53,578 people. The toeatmcnt process at each plant is similar. The Sewerage and Water Board takes great pride in providing the citizens of New Orleans vWth a constant supply of high quality drinking water.
Tne men and women of the Board are at work 24 hours a day, seven days a week to produce the ivatcr and distribute it through 2.000 miles of pipes, mains aiid 143,6(W service connections. Tlie water is also carried at high pressure to approximately 17,000 fire nydrants for fire-fighting purposes.
Above Ground Tunnel? Actually, it s vieiv of the inside of a 60-inch corrugated pipe used as a temporary drain line to move storm water around areas where nev; box canals are being built- In thj^ case, ne.ir Monticello Avenue at South OaibomcXvenue. The work consists of constructing approximately 2^0 linear feet of single-barreled reinforced concrete canal under the median along Soulli Claiborne Avenue from Monticello Avenue to Leonidas Street. The new canal will parallel an existing canal and lie in to the existing Monticello Canal. Cost is $27.1 million and the completion date is mid-2014. The pro;ed is pari of SELA, a cooperative agreement between the S&WB and the US. .Army Corps of Engineers.
I N T R O D U C T 0 R Y
S E C T I 0 N

'RB'BUILDING THE CnVS WATER SYSTEMS FOR THE 21^' CENTURY"
Sewerage & Water Board OF NEW ORLEANS * ^ 625 ST. JOSEPH STfi£EJ
MITVHea J. WWOWEW. t ^ M e n t NBVORLEANS. LA 70165 . SM-SJMMT OR S3W-AJER WU. RAVMOVD tMNNim. Pnshtent Pro-Ttm imm.swbnola.org
May 9,2013
TO: THE HONORABLE PRESIDENT AND MEMBERS OF THE SEWERAGE AND WATER BOARD OF NEW ORLEANS
We are pleased to present the Comprehensive Annual Financial Report of the Sewerage and Water Board of New Orleans for the year ended December 31, 2012. Responsibility for both the accuracy of the data and the completeness and fairness of the presentation, including all disclosures, rest solely with the Sewerage and Water Board. It is our belief that the data, as presented, is accurate in all material aspects and is presented in a manner designed to fairly set forth the rinancial position, results of operations, and cash flows of the Board's Enterprise and Pension Trust Funds. All disclosures necessary to enable the reader to gain an understanding of the Sewerage and Water Board's fmancial activities have been included.
COMPREHENSIVE ANNUAL FINANCIAL REPORT SECTIONS
The Comprehensive Annual Financial Report is presented in four (4) major sections: Introductory, Financial, Statistical and Supplemental. The Introductory Section includes the transmittal letter and listings of the officers, members and committees of the Board of Directors. This section also includes the Board's organizational chart and a reproduction of the 2011 Certificate of Achievement for Excellence in Financial Reporting awarded by the Government Finance Officers Association. The Financial Section includes the independent auditors' report, along with the basic financial statements, required supplementary information, accompanying notes and other supplementary information. The individual fund statements for the Enterprise and Pension Trust Funds are included. Required supplementary includes management's discussion and analysis and a schedule of pension funding progress and contributions. The Statistical Section includes selected fmancial and demographic information, generally in a multi-year presentation. Additional infonnation relative to the Sewerage and Water Board's operations is included in a Supplemental Section.
The independent audit of tlie financial statements of the Sewerage and Water Board was part of a broader, federally mandated "Single Audit" designed to meet the special needs of federal grantor agencies. The standards governing single Audit engagements require the independent auditor to report not only on the fair presentation of the fmancial statements, but also on the audited government's internal controls and compliance with legal requirements, with special emphasis on internal controls and legal requirements involving the administration of federal awards. These reports ai« available in the Sewerage and Water Board's separately issued Single Audit Report.
The Sewerage and Water Board meets the criteria for classification as an "other stand-alone government" as described in Governmental Accounting Standards Board Statement No. 14. The reporting entity includes the Enterprise Fund and the Pension Trust Fund. The Enterprise Fund is composed of three (3) independent systems: Water, Sewerage and Drainage.
I-l McitOars of Hv Bo8fC: MAHIONBRACy . STfiCYHeAO' KBRRIKANE. WU. flAYMOND MANNI\G > UARKU.^OODY • tAnCHBU J. LANORISU
KRlSTllV G. PALVEP. . GiefJPIUE ' PLQflENCe W. SCHZIftNSTEIN 'CHAfiL^S l=. WEBB ' BEVERLy WRiG^T, t ^O . LGYCEP WRIGrTT 'An Equal Onpiitariilf Empisye'"

GAAP require that management provide a narrative introduction, over\'iew, and analysis to accompany the basic financial swtements in the form of Management's Discussion and Analysis (MD&A). TItis letter of transmittal is designed to complement MD&A and should be read in conjunction with it. The Sewerage and Water Board's MD&A can be found immediately following the report of the independent auditors.
PROFILE OF THE SEWERAGE AND WATER BOARD OF NEW ORLEANS
Sewerage and Water Board of New Orleans is a political subdivision created in 1899 by Louisiana State Statutes. The Board is charged with construction, operation, and maintenance of Water, Sewerage and Drainage Systems for the City of New Orieans. By agreement, approximately 2,550 acres of adjourning Jefferson Parish is served by the Board's drainage facilities for which Jefferson Parish pays its pro rata share of expenses. In addition, the Board provides sewerage services to Jefferson Parish businesses the majority of which are restaurants located in the West End neighborhood near the Lakefront. Additionally, the Board provides water and sewerage services to the Plaquemines Parish Industrial Park. The Sewerage and Water Board was established as a "special board" operating independently of city government. The Mayor of New Orleans serves as the President of the Board of Directors which is composed of three (3) representatives of the City Council, two (2) representatives of the Board of Liquidation, City Debt and seven (7) appointees as designated by the State statutes.
ECONOMIC CONDITION AND OUTLOOK
The Board's ser\'ice area includes the Civil Parish of Orleans in the state of Louisiana and covers 364 square miles. Based on the 2010 census, the population of Orleans Parish was 369,250. Major industries include tourism, oil and gas, transportation, health and other services, such as legal, education and entertaiiunent.
According to the December 2012 issue of tlie Metropolitan Report. Economic Indicators for the New Orleans Area (UNO Report) total employment increased slightly by 0.4% or by approximately 2,000 jobs y6ar-to-date. Substantial job. losses in some industries, such as construction, manufacturing of transportation equipment, and retail trade, were offset by employment gains in other industries, such as leisure and hospitality, educational services, and profession^ and business services. While the overall employment gains in New Orleans were down from the second quarter in 2012 (-0.7%), the gradual upward trend from the first months offset the losses during the most recent months.
Employment gro\vth in the New Orleans area for tlie next two years parallels tliat of the nation. By the end of 2014, the area will have approximately 527,000 jobs, reaching figures seen in 2008, according to the UNO report (See Figure I).
T o t a l iMeMr O r l e a n s IWISA Ennploy i rnQnt |TlkOU««l>M<S o f J o b s )
FIGlfRE I
1-2

Year to Date Total employment in the area grew by nearly 2,000 jobs or 0.4% compared to last year. Industries with the strongest employment gains in New Orleans year-to-date include leisure and hospitality, private educational services, and professional and business services.
Employment increased by about 3,500 jobs or 5% in the leisure and hospitalitj' industry over last year, with nearly 3,200 new jobs added in the food services and drinking places sector, and nearly 2.100 or 11% new jobs were added across the area. In the professional and business services industry, abut 1,600 jobs (2%) were added over the past year, where the highest increase occurred with'm the professional and technical services (700 jobs) and management of companies (500 jobs).
Other industries experienced moderate growth in the New Orleans area over the past year. In health care and social assistance, an increase of 2% brought over 1,000 to area hospitals and ambulatory health care.
Unemployment The unemployment rate in the New Orleans area has decreased slightly to 7.4%. Like the downward trend in continued unemployment claims throughout tlie U.S., year-to-date claims in New Orleans over the year have substantially decreased (-19%), per the UNO report.
According to the report, local initial unemployment claims increased by 36% over the same quarter last year due to the effects of Hurricane Isaac. Continued unemployment claims, an indicator which is less volatile, decreased by 21% over the same time period. The decrease in unemployment rate and reduction of continued imemploj'ment claims may indicate that some people are exiting the labor force as job grovvth remains low in (he area. Despite some increases over the past year, the unemployment rate in New Orleans metro area has consistently remained below the national average since after Katrina (See Figure 2).
Unemplovnieflt iut« (%)
FIGURE 2
1 1~ I w — i - 1 T ^ T 1 1—1 ^ n — I 1 I—x^-—r 1 —
Oil and Gas Production Production of oil and natural gas in Louisiana provides a number of jobs for residents of the New Orleans area and generates revenues that benefit the local economy. Year-to-date oil production increased by 4%, while it decreased by 2% over the last quarter. Oil production has been gradually trending upwawi since a recession-related drop in 2008. Current oil production is at about 80% of the production level obser\'ed prior to Katrina, according to the report.
Construction The New Orleans MSA construction industry has been driven primarily by non-residential and non-building contracts since 2007. Year 2012 was no different than prior years. In 2007, non-residential construction activity, which includes the construction of commercial buildings and refineries, dominated the local construction market due to a large expansion at Bayou Steel in St. John parish. From 2008 through 2010, non-building construction, such as roads, bridges and flood control projects, generated
1-3

higher-valued contracts than other types of construction activity, in 2011, non-re.sidcntiaI contracts represented a higher share of the market due to high-budget projects such a.s the expansion of the Valero oil refinery in St. Charles parish For 2012, contract awards have increased in the non-building category, which was up about 23% over 2011. The increase in non-building construction in the New Orleans metropolitan area was primarily driven by projects such as the expansion of the Muey P, Long Bridge ($1.2 billion), and extensive repairs of streets in New Orleans.
Both non-residential and residential conu-act awards were down 31% and 7%, respectively from 2011. Despite this decrease, it should be noted that the level of residential and non-residential projects was still high compared to the construction levels present from 2008 to 2010. Some important non-residential projects in 2012 were the opening of new public schools in the metro area ($1.8 billion), rebuilding of public housing, and reconstruction of the University .Medical Center {1,09 billion). Other non-residential projects were the construction of the Veterans Affairs Hospital, expansion of the National WWII Museum and that of the Port of New Orleans.
Tourism During the first half of 2012, llio New Orleans tourism industry continued to attract more visitors than the previous year, a trend that has persisted since 2007. About 4.94 million visitors came to the New Orleans area in half year 2012, marking a 2% increase over the 4.84 million visitors who came during the same period in 2011. Spending estimates were up 11% over last year's figures, an increase from $3,11 billion lo $3,45 billion, according to the UNO Report.
Greater visitor spending in the New Orleans metropolitan area lesults in additional tourism-related employment opportunities for loca' residents. Between 2006 and 2011, roughly 15,000 tourism-related jobs were added. Year-to-datc 2012, another 3,000 jobs were generated in the local tourism industry. In first three quarters of 2012, hotel sales were up 13% over the same period last year.
Population Since 2006, population has been steadily increasing in the New Orleans MSA. Over the past year, the population grew by 0.8% (9,000 new residents). With approximately 1.2 million residents, the current population estimate stands at 88% of the pre-Katrina population; as a result of migration to suburban areas since Katrina, a greater proportion of the population now resides in Orleans parish. The population in Orleans Parish is 74% of what it was prior to Katrina, while the current population in remainder New Orleans MSA Parishes has reached 97% of its respective pre-Katrina population.
WATER MAJOR INTITIATIVES
Carrollton Walor Purification Plant • Construction of the ne\v soditm hypochlorite storage and feed facilirj', financed through the State
Revolving Loan Program and $1,000,000 in ARRA stimulus fund, is near completion. The project shall eliminate the need for 55-ton rail cars of chlorine and reduce the risk of exposure to staff, the communitj" and environment.
• A permanent sodium hypochlorite facility' at the Sycamore Filter backwash clilorination system needs to be installed. Tin's project will eliminate the storage of one-ton cylinders of chlorine on site and reduce the risk of exposure lo staff, the community and environment to a toxic chlorine release.
• Staff is overhauling the flocculation-sedimcntation basin G4 by replacing the gearboxes in the flocculaiion drive system, upgrading the mono-rake system and replacing the sludge piping to increase the sludge removal efficiency.
• Outstanding repairs required for Sycamore and Claiborne filters, damaged or plugged venluri plumbing and repair'replacement of the pump infrastruclure,
1-4

• Design is slowly progressing on a second sludge line to the river. This will add redundancy and fle.xibility to the operations.
Water Quality Laboratory • Staff is working with the vendor lo resolve software and operating system compatibility on the new TOC
analyzer. Routine monitoring of the TOC removal through the treatment process has been implemented and progress is being made toward state certification.
• Corrosion control monitoring program: Data collection continues to gauge the effectiveness of the ueatment processes and any process change on conosivity. The program includes installation of corrosion pipe loops at both plants and routine phosphate monitoring initiated in early 2012.
Algiers Water Purification Plant • Chlorine contact tanks are needed as a long-term solution for meeting contact time. Staff is also working
with the vendors to resolve the problems in the sodium hypochlorite generation system. Hypochloride was purchased to meet the daily needs for disinfectant.
• New anhydrous ammonia feed system is in service supporting plant operations. • A chemical piping trough to house piping from the permanent ferric sulfate storage and feed facility to
Eimco 3 and 4 is in design. The facility currently ser>'es only the Eimco 2 clarifier.
Water Pumping & Power • The total capacity of the plant is at present 26 MW. Turbine 1 (6 MW) was retrofitted with a new
governor in 2012. Turbine 3 (15 MW) was placed out of service for emergency repairs in late October 2012 and is expected to return to service in March 2013. The $12.8 M project for repairs to Turbine 4 (20 MW) was awarded in November 2011 to replace the steam path, rotor and condenser, install 8 transmitters, update the governor control system and replace the 25 Hz motor on the condensate pump. The design of the repairs to Generator 4 is underway and expected to be repaired by raid-2014. At that time, Turbine 4 shall be returned to ser>'ice, Turbine 5 (20 MW) is operating on natural gas with diesel backup.
• Turbine 6 (15 MW) is currently in construction. The federally funded project was awarded in November 2009 and is scheduled for completion by early 2013. The unit was successfully tested October-December 2012. The new turbine-generator is for emergency 60 Hz power when commercial power is not available.
• The S2.8 M project to replace boiler pre-heater at the power complex was awarded in November 2011. The project is scheduled to be complete by mid-2013.
• The New River Intake Station is operational and has sufficient capacity to supply the raw water requirements for the Canx)llton Plant. One of the three pumps has been refirrbished. The FEMA project to repair/replace the suction, discharge and check valves on Pump No. 1 is scheduled to be complete by mid-2013.
• The Oak River Intake Station currently has pumps "B", "C" and "D" available for back up to the New River Station or if additional pumping capacity is required.
• The three high lift pump stations are operational. The Claiborne High Lift Pump Station has two pumps driven with 25 Hz electric motors and two with 60 Hz electric motors. Pump No. 4, a 25 Hz driven pump is in service and utilized for emergency use only, requires repairs to the check valve. In addition, there are two pumps driven by the DeLaval steam turbines located at the power plant, which offer reliability in unison with the electric driven Claiborne Pumps. FEMA is funding the $12.7 M reconditioning of both pump-turbine packages. One of the DeLaval steam driven distribution pump and turbine is currently undergoing reconditioning. The Panola Street High Lift Pump Station serves as a backup in the event of an emergency or to offer additional pumping during maintenance outages. FEMA also funded the addition of a 60 HZ motor to Pump No. 2 at Panola. This provides a redundancy source of power and
US

permits the pump drive to be either 25 or 60 cycle. The project awarded in January 2012, shall he complete by mid-2013.
• The $32.6M FEMA project to mitigate the impact of water hammer in the distribution system by replacing the pumps at Claiborne Pump Station and the Panola Pump Station with variable speed pumps and slow opening/closing valves with batter>' backup is under design. Design shall be complete by eariy 2014.
• Corps storm proofing projects are in construction at the power plant, the Oak River and New River Intake Stations, and the building housing the frequency changer.
• The Retrofit Power Plant Hazard Mitigation Project Phase I award of $193 M was issued November 2012. Piiocurement of the design consultant for the associated facilities: power plant, Oak Street Raw Water Intake and Pump Station and the Board's power network on tlie East Bank is underway.
Water Distribution System • In 2011, Echologics began providing system wide leak detection scrx'ices for the distribution system in
water mains for repair or replacement in advance of construction activities ptatuied by various agencies and to facilitate emergency maintenance activities. Leak detection activities are funded by FEMA and support the water line replacement program. To date, 2232 leaks in the distribution system have been identified for repair.
• Over 14,000 work activities oM:urred in the water system in 2012. These included 290 water leaks investigated, 2,130 water valves inspected, and repairs to 10,238 water services lines, 1,793 water mains, 830 valves, 1,035 fire hydrants and 26 water manholes. Also, 18,768 water meters were installed, removed or reset.
• Preventative maintenance of fire hydrants is continuing in coordination with the local fire department Of the 16,500 fire hydrants mapped, the Board performed preventative maintenance for 2,985.
• The Board is continuing to coordinate with Department of Transportation and Development (DOTD) and Department of Public Works (DPW) to repair or replace water lines associated with the Submerged Roads Program and other roadway repair projects. FEMA has to date obligated $31 M for water line replacements. Increased coordination includes embedding DPW staff at the Carrollton Plant.
SEWERAGE SYSTEM MAJOR INITIATIVES
E^st Bank Wastewater Treatment Plant • A new $2.1 M administratioa''laboratory building is under construction and shall be completed by early
2013. The laboratory analyses are bebg performed off site, while the administrative offices are being housed in office trailers.
• Major upgrades to the East Bank plant's headworks occurred in 2012. This included rehabilitation of three of the six bar screens; rebuild of both process air blowers; rehabilitation of two grit pumps and grit screw mechanisms, and rehabilitation and calibration of the grit automation system.
» The new Vacuum Swing Adsorption oxygen production plant has been on-line since July of 2011. Cost savings of $978,397 was realized for 2012 as compared to 2010 liquid oxygen expenses for the same dissolved oxygen production levels in the secondary treatment oxygen reactors.
• Several repairs were made to the fluidized bed incinerator (replacement of the main heat exchanger, expansion joint, and rehabilitation of the refractory wall and dome). Also the Continuous Emisision Monitoring System (CEMS) received a major overhaul and upgrade with the installation of a Sulfiu-dioxide anal^Tier.
• The new sludge dryer is currently in design and is expected to be advertised in the first quarter 2013. Tlie project includes the procurement and installation of a ten (10) dry ton per day sludge dryer to blend into the existing sludge stream prior to incineration. The resulting sludge quality will be greater than 33% Total Solids (TS) allowing for an autogenous burn, which will require fuel only for start-ups.
1-6
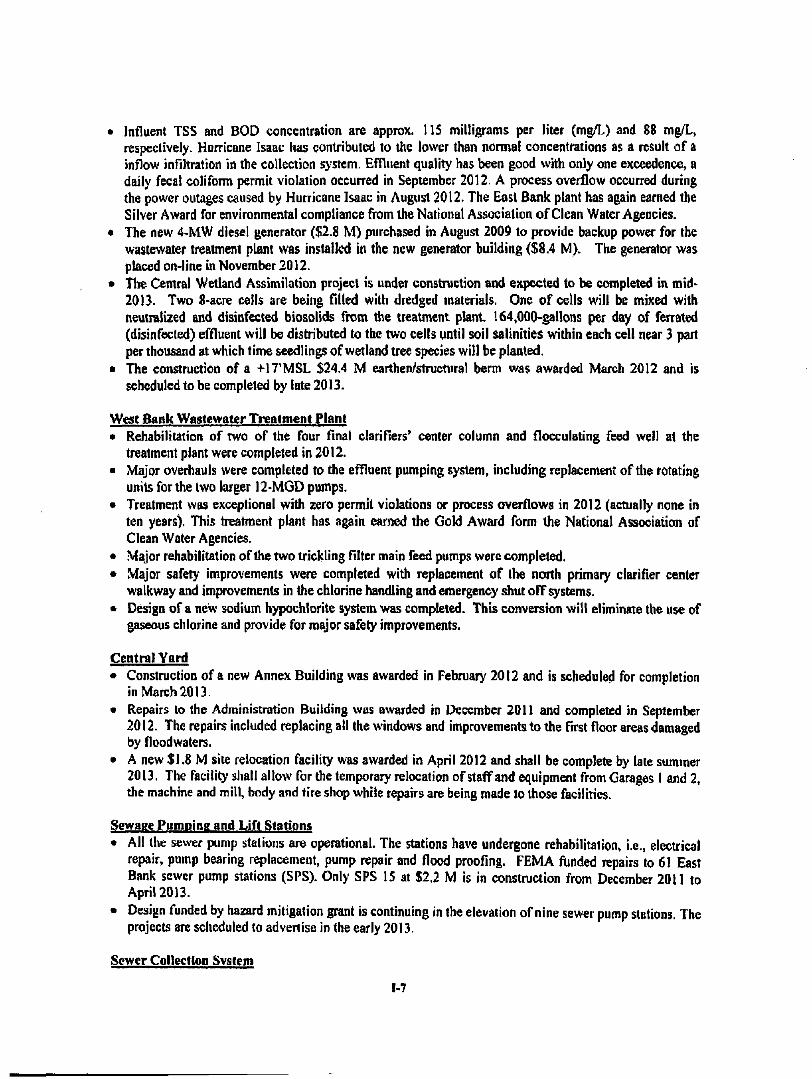
• Influent TSS and BOD concentration are approx. 115 milligrams per liter (mg/L) and 88 mg/L, respectively. Hurricane Isaac has contributed to the lower than normal concentrations as a result of a inflow infiltration in the collection system. Effluent quality has been good with only one exceedence, a daily fecal coliforra permit violation occurred in September 2012. A process overflow occurred during the power outages caused by Hunicane Isaac in August 2012. The East Bank plant has again earned the Silver Award for environmental compliance from the National Association of Clean Water Agencies.
• The new 4-MW diesel generator ($2.8 M) purchased in August 2009 to provide backup power for the wastewater treatment plant was installed in the new generator building ($8.4 M). The generator was placed on-line in November 2012.
• The Central Wetland Assimilation project is under construction and expected to be completed in mid-2013. Two 8-acre cells are being filled with dredged materials. One of cells will be mixed with neutralized and disinfected biosolids from the treatment plant. 164,00Q-gallons per day of ferrated (disinfected) effluent will be distributed to the two cells until soil salinities within each cell near 3 part per thousand at which time seedlings of wetland tree species will be planted.
• The construction of a -i-n'MSL S24.4 M earthen/structural berm was awarded March 2012 and is scheduled to be completed by late 2013.
West Bank Wastewater Treatment Plant • Rehabilitation of rwo of the four final clarifiers' center column and flocculating feed well at the
treatment plant were completed in 2012. • Major overhauls were completed to the effluent pumping system, including replacement of the rotating
units for the two larger 12-MGD pumps. • Treatment was exceptional with zero permit violations or process overflows in 2012 (actually none in
ten years). This treatment plant has again earned the Gold Award form the National Association of Clean Water Agencies.
• Major rehabilitation of the two trickling filter main feed pumps were completed. • Major safety improvements were completed with replacement of the north primary clarifier center
walkway and improvements in the chlorine handling and emergency shut off systems. • Design of a new sodium hypochlorite system was completed. This conversion will eliminate the use of
gaseous chlorine and provide for major safety improvements.
Central Yard • Construction of a new Annex Building was awarded in February 2012 and is scheduled for completion
in March 2013. • Repairs to the Administration Building was awarded in December 2011 and completed in September
2012. The repairs included replacing all the windows and improvements to the first floor areas damaged by floodwaters.
• A new $1,8 M site relocation facility was awarded in April 2012 and shall be complete by late summer 2013. The facility shall allow for the temporary relocation of staff and equipment from Garages 1 and 2, the machine and mill, body and tire shop while repairs are being made to those facilities.
Sewage Pumping and Lift Stations
• All the sewer pump stations are operational. The stations have undergone rehabilitation, i.e., electrical repair, pump bearing replacement, pump repair and flood proofing. FEMA funded repairs to 61 East Bank sewer pump stations (SPS). Only SPS 15 at $2.2 M is in construction from December 2011 to April 2013.
• Design funded by hazard mitigation grant is continuing in the elevation of nine sewer pump stations. The projects are scheduled to advertise in (he early 2013.
Sewer Collection Svstcm
1-7

• Three sewer rehabilitation construction projects in the Lower Ninth Ward were awarded and will continue through the first quaner of 2013. Tlie projects are being financed through the State Revolving Loan Program.
• Design projects are continuing for multiple point repair and replacement of sanitary sewers in the Carrollton, Lower Ninth Ward, Mid-City, New Orleans East and South Shore areas. Construction projects shall be completed by 2015.
• Construction projects for replacement of sewer mains from manhole to manhole for various sites throughout Orleans Parish were awarded.
• The Board is continuing to coordinate with DOTD and DPW in repair of sewer lines associated with the Submerged Roads Program, SSERP, ESSA and other roadway repair projects as well as routine reconstruction and maintenance.
• Emergency Sewer* System Assessment (ESSA), financed by FEMA, continues to locate and repair or replace sewers line on the East Bank.
• Preventative maintenance of the collection systerfi included inspection of 1,055,970 feet of sewer line utilizing closed circuit television and smoke testing, cleaning 1,387,184 ft., inspection of 8,738 sewer manholes and repairs to 1,526 sewer breaks. Thirty-four air release valves were inspected and maintained and 168 force main isolation valves were inspected and exercised. Alignment inspection of 392 miles of the force main was also accomplished.
• Cathodic protection survey is performed annually on the 22 systems in place in the collection system. Repairs to the cathodic protection systems damaged as a result of Katrina are ongoing. The project shall be complete by the first quarter of 2013.
DRAINAGE SYSTEM MAJOR INTITUTTVES
Pnmp Stations • All 24 drainage and 12 underpass pumping stations have been maintained and are operational. Most
motors have been rewound and are in service. • The Corps has committed $204 M for storm-proofing projects. In April 2011, a S23.8 M project to
install uvo new 300 cfs pumps and a generator at DPS S was awarded and shall be completed l ^ June 2013. In July 2010, a $ 10.9 M project was awarded to construct a new generator building at DPS 20 and perform facility upgrades to DPS 3 and 6, and is scheduled for completion in January 2013. In July 2010, a $16.6 M project was awarded to construct a new generator building at DPS 7 and shall be completed by April 2012. In September 2010, a $16.0 M project to construct a new generator building at DPS 13 was awarded for completion by December 2012. In December 2010, a S15.9 M storm-proofing project for DPS-1,2,3, 19 and I-10 was awarded and shall be completed by third quarter 2013.
• The federally funded $19.3 M expansion of Dwyer Road Pumping Station from 125 cfs to 1000 cfs shall be complete by early 2013.
• The Corps design build of three new penmanent pump stations at 17* Street, Orleans and London Canal at Lake Pontchartrain is expected to be awarded in 2013. The $804 M project would provide both frontal protection and allow for easier and more efficient pumping of water to the Lake,
Drainage System • Dwyer Road Intake Canal is under construction and scheduled for completion by February 2013. The
$58.8 M project is 100% federally funded and consists of 6,800 feet of new concrete boxed culvert into the Dwyer Road Pumping Station.
• Florida Ave. Canal Phase I is in construction from January 2010 to May 2013. The $49.2 M project is federally funded and consists of an open concrete canal within the right of way between Mazant St. and DPS 19. Florida Ave. Canal Phases U and III from Peoples Ave. to Mazant St. are in design.
• Napoleon Ave. Canal Phase fl is in construction firom September 2011 through May 2015. The S55.1 M project is 65% federally itinded and consists of 4,300 feet of new concrete box canal along Napoleon
1-8
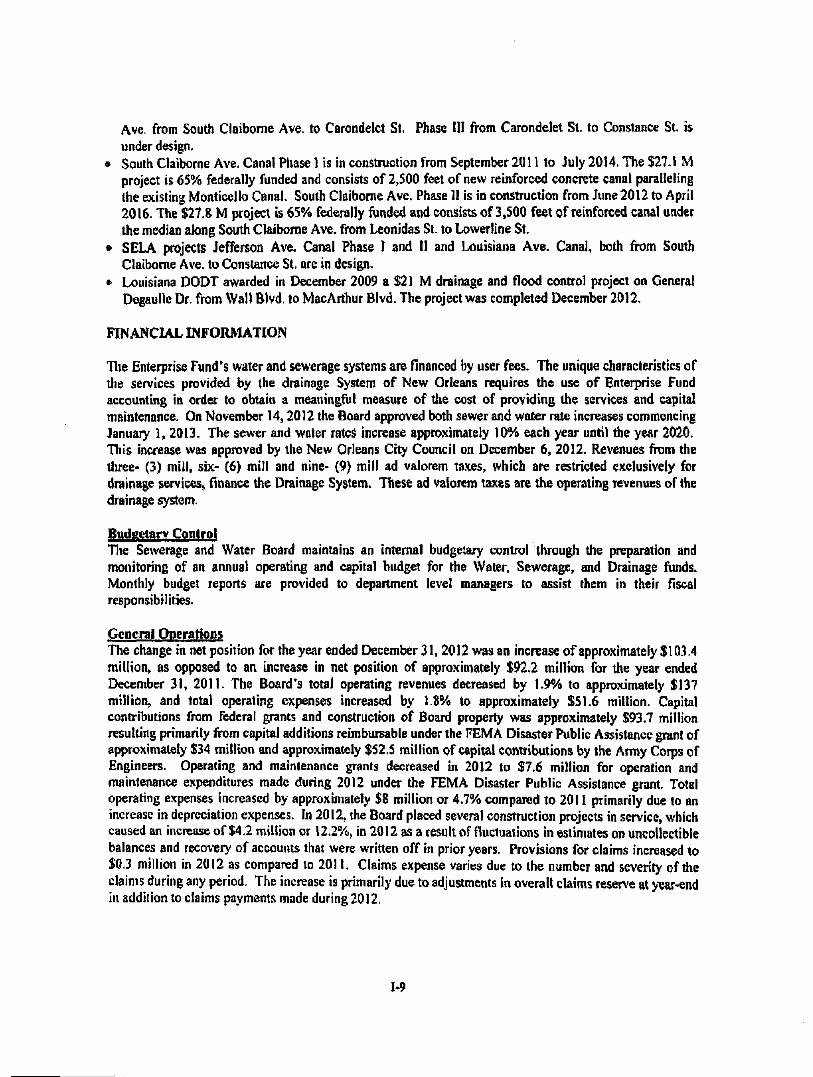
Ave, from South Claiborne Ave. to Carondelet St. Phase III from Carondelet St. to Constance St. is under design.
» South Claiborne Ave. Canal Phase 1 is in construction from September 2011 to July 2014. The $27.1 M project is 65% federally funded and consists of 2,500 feet of new reinforced concrete canal paralleling the existing Monticello Canal. South Claiborne Ave. Phase II is in construction from June 2012 to April 2016. The $27.8 M project is 65% federally funded and consists of 3,500 feet of reinforced canal under the median along South Claiborne Ave. from Leonidas St. to Lowerline St.
• SELA projects Jefferson Ave. Canal Phase 1 and II and Louisiana Ave. Canal, both from South Claiborne Ave. to Constance St. are in design.
» Louisiana DODT awarded in December 2009 a $21 M drainage and flood control project on General Degaulle Dr. from Wall Blvd. to MacArthur Blvd. The project was completed December 2012.
FINANCUL INFORMATION
The Enterprise Fund's water and sewerage systems are financed by user fees. The unique characteristics of the services provided by the drainage System of New Orleans requires the use of Enterprise Fund accounting in order to obtain a meaningful measure of tlie cost of providing the services and capital maintenance. On November 14,2012 the Board approved both sewer and water rate increases commencing January 1, 2013. The sewer and water rateS increase approximately 10% each year until the year 2020. Tills increase was approved by the New Orleans City Council on December 6, 2012. Revenues fix>m the three- (3) mill, six- (6) mill and nine- (9) mill ad valorem taxes, which are restricted exclusively for drainage services, finance the Drainage System. These ad valorem taxes are the operating revenues of the drainage system.
Budgetary Control Tlie Sewerage and Water Board maintains an internal budgetary control through the preparation and monitoring of an annual operating and capital budget for the Water, Sewerage, and Drainage fiinds. Monthly budget reports are provided to department level managers to assist them in their fiscal responsibilities.
General Operations The change in net position for the year etided December 31,2012 was an increase of approximately $103.4 million, as opposed to an increase in net position of approximately $92.2 million for the year ended December 31, 2011. The Board's total operating revenues decreased by 1.9% to approximately $137 million, and total operating expenses increased by 1.8% to approximately $51.6 million. Capital contributions from federal grants and construction of Board property was approximately S93.7 million resulting primarily from capital additions reimbursable under the FEMA Disaster Public Assistance grant of approximately $34 million and approximately $52.5 million of capital contributions by the Army Corps of Engineers. Operating and maintenance grants decreased in 2012 to $7.6 million for operation and maintenance expenditures made during 2012 under the FEMA Disaster Public Assistance grant. Total operating expenses increased by approximately $8 million or 4.7% compared to 2011 primarily due to an increase in depreciation expenses. In 2012, the Board placed several construction projects in service, which caused an increase of $4.2 million or 12.2%, in 2012 as a result of fluctuations in estimates on uncollectible balances and recovery of accounts that were written off in prior years. Provisions for claims increased to $0.3 million in 2012 as compared to 2011. Claims expense varies due to the number and severity of tlie claims during any period. The increase is primarily due to adjustments in overall claims reserve at year-end in addition to claims payments made during 2012.
1-9
Other Information
State Statutes and covenants governing outstanding bond issues require an annual audit of the Board's financial records by independent certified public accountants. The accounting firm of Postlethwaite & Netterville was selected by the Board to perform this audit through a competitive bid process. The independent auditors' report on the basic financial statements is included in the Financial Section of the report. The Government Finance Officers Association of the United States and Canada (GFOA) awarded a Certificate of Achievement for Excellence in Financial Reporting to Sewerage and Water Board of New Orleans for its Comprehensive Annual Financial Report for the fiscal year ended December 31, 2011. The Certificate of Achievement is a prestigious national award-recognizing conformance with the highest standards for preparation of state and local government financial reports.
In order to be awarded a Certificate of Achievement, a government unit must publish an easily readable and efficiently organized comprehensive annual financial report whose contents conform to program staitdards. Such CAFR must satisfy botli generally accepted accounting principles and applicable legal requirements.
A Certificate of Achievement is valid for a period of one (1) year only. The Sewerage and Water Board of New Orleans has received a Certificate of Achiex'emeni for twenty-nine (29) years. We believe our current report continues to conform to the Certification of Achievement Program requirements and we are submitting it to GFOA.
ACKNOWLEDGMENTS
The Comprehensive Annual Financial Report was prepared by the dedicated staff of the Director's Office, particulariy the Finance Administration and Printing Department. Additionally, we realize that the cooperation of each Department of the Sewerage & Water Board of New Orleans is essential, and we appreciate the willingness to work together toward this endeavor.
We also wish to thank the members of the Board for their interest and support in our efforts to achieve greater fiscal efficiency and accountability.
Yours very truly,
M^rcia A. St. Martin Executive Director
Robert K. Miller Deputy Director
Ethel H^i l l iams Financial Administrator
1-10

Sewerage and Watei- Board of New Orleans
2012 Revenue Interest Income
Operating and . .^ 0,21% Maintenance
G rants 4.03%
.Other Revenue 2.44%
Provision for Doubtful Accounts
0.93%
Amortization 0.09%
2012 Expenses Provision for
Claims 0.07%
Interest Expense 0.41%
Power and Pumping
6.65%
Customer Accounts
1.86% Customer Service
1.86% Administration and
General 8.84%
M l

(This page intentionally lef blank)

Certificate of Achievement for Excellence in Financial Reporting
Presented to
Sewerage and Water Board of New Orleans, Louisiana
For its Comprehensive Annual
Financial Report
for the Fiscal Year Ended
December 31,2011
A Certificate of Achievement for Excellence in Financial Reporting is presented by the Government Finance Officers
Association of the United States and Canada to government units and public employee retirement s)'Stems whose comprehensive annual financial
reports (CAFRs) achieve the highest standards in government accounting
and fmancial reporting.
^%:a!^f^ l ! (a^ President
Executive Director
I ' l l

(This page intentionally left blank)

OFFICERS of the
SEWERAGE AND WATER BOARD OF NEW ORLEANS
December 31,2012
MITCHELL J. LANDRIEU Mayor, City of New Orleans
President
WILLIAM RAYMOND MANNING President Pro Tern
MARCIA A. ST. MARTIN Executhre Director
ROBERT K. MILLER Deputy Director
JOSEPH R BECKER General Superintendent
MADELINE F. GODDARD Deputy Genera! Superintendent
BRIAN FERRARA Interim Special Counsel
H3

MEMBERS OF SEWERAGE AND WATER BOARD OF NEW ORLEANS
December 31,2012
MITCHELL J. LANDRIEU Mf^or
MARION BRACY Council District D Appointanent
STACY HEAD Councibnember At-Large
KERRIKANE Council District C Appointment
WILLIAM RAYMOND MANNING Board of Liquidation Appointment
MARK M. MOODY Board of Liquidation Appointment
KRISTIN GISLESON PALMER Councilmember District C
GLENPIUE Council District A Appointment
FLORENCE W. SCHORNSTEIN Council District B Appointment
VACANT Councibnember
CHARLES F. WEBB Council District E Appointment
BEVERLY WRIGHT, PhD At-Large Appointment
LOYCEP WRIGHT At-Large Appointment
1-14

COMMITTEES OF THE SEWERAGE AND WATER BOARD OF NEW ORLEANS
December 31,2012
MARK MOODY GLENPILIE
EXECUTIVE COMMITTEE WILLIAM RAYMOND MANNING - Chairperson
FLORENCE W. SCHORNSTEIM CHARLES F.WEBB
STACY HEAD KERRIKANE
FINANCE AND OPERATIONS COMMTrTEE CHARLES F. WEBB - Chairperson
WILLIAM RAYMOND MANNING LOYCE WRIGHT
MARION BRACY KERRIKANE
INFRASTRUCTURE COMMITTEE FLORENCE W. SCHORNSTTEN - Chairperson
GLENPILEE BEVERLY WRIGHT, PhD
MARION BRACY FLORENCE W. SCHORNSTEIN
OPERATIONS COMMITTEE MARK MOODY, Chairpereon
BEVERLY WRIGHT, PhD LOYCE P. WRIGHT
PENSION COMMITTEE WILLIAM RAYMOND MANNING - Chairperson
KRISTIN GISLESON PALMER HAROLD HELLER MARVIN RUSSELL
GERALD TILTON CHARLES F. WEBB
JOHN WILSON
JAY ARNOLD JOSEPH BECKER RONNIE CROSBY JIM FINLEY
PLUMBING COMMITTEE GLEN PILIE - Chairperson
STACY HEAD MARK M.MOODY
KRISTIN GISLEON PALMER BEVERLY WRIGHT, PhD
MICHAEL CONEFRY & COMPANY, ACTUARY
1-15

SEWERAGE AND WATER BOARD ORGANIZATION CHART 2012
BOARD
k
EXECUTIVE DIRECTOR
>:SA;:^fS^5K^;i;;. 45S«:
coMMUNrrv & INTER60VHRNMENTAL
RELATK>NS
ECONOMICAaY DISAOVANTAGEO
BUSINESS PROGRAM
EMERGENCY MAHAGEMENT
J L .
u SPECIAL COUNSEL
T
EQUAL EMPLOYMENT . OM>ORnJNnY
LEGAL DEPARTMENT
DEPUTY DIRECTOR GENERAL SUPERINTENDENT DEPUTY GENERAL SUPEfUNTENDENT
ADMINISTRATIVE SERVICES
ENVIRONMENTAL COMPLIANCE
FINANCE ADMINISTRATION
ENGINEERING DIVISION
INFOmiATION SYSTEMS
ADMINISTRATION
INTERNAL AUOn PERSONNEL ADMINISTRATION
NETWORKS DWISION
X
FACIUTY MAINTENANCE
OPERATIONS DIVISION
PUNNING & BUDGET PURCHASING ADMINISTRATION
RISK MANAGEMENT SUPPORT SERVICES
F£VENUE& CUSTOMER
SERVICE ADMIMISTRATIQW
PLUMBING DIVISION

THE SEWERAGE AND WATER BOARD OF NEW ORLEANS DIVISION HEADS OF DEPUTY DIRECTOR
December 31,2012
ROBERT K. MILLER DEPUTY DIRECTOR
ADMINISTRATIVE SERVICES LYNNCOBETTE
ENVIRONMENTAL COMPLIANCE ANN WILSON
FINANCE ADMINISTRATION ETHEL H. WILLIAMS
INFORMATION SYSTEMS ADMINISTRATION MELINDA NELSON
INTERNAL AUDIT
RAYMOND GABLE
PERSONNEL ADMINISTRATION AUDREY LEE (INTERIM)
PLANNING AND BUDGET DEXTER JOSEPH
PURCHASING ADMINISTRATION WILLIE M. MINGO, JR.
REVENL1E AJfD CUSTOMER SERVICES ADMINISTRATION JACQUELINE K. SHINE
RISK MANAGEMENT JENNIFER MEDLEY
SLTPORT SERVICES
J0HN^\TLSON
1-17

THE SEWERAGE AND WATER BOARD OF NEW ORLEANS DIVISION HEADS OF GENERAL SUPERINTENDENT
December 31,2012
JOSEPH BECKER GENERAL SUPERINTENDENT
MADELINE F. GODDARD DEPUTY GENERAL SUPERINTENDENT
ENGINEERING DIVISION
JOHN (JACK) HUERKAMP
FACILITY MAINTENANCE DIVISION GABE SIGNORELLI
RUDY AUGUST
OPERATIONS DIVISION
BOBMOEMAN
P)[,VM?INQPm^I9N JAMES J. ARNOLD
1-18

iT'^'^^-O''
A new $32 million hunicane protection berm is being consbucted at the East Bank Sewage Treatment Plant (EBSTP) to protect it from hurricane surges. The plant was nearly destroyed by Katriiia's sui^ge. The 100 per cent federally funded berm will replace a 7-foot high earthen levee with an 18-foot T-Wall constructed berm, similar to the ones the US, .\tmy Corps of Engineers built after Katrina. The project, which began in Maiich of 201i is set for completion at the end of November of 2013. The berm is designed to protect 26.4 acres of land.
1 - ^ '
( I I <
iii»K|.'<:^
Drainage Puiinping Station So. 7, on Marconi Drive near City Park, now has a new 4,023 horsepower, 3 mega watt generator to run one of its pumps should commercial power be interrupted, the station pumps storm water through the Orieans Outfall Canal to Lake Ponlcliartrain. The cost of this important generator, its two-story housing building and fuel supply t.nnk w.is $16 million, fully paid for by Federal funds through the U.S. Army Corps ot Engineens, The noiising building was designed to blend into the landscape of nearby neighborhoods.
F I N A N C I A L
l i j a S I Postlethwaite U ^ i M & Netterville
INDEPENDENT ALT)ITORS' REPORT
Member of the Board Sewerage and Water Board of New Orleans
Report on the Financial Statements
We have audited the accompanying financial statements of the business-type activities and aggregate remaining fiind information of the Sewerage and Water Board of New Orleans (the Board) as of and for the years ended December 31, 2012 and 2011, and the related notes to the financial statements, which collectively comprise the Board's basic financial statements as listed in the table of contents.
Management's Responsibih'ty for the Finaocial Statements
Management is responsible for the preparation and fair presentation of these fmancial statements in accordance with accoimting principles generally accepted in the United States of America; this includes the design, implementation, and maintenance of internal control relevant to the preparation and fair presentation of financial statements that are free from material misstatement, whether due to fraud or error.
Auditors' Responslbilit}'
Our responsibilit)' is to express opinions on these fmancial statements based on our audits. We conducted our audits in accordance with auditing standards generally accepted in the United States of America and the standards applicable to financial audits contained in Government Auditing Standards, issued by the Comptroller General of the United States. Those standards require that we plan and perform the audit lo obtain reasonable assurance about whether the fmancial statements are free of material misstatement.
An audit involves performing procedures to obtain audit evidence about the amounts and disclosures m the fmancial statements. The procedutes selected depend on the auditor's judgment, including the assessment of the risks of material misstatement of the fmancial statements, whether due to fraud or error. In making those risk assessments, the auditor considers internal control relevant to the entity's preparation and fair presentation of the financial statements in order to design audit procedures that are appropriate in the circumstances, but not for the purpose of expressing an opinion on the effectiveness of the entity's internal control. Accordingly, we express no such opinion. An audit also includes evaluating the appropriateness of accounting policies used and the reasonableness of sipificant accounting estimates made by management, as well as evaluating the overall presentation of the fmancial statements.
We believe that the audit evidence we have obtained is sufBcient and appropriate to provide a basis for our audit opinions.
U - l : ' r i ' . - I i,>( . ('iPUjvCentit; • ""lOO Poydfai Stree: • l\iew Orc-ans IA 7'riiS? ICQj • Tfl" F,i,i'l.'',i:":i .'•j'?;.
Oop Gal'try BIvc:, Suite 2100 • t/etairie, LA 7C.tWl • 1^1:501.837.5090 • Kj.:. r.r,..) tl...) JcCH:'
Opinioft.s
In our opinion, the financial statements referred to above present fairly, in ail material respects, the respective financial position of the busuiess-typc activities and the aggregate remaining fund information of the Board, us of December 31, 2012, and the respective changes in financial position and, where applicable, cash flows thereof for the year then ended in accordance with accounting principles generally accepted in the United States of .\merica.
Other Matters
Required Supplementary Infonnation
Accounting principles generally accepted in the United States of Amtrica require that the management's discussion and analysis on pages 11-4 tlvough 11-17 and the schedules of funding progress presented on pages 11-62 and n-63 he presented to supplement the basic financial statements, Such infonnation, although not a part of the basic financial statements, is required by the Govenunental Accounting Standards Board, who considers it to be an essential part of financial reporting for placing the basic financial statements in an appropriate operational, economic, or historical context We have applied certain limited procedures to the required supplementary' information in accordance with auditing standards generally accepted in the United States of America, which consisted of inquiries of management about the methods of preparing the information and coraparixig the information for consistency with management's responses to our inquiries, the basic financial statements, and other knowledge we obtained during our audit of the basic financial statements. We do not expres.s an opinion or provide any assurancni on the infonnation because the limited procedures do not provide us witl) suflicient evidence to express an opinion or provide any assurance,
0/Ji^r Information
Our audits were conducted for the purpose of forming opinions on the financial statements that collectively comprise the Board's basic financial statements. The Introductory section, Schedules 1 through 6, the Statistical infonnation section, and Supplementary Information section are presented for purposes of additional analysis and are not a required part of the basic financial statements.
Schedules 1 through 6 are the responsibility' of management and were derived from and relate directly to the underlying accounting and other records used to prepare the basic financial statements, Such infonnation has been subjected to the auditing procedures applied in the audit of the basic financial statements and certain additional procedures, including comparing and reconciling such information directly to the underlying accounting and other records used to prepare the basic financial statements or to the ba.sic financial statements themselves, and other additional procedures in accordance with auditing standards generally accepted in the United States of America. In our opinion, the information is fairly stated, in all material respecB, in relation to ihe financial statements as a whole.
The Statistical Information and Supplementary Information sections have not been subjected to the auditing procedures applied in the audit of the basic financial statements and, accordingly, we do not express an opinion or provide any assurance on them.
l i -2
P&N

Other Reporting Required bv GoverruneM .Auditins Standards
In accordance with Government Auditing Standards, we have also issued our report dated Mey 9, 2015, on our consideration of tiie Board's internal control over tlnancial reporting and on our tests of its compliance with certain provisions of laws, regulations, contracts, and grant agreements and other maners. The purpose of that report is to describe the scope of our testing of internal control over financial reporting and compliance and the results of that testing, and not to provide an opinion on internal control over fmancial reporting or on compliance. That report is an integral part of an audit performed in accordance with Government Auditing Standa}-d% in considering the Board's internal control over fmancial reporting and compliance.
New Orleans, Louisiana Mav9.2013
11-3
P&N

(This page intentionally left blank)

SEWERAGE & WATER BOARD OF NEW ORLEANS
MANAGEMENT'S DISCUSSION AND ANALYSIS YEAR ENDED DECEMBER 31,2012
This section of the Sewerage & Water Board of New Orleans' (the Board) annual fmancial report presents a discussion and analysis of the Board's financial performance during the fiscal year that ended December 31,2012. Please read it In conjunction with the Board's financial statements, which follow this section.
FINANCIAL HIGHLIGHTS
The B0B16 adopted a fmancial plan for 2011 through 202Q that is anticipated to result m improved debt service coverage, increased liquidity, increased funding for operations and maintenance, and ftlll funding for the capital improvement program.
Recovery from Hurricane Katrina and the resulting flooding continued to be significant event during 2012. Repairs to water, sewerage, and drainage systems, building repairs, and vehicle and equipment replacements continued throughout 2012. Management anticipates this recovery work to continue through 2025.
Enterprise Fund
The major highlights in the Board's enterprise frmd were as follows:
2012
• The Board's additions to its major systems approximated $ 193.4 million. • The Southeast Louisiana (SELA) project which is a major upgrade to the drainage system by the
Corps of Engineers resulted in additions of approximately $69.4 million to work in progress duritig the year.
• Federal Emergency Management Agency (FEMA) Disaster Public Assistance grants expended totaled approximately SSI million, of which approximately $42.5 million were capital contributions and approximately S8.S million were for operating and maintenance expenses.
2Q11
The Board's additions to its major systems approximated S1S1.9 million. The SELA project which is a major upp'ade to the drainage system by the Corps of Engineers resulted in additions of approximately S3 9,6 million to work in progress during the year, Federal Emergency Management Agency (FEMA) Disaster Public Assistance grants expended totaled approximately S39.5 million, of which approximately $28,5 million were capital contributions and approximately $ 11 million were for operating and maintenance expenses.
Pension Trust Fund
2012
The major highlight in the Board's pension trust fiind was the financial performance in the stock market as compared to 2011. The appreciation of the fair value of investments was $20.6 million compared to $7.7 million in 2011. The plan net position available for benefits had a net increase of $12.9 million to S209.9 million in 2012.
I M

2011
The major highlight in the Board's pension trust fiind was the financial performance in the stock market as compared to 2010. The appreciation of the fair value of investments was $7.7 million compared to S19.2 million in 2010. The plan net position available for benefits had a net increase of $0.5 million to SI97 million in 2011.
OVERVIEW OF THE FINANCUL STATEMENTS
This financial report consists of five p»ts: management's discussion and analysis (this section), the financial statements, the notes to the financial statements, required supplementary information, and other supplementary information.
Governroeot-wide Financial Statements - Enterprise Fund
The Board's principal activities of providing water, sewerage, and drainages services are accounted for in a single proprietary ^ n d - the enterprise frind. Enterprise fimds are used to report business activities. Suice the enterprise fund is the Board's single activity, Its financial statements are presented as the Board's goverament-wide financial statements.
The finaacial statements provide both long-term and short-term information about the Board's overall financial status. The financial statements also include notes that explain some of the information in the financial statements and provide more detailed data. The statements are followed by a section of required supplementary information and other supplementary information that fiirther explain and support the information in the fmancial statements.
The Board's financial statements are prepared on an accrual basis in conformity with accounting principles generally accepted in the United States of America (GAAP) as applied to government units. Under this basis of accounting, revenues are recognized in the period ui which they are earned, expenses are recognized in the period in which they are incurred, and depreciation of assets is recognized in the Statements of Revenues, Expenses, and Changes in Net Position. All assets and liabilities associated with the operation of the Board are mcluded in the Statements of Net Position.
The Statement of Net Position reports the Board's net position. Net position - the difference between the Board's assets and liabilities • are one way to measure the Board's financial health or position.
Fund Financial Statements - Petisiou THist Fund
The Board's fiind financial statements consist of its pension trust fiind. As a fiduciary flind, the pension trust fund is held for the benefit of employees and retirees of tlie Board, The pension trust fund is not reflected in the govemment-wide fmancials because tlte resources are not available to the Board for its activities. The accounting for the pension trust fimd is much like that used by the enterprise fund.
U-5

FINANCIAL ANALYSIS OF THE BOARD
ENTERPRISE FUND
2012 Net Position
The Board's total assets at December 31, 2012 were approximately S2.1 billion, a 6.3% increase from December 31.2011 (see Table A-l).
Table A-I Semragt & Water Board o f N t w Orieans
Ne i ro t i t l on
Cmreiu itnregtricied assiXl Restricted assets Piopeity, plant and eqiqxncnt - net Other assets
Total assets
Cunenl Habiliti&S Ijong-tenn Gabflhies
Total Uabililies
Net posHksK Net investment ii capital assets Restricted Unrcsricted
Total net posiUon Total liabilities and net pos:ilion
2012
S 63,969,654 112,309,089
1,968.531,923
2,146.629.901
S 181,781.809 3frt.235.g9 546^017338
1,762,389,823 35.186,883
(196.964.143) 1.60D.6I2.563
2011
73,557,121 124,217,838
1.819,352,046 1,987,652
i 2.019.114.657,
$ 175,800,803 348.127.496 S2I.928J99
1,604.703377 33,137,542
(140^655^)61) t.497,186J58 2.019,114.657
Increase (Decrease)
S (9,587,467) (11,908,749) 149,179.877
{I68.417J
127.515,244
S 7.98IJ006 16.108.033 24.089.039
157,685^946 2,049^41
(56J09.082) 103,426.205
127.515.244
Increase (Deereeie'
-13.0% -9.i B.2»S
-8.5%
4.6%
4.6%
9.8% 6.2%
40.0%
6.3%
T h e n e t i nc rease in tota l a s se t s o f $ 1 2 7 . 5 mi l l ion resul ted p r imar i ly d u e t o an i n c r e a s e in p rope r t j ' , p lant , and e q u i p m e n t o f S149 . I mi l l ion , a n d a d e c r e a s e o f $ 1 1 . 9 mi l l ion in r e s t r i c t ed a s s e t s , o f wh ich i n c l u d e s a d e c r e a s e o f $14 .8 mi l l ion in i n v e s t m e n t s res t r ic ted for capi ta l p ro jec t s . T o t a l d e c r e a s e o f $9 .6 mi l l ion in cu r ren t unres t r ic ted a s s e t s w a s p r imar i ly d u e t o a d e c r e a s e o f $7 .6 mi l l i on in c a s h . Cur ren t l iabil i t ies increased b y $ 8 mi l l ion p r imar i ly d u e t o an inc rease o f 517 .4 mi l l ion in a d d i t i o n a l b o r r o w i n g from t h e State o f L o u i s i a n a and offset by a d e c r e a s e o f $4 .3 mi l l i on in accoun t s p a y a b l e a n d S3.5 mi l l ion in o ther l iabi l i t ies . L o n g - t e r m l iabi l i t ies inc reased b y S I 6 . 1 mi l l ion p r imar i ly d u e t o an i n c r e a s e o f S K , 2 mi l l ion in S E L A pro jec t p a y a b l e , $4 .4 mi l l i on in teres t acc rua l for Specia l C o m m u n i t y D i s a s t e r loan, and a n increa.se o f $7.3 mi l l ion in o the r p o s t r e t i r e m e n i benef i t s l iabil i ty, offset by a d e c r e a s e o f S9,7 mil l ion in b o n d s payab le .
11-6
2011 Net Position
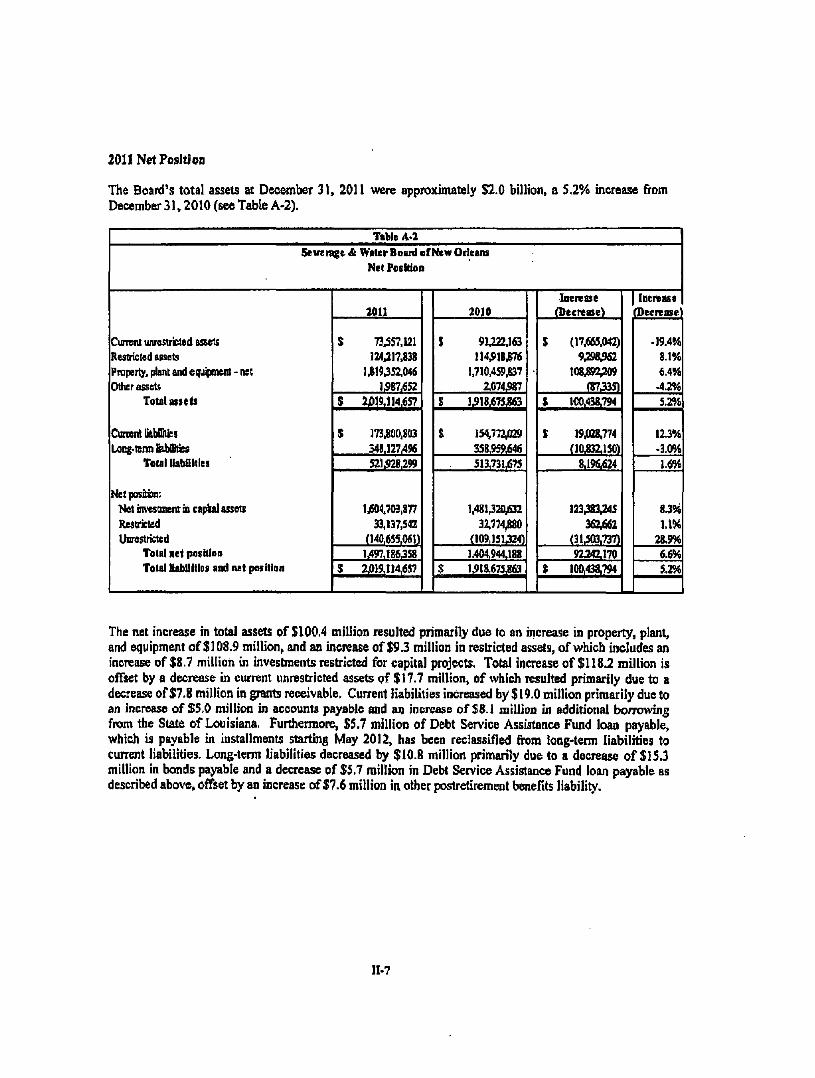
The Board's total assets at December 31, 2011 were approxintately $2.0 billion, a S.2% increase from December 31,2010 (see Table A-2).
Table A-2 1
Sewerage & Water Boaid of New Orleans 1
Net Position
Current unrestricted assets Restricted assets
Proper^, plant and equipment - net Other assets
Total assets
Cunem UabMs Loog-tenn labilities
Total Uabiiltles
N e t p o s ^ :
Met im'esBnent in c a p ^ assets
Restricted
Unrtstricled Total net poshlon
Total liabilities and net position
2011
S 73,557,121
124J17.838 1319352.046
1587.652
S 2.019.114,657
S 173.800.803
S4g.l27/I96 521.928,299
lj604.703,877 33,137,542
(140,655.061 1/497.186358
S 2j019,l 14,657
2010
J 91,222.163 tl4;9l8.876
1.710.459.837
i074.987
$ 1518.675.863
$ 154,772/129 358,959,646
513,731.675
1,481320,02
32,774380
(109.151324) 1^04,944.188
$ 1,918.675363
Increase (Decivase)
$ (17.665,042)
9.298.962
108392,209
(87335) S 100.438.794
J 19,028,774 (10.832.150)
8,196,624
123383,245
362,662
(31.303.73Ti 9124Z170
$ 100,438.794
Inertast | (Decrease)
• 19.4% 8.1%
6.4% -4.2%
5,2%
113% -3.0%
1.6%
83%
l.t% 28.9%
6.6% S.2%
The net increase in total assets of $100.4 million resulted primarily due to an increase in property, plant, and equipment of S108.9 million, and an increase of $9.3 million in restricted assets, of which includes an increase of $8.7 million in investments restricted for capital projects. Total increase of $118.2 million is offset by a decrease in current unrestricted assets of $17.7 million, of which resulted primarily due to a decrease of $7.8 million in grants receivable. Current liabilities increased by $ 19.0 million primarily due to an increase of $5,0 million in accounts payable and an increase of S8.1 million in additional borrowing from the State of Louisiana, Furthermore, $5.7 million of Debt Service Assistance Fund loan payable, which is payable in installments starting May 2012, has been reclassified from long-term liabilities to current liabilities. Long-term liabilities decreased by $10.8 million primarily due to a decrease of $15.3 million m bonds payable and a decrease of $5.7 million in Debt Service Assistance Fund loan payable as described above, offset by an increase of $7.6 million in other postretirement benefits liability.
11-7

2012 Changes in Net Position
The change in net position for the year ended December 31,2012 was an increase of approximately $103.4 million, as opposed to an increase in net position of appro.vimately $92.2 million for the year ended December 31, 2011. The Board's total operating revenues decreased by 1.9% to ^proximately $137 million, and total non-operating revenue increased by 1.8% to approximately $51.6 million. The changes in net position are detailed in Table A-3; operating expenses are detailed in Table A-4.
TaUe A-3 Sewnge & Water Board of New Orieans
Hevenues, Expenses and Change In Net FOSIHOD
Operating rcveiucs: Charges fiir services
, CWier Total operating revenues
Operating e (pe ses CTable A-4)
lOpcsatEig loss
Non-operating revenies: Property taxes Other taxes Operait^ and maintenanca graiits Invcsonent expense
Total non-«peniting revenues
Income before capital oonoibuUons
Capital contributions
Qiange in net position
No pojiiton, beghnli^ofycar
Net posilion, end ofvenr
2012
J 132351.945 4.626,276
136,978,221
178,873,695
(41,895,474) 1
44.061.990 278394
7.621,526 (336.506)
51.628,404
9.732.930
93,693,275
103,426,205
1,497.186358
$ 1,600,612,563
2011
S 131.006.460 8,581,123
139.587,583
170,909,110
j (31321,527)
39.232.254 316,079
11,479,664 (310.008)
50.717,989
19.396,462
72,845,708
92,242.170
1.404,944,188
S 1.497,186,358
Increase (Decrease)
$ 1343.483 (3.954.847)
( 2 ^ 3 6 2 )
7.964.585 [
, (10,573.947)
4.829,736 (37,685)
(3.835,138) (26.498) 910,413
(9.663.532)
20,847,567
11,184,035
92.242.170
S 103.426,205 1
Incnaso (Deeraaso)
1.0% •46.1%
-1.9%
4.7%
•33.8%
12.3% •11.9% -33.6%
8.5% 1.8%
-49.8%
28.6%
12.1%
6.6%
6.9%
Capiuil contributions from federal grants and construction of Board property was approximately $93.7 million resulting primarily from capital additions reimbursable under the FEMA Disaster Public Assistance grant of approximately S34 million and appro.Kimately $52.5 million of capital contributions by the Army Corps of Engineers. Operating and maintenance grants decreased in 2012 to $7.6 million for operation and maintenance expenditures made during 2012 under the FEMA Disaster Public Assistance grant
n-8

TaWe A-4 1 Sewerage & Water Board 1
1 Operating Expenses
Power and pumping Treatment Transmission and distribution Customer accounts Customer serv ice Administmtion and general Payroll related M aintenanoe of general plant pepxeciation Amortization Provision for doubtful accounts Provision for (benefit oO claims
Total op erating exp enses
2012
$ 11,951,746 18,906,540 26,019,713
3334,652 3,332,300
15,879,736 33,980,859 24^80,560 39,011,955
168,419 1.676,511
130,704 $ 178,873,695
•
2011
$ 11,787,614 18,081,523 27.216.035 3,369,643 3,320,100
16,054,154 34,770,439 25,185.237 34,772,279
165,080 867,460
(4,680,454) $ 170,909,110
bcrease (Decrease)
S 164,132 825,017
(1,196322) (34,991) 12,200
(174,418) (789,580) (704,677)
4,239,676 3,339
809,051 4,811,158
$ 7,964,585
Increase 1 (Decrease) |
1.4% 4.6%
-4.4% -1.0% 0,4%
-1.1% -23% •2.8% 12.2% 2.0%
93.3% -102.8%
4.7%
Total operating expenses increased by approximately $8 million or 4.7% compared to 2011 primarily due to an increase in depr«:iation expenses. In 2012, die Board placed several construction projects in service, which caused an increase of $4.2 million or 12.2% in depreciation expenses. Provisions for claims increased to $0.3 million in 2012 as compared to 2011. Claims expense varies due to the number and severity of the claims during any period. The increase is primarily due to adjustments in overall claims reserve at year-end in addition to claims payments made during 2012,
2011 Changes in Net Position
The change in net position for the year ended December 31,2011 was an mcrease of approximately S92.2 million, as opposed to an increase in net position of approximately $89.5 million for the year ended December 31, 2010. The Board's total operating revenues increased by 7.3% to approximately $139.6 million, and total operating expenses decreased by 2.8% to approximately $170.9 million. The changes in net position are detailed in Table A-5; operating expenses are detailed in Table A-6.
n-9

Table A-5 Sewerage & WaterBoard of NewOrieans
Revennes, Expenses and Change in Net Position
Operating revenuEs; Charges fi)r senrioes Olher
Total openting revennes
Operating eicpenses (Table A-6)
Operating bss
Kofroperalgng revenues: Properly taxes Olher taxes
Operaxtns ^ maintenance grains Investment expense OSicr non-opera% income (expense)
Total non^pe rating nvenues
Capital concributbns
Ciiange in net position
Net positioa begtming ofyear
Net position, end of year
2011
S 131,006,460 8,581,123
139,587,583
170,909,110
(31321,327)
39,232,234 316,079
n.479,664 (310,008)
50.717.989
19,396,462
72,845.708
92,242,170
1,404,944.188
S 1.497,186358
2010
S 125360,977 4.702,753
130,063,730
175,809,537
(45.745,807)
36350.476 333,795
9367,940 (M13,2B0) 41.438,410 86.277,341
40331,534
48.959,148
89.490,682
1315,453.506
S 1,404.944,188
Increase (Decrease)
t 5,645,483 3.878370 9.533.853
C4.900.427)
14.424380
2,681,778 (17.716)
2,111,724 1,103,272
(41.438.410) (35.559352)
(21.135.072)
23,886360
2.751.488
89.490,682
S 92,242.170
Increase (Decrease)
4.5% 82.5% 7.3%
-2.8%
31.5%
7.3% - 5 3 % 22.5%
-78.1% -100.0% -41.2%
•52.1%
48.8%
3.1%
6.8%
6.6%
Capiial contributions from federal grants and construction of Board property was approximately $72.8 million resulting primarily from capital additions reimbursable under the FEMA Disaster Public Assistance grant of approximately $33.2 million and approximately $39.6 million of capital contributions by the Army Corps of Engineers. Operating and maintenance grants increased in 2011 to SI 1.5 million due to operation and maintenance expenditures made during 2011 under the FEMA Disaster Public Assistance grant.
IMO

Table A-6 Sewerage & Water Board
Operating Expenses
Power and pumping Treatment Transmission and distribution Customer accounts Customer service Administration and general P^roll related Maintenance of general plant Depreciation Amortization Provision for doubtfbl accounts Provision for (benefit of) claims
Total operating expenses
2011
$ 11,787,614 18,081,523 27,216,035 3,369,643 3,320,100
16,054,154 34.770,439 25.185.237 34,772,279
165,080 867.460
(4.680,454) $170,909,110
2010
$ 12,606,851 19,029,752 15,915,361 5,314,887 3,386,338
16,060,032 33,616,025 28.457.226 35.216,611
164,415 4.855,325 3,186,714
S 175,809,537
Increase (Decrease)
S (819,237) (948,229)
11,300,674 54,756
(66,238) (5.878)
1,154,414 (3.271.989)
(444.332) 665
(3.987.865) (7.867.168)
$ (4,900.427)
Increase (Decrease)
-6.5% -5.0% 71.0%
1.7% -2.0% 0.0% 3.4%
-11.5% -1.3% 0.4%
-82.1% -246.9%
-2.8%
The increase in transmission and distribution expenses in 2011 of $11.3 million or 71.0% is primarily due to an increase in operation and maintenance expenses of SI 1.0 million under paving contracts. The decrease in maintenance of general plant in 2011 of $3,3 million or 11.5% resuhed primarily from additional repair and maintenance expenses incurred in 2010, Provisions for doubtful accounts decreased by approximately $4.0 million, or 82,1%, in 2011 as a result of lowered estimates on uncollectible balances and recovery of accounts that were written off in prior years. Provisions for claims decreased by $7.9 million in 2011 as compared to 2010. Claims expense varies due to the number and severity of the claims during any period. The decrease is primarily due to a decrease in overall claims reserve at year-end in addition to claims payments made during 2011.
PENSION TRUST FUND
2012 Plan Net Position
The Board's total plan net position of its pension trust fund at December 31, 2012 was approximately $209.9 million, a 6.5% increase from December 31, 2011 (see table A-7). Total assets increased 7,1% to $220.7 million.
Plan net position increased by approximately SI2.9 million in 2012 primarily due to increased unrealized gains on investments of S20.6 million in 2012 compared to $7,7 million ghin in 2011.
II-11

TaUe A-7 Sewerage & Water Board of New Orleans 1
Plan Net Position
Cash Investments Receivables Other assets
Total assets
DROP participant payable TotalliaMIities
Plan net posilion
2012
J 755.634 218,299,235
81,122 1,568,064
220,704,055
10,830,705 10,830.705
$209,873,350
2011
$ 1,493,734 203.410,658
78,126 1,111,238
206,093,756
9.121,044 9,121,044
$196,972,712
'
Increase (Decrease)
$ (738,100) 14,888,577
2,996 456,826
14,610,299
1,709.661 1,709,661
$ 12,900,638
1 Increase (Decrease)
-49,4% 7,3% 3.8%
41.1% 7.1%
18.7% -18.7%
6.5%
2011 Plan Net Position
The Board's total plan net position of its pension trust fund at December 31, 2011 vvas approximately S197.0 million, a 02% increase from December 31. 2010 (see table A-8). Total assets increased 0.4% to $206.1 million.
Plan net position increased by approximately only $0,3 million in 2011 primarily due to lower uiu-ealiised gains on investments of S7.7 million in 2011 compared to $19.2 million gain in 2010.
Table A-S Sewerage & Water Board of New Orleans
Plan Net Position
Cash Investments Receivables Other assets
Total assets
DROP participant payable Total liabilities
Plan net position
2011
S 1,493,734 203,410,658
78,126 1,111,238
206,093,756
9,121,044 9,121,044
$196,972,712
2010
S 895,812 204,209,292
38,896 96,285
205.240,285
8,752,101 8.752.101
$ 196,488,184
Increase (Decrease)
$ 597,922 (798.634)
39.230 1,014.953
853.471
368.943 368,943
S 484.528
Increase (Decrease)
66.7% -0.4%
100.9% 1054.1%
0.4%
4.2% -4.2%
0,2%
U-12

2012 Changes in Plan Net Position
Tabic A-9 1 Sewerage & WaterBoard of NewOrleans 1
Change in Plan Net Position
Additions: Contributions Net income on investments
Total additions
Deductions: Benefits Employee refunds Employee DROP contributions
Total deductions
Change in act position
Plan net position, beginning of year
Plan net position, end ofyear
- 2012 :
$ 8,933,937 21,372,939 30,306,876
(12,568,639) 011,854)
(4,725,745) (17.406,238)
12,900,638
196,972,712
$ 209,873,350
2011
S 7,832,200 8,599.418
16,431.618
(11,712,037) (185.810)
(4.049.243) (15,947.090)
484.528
196,488.184
1 S 196,972,712 | 1 1
1 Increase 1 1 (Decrease) |
$ 1,101,737 12,773,521 13.875,258
(856,602) 73.956
(676,502) (1.459,148)
12,416,110
484,528
1 S 12.900,638 1 1 ' 1
t increase 1 (Decrease)
14.1% 148.5% 84.4%
• 7.3% -39.8% 16.7% 9.1%
2562.5%
0,2%
1 6.5%
Net income on inrastments increased by $12.8 million or 25 times during 2012 due to increasing performance of the investment portfolio as compared to 2011. The increase in the dtange in plan net position of S12.9 million resulted primarily from an increase in unrealized gains on investments compared to 2011 and an increase of $1.4 million or 9,1% hi deductions compared to 2011.
11-13
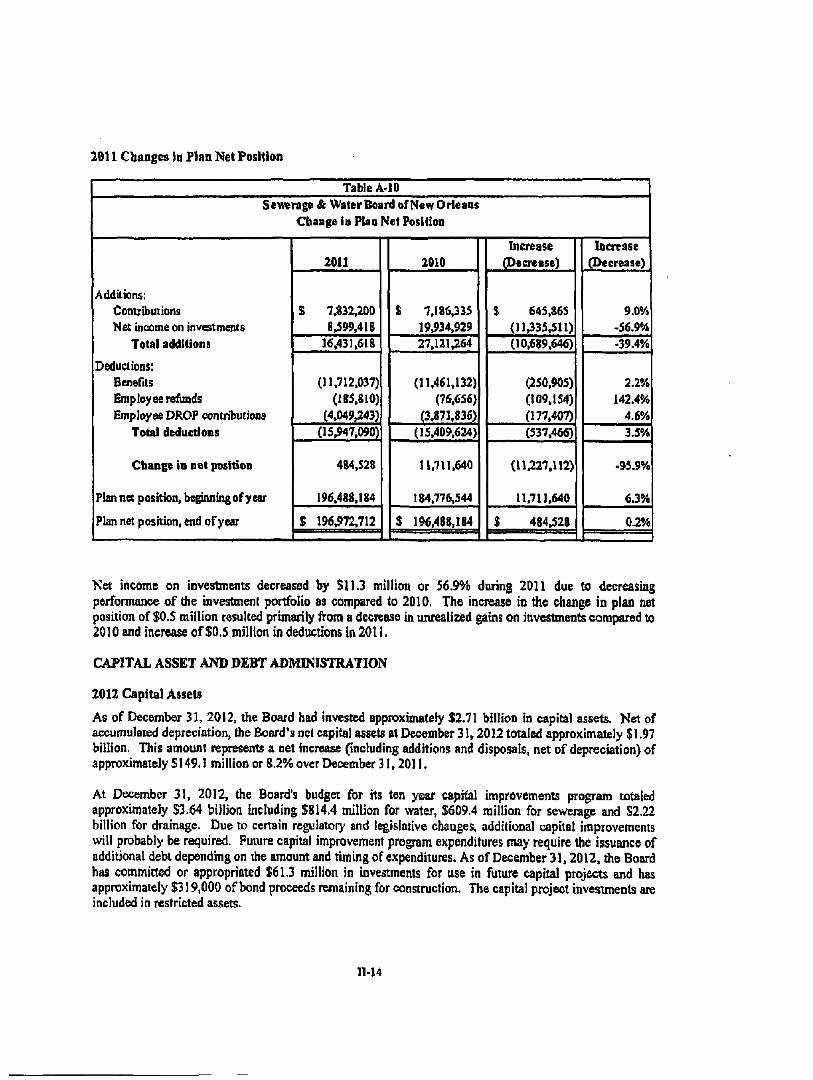
2011 Changes in Plan Net Position
Table A-IO
Sewerage & WaterBoard of New Orleans 1 Change in Pian Net Position
Additions: Contributions Net income on investments
Total additions
Deductions: Benefits Employee refinds Employee DROP contributions
Total deductions
Change in net position
Plan net position, beginning of year
Plan net position, end ofyear
2011
S 7.832.200
8.599,418 16,431,618
(11.712.037) (185,810)
(4.049,243) (15,947i090)
484,528 I
196,488,184
$ 196,972,712
1
2010
S 7.186335 19,934.929 27.121.264
(11.461.132) (76,656)
(3.871.836) (15.409.624)
11.711.640
184.776.544
$ 196.'I88,184 •
Increase (Decrease)
$ 645.865 (11335,511) (10,689.646)
(250.905) (109,154) (177,407)
(537.466)
( IU27 .U2)
11,711.640
i 484.528 M l 1 1 1
Increase (Decrease)
9.0% -56.9% -39.4%
2.2% 142.4%
4.6%
3.5%
-95.9%
6 3 %
0.2%
Ket income on investments decreased by SI 1.3 million or 56.9% during 2011 due to decreasing performance of die investment portfolio as compared to 2010. The increase in the change in plan net position of $0.5 million resulted primarily from a decrease in tmrealized gains on investments compared to 2010 and increase of $0.5 million in deductions in 2011.
CAPTTAL ASSET AND DEBT ADMINISTRATION
2012 Capital Assets
As of December 31, 2012, the Board had invested approximately $2.71 billion in capital assets. Net of accumulated depreciation, the Board's net capital assets at December 31,2012 totaled approximately $1.97 billion. This amount represents a net increase (including additions and disposals, net of depreciation) of approximately S149.1 million or 8.2% over December 31.2011,
At December 31, 2012, the Board's budget for its ten year capital improvements program totaled approximately S3.64 billion including $814.4 million for water, $609,4 million for sewerage and S2,22 billion for drainage. Due to certain regulatory and legislative changes, additional capital improvements will probably be required. Future capital improvement program expenditures may require the issuance of additional debt depending on the amount and timing of expenditures. As of December 31,2012, the Board has committed or appropriated $61.3 million in investments for use in future capital projects and has approximately $319,000 of bond proceeds remaining for construction. The capital project investments are included in restricted assets.
11-14

The capital improvements budget for 2012 is $1.56 billion, including S76 million for projects which are expected to be funded by federal grants and programs. Significanl projects included in property, plant and equipment in progress as of December 31,2012 include the following:
Hurricane Katrina-related Repairs and Replacements Southeast Louisiana Flood Control Program
Sewer System Sanitation Evaluation and Rehabilitation Program Drainage Pumping Station #1
Eastbank Sewer Treatment Plant Westbank Sewer Treatment Plant
Sodium Hypochlorite Bulk StoragcTeed Facility at the Main Water Purification Plant Wetlands Assimilation Project
See Note 4 for detailed capital asset activity during 2012.
2011 Capital Assets
As of December 31, 2011, the Board had invested approximately $2.53 billion in capital assets. Net of accumulated depreciation, the Board's net capital assets at December 31,2011 totaled approximately $1.82 billion. This amount represents a net increase (including additions and disposals, net of depreciation) of approximately $108.9 million or 6.4% over December 31,2010.
At December 31, 2011, the Board's budget for its ten year capital improvements program totaled approximaiely $3.6 billion including $813.4 million for water, $551.7 million for sewerage and $2.2 billion for drainage. Due to certain regulatory and legislative changes, additional capital improvements will probably be required. Future capital improvement program expendimres may require the issuance of additional debt depending on the amount and timing of expenditures. As of December 31,2011, the Board has committed or appropriated S76.2 million in investments for use in fiiture capital projects and has approximately $176,000 of bond proceeds remaining for construction. The capital project investments are included in reshncted assets.
The capital improvements budget for 2011 is $1.6 billion, including £67.4 million for projects which are expected to be funded by federal grants and programs. Significant projects included in property, plant and equipment in progress as of December 31, 2011 include the following:
Hunricane Katrina-related Repairs and Replacements Southeast Louisiana Flood Control Program
Sewer System Sanitation Evaluation and Rehabilitation Program Drainage Pumping Station #1
Eastbank Sewer Treatment Plant Westbank Sewer Treatment Plant
Sodium Hypochlorite Bulk Storage/Feed Facility at the Main Water Purification Plant
See Note 4 for detailed capital asset activity during 2011.
2012 Debt Administration
The Board continues to make its regulariy scheduled payments on its bonds. During 2012, $16.2 million in principal payments were made.
11-15

The Louisiana Department of Health and Hospitals has committed to loan the Board up to $3.4 million to fund the installation of a new sodium hypochlorite storage and feed facility as well as the installation of a new sludge line into die Mississippi River (project). The outstandmg balance is $1,998,636 at December 31,2012.
The Louisiana Department of Environmental Quality has committed to loan the Board up to $9 million to fund construction of sewerage treatment works, implementing a management program under Section 1329 of the Wafer Quality Act of 19S7, and de\'eloping and implementing a conservation and management plan under Section 1330 of the Federal Act. The outstanding balance is $7,47l,S0S at December 31,2012.
See Note 6 for detailed long term debt activity during 2012.
2011 Debt Administration
The Board continues to make its regularly scheduled pajrments on its bonds. During 2011, SIS.4 million in principal payments were made.
The Louisiana Department of Heahh and Hospitals has commhted to loan the Board up to $3.4 million to fund the installation of a nen.v sodium hypochlorite storage and fiaed facility as well as the installation of a new sludge line into the Mississippi River (project). The outstanding balance was $1,503,834 at December 31,2011,
The Louisiana Department of Environmental Quality has committed to loan the Btrard up to $9 million to ftind construction of sewerage treatment works, implementing a management program under Section 1329 of the Water Quality Act of 19S7, and developfaig and implementing a conservation and management plan under Section 1330 of the Federal Act. The outstanding balance was $98,375 at December 31.2011.
See Note 6 for detailed long term debt activi^ during 2011.
ECONOMIC FACTORS AND RATES
There are continued signiflcani other revenues and expenses which impact the Board. State and fedeml grants related to the disaster are expected to have a significant impact on 2013 as in the past few years. Total FEMA debris removal, mitigation, and capital replacement grants are expected to exceed $537.8 million. Of this amount, approximately S281.8 million has been recognized through 2012. FEMA revenues will continue to be recognized as buildings, systems, and other reimbursable assets are repaired or replaced. In 2013, the Board will recognize additional portions of these revenues but much of the construction and replacement will not have been completed and the revenues although measurable may not be readily available due to the delays in actual receipts of FEMA funds.
The Board, the City Council, and the Board of Liquidation City Debt approved rate increase often pei cent for the Water and Sewer Department effective January 1,2013 and annually thereafter through 2020.
The Board also authorized a study to develop a drainage service charge amount and implementation methodology.
U-16

The number of open accounts has increased from 117,913 at the end of 2009 to 128,002 at the end of 2012, an increase of 8.56%. The number of open accoimts decreased significantly in 2006 and 2007. However, the number of open accounts increased in 2011 by 3,027 and increased by 2,359 in 2012.
CONTACTING THE BOARD'S FINANCIAL MANAGEMENT
This financial report is designed to. provide our bondholders, patrons, and other interested parties with a general overview of the Boiu^'s finances and to demonstrate die Board's accountability for the money it receives. If you have questions about this report or need additional fmancial mformation, contact the Sewerage & Water Board of New Orleans at (504) 585-2356.
11-17

BASIC FINANCIAL STATEMENTS

(This page intentionally left blank)

SEWERAGE AND WATER BOARD OF NEW ORLEANS STATEMENTS OF NET POSITION
December 31,2012 and 2011
ASSETS 2012 2011
Koncuirect assets:
Propeit)', plant and equipment Less: accumulated depreciation
Property, plant and equipment, net
Other tasea: Bond issuance cosu Deposits
Total other assets
Total noncurrcnt assets
Cuncm assets: Unrestricted:
Cash Accounts receivable:
Customers, net of aUo\»wce Taxes Grants Miscellaneous
Inventoiy of supplies Prepaid expenses
Total unreswicKd
Restricted Investme^is: Capital projects Consttucuon funds Debt service reserve Customer deposits Health insurance reserve Other
Total restricted
Total current assets
Total assets
S 2,711.454.277 742,922,354
1.968,531,923
1,767.920 51,315
i.819.235
1.970.351,158
S 2.526,472.267 707.120,221
1,819,352,046
1.936.337 51.315
1.987.652
1.821,339.698
8.607.217 16,159.335
13.555.071 7.732.452
22.988,323 2,637,158 7,698,327
751,106 63,969,654
61,355,875 319.442
35,186,883 9,492,988 5,362,863
591,038 112.309,089
176.278,743
J 2.146.629,901
12,475,783 6,895,232
26.572,959 2,708.045 8,024,117
721.650 73,557.121
76.150,163 175,768
33,137,542 8.849,159 5,350,225
554.981 124,217,838
197,774,939
I 2,019,114,657
(Continued)
11-18

SEV^RAGE AND WATER BOARD OP NEW ORLEANS STATEMENTS OF NET POSITION
Deeember 31,2012 and 2011 (Continued)
NET POSITION A.ND LIABILITIES
2012 2011
Net position: Net Investment in capital assets Restricted for debt service Unrestricted
Total net position
Long-term liabilities: Claims payable Net pension obligation Other posu«tirement benefits liability Bonds payable, net of current matairlties Special Community Disaster loon payable Southeast Louisiana Project Utility Debt Service Assistance Fund loan payable, net of cunrent maturities
Total long-term liabilities
Current liabilities (payable firom cunent unrestricted assets): Accounts payable Due to Ci^ of New Orleans Due to other govemments (Note 13) Retainers and estimates poyable Due to pension trust fund Accmed salaries. Accrued vacation and sick pay Claims p^«ble
Debt Service Assistance Fund loan payable Other liabilities
Total cutimt liabilities (payable fiom cunent unrestricted assets):
Current liabilities (payable firom cuncni restricted assets): Accrued interest Bonds payable Retainers and estimates payable Customer deposits
Total current liabilities (payable from ctirrentresuicted assets):
Total current liabilities
Total liabilities
Total net position and liabilities
See accompanying notes to financial statements,
1,762.389,823 $
35.186,883 (196,964,143) _
1.600.612.563
2,234.075 11,123,890 48,072.203
189.079,542 29,576.512 14,23].768 69.917.539
364.235.529
151,798.932
2,395,406 17,382,000
712.483 9.492.988
29,982.877
181,781.809
546,017.338
S 2,146.629.901
1,604,703.877 33,137.542
(140.655.061)
1.497.186,358
2,861,441 8.8S8.332
40.781,954 198.674,937 25,166,747
71,754,085
348.127.496
36,861.750 160.093
85,275.609 2,840,502
78,013
1,799.861 9.803.436
10.977.109 3,859.428
143,131
41.212,632 107,442
67,894,157 3.293.968
127,133
1.255.349 10,265,830 12.040.040 5,711,162 3,719.226
145.626,941
2.534,988 16,149,000
640,715 8,849,159
28.173.862
173,800.803
521,928,299
2,019,114,657
ri-19
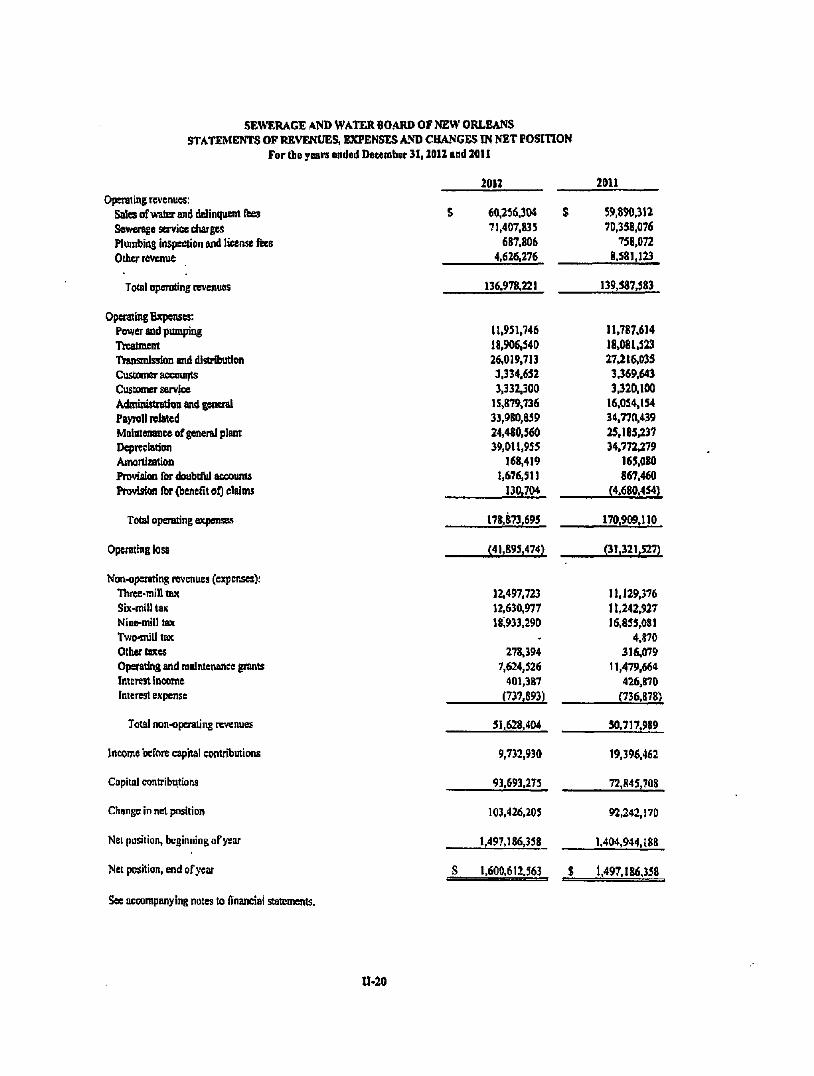
SEWERAGE AND WATER BO.ARD OF NEW ORLEANS STATEMENTS OF REVENUES, EXPENSES AND CHANGES IN NET POSITION
For (he years ended December 31,2012 and 2011
2012 2011
Operating revenues: Sales of u'atcr and delinquem fbes Sewerage service charges Plumbing inspection and lictnse fees Other revenue
Total operating revenues
Operating Expenses: Power end pumping Treatment Transmission and distribution Customer accounts Customer service Administration and general Payroll related Maintenance of general plam Depreciation Anuirtization Provision for daubtf\J accounts Provision Ibr (benefit of) claims
Total operating expenses
Operating loss
Non-operating revenues (expenses): Three-mill tax Six-mill tax Nine-mill tax Two-mill tax Other taxes Operating and maintenance grants Interest income Interest expense
Total non-operating revenues
Income before capital contributions
Capitol contribtitiarj
Change in net position
Nei pusitian, beginning ofyear
Net position, end ofyear
See accompanying notes to /Tnancial statements.
S 60,256.304 $ 71,407.835
687.806 4,626,276
136,978,221
11.951,746 18.906,540 26,019.713 3.334.652 3,332.300
15,879.736 33,980,859 24,480,560 39,011,955
168,419 1,676,511
130,704
178,873,695
(41,895,474)
12.497.723 12,630,977 18.933.290
-278.394
7,624,526 401,387
(737,893)
51,628,404
9,732,930
91,693,275
103,426,205
1.497,186,358
S 1,600.612.363 i
59,890,312 70,358,076
758,072 8.581,123
139,587,583
11.787.614 18.081.523 27.216.035 3J69.643 3.320.100
16.054.154 34.770,439 25.185,237 34.772.279
165.080 867.460
(4.680.454)
170.909.110
(31,321,527)
11.129.376 11,242.927 16,855,081
4,870 316,079
11,479,664 426,870
(736.878)
50,717,989
19,396.462
72.845,708
92,242,170
1.404.944.188
i 1.497.186,358
U-2D

SEWXRAGE AND WATER BOARD OF NEW ORLEANS STATEMENTS OF CASH FLOWS
ENTERPRISE FUND For the yoars ended December 31,2012 and 2011
2012 2011 Cash flows &om operating activities
Cash rmeived flnm customers Cash payments to suppliers for goods end services Cash pa>7nents to employBes for services Olher revenue
Net cash provided by operating acti^'ities
Cash flows from noncapital financing activities Proceeds from property taxes Proceeds from federal operating and maintenance grants
Net CASh provided by nonoaplal floanchig activities
Cash flows fiom capital and related financing activities Acquisition and construction of capital asseu Principal payments on bonds payable Proceeds from bonds payable Proceeds fi^om Debt Service Assistance Fund I6an Principal payments on Debt Sevice Assistance Fund loan Payments for bond Issuance costs Interest paid on bonds psQ^ble Proceeds from construction fund, net (Note 13) Capital contributed by developers and federal gironts
Net cash used in capital and related financing activities
< ^ h flows from investing activities Pt><ments for purchase of investments Proceeds from maturities of investments Investment income
Net cash provided by (used in) investing activities
Net increase (decrease) in cash
Cash at the beginning of the year
Cash at the end of the year
Reconciliation of cash and restricted cosh (Note 2) Current assets-cash Restricted assets -cash
Total cash
S 1^8,960,991 (63.842,090) (64.800,112)
5484,969
5.703.758
43.503,164 5.040.113
48.543,277
(113,016,485) (16,175,000)
7.957.932 •
(3,688,280) -
(14.431.884) 17.381,452 47,381.086
(74,611.179)
(1.093,585,995) 1.101.209.284
259.448
7.882.737
(12,481.407)
89.408,416
$ 76,927.009
$ .8,607.217 68.319.792
i 76,927.009
S 131.688,497 (64.804,326) (62,177.005)
9.873.742
14.580,908
42.208,555 3366.850
45.575.405
(127,102,736) (15,360.000)
994.367 4.854
-(77.745)
(9,373,299) 8,074,749
89,131,241
(53,708.569)
(1,060.300,624) 1,059.091.196
308,080
(901.348)
5.546.396
83,862,020
$ 89.408,416
$ 16.159,335 73.249.081
S 89.408.416
(Continued)
Q-21

SCWT^RAGE AND WATER BOARD OF NEW ORLEANS STATEMENTS OF CASH FLOWS
ENTERPRISE FUND For the years ended December 31,2012 and 20111
(Continued)
2012 2011
Reconciliation of operating loss to net cash provided by (used in) operating activities is as follows: OpcTirting toss .Adjustments to reconcile nst operating loss to oet cash
ust i in Operating activities: Depreciation Pro\'ision for (benefit of) claims Prevision fbr doubtiUl accounts Amortixation Change in operating assets and liabilities:
(Increase) decrease in customer receivables Decrease in inventory Decrease m prepaid expenses
and other receivables Increase in net pension obUgation Increase (decrease) in accounts payable Increase in accrued salaries, due to
pension and accrued vacation and sick pay Increase in net other postretirement benefits liability Decrease in other liabilities
Net cash provided by operating activities
See accompanying notes to (inuncial statements.
S (41,895.474) $
39,011,955 130,704
1,676,511 168,419
(2.755,799) 325,790
41,431 2,235,558 1.209,768
32.996 7,290,249
(1,768,350)
S 5,703.758 S
(3U2I,527)
34.772.279 (4.680,454)
867.460 165,080
1.440,081 2.340.578
503,157 3,912,279
285,521
31,955 7.712.867
(1.448.368)
; 14,580.908
U-22

SEWERAGE AND WATER BOARD OP NEW ORLEAJ^S STATEMENTS OF PLAN NET POSITION
PENSION TRUST FUND December 31,2012 and 2011
See accompanying notes to financial statements.
2012 2011
Assets: Cash Receivables:
Investment income Employee contributions receivable
Due fiorn other fluid Investmoits:
Money market LAMP Debt securities Hedge funds Equities
755,634 1,493,734
68,850 12,272
1,568,064
1.242,693 12,200,194 74,182,056 18.459,666
112214.626
55.724 22,402
1,111,238
478,207 9.156,807
73,055,847 17/450.681
103,269.116
Total assets
Liabilities: DROP participants payiable
Total liabilities
Net position - restricted for pension benefiU $
220.704,055
10.830,705
10,830.705
209.873.350 $
206,093,756
9,121,044
9,121.044
196.972.712
11-23
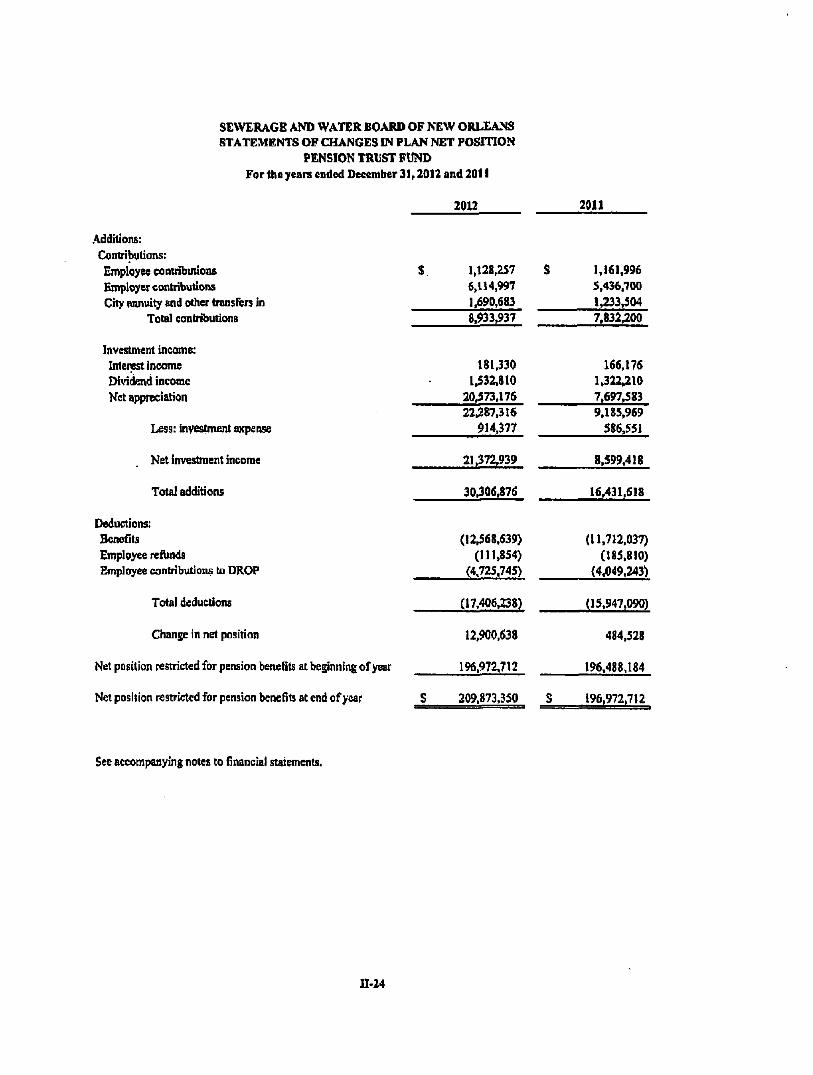
SEWERAGE AND WATER BOARD OF NEW ORLEANS STATEMENTS OF CHANGES IN PLAN NET POSITION
PENSION TRUST FUND For the years ended December 31,2012 and 2011
.Additions: Ckintributions: Employee contributions Employer contribudons City annuity and other transfers in
Total contributions
Investment income: Interest income Dividend iticome Net appreciation
Less: iny^tment expense
Net investment income
Total additions
Deductions: Benefits Employee reiUnds Employee contributions lo DROP
Total deductions
Change in net position
Net posilion restricted for pension benefits al beginning ofyear
Net position restricted for pension benefits at end ofyear
2012 2011
$ 1,128,257 S 6.114,997 1.690,683 8.933.937
181.330 1.532,810
20.573.176 22.287.316
914.377
21.372,939
30.306,876
(12,568.639) (111,854)
(4.725.745)
C17,406J!38)
12.900.638
196,972,712
S 209,873.350 S
1,161,996 5,436.700 1,233,504 7,832.200
166,176 1,322,210 7,697.583 9.185,969
586,551
8.599.418
16.431,618
(11,712,037) (185.810)
(4.049,243)
(15,947,090)
484,528
196,488.184
196,972,712
See accompanying notes to financial statements.
n-24
(This page intentionally left blank)

NOTES TO BASIC FINANCIAL STATEMENTS

(This page intentionally left blank)

SEWERAGE AND WATER BOARD OF NEW ORLEANS
NOTES TO FINANCIAL STATEISfENTS
(1) Summary of Significant Accounting Policies
History and Organization
The major operation of the Sefwerage and Water Board of New Orleans (the Board) is providing water, sewerage and drainage services for the City of New Orleans (the City). The Sewerage and Water Board of New Orleans was created by Act 6 of the Louisiana Legislature of 1899 as a special board independent of flie C i^s goveininent to construct, maHitain and operate a water treatment and distribution system and a public sanitary sewerage system fbr the City. In 1903, the Legislature gave the Board control of and responsibility for the C'lt/B major drainage system and relieved the City of the duty of providing in its annual operating budget or otherwise for the maintenance and operations of the water, sewerage and drainage systems.
In accordance with the Louisiana Revised Statutes (LRS) 33:4096 and 4121, the Board has the autiiority to establish the water and sewerage rates to charge to its customers. The rates are based on the actual water consumed and on the costs of mamtenance and operation of the water and sewerage systems, including the costs of improvements and replacements, ll ie collections of water and sewerage revenues are to be used by the Board for the maintenance and operation of the ^sterns, the cost of improvements, betterments, and replacements and to provide for the payments of interest and principal on the bonds payable, On March 21,2007, the Board apptovei a series of five annual water rate increases beginning with the &st mcrease on November 1,2007 followed by four additional increases to be implemented on July 1 of each year, 2008 through 2011. The New Orleans City Council approved the annual water rate increases on October 4, 2007. Furthermore, On November 14, 2012, the Board approved both sewer and water rate increases commencing January 1,2013. The sewer and water rates increase approximately 10% each year imtil the year of 2020. This increase was approved by the New Orleans City Council on November 14,2012.
The Board has also been given the audiority to levy and collect various tax millages which are used for the operation and maintenance of the drainage operations. All excess revenues collected are made available for capital development of the system. The proceeds of the rate collections and tax millages are invested in such investments as authorized by the LRS. These investmwits are reflected in the combmed statement of net position, as "restricted assets," as t h ^ are restricted to the purposes as described above.
The Board Is composed of thirteen members, Including the Mayor of the City, three City Council members, at least one an at-Iarge •member, selected by the City Council, two members of the Board of Liquidation and seven citizens appointed by the Mayor. The appointed members of the Board serve staggered nine year terms.
The Board's accounting policies conform to accounting principles generally accepted in the United States of America as applicable to utilities and to governmental units. The following is a summai^' of tlie more significant policies.
(A) Reporting Entity
In conformity with the Governmental Accounting Standards Board's definition of a reporting entity, the Board includes an enterprise fund and a pension trust fund for financial reporting purposes. The Board is considered a reporting entity based on the following criteria:
n-25

SEWERAGE AND WATER BOARD OF NEW ORLEANS
NOTES TO FINANCUL STATEMENTS (Continued)
(1) Summar\' of Significant Accounting Policies (continued)
(A) Reporting Entity fcontinued)
(a) Responsibility for surpluses/deficits. The Board is solely responsible for its surpluses/deficits. In accordance with Louisiana Revised Statutes, no other governmental unit is responsible fbr the Board's deficits or has a claim to its surpluses. The Board's operations are self-sustaining; revenues are generated through charges to customers and dedicated property taxes. Other than grants, no funding is received fivm the State of Louisiana or the City of New Orleans.
(b) Budget Approval. The Board is solely responsible for reviewing, approving and re\'ising its budget
(c) Responsibility for Debt. The Louisiana Revised Statutes authorize the Board to issue bonds; such bonds must bear on their face a statement that they do not constitute a debt of the City. The Board is solely responsible for payments to the bondholders. No other governmental unit is required by statute to make any payments to bondholders nor have any payments to bondholders ever been made by any governmental unit, except die Board.
(d) Designation of Management. The Board controls the hiring of managemmt and employees.
(e) Special Financial Relationship. The Board has no special fmancial relationships with any other governmental unit
(f) Statutory Authority. The Board's statutory authority was created by the State of Louisiana as an independent governmental unit Only an amendment to the state statutes can change or abolish the Board's authority,
The Board is a stand-alone entity as defmed by Governmental Accounting Standards Board Statement 14, The Financial Reporting Entity. The Board is a legally-separate governmental organization that does not have a separately elected governing body and does not meet the definition of a component imit As a result of a Louisiana Supreme Court decision on March 21, 1994, the Board was declared to be an autonomous or self-governing legal entity, legally independent of the City, State and other governments, created and organized pursuant to Louisiana Revised Statutes 33:4071 as a board, separate and independent of the governing authorities of the City and vested with autonomous or self governing authority. No other government can mandate actions of the-Board nor impose specific financial burdens. The Board is fiscally independent to operate under its bond covenant and the provisions of Louisiana Revised Statute provisions.
The City of New Orleans includes the Board as a component unit in the City's financial statements.
11-26

SEWERAGE AND WATER BOARD OF NEW ORLEANS
NOTES TO FINANCIAL STATEMENTS (Continued)
(1) Summary of Significant Accounting Policies (continued)
(B) Basis of Financial Statement Presentation
The Board's basic financial statements consist of the govemment-wide statements which include the proprietary fund (the enterprise fund) and the fund fmancial statements which includes the fiduciary fund (tiie pension trust fimd). The Board has applied GASBS No. 62, Codification of Accounting and Financial Reporting Guidance Contained in Pre-November 30, 1989 FASB and AICPA Pronouncements, which eliminates the option for busmess-type activities to follow new FASB pronouncements, although diey may contiaue to be applied as "other accounting literature."
The operations of the Board are accounted for in the following fimd t>'pes:
Proprietar\' Fund Type
The proprietary fund is used to account for the Board's ongoing operations and activities, which are similar to those often foimd in the private sector. The proprietary fund is accounted for tistng a flow of economic resources measurement focus. With this measurement focus, all assets and all liabilities associated with the operation of tiiese fhnds are mcluded on the statement of net position. Net position are segregated into amounts invested m capital assets (net of related debt), restricted for debt service^ restricted for capital projects and unrestricted. The Board's restricted assets are expendable for their purposes. The Board utilizes available unrestricted assets before utilizing restricted assets. The operating statements present increases (revenues) and decreases (expenses) in net position. The Board maintains one proprietary fund type - the enterprise fund. The enterprise fund is used to account for operations (a) that are financed and operated in a manner similar to private business enterprises-where the intent of the governing body is that the cost (expenses, including depreciation) of providing goods or services to the general public on a continuing basis be financed or recovered primarily through user charges; or (b) where tlie governing body has decided that periodic determination of revenues earned, expenses incurred, and/or net income is appropriate for capital maintenance. The presentation of the financial statements of the enterprise fund follows the format recommended by the National Association of Regulatory Utility Commissioners (NARUC).
The statement of net position arrangement for a utility reflects the relative importance of the various accounts. "Property, plant and equipment" is the first major category on the asset side, and long-term capitalization categories of net position are listed first on the liability side. Current assets and current liabilities are assigned a relatively less important position in the center of the statement of net position, rather than being placed fu-st as in the statement of net position of conuncrcial and industrial enterprises.
Operating revenues include all charges for service; otfier revenues include reconnection fees and other miscellaneous charges. Operatmg expenses include the costs associated with providing water, sewerage and drainage services. Interest income, interest expense and tax revenues are presented as non-operating items.
The enterprise fund is presented in the govemment-wide financial statements.
n-27

SEWERAGE AND WATER BOARD OF NEW ORLEANS
NOTES TO FB^ANCIAL STATEMENTS (Continued)
(1) Summary of Significant Accounting Policies (continued)
(B) Basis of Financial Statement Presentation (continued)
Fiduciary Fund Type
The fiduciaty fUnd is used to accoimt for assets held by the Board in a trustee capacity or as an agent for individuals, private organizations, other governmental units and/or other fimds. The Board maintains one fiduciary fimd type - the pension trust foni. The pension trust fund uses die flow of economic resources measurement focus. All assets and liabilities associated with the operation of this fimd are included m the statement of plan net assets. The pension trust fUnd is used to account for die activity of tiie Board's employee retirement plan.
Tlie pension trust fimd is presented in the fimd financial statements.
(C) Basis of Accounting
The enterprise fimd and the pension trust fund prepare theh* financial statements on the accrual basis of accounting. Unbilled utility service charges are not recorded as management considers the effect of not recording such unbilled receivables as not material. Propierty taxes are recorded as revenue in the year for which they are levied. Plan member contributions are recognized hi the period m which contributions are due. ^nployer contributions to the pension plan are recognized when due and the employer has made a commitment to provide the contributions. Benefits and refunds are recognized when due and payable in accordance with the terms of the plan.
(D) Investments
Investments are reported at fair value, except for short-term investments (maturity of one year or less) which are reported at amortized cost, which approxmiates fair value. Securities traded in a national or international exchange are valued at the last reported sales price at current exchange rates. Investments that do not have an established market are reported at estimated fair value. All investment income including changes in the fair value of the invesunents is recognized in die Statements of Revenues, Expenses, and Changes in Net position.
(E) Inventory of Supplies
Inventory is valued at the lower of cost or market. Cost is determined by weighted average cost method.
(F) Vacation and Sick Pay
Vacation (annual leave) and sick pay (sick leave) are accrued when earned. Annual leave is accrued at the rate of .6923 of a workday for each bi-weekly accrual period for all employees on die payroll as of December 31, 1978. Employees hired after that date earn leave at a rate of .5 of a workday per bi-weekly pay period.
n-28
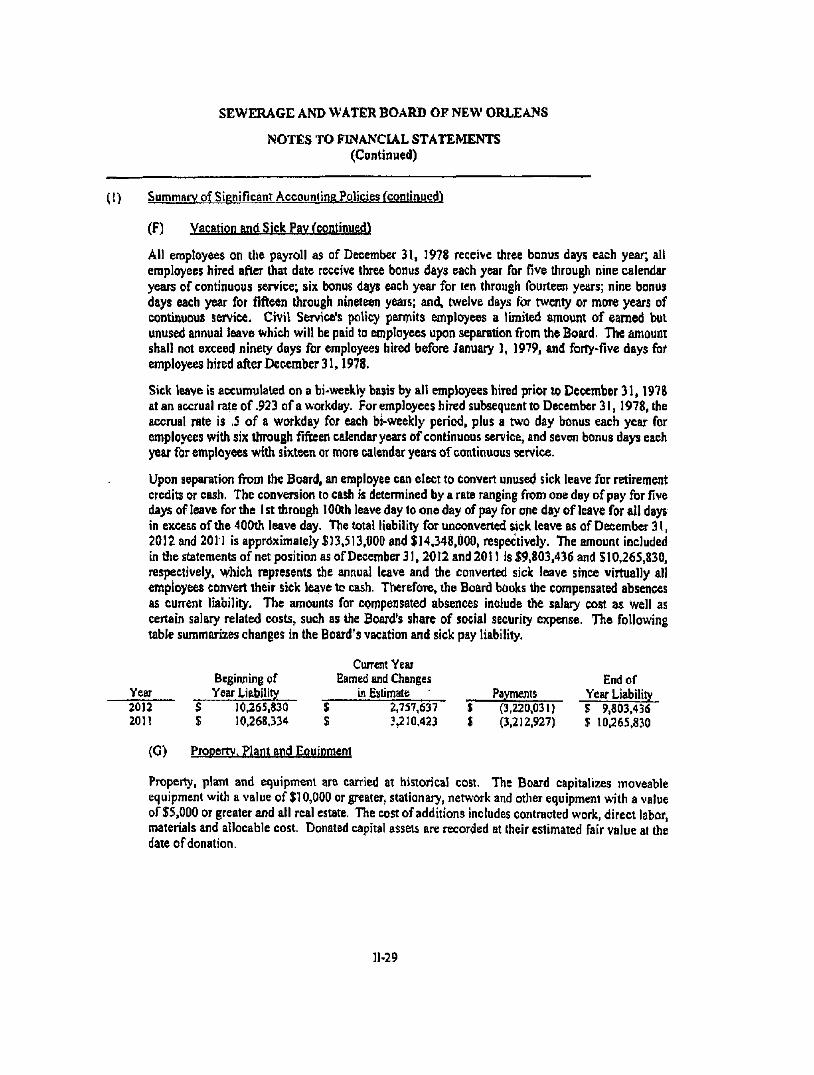
SEWERAGE AND WATER BOARD OF NEW ORLEANS
NOTES TO FINANCUL STATEMENTS (Continued)
(1) Summary of Significant Accounting Policies (continued)
(F) Vacation and Sick Pav (continued)
All employees on the payroll as of December 31, 1978 receive diree bonus days each year; all employees hired after dtat date receive three bonus days each year for five through nine calendar years of continuous service; six bonus days each year for ten through fourteen years; nine bonus days each year for fifteen through nineteen years; and, twelve days for twenty or more years of continuous service. Civil Service's policy permits employees a limited amount of earned but unused annual leave which will be paid to employees upon separation from the Board. The amount shall not exceed ninety days for employees hired before January 1, 1979, and forty-five days fbr employees hired after December 31,1978.
Sick leave is accumulated on a bi-weekly basis by all employees hired prior to December 31,1978 at an accrual rate of .923 of a workday. For employees hired subsequent to December31, 1978, die accrual rate is ,5 of a workday for each bi-weekly period, plus a P 'o day bonus each year for employees with six through fifteen calendar years of continuous service, and seven bonus days each year for employees with sixteen or more calendar years of continuous service.
Upon separation from the Board, an employee can elect to convert unused sick leave for retirement credits or cash. The conversion to cash is determined by a rate ranging from one day of pay for five days of leave for the I st through 100th leave day to one day of pay for one day of leave for all days in excess of the 400th leave day. The total liability for unconverted sick leave as of December 31, 2012 and 2011 is apprdximately $13,513,000 and $14,348,000, respectively. The amount included in the statements of net position as of December 31,2012 and 2011 is S9,803,436 and S10,26S,830, respectively, which represents the annual leave and the converted sick leave since virtually all employees convert their sick leave to cash. Therefore, die Board books the compensated absences as current liability. The amounts for compensated absences include the salary cost as well as certain salary related costs, such as the Board's share of social security expense. The following table summarizes changes in the Board's vacation and sick pay liability.
Current Year Beginning pf Earned and Changes End of
Year Year Liability in Estimate Payments Year Liability 2012 S 10.265,830 5 2,757,637 $ (3,220.031) $ 9,803,436 2011 $ 10,268.334 S 3,210,423 S (3,212.927) J 10,265.830
(G) Property. Plant and Eouipment
Property, plant and equipment are carried at historical cost. The Board capitalizes moveable equipment with a value of $10,000 or greater, stationary, network and other equipment with a value of $5,000 or greater and all real estate, The cost of additions includes contracted work, direct labor, materials and allocable cost. Donated capital assets are recorded at their estimated fair value at the date of donation.
11-29

SEWERAGE AND WATER BOARD OF NEW ORLEANS
NOTES TO FINANCLIL STATEMENTS (Cootinaed)
(1) Sununarv of Significant Accounting Policies (continued)
(G) Propeytv. Plant and Equipment (continued)
Interest is capitalized on property, plant and equipment acquired and/or constructed with tax exempt debt Depreciation is computed using the stFaight-line method over the estimated useful life of the asset When assets are retired or otherwise disposed of, the cost and related accumulated depreciation are removed ftom the accounts and tmy resulting gain or loss is recognized in revenue for the period. The cost of maintenance and repairs is charged to operations as incurred and significant renewals and betterments are c^italized. Deductions are made for retironents resulting flx>m renewals or betterments.
(H) Pension
The Board may ilmd all or part of the accrued pension cost, depending on the resources that are available at die time of contribution, for its contributory pension plan which covers substantially all employees. Annual costs are actuarially computed using the entry age normal cost method.
(I) Drainage System
In 1903, die Legislature gave the Board control of and responsibility fbr the City's drainage siystem. The Drainage System was established as a department of the enterprise fimd to account for the revenues from three-mill, six-mill and nine-mill ad valorem taxes designated exclusively for drainage services. These revenues have been supplemented by inspection and license fees collected by the Board, There exists a potential for additional financing by additional user service charges. Expendimres from the system are for the debt service of three-mill, six-mill and nine-mill tax bonds and drainage related operation, maintenance and construction.
(J) Self-Insurance/Risk Management
The Board is self-insured for general liability, workers' compensation, unemployment compensation and hospitalization benefits and claims, The accrued liability fbr the various types of claims repre.<ieni£ an estimate by management of the eventual loss on the claims arising prior to year-end, mcluding claims incurred and not yet reported including estimates of both fiiture payments of losses and related claims adjusUnenl and expense. Estimated expenses and recoveries are based on a case by case review.
(K) Capital Contributions
Contributions from developers and odiers, and receipts of Federal, State and City grants for acquisition of property, plant and equipment are recorded as capital contributions in the statement of revenues, expenses and changes in net position.
(L) Bond Issuance Costs and Refinancing Gains (Losses)
Costs related to issuing bonds are capitalized and amortized based upon die methods used to approximate the interest method over the life of the bonds. Beginning with fiscal years in 1994 and thereafter, pins and losses associated with reflmdings and advance refiindings are being deferred
U-30

SEWERAGE AND WATER BOARD OF NEW ORLEANS
NOTES TO FINANCUL STATEMENTS (Continued)
(1) Summary of Significant Accounting Policies (continued)
(L) Bond Issuance Costs and Refinancing Gains (Losses) (continued)
and amortized based upon the medtods used to approximate the interest method over the life of tiie new bonds or the remaining term on any refimded bond, whichever is shorter. Premiums associated with bond issues are amortized over die interest yield method.
(M) Cash Flows
For purposes of die statement of cash fiows, only cash on hand and on deposit at finwicial institutions is considered to be cash equivalents. Certificates of deposits, treasury bills and other securities are considered investments.
(N) Use of Restricted Assets
When restricted and unrestricted resources are available to cover expenses, unrestricted resources are first applied.
(0) Use of Estimates
The preparation of financial statements in conformity with accounting principles generally accepted in the United States of America requires management to make estimates and assumptions that affect the reported amounts of assets and liabilities and disclosure of contingent assets and liabilities as of the date of the financial statements and the reported amounts of revenue and expenditures during the period. Actual results could differ from those estimates. The current economic environment has increased the degree of uncertainty inherent in those estimates and assumptions.
(P) Net Poshion
The Board has implemented GASB No. 63, Financial Reporting of Deferred Outflows of Resources, Deferred Inflows of Resources, and Net Position, effective fiscal year 2012. This standard provides guidance for reporting the financial statement elements of deferred outflows of resources and deferred inflows of resources. Deferred outflows represent the consumption of the government's net position that is applicable to a future reporting period. A deferred inflow represents the acquisition of net posilion that is applicable to a future reporting period.
Because deferred outflows and deferred inflows are, by definition, neiUier assets nor liabilities, the statement of net assets title is now referred lo as the statement of net posilion. The statement of net position reports net position as Ihe difference between all odier elements in a statement of net positioii and should be displayed in three components—net investment in capital assets, restricted net posiUon (distinguishing between major categories of restrictions), and unrestricted net position.
11-31
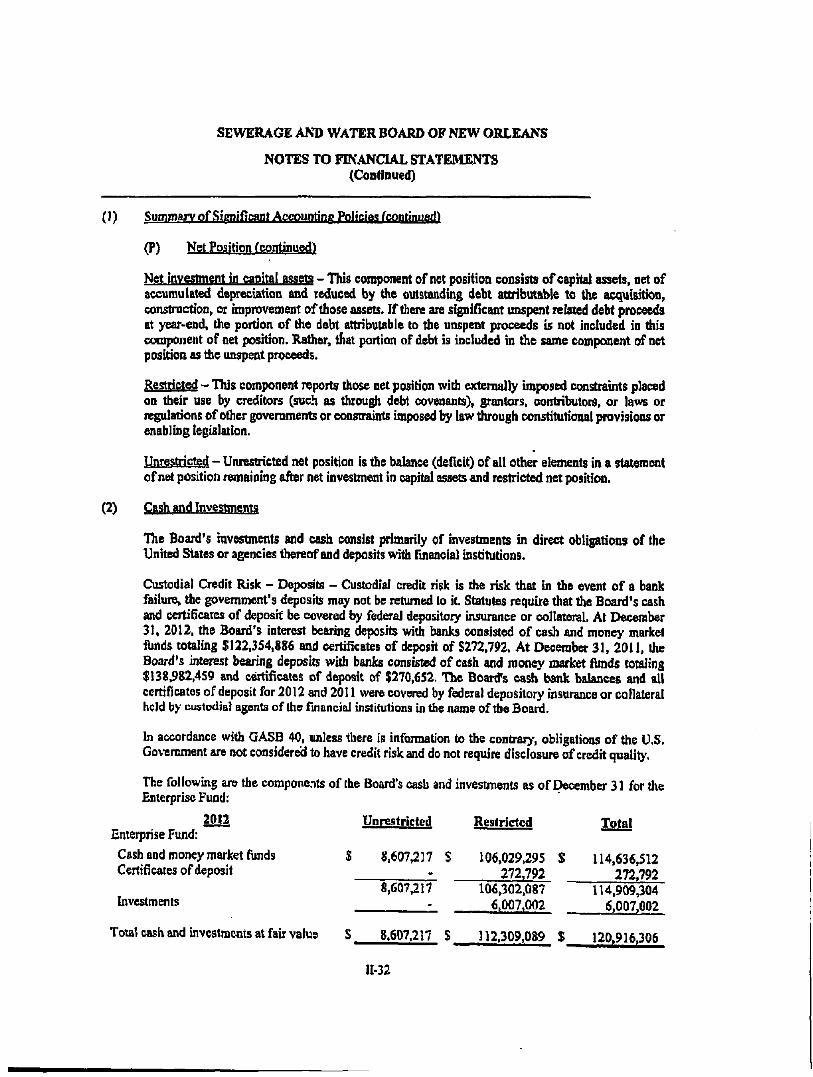
SEWERAGE AND WATER BOARD OF NEW ORLEANS
NOTES TO FINANCIAL STATEMENTS (Continued)
(1) Summary of Significant Accounting Policies (continued^
(P) Net Position (continued)
Net investment in capital assets - This component of net position consists of capita] assets, net of accumulated depreciation and reduced by tiie outstandbtg debt attributable to the acquisition, construction, or nnprovement of those assets. If there are significant unspent related debt proceeds at year-eod, the portion of die debt attributable to the unspent proceeds is not included in this component of net position. Rather, tfiat portion of debt is included in the same component of net position as the unspent proceeds.
Restricted - This component reports dtose net position widi externally imposed constraints placed on their use by creditors (such as through debt covenants), grantors, contributors, or laws or regulations of other governments or constraints imposed by law through constitutional provisions or enablmg legislation.
Unresu-icted - Unresuicted net position is die balance (deficit) of all other elements in a statement of net position remaining after net investment in capital assets and restricted net position.
(2) CftShqndlnveytmemy
The Board's ravestments and cash consist primarily of investments in direct obligations of die United States or agencies thereof and deposhs widi fmancial institutions.
Custodial Credit Risk - Deposits - Custodial credit risk is the risk that in the event of a bank failure, the government's deposits may not be returned lo it Statutes require that the Board's cash and certificates of deposit be covered by federal depository insurance or collateral. At December 31, 2012, the Board's interest bearing deposits widi banks consisted of cash and money market fimds totaling $122,354,886 and certificates of deposit of 5272,792. At December 31, 2011, die Board's interest bearing deposits with banks consisted of cash and money market fimds totaling $138,982,459 and certificates of deposit of $270,652. The Board's cash bank balances and all certificates of deposit for 2012 and 2011 were covered by federal depository insurance or collateral held by custodial agents of die financial institutions in the name of tbe Board.
In accordance with GASB 40, unless there is infonnation to the contraiy, obligations of the U.S. Government are not considered to have credit risk and do not require disclosure of credit quality.
The following are the components of the Board's cash and investments as of December 31 for die Enterprise Fund:
2012 Enterprise Fund:
Cash and money market funds Certificates of deposit
Investments
Total cash and investments at fair value
S
s
Unrestricted
8,607,2] 7
8,607,217
8.607,217
S
Restricted
106,029,295 272,792
106302.087 6.007,002
112.309.089
$
$ _
Total
114,636,512 272.792
114,909,304 6.007.002
120,916,306
n-32

SEWERAGE AND WATER BOARD OF NEW ORLEANS
NOTES TO FINANCUl, STATEMENTS (Continued)
(2) Cash and Investments (continued)
2011 Enterprise Fund:
Cash and money market fimds $ Certificates of deposit
Inv^tments Total cash and investments at fair value S
Unrestricted
16,159,335
16,159,335
16,159,335
S
$
117,940,184 270.652
118.2I0,S36 6,007.002
124,217,838
$
S
134,099,519 270.652
134370,171 6.007,002
140377.173
The composition and carrying value of mvestments is as follows:
2012 2011
6,007,002 $
2012
1,242,693 $
74.182.056 18,459,666
112,214,626
206,099,041 $
6,007,002
2011
478,207 9,156,807
73,055,847 17,450,681
103,269.116
203,410,658
Enterprise Fund: LAMP
Pension Trust Fund: Money market LAMP Debt Securities Hedge funds Equities
Investments - Statutes authorize the Board to invest in obligations of the U.S. Treasury, ^ n c i e s , and instrumentalities, commercial paper rated A-l by Standard & Poors Corporation or P-1 by Moody's Commercial Paper Record, repurchase agreements, and tiie Louisiana Asset Management Pool (LAMP). In addition, the pension trust fund is audiorized to invest in corporate bonds rated BBB or better by Standard & Poors Corporation or Baa or better by Mood/s Investors Service, and equity securities.
LAMP is administered by LAMP, Inc., a non-profit coiporation organized under the laws of die State of Louisiana. Only local government entities having contraaed to participate in LAMP have an investment interest in its pool of assets. The primary objective of LAMP is to provide a safe enviroiiment for die placement of public funds in short-term, high quality investments. The LAMP portfolio includes only securities and other obligations in which local governments in Louisiana are autiiorized to invest in accordance with Louisiana R,S. 33:2955. Accordingly, LAMP investments are restiicted to securities issued, guaranteed, or backed by the U.S. Treasury, tlie U.S. Government, or one of its agencies, enterprises, or instrumentalities, as well as repurchase agreements collateralized by those securities. The dollar wei^ted average portfolio maturity of LAMP assets is resfa-icted to not more tiian 60 days, and consists of no securities witii a maturity m excess of 397 days. L.AMP is designed to be highly liquid to provide immediate access to participants. The hi t market value of investments is determined on a weekly basis to monitor any
11-33

SEWERAGE AND WATER BOARD OF NEW ORLEANS
NOTES TO FINANCUL STATEMENTS (Continued)
(2) Cash and Invesmnents (continued)
variances between amortized cost and market value and the value of die position in the external investment pool is the same as the net asset value of the pool shares. For purposes of determining participants' shares, investments are valued at amortized cost. LAMP is subject to the regulatory oversight of the state treasurer and LAMP'S board of directors. LAMP is not registered with the SEC as an investment company.
Under die provisions of its benefit plan and state law, the Board's pension benefit trust engages in securities lending to broker dealers and other entities for cash collateral that will be returned for die same sectu-ities in tbe future. Tbe cash collateral catmot be liquidated by the Board unless die borrower defaults. Cash collateral is initially pledged at 102.49% of die market value of securities lent and additional collateral is provided by die next business day if die value falls to less than 100% of the market vahie of die securities lent. No collateral exposure existed at December 31, 2012 and 2011. The value of securities lent at December 31, 2012 and 2011 was $42,044,678 and $40,805,211, respectively. The madcet value of die cash collateral at December 31,2012 and 2011 was 543,091,726 and $41,206,879, respectively.
Credit Risk - State law limits investments in securities issued, or backed by United States Treasury obligations, and U.S. Government instrumentalities, u^ich are federally sponsored. The Board's investment policy does not fiuther limit its investment choices. LAMP is rated AAAm by Standard & Poor's. The Pension Trust Fund's hivestment policy requires that fixed income investments be investment grade (BBB or higher as rated by Standard & Poor's or Baa or higher as rated by Moody's). Bonds rated below BBB/Baa are not to exceed 15% of die portfolio and non-rated bonds are not to exceed 1% of tiie portfolio.
Following are the credit risk ratings of tiie pension trust fimd's mvestments in debt securities as of December 31,2012:
n-34
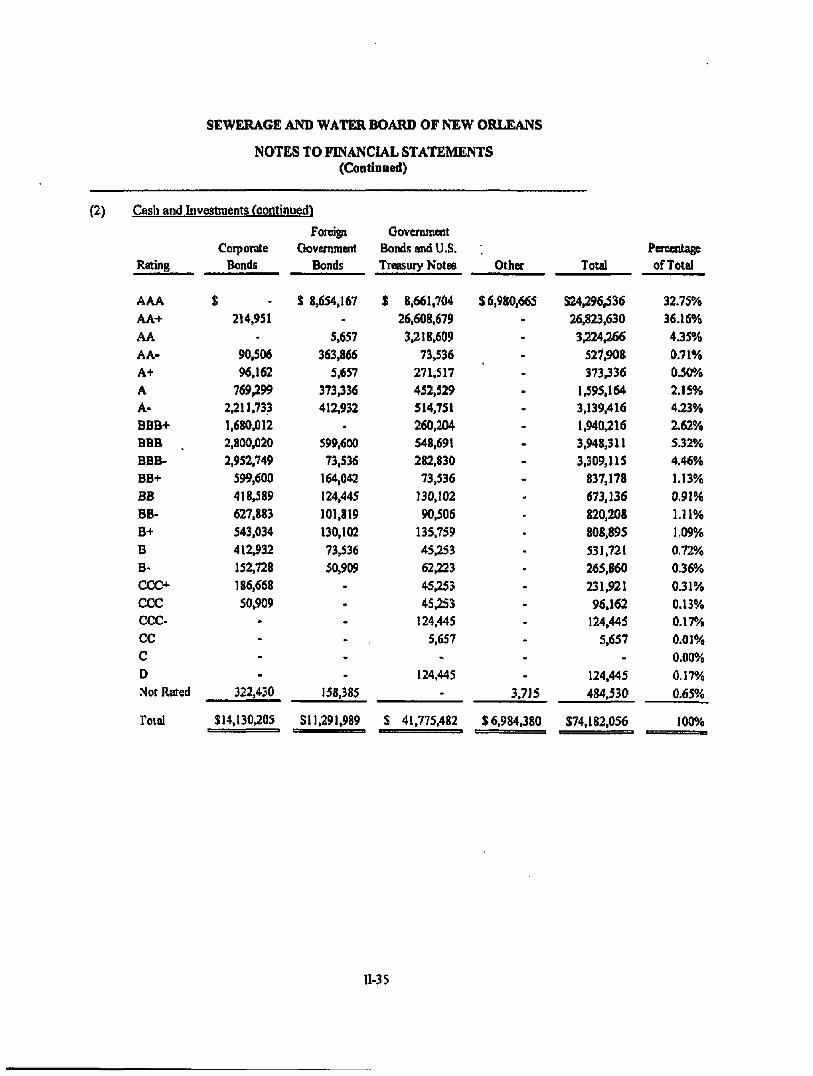
SEWERAGE AND WATER BOARD OF NEW ORLEANS
NOTES TO FINANCUL STATEMENTS (Continued)
(2) Cash and Investments (continued)
Rating
AAA AA-t-AA AA-A+ A A-BBB-f BBB BBB-BB+ BB BB-B+ B B-CCC+ CCC CCC-CC
c D Not Rated
Foial
Corporate Bonds
$ 214.951
-90,506 96,162
769,299 2.211.733 1,680.012 2.800.020 2,952.749
599,600 418.589 627.883 543.034 412.932 152,728 186,668 50,909
----
322,430
$14,130,205
Foreign Governraait
Bonds
S 8,654,167 -
5,657 363,866
5,657 373336 412,932
-599,600 73,536
164,042 124,445 101,819 130,102 73,536 50,909
------
158,385
$11,291,989
Governmem Bonds and U.S. Treasury Notes
$ 8,661,704 26.608.679 3.218.609
73,536 271.517 452,529 514.751 260,204 548,691 282.830
73,536 130.102 90,506
135.759 45.253 62.223 45353 45353
124.445 5,657
-124,445
-
S 41,775,482
Other
$6,980,665
-----
3.715
$6,984380
Total
824396,536 26.823.630 3324,266
527,908 373336
1395,164 3,139.416
1.940316 3.948311 3309,115
837,178 673,136 820,208 808,895 531,721 265,860 231,921 96,162
124,445 5.657
-124.445 484.530
$74,182,056
Percentage ofTotal
32.75% 36.16% 4J5% 0.71% 0.50% 2.15% 4JJ3% 162% 5.32% 4.46% 1.13% 0.91% 1.11% 1,09% 0,72% 0.36% 0.31% 0.13% 0.17% 0.01% 0.00% 0.17% 0.65%
100%
n-35

SEWERAGE AND WATER BOARD OF NEW ORLEANS
NOTES TO FINANCUL STATEMENTS (Continued)
(2) Cash and Investments (continued^
Following are die credit risk ratings of the pension trust fiind's investments in debt securities as of December 31.2011:
Rating
AAA AA+ AA AA-A+ A A-BBB-I-BBB BBB-BB+ BB BB-B+ B B-CCC+ CCC CCC-CC C D Not Rated
Total
Corporate Bonds
$ 6,159 190329
-122383 402.411
1,052,319 2.461,801 . 2,059,547 3,880,999 2.647,619
978,560 630,526 517,220 416,418 386,728 266,278 178,648 44,487
9,567 2,179
--
99.589
S 16353,567
Foreign Government
Bonds
$ 9,799.877 72,714 8336 2.891
62384 97350 19371 5389
597.460 117,978 133,763 271338 76,420
366,083 10837 i 49,478
--•*
---
262,783
S 12,051.486
Government Bonds and U.S. Treasury >Jotes
$ 16,416.370 237,116
20,466.793 23.046 18.874 6,507
23,940 V
--
109369 106,538
-1,242 8,295
-50.711 33.960
---
14.602 74,751
S 37,594,114
Other
$3,472,025 63328
690332 28,261
104,452 243,964 41,771
265,625 386,988 172.845 24.884
211,782 44,006 37,301
125.045 84,088 46.837
111,478 148.756 20,801 16313 86.132
629,966
$7,056,680
Total
8 29.694,431 . 563387 21,165,361
176,481 588.021
1.400.040 2346.783 2330361 4365,447 2338,442 1346376 1320,084
637,646 821,044 628,339 399,844 276,196 191,925 158323 22,980 16313
100,734 1,067.089
$ 73,055,847
Percentage ofTotal
40,65% 0.77%
28.97% 0.24% 0.80% 1.92% 3.49% 3.19% 6.66% 4.02% 1.71% 1.67% 0.87% L12% 0.86% 0.55% 0.38% 0.26% 0.22% 0.03% 0.02% 0.14% 1.46%
100.00%
Interest Rate Risk - Interest rate risk is the risk that changes in market interest rates will adversely affect the fair value of an bvestment. In general, the longer the maturity of an investment, die greater the sensitivity of its fair value to changes in market interest rates. The Board has a formal investment policy that states tiiat flie investment portfolio shall remain sufficiently liquid to meet all operating and capital requirements Oiat may be reasonably anticipated and tiiat maturities of investments are to be structured concurrent with cash needs to meet anticipated demand.
n-36

SEWERAGE AND WATER BOARD OF NEW ORLEANS
NOTES TO FE^ANCLU. STATEMENTS (Continued)
(2) Cash and Investments (continued)
As of December 31. 2012, the pension trust fimd had the following mvestments in debt securities and maturities:
Duration
Investment Type
Corporale Bonds
Foreign Government Bends
Governmem Bonds and U.S. Treasury
Notes Other
Total
Less than 1 Year
$ 1,114352
559388
1.153,948 1.073,226
$ 3.900.914
1 - 5 Years
S 7,528.944
567,138
25,068,149 -
8 33,164,231
6-10 Years
$ 2,952,749
3,326,619
7,003,585 •
S 13,282,953
Greater Than 10 Yean
$ 1,877,994
6369,346
5,670387 •
$13,917,927
DuradonNot Available
$ 656.166
469,498
2.879313
5.911.154
S 9.916,031
Total
S 14,130305
11391,989
41,775,482 6.984380
$74,182,056
As of December 31, 2011, the pension trust fund had the following investments in debt seciuities and maturities;
Duration
Investment Type
Corporate Bonds
Foreign Government
Bonds
GDvcmment Bonds
and U.S. Treasury Notes
Other
Total
Less Than 1
$
J_
Year
721.618
796,396
3,132,683
2,409.002
7.059.699
l-5Yeare
$ 8,023,780
2,849,951
22,000.038
3.325.146
S 36,198.915
6-lOYeais
$ 5,869,043
2,995307
5,194,764
245387
$ 14,304,901
Greater Than
10 Years
$ 1,717,753
5,409,932
7,265,188
474,501
S 14.867,374
IDuration Not
Available
S 21,373
-
1,441
602,144
$ 624,958
$
$
Total
16.353.567
12,051,486
37394,114
7.056,680
73.055,847
U-37

SEWERAGE AND WATER BOARD OF NEW ORLEANS
NOTES TO FTNANCLU. STATEMENTS (Continued)
(3) Defined Benefit Pension Plan
The Board has a single-employer contributory retirement plan covering all full-time employees, the Pension Trust Fund (PTF). The Board's payroll for current employees covered by die FTP'for die years ended December 31, 2012 and 2011 was $29,074,529 and $29,774,937, respectively; such amounts exclude overtime and standby payroll. Total payroll, including overtime and standby payroll, was $46,538,998 and $44,768,936 for die years ended December 31, 2012 and 2011, respectively. At December 31, the PTF membership consisted of:
2012 2011 Retirees and beneficiaries currently receiving benefits and terminated employees entitled to benefits but not yet receiving tiiem 834 822
Current employees: Vested Non-vested
509 333 842
1,676
519 333 852
1,674 Total
The benefit provisions were established by action of the Boaiti in 1956 in accordance with Louisiana statutes. The Board retains exclusive control over the plan through the Pension Committee of tiie PTF. Effective Januaiy 1, 1996, the plan became qualified under Internal Revenue Code Section 401 (a) and thus is tax exempt.
The plan provides for retirement benefits as well as death and disability benefits. All benefits vest after ten years of service. Employees who retire at or after age sixty-five with ten years of credited ser\'ice «re entitled to an aimual retirement benefit, payable biweekly for life, in an amount equal to two percent of their average compensation for each year of credited service up to ten years, increasing by (1) one-half percent per year for service years over ten years, (2) an additional one-half percent per year for service years over twenty years and (3) an additional one percent per year for service years over thirty years, for a maximum of four percent for each year of credited service. Average compensation is the average annual earned compensation (prior to 2002, less $1,200) for the period of diirty-six successive mondis of service during which tiie employee's compensation was the hi^est Employees with thirty years or more of credited service may retire without a reduction in benefits. Employees may retire prior to age sixty-two without thirty years of service widi a reduction in benefits of tiiree percent for eaoh year of age below the age of sixty-two. If an employee leaves covered employment or dies before three years of credited service, the accumulated employee contributions plus related investment earnings are refunded to the employee or designated beneficiaiy.
The retirement allowance for retirees over age sixty-two is subject to a cost of living adjustment each January 1, provided that die member retired on or after January 1, 1984, The adjustment is based on the increase in die Consumer Price Index for all urban wage earners published by the U.S. Department of Labor, but is limited to an annual maximum of two percent on tiie fust $10,000 of initial retirement benefits.
11-38

SEWERAGE AND WATER BOARD OF NEW ORLEANS
NOTES TO FINANCUL STATEMENTS (Continued)
(3) Defined Benefit Pension Plan (continued)
Effective September 23,1993, employers may transfer credit between the Board's plan and the Ci^ of New Orleans' retirement system with fiiU credit for vested service. The Board and its employees are obligated under plan provisions to make all required contributions to the plan. The required contributions are actuarially determined. Level percentage of payroll employer contribution rates is determined using die entry age normal actuarial funding metiiod. Employees are required to contribute four percent of their regular salaries or wages.
The Board bad attained fiill fiinding of the actuarially computed pension liability m 2000. Effectwe June 19,2002,'however, as a resuh of die adoption of several plan changes in accordance witii the Board's reciprocity agreement with the City of New Orleans, the plan became imfimded. These changes impacted the plan's fimding requirements by $20,333,835, which is being amortized over a 10 year period. Key dianges adopted included: (a) amendment to benefit formula; (b) adoption of a "Rule of 80" retirement; (c) change m the years of service required for a terminating employee to qualify for a later separation benefit from 10 years to 5 years; and (d) elimination of the exclusion of the first $1,200 of earnings ftom benefits and contributions. At December 31, 2012, the actuarially computed pension liability is unfimded by $53,965,718.
Tbe Btmual required contribution for the current year was determined as part of the December 31, 2012 actuarial valuation using the enby age normal cost method. The actuarial assumptions included (a) 7.0% investment rate of return (net of administrati>'e expenses) and (b) projected salary increase of 5.0% per year. Both (a) and (b) Included an Inflation component of 2,5%. The actuarial value of assets was determined using a seven-year weighted market average.
The Board's net pension activitj' for the years ended December 31 was as follows:
2012 2011 Annual required contribution Interest on net pension obligation Adjustments to annual required contribution
Annual pension cost Contributions made
Licrease in net pension liability Net pension liability, beginning ofyear
Net pension liability, end ofyear
The net pension liability is being amortized over 10 years as of December 31,2012, using the level dollar closed method and using the same interest, salary increase and inflation factors as the plan.
9,127,658 $ 622,183
(1.226,625)
8,523,216 (6387,658)
2,235.558 8,888332
11,123,890 S
9,815,606 348324
(686.715)
9,477,215 (5,564,936)
3,912379 4.976,053
8.888.332
n-39

SEWERAGE AND WATOR BOARD OF NEW ORLEANS
NOTES TO FINANCUL STATEMENTS (Continued)
(3) Defined Benefit Pension Plan (continued)
Trend information for Board and employee contributions is as follows:
Fiscal year ending: December 31,2012 December 31,2011 December 31,2010
Annoal Pension Cost
(APC)
$ 8,523316 $ 9,477315 $ 8330,508
Percentage of APC
Contributed
74% 59% 62%
Net Pension (Uability)
Asset
S (11,123,890) $ (8,888332) $ (4,976,053)
The actuarially determined contribution requirement for the Board was 31.394% fbr 2012-and 32.966% for 2011. The conuibution requirement for employees is 4.0%. The actual Board's and employees' contributions (including contributions for transferred employees ftom other pension plans) for the years ended December 31 were as follows;
2012 2011 Employer and otiier transfers Employee
Total contributions
f m M Status and Funding Prpgregs
$
S__
6,114,997 $ 1.128,257
7,243354 $
5,436,700 1,161,996
6,598,696
The fimded status of tiie Plan as of December 31,2012 and 2011, respectively, is based on die most recent actuarial valuation as follows:
Valudatlon Date
2012
2011
Actuarial Value of Assets
5 229,633,410 $229,137,699
Actuarial .Accrued
LiabUlty (AAL)
$283,599,128 $285,509317
Unfunded Actuarial Accrued Liability (UAAL)
$ 53,965318 $ 56371,618
Funded Ratio
80.97% 80.26%
Covered Payroll
S. 29,074.529 $ 29,774,937
UAAL as a Percentage of Covered
Payroll
185.61% 189.33%
The projection of benefits for fmancial reporting purposes does not explicitly incorporate the potential effects of legal or contractual fimding lunitations.
U-40
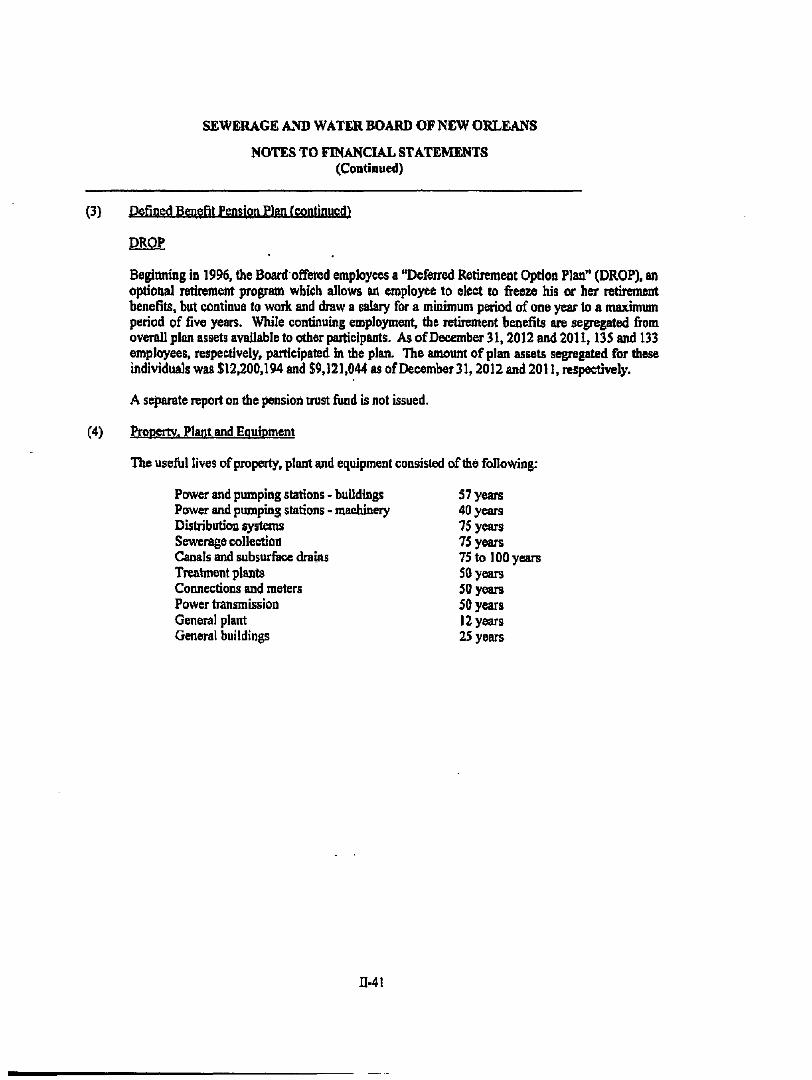
SEWERAGE AND WATER BOARD OF NEW ORLEANS
NOTES TO FINANCUL STATEMENTS (Continued)
(3) pefioed Benefit f pnsim V]m {smWrn^^}
DROP
Beginning in 1996, die Board offered employees a "Defenred Retirement Option Flan" (DROP), an optional retirement program which allovn an employee to elect to freeze his or her retirement benefits, but continue to work and draw a salary for a mbimum period of one year to a maximum period of five years. White continuing employment, tbe retirement benefits are segregated firom overall plan assets available to otiier participants. As of December 31,2012 and 2011,135 and 133 employees, respectively, participated In die plan. The amount of plan assets segregated for these individuals was $12300,194 and $9,121,044 as of December 31,2012 and 2011, respectively.
A separate report on tbe pension urust fimd is not issued.
(4) Property. Plant and Equipment
The usefiil lives of property, plant and equipment consisted of the following:
Power and pumping stations - buildings 5 7 years
Pow» and pumping stations - machinery 40 years Distribution systems 75 years Sewerage collection 75 years Canals and subsurface drains 75 to 100 years Treatment plants 50 years Connections and meters 50 years Power transmission 50 years General plant 12 years General buildings 25 years
n-41

SEWERAGE AND WATER BOARD OF NEW ORLEANS
NOTES TO FINANCUL STATEMENTS (Continued)
(4) property. Plant and Equipment (continued) Property, plant and equipment consisted of the following as of December 31:
Cost Real estate rights, non depreciabb Power and pumping stations -buildings Power and pumping stations -machineiy
Distiibution systems Sewerage coOectfon Canab and subsurface drainage Treatment plants Coimections and naetets Power transrnssibn General plant Oeneral buildings
Total property, plant and
equipmsnt in service
Construction in progress Total property, plant und equipment
Accumulated Depreciation Power and pumping stations -buildings Power and pumping stations -machinery Distribution systems Sewemge collection Canals and subsurface drainage Treatment plants Connections and meters Power Iran s rm's s io n General plant General buildings
Total accumulated depreciation
Net property, plant, and equipnient
2012 Beginning
Balance Addilbns Deletions Qiding Balance
9,427,464 S 3326,769.00 $
333380,542 33,710302
13354,233
366.990,744
243328.616 124,628.688 344.666.880
319383,473 139,877.046
48396.840 23.607.668
201.893305 7.586347
1.796.076369 730395398
2,526,472267
113313347
138,692,879 44.291.260 39315.716 66.131374 52,918389 29.109.935 13359,413
201,893.205
6,194,003 707.120321
$ 1319352,046
54,112396 98361,801
112.840332 67.685,009 54.826,990 45355,618 4379387
64368,129 -
540367,733 188,191,832
728.459365
6303.543
7.439384 2,959,741 6,060,737
3,926343 3,897,729
1382.723 563.752
5.473341
303,462 39.011,955
5 689.447,610
-(3S3388)
(1,812.752)
--
(116374) •
(927308) •
(3309,822)
(540.267,733)
(543,477355)
-
.
(353388) (1312,752)
--
(116374) -
(927308) •
(3,209.822)
S (540.267333)
297,641,612
222336301 455,694/160 386^968^82 194,704,036 94.136,184 28.187355
265334.126 7386.547
2333.134,8»)
378319397
2311.454377
121317,090
146.132,663 46.897,413 43,463.701 70,058,917
56,816,018 30,876,384
13.923.165 206,439,538
6.497,465 742.922,354
$ 1,968,531,923
n-42
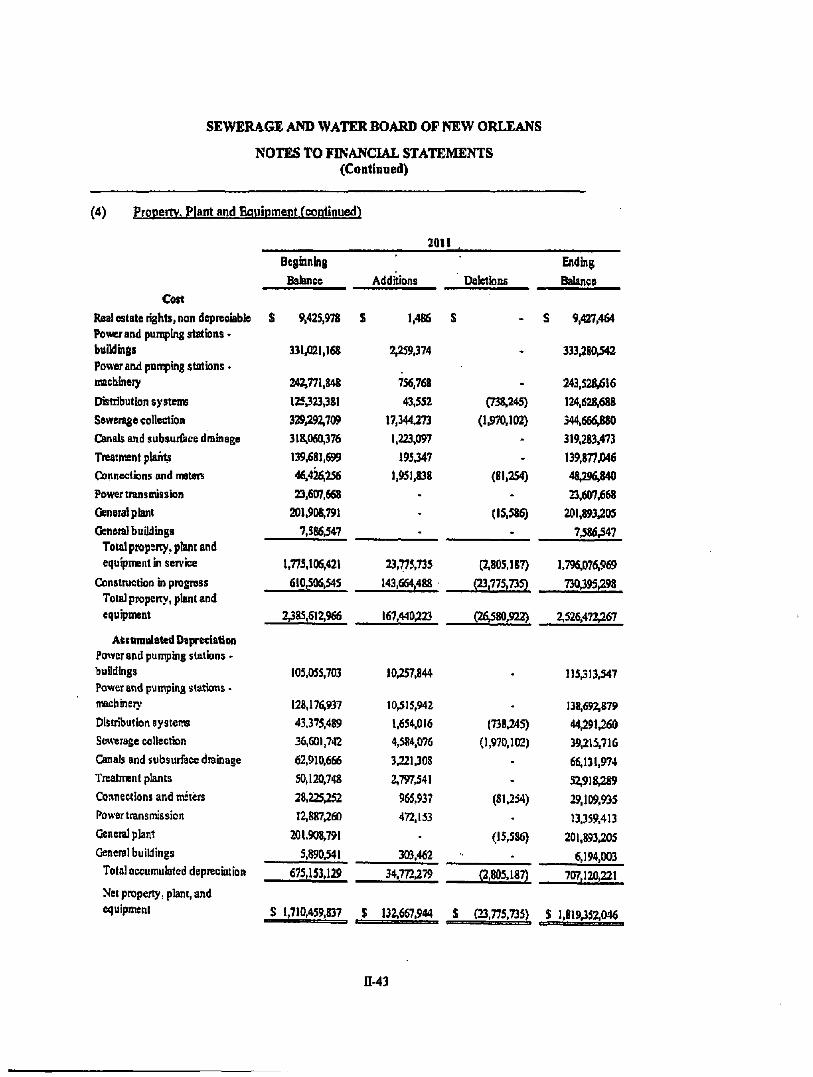
SEWERAGE AND WATERBOARD OF NEW ORLEANS
NOTES TO FINANCUL STATEMEIO'S (Continued)
f4) Property, Plant and Eouipment fcontinued)
Cost
Real estate rights, non depreciable Power and pumping stations • buildings Power and pumping stotions • machineiy
Cteitiibution systems
Sewen^e collection
Canals and subsurface drainage
Treatment plants
Connections and meters
Power transmission
Geneial plant
General buildings Total propeny. plant and equipment in ser\'ice
Constniction in progress Total property, plant and
equipmeat
Accnmntated Dtpreciation Power and pumping stations -buildings Power and puinping stations. machineiy
Distribution systems
Sewerage collection
Canals and subsurface drainage
Treatment plants
Comiectionj and metiirs
Power transmission
General plant
General buildings
Total accumulated depreciation
Net property, plam, and equipmeat
Beginniflg
Balance
S 9,425,978 S
331321,168
242,771.848
125323,381
329392,709
318,060,376
139.681,699
46.426,256
23,607.6^
201.908,791
7.S86.547
1,773.105,421
610306,545
2385,612,966
105,055,703
128,176^937
43,375,489
36,601,742
62,910.666
50,120.748
28,225352
12,887360
201.908,791
5,890341
675,153,129
S 1310,459,837 $
2011 . '
AddHbns
1,486 S
2,259,374
756,768
43,552
17,344.273
1,223,097
195,347
1,951.838
--•
23,775,735
143,664,488
167,440323
10357.844
10315,942
1,654.016
4,584,076
3J21.308
2,797,541
965,937
472.153
-
303.462
34.772379
132,667.944 $
Deletions
-
-
-C738345)
(1.970.102)
--
(81.254)
-
(15.586)
.
(2.805,187)
(23375,735)
026380,922)
.
-(738.245)
(1,970.102)
-
-
(81.254)
-
(15,586)
-
(2,805.187)
(23,775.735)
Ending
Balance
S 9,427,464
333380342
243,528,616
124,628.688
344.666^880
319383.473
139,877.046
48396.840
23.607.668
201.893,205
7.586.547
1.796.076,969
730.395398
2,526.472367
115,313.547
138.692,879
44,291360
39315316
66,131.974
32,918389
29,109,935
13.359.413
201,893305
6,194,003
707,120,221
S 1,819352.046
n-43

SEWERAGE AND WATER BOARD OF NEW ORLEANS
NOTES TO FINANCUL STATEMENTS (Continaed)
(4) Property. Plant and Equipment (continued)
Interest capitalized was as follows fbr the years ended December 31:
2012 Interest income Interest expense Net interest capitalized
$ 28,757 $ (14.433.447) (14.404.690) $
(5) Customer Receivables
Customer receivables as of December 31 consist of die following:
2012
2011
2011 55.951
(11.020.055) (10.964.104)
Water Sewer
Water Sewer
S
$ _
S
$ _
Customer Accounts
11,480,993 $ 9.547377
21.028,270 $
11,650,661 $ 9,476,841
21,127302 $
Allowance for Doubtful
Accounts 4,167,429 $ 3.305.770
7,473,199 $
4,625363 $ 4.026.156
8,651,719 $
Net 7,313364 6,241307
13,555.071
7,025.098 5.450.685
12,475,783
11-44

SEWERAGE AND WATER BOARD OF NEW ORLEANS
NOTES TO FINANCUL STATEMENTS (Continued)
(6) Changes in Long-term Obligations
(A) Bonds Payable
Bonds payable consisted of the following as of December 31: Principal Balances
2012 2011 5.00% to 635% sewerage revenue bonds, series 1997 (inidal average interest cost 5.36%), due in annual principal installments ranging firom SI, 100,000 to $2,425,000; final payment due June 1.2017 S 10,875,000 $ 12,715;000
4.125% to 6.125% water revenue bonds, series 1998 (initial average interest cost 4.82%), due in annual principal instalhnents ranging fix>m $625,000 to S 1,220,000; final payment due December 1,2018 6,535,000 7,460,000
4.125% to 6.000% sewer revenue bonds, series 1998 (Initial average interest cost 4.82%), due in annual principal instalhnents ranging from $950,000 to $1,910,000; final payment due June 1,2018 10,215,000 11,660,000
4.10% to 6.10% drainage system bonds, series 1998 (initial average interest cost 4.84%), due in annual principal installments ranging from $370,000 to $760,000; final payment due December 1.2018 4,040,000 4,610,000
5.25% to 6.50% sewer revenue bonds, series 2000 (initial average interest cost 5.48%). due in annual principal installments ranging from $820,000 to $2,205,000; final payment due June 1,2020 14305,000 15.890,000
5.00% to 7.00% sewer revenue bonds, series 2000B (initial average interest cost 5.43%), due in annual principal installments ranging from $640,000 to 81,660,000; final payment due June 1,2020 10,995,000 12,055,000
4.40% to 6.70% sewer revenue bonds, series 2001 (initial average interest cost 5.02%), due in annual principal installments ranging from Si,100,000 to 52,455,000; final payment due June 1.2021 18.370,000 19.985,000
3.00% to 5.00% sewerage service revenue bonds, series 2002 (initial average interest cost 4.36%; due in annual principal installments ranging from $1,635,000 to $4,520,000; final payment due June 1,2022. 35,950,000 38,595,000
n-45

SEWERAGE AND WATER BOARD OF NEW ORLEANS
NOTES TO FINANCUL STATEMENTS (Continaed)
(6) Changes in Lone-term Obligations Ccontinued)
(A) Bonds Payable f continued)
3.00% to 5.00% water rev^ue bonds, series 2002 (initial average interest cost 4.57%, due in annual principal instalhnents ranging firom $945,000 to $3,658,000; fmal payment due December 1,2022.
3.45% to 6.00% drainage system bonds, series 2002 (iiutial average interest cost 4.46%), due in annual principal instalhnents ranging from $510,000 to $2,155,000; final payment due December 1,2022.
230% to 5.00% sewerage service revenue bonds, series 2003 (initial average interest cost 3.94%); due in annual principal installments ranging from $140,000 to $395,000; final payment due June 1,2023.
3.25% to 6.00% sewerage ser\'ice revenue bonds, series 2004 (initial average interest cost 4.26%); due in annual principal instalhnents ranging from $945,000 to $3,685,000; final payment due June 1.2024.
3.40% to 6.25% sewerage service revenue refimding bonds, series 2009 (initial average interest cost 6.68%); due m annual principal installments ranging from $680,000 to $1,945,000; final payment due June 1, 2029.
2.95% LADHH Loan Revenue bonds, series 2010A; due in certain percentage of total drawdown; final payment due February 1,2030,
2,95% LADHH Loan Revenue bonds, series 201 OB; due in certain percentage of total drawdown; fuial payment due February 1,2030.
0.45% sewerage service subordinate revenue bonds, series 2011 (initial average interest cost 0.95%); due in annual principal installments ranging from $411,000 to $491,000; final payment due December 1,2032.
Plus: bond premiums
Total Less: current maturities Bond payable, long-term
Principal Balances 2012 2011
S 23,555,000 $ 24.955,000
13,590,000 14,380,000
3,530.000 3,780,000
22,885.000 24,315,000
21,260,000 21,990,000
746,003 628,127
1352,633 875,707
98.375 7.471.505 _
205,775,141 213,992,209 686,401 831.728
206,461,542 214,823,937 (17382.000) (16.149.000)
$ 189.079.542 $ 198,674.937
n-46

SEWERAGE AND WATER BOARD OF NEW ORLEANS
NOTES TO FINANCUL STATEMENTS (Continued)
(6) Changes in Long-term Obligations (continued)
(A) Bonds Payable (continued)
The changes in long-term debt were as follows:
2012 2011
Balance, beginning of year $ 213.992,209 $ 228,357,842 Payments (16,175,000) (15360,000) Proceeds 7,957.932 994,367
Balance, end of year S 205,775.141 $ 213,992309
Tlie annual requirements to amortize bonds payable as of December 31,2012, are as follows:
Year Principal Interest Total
2013 2014 2015 2016 2017
2018-2022 2023-2027 2028-2030
S 17382,000 $ 18338.000 19,129,000 20,084,000 21,111.000 89,114,000 15,668,000 5,049,141
9,596.438 $ 8,777,099 7.879.643 6,937,967 5,936,446
15379,185 2,801,140
262.876
26,978,438 27,015,099 27,008,643 27,021,967 27,047,446
104,493,185 18,469,140 5312,017
S 205,775.141 $ 57,570,794 $ 263,345,935
The amount of revenue bonds and tax bonds payable as of December 31,2012, are as follows:
Year 2013 2014 2015 2016 2017
2018-2022 2023-2027 2028-2030
Revenue Bonds S 15,957,000 $
16,748,000 17,574,000 18,459,000 19,406,000 79384,000 15,668,000 5,049,141
Tax Bonds 1,425,000 S 1,490,000 1,555,000 1,625,000 1,705,000 9,830,000
-.
Total 17382.000 18,238,000 19,129,000 20,084,000 21,111.000 89314,000 15.668,000 5,049,141
188,145,141 S 17.630,000 $ 205,775.141
11-47

SEWERAGE AND WATER BOARD OF NEW ORLEANS
NOTES TO FINANCUL STATEMENTS (Continued)
(6) <;3*»P gs in Long-term Obligations (continued)
(A) Bonds Pa\'able fcontinuedl
The indetitures under which these bonds were issued provide for the establishment of restricted fiinds for debt service as follows:
1. Debt service fiinds a^ required for the payment of interest and principal on the revenue and tax bonds. Monthly deposits on revenue bonds, excluding bond anticipation notes, are required to be made into tills iiind from operations in an amount equal to 1/6 of the interest falling due on the next mterest payment date, and an amount equal to 1/12 of the principal Mltng due on the next principal payment date. All debt service fimds are administered by the Board of Liquidation. The required amount to be accumulated in this fimd was $8,793,211 and $8,280,401 at December 31, 2012 and 2011, respectively; die accumulated balance at December 31, 2012 and 2011 was $12,757324 and $10,564,501 respectively. Montiily deposits to the debt service fiinds were temporarily suspended due to debt service payments being paid directly by the State of Louisiana through a Cooperative Endeavor Agreement and resumed as of June 2008. See note (6) (D) for additional infonnation.
2. A debt service reserve is required for an amount equal to but not less than fifty percent of tiie amount required to be credited in said month to the debt service fimd until tiiere shall be accumulated in the debt service reserve account the largest amount required In any fiiture calendar year to pay the principal and interest on outstanding bonds, except for the water and sewer bonds. The water bonds require an amount equal to the largest amount required in any fiiture calendar year to pay the principal of and interest on outstanding bonds. There is no debt service reserve required for the 1998 and 2002 drainage 9 mill tax bonds. The sewer bonds require an amount equal to 125% of average aggregate debt service. The amounts required to be accumulated in diis fimd were $16,424,834 and $17,136,874 at December 31, 2012 and 2011 respectively; die accumulated balance at December 31.2012 and 2011 was $20,092,504.
The Board was in compliance wfth the requirements of its long-term debt agreements for die Water Department for die years ended December 31,2012 and 2011.
The Board was in compliance witii the requirements of its long-term debt agreements for tiie Sewer Department for the years ended December 31,2012 and 2011.
(B) Special Community Disaster Loan Payable
During January 2006, the Board entered into a long-term agreement widi tiie Federal Emergency Management Agency under tiie Community Disaster Loan Act of 2005 as a result of the major disaster declaration of August 29, 2005 for Hurricane Katrina. The loan was for a term of five years, which may be extended, and shall bear interest at the latest five-year Treasury rate at the time of the closing date of tiie loan, plus one percent. Simple interest accrues from tiie date of each disbursement Payments of principal and interest are defen'ed until the end of die five year period.
n-48

SEWERAGE AND WATER BOARD OF NEW ORLEANS
NOTES TO FINANCUL STATEMENTS (Continued)
(6) Changes in Long-term Obligatiotis fcontmued)
(B) Special Community Disaster Loan Payable (continued)
In Decembra 2010, the Board was granted a partial forgiveness of this loan in tbe amount of $36,790,000 of principal and $4,648,410 of accrued interest, In addition, the Board was granted a S year extension on the payment date. As of December 31,2012 and 2011, accrued interest on the loan was approximately $4.4 million and $3.7 million, respectively. Interest rate and maturiQ' date for the loan are now as follows:
Maturity Dale Interest Rale Principal August 27,2016 2.93% S 25.166.747
Operating revenues are pledged as security for the loan. Debt service requirements relating to the loan due in 2016 include $25,166,747 of principal and $7,104,758 of faiterest
(C) LADHH Bonds Series 2010
Tbe Board, in conjunction vridi die City, entered into an agreement with the Louisiana Department of Healdi and Hospitals (the Department) whereby die Department has committed to loan the Cify up to $3,400,000 to fund the installation of a new sodium hypochlorite storage and feed facility as well as die installation of a new sludge line into the Mississippi River (Project). The loan is to be advanced in incremental amounts as project costs are incurred. The indebtedness to die Department will be evidenced through the LADHH bonds payable and the Board will pay the bonds in 20 principal installments, paj'able annually beginning no later dian 2 years after tbe Closing Date CPebruary 1, 2010) or 1 year after the completion of the Project. Each annual installment due is based upon a pre-determmed percentage of the ultimate amount of the borrowing that is not forgivable (see forgiveness provisions in die following paragraph). Principal payments of the amount repayable began February 1,2011. Interest on tiie bonds is incurred at die rate of 2.95% and pajment diereof began August 1, 2010 and is due semi-annually thereafter. As of December 31, 2012, the Project has been completed, and die amount of advances totaled $3,113,636.
A portion of the LADHH bonds payable is to be funded widi amounts provided under the American Recovery and Reinvestment Act (ARRA). Up to $1,000,000 of the ARRA Loan can be forgiven. The City received advances of $3,113,636 as of December 31, 2012. Of this amount, $1,000,000 has been forgiven, Si 15.000 has been repaid, and die remaining balance of $1,998,636 is recorded as bonds payable at December 31, 2012. The Board received advances of $2,157,836 as of December 31, 2011. Of tiiis amount, $629,002 has been forgiven, and 51,503,834 is recorded as bonds pa>'able at December 31.2011.
11-49

SEWERAGE AND WATER BOARD OF NEW ORLEANS
NOTES TO FINANCUL STATCMENTS (Continued)
(6) Changes in Lone-tenn Obligations (continued) •
(D) Sewerafte Service Subordinate Revenue Bonds. Series 2011
Tbe City entered into an agreement with the Louisiana Department of Envfronmoital Quality (LDEQ) whereby the LDEQ has committed to loan die Board $9,000,000 to fimd sewer main replacements, point repairs, replacement of associated service connections and laterals, sewer line rehabilitation by cured in-place pipe lining and manhole rehabilitation. The loan is to be advanced in incremental amounts as project costs are incurred. The indebtedness to the LDEQ will be evidenced through the Sewerage Service Subordinate Revenue Bonds, Series 2011. Annual principal payments will be due be^nning November 1. 2013 and continuing througji November 1, 2032. Interest on the bonds is incurred at the rate of 0.45%. and the LDEQ administrative fbe rate is 0.5%. Interest and administrative fee payments begin on May 1,2012 and are due semi-annually tiiereafter. As of December 31. 2012 and 2011. $7,471,505 and $98,375, respectively, have been drawn down on the loan and is recorded as bonds payable.
(E) Debt Service Assistance
In July 2006, the Board and the State of Louisiana (tiie State) entered into a Cooperative Endeavor Agreement whereby the State agreed to lend up to $77,465,247 from State fimds on deposit in die Debt Service Assistance Fund, autiiorized by die Gulf Opportunity Zone Act of 2005 and Act 41 of the First ExUtiordinary Sessioii of die Louisiana Legislahjre of 2006, to assist in payment of debt service requirements from 2006 through 2008 due to disruption of tax bases and revenue streams caused by Hurricanes Katrina and Rita. Draw downs on the loan will be made as debt service payments become due. No principal or interest shall be payable during the initial five year period of die loan. After die ex;piration of the initial five year period, the loan shall bear interest at a fixed rate of 4.64 percent. Principal payments on the bonds began in July 2012 and the loan will mature in July 2026, Interest is payable semi-annually on January 15 and July 15 begiiming January 2012. The loan may be prepaid without penalty or premium.
As of December 31,2012, debt service requirements relating to the bond are as follows:
Years Ending December 31 Principal hiterest Total 2013 2014 2015 2016 2017
2018-2022 2023-2026
S 3,859.428 4,038,505 4,225,892 4,421,973 4,627.153
26,562,566 26,041.450
$ 73,776.967
S 3.423351 3.244,173 3,056.787 2.860305 2.655326 9.850326 3.089373
S 28.180.541
$ 7382,679 7.282,678 7382,679 7382,678 7382,679
36.413,392 29.130,723
$ 101,957.508
11-50

SEWERAGE AND WATER BOARD OF NEW ORLEANS
NOTES TO FINANCUL STATEMENTS (Continued)
(6) g^^pges in IfQng-tgm QMisMiffPS f9Qfftinyg<i)
(F) Southeast Louisiana Project
In 2010, the Coastal Protection and Restoration Autiiority of Louisiana entered hto agreements (SELA PPA and SELA DPA) widi die Department of die Army for die Soudieast Louisiana, Louisiana Project in Jefferson and Orleans Parishes (the Project). The purpose of the Project is to provide flood damage reduction and interior drainage for (Cleans and Jefferson Parishes in soudieast Louisiana. Tbe agreements set forth the obligations of the federal government and nonfederal sponsors, inchidmg the Board, regarding the construction and the operation, maintenance, repair, rehabilitation, and replacement of the Project. For the projects, the federal government is liable for 65% of the project costs and the non-federal sponsors are liable for the remaining 35%. Under the agreement, tbe Department of die Army, subjea to tbe availability of fiinds appropriated by the Congress of tiie United States, shall design and construct specified work at 100% federal expense. The Board will be allowed to defer payment of its required non-federal contribution of funds of 35% and to pay said contribution of fiinds with interest over a period of not more than 30 years from the date of completion of tite project or separable element of tiie project The interest rate to be used hi computing the interest shall be determined by the Secietary of die Treasury, taking into consideration average market yields on outstandmg marketable obligations of the United States with remaining periods of mauirity comparable to tiie payment period during die month preceding the Government fiscal year in which the first federal constniction contract for such separable element is awarded to the SELA PPA, plus a premium of one-eighth of one percentage point for transaction costs.
(7) Due to City of New Orleans
The Board bills and collects sanitation charges on behalf of the City of New Orleans (the City). The Board is not liable for any uncollected sanitation charges.
Additionally, amounts included in accounts payable due to tiie City were $10,889,569 and 514,715,479 at December 31,2012 and 2011, respectively.
(8) Property Taxes
Property taxes are levied by the City of New Orleans. Taxes on real and personal property attach as an enforceable lien on the property as of January 1. Taxes are levied on January I, payable on January 1, and delinquent on Februaty 1.
11-51

SEWERAGE AND WATERBOARD OF NEW ORLEANS
NOTES TO FINANCIAL STATEMENTS (Continued)
(8) Property Taxes (continued) The assessed value of the property is determined by an elected Assessor. The assessed value fbr 2012 and 2011 was $2,949,672,237 and $2,766,725,610, respectively. The combined tax rate dedicated for die Board for die years aided December 31,2012 and 2011 was S16.43 per $1,000 of assessed valuation. These dedicated ftinds are available fbr operations, maintenance, construction and extension of tite drainage system (except fbr subsurface systems).
(9) Commitments
(A) Capital Improvements
At December 31, 2012, the Board's budget for its ten year capital improvements program totaled $2,877,910,000 including $502,600,000 for water, $308,266,000 for sewerage and $2,067,044 for dramage.
Due to certain regulatory and legislative changes, additional capital improvements will probably be required. Future capital unprovement program expenditures may require tiie issuance of additional debt depending on tiie amount and timing of expenditures. As of December 31,2012, die Board has committed or appropriated 561355,875 in investnients for use in fiiture capital projects and has $319,442 of bond proceeds remaiiting for construction. The capital project investments are included in restricted assets.
The capital improvements budget for 2013 is $1,502,628,000 includmg $76,005,000 for projects, wliich are expected to be fimded by federal grants and programs. Significant projects included in properly, plant and equipment in progress as of December 31,2012 include die following:
Hunicane Kati'lna related Repairs and Replacements Southeast Louisiana Flood Control Program
Sewer S>'stem Sanitation Evaluation and Rehabilitation Program Drainage Pumping Station ll-l
Eastbank Sewer TYeatinent Plant Westbank Sewer Treatment Plant
Sodium Hypochlorite Bulk Storage/Feed Facility aitlie Main Water Purification Plant Wetlands Assimilation Project
U-52

SEWERAGE AND WATER BOARD OF NEW ORLEANS
NOTES TO FINANCIAL STATEMENTS (Continued)
(9) Commitments (continued)
(B) Self-insurance
The Board is self-insured for general liability, workers' compensation, and hospitalization benefits and claims. Settled claims have not exceeded excess coverage in any of the past three fiscal years. Hospitalization benefits are charged to payroll related expense.
General liability claims are segregated internally by "claims" and "suits" depending on the scope and type of claim, and are handled by the Office of die Special Counsel and Administrative Seivices. Individual general liability losses have ranged from $100 to S7,500,OPO, illustinting tiie volatility of this exposure. The provision fbr clahns for 2012 and 2011 amounted to a decrease of $1,245,349 and a decrease of $4,372,097 in general liability claims payable, respectively.
Worker's compensation eTqiense provision fbr 2012 and 2011 amounted to $2,003,423 and $1,132,569, respectively.
The hospitalization self-insurance benefits are administered by Blue Cross of Louisiana. The Board's expense provision m excess of employee contributions for 2012 and 2011 was approximately $13,384,591 and $13,252,400, respectively, and is mchided in payroll related expenses.
Changes in the claims payable amount are as follows (health payments are reflected net):
Current Year Claims and
Begmning of Estimate Change Claim Payment Fiscal Year Year End of Year
2012 2011
$ $
14,901,481 21,030,331
$ S
13,345,714 9,348,118
The composition of claims payable is as follows
S (15,036,009) S (15,476,968)
2012
$ 13311.186 $ 14,901,481
2011 Short-term:
Workers' compensation Health insurance General liability Total short-term
Long-term:
Workers' compensation
Total long-term
Total
1372,932 S 2,214,496 7389,680
10.977,118
2,234.076
• • 2,234-.07^
13,211,184 . $
1,085349 2,093,499 8,861.192
12.040,040
2.861.441
2.861.441
14.901,481
n-53

SEWERAGE AND WATER BOARD OF NEW ORLEANS
NOTES TO FINANCUL STATEMENTS (Continued)
(9) Commitaients (continued)
(C) Regulatory Matters
The Sewer System Evaluation aai Rehabilitation Program (SSERP) was initially estimated to cost tiie Board $408.2 million by tite original Consent Decree end date of 2015. However, the Board has negotiated, and continues to negotiate with U.S. Environmental Protection Agency (EPA), extensions beyond the originat Consent Decree deadline. Consequentiy, the original Consent Decree has been modified to currently provide an end date of October 2019.
The Board is also participating in Federal fmancial award programs which are. subject to financial and compliance audits by various agencies. No disallowed costs have been idientified. As part of Federal and other governmental agency fimding, the Board is required to match a portion of funding received. The Board believes it has suSicient funds to meet its matching requirements.
(D) Postemplovment Healtiicare Benefits
Plan Description - Tlie Board's postemployment benefit plan is a single-employer defined benefit plan. The Board's post-employment medical benefits for retirees are provided througih a self-insured medical plan and are made available to employees upon actual retirement
The retirement eligibility (D.R.O.P. enhy) provisions are as follows: 30 years of service at any age; age 62 and 10 years of service; age 65 and 5 years of service; age 70 regaitiless of service; or, if age plus service equals at least 80. Complete plan provisions are contained in tiie official plan documents. Currently, die Board provides post employment medical benefits to 672 retired employees.
Contribution Rates - Employees do not contribute to their post employment benefits costs until they become retirees and begin receiving those benefits. The plan provisions and contribution rates are contained in the official plan documents.
Fund Policy - Until 2007, die Board recognized the cost of providmg post-employment medical benefits (tbe Board's portion of the retiree medical benefit premiums) as an expense when the benefit premiums were due and thus financed die cost of die post-employment benefits on a pay-as-you-go basis. In 2012 and 2011, the Board's portion of healtii care fiinding cost for retired employees totaled $6,412,644 and $6325.076, respectively. Effective January 1, 2007. the Board applies this amount toward tiie Net OPEB Benefit Obligation as shown in tiie tables on die following page.
n-54

SEWERAGE AND WATER BOARD OF NEW ORLEANS
NOTES TO FINANCUL STATEMENTS (Continued)
(9) (Commitments (continued)
(D) Postemplovment Healthcare Benefits (continued)
Annual Required Contribution • The Board's Annua] Required Contribution (ARC) is an amount achiarially determined in accordance with GASB 45. The ARC is the sum of the Normal Cost plus die contribution to amortize die Unfimded Actuarial Accrued Liability (UAAL). A level dollar, open amortization period of 30 years (the maximum amortization period flowed by OASB 43/45) has been used fbr the post-employment benefits. The actuarially computed ARC is as follows:
2012 2011 Normal cost 30-year UAL amortization amount Annual required contribution (ARC) $
4333,408 10,196.635
4326.296 10333.149
14.430,043 14,659.445
Net Post-employment Benefit Obligation - The table below shows die Board's Net Other Post-employment Benefit (OPEB) Obligation for fiscal years ending December 31:
2012 2011 40,781,954 $
14,430,043 1,631378
(2^58,429) 13,702,892
(6.412,643) 7390.249
48.072303 $
33,069,087
14.659,445 1321.464
(1,942,966) 14,037,943
(6325.076) 7,712.867
40,781,954
Beginning Net OPEB Obligation
Aimual required contribution Interest on Net OPEB Obligation ARC Adjustment OPEB Cost Contribution Current year retiree premium Change in Net OPEB Obligation Ending Net OPEB Obligation
The following table shows the Board's annual postemployment benefits (PEB) cost, percentage of the cost conn-ibuted, and the net unfimded post employment benefits (PEB) Uability:
Fiscal Year Ended December 31,2012 December 31,2011 December 31,2010
Annual OPEB Cost
$ 13,702,892 $ 14,070,394 $ 14323,092
Percentage of Annual Cost Contributed . 46.50%
45.06% 39.99%
Net OPEB Liability (Asset)
$48,072,203 $40,781,954 $33,069,087
E-55
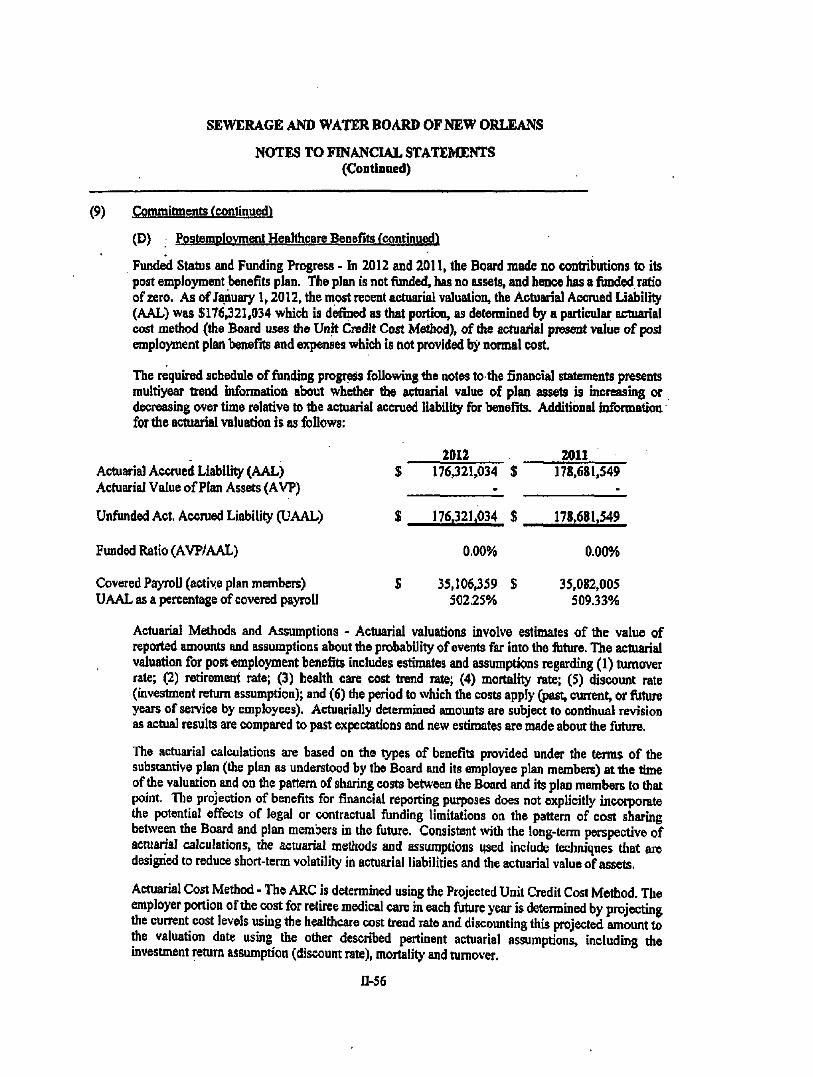
SEWERAGE AND WATER BOARD OF NEW ORLEANS
NOTES TO FINANCUL STATEMENTS (Continued)
(9) Commitments (continued)
(D) Postemplovment Healthcare Benefits (continued)
Funded Status and Funding Progress - In 2012 and 2011. the Board made no contributions to its post employment benefits plan. The plan is not fimded, has no assets, and hence has a funded ratio of zero. As of January 1,2012, the most recent actuarial valuation, the Actuarial Accrued Liability (AAL) was $176321,034 which is defined as that portion, as determined by a particular actuarial cost method (the Board uses the Unit Credit Cost Method), of the actuarial present value of post employment plan benefits and expenses which is not provided by normal cost
The required schedule of fiindmg progress following the notes to the financial statements presents multiyear trend mformation about whedier the actuarial value of plan assets is increasing or decreasing over tune relative to tbe actuarial accrued liability for benefits. Additional information for the actuarial valuation is as follows;
2012 Actuarial Accrued Liability (AAL) Actuarial Value of Plan Assets (AVP)
Unfunded Act, Accrued Liability (UAAL)
Funded Ratio (AVP/AAL)
Covered Payroll (active plan members) UAAL as a percentage of covered pajToll
2011 $ 176321,034 $ 178,681,549
$ 176,321.034 $ 178,681,549
0.00% 0.00%
35,106359 502.25%
S 35,082,005 50933%
Actuarial Methods and Assumptions - Actuarial valuations involve estunates of the value of reported amounts and assumptions about the probability of events far into the future. The actuarial valuation for post employment benefits includes estimates and assumptions regarding (1) turnover rate; (2) retirement rate; (3) health care cost trend rate; (4) mortality rate; (5) discount rate (investment return assumption); and (6) die period to which die costs apply (past, current, or fiiture years of service by employees). Actuarially determined amounts are subject to continual revision as actual results are compared to past expectations and new estimates are made about tiie future.
The actuarial calculations are based ou die types of benefits provided under tiie terms of tiie substantive plan (die plan as understood by the Board and its employee plan members) at the time of die valuation and on flie pattern of sharing costs between the Board and its plan members to tiiat point. Tlie projection of benefits for financial reporting purposes does not explicitly incorporate die potential effects of legal or contractual fimding limitations on the pattern of cost sharing between tiie Board and plan members in die future. Consistent widi the long-terra perspective of acmarial calculations, die actuarial methods and assumptions used include techniques tiiat are designed to reduce short-term volatility in actuarial liabilities and die actuarial value of assets.
Artuarial Cost Metiiod - The ARC is determined using tiie Projected Unit Credit Cost Metiiod. The employer portion of the cost for retiree medical care in each future year is determined by projecting tiie current cost levels using the healthcare cost trend rate and discounting this projected amount to die valuation date using the odier described pertinent acmarial assumptions, including die uivestment return assumption (discount rate), mortality and turnover.
U.56

SEWERAGE AND WATER BOARD OF NEW ORLEANS
NOTES TO FINANCUL STATEMENTS (Continued)
(9) Commitments (continuedl
(D) Postemployment Healdicare Benefits (continued)
Actuarial Value of Flan Assets - Since the OPEB obligation has not as yet been fimded, tiiere are not any plan assets. It is anticipated that in fiiture valuations, should fiinding take place, plan assets will be valued using a smoothed market s'alue metiiod consistent with Actuarial Standards Board ASOP 6, as provided in paragraph number 125 of OASB Statement 45.
Turnover Rate • An age-related turnover scale based on actual experience has been used. The rates, when applied to the active employee census, produce a composite average aimual turnover of approximatety 8%. In addition to age related turnover, it has additionalty been assumed that 10% of future eligible retvees will decline covemge upon retirement
Post employment Benefit Plan Eligibilhy Requirements - It is assumed that entitlement to benefits will commence five years after earliest eligibility for retireinent (D.R.O.F. entry). The five years is to accommodate the anticipated period of the D.R.O.P. Also, if the initial eligibility for D.ILOP. envy is prior to age 55, an additional one year delay has been assumed, and It has been assumed that members eligible for die "Rule of 80" retirement formula delay tiiree years beyond that earliest retirement date. Medical benefits are provided to employees upon actual retirement. The retirement eligibility (D.RO.P. entry) provisions are as follows: 30 years of service at any age; age 62 and 10 years of service; age 65 and 5 years of service; age 70 regardless of service; or, if age plus service equals at least 80. Entitiement to benefits continues through Medicare to death.
Investment Return Assumption (Discount Rate) - GASB Statement 45 states tiiat the investment return assumption should be die estimated long-term investment yield on the investments that are expected to be used to finance the pa>'ment of benefits (that is, for a plan which is frmded). Based on die assumption diat the ARC will not be fimded, a 4% annual investment return has been used in this valuation.
Health C are Cost Trend Rate - The expected rate of increase in medical cost is based on projections performed by the Office of the Actuary at die Centers fbr Medicare & Medicaid Services as published in National Health Care Expenditures Projections: 2003 to 2013, Table 3: National Health Expenditures, Aggregate and per Capita Amounts, Percent Distribution and Average Annual Percent Change by Source of Funds: Selected Calendar Years 1990-2013. released m Januarj', 2004 by tiie Healtii Care Financing Administration (www.cms.hhs.gov), "State and Local" rates for 2008 through 2013 from tliis report were used, with rates beyond 2013 graduated down to an ultimate annual rate of 5.0% for 2016 and later.
Mortality Rate - The 1994 Group Annuity Reserving (94GAR) table, projected to 2002, based on a fixed blend of 50% of die unloaded male monality rate and 50% of the unloaded female mortality rates, was used. This is a published mortality table which was designed to be used in determining die value of accrued benefits in defined benefit pension plans.
Method of Determining die Value of Benefits - Tbe "value of benefits" has been assumed to be die portion of the premium after retirement date expected to be paid by the employer for each retiree and has been used as tiie basis for calculating the actuarial present value of OPEB benefits to be paid. The current premium schedules for active and retired are "unblended" rates, as required bv GASB 45.
11-57
SEWERAGE AND WATER BOARD OF NEW ORLEANS
NOTES TO FINANCUL STATEMENTS (Condnned)
(9) Commitments (continued)
(D) Postemplovment Healtiicare Benefits (continued)
Inflation Rate - Included in both the Investment Return Assumption and the Healthcare Cost Trend rates above is an implicit infiation assumption of 2.50% annually.
Projected Salary Increases - This assumption is not applicable since neither the benefit structure nor tbe valuation methodology involves salary.
Post-retirement Benefit Increases - The plan benefit provisions in effect for retirees as of the valuation date have been used and it has been assumed for valuation purposes that there will not be any changes in the fimire.
(10) Deferred Compensation Plan
The Board offers its employees a deferred compensation plan created in accordance'with Intemat Revenue Code Section 457. This plan, available to all employees, pemuts them to defer a portion of their salaiy until fiiture years. The deferred compensation is not available to employees until termination, retirement, death, or unforeseeable emergency. All amounts of compensation deferred under tiie plan, all property, and rights purchased witii those amounts, and all income attributable to those amounts, property or ri^ts are held in hoist for the employees, tiierefore tiie assets of the plan are not mcluded in tiiese financial $tatements.
(11) Budgets
Operating and capital expenditure budgets are adopted by the Board on a basis consistent with accounting principles generally accepted in the United States. While not legally required, diis budgetary information is employed as a management control device during the year. Comparison between actual and budgeted expenses is not a required presentation for an Enterprise Fund.
(12) Segment Infonnation
The Board issued revenue bonds to finance its water and sewerage departments which operate die Board's water and sewerage treatment plants and disunbution and collection systems. These bonds are accounted for in a single fimd; however, investors in the revenue bonds rely solely on the revenue generated by die individual activities for repayment
11-58

SEWERAGE AND WATER BOARD OF NEW ORLEANS
NOTES TO FINANCUL STATEMENTS (Continued)
(12) Segment Information (continued) Summaiy financial information for tiiese departments as of and for tiie ya as follows:
Condensed Statements of Net Posilion
Assets:
Property, plant and equipment
Current unrestricted assets
Restrbted assets
Odier assets
Total assets
Net posftbn:
Net investment in capital assets
net of related debt Restrbted
Unrestrfcted Total net position
LiabOides:
Current
Current Ijabilities payable from
restricted assets
Noncurrent liabiiies
Total liabilities Total liabiBtbs and net position
—
$
5«
$
Water
2012
344,621 $
(6,932)
37,896
190 375,775 S
312,475 S 7,417
(95,128)
224.764
50.199
12325
88387
151,011 $ 375,775 $
2011
(amounts
321,401
(11.656)
37,138
209 347,092
287387
7393
(94,019)
200.661
51399
11,751
83,081
146,431 347,092
Sewer
2012
571.754
87,089
15375
222,966
325,930
2011 in thousands)
$ 812,779 $ 764,091
36.978 52359
46342 45,674
1.585 1.723
$ • 897.684 $ 863.847
$ 656,405 $ 602334 27,673 25,644
(112324) (79.827)
548351
72,793
14,882
227,821
315.496 $ 897,684 $ 863.847
n-S9

SEWERAGE AND WATER BOARD OF NEW ORLEANS
NOTES TO FDSANCLVL STATEMENTS (Continued)
(12) Segment Information (continued)
Condensed Statements of Revenues, Exnenses and Changes
Servbe charges, pledged a^inst bonds
Deprecaticm expense Other operating expenses
Operating income (bss) Nonqietating revenues (expenses):
Investment earnings Oriier Capital ccxitribudons
$
Trtal nonqperating revenues (e;qKnses)_ Change in net assets
Beginning net assets Ending net assets S
Water 2012
63,834 S (11323) (63,157) (10/i46)
95 7,003
27.651 34,749 24,103
200,661
224,764 $
2011
in Net Position Sewer
2012 (amounts b diousands)
64,699 $ (13.793) (66355) (15,449)
47 10,919 11,115 22,081 6,632
194.029
200,661 $
Condensed Statements of Cash Ffows
Net cash provided by (used in): Operating acth'ities Noncapital financing activities Capital and related financing
activities Investuig activities
Net increase (decrease) Cash and cash equh^alents:
Begimmig ofyear End ofyear
$
$ 1
Water 2012
6.000 $ (14,862)
(1.651) 508
(10,005)
17386 7381 $
2011
(amounts m
(2.646) 8,758
(3,154)
(8.772) (5,814)
23300
17386
72.041 $ (14366) (45.534) 12,141
196 162
10305 11363 23,404
548351 571,755 $
2011
73,782 (9.907)
(42,508) 21367
252 140
21,646 22,038 43,405
504,946
548351
Sewer 2012
1 tiiousands)
S 33,777 $ 24,071
(49,794)
(3.106) 4,948
7.018
$ 11,966 $
2011
35313 2,842
(30,010) (7,175)
870
6.148
7.018
11-60

SEWERAGE AND WATER BOARD OF NEW ORLEANS
NOTES TO FTNANCIAL STATEMENTS (Continued)
(13) statural Disaster
As of December 31, 2012 and 2011, tiie Board has cumulatively received $281,840,800 and $235,893,718, respectively, of cash reimbursements from the'Federal Emergency Management Agency (FEMA). Included in accounts receivable as of December 31, 2012 and 2011 are $21,708,578 and $25,164,758. respectively, of reimbursements due fixim FEMA. Eligible FEMA grants totaling in excess of $537.8 million are in various stages of the approval process and include amounts for system repairs, building repairs, vehicle and equipment repairs and replacements, temporuty povrar, supplies and other costs.
On Jime 29, 2007, the Board entered into a Cooperative Endeavor Agreement with tbe State of Louisiana, City* of New Orleans, Louisiana, and the Louisiana Public Facilities Authority (LPPA). The LPFA agreed to issue its bonds to provide the cash capital investment to pay for capital improvements of the Chy of New Orleans and the Board. The estabUshment of the construction fimd permits die Board and City of New Orleans to publicly bid contracts that are subject to a Project Worksheet tiiat has been obligated by FEMA or for which an award letter has been received and encumber such amounts. The State of Louisiana, City of New Orleans, and Sewerage and Water Board agree that as FEMA pays any reimbursement amounts related to projects for which disbursements have been made, or the City or the Sewerage and Water Board receives monies related to tbe hazard mitigation grant program for >vfalch disbursements have been made frota the construction fimd, the full amount of such projects shall be deposited m the construction fund and used to fimd additional projects until all City of New Orieans and Sewerage and Water Board improvements are completed. The total amount made available to the Board under the agreement was $100,000,000. At December 31, 2012 and 2011, die Board had an dutstaiuling obligation under tiie agreement of $85,275,609 and $67,894,157 included as a liability in due to odier governments on the statements of net position, which represent amounts not yet reimbursed by FEMA and deposited back into the construction fiind.
(14) Subsequent Event
Management has evaluated subsequent events through die date that tiie fmancial statements were available to be issued, May 9,2013, and noted the following item for disclosure.
As described in Note 1, effective Januaiy 1, 2013, the water and sewer rates have increased by approximately 10%. This increase was approved by the New Orleans City Council on November 14,2012.
On Februaty 18.2013. flie Board entered into a Cooperative Endeavor Agreement widi die City of New Orieans. The City determined that flie Board is eligible under Hazard Midgation Grant Program administered by the U.S. Department of Homeland Security and approved a total grant award of approximately $19.3 million. The fimds will be used to assist reU"ofitting tiie power plant at flje Carrollton Water Treatment Plant during 2013.
11-61

(This page intentionally left blank)
REQUIRED SUPPLEMENTARY INFORMATION (GASB STATEMENTS NO. 25 AND NO, 45)
(This page intentionally left blank)
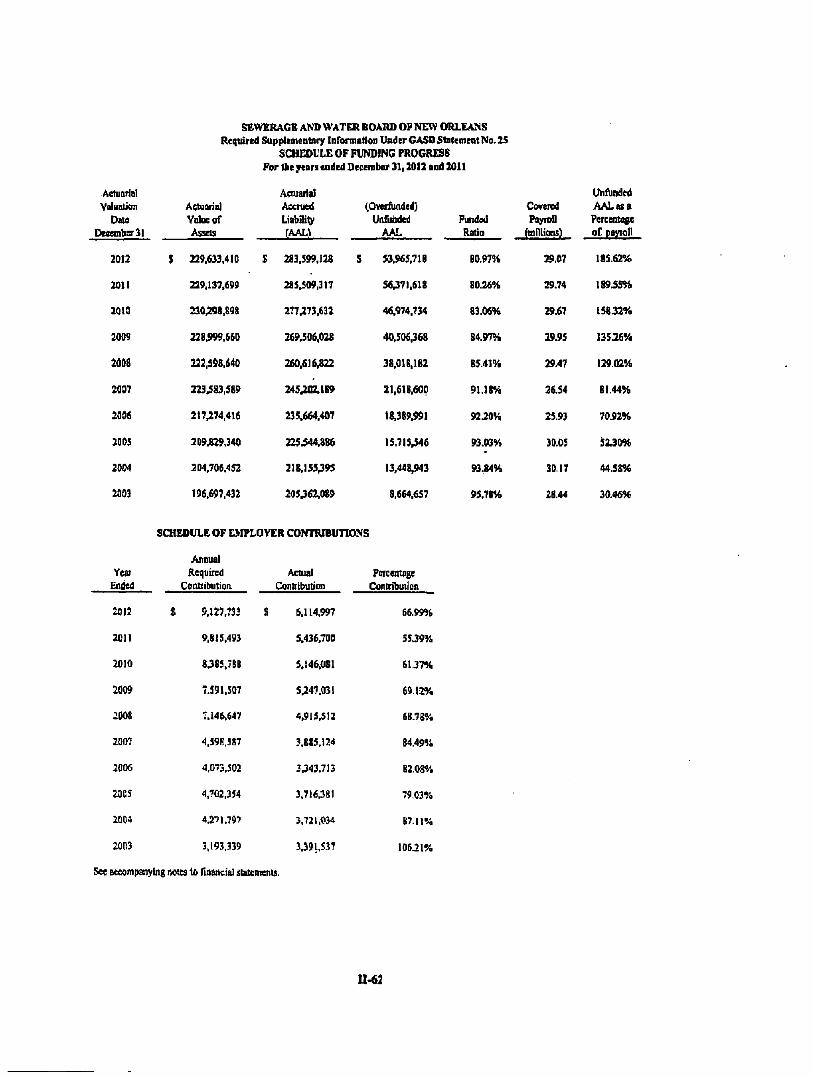
SEWERAGE AKD WATER BOARD OF 7)E\>' ORLIANS Required Supplemeatary InrormaUoa Under GASB Statemeat No. IS
SCHEDIXE OF FUNDING PROGRESS For ttie years ended December 31,2012 and 2011
Aetnarial
Valuation
t>ate
Dccefnbs?31
2012
ZOII
2oia
2009
20D8
2007
2006
2005
2004
2003
Actuarial
Valoeof
Assets
S 229,633,410
239,137.699
230,298.898
228^)99,660
222,598,640
223,383,589
2l7;i74,416
209.829,340
204,706,452
196.697,432
.'Vciuariat
Aecnied
LiabiliQr (AAL)
J 283.599,128
285,509,317
277;i73,632
269.506,028
260,616,822
245.202.189
235.664.407
225.544,886
218.153.395
205J62.089
(Oveiiunded)
Uofiiiided AAL
$ 53,965.718
.56,.371,618
46,974.734
40^506,368
38.018,182
21,618,600
18,369,991
15.715446
13,448,943
8,664,657
Funded
Ratio
80.97%
80.26%
83.06%
84.97%
85.41%
91.18%
92.20%
93.03%
93,84%
95.78%
Covered
Payroll
(millions)
29,07
39.74
29.67
39.95
29.47
36.54
25.93
30.05
30,17
28.44
Unflmded
A A L D S S
Percentage
of payroll
185.62%
189.55%
15832%
13506%
129.02%
81.44%
70.92%
5 2 J 0 %
44.58%
30.46%
SCHEDULE OF £.\tPLOYER CONTRIBUTIONS
Year Ended
2012
2C11
2010
2009
2008
2007
2006
2acs
2004
2003
Aniniai
Required
Contributloa
S 9.127,733
9,815,493
8.385.788
7.591,507
7.146.647
4,598,587
4,073,502
4,702,354
4,2"'1,797
3,193.339
Actual Contribution
i 5,114,997
S.436.7DD
5.146,081
S;S47.03I
4,915,512
3.885,124
3,343.713
3.716,381
3,721,034
3.391.537
PereeRttge Contribution
66,99%
55.39%
51.37%
69.12%
68.78%
84,49%
82.08%
79.03%
87.11%
106.21%
See BCCompBnying PiOies lo rinancial statements.
U-62

SEWERAGE AND WATER BOARD OF NEW ORLEANS Required Supplementary Infornution Under GASB Statement No. 45
SCHEDULE OF RENDING PROGRESS For Hie years ended December 31,2012 and 2011
Actuarial V(Shiatlon
Dace December 31
2012
2011
2010
2009
2008
2007
Aetuarial Value of Asseb
S
Actuarial Aoeruad
uamfy (AAL)
S 176321.034
178.681,549
178.904,131
184,174,734
177,956339
147,995,856
(Overftinded) Unfiinded
AAL
S 176,321,034
178,681,549
178.904.131
184.174,734
177.956.339
147.995,856
Funded Ratio
0.00%
0.00%
0.00%
0,00%
0.00%
0.00%
Covered PqyroU
(mtllioas)
35.11
33.08
34.74
33.88
29.47
27.00
UnAinded AALua Percentage of psyioll
502.25%
50933%
514.92%
543.56%
603.93%
548.13%
SCHEDULE OF EMPLOYER CONTRIBUTIONS
Year Ended
2012
2011
2010
2009
2008
20O7
Annual Required
Contributicn
S 14,430,043
14,659,445
14,759.470
15,046,112
14304.620
12,818364
Acmal Contribution
S 6.070360
6.057.637
5,728,065
5,487,971
5.673,616
6.143,654
Percentage Contribution
42.07%
4132%
38.81%
36.47%
39.66%
47.93%
See acconipan>')ng notes to Gnancial statements.
II-«}

SUPPLEMENTARY INFORMATION

(This page intentionally lefl blank)
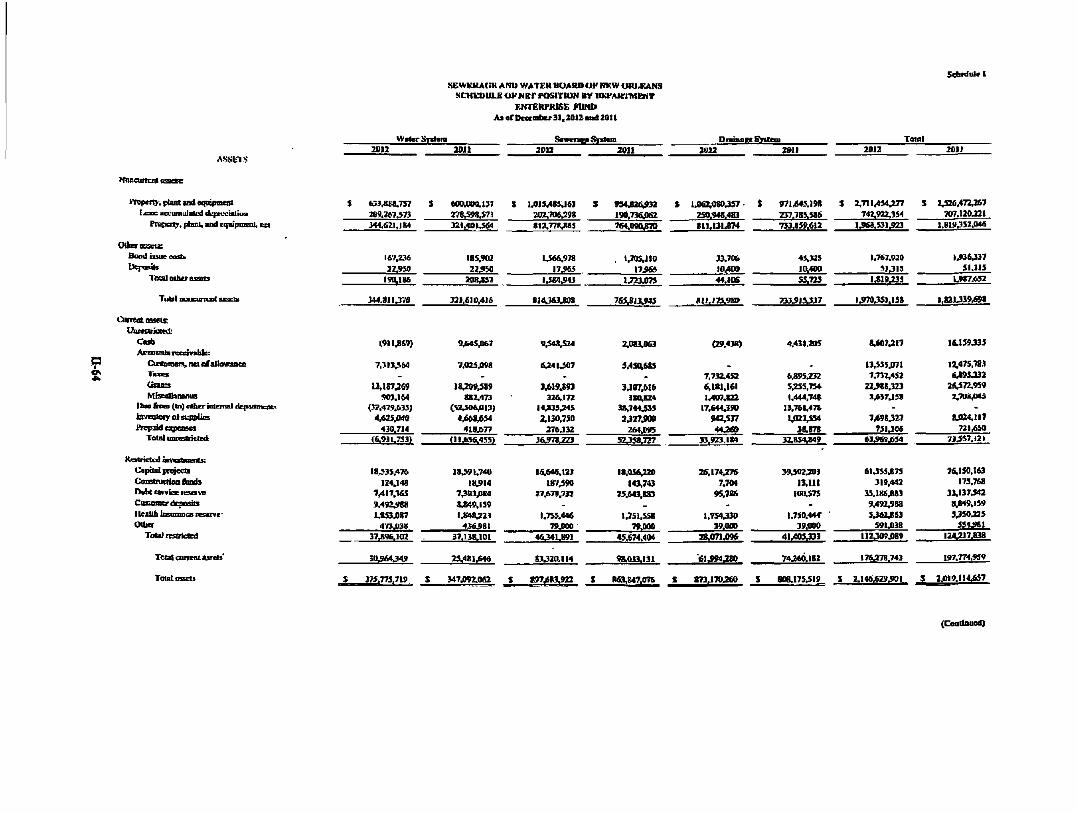
SeWKKACni AKU WA'ri:'.R BOARD (>F m:W URIXAtiS SL-HK3>UL8 UV M BP rOSITHIN BV IIKPAKTMtWT
KNTEiU-RKe niHD A s o r i > c c n i i l K r 3 l , M I £ u i d 2 0 l l
S c t M o l d
ASSb-|S zon
Wtto-Si i fan i
M i l ma SiCT>cngyS|5tein
2011
Dt^Mflgt Syttem
M M M i l T<1«l
2012 2011
^'Tononrcni fiactc
llrapeny. ptuR tod equipmesi t f o : a c c u m u l i t u l dc|au:fat l ioa
P r ^ p o ^ , p fam. and cqu ipusn l . c s i
O t l a r o s s c u :
B o n d t&sue cost).
l *4 IUwl»
To ta l ot i icr u s e s
T u l l l nu iKuTnxi . iuuaa»
O imOLBSSt iX
UucsoicMd: O n h
A c o j u n t i r sesTvh Ie :
^ CUt tQmen,n£t f l f f l l lawBnoQ
flj 1-.XE,
Cinsa MtsuStooma
I h m fitan (b i ) d f t m - i d c n u l d q i M m e n L i
I t t veo la j r o t supplicE
f K p s M a q M a s e s
T o u t i m i c s B k u d
K m n d u l i m a t i i i a i t s :
C a p i a t i i q i e c t s
Coastmct lon Kmds
r> t l « x c v t e e i i : «£ i i «
"n*HfMH'r i tppoy in
l l ea l t l i UBunmce reserve-
C W K T
T o t i l n f i r i c l E d
T<»:d c tu icn t asers '
ToiEt asset!
$ « 3 . 8 « a . 7 5 7
T S 9 M l j n > H , f i 2 t , | M
I67J!3«
2 2 J M
190:186
1 4 4 . » l l j y 0
(9 I I .SSV)
7 ,%IJ,»M
-13.1«7J69
903.164
(37.479.635)
AATiJMO 430 .7 I4
(6.93U7S31
18.S3J.476
1Z4.148
7 , d l 7 . M S
».1S2J>8g
L S S j D r ?
4 7 3 ^ 8
3 7 . 8 % . I 0 2
J 0 S M 3 A 9
$ 375.775,719 S
( 60%WW.I37
178,598,573
3 2 i , « ) t . 5 6 4
185,902
Z J 5 M
»n;as2
3 3 I , £ I 0 , 4 I 6
9.6»S,n67
7.0 I4 .0»«
. I8.209.3t9
nz. iT i
^MSfiM 418.677
( 1 I . 6 S M S 5 )
H).591,740
18,914
7 4 9 3 . D M
S * i B . I 3 9
i * M , 2 H
43<S.98t
37.138.101
T X i W j m e
wumjia
% 1 .0 ] ) v4SW6}
202,706,29«
812.778.885
1.566.978
17JW5
I J M . 9 4 3
814J&3.S08
0,548.524
« U 4 I J 0 7
. 3.619.S93
326,171
I4.833.34S
Z t 3 0 . 7 3 0
3 7 6 J 3 2
36.978.22}
i 6 > M , l 2 3
1*7,590
27 .673J32
. t . 7 M . 4 4 6
Tsono 4 ( U 4 L . I » 1
83,320.114
S 897^83^922 S
S 954.t2£k932
19l]l7)l6UgSZ
784.090870
, 1,705.110
I 7 j e
7 S S . S I U » S
2,083.0S3
$.454685
. 3.l07.»t6
380.SZ4
U , 7 4 4 j 3 5
vrrsm 264J)ilS
S 2 J S 8 J 2 7
18,056,220
143,743
2 5 , 6 4 ) , 8 S
. 1,751,558
79.(100
45.674.404
98.033.1)1
i t a ,847 ,076 ]
t l . 0e t .O !OJJ7 i 971.643.198
2 S 0 . 9 4 S A B
8 U . U 1 . 8 T 4
33.706
10400
44.ias
8(;.m.9a>
(Z9.4JB)
-7,732.453
6 , I S 1 . I « I
1.4D7.8Z2
17.644J9D
942,537
4 4 j a >
X I . 9 2 3 . I M
2 6 ^ 1 7 ^ 7 6
7.70»
95,786
-1.754330
3 9 J I I »
2S .<mja96
til . 9 9 4 ^ 8 0
873470 .260 S
2J7.785.S86
733.859.412
4S,X25
1 0 4 0 0
55,723
7 3 3 . 9 i W 3 7
4.431.205
. 6.895232
5,255,754
1.444.748
13.761.478
UD27454
i B j n 32.854,849
3 9 J 0 2 J 0 3
13.111
I 0 0 J 7 5
•
1.750.444
39.000
4 1 J U 5 J 3 3
74.260.182
808.175.519
S 2,711,454,277
742,922,354
t J » 8 . 5 3 1 J 2 3
1.767.920
5 I J I S
1 ^ 1 9 ^ 5
I j n 0 . . t 5 l . l 3 $
8.607.217
13.555.071
7.732.452
22,988323
2 j « 7 J 5 8
-7J698J27
7 5 I J 0 6
6 3 4 W W 3 4
6 U 5 S . B 7 5
319.442
35.186.883
9 / 9 2 . 9 8 8
5 J U , 8 6 3
S9IJ)38
I12.30»J)B9
17&;278.743
I 2 .146*29 .901
$ 2.526,472467
707.120J21
I . g l W S J . O W
1.936337
51.315
1.987.657
1,821339.698
16.159335
14475,783
6 .895032
26.572,959
2,708,045
-8.024,117
721,650
7J .5S7. I2 I
7 6 . 1 » , t 6 3
173.768
31 .137342
8.849,139
J 3 5 0 3 2 5
S S « « I
1 2 4 2 7 . 8 3 8
197,774,959
S 2.0I9 . I14.6S7
(Caa t lnacd )

SEWERAGE AND WA.TER BOARD o r rOiW OII1.KAN.S SCHEDVLE OF NET POSITION BY DEPARTMENI-, CUmiNUKII
ENTEBFKKE J t u m Al or Dtcanlier 31, lOU and 2011
Sdwdate t(0<m)tu<d>
^
UBT HosmoN ANi} tJAtsiurms
KdposiUane Net iavcstmcat in capiial asstia Kestzicted fi>r debt service UidCSbidtd
Tocid net posUioa
LcngficTTn liabilities: cuius |»r>Ue Net ri'«»*HT!n oUi£B&ia
•; Other jnEtrdiTEXDcnt twoeCts ^HCty BflKb pqvtjB, net tdamoft msturf ties •Spraal ConuDinu^ Disutv Usn payable Soudieast Uiaistaus fiOjtci ItabUifr f>ftf fifpww A**«'tf»"«^ fiiiwt trtffp payHfalle,
nei«f cuneut DBkunSica Total loagrtaxa OatstUisa
Cuucoi listatillBS (pOiyi Ie from cunmi assciii: Aecounn psyafaEo Uiw (o City of Now Ortcacs ihic ro otber govemmoils Ri'lnnflcn ttul laliiiiMtci payalilc
• DuetotfhcrfuDd Accmed salAikft
' AoooalvcxaStflUBiid&kkiiiy Cbutis fi raU*: DeU S C H M Asdssvice FoDd lam poyatriiB Other lUfaXties
Total Qmea tiabiUties (pav«bi» from eivnstt «55«t9;:
Cuntnt UttfcUilics (payi&le fnm restricted BSCU^ AcfXkiied tmcicst Buaih|)agpBbb Kefainen nod csliiiatcs ps^bte Customer d e p o ^
Total Om«nt liahililies (ptyaHc fhiBo rcxtnctat asivK):
Tocal U&bnilid
ToUd Uabililies
Total net pos3i2ou sod Uabmiles
See indepefideiit audiietf fCfxtft
Wafer ST<<as 2012
S 312,47S3W J 7.417365
49$.128.083»
29U tSemutif/sSjttaa
i o n
387J86.95B t 656.404.941 $ 7393,084 27^673.732
(94,018.650) (112324,037)
2011
40^334.196 S 25.643JH3
(79,827.568)
Ilraliui|>e S]nte 20U
JSav5<»37» 95.786
I0 , f l87 jm
t
ra 2SII
714;8«S,72J
100375 33,191,157
Tot* 2BI2
% 1,762.380.821 33.186.883
(196,964,143) _
2011
33.137342 (14D,65:U)61)
224^764386
6J43.817 88.287,088
16,212,631 160.093
23,961366 468314
18326 876319
4,233,719 3.775,887
339.136 132349
J«IJ98.7«P
267,233 2326,000
239,084 9.492.988
12325305
61.724.045
375.775.719
200j66l,592 571,754/36 5483503" 804JW341 W8.174.455 1.600,612363 1.497.1 BA35B
744,692 1/12306
U,46S333
29.744.021
293T63U
-
953.814 I.««7,«20
16:035,150 31.744,520
3S.M6.T4T
-
744.691 1.742,752
tS,488;386
143330314
. -
9S3.81> 2^997366
13,056,803
1493M.117
. -
744.692
V«M» l432n.QM
I6.zo5.oao
. MZ}l .7bS
953.814
3.023,146 )l>S90uD0I
17.S30.QOO
. -
2,2K075 11,123,890 48,072303
189,079341 29376i.S17 14331,768
236»>»I i f ta^iZ
40^781,»»4 198,,»74,937 M.l«i.747
-&313375
10,08132*
14386.058 107.442
22,020,099 1,602.446
62396 623,734
439X3»9 3395.631
493,M6
3309314 g l 3 9 a « »
281.159 2389,000
231,121 8,849.159
1U50.439
ffl>349>M
I46^430J6TO
722.965.836
16.410306
5737fi.618 2,138/480
17.943 450,793
3,156,830 3.7»,089 3304310
12.678
1374.411
i3.4»,<IOO
469372
15,874.783
102.963.450
3g329J86
61311148 227321.747
15,755327
433S8<4I5 1322.348
2«34l 299,498
3393303
3:484,733 4JID9J43
9,912 7a.7W.iaO
2,W1,U1 1%400 0M
390367
14,881,698
3Jta.70 U I 7 J 6 2 52382^05 37JM323
4338313
J.437.425 233308 11.844
472.549 2.4123(7 J.481.0U
10.871^7
2385,643 169474 35398
1J2.I17 2374308 4359,676
4073*3
14311325 l l O i t J M
l l33 lSi Mzwno
4J127
162.098 ujcooo
l9jdZ7
•,^2,789 1341,725
87.674318
315/4963M
16.094314 ZLTl6Mt_
69.07^19
8M.847J)76 873.170360
«tDQI,fl64
69317339 364335329
36361.750 160.093
8537S/09 2.84a.»2
78/113 1.799.861 9303.436
10377.109 3359:428
143.131 151,798,932
2395.406 17382,000
712.483 9.492388
29.982377
181.781309
S4W>t7338
71.754.085 348.127VW6
41312.632 107:442
67394,157 3393,968
127,135 1355349
10365330 12.040.010 5,711.162 3,719326
2,5343*8 16449,000
640.715 8349,159
38.173362
173.800.803
521328399
808.175319 8 LI4ft629.90t S 2Jt9.l 14,087

SEWEBACE AND WATER BOARD OF NEW OKLKANS SCHEUUI^ Ol ' RKVENUES, EXPENSES AlW CKArTGES UiKET POSmOM BY fifEPARTMENT
ErrrERpRifiK n m o For Oe j^eao coded i>eccabcr 31,2U2 ntd 2011
Oimsiuiiir sale* ftf w*rer «id ddinquait f « i Sewasee Krviee. chas^ta PixaxAna^ irepecCiEm sad licoac Tcm OOuiT fcvcpues
Tots! Qptnaaz nvenues
0|icfalui|( F jqxmu. Power and pnn^isg Ticffiiteni
Tiassoussoii ftad disttibtttiaa CusKococx jcoonts CtuiQfna scivkcc AJmiiiitJiHUiiri ddgcnfinl Ptyrcll iflucd MameruBce of ecuoe] plarti IJepiecuirspfi A»tvitj«awn PmviiaDn TDT doaUTid acoovnis
^ Piimucm fuT dzifiu
^ Tvlat ut>«rsliiiii expenses
Opci«ling incDnM: (}et»}
Non-cf}crBhAg nvcoues (ejcpewee): Tlove-tnitl (ax Six-mill tBM Nu»'[iiin ux Two- to i l l tax
O d n faxes
Operntbg and nrninttnance ^aats tmecur mumie InMTCSt cjcpdisc
FotKtvescu cfComnnatitv Dsasfer Loan (Nats 6)
TotsI non-cpsnsing tcvemtcii
IncnEoe before capoal coatnbati&as
Oi^ ' t i d Loairibttitnw;
Change, fa nd ptuttiim
ffai pof ttion. beemnnig ol yrar
Net ponrjro, end ofyeu
See indrpeadent acdiiOfi' rejwii.
WalCT STlltn 2012
* «>.7Vl.J(H S
-343.903
3334.003
63.334.210
3.576,750 8!l48.0l6
16,323.002 1.643.953 1.666. U2 5.713,425
133043(1 11.485,546 11322.865
18.646 l.tJO.MO
776.441
74.480.077
<IO*lJ.8«n
---
in.885 7.617.061
9 i 3 M f7373931
7.098359
(3.547.e«8)
27.fr50.B(n
24.IIU,I94
20O.66U92
t 224.764386 S
l U l l
39,890312
-S79.036
4.4Z9.2U
64.698.569
3.912,898 7.127,633
183)7.656 1.663,338 t.6£[>.al7 7 /» l , l20
13.354343 11329390 t3.7ln.JI3
18.666 1.658.080
110.697
80.147398
HS.44«.n«)
• --
I403SS 11314336
46357 (736378)
I0,965.2W
(4.483.459)
11.116.055
6.ftl7.?«»
194328.796
700.661.197 t
Scwef Jte Swtpa 2012
S i 7U40T.es5
343303 288343
72.040.681
7342342 ifl.758.524 7.647.470 1.60,950 l,fiS<!.l48
4.7J0,IIJ 11.408377 3355.707
l43<iS,<I13 I38.I.U 325.961 srr.oas
U.I40377
---
IS4.509 7.463
196.433
-
358.407
12.499384
10.904341
23.404.125
548.750.511
571.754.636 I
la i i
70338,076 379.036
3 . 0 4 4 ^
73,781395
2354371 10333390 7.116.146 1.663.534 1,660,048
3,84138* 11.496316 3361381 9307367
134.795 (801,413)
J5.847
52.414390
21367305
-.
175.474 (35372) 251,742
391.894
21.759.199
2 IM5344
43.404,443
304.946,068
548.350.511 I
Dn faa tcSn tan 2012
S
-1.103.330
1.103330
5,511.734
Z.049.241 46.749
•
3.416,I9> 9367.471 9.439307
13323,177 11.619
lOO «72302)
44.493314
«3390.4!4»
11,497.713 12.630377 I8333390
.
. 109.748
-
44.17J.738
281.254
M.I37,4J2
55.918.886
718.r74.455
804.093341 !
2011
5
--
1.107.419
I.I07.4I9
5320343
-1.887.73)
42.571
-3.121.646 9.919360 9.794.266
11.071,687 11,619 10,791
(4.826.9981
38.347322
P7,240,10J) .
11,129376 11342»7 16.855381
4.870
.
. 128371
-
39360325
2.120722
40084.409
42305,131
703369.324
748.174.455"
Too l 2012
S G03SC304 i 7l.407.aJS
637.806 4326376
136,978,221
11351.746 18306,540 26.019313 3.334.652 7,312,300
15.879.736 33.980.839 24,480.560 J9,011.954
168,419 1,676.511
IJ«.704
178,873.693
(41.895.474)
I2.497.T23 12330.977 18.933.H0
-278394
7.6243J6 401387
(737,893)
5I.628.4(M
9.732.930
93.693.275
•03.426305
1.497,186.338
E 1.600.612.563 5
2011
393S0312 70338.O76
758372 8381.123
I19387J«3
11.717314 13381.523 273I6JD3S
33«9,ft43 1320.100
16.034.134 34.770439 25.185337 J4,T7I.1J9
143,080 8«7,4«0
(4.6W.434)
I7O909.1I0
(31321327)
11.179,376 11.242.927 16.853.081
4.870 ll(i.079
11.479.664 426.870
(736,878)
30317389
19,396.462
77,845.708
92,242.110
1.404.944.1(8
1.497.186.338
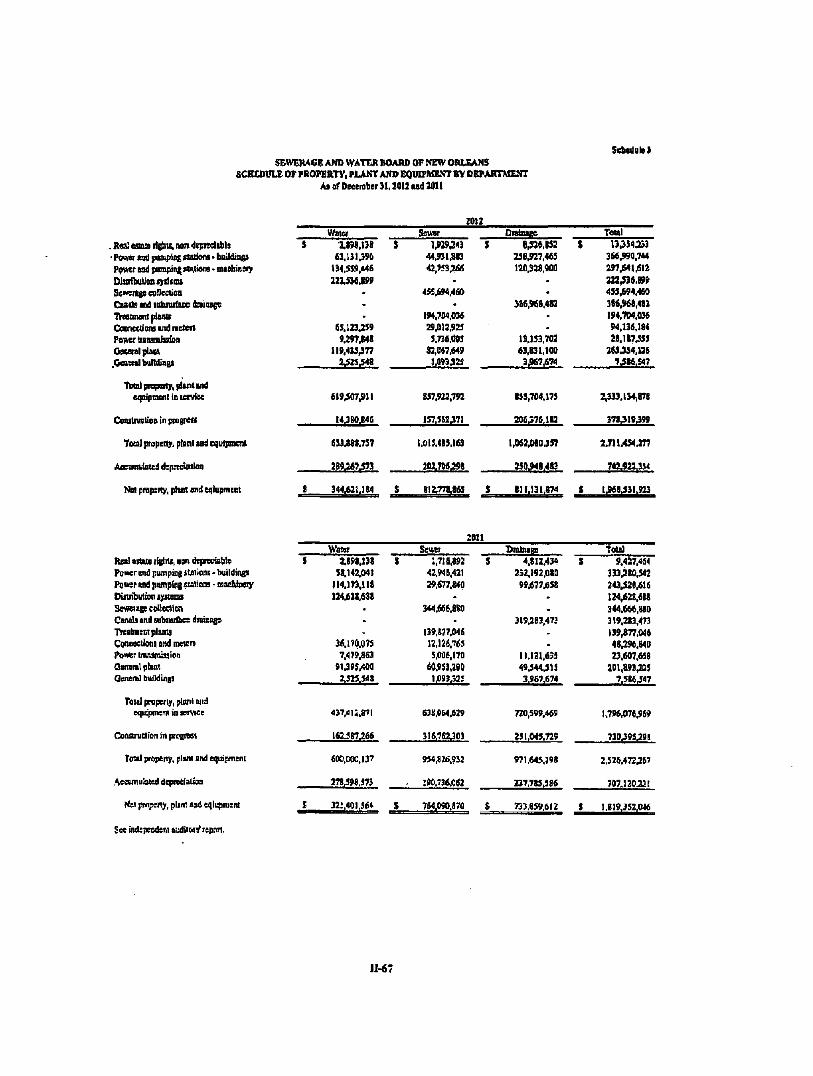
SEWUUCe AND WATCJt BOARD OF NE1V 0IUl£AN5 SCBCDULE OF FROPERTV, PLAKT AND EQ1)IPMEN*r BV DEPARTMENT
At or Deetmber }1,2012 u d Iflll
ScbedoltJ
1012
R«a! t a t a rigiitt, noa 4eia«cla])l( Powet tmi ))iimpliigttg2)oni • buiUiag* ?qvfa sai pumprajJtatioM - mielnnay DinrflwUgooriteas S«iwi«g« csneouoo Canils iod nhnrftce dnimee Tiitannant plosti Omneclions tnd meten PevhtrttammlisIcB Ooenl plant fimmiivMatt
Tbttl proptny, pUnI «nd eqajpneniiDieiviM
OiRUlnictioD in piogitsi
Tool ptopntjr, plinl lod cquipacnl
AdcsmulaTed dspnoiBliiio
N« pnpiRy, ptiM BIKI ei|iiipmEiit
Wator
s xm,m i £3.1313%
134,559.446
llUii6.m -• •
65,123319 »,297.«48
IIMU.377 2325348
619,507,911
14^80,846
SU.88J.7J7
289347J5JJ
S 344.621.184 !
Smitr ( 1,V2».243 ;
44331,883 42,f53;2li6
. 455394,460
• I94,704,0W 29,0)3,923 5,738,005
83,067«49 13933a
657,922,792
157,562371
1,0IM8S,I63
ai2.7M.298
I 812.778,865
Oniiu«» 5 B.a»,8S3 !
25B.927,4«3 120328,900
--
386,M8,483
-•
1S,153,W2 68,831,100 3,M7,«74
853,704,175
206376.182
1,062,080,357
230.94a.483
i 811.131.^4
Total t 13.^51353
366.990.744 297>I|,6I2 212^6,g9» 455.694,460 386,968,481 J94.W,096 94,136,184 28,187335
264J34,12« 7.586,547
2,333.134,878
378319399
2.Tn.4«.277
742^22,154
t 1.968331,913
;DII
Real astut righu, non deprensblv
PoHcr end pumpiaj itniioiii • buildingi
Powiftnd jumpidg statiora - DmeUmy
Dlnributioniyitaiu
SewB»g6»l l«\ l ta CifiAb tit i i albsuiliie: diBisBjis
Ttailiiiciiipiints
CoooKtioni DMI imetcrs
Power tnutusiijion
Oeinit l phm
Oentnl btlildinB]
r o u l progeny, plnit end eqicpoRmuXBrvKc
Ckmstrudicn In pnsmsi
Tnul pKiperty, pliM and equipfliem
,Ac«imu!at«d dipicdalioa
Ha ptcpsny, plitn njid eqiqunsnt
S « indipetulent A'i:dliMy fcpnn,
W B 1 «
{ 31,193,138 ]
58,142.041
114.173.118
124:638,688
. --
3«,l70t075 7,^79,863
$1,395,400
2,525,548
437,4 l i .87 |
162.387.266
«OD,OOC,I37
27S398.m
I 32;,40I,.S«4 S
Scutt
I 1,716,892 42.946,421
29,677.840
• >4,666JI80
-139,877,046
12,126.763
3,006,170
60^933,290
1.093.33!
638,064,639
316,7(2303
9i4.8J6,?i2
. :»0,736,C62
764,090,870
OmlaoRs
S 4,812,434 i
232,192,080
99,677,658
.
. 319,283,473
.
. II.I2I,6$3
49344315 3.967.674
720,599.4«9
251,045.729
971,645,J«8
237,785386
i 733,859.612 !
Tot i l
( 9.427,464
333,280,342
243.S28,6ie
124,628,688
3«4.666,g»D
319.283,473
139,877.046
48.296,840
23.607,668
101,893403
7386,547
1.796,07e,96»
73039SJ[9B
2,526,472367
707.120221
t 1,819,332,016
11-67

SclKdlll<4
SeweRACE AND WATER HOARD OF NEW OKU:ANS SCHEDULE OF RONDS PA VABU For 18* Tar coded DeoalMr 31,2042
ON OD
O n i a i g e System fioodi. 199l(9-Min5)
D i a i a w e S v m m Bua ib . 2002 (9-MiOs)
.sewer K n a m lioniU. L"W7
SBni rKnaam Randi, I9V1I
S e w c r R c K o i i c Boodi , 2 0 0 0
S c n r K c t c a a c D m t a . ZOOO-U
S e v e r Rcvcooe DflDdi 2 0 0 1
Sewer Revconr Bondsi 2002
Scwis RcMarar Boutfa^ 2003
S e w o REvemx BIIII& 2004
Scmx Kcvcnn: Baodi, 2009
. Semi Rewai» Doiuh, 2011
W U B BsTcmK Bandi, 1998
Water Eoenne Boods. 2002
LADHH Lmu flenaae Boals, 20I(M
I JM>HII Unn Hevmae Benl], 201 w
TOTAL
AosiiU Interest Raus
4.84%
4.4fi%
S30?k
4.8234
i48K
5.43%
SJTBi
4 3 « l
1.94>
43SH
6,«8M
095%
4.82M
437?i
2L95;i
235%
iDteKSI Piymcot
Data
(6/1:12/1)
<«l;l2ni)
( & t ; l 2 / t )
(6/102/1)
(6/U12/1)
(e /uu/ i )
(6/l: lzn)
(6/1; 12/1)
(01:12/1)
(» i : i 2 / i )
(«n:l2/i)
<i/ i - i r i )
(6/1:12/1)
( 6 / l ; i 2 n )
(J/1)
(20)
t na* Dste
12A>]/»
lOWlAB
0(>l01/97
UAM/9S
OS/OI/DO
11A1A»
I JA IA I
12/OI/DZ
(JAIMU
I2WUH
l2ffll/09
12AV1I
I2«t>98
lOOIAQ
02/11/10
(raiVlD
n u i
MxtmttT D B U
12/01/18
lao im
06X11/17
0(WI/I8
06/01/10
D M i a >
OMUZl
o M u n
0001/23
UMII/24
osmtm
n m a i
I2«l/18
l2«1/22
(nA>iM
jonuso
OutsUBdlDg
u s v j o n
S 4,610090
14380000
18390000
U,71530D
11360000
1U90000
ixosisnu
19382^000
38393.000
3,780000
24315,000
21.990000
' 161383375
7,M>.000
24355,000
628,117
873,707
33318334
l o j e u
J
.
.
-
•
-
-
-
-
-
-7373.130
7,J7JJ30. _
-
-
170376
4U.926
534,802
» 2U392309 « 7.«7,932_
h i l O l I
S .576.000
79O900
- IA.6O.00O .
LSio.aoD
M4S3l«
1385.0(10
l,060,«IO
L6I5.O0O
2345.000
2»30O
1.430,000
7Hvino
,
12.400000
9»,0OO
1.400000
53,000
>7.000
ui5.aao
( i6.m.aao
OstHaodinc UDf
izainoiz
% 4.040.000
0390000
17:630000
I08753M
10315300
14305,000
10395,000
18,370.000
35,950300
333ftJ»0
22.883.009
3I36030O
7.471305
I56.03&505
6335^000
13355300
746,003
I3S>;03
32.088316
8 205.77 J. 141
Sec •MfTifi lArtft titiV^ tn^ ccpuL
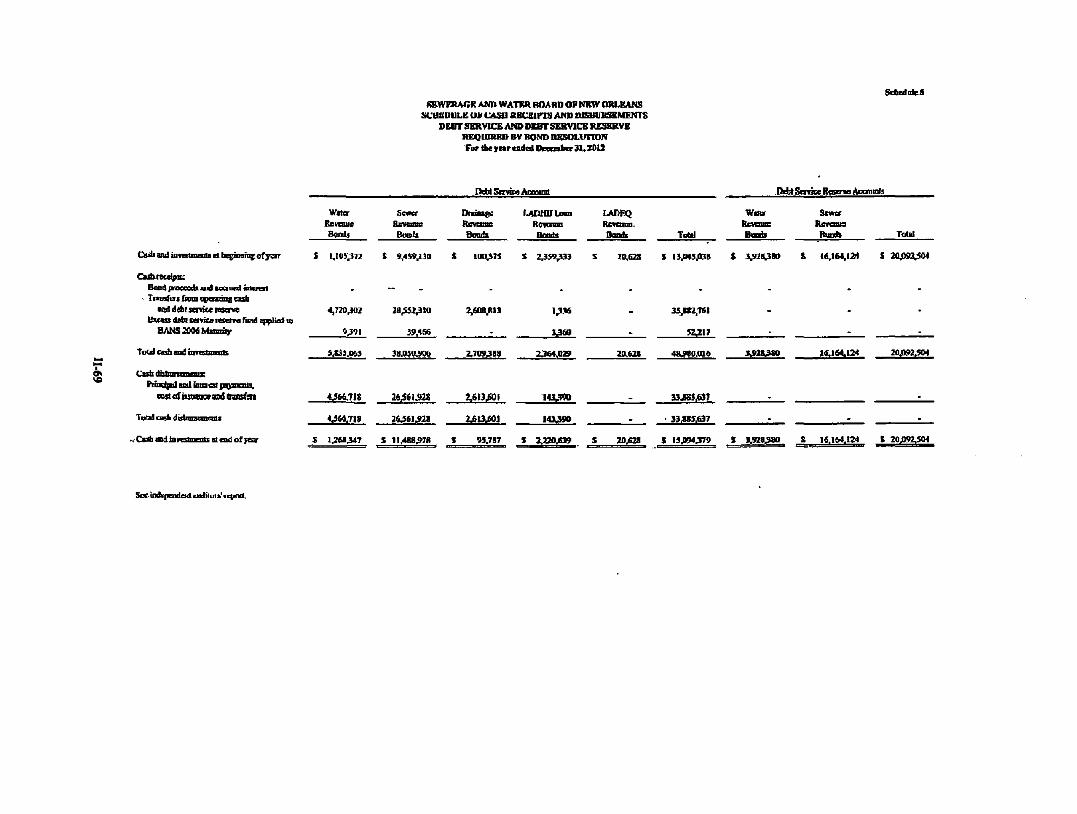
SctedideS RKWERAnK ANn V/ATtK BOARD OF l«RW ORLEANS
SJC'iUfDULK UF CASD RECEIFlli AND DBaiVKSEMENTS DEBT SERVICE AND DEBT SEKVICE RE^RVE
IKQUIRBD BV BOND OISOLUTION Far the rear ended Decoabcr 31. ZOU
IMilSnviMAoeoimt Drill StTvice Besmra Acmmit!!
Water BsvcaM B«ndj
Sower Bevoms Bomb
Dndm^ Rcvcmc Bondx
IJillHIIUnn
Bends
LADn; Witcr Rmmnc
Total Total
(Tndi imd inveameim a lic^iimingof year S 1,103372 t 9,459330 1U0315 s 2359^333 20628 S 13jB45,n38 t 3,928380 & 16.164.121 S 20.092304
CtAnalfts: B«od praxcodlaul aoaunl iaienst
' Tmofuiliomopaatingcasb •Qd d<(it serr iu leterve
Tot i i cash and une&tiuails
PitnapJ gal BUsrcst jBymooLi,
cost OlBSUOCV 8110 ttSl&UlK
Joo i t i ^ i iA t tBsaoa i l x
Cssli imd bvEsHiEiia m end of year
4,720302
9391
5.833.063
4J66.7I8
43M.7I8
S 1368347
28352310
39.466
38.03(UW6
16,561.928
26361.918
S 11,488378
2308,813
2.709388
2.613,601
2313^601
t 95387
13.«
3360
2364.029
143390
141390
s ^«03„ s
•
2062S
20328
353SZ,T6I
52317
48389.016
33383:637
• 33385:637
s 15394379
;
33128380
.
8 33M^80_
10.164.124 20392304
i 16.164.124 8 20392.504
Soc indipeHlcRl noiiloiA' icpnit

SEWERAGE AND WATER BOARD OF NEW ORUiA.NS CHANGES IN SiELP-lKSinUNCE UABIUTIES BY DETARTMEIIT
For the year ended Deceisbcr 31,2012
Scliedale6
WATER Snort.{eiDU
Workcri' coinpciisttisn HuMi iniuranee Cenanl iltblliiy
Toal shon^ntrn
Lanjiienn: Woilurs'MmpematiiHi
Total lonS'tsTn
Total
Shojt'tBnn: Wafcntf compGDration Health iosunmc« OenerBl liability
TetsI thon-wm
Lon^tsrm: Woifcer/osmpsBiotion
Totnt long-tenn
Total
DnAIKACE Short Jtem;
Woiteri? OQinpsnsiuion Health Ciiunuice (Bomal liability
Toml ihnn-term
Umg-trnn: V/oikers' Dompsiuatio:
Total losg-ttrtn
Total
TOTAL 5hon-icnn;
Wottcsn' oompfiisation Hcahhinsumnce Genera] linbiltiy
Total diar.-iem
Lona-temi' . Woikeu' wmpcnsation
Toal long-tenn
Total
See independent audiicn' report
s
$
{
i
$
J
s
..«
i
Betinning «f
Year
361,784 6971833
2.936,014 3J>9J,631
953,814 953,814
4.949,445
361.782 697,833
2.425.117 3.484.732
»3314 953,814
4,438,946
361,783 697,833
3.500,060 4,559.676
953.814 953,814
3,313.490
I.0S5.349 2,fl9J,W 8,861,191
12,040,039
2,861.442 2,861,442
I4,901,4M
Current Year ClahBS and
Ettlmata Chanee
S 876,917
• 4,964,274 (232,242}
3,603,959
(209,122) (209,123)
$ 5399337
S
s
s
J.
8
S
876331 4.1473S3
118379 5.143,263
(209.122) (209.122)
4.934,141
876J931 3.47S.4I3
ri.I31.486) 3.220.858
(209.123) (209,122)
3.011.736
2.650,789 12.587.640 (1,245349) 13,873,080
(637.366) (627.356)
13j4J.Jt4
8
^ ^
i
781.066 4^23.942
123495 5,828303
. 5.828:603
781,070 4,107.621
19316 4,907.907
. 4,907,907
781,070 3.433.080
»,35l 4.299301
• 4,299,501
2.343.206 11466,643
226.162 15,036.011
-
IS.036,011
8
S
8
i
S
s
i
s
Eadsf Year
457,643 738,165
2,580.177 3,775,987
744.692 744.6S2
4320:679
457,643 738,165
Z524.2S0 3,730,088
744,^92 744,692
4,464.780
457,644 738,166
2,283.223 3.481.033
744,692 744.692
4,225.725
1,372,932 2,214,496 7JB9.6SC
10,977.108
2.234,076 2.234,076
13,211,184
11-70

(This page intentionally left blank)

The Sewerage & Water Board's Facility Maintenance Dcpartrncnt is refurbishing a 36-incfi check valve from Claiborne Pumping Station. This valve opens or closes depending on whether in this case, the 40 million gallon a day potable water distribution pump is in service or in the stopped positioa When the pump is started, the water flow swings open the disc inside of the valve allowing the distribution of potable water throughout the city. When the pump is slopped the disc aulonnalicall)'closesypre venting the water from flowing back through the pump causing it to turnbackwanis.
Tlie staff refurbishes various pump, motoi; generator and other parts because many ace not available off the shelf or are no longer manufactured for the old but reliable S&WB equipment.
New Orleans could not exist mthout a modem and strong drainage system. That is why the Sewerage & Board of New Orleans joined with the U.S. Anmy Corps of Enginct^ to upgrade or build cnnals, pumping stations and electrical generator power. One of those projects is canal work underway now Uptown. The work consists of constructing approximately 4,300 linear feet of concrete box canal utider the median along Napoleon Avenue, from South Claiborne Avenue to Carondelet Street. The new canal will parallel an existing box can.il and will tie in to the existing ranal at South Claiborne .Venue. The a>st of the project is $55.1 million, with 65 percent federal funds and 3S percent S&WTB funds.
s T A T I S T I C A L
S E C T
\
O N u N A U D I T E D

SEWERAGE AND WATER BOARD OF NEW ORLEANS SUMMARY OF STATISTICAL INFORMATION
December 31,2012 (Unaudited)
This part of the Board's comprehensive annual financial report presents detailed information as a context for understanding what the information in the financial statement, note disclosure, and required supplementary infonnation says about the Board's overall financial health.
Financial Trends:
These schedules contain trend information to help tlie reader understand how the Board's ftnanci^ performance and Vvell-being have ehanged over time.
Revenue Capacity:
These schedules contain information to help the reader assess the Board's most significant local revenue source, th6 property tax.
Debt Capacity:
Tiiese schedules present information to help the reader assess the affordability of the Board's current levels of outstanding debt and the Board's ability to issue additional debt in the future.
Demographic and Economic Information:
These schedules offer demographic and economic indicators to help the reader understand the environment within which the Board's financial activhies take place.
Operating Information:
These schedules contain service and infrastructure data to help the reader understand how the information in the Board's financial report relates to the services tlie Board provides and the activities it performs.
III-O
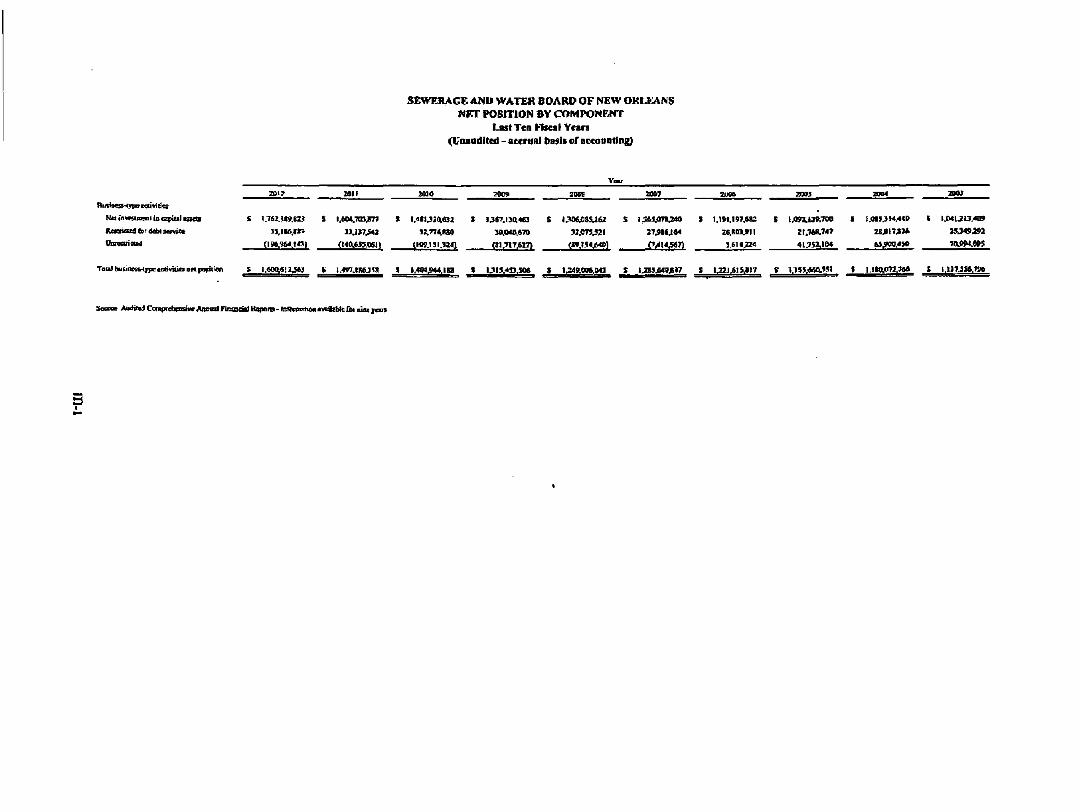
SCWERAGi: AMD WATER BOARD OF NEW OKIJO^NS NET POSITION BV COMPONR«*T
Last Ten Hscai Years (Vaaoilited - accrual basis or actouDting)
Rooicud for delvt Mfvjtt
UarcsmeiBd
low t o »
% I.T62..te9.8Zl i l,eO<.7ID,l77 t l.4*IJJ%fi31 S 1^67.13446] S t.1IO«.{ltSil6Z S IJ&5.(mj4a S 1,I»I.I97.<S2
IJ . I IS. in UJ»7.S42 ».77i.EB0 ai,<HO,67D M.4T5JII 27.MU64 ZC^SIII.911
(ia6.9M.10| (MOL&B.WIt (HW.m.Kf l (81.717.617) (»».I5<|S<0) f>j<l<?«?) J.SHjZI
s ijon.uv.7oa
2I.7M.747
^1.751.10«
aKM
t 1.0II.3S4.44B
28.gl7.S7«
M.W0.4ie
t IJ>«IJt3.«!»
7fJ«3»i
TealbuMtaHtrctr6.nUcicelrimtitia t l .«0Wm63 t l..W7J«6jra S l.«MJ4«.lg3 « lJI5.<».S0t 8 l34».Cg6.0« t IJI5.«».gl7 t l .a iJ lS.»l7 t 1.15t.«M.5»l f U ^ ^ j ^ , _ J _ _ | j U W ^ ™ _
Soone AiHKt«d CoiRpreliefaivv Affinal FuaiiBalRs|ians-lttft)nii3]ion,»iqlaMfr Cot niaz rem

SFWERAGE AND WATER BOARD OF NEW ORIXANS CHANGES IN H t r PO$TnON BY COMPONENT
Lust Ten Fbvrol Yean (liiuacUUd-accrual basis of accouaCtne}
lEfllca o/KMer MIJ Adhofmsm ftes
S d u i MgB xei I iLe uuu jjcft
Ptaubuij) tnapvctioD a d ficeiixv TBCS
•pcratiSES ExpcsBS:
P(M<rDnd(iuOi|)tn9
Trattnniisioa cad dharOtulMn
<!ustiKxr J d x u n u
AdUEBStUlDa A l l eCttUl
fi>iaa r e l i l d
Mwiuri*"*'^ (a gCQcnlp[B3B
Aiwvliuiinik
PfDVItBD u r oQUBUUl JKCOnntl
= T«ii l
Opcotsigloa
Rmues^uptceeci. TwtWwIlbM
.SpKsiUax
(MMTIBXCt
Upoumy ind ocuttca^xc p m t i
UAUlUf OGOBK
mmCKKBBB
lfll(TC9l ttpmK
fcvgivtrcn ttf Coniouad;^ UiiBim L o n
Teaaf ooa <^Krata> mrtsuei ^ j x n « n >
tnccRc (Ion) bcftrr c
CapcUIci
Wttpoflrtion*
Efidcfyev
J ( K U M J M S
71.407.115
a'.«» 4.4Z4J76
|]«1*7I.I1I
n.MI.74«
H 9 0 i . « l
JWI9.713
i j j 4 . « n
} . i J U o a
l i .«J9.7» J M t H l f f
I4.4RI.5Sa
W.01IJ9M
iU.4IS>
i j ^n i iM l
IJB.704
l!t,»7J.MS
{4I.I»S/<T4)
_ IJ.447J7}
i3 / ja . j ) t7
ll.933.290
27j ; !» l
J^M.JIS
401.111
(7J7.WJ)
. SLM«.404
4.73 i , n o
W.59Jjr75
lOJMIMII i
I .4W.IMJJI
I l.<«>.«U.3e3 s
W . » I U B 7aj j i .076'
73I.D72
t 4 l l . l I 3
i L 7 r . « i 4
i t .n i .>z3
n f U M O i
3J«?,M3
3 ; } » , m
nfin.m J4.778.4M
13,11} J 3 }
34.7n.27«
t a j O K
K7.4KI
(4>SW4;4|
I7S.$(D.I1(!
(3U2I.}27)
4373
I U B . 3 7 f i m42.»27
] ( . » S ^ I 3I6;I»711
t i .mf iu 4 l U 7 a
( 7 3 * j n )
. sa7iT.$t}
1».«M.4«2
72.S4i.70l
n . K I . i r a
. 1 . 4 ( > . ^ M «
i . 4 j 7 i u . n $ I
J 9SJII79.77Z t « . » 4 . 7 »
7IS.42t
4.701,753
UU.OSJ.VJO
U.«Ot.UI
I«J1B,7S2
i5.9IS.UI
l i f j n } , } a . ? 3 i
tt .OM.Oll
n .6 l6 .0»
2t.4S7.2I»
X i l t l i l t
164.413
4.IJJ.3B
^ I M . 7 I 4
I754ll9.n7
<43,,4SJW, _
IJMS
I0J7I.IKO
l i v n u l o IJjS71.7»l
33t.WS
« j * r » o
274.32]
(ljS«7.«D) 4 I .43MKI
t s . z n j 4 i
4a:J! l .B4
4 t . » » , | 4 l
f M w m
i:iw.4S3.jo6
1^4«.«M.IJI S
t IM77.0S4
44.I42.V4>
4M,44I
' .» I4 .«4
IIIJDISJII]
12.910.711
15,910.157
U.4<S.S2I
3J0W.9M
3.417^39
ttSW.US
3SJ0UAU
i *Aa f i< I t
M.«W*3«
140.417
•19.111
S tMO
U 9 9 9 U 3 9
t t V i V J ? ! _
. io.sai.i4s
IO.4l0in4
l j .4U,e3»
37UX)i
IW71. IW
tM.7 I3
(l.7««,S5})
s i .oEt. t ta
« , i 4 » j m
MJS(.2IV
M.447.4S3
IJ49.1I06.9M
1J13.453JIK 1
t 4».«t .7J l
« l . l7r .MS
550,SD4
».4S7,9»»
IOI.9SI.su
I I . I 2 M 4 I
\%ya.m H9MJW 2.7I9J94
3 J 2 3 j a i
I5.I7I. I90
3 l>4»,«t t
}J,4M«24
31. i4M17
t5IJ>19
(1>,»5.I15)
»7 .4 i3
IS7.7IB.4H
(41.791,919)
. i t . M 4 , i n
11,4461^1
n / a i f a
3IS,73J
Osrr> 3;S4Sfiti
( I .TKWO)
. 47.039,7)7
<4|,711,1*7)
as. i ium
tJM43J»4)
UX3A49.U7
L249jaaUI4J S
I 37,7!»J22 ( I J M . t 4 7
541,340
2,9I7j»?0
i09.JC9.4?9
I1MI .9 !4
l(,3U.9TJ
l9 . tJJ . IM
1290.CV2
I.4M.I4S
I4. i99. iai
ZI.299413 2>,993«B
B.377,71!
I5»f l l9
I M U . 2 0
a.44».9tl)
l » ; » 7 . 9 3 i
<30J9I,4JJ|
120
I6.JH,I!H
a ^ t i » }
13,773,070
4(3JZ2
t.777J»«
3,MS.I4«
2D1.9»i
I^>4UI2>
, 4>.477,34&
i i jaun '*
7I,9>S,IW
64.aH02a
U l U L t , l i T
l.2B5/i49,lt37 S
1 33,79»,7«
t l f i t t f i V
590,141
l i . f U f i U I
tA,SII.>TI>
IM45,7»3 I;9I0J5I2
JLK5.250
D.TI4/44
l74»4jE94
23,I44j6«>
2».7«lvMS
M U 4 5
HJJJJWt
vausr
152,017.247
( ] l , E 7 l i a a
S.««» »jSM,«ff«
9,B»,g} i
13,SU,I49 634.311
35J0I3,I4}
4.I IJ,«I»
iB2.435>
74.911.437
31.309.S3)
4Z.«4>.7J»
«3,935.2M
I.I3>,M0JJI
lJJI .SI5.8t7 1
i 31,723,140
47.429.9M
i n .MO
99t4M.t92:
I I J I U M
H.71S.fl4
l lL02,43 l
2.4I1.&3I
I.S4I.S1)4
I7,IM.7J1
I9,7«IU4I
27,991.450
39,II7,US
3Ml44$
8JM,4S5
7.a7,9w
l&2.>69,42ft
IG2JM.234)
1.4fl7 i>.«9ft/k<a
M.UI,»43
I9.70r.7«7
U l . t l l
9J3 IJ2«
U 9 1 , 4 »
a f t )
3.70I4U
(J9.J4J.77S)
C f i t l V t I S )
i . tvumitf
I.155M0,S3I J
1 54,214,144
7 U 3 2 . I M
33J.I4J
J J 4 J . U I
I30j0&},«3
2 2 . t K 4 M
I7.IS1.47J
2«,t4«;UI
2j62}.73l
JJSJ/!8I
14.9t l ,9«
tt,7V4,U4
n,7C4>}4
31.COD,91I
2 » , l f «
2.7II,I7«
2J2f. l9<
IS4.«33J»53
(24.771Wi4)
JLI9}
I 3 . m j s «
I2.U2.092
u j m j m
744J22
U M , 4 U
43. i6l .«M
70.J9I,«IO
^ I 2 4 . 9 t 0
4Uli l .97<l
).D7,JS«.79«
I.Un.0T2.7t» 1
> 54,997.431
<2J2tA9;
214.44}
Z,<I».I<B
II9AS7.97J
I9.J39.09S
IJ.p7V«>
1M»J0« J.JIJ.4Ki
i j e i . o u
l l , 5 I 4 , m i o j H n j i ?
ID.5«1.9M
35,40).955
1U.I2S l , IM,7JI
3J173.I92
U I J O K M I
C3.457JI9)
7.4JI
11.031.097
11.109.137
I4.7J5JIS
7m.6»3
1.031.39)
-
ta .Hs,7ai
17,2X7,771
H f l i 4 f i i t
I t H l M J
I,067.1I4.S«9
Ll l7.33<,n»
• outTt. AadilcilCcnipR)>»EinAimiilFsBiicii)Rqn&- bfinmliaiwidsUsisiBKjaa

SEWERAGE AND WATER BOARD OF NEW ORLEANS REVENUE AND EXPENSES BY SOURCE
ENTERPRISE FUND Last T«n Years
(Unaudited)
Revenues
d o T ^ for service
Dei£cstcd taxes
'Iwo-CBtDtax
IntETcsr en investments
Otha i»xcK |ind rcvcauie
2004 2003 2O0G 2008 2009 WH 2012
ExpBni».n
Ptrsdcmd services
Servtcea and nrilititn
MstcfiBb ftoii stEpplKs
t>qnccunian Af)4
amonizaiiMi
Pravisinn foTCtoubtful
Bocounts
I'Tcvistoa for cUiini
HnrzkanfiljOtt
imerest
$ I17,«2, l«8 38.93(k.0gl
7,«3 I.OJ1.593 2.SM.46S
S 160JS3,7J3
200J
$ 49,759,MI
40.120,890 5,SM.»J
35.0C9.OS3
I.&84,7SI 3,673,192
--
$ 126.719.405 43.059,755
J.t92 1.J52.425 4.QlW,t90
S I7S.M4,»67
M M
J n s i i M f 411.718,878
8.«37,479
38,S96,0!M
2,718,176 2,<864M
--
S 9«,232.4S9 45,a».47t)
1,407 3.29l.4«9
13.142.049
S 1S8.S17,«14
I M J
1 58422.6X1 45,60«.037 5,020.134
39,548,115
«.58;2,4i5 7JB»,990
3S.909,2M 2,993
S 97.047.08 33.t71J29
3.699 4,llS,0Ol
38.938.147
i 173.275.816
M0«
i 49,118.747
43.170.196 5.649,«27
29JU63J)14
22^5SJW6 2JIS8.657
(2,303.397) 252.435
S 106.642.409 36,667,784
120 5,826,769 5,147,380
S 1S4,281.4«2
2 i m
S 61,421,931 52,966.504 9,S79.42«
25J35.732
12.613,283
{2.448,965) (20S.99S)
2.443.612
S I06.463J82 39,702,436
-3.54J.564 2J99.745
S 152,731,327
lOOS
S (SADSitO 56,428,567 . t2,#03,9«l
31,704.036
(12.225.825) 587,465
-1,720,030
t 1I7,264,44« 36,198.099
. 885,723
23,SSS.7S$
t 177,907,02$
2009
1 74,540.678 50,787,19$
8.380,950
34.833.545
- 889,811 5S,tl«0
-1,766.553
s
i
i
125,360,977
36,349.431 1.045
274323 55.842,898
218,028.074
2010
72,725,464 47,125,394 12,535.610
3S,3Slj030
4,«$S,»S5' 3,186,714
-1,687,603
S 131,006,460 39427,384
4,870 426.870
:0J76.t<«
t 191,942.450
2( i | l
i 73.834.142
42,417,785 23,»32.»I8
34^(37.359
867.460 (4,680,454)
-73S.87S
t D2,35I,943 44.061.990
-401,387
12429,196
S 189.344,51$
2012
$ 74.358.288 40.621,806 22,906,012
39480^74
1,676,511 130.704
737,893
143.095,962 154,833,957 S 21H7gU680 I lA9.9i6MS J i62;i05,548 159,423414 I 171,757.791 S 177.497.140 S 171.645J88 t 179,611488
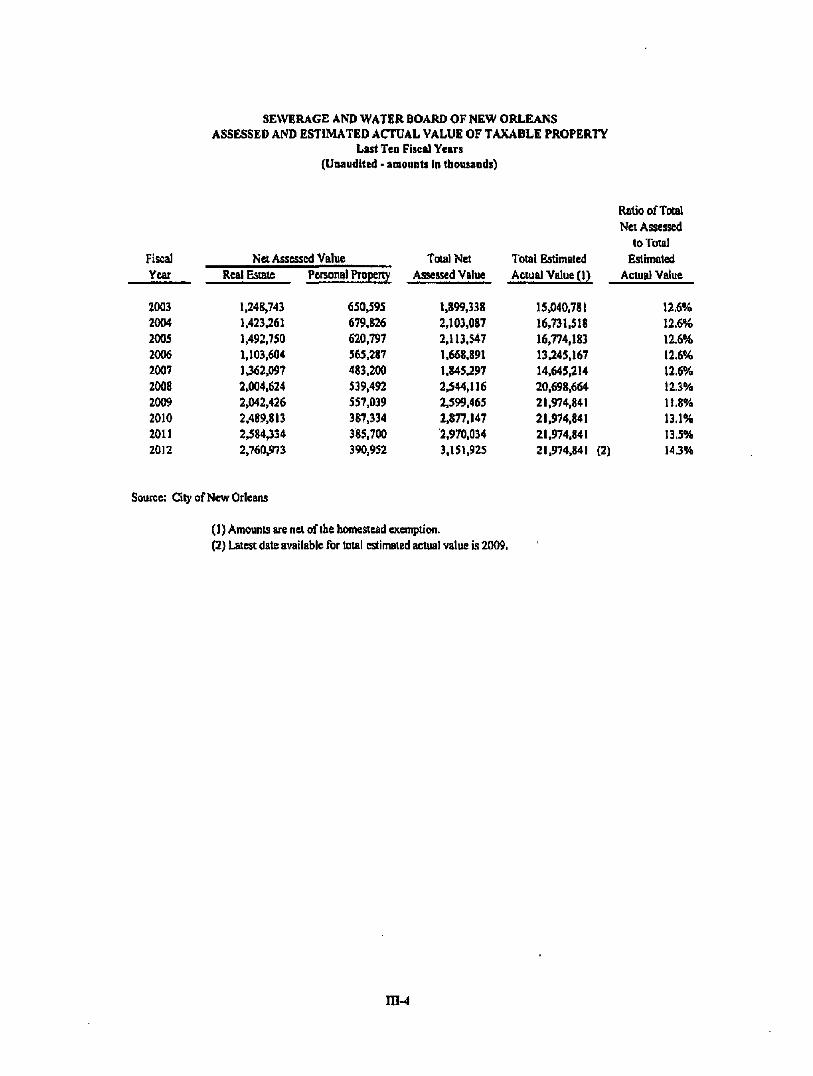
SEWERAGE AND WATER BOARD OF NEW ORLEANS ASSESSED AND ESTIMATED ACTUAL VALUE OF TAXABLE PROPERTY
Last Ten Fiscal Years (Unauilited - amonnts In thousands)
Fiscal Year
2003 2004 2005 2006 2007 2008 2009 2010 2011 2012
Net Assessed Value Real Estate
1,248,743 1,423,261 1,492.750 1,103,604
U62,097 2,004.624 2,042,426 2,489,813 2,584,334 2,760,973
Personal Property
650,595 679,826 620,797 565,287 483,200 539,492 557,039 387,334 385,700 390,952
Total Net Assessed Value
1,899,338 2,103,087 2.113.547 1,668,891 1,845,297 2,544,116 2,599,465 2,877,147 2.970,034 3,151,925
Total Bslimated Actual Value (1)
15,040,781 16,731,518 16,774,183 13,245,167 14,645,214 20,698,664 21.974,841 21,974,841 21,974.841 21.974,841 (2)
Ratio ofTotal
Net Assessed to Total
Estimated Actual Value
12.6% 12.6% 116% 12,6% 12.6% 12.3% 11,8% 13.1% 13.5% 143%
Source: Citjr of New Orleans
(1) Amounts are net of the homestead exemption, (2) Latest date available for total estimated actual value is 2009.
ni-4

SEWERAGE AND WATER BOARD OF NEW ORLEANS PROPERTY TAX RATES - DIRECT AND OVERLAPPINC COVERNMENTS
Last Ten Vocal "V tan
(Uoandilcd)
Number o f M i i b
(PcrSl,O0O of assessed value)
•
Kuxal
Year
2003
2004 2(M5
2«)6
2007
2008
2009
21)10 2011
2012
Crityof
New Ol leant
7K..W
78,59 7«,.W
89.S9
82.39
61.34 61.34
64.31 72.05 72.0S
Orleans
Levee Board
12.76
12.76 12.76
1Z.76 1X76 0»»4
o»> 0 * " O * "
O " '
Orieans
Levee District
Q444
0 » "
o*«* 0 « " q»»»
9.65
10.95
11.67
11.67
11.67
Algiers
Levee District
0 " *
o««« o»** o*** 9.28
12.76
12.76 12.76
12.76
Sewerage &
Watci Board
of
NewOrleans
22.S9**
77. S9**
22.59»»
22.S9** 22.59»»
16.43** I 6 . 0 3 "
16.43** 16.43**
16.43**
Oileans
Parish
School Boaid
52.83
57.80
52.80
58J5 52.90
38.47 38.47
44.12 44.12
43.60
Audubon
Parte &
Zoo
4.55
4,5S
4.55
4J5 4.55
3.31
3J1
3J1 3 J I 3J1
Total
171J2
17129 171J29
188J4
175.19
129.20
130.10
140.93 148.67
148.15
Souice: City u f New Orkaiis
»The Homeskad Exemption is not allowed fnr the new 9-Mill PcJiee and Fire Tax.
**3 inilL<! ado|Mett in 1967 expires in 2017
**6 mills adtqrted in 1978 expires in 2IIZ7
**9 mills adopted in 1982 expires in 2032
*Special mOlage beginning in 2U0K anil no lungicr City-wide.

SEWERAGE AND WATER BOARD OF NEW ORLEANS TEN LARGEST TAXPAYERS
December 31,2012 and Nine Years Ago (Unaudited)
Name of Taxpayer
Entergy Service AT&T Capital One Bank Harrah's Entertainment Marriott Hotel Properties JP Morgan Chase Bank International Rivercenter Whitney Bank C S & M Associates Hertz Properties
Name of Taxpayer
Entergy Service BellSouth Telecommunications HibemiaNational Bank
Bank One Whitney National Bank Harrah's Entertainment Tenet International River Center Marriott Hotel Properties C S & M Associates
Type of Business
Utility Telephone Utility Bank Casino Hotel Bank Shopping Mall; Hotel Bank
Commercial Real Estate Rental Car
Type of Business
Utility Telephone Utility Bank Bank Bank Casino Health & Hospital Shopping Mall; Hotel Hotel Commerical Real Estate
2012 Assessed
Value
92,525,630 52,626,310 39.216,860 34,589,770 23,085,290 22.490,460 17.466,490 17.299,990 14.759,580 11,710,620
S 325,771.000
2002 (•) Assessed
Value
S 75,365,530 60,994,780 42,610,750
32,623,813 24,145.763 23,945,540 18.318,865 14.241.180 13,727,520 11.462,858
S 317,436.599
Percentage ofTotal Assessed
Value
3.38% 1.79%
1.33% 1.18% 0.78% 0.76% 0.59% 0.59% 0.50% 0.40%
11.30%
Percentage ofTotal Assessed
Value
4.16% 3.37% 2.35% 1.80% 1.33% 1.32% 1.01% 0.79% 0.76% 0.63% 17.52%
(*) The latest date available for the Ten Largest Taxpayers in the City of New Orleans is for the year ended December 31, 2002.
Source: City of "New Orleans
in^
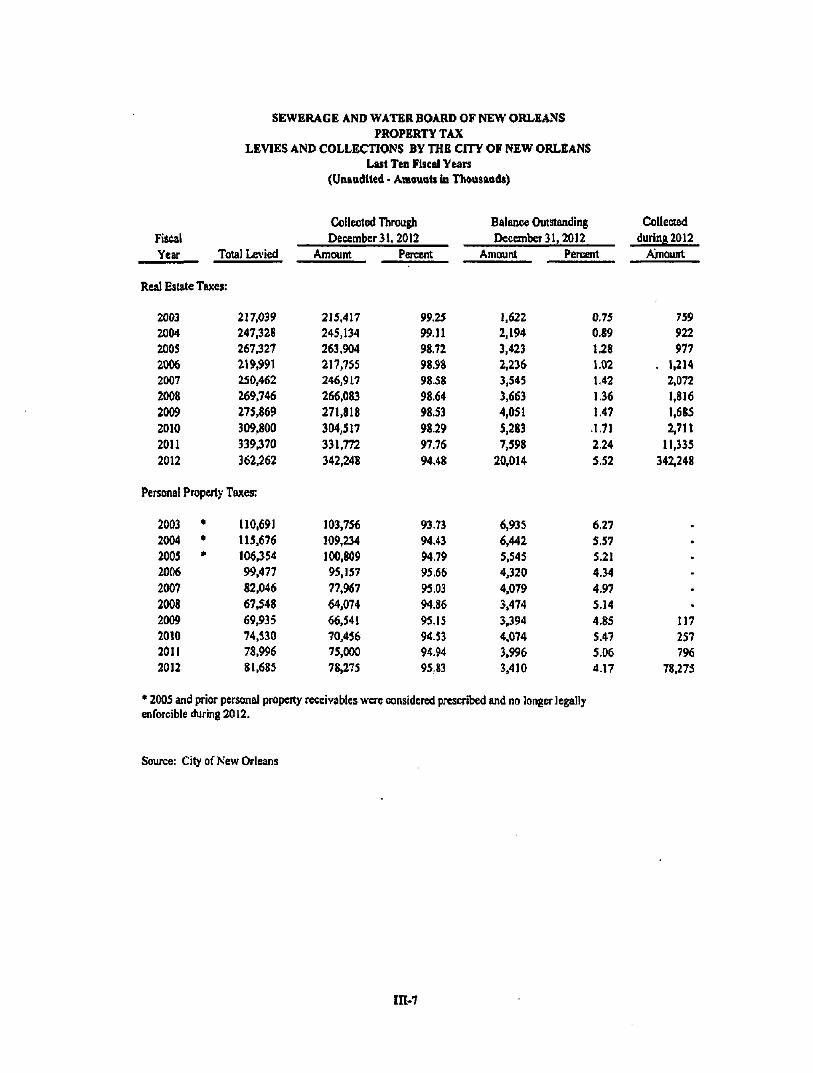
SEWERAGE AND WATER BOARD OF NEW ORLEANS PROPERTY TAX
LEVIES AND COLLECTIONS BY THE CITY OF NEW ORLEANS Last Ten Fiscal Years
(Unaudited • Amounts in Thongaods)
Fiscal Year
Real Estate!
2003 2004 2005 2006 2007 2008 2009 2010 2011 2012
Total Lex'ied
raxes:
217,039 247,328 267327 219,991 250,462 269,746 275,869 309,800 339370 362,262
Collected Through December 31.2012
Amount
215.417 245,134 263,904 217,755 246,917 266,083 271,818 304,517 331,772 342,24?
Percent
99.25 99.11 98.72 98.98 98.58 98.64 98.53 98.29 97.76 94.48
Balance Outstanding December 31
Amount
1,622 2,194 3,423 2,236 3,545 3,663 4,051 5,283 7,598
20,014
2012 Percent
0.75 0.89 1.28 1.02 1.42 1.36 1.47
.171 2,24 5,52
Collected during 2012
Amount
759 922 977
. 1,214 2.072 1,816 1,685 2,711
11,335 342,248
Personal Property Taxes;
2003 * 2004 • 2005 • 2006 2007 2008 2009 2010 2011 2012
110,691 115.676 106354 99,477 82,046 67448 69,935 74.530 78.996 81.683
103,756 109,234 100,809 95,157 77,967 64,074 66,541 70,456 75,000 78,275
93.73 94,43 94.79 95,66 95.03 94.86 95.15 94.53 94.94 95,83
6,935 6,442 5,545 4,320 4.079 3,474 3,394 4,074 3,996 3,410
6,27 5,57 5,21 4.34 4.97 S.14 4.85 5.47 5.06 4.17
117 257 796
78.275
* 2005 and prior personal property receivables were considered prescribed and no longer legally enforcible during 2012.
Source: City of New Orleans
in-7

SEVVERAGE AND WATER BOARD OF NEW ORLEANS WATER AND SEWER RATES
Last Seven Fiscal Years
(Unaudited)
Water Stswcr
Year •
2006 2007 2008 2009 2010
2011 2012
Monthly Base Rate
S 3,50 S S S S
s s
3.50 3.50 3.70 3.90 4.05 4,05
First 3,000 Gallons
$ 2.31
S S
s s s s
1.94
2.35 2.47
2,59 2,69 2.69
Rate per 1,000 Gallons
Next 17.000 Gallons
S 2.31
$ 3.31 S 4.01 $ 4.21 S 4.42 i 4.60 $ 4.60
Next 980.000 Gallcns
S 2.07
$ S S S $ $
2.60 3.15 3.31 3.48 3.62 3.62
Al! Gallons Over
1.000,000
S 1.59 i
S S
s s $ $
2,19 i 2.65 1 2.78 i 2.92 1 3,04 1 3.04
Monthly Base Rate
( 11.60
( 11,60 ( 11.60 ( 11.60 ( 11.60
( 11.60 i 11.60
Rate per 1,000
Gallons
S 4.04
S 4.04 S 4.04 $ 4,04 $ 4.04
S 4.04 $ 4.04
Note; Rates are bated on S.V meter, vvhieh is Ihe standard household meter size.
ni-s

SKWEIRAGE AND WATER BOARD OF NEW ORLEANS RATIOS OF OUTSTANDING DEBT BY TYPE
Last Seven Fiscal Yean (Uiiaad»ed)
s
Fiscal
Year
2006
2007
2008
2009
2010
2011
2012
(1)
m (3)
INnsunal
Incniiie(l) (in Uiuusandi)
S 12,739J0!»
J I4jii\,56i S 15.802.534
$ I5^&t).613
i 13.260.613
S 15.2C0.fil3
$ 15..346.67g (3)
Popuhtion
(2)
208.S48
2««.II3
336.644
354.850
347,907
360,740
369.250
Suutce: Dureau of Econamic Analysts. Saitfu;: www.ccnsos gov/popesL
Most recent available is as of April 2012.
Revenue
Bvnds
J 258.047,868
J 245.907.968
S 235,216,902
S 221,958,521
i ;fl)8.';22.i55
$ 193,498,375
S 186.146.505
Special Tax
Oonds
S 24,90S.0(K) !
S 23.835.000 1
S 22.710,000 1
S 21,52S.0«) 3
S 20,290.000
i 18,990,000 i
S 17,630,000 i
U3HH
Bonds
1
8
t [ 632.842
S 1,503,834
t 1,998,636
Special Community
Disaster Loan Payabls
5 46.011,566
i 61,9«.747
J 61,956.747
i 61.956.747
S 25,166.747
S 25.166,747
$ 25,166,747
Debt Service
Assauncc
Fund
l.auin
$ 40.494,073 1
S 64.655.122 1
$ T7.4«0.393 1
$ 77,460393 i
i 77,460,393 1
S 77.4«iJ47 1
$ 73.T76.967 3
-
C<;ntd
Leases
Pajrabte
( 2.760,672
i 104.445
t ^ 8
t i
Total
Debt
$ 372.219.179
$ 397,459,282
$ 397,344,042
S 382.90O.66I
S 331,972,137
S 316.624.203
$ 304.718.855
Petcemaee
of Pusoiid
Incoine
3.42% 1
3.73% 3
3 9 8 % 3
3.99% 3
4.60% 3
4 8 2 % i
5 04% 3
Debt per
Capita
! I.78S
! USO
E 1,180
! 1,079
E 954
[ 878
E 825

SEWERAGE AND WATER BOARD OF NEW ORLEANS COMPUTATION OF DIRECT AND OVERLAPPING DEBT
December 31,2012 (Unaudited)
Direct debt:
Net Outstanding
Debl Percentage
Overlapping Overlapping
Debt
Sewerage and Water Board, net of debt service fiinds (tax bonds only)
S 17,630.000 100% S 17,630.000
Overlapping debt: City of New Orleans Audubon Park Commission Orleans Parish School Board (1) Orleans Levee District (1)
Total overlapping debt
491,576,615 100% 29,040,000 100%
104,741,527 100%
0%
625,358,142 100%
491,576,615 5 29,040,000 S 104,741,527 J •__
625,358,142
Total direct and overlapping debt $ 642,988,142 100% S 642,988.142
(1) The fiscal year of the Orleans Parish School Board and Orleans Levee District end$ on June 30th; overlapping debt is based on June 30,2012 financial infonnation.
IIMO

SEWERAGE AND WATER BOARD OF NEW ORLEANS REVENUE BONDS DEBT SERVICE COVERAGE
WATER BONDS Last Ten Fiscal Years
(Unaudited)
Fiscal Year
2003
2004
2005
2006
2007
2008
2009
2010
2011
2012
Operating RevtMiue
57,550,818
57.955,617
40,716,893
.36.378,265
35,098,826
47,435,375
70,211,761
77,837,538
76,400,717
73,802,442
Direct Operating Expenses
47.886,711
51,749,138
53,450,918
41.970,320
58,708,774
66,989,084
51,983,869
58,180,206
64,677,227
61,988.096
Net Revenue Available for Debt Services
9,664,107
6.206.479
(12,734,02^
(5.592.055)
(23,609.948)
(19,553,709)
18,227.892
19,657,332
11,723,490
11,814,346
Debt Service Requirement* Principal
2,020,000
1,575,000
1,655,000
1.735.000
1,820,000
1,920,000
2,115,000
2,220,000
2,325,000
2,435,000
Interest
2,490,059
2,177,094
2,110,155
2,032,524
1,980,068
1,917,131
1,771,268
1.685,618
1.592,393
1,493,380
Total
4,510.059
3,752,094
3,765,155
3,767.524
3.800.068
3,837.131
3,886.268
3,905.618
3,917,393
3,928.380
Coverage
2.14
1.65
(3-38)
(1.48)
(6.21)
(5.10)
4.69
5.03
2.99
3.01
Payments are based on future payments subsequent to tlie year of calculation.

SEWERAGE AND WATER BOARD OF NEW ORLEANS REVENUE BONDS DEBT SERVICE COVERAGE
SEWER BONDS Last Ten Fiscal Years
(Unaudited)
Fiscal Year
2003
2004
2005
2006
2007
2008
2009
2010
2011
2012
Operating Revenue
60,837.820
72,434,733
58,494.963
63.907,388
64,750,010
70,836,988
69,501,438
87,569,727
74,173,489
72399.088
Direct Operating Expenses
38.579.473
39,459,105
33,072,494
33.435,068
38,899.024
42.135,587
49,879,875
44361,297
43.173,641
44.869.796
Net Revenue Avaihable for Debt Services
22.258,347
32,975,628
25,422,469
30,472,320
25,850,986
28.701,401
19,621.563
43,208.430
30,999,848
27,529.292
Debt Service Requirements* Principal
6.245,000
6,715,000
8,265,000
8,685,000
9,130.000
15.035,000
11.255,000
11.815,000
12.400,000
13.431,000
Interest
8.988.665
10,343,878
9,873.999
9.453,651
10,211,257
3.326,538
9,058,968
8,435,057
7,863,432
7.282,082
Total
15,233,665
17,058,878
18,138,999
18.138,651
19,341.257
18,36U38
20,313,968
20,250,057
20,263,432
20,713.082
Coverage
1.46
1.93
1.40
1.68
1.34
1.56
0.97
2.13
1.53
1.33
Payments arc based on future payments subsequent to the year of calculation.

SEWERAGE AND WATER BOARD OF NEW ORLEANS DEMOGRAPHIC STATISTICS
Last Seven Fiscal Years (Unaudited)
Personal Fiscal Year
2006 2007 2008 2009 2010 2011 2012
Population (1)
208,548 288,113 336,644 354.850 347,907 360,740 369,250
S $ $ S $
s s
Income (2) in thousands)
12,739,309 14,831,565 15,802,534 15.260,613 15,260,613 15,260.613 15346,678 (4)
Per Capita Personal Income
S 61,086 S
s $ $ $ $
51,478 46,941 35,507 35.507 38,578 41,562
Unemployment Rate (3)
4.30% 3.50% 4.40% 6.80% 8.50% 7.30% 5.50%
(1) Source: w\vw.census.gov/popest/ (2) Source: Estimates- Bureau of Economic Analysis. (3) Source: U.S. Bureau of Labor Statistics. (4) Most recent available is as of April 2012.
in-13

vm 21HM<
SKWERAGE AND WATER BOARD OF NEW ORLEANS NEW OR1.EANS AREA PIUNCIPAl. KMPtXJVRRS
I.BSt Tea Fbcal Yrars (thiaialitcd)
Ranh / Number of Euqdoyecs
200S* 2006 2007 2008 2009 2010 2011 2012
Acme Tnick Line Inc. A l Copeland Invejtmaits
Daily's Casino Lakesfaore Resort
Boh Bros. Coustrucl iui Doomtown Casino Westhmk
Capitnl One Bank N.A.
Ciry o f New Orleans
Dow Chemical Company
east Jefferson General Hospital
Harrah's New Orleans Casino
Hilton New Orleans Hope Ha\«n Center
t l ounu Industries J t r H o b f i D g C o . l.l.C
I w M e e d Mai t in Kbnned Space Systems
LSU Heatlfa Sciences Center New Oilcans
Meadowcrest Hospital
Methodist Hospj td
NASA Michoud
Nonhnjp Gn i in in in Avondale
OcfaMier MedicBl Imtitulions r IlcalOi System
Reginnal TTansil Authoi i ly
Superior EncriEy Services. Inc.
TrjifTXHi Mannc & Land Systems
Tulane UnivEisity
University o f New Orleans
US Past Office
t I S n A , Naiional Finanoc Center West JeflerEm Medical Center
9 / 6 2 3
8 / I . I 0 0
2 /2 .000
I 0 / 4 S 7
7 /1 .116
1 / 6.071
6 /1 ,199 S / t J O O
3 /1 ,900
4 /1 .829
9 / 7 9 0
f / * ^ 0 0
4 /4 .000 S/2.000
1/6.000 6 /2 .000
I0 /7SO
2 /5 ,000
8 / 1 2 5 0
7 /1 ,904
8 / 2 5 0
6 / 7 8 1
10 / ISO
9 / l « )
2 / 2 A 1 2
1 / 5.400
7 / 7 5 0
5 /1 .165
4 /1 ,300
3 /1 ,654
10/2 .000
9 /2 ,150
3 /3 .500
« / 3 , l 5 0 R/2,200
7 /2 .832
3 / 5 . 0 0 0
2 / 5 . 4 0 0
1/9.107
4 /4 ,410
7 /2 .000
9/I.SOO
6 /2 ,150
11/2,000
5 /2 .200
1 0 / 1,400
4 / 2 . 8 3 2
2 /5 ,400
1/9.107
3 /4 ,410
7 / 2 . 0 0 0
9 /1 .500
6 /2 .150
8/2.00O
5 /2 .200
l O / M O t )
4 / 2 , 8 3 2
2/S,4t lD
1 /9 ,107
3 / 4 . 4 I O
X / 2.500
9 / 2 J 0 0
7 /2 .700
2 / 7 . 0 0 0
10/2,000
J / 6 . 0 0 0
1/9.800
4 /5 .000 6 /3 .114
5 /4 ,000
9 /2 .000
8 /2 .150
10/2.000
5 /3 ,150
7 /2 .200
7 /2 ,800
3/5.0OO
2/5 ,400
1/9.100
4 /4 ,400
6 /2 ,900
SUIUCE: Louisiana Commercial Realty (Tcbrvary 2012).
* lliese years arc unavailnblc-

SEWERAGE AND WATER BOARD OF NEW ORLEANS
CAPITAL EXPENDITURES BY DEPARTMENT ENTERPRISE FUND Last Ten Fiscal Years
(Unaudited)
Year Water Sewer Drainage Total
2003 S 14,531,801 S 49,419,442 S 64,155.080 S 128,106,323
2004 5 15,772,218 S 67,424,755 $ 38,407,889 S 121,604,862
2005 $ 10,380,889 S 46,550,580 $ 23,709,553 S 80,641,022
2006 $ 36,481,683 S 49,891,752 $ 19,515,232 S 105,888,667
2007 $ 19,053.142 $ 56,093,058 $ 16,250,996 S 91,397,196
2008 $ 19,938,659 $ 25,608,236 $ 28,592,805 S 74,139,700
2009 $ 22,465,931 $ 56,010,946 $ 47,185,424 S 125,662,301
2010 $ 32,248.119 $ 58,682,400 $ 51,465,065 S 142,395,584
2011 $ 20,374,785 $ 53.662,611 $ 66.821.905 S 140,859.301
2012 $ 33.888.620 (1) $ 60,658,231 (1) $ 90.435.159 (1) S 184,982,010
(1) Includes contributed assets
in-15

SEWERAGE AND WATER BOARD OF NEW ORLEANS SCHEDULE OF FUTURE DEBT PAYME>rrS
OecQinbor 31,2012 (Unauilited)
Water Revenue Bonds
2013
2014
"2015
2016
2017
2018
2019
2020
2021
2022
Principal
Interest
Principal Interest
Principal
Interest
Principal
Interest
Principal Interest
Principal Interest
Principal Interest
Principal
Interest
Principal Interest
Principal
Interest
Total Principal Total Interest
Total Future Debt Payments
Seines 1^8
965,000
315,630
1,015,000 269,793
1,060,000
221,580
1,110,000
170.700
1,165.000 116,865
1,220,000 59,780
Series 2002
1,470,000
1,177,750
1,530,000 1,104,250
1,595,000
1,027,750
1,665,000
948,000
1,740,000 864,750
1,820,000 777,750
3,195.000 686,750
3,345,000 527,000
3,510,000
359,750
All Bond
Issura
2,435,000
1,493,380
2,545,000 1,374,043
2,655,000
1,249,330
2,775,000
1.118.700
2,905,000 981,615
3.040.000 837,530
3,195,000
686,750
3,345.000 527.000
3,510,000 359,750
6,535,000
L. 154,348
3,685,000
184.250
23,555,000
7,658,000
3,685,000
184,250
30,090,000
8,811348 $ 7,689,348 $ 31.213,000 $ 38,902,348
111-16

SEWERAGE AND WATER BOAKO OF HEW ORLEANS S a i E O U U £ OF F t m i B K DF.DT PAYMBNTS
I>ennll icr3l ,20ll (Umsdilcd)
301}
2014
»\s
U I S
» I 7
M i l
101 <
2020
20(21
J M I
2 » l l
203«
U U
M M
2037
tan
sa9
Tonllimnsi T o r i F i m r c l N
Pimdpd t i t t a o
Fmup t i Inbcst
P i i n jp i l merest
tnona '
Jll IHKI
PilDdpd tnS'.rcA
tfOMSt
tolsnst
b o a s t
f>dwqiJ thlSRTt
P r i ^ i p d
talGJGSI
l a a i s t
b iMnu
Mum k n c a
otl'^jraEn&
2,050.000 42S.n4
1.170.000 IIJJOO
useiooo 192.7X0
2,421.000
ia,»7S,00»
Scr id
i.»iojoao
1.913.000 )M. I«5
I.6S5J00O
l.7i9jMO 22J.79I
i.i:o.Mo 141.000
• .VIU.UJU 47,730
i«ai$.ooo 1.577.101
S 11.712.1101
UOOA
l/<3,000 750.191
1.515.000 « « 3 2 »
sn.22g
1.743.000 «S>2.122
uuojm 394 J5D
LVUI.mi) 5m.575
2.010.000 17M73
2J05.000
l4JD)J0Og ] . 4 I U » 7
S 1 7 4 2 ) ^ 7
Sedu looon
1.110.000
1.115.000 504.925
i j u . a o a 440JI5*
1.525.000 571,825
I.400.O0O 2»7.5»
1.480.000 2I«.»S0
1.520.000 114.47)
I.6i0.000 45j650
I0.99I.DOO rJT7J21l
t ii,572,saa
R a i n lOOl
i j i t s j xn n i . T i i o
1.760^000 79».140
i m L o m 709,»I0
i.9mo()o 6i£.«I0
U030LODQ 5t7.»«0
2,ia>,0DO 4 l 4 j e o
2.22},0W 304 J44
2.II5.00D 117,494
63.110
11.110.000 4.494.27*
t 22.8*4.2>»
2M1
2,790JOO» 1,727,710
2.945.000 I.5MJ7S
1,110.000 1,411.000
3.380UOOO 1.171.250
3.460.000 I.104.7S0
IjUOlOOO M 7 / X »
3,l50lO0O 739J0O
4,OGo.aoa i41.7S»
4JI5.000 31J.I2S
4.S2O.O0O lU.OOO
.
35.950.000 9.777.M0
t 4S.727J00 >.
n u
2<0gDOO I»T .«1
270;,«es I2«.<lt
7».oaft
290000 10^091
305.000 94.472
115,000 «3.4«)
311^000 69,5«}
345.000 5i,«47
IW.900 41/UI
ItOjOOO Z 3 J M
995.000 •,<41
If 1 .1
I j c i t a 1004
l,4t5,O0O »4*,4I1
U4$.00O >«a.i5&
I.ea5.ooo •09.411
I.&80.000 743.711
1.755.000 67S,(ai
•.ns.ooo <03.131 .
1.915,000
445,011
^lOO.OOO itiv.«oa
Z^10;00O 3a2.} i9
uzo.ooo 161.721
^435,000 « . 7 M
2 2 j u . o a o . . « J I « 7 ^ I « . _
I 29J52j<16
Ser in 1009
SOO.O0O 1.296.4S3
(45.000 l . iM.211
190.000 I,t l7.«25
94ajOOO 1^056,713
««5.ooa l,OII,««9
1,055.000 951.413
1,120.000
1.190.000
I.2i5,000 743.ZI3
IJ43.P00 C«.9IS
ljd25.000 SII.SI3
1.515^000 491,719
l.«l».O00
l ,7».000 2I9.&I1
too.««o 17«.TS0
l.915.0ai £0.711
2i j6D.oao i2.>«9.C44
I 34.t29.M4
S o t o 1011
4 I I . 0W J3,W2
415,000 31,Tn
4I9,«(» 29.904
422.000 2<,«19
427.000 2ekl20
41I.400 24,199
4I5.O0O 2 U S 9
4».<KI0 J0.1OJ
443.000 I I . 1 U
447,000 I t j l l
4>l,«00 14,311
45<,000 12.292
4fiD.00O 10,240
H.lTO
4C9.O0O 6.022
47i,0D0 3.931
409.405 1,M1
7.0r .797 307,775
S 7.135.572
AOBogd iBo ta
13,411,0110 7,2»2,0»»
I4,I10.««0 6,616,719
I 4 , m , 0 l » 5.911,120
15.517.000 S , l» . t45
16.402.000 4,3D,52I
14.606,000
13.460.000 J.927.062
I4.l«4.ao0 7 . z n . u i
tSJS}.000 1.629.135
•AXOOO I.I60.22I
4,511,000 149.649
4.316,000 641.192
1.975.000 501,959
2^79,000 402.074
2.1I9.0OO 295,770
112.721
2,354,505 «2.«14
IS«.0>«.iO» 43 . IK .7M
S i99.9XS.2M

SEWERAGE AND WATER BOARD OF NEW ORLEANS SCHEDULE OF FUTURE DEBT PAYMENTS
December 31,2012 (Unaudited)
Drainage Special Tax Bonds
2013
2014
2015
2016
2017
2018
2019
2020
2021
2022
Principal Interest
Principal Interest
Principal Interest
Principal Interest
Principal Interest
Principal Interest
Principal Interest
Principal Interest
Principal Interest
Principal Interest
Total Principal Total Interest *
Total Future Debt Payments
Series 1998
595,000 198,280
625,000 170,018
655,000 140,018
685,000 108,250
720,000 74,000
760,000 38,000
Seri^ 2002
830,000 593,218
865.000 560.018
900,000 525,418
940,000 489.418
985,000 450,878
1,030,000 38,000
1,870.000 365.218
1,960,000 282,938
2,055,000 194,738
AH Bond Issues
1,425,000 791,498
1,490.000 730,036
1,555,000 665,436
1,625,000 597,668
1,705,000 524,878
1,790,000 76,000
1,870,000 365,218
1,960,000 282,938
2,055,000 194,738
t,040,000 728,566
2,155,000 100,208
13,590,000 3,600,048
2,155,000 100,208
17,630,000 4,328,614
$ 4,768,566 $ 17,190,048 $ 21,958,614
1IM8

SEWERAGE AND WATER BOARD OF NEW ORLEANS SCHEDULE OF FUTURE DEBT PAYMENTS
Deetmber 31.2012 (Unauilltei])
2013
2014
2015
2016
2017
2018
2019
2020
2021
2022
2023
2024
2025
2026
2027
2028
2029
Total Princip Total Interesl Total Future
Principal Interest
Principal Interest
PrineipB] Interest
Prixtcip&l Interest
Prteeiptil Interest
Prucipal Interot
Principal ]iUe9«si
Principal Interest
Principal liiterest
Principal InCetcs'l
Principal Ituetcst
Principal Interest
Principal lntei«st
Principal Interest
Principal Ititercst
Principal Interest
Principal Interest
at 1
Debt Payments
Water
2.435.0O0 1,493.380
2.545.000 1.374,043
2.655,000 1.249,330
2,775.000 1,118,700
2.905,000 981.615
3,040.000 837,530
3.195.000 686,750
3.345.000 527,000
3,510,000 359.750
3,685,000 184,250
30,090.000 8,812,348
S 38.902.348
All Departi Sewer
13,431,000 7,282,083
14,110,000 6,616,719
14,824.000 5,911,320
15,587.000 5.170.845
16,402,000 4,383,521
14,696,000 3,618,597
13,460.000 2.927,062
14,164.000 2,242.880
10,833.000 1.629,825
8.822,000 1.160.221
4,511.000 849,649
4,316,000 648,892
1,975,000 501.959
2,079,000 402.076
2,189.000 295,770
2.303,000 182.721
2,354,505 62,624
156.056,505 43.886.762
J 199.94337
inents Drain age
1,425.000 791,498
1,490.000 730,036
1.555.000 665.436
1.625.000 597.668
1.705,000 524,878
1,790,000 76,000 .
1,870,000 365,218
1,960.000 282.938
2,055,000 194,738
2,155,000 100,208
17,630.000 4,328.614
$ 21,958.614
Total
17^51.000 9.566,960
18.145.000 8.720,798
19,034,000 7,826,085
19.987,000 6.887,212
21,012,000 5.890,013
19,526,000 4.532.127
18,525.000 3.979.030
19,469.000 3,052.818
16,398,000 2,184.312
14,662.000 1,444.678
4,511.000 849.649
4,316,000 648.892
1,975,000 501.959
2,079,000 402.076
2,189,000 295.770
2,303,000 182,721
2,354,505 62,624
203.776,505 57,027,723
$ 260.804.228
m-19
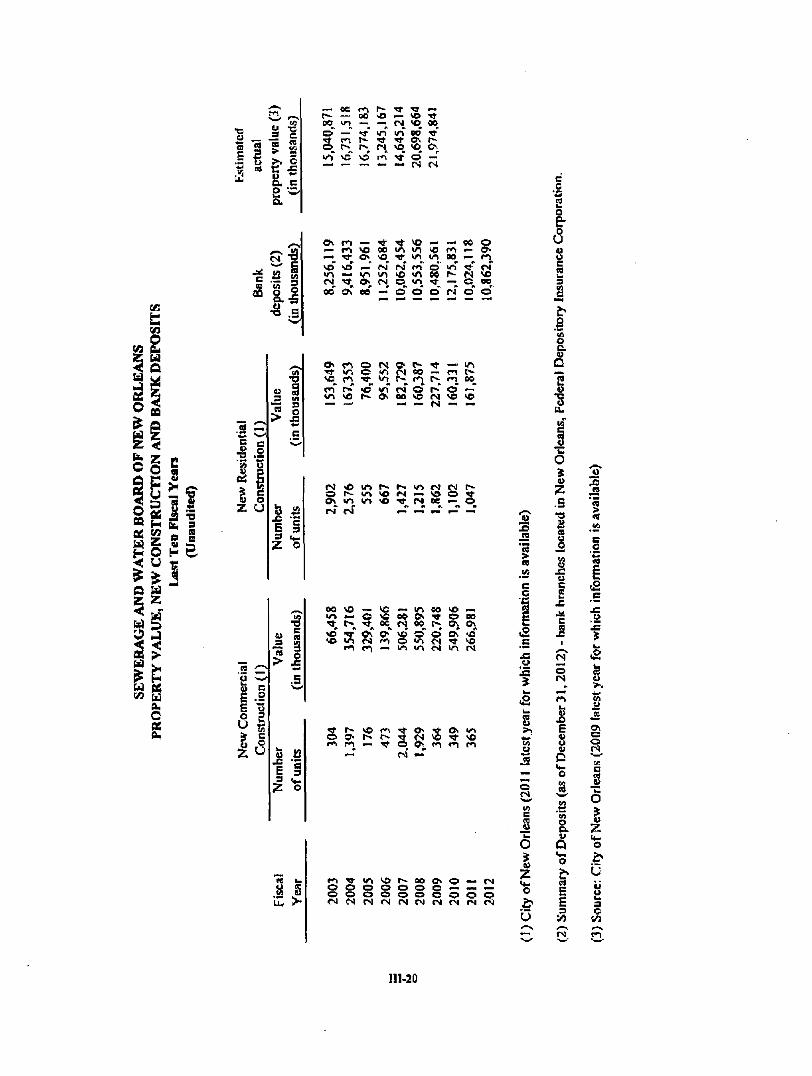
t 5 U a
•a
at
n»
^^ ca
> g" ^ P
CO
c V) 3 c
•s c
Ou
— OC P^ I*- T t Tt — ( ^ — oo so — O Tt 00^ V I _ . _ j ^ { > ! l o ao o ^ —" T * 1/1 «n oo V*
S r^. t~- ' ^ T t 0 \ r -
t ^ r-' M >0 vo O . . . . ^ r- .. » ,.
l O \ C VS m Tf O — — . - — - . - . (S fS
Si ^11
o ^ r " — • ^ t ' t ^ T - r ' ^ g •— m \ o o o v r . » n ' > o f » ^ .— Ti- o 'O V vn in 00 .— r^ v o s o — ( M i M c n O m r J - o i
o o o \ c o — o o o f s o o
d : - :
?f
03
J "3 >
^^ (A
l A
s o
o> •<r "O
r»f »A
^
n i r .
^. r* »a -—'
o ^ •V
«c t ^
f S < f l
<ri o
c ! . r«) ee
•—*
r-CO
a o • o
••"
• *
f . r-* <M M
_. m fn O vo
^
1/^ t*-
*. .-. vo » M
x ; •= E § 5 •*-
~ P - - u ^ v O f s | — v o o t Ov wT_ irv «o CM" ( M '
•V r * oe — o
oo vo — ir> f o ^ r f ^ -^^ vo' ^ Ov VO <A r q
ve — ir t OO vo r-, VO 00 Ov ^ O BO oc r ^ 00 f^^ o \ Ov o^' vo o " o oC « ' f o o vn f s ' J - vo — m >r> ( s j I/-1 CM
4> 13
S S: {5 P f , r o ^ Tir
0^ "Cf Ov w-l f ^ « ^ « O^ f i * o t o
J3
hN
£ fi >. M CJ W
o (•-4 fO
.s b 4> U u
c — o o
«e I .
iZ >•
« » t t r w i v o r - a o o > 0 — <N o o o o o o o ^ — — o o o o o o o o o o r 4 N r v i r N r < « { N r v t r N c > i f S
J) o
o p. u Q
n E E 3
.JO JS I .o
x:
c^ c o
D
M o 41
?: o
'0 o ha 3 c
111-20

OV <r. "1 »-.
^ o.
o r
M *
«M vn ov" <
oc r-o. rn <N
O (N "T, r . m
fO 00 Ov «N <S
o
t~ O — •ri 0% vn — n vn -^ i « O
* «> » ~ ~ O OV
?)
^ 1^ — 1^ «n o>
^
o CM
O t-» VO <»> OS « > VO * •/^ Ov f n Ov » ^ Ov Oh cf
cs r>5 ts
00 t ^
— * — rr,
ev o o
r- — t - •* 00 * r^ Ol ir)_ r-- f ^ 00 -T o f o> M
C* »M M
<s oe — o <n o»
- a
o
vo r» m >n CO K «n 00 v^ >«> r t . t"-_ - • Ov ov' r i
cs <S c i
«n
t ^
s CM
CO oo lA *-<
N vo CO V «„«, CS CM
o 00 t>
a « o ' . s (?v 8
o Ol
»n v/^ r ^ 1 ^ —* o \ Ov r-f
< ^ CM <S
00 cs
E a i3 - 'I
« S £ ? ? (S
1 J s I y 4)
I u
ni-2j

SEWERAGE AND WATER BOARD OF .NEW 0 R L E . \ N : S
NUMBER OF ACTIVE EMPLOYEES Last Six Fiscal Years
(Unaudited)
Year
2012
2011
2010
2009
2008
2007
Number of Active Employees
991
994
974
964
940
899
Source: Sewerage and Water Board of New Orleans.
III-22
(This page intentionally left blank)

' 44i
' I « ' ^*
. i . •, t M i * •. . .^. V N * ' d
Cooperative wntune In partnership with SL Bernard Parish, work is under\vay by the S&V\'B on the first phase of a long-term effort to divert treated effluent from the East Barvk Sewage Treatment Plant into a formerly dead c>'press habitat. The habitat has largely reverted to open water south of Bayou Bienvenue and the Mississippi River GuU Outlet in Orleans and St. Bernard.
Use of the wetlands for assimilation of wastev^'ater has several benefits, including reducing the effects of salt water intrusion in the project area and increasing the build up of sediment to improve habitat quality and plant produdivitj'. Ultimately, cypress replanting will aid in wetiand stability, water filtration and storm protection fbr future generations. In this photo, effluents are being liistributed to the open water area.
The Sewerage and Water Board saves thousands of dollars a year by operating its own in-house Mailing and Printing Departments. The mailing staff processed approximately 1,864598 pieces of mail in 2012. This includes customer bills and customer commiurications, applications for new service, corrected bills, payments to subcontractors, ched(s for retirees and the return of customer deposits. The department also includes billing inserts with important news from the Qty and conunuiuty and dvic itssoaaliims.
The Print Shop made 1.1 million reproductions last year, many under tight deadlines. The staff prepares reports, booklets, color presentations and handout billing inserts and much morxs.
Recently the Cbnununity and Intergovernmental Relations Department worked with the Mailing and Printing Departments to develop a cheaper method of mailing an annual government-mandated report on the quality of drinking water to everj' SkWR customer, again saving thousands of dollars for customers.
s u p p L E M E N T A L
S E C T I 0 N

SEWERAGE AND WATER BOARD OF NEW ORLEANS
2012 ACTUAL CAPITAL EXPENDITURES
WATER DEPARTMENT
C.V.» WATERWORKS
110 Normal Extension & Replacement 135 Improvement of Chemical System IS6 Advance Water Treatment 175 Water Huiricanc Recoveiy Bonds
TOTAL WATERWORKS
538,567.30 3.555.14
1,005,974.91 22,866,526.14
24,414,623.49
WATER DISTRIBUTION
214 Normal Extension & Replacement 215 Rehabilitation - Mains, Hydrants and Services 239 Mains DPW Contracts
TOTAL WATER DISTRIBUTION
1.848,698.06 (1.007.91)
717.133.13
$ 2,564,823.28
GENERAL BUDGET
800 Water Share of Genera] Budget Items
GENERAL BUDGET
TOTAL WATER DEPARTMENT
5,631,388.72
$ 5,631.388.72
S 32.610.835.49
NOTE: These figures do not include proration of interest expense.
IVI

SEWERAGE AND WATER BOARD OF NEW ORLEANS
2012 ACTUAL CAPITAL EXPENDITURES
SEWERAGE DEPARTMENT
Q M SEWERAGE SYSTEM
317 Normal Extensions & Replacement of Gravit>' Mains
318 Rehabilitation Gravity Sev 'er System 326 Extensions & Replacement to Sewer Pumping Stations 339 Mam in Streets Dept, Contracts 348 Noimal Extensions & Replacements 368 Wetlands assimilation Project 375 Sewerage Hurricane Recovery Bonds 381 Modification & Extension of WBSTP to 20/50 MGD
TOTAL SEWERAGE SYSTEM
10,109,846.49 1,009,949.16
40,028.86 1,534,332.72 1,593,234.31 1.100.903.58
31,233.350.42 3,575.38
46,625.220.92
POWER PROJECTS AND GENERAL BUDGET
800 Sewerage Share ofGeneral Budget Items
TOTAL GENERAL BUDGET
TOTAL SEWERAGE DEPARTMENT
5,589.364.99
5.589,364.99
52.214,585.91
NOTE: These figures do not include proration of interest expense.
IV-2

SEWERAGE AND W A T E R BQAIU) O F N E W ORLEANS
2012 ACTUAL CAPITAL EXPENDITURES
DRAINAGE DEPARTMENT
l A
418 439 471 476 478 486 496 497 498 499
511 554 575
600 800
CANALS
Normal Extension &. Replacements Major Drainage Participation in DPW Projects SELA Program Management Hollygrove Canals (SELA-A) S. Claibome-Lowerline to Monticello Street Napoleon Avenue Canal Improvements (SELA-B) General DeGaulle Canal (SELA-C) Florida Ave. Canal - DPS#19 to Peoples Ave. (SELA-B) Dwyer Intake Canal (St. Charles to Dwyer (DPS)(SELA-A) Jefferson Avenue Canal
TOTAL DRAINAGE CANALS
PUMPING STATIONS
Normal Extension & Rep./Stations Expansion of Dw>'er DPS (SELA-A) Drainage Hurricane Recovery Bonds
TOTAL DRAINAGE PUMPING STATIONS
GENERAL BUDGET
Modification of Steam System Drainage Share of General Budget Items
TOTAL GENERAL BLDOET
TOTAL DRAINAGE DEPARTMENT
S 2.328.523.73 829,572.60
1,554,061.64 141,628.66
2^02.524.50 3,439,175i)7
115,909.61 676,736.73 575,922.64
3.129.032.43
S 14,993,088.51
$ 1,484,990.94 515.65
748,820.30
1 2,234,326.89
1,289,202.00 4,328,005.95
1 5.617.207.95
$ 22.844.623.35
NOTE: These figures do not include proratian of inierrat expense.
TV.3

SEWERAGE AND WATER BOARD OF NEW ORLEANS
2012 ACTUAL CAPTIAL EXPENDITURES
C.P.# POWER PROJECTS
613 Modification of Sleam System
TOTAL POWER PROJECTS
$
$
POWER PROJFXrrS
Water Seweraee
$
$
Drainage
$ U89,202.00
S 1,289,202.00
Total
$ 1,289^102.00
J 1.289,202.00
NOTE: These figures do not intrude proration of interest expense.
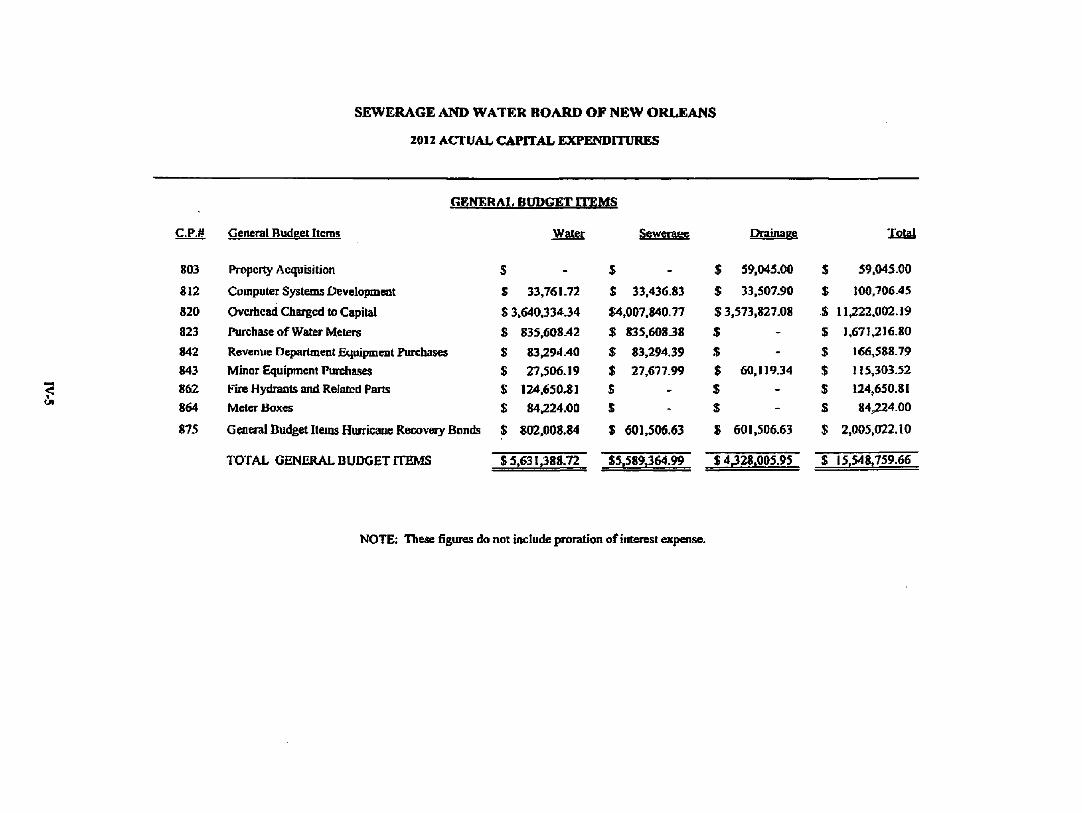
SEWERAGE AND WATER BOARD O F NEW ORLEANS
2012 ACTUAL CAPITAL EXPENDITURES
^
C.P.# General Biidget Items
803 Pit>pcrty Acquisition
812 Computer Systems Development
820 Overhead Charged to Capital
823 Purchase of Water Meters
842 Revenue Departmisnt Equipmtnit Purchases
843 Minor Equipment Purcha.se$ 862 Fire Hydrants and Relatcil Parts 864 Meter Boxes
875 G eneral Budget Items Hurricane Recovery Bonds
TOTAL GENERAL BUDGET ITEMS
GENERAL BDDGET ITEMS
Water
S
$ 33.761.72
S 3.640.334.34
S 835,608.42
$ 83,294.40
$ 27,506.19
$ 124.650.81 S 84.224.00
Bonds $ 802,008.84
$5,631,388.72
Sewerae«
$
$ 33,436.83
$4,007,840.77
$ 835,60838
$ 83,294..39 $ 27,677.99
$ $
$ 601.506.63
$5,589,364.99
$
$
Drainage
59,045.00
33.507.90
$ 3,573,827.08
$
$
$ $ S
$
-
-60,11934
--
601,506.63
$ 4328.005.95
S
$
• i
$
$
$
s s s
s
Total
59,045.00
100,706.45
11,222.002.19
1,671,216.80
166,588.79 115,303.52
124,650.81 84,.224.00
2,005,022.10
15.548.759.66
NOTE: These figures do not include proration of interest expoise.
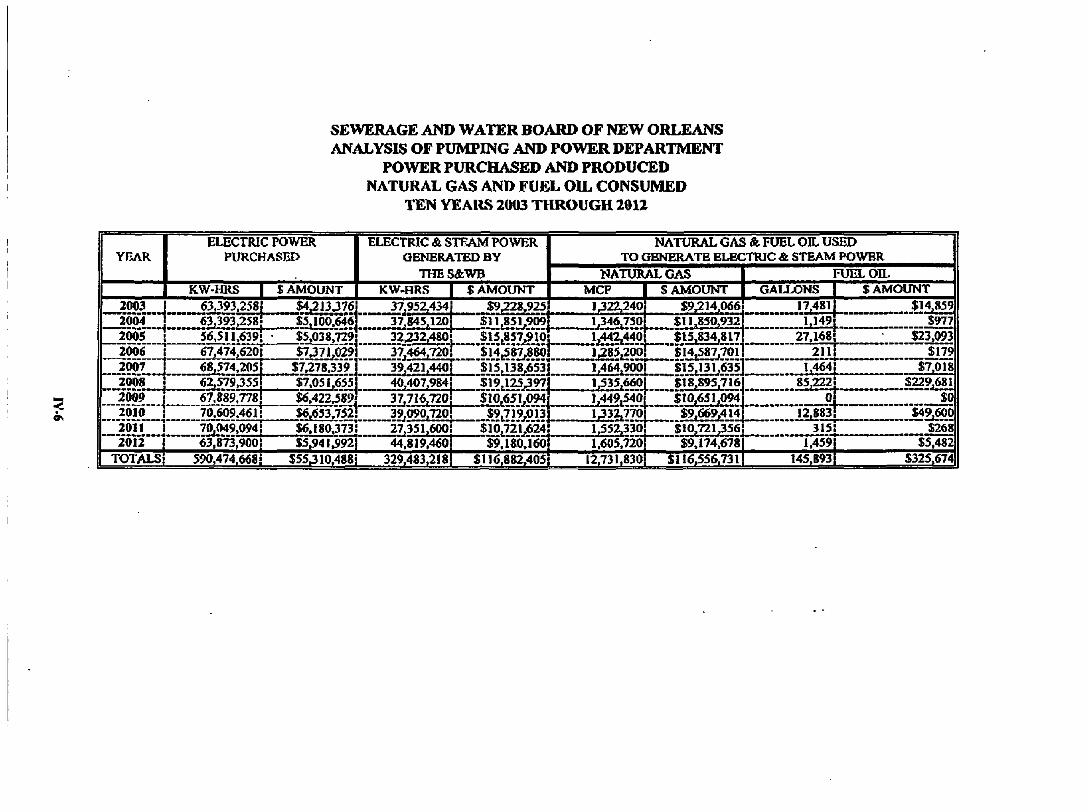
SEWERAGE AND WATER BOARD OF NEW ORLEANS ANALYSIS OF PUMPING AND POWER DEPARTMENT
POWER PURCHASED AND PRODUCED NATURAL GAS AND FUEL OIL CONSUMED
TEN YEARS 2003 THROUGH 2012
YEAR ELECTRIC POWER
PURCHASED ELECTRIC & STEAM POWER
GENERA'mD BY
THE S&WB
NATURAL GAS & FUEL OIL USED TO GENERATE ELECTRIC & STEAM POWER
NATURAL GAS FUEL OIL KW-HRS $ AMOUNT KW-HRS $ AMOUNT MCF $ AMOUNT G A I X J O N S $ AMOUNT
2003 003 J x : r ; — I "
63.393.258 jMjgisjr/e 37,952,434 $9,228,925 1,322,240 $9,214,066 17,481 $14,859 2004 63,393.258 $5,100,646 37,845,120 SI 1.851.909 1.346,750 $11,850,932 1,149 S977
_2005 2006"
56,511,639: $5,038,729 32332,480
2007 - 1 -67.474,620; $7,371,029 68,574,2058 $7,278,339
37,464,720 J.l5j^B57^J.O
39,421,440 $_I4j587,880
'$T5,138.653
J,442^44q Jj285,2p0 1.464,900!
$15.834,817 27,168. $14^587,701
•$15,131,635 _2n
' l ,464
$23.093
"$7 ,018 2008 I 62,579,355! $7,051,655
< 9s
2009 i "'20l6~'\ ""ioVi ""
40,407,984 37.716J20 67.889,778' $6.422,589
"70.609.46 Ij $6,653'.7"52; 39,090,720 "70.049,094; $6.I803"73i 27.35 l,6()bl
__S19^125j397 $10^(^1^094
Ij535j660| $18^895,716
$9,719,013 I.449.540j $10,651.094
. 85,222. 0
$10,721,624 1^332,7701 $9,669,414 1,552^330! $10,721,356
12,883 315:
$229,681
SO "$49,600
$268 2012 63.873,900! $5,941,992} 44,819.460 S9.l«Q.l60 1.605.720 j $9,174,678 1.459i $5,482
TOTALS 59Q.474.668j $55310.488i 329.483,218 $116,882,405 12.731.8301 $116,556,731 145,893 i $325.674
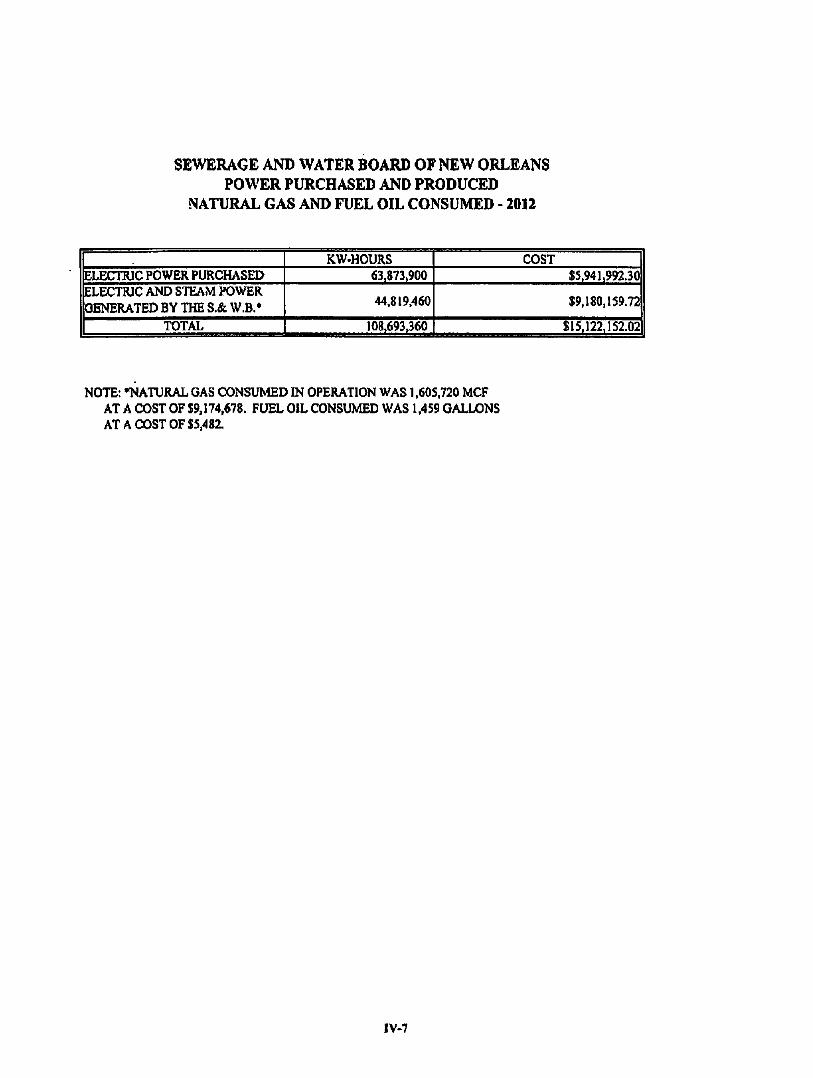
SEWERAGE AND WATER BOARD OF NEW ORLEANS POWER PURCHASED AND PRODUCED
NATURAL GAS AND FUEL OIL CONSUMED - 2012
ELECTRIC POWER PURCHASED ELECTRIC AND STEAM POWER GENERATED BY THE S.& W.B.*
TOTAL
KW-HOURS 63,873.900
44,819,460
108.693.360
COST $5,941,992.30
$9,180,159.72
$15,122,152.02
NOTE: -NATURAL GAS CONSUMED IN OPERATION WAS 1.605.720 MCF AT A COST OF $9,174,678. FUEL OIL CONSUMED WAS 1.459 GALLONS AT A COST OF $5,482.
IV.7
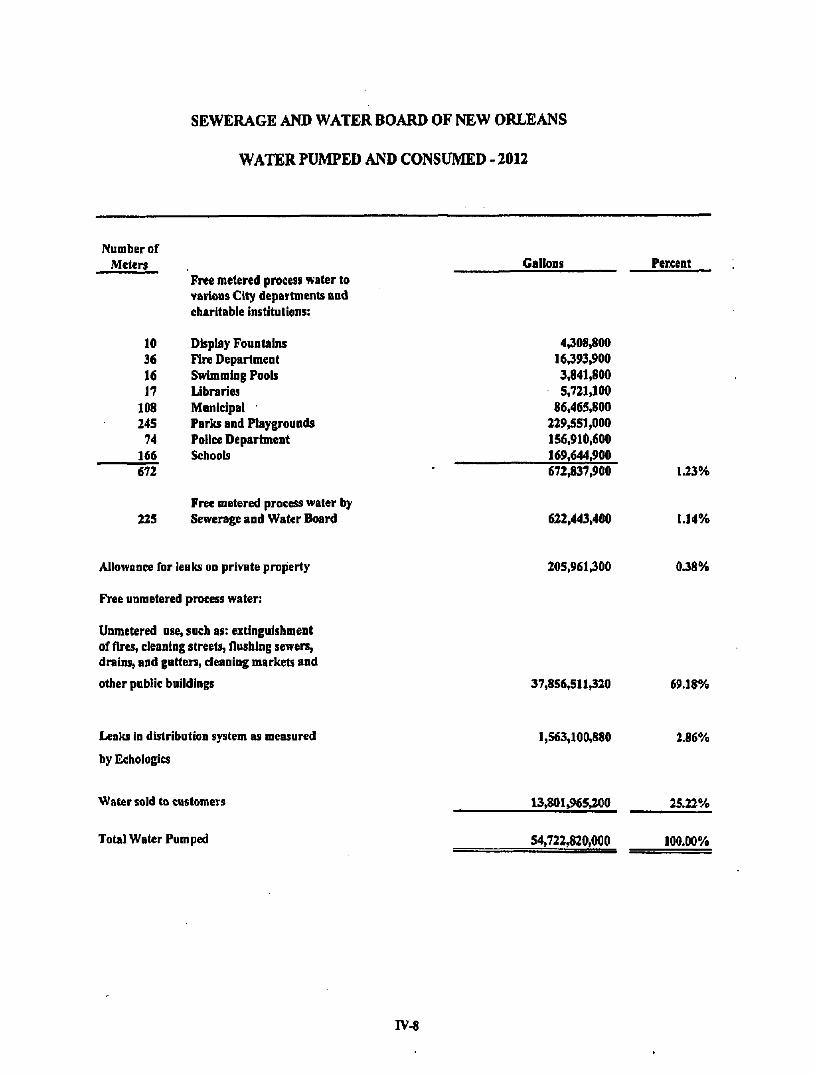
SEWERAGE AND WATER BOARD OF NEW ORLEANS
WATER PUMPED AND CONSUMED - 2012
Number of Meters
Free metered process water to various City departments and charitable Institutions:
10 36 16 17
108 245 74
166 672
225
Display Fountains Fire Department Swimming Pools Libraries Municipal Parks and Playgrounds Police Department Schools
Free metered process water by Sewerage and Water Board
Galloos
4,308,800 16,393.900 3,841,800 5,721,100
86,465,800 229,551,000 156,910,600 169.644,900 672,837,900
622,443,400
Percent
1.23%
1.14%
Allowance for leaks on private property
Free unmetered process water:
Unmetered use, such as: extinguishment of fires, cleaning streets, flushing sewers, drains, and gutters, cleaning markets and
other public buildings
205,961,300
37,856,511,320
0.38%
69.18%
Leaks in distribution system as measured
by Echologics
1,563,100,880 2.86%
Water sold to customers
Total Water Pumped
13.801.965,200
54,722,820,000
25.22%
100.00%
IV.8

SEWERAGE AND WATER BOARD OF NEW ORLEANS
Gallons Metered - Pay Water Consumption - 2012
Month
January
February
March
April
May
June
July
August
September
October
November
December
Gross Total
Consumption
1,019,203,500
1,083,572,400
1,116,620,500
1.149,220.000
1,044,507,500
1,173,162,000
1,315,905.900
1,102,224,700
1,213,907,200
I,321j840,400
1,111,027,900
1,150,773,200
13,801,965,200
IV-9
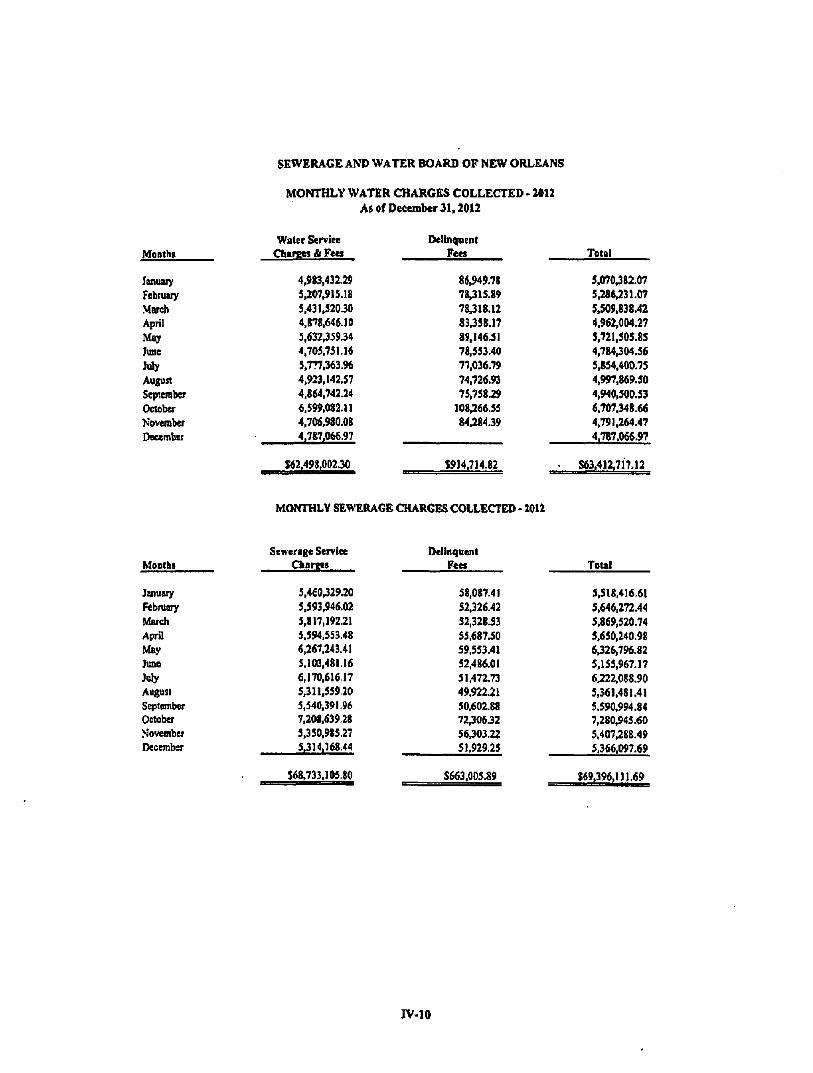
SEWERAGE AND WATER BOARD O F NEW ORLEANS
MONTHLY WATER CHARGES COLLECTED - M12
As of December 31,2012
Months
Ianuai> Febnuiy Morch April May Itine Uy August September October November Deoembtr
Water Service Charees & Fees
4,983,43129 5,207.915.]« 5,431,520.30 4,878,646.10 3,632.359.34 4.705.751.16 5.777.363.96 4,923.142,57 4.864.742.24 6,599,082.11 4,706,980.08 4,787.066.97
Delinqnenl Fees
86.949.78 78,315.89 78,318.12 83,358.17 89.146.51 78,553.40 77,036.79 74,726.93 75.758J9
108.266.55 84.284.39
Total
5.070,382.07 5.286;J31.07 5.509.838.42 4.962,004.27 5,721,505.85 4,784.304.56 5,854,400.75 4,997,869.50 4,940.500.53 6,707.348.66 4,791.264.47 4.787.066.97
$62,498,002.30 $914,714.82 S63.412.717.12
MONTHLY SEWERAGE CHARGES COLLECTED - 2012
Monlht
Jsnutuy Febmary March April May lime
July August September October November December
Sewerage Service Chances
5.4€0.329.20 5,593.946.02 5,817,192.21 S.S94.SS3.48 6,267.243.41 5,103.481,16 6,170,616,17 5,311,559.20 5,540,391.96 7.208.639.28 5.350.985.27 5,314,168.44
$68,733,105.80
Delinquent Fees
58,087.41 52.326.42 52,328.53 55,687.50 59.553.41 52,486.01 51,472.73 49.922.21 50,602.88 72,306.32 56,303.22 51.929.25
S663.00S.89
Total
5.518,416.61 5.646,272.44 5.869,520.74 5,650,240.98 6,326,796.82 5.155,967.17 6.222,088.90 5,361,481.41 5.590.994.84 7,280.945.60 5,407.288.49 5,366.097.69
$69,396,111.69
rv-io

SEWERAGE AND WATER BOARD OF NEW ORLEANS
TABLE I As of December 31, 2012
CARROLLTON TURBIDITIES
t/axinuTi Minimum Average
Rh/er frjTW
2008 165
7 67
2009 320
5 71
2010 274
5 71
2011 282
11 51
2012 159
S 341
Effluent Settling Reservoirs
2008 15 1,0 4.9
2009 19 1.1 3.1
2010 8.3 1.1 3.2
2011 10 1.0 2.9
2012 7.3 0.5 2.0
200B 0.90 0.09
1 0.131
20Q8 0.78 0.09 0.14
Fitters NTU 2010 0 ^ 6 0.07 0.13
2011 0.22 0.08 0.13
2012 0.35 0.08 0.12
TABLE II
CARROLLTON ALKALINITIES PARTS PER MILLION
Maximum MirJmum ftvetsge
River 2008
183 78
117
2O09 185 83
121
2010 212
93 143
2011 163
83 125
2012 154 B1
122
Effluent SetMing Reseri/o)rs 2008 171 S3
107
2009 175 72
114
2010 2011 202 165 76 66
135 115
2012 146
53 110
assad
Filters i 2008 202
71 124|
20Q9 200
80 134
2010 225
98 155
2011 195
88 135
2012 168 99
1 13S|
TABLE IIA
CARROLLTON HARDNESS PARTS PER MILLION
Maximum M-dmum lAvitraga
NON-CARBONATE HARDNESS RIVER
2008 70 A
1 38|
2009 91 0
33
201C 64 0
36
2011 105
17 47
2012 10<
19 43
FILTERS 2008
76 16 50
2009 92
0 1 40|
2010 91
0 4^
2011 B3 26 55
2 0 1 : 109
1 55
TOTAL HARDNESS I RIVER
2008 250 114 155
2009 211 110 153
2010 238 116 178
2011 220 115 172
2012 214 115 164
FILTERS 1 2008 250
2009 227
114 130 176 173
2010 278 140 195
2011 238 132 191
2012 242 143 190
TABLE III
CARROLLTON BACTERIAL CHARACTERISTICS TOTAL COLIFORM ANALYSIS
2012
Maximum {Cc'onies /100 nnl) Minimum (Colonies /100 ml) Average (tulonies / 100 ml) Number of Samples Number o( Samples Negative [Number of Samptes Posillve
River
3,400 67
740 355
0 355
Plant Tap
1 0 0
365 364
1
Distribution System
4 0 0
2.367 2.365
2-' Neither of the$e 2 lolal i»llform positlva samples was €. coH positive,
ant) neiltrar rasulted in a violaUor or the Total Coliform Rule.
IV-11

SEWERAGE AND WATER BOARD OF NEW ORLEANS
TABLE IV-A
PRINCIPLE RESULTS OF OPERATION OF THE 63 CONVENTIONAL UNIT AT THE CARROLLTON WATER PURIFICATION PLANT FOR THE YEAR ENDING: December 31,2012
1
Month
January
Febniaiy
Merer,
Apf3
May
June
Juty
August
September
October
November
December
Total
General
2
Max. Uin. Ava. Max. VBn. AvB. M ix U n . Avg.
Max. Uin. A»g.
MiDL MOT.
A * * Max. Mm. Avft Mm. MIn. ATIB.
Max. Min. Ava. Max. Mil). AVB. Max. Mn . Ava Max.
Mh. AVB. Mm. Mn. Avq.
M t t . Mm. Ava.
3
Total MnRon Gal tansof
WBIer Treated louring Month
2.729.04
2.470.71
2,742.17
2.931.00
3.061 J 3
2.529.38
2.521.58
2.530.75
2.565.04
2.741.88
2.599.17
2.704.29
32.126.33 3,t)61.33 2.470.71 2.672.48
4
Amount ot Vteter
Treated MaSon
Gsnons Pet 24 Hours
91.08 80.83 88.03 91.25 85.46 88.24 90,92 83.75 88.46
104.71 81.50 97.70
106.83 8 4 4 8 98.75 BS.B3 a 2 3 S 8 4 J 1 84.54 77.63 81.34 85.83 71.13 81.64 9 5 4 6 80.42 65.50 84.00 82.38 88.45 91.67 80.17 B6.64 92.75 82.63 87.24
108.B3 71.13 88.02
5
Total Poura lsof Potymer used at Intake
0
0
0
0
0
0
0
0
0
0
0
0
0 0 0 0
6
P D l y m « a t bitake Parts PorMt inon
0.00 0.00 0.00
0.00 0.00 0,00 0.00 oxn 0.00 0.00 0.00 0 X 0 0 X 0 O J O O
o.(n OilO OJW 0.00 O i M
0.00 0.00 0.00 0.00
0.00 aoo 0 0 0 0.0O 0.00
aoo 0.00 0.00
aoo aoo aoo 0.00
0,00 0.00 0.00
7
Total Pounds of
P o ^ m e r used In Plant
BT.285
97.448
107/436
KI .174
^ . 3 7 3
88.556
BSJBA3
85.878
90.316
102.403
94.259
93.720
1.132.492 107.438
6 5 ^ 7 8 94.110
8
Polymari r t Plant Parts Per Mill ion
4.66 3.62 4.28 5.23 3.83 4.73
S.13 4.27 4.70 4.72 3.32 3.72
4 8 5 2.86 3 X 8 4.58 3.85 4.20 4.41 3.92 4.15 4.29 3.77 4 X 6 4 X 7 3 X 9 4.22 4.9C 4.17 4.48 4 X 8 4 X 0 4.3S 4 .70 3.63 4.16
5.23 2.86 4.23
9
Totel Pounds of Pure Iran <Fa)uEetf
Ounns Mont l l
t (S ,164
100.498
120.664
101X81
111.021
100.116
9 7 J 2 1
95.709
101.512
115,130
105.997
105.288
1.273,097 120,664
93,709 105X12
to
Pure. Iron (Fe> Parts PerMIKon
S.22 4.21 4 X 0 5 X 9 4 ^ 6 X 1
sx t 4.79 5 J 8 sxt X7S 4.20 S.4S 3.21 4.38
5 X 8 4 X 2 4.75 4 X 6 4.40 4 X 3 4.82 4.13 4.53 5.49 4.11 4.74 5.49 4 8 9 S.04
5.60 4.49 4.89 5.27 4.09 4.67
SX9 3.21 4.75
n
N T U Turbidity Of
River Water
79 25 57
74 100
17 58 83 31 49
159 30 71
44 9
17 18
7 10 18 6
10 20
5 I t 33
5 12 22
7 12 80
6 23
159 3
34
12
P P M Alkalinity Of River Water
119 88
103 114
90 86
126 81
104
120 88
111 138 112 126
ISO 120 138 154 132 145 145 128 139
138 114 130 131 103 117 140 107 121 143 as
122
154 81
122
13
N T U TtirfaMiiyirf
U n i t E f f l u m
7.3 1 4 3.3 5.2 I X 3.0
3,5 1.1 t x 3,4 1.0 I X 3.7 I X 2.1 3.5 1.1 2 X 3 X I X I X 3.5 OX 1.6 2 X as 1.4 2.0 0.5 1.3 2 X 1.0 I X 3.5 0.7 1.7
7.3 as 2 X

SEWERAGE AND WATER BOARD OF NEW ORLEANS
TABLE IV-B
PRINCIPLE RESULTS OF OPERATION OF THE ©4 CONVENTIONAL UNIT AT THE CARROLLTON WATER PURIFICATION PLANT FOR THE YEAR ENDING: December 31. 2012
1
Month
January
Feb fua iy
March
Apr i l
pby
June
July
Augus t
Sepleail>er
October
November
December
Tota l
Genera l
1 ^
Max. M in . A v g . Max. M in . AvB. Max . M in . A v n . Max. M in . A v n . Max.
M in .
A v a . Max. Mfn.
AVB. Max. Mhi . Ava .
Max.
Ava . Max.
A v g . Ktex. fff in. A v o . Max . I\fin. AV«^. M ^ .
Min.
Awa.
Max. M in . Avq. 1
1 ^ Total twtiffion GaSonsof
Water Treated IXiring MonA
0.00
0X0
0.00
0.00
0X0
0.00
0X0
0.00
0.00
0X0
0X0
0.00
0X0 0.00 0X0 oxol
1 ^ Amount o f
Water
Treated tjstsion
Gallons Per 2 4 Hours
0.00 0.00 0.00 0.00 O.O0 O.OO 0.00 0.00 0.00 0,00 0.00 0.00 0.00 0.00 0.00 0X0 0X0 0X0 0.00 0X0 0X0 0.00 0.00 0X0 0.00 0X0 0.00 0X0 0.00 0X0 0.00 0X0 aoo 0X0 aoo 0X0
0.00 0.00 o.oo|
5
Total Pounds of Polymer leedat bi&dce
0
0
0
0
0
0
0
0
0
0
0
0
r 0 0 0
1 ^
PCdymcrst Intake Parts PerMl i l kx i
0.00 ! aoo
0.(H) 0.(»
1 0.0O \ 0.00
0.(» 0.00 0.(8} 0.00 0.00 0.(K> 0X0 0 J » 0.00 0X0 am 0.00 0.00 0X0 0X0 0X0 0X0 0.00 0X0 0X0 0.00 0X0 0.00 0.00 0X0 0.00 0X0 0X0 0X0 0X0
0X0 aoo 0X0
7
Total Pounds of Polymer uscdin Plant
0
0
0
0
0
0
0
0
0
0
0
0
1) 0 0 0
8
FHilymerIn Plar« Parts PcrMiTmn
O.0O 0.00 0.00 0.00 0.00 0.00 0.00 0.00 0.00 a.ao 0.00 0.00 0X0 0X0 0.00 0X0 0X0 oxo 0.00 0X0 0X0 0.00 0X0 0.00 0X0 0.00 aoo 0X0 0.00 0X0 0.00 0.00 0X0 0.00 0.00
0.00 0.00 0.00
9
Total Pounds Of Pure Iran (Felused
During Montll
0
0
0
0
0
0
0
0
0
0
0
0
0 0 0 0
10
Pure Iron 9^e) Parts PerMUIton
0.00 0.00 0.00 0.00 aoo 0X0 0X0 0.00 0.00 0.00 0X0 0X0 0.00 0.00 0.00 0.00 0.00 0.00 0.00 0.00 aoo aoo aw) 0.00 0.00 0.00 0.00 o.(n O.0O o.tn O.I» O.0O 0X0 O.IH) 0.00 O.I»
o j n 0.00 0.(KI
11
NTU TurbMityof Rtvar Water
79 25 57
120 44 74
100 17 58 83 31 49
150 30 71 44
9 17 18 7
10 18 6
10 20
5 11 33
5 12 22 7
12 80 6
23
159 5
34
12
PPM AlKtfinilyof River Water
119 86
103 114 90 96
126 81
104 129 88
11 138 112 126 150 120 138 154 132 145 145 128 130 138 114 130 131 103 117 140 107 12 143 98
122
154 8
122
13 1
NTU Turtiidilyof UnH Effluent

SEWERAGE AND WATER BOARD OF NEW ORLEANS
TABLE IV-C
PRINCIPLE RESULTS OF OPERATION OF THE L3 CONVENTIONAL UNIT AT THE CARROLLTON WATER PURIFICATION PLANT FOR THE YEAR ENDING: December 31,2012
1 1
Month
January
iFsbruary
March
April
May
June
July
August
September
October
November
pecember
T c ^ l
General
1 2
Max. Min. Ava. IMax. Min. AVQ. [Max. Min. Avfl. Max. Min. Avn. Max, Min. Avn. Max, Min. Avn-Max. Mm. Avq. Max. Min. Avn. Max. Min. Avq. Max. MIn. Avg. Max. Min. Avg. j Max. j Mtn. Avfl.
Max. Min. Avo. 1
1 ^ Total Million Galtons of
Water Treated During Month
1,561,71
1,269.42
1.355.79
1,482.92
1,4^.28
1,408.63
1.574.21
1,570.50
1.595.88
1,708.29
1,578/48
1.460.13
18,(»2.21 1,708.29 1.269.42 1,50518|
1 ^ Amoiaitof
Water Treated Miltion
Grttons Per 24 Hours
60X7 42.38 50.38 51.54 40.98 47.28 AB.m 40X8 45.13 54.SB 40/46 49.43 58.25 42.29 40.88 53.42 40.17 44.04 58.58 45/42 50.78 53.50 45.92 50.68 57.33 39.60 53.20 58.42 49.54 54.94 57.46 46.04 52.82 55.67 41.29 47.10'
60.67 39.50 49.49
5
Total f>oundsof
1 usedal Intake
[ 0
0
0
0
0
0
0
0
0
0
0
0
0 0 0 0
6
Polymer at Intake Paris Per Million
aoo 0.00 0.00 o .m 0.(» 0.00 0.(U aoo 0.(» a o o 0.00 o j m 0.00 0.00
0.00 o.tn 0.00 0.00 0 x 0 0 x 0 0 x 0 0X0 0X0 0 x 0 0.00 0 x 0 0 x 0 0.00 0 x 0 0 x 0 0 x 0 0 x 0 0 x 0 0 x 0 0.00
0 x 0 0 x 0 0 x 0
7
Total Pounds oi Po^mer used in Plant
CI .362
51.971
57X21
52,760
50,214
47,990
53,481
53,486
58.480
60,744
58.038
54X26
658X92 01,302 47.990 54,891
8
Polymer In Ptmrt Parts Per Million
5.43 3X3 4.72 5.87 4.33 4.67 5.78 4.49 5X0 5X9 3.67 4.30 5.26 3X1 4X6 4X1 4.32 4.69 4X6 3.52 4.08 S.79 3X0 4.09 S.31 3.81 4.40 4X8 3.SB 4.13 4.78 3.77 4.27 5.14 3.88 4.49
S.87 3.31 4X7
9
Total Pounds Of Pure Iron (Fe) used
Dtafng Month
69.387
58,731
65.539
59,808
57,414
55.943
60.980
61,341
85.B2B
88X96
63.356
61X41
748.142 89.387 55.943 62X45
10
PUT© Irofi (Fe) Parts PwMIIHon
6.17 4.41 6.34 6.25 4.96 5.25 6X8 5.08 S-71 6.27 4,07 4X7 6X0 3.79 4.64 6.17 4.93 S.46 5.29 4.02 4.85 5.30 4.41 4.69 6.09 4.34 4.94 5.18 4.39 4.71 5.39 4.25 4.63 5.«) 4.35 5.05
6.68 3.79 4X7
11
KTU Turbidity of fUver Water
79 25 57
120 44 74
100 17 58 83 31 49
1S9 30 71 44
0 17 18 7
10 18 6
10 20
5 11 33
5 12 22
7 12 80 6
23
159 S
34
12
PPM Alkarmayol River Water
119 86
103 114 90 98
126 81
104 129 88
111 138 112 126 150 120 138 154 132 145 145 128 139 138 114 130 131 103 117 140 107 121 143 98
122
154 81
122
13
MTU Tufbidilyof unit Eftluend
8.7 I X 3.4 5,1 1.7 3,21 3X I X 2.2 3.3 1.4 2.1 3.1 OX 2.1 4.1 1.2 2.2 3.4 1.2 1.9 3.0 1.0 I X 2.6 1.1 1.7 3.1 OX I X 2.9 I X 1.7 3.1 I X 1-7!
6.7 OX 2.1
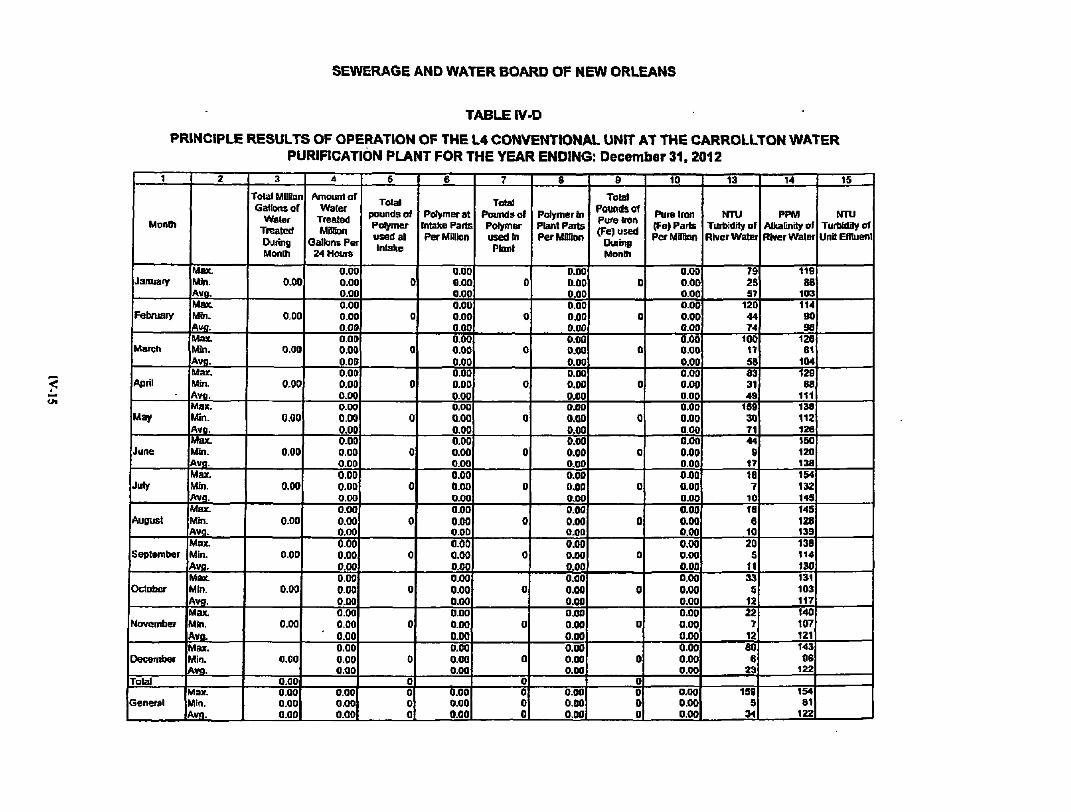
SEWERAGE AND WATER BOARD OF NEW ORLEANS
TABLE IV-D
PRINCIPLE RESULTS OF OPERATION OF THE L4 CONVENTIONAL UNIT AT THE CARROLLTON WATER PURIRCATION PLANT FOR THE YEAR ENDING: December 31. 2012
1 1
MonB i
Jaro iary
Februa ty
M a r c h
Apr i l
May
June
Ju ly
Augus t
1 Sep tember
Oc tober
November
p e c « m b e r
To ta l
1 Genera l j
1 ^
Max. Min. AVfl. Max. Min. Avg. [Max. I«n . Avn. Max. Min. Avg. Max. Min. Avg. Max. Mtn. Avn. Max. Min. Avq. Max. Min. Avg. Max. Min. j Avg. Max. Min. Avg. Max. MIn. Avn-Max. 1 Min. Avq.
Max. Min. Avg. 1
1 ^ Total MnSon Gallons or
Water Treated Ourmg MonD)
0X0
0.00
0.00
aoo
0X0
0X0
0.00
0.00
0.00
0.00
0.00
0.00
0X1 0.00 0.00 oxol
1 ^ 1 Amount o f
Wa te r Treated t A m m
Galkins Per 24 Hours
0.00 0.00 0.00 0.00 0.00 0.00 0.00 0.00 0.00 0.00 0.00 0.00 0.00 0.00 0X0 0.00 0.00 0.00 0X0 O.OO 0.00
0X0 0.00 aoo 0.00 0X0 0.00 O.OOj 0.00 0.00 0.00 0.00
' 0.00 0X0 0.00 0.00
0.00 0.00 aool
1 5
Tn ta l
pounds o f P o ^ m c r u s e d a l
In take
0
0
0
0
0
0
0
0
0
0
0
0
i 0 0
o|
1 ^ Polymer at Intake Parts Pa-Million
aoo 0.00 0.00 0.00 0X0 0.00 0.00 0.00 0X0 0.00 0X0 0.00 0,00 0X0 0.00 0.00 0.00 0X0 0.00 0.00 0X0 0X0 0.00 0.00 0X0 0.00 0.00 0.00 0.00 0.00 0.00 0.00 0.001 0X0 0X0 0X0
0.00 0X0 oxol
1 7
Tota l Pounds o l
l i s e d t n Plant
0
0
0
0
0
0
0
0
0
0
0
0
0 0 0
ol
1 ^ Polymer in Plan! Parts Per«4iinon
0X0 0X0 0X0 aoo 0X0 0X0 oxo
1 0.00 0X0 0.00 0.00 0X0 0X0 0.00 0.00 0.00 0X0 0.00 0.00 0X0 0.00 0.00 0.00 0X0 0.00 0X0 0.00 0.00 0.00 0.00 0.00 0.00 0.00 0.00 0.00 aoo
0.00 0.00 o.cwl
1 ° To ta l
Pounds o f Pure Iron ( F e ) u 5 e d
During Month
1 ° 0
0
0
0
0
0
0
0
0
0
0
0 0 0
ol
10
Pure Iron p:e) Parts Per Million
0.00 0.00 0.00 0.00 0.00 0.00 0.00 0.00 0X0 0X0 0.00 0.00 0.00 0.00 0.00 0.00 0.00 0.00 oxo 0X0 0.00 0.00 0.00 aoo 0X0 0.00 O.OO
O.OO
0.00
0.00 0.00 0 .00 0.00
0.00 0.00 0.00
0.00 0.00 0,00
13
1 t t n j Turt>idityof River Water
79 25 57
120 44 74
100 17 58 83 31 49
159 30 71 44
8 17 18 7
10 18 8
10 20
S 11 33
S 12 22
7 12 80 6
23
159 5
34
14
PPM Alkalinity of IQver Water
119 86
1 103 114
I 90 98
128 81
104 129 88
111 138 112 126 ISO 120 138 154 132 145 145 128 139 138 114 130 131 103 117 140 107 121 143 86
122
154 81
122
1 15
1 NTU T u r b i d a y o f
Uni t Efl luentj

SEVVERAGE AND WATER BOARD OF NEW ORLEANS
TABLE IV-E
MONTHLY 8UMIUIARY OF COMBINED OPERATION OF CONVENTIO?4AL UNITS AT THE CARROLLTON WATER PURIFICATION PLANT FOR THE YEAR ENDING: December 31. »)12
1 1
j Month
January
iFebniary
Mnrcn
A p *
May
IJUW
JUy
lAt^iOt
Septemliei
OctMier
bccember
kctai Cstaral
1 2
M n .
Max. Min. Avq. M n . Mki.
Max. Mki A v , Max. t£n. Avp Uax.
A v , M ^ Uirt A»9 Mait Mm, A»B. Max. Min. Avn-
Wfl.
M M
Mm. AVJ.
Mn.
M n Mbi. Avp . |
1 ^ Totd MOlian
GaSsnsof V*a«f
TrBBtMl During Uonb
4.29a76
3,740.14
, 4.097.98
4.4I1JB
4.Bua,3i
3.338.02
4.09S.80
4.iio.oa
4.1l».93
4.4S023
4.177.65
4,1844
S024a7< i 4 ,03.32 3.740.14 4,188.731
1 4
Amowtl of Water Treated Miaan
G iAnu Hare* Hours
; 1*5,48 1 132,2S 1 13B41 1 VJV.17
128^83 133tS8 13S79 12113 13Z19 156 9S 129.88 147.05 1B129 133.04 14849 13a42 izae? 131.27 138,79 123 67 192.12 I4 t .sn 117.8« laasa 142.79 131.7S 188.70 I4S.13 W7.es 143.66 144.33 133.42 13S.2S 140.S0 12830 134.34
163 J!9 117.96 1ST.05
1 S
Total pounds oS Po^mQ-
1 usedal Inlake
0
0
0
0
0
• 0
0
0
0
0
0
0
) 0 0
ol
6
Total
Potyniei used in Plant
158XH7
149,419
155.057
1*2,854
148.587
138,548
140.124
139.364
148.796
1BJ.147
150,286
146.248
1.791,184 165fl57 138,546 149.285
7
Total Patnfsef Fluoiiile (10O*)
used 1 Outing
•MonUi
18.108
14,648
18,031
14,351
11,l»2
7. WO
6.23
5.630
6,874
6,606
Si415
4.634
116.71!! 18.103 4.63*
iszl
6
Flioride Parts Per
MOon
0.S5I 0.38 0.S0 049 0.42 046 0.48 flL39 045 0.45 081 0.42 0.43 025 032 0.25 0.18 022 0.20 0.16 0.18 aie a i l 0.16 az7 a i l a i 8 aie ai3 ai7 ai9 a i 015 0.14 0.12 a 13
0.S9 0.11 o.za
9
Telf l Pounds or Ptirelron (He) land
Oanrg norm
178.5S1
I6SJ!27
188J!03
161.487
168.436
1SCA58
158.281
157.050
167,140
183.826
169.354
166,627
2,021,231 188.2(0 156.099 168.437
10
ro td PoundsM l l m s U i e d
Duing
818,951
6S5,9S4
813.914
766,028
83S;i81
8eZ;e64
979,820
892,803
871.687
920.ra3
804.172
607.17
10.019.15 i 978.620 6SS.9S4 834.030
11
.Lene Pats
Ml l ia i
27.68 18,05 22.86 24.69 I B M ZI.OO 26.05 21.63 73„a2 24.68 16.81 20.56 M.7S i a i 4 41.74 34.00 M-34 26,24 3226 24.68 28.76 29.15 13.60 23.54 97.1s 22.58 25.12 27.20 2128 24.8 28.82 20.08 23.07 25.74 18.48 23.24
94.00 13.34 23.91
12
Tuial Poundaor Q i M n a
Used tXKhg Montti
1G1.S16
142,382
157,908
163.224
180,251
18a,*39
209.025
214«(S
214215
213,880
18S,B0a
1«1,««7
2.21422 I 214:845 142.362 184,527
13
Chtnine Pats Per
MldDn
4.72 4.28 4.51 4.03 436 457 5 « 4.10 4.62 4.66 4.17 4.44 5.55 429 4.72 6.11 S2t 5.68 BJO 5.91 6.12 &94 4.41 A2B 6.&1
6,17 622 6X0 8.77 SJST
4.e 5.41 5,84 4.79 524
664 4,10 5.ai
14
Total Pounds of Anhydrous Anvmenia
Used Ooring Month
33.947
28,506
S1.7«2
34.185
37,235
38.S04
41.314
42.804
42,S»1
42276
34.864
32,022
441.7SI 42,920
38313
IS
AllHIKU44 Parts Per
USSm
1.02 0.88 0.96
0,87
0.97 028 0.03
•1.00 o*r 0.93 1.14
0.97 129 1.09 1.17 134 1.19 123 122 1.19 124 1.30 1.19 124 1,26 0.90 1,14 1.09 096 iXX) 1J00 o a i a95
124 087 IJBG
1 ^
Total Pounds
of
Pofrptw* phcte Uted
IJuirQ Month
19,101
i6.Twe
18,648
17.718
19,541
17,716
2I0V949
20,122
18,891
19.888
20,802
23^03
233.646 23,503 16,768 19.470
17
phata Parts Per
HWan
0.56 0.62 as3 0.S7 0.52 0JB4
0.57 0.31 0.56
oiy D.44 Oi48
0.44 0.51 0.S9 0.49 054 073 a 8 1 061 068 OSO 082 0A7 048 aS4 059 0.51 0 * 1 064 0LS7
oeo 092 058 0.68
0:92 0.44 056
18
AOLBlMy ot
FBtcrcd Water Part* HW
1*0 105
99 111 140 100 121 146 100 123 149 125 139 160 I2C 148 168 136 154 160 134 ISO 152 121 140 145 103 129 144 125 136 157 l i s 139
168 89
135
18 1
Estimated Kigl i lJa Pumpage
ToialM.G.
4;I44.S2
S ^ l i i O
4.317.20
4.088.16
4,11D«0
3,939.86
4.1S2.78
425391
4,33120
4.59^44
4289.48
4273.40
50,7202 4.6S2.44 3,831.60 4 ^ . 1 9
M.G,0
145.04 135 20 I 4 0 1 14248 130.92 138.84 145.64 13O80 139126 139.84 12&ie 13627 151.12 121.40 132,58 i s a j B 124,»^ 13122^ 14023 13824 I33.9e 141.72 123.S6 137.22 15O04 13728 144 37 154.48 UIJB 148.14 152.24 139,98 146,32 147,88 13226 141.14
1S4.4B 121.40 138.98

SEVVERAGE AND WATER BOARD OF NEW ORLEANS
TABLE V
PRINCIPLE RESULTS OP OPERATION OF THE ALGIERS WATER PURIRCATION PLANT FOR THE YEAR ENDING: December 31.2012
1 '
Month
Uanuary
Febnaty
Marcii
L i
May
June
M f
August
SeplemD«r
oetoecf
^ovfisbGf j
DecMiticr
Total
Q«ner8t
Mnx. t£n.
[Max. Min.
{Max. Mfn.
Max. luin.
Max. Min, A « , . Max. Min. A«g, Max. Min. A«, . Max. Min. Avg. Max. Min. Av, , Max. j Min. Avg. Max. 1 Min, Avg. M ^ Min. Avq,
Max. MIn.
ASLJ
1 ^ 1 UNTUR
Totet MSen
Gekntof
TreatoJ Owing Monin
359.87
323.58
337.15
3 3 3 ^
354.16
349.66
369A1
364.76
3A423
368.24
3S4.42
367.92
4.22726 38931 323L96 35222!
T 4
Amount cl Walar
Treated H«on
Gslana Per21 Moors
14.00 looa 11.61
1 13.08 lOJM
1 11.16 1 12J»
lOJM 1028
( 12.67 i IOJOO
1 11.13 t4JXI I f l tW 11J42
14.00 10JW 11.67 1400 1O00 t 1 i l 2 1383 IOJOO 11.44 U.OO tOSX) 11*1 15.50 1000 11.88 14.00 tooo 11.81 t2J00 t 0 4 2 11.87
1.S.S0 tooo 11.58!
1 ^ Toni
Pounds of Potyctso-
ttoiyte Und
Oirtig Monoi
12,334
1 9,600
10,027
I0,£BS
10,805
9.740
7,055
6.853
8,388
9,288
0.464
10.113
113.939 12,33* 0.853 9.4951
[' *""
Polfetec-troijite
Pens Per MOnon
4.55 3,54 4.11 327 3.54 3.56 3.60 3.56 3.57 4.18 3.23 3.69 3.B3
3.6G 3.60 227 3.35 224 213 229 315 226 232 4.29 Z2B 224 ao6 296
2 3 0 201 3.20] 230 j 327 3,30
4.SS 213 3731
1 7 —
Tew Pounds or Flaaride (lOOllf Used
tlutng Month
1.BS2
1.647
1,420
1,148
1.409
1.093
718
748
706
71S
682
496
12.432 1.652
496 1.036
1 '
Fluorida Pans Par
MBon
0.89 0,32 OSS 072 0,50 0.61 0.78 027 021 0.60 02S U41 (160 a 12 0.48 0X0 OIS D2S 023 0.11 023 0.30 017 0.26 0.30 016 024 0 2 0 012 024 O30 015 024 018 016 0.16
0.76 0.11 0.351
9 ••
TotK PoundKcf Purelron (FOuKxt
DuUmj Monlh
17.707
14,847
15,818
16.709
17,!!15
17,088
20073
18,697
17.780
1G.619
1G.C07
17^12
207.782 20,OT3 14,8*7 172151
p i B ^
Puralron (Fs) Parts PerUBon
I058 4.63 5.92 644 4.79 5.52. 791 4.12 5.48 T.04 4.13 6.04 923 4.95 5J86 8.SJ 4.40 8.19 870 325 8.S0 023 4.70 6.38 7.90 3.77 6.04 7.61 2.S1 S.S7 7.69 3.17 5.67 6.58 2 3 0 8.62
10.!>S 251 5.891
Total Pounds e(
Uottthcd DuAig Man3>
191202
138L410
162214
179252
Z0S.12S
138.171
178,472
242,968
214,947
16t,ffi4
159,883
1S52BS
2.127,164 2 4 2 2 ^ 138,171 177.2651
r-Tz
LlaisPa& PerMRoo
60.10 4224 83.87
- 71.30 3037 SI .69 80.06 4O00 S7.99 83.76 6428 64.34
102.73 35.04 70.44 S&OS 3 7 J » 1
47.44 sooe 34.14 S721
117.15 ta.17 8129 8074 5642 72.71 7O20 3424 52.76 67.07 4 2 ^ 6228 64.67 29.88 soes
117.15 29.96 6023
^ J 3 —
-rtnai Pouidaol
AHIINHAJ U n d
Doing Uonei
2.848
2293
2.665
3.190
3,408
3.675
3,886
3.769
3,662
3,947
3,388
2,891
4001 r 3247 2.533 3242
1—TT"
Anhjdnus Ammonia PaitsPw
MDIkxl
098 0.91 095 1.01 0.92 09S 1.01 0 9 2 06S 124 098 1.14 1.40 124 1.15 1.44 1.1* 126 1J45
1.17 126 1.35 1.10 127 i j t n 1.14 121 1.42 120 129 127 829 1.14 128 026 0 9 4
1.51 0 8 8 1.14
Tolzl PtouMS OHoiina
tJnd •wing Nonh
19.297
21.080
23.046
14.133
tsf in
14.774
1.1223
1S2G4
15,446
15248
14,942
15,006
197,7S r 23,046 13,577
i=^r=
Oitgrtne PMUPer
MiSon
7.78 4.S> 6.4$ 6.16 7.60 7.81 aso 7.82 8 2 0 OGO 427 5.08 S.S8 4.17 4.57 5.79 4.S3 5.06 5.79 4.69 504 as9 4 4 0 5,10 8.02 4 5 6 523 8.01 4 2 2 5,16 724 4 2 0 S.05 5 2 1 447 4 2 9
8 2 0 4.17 S.61
17
Tow Pounds
rdfOhoe. piule tised
OuHno UMth
2,000
1,933
2,007
2,000
2280
2.200
2.S33
2.134
2233
2.400
2,133
2200
26.433
1.933 2,203
18
Peln«<os-ptate
Parts Per ttiaum
0.79 023 027 120 0 2 0 0.T2 0 2 0 0 2 6 074 0 2 0 063 0 7 2 1 2 0 027 0.7S 120 021 0.76 120 027 0.83 1 2 0 O.W 0.87 1.20 0.49 0.80 120 0.S2 O.TS 1.20 027 073 1.15 0.66 0.85
120 0.49 0.75
19
NTU Turt*ft/Ol
osmer Eltusnl
2 7 0.4 12 4.6 0 4 M 4 2 0 4 17 82 0 6 22 5 0 0 2 1 3
102 0 6 i l
102 0 3 37
11.1 1 2 4 5
114 1 2 4 7 9 2 0 2 2 2
112 1.0 3 2
105 1.0 3 2
11.4 0 4 2.7
2D
F>P« CkKifWeil ADeowyoi
Fiter Etltuent
71 53 6S 89 50 74 82 €6 74 86 65 76
111 60 80
126 100 116 136 75
115 98 72 83 98 76 87
111 78 94
132 84
102 121
80 99
138 50 63
21 1
HighLMPwipaas
Tolat M,GD.
1t.75| 334.591 1077
10.791
297.10
307.86
30636
338.S8
353.92
34925
341.72
342.59
346.72
3S3.75
341.68
3.996.62 353.92 297.10 333.05
10771 9.70l
102*! 10.97 8.86^ 9.93|
1127 9.43|
1021 12.15
827| 1023) 12.S» ia.9« 11.8ffi 12,41 102N 1127!
ii.ea io i«
i ; | i i i ^ 122t | 10.4d
ii.isl 11.651 10481
nod 1
13.33 B.B6
10.9S!
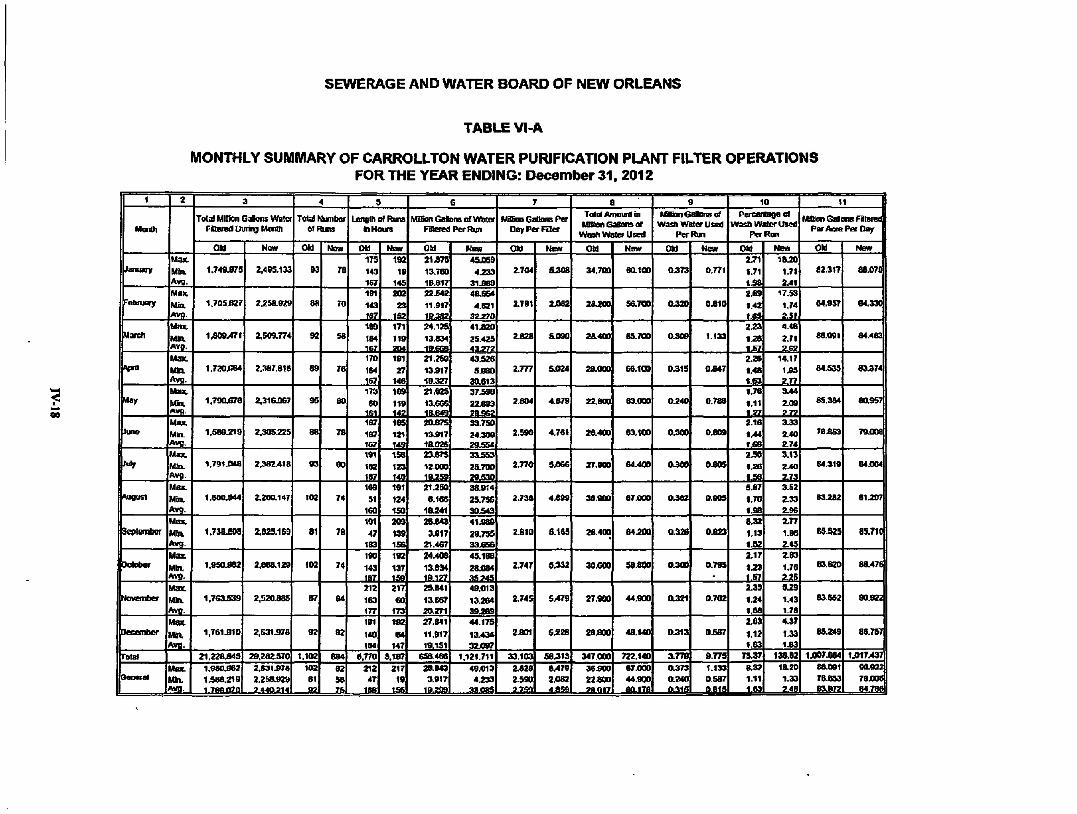
SEWEE^GE AND WATER BOARD OF NEW ORLEANS
TABLE Vl-A
MONTHLY SUMMARY OF CARROLLTON WATER PURIFICATION PLANT FILTER OPERATIONS FOR THE YEAR ENDING: December 31. 2012
1
Month
Llanuaiv
Feltruary
Mafch
Lrt
May
Dune
kv
k igus i
Scptsmtior
October
November
becemBer
n'otal
|o«a«isl
1 ^
Max. Min. AVQ.
Max Mia Avp,
Mnx.
MM. AVJ, Max.
Mtn
Max.
MkL *vg .
I4IU.
Mia A V , .
Max. Min. Avp.
Max. Mta. Avg.
Max.
MIn. A v ,
Max.
Mia
Max.
Mia Avg.
Max
Mm. AVI}.
Max. Mh . Avg.
1 ^ Total Mi lon Galons Water
Filtered tXirtng Month
a t
1,749275
1,705.827
1209v47t
1.7W.IK4
1.790278
1286219
1.791iM8
1,660244
1,738203
1,9SO»2
1,763239
1,761210
21,228246
1,980262 1,560219
....l,7e9JI7D
New
2.495.133
2,250929
2.509.774
2.3H7.816
2,316267
7,305225
2.382418
2,260147
2,625.169
2,668.129
2,520285
2,631278
29,282.570
2,691278 2.2b8L92»
... 2.440214
4
Total Number otRuns
Old
93
88
92
69
95
88
60
102
81
102
87
92
1.102
102 81 82
N B U
78
70
58
78
80
78
80
74
78
74
64
82
68*
62 56
5
Length of Runs UHoun
Old 175 143 167 181 143 167 168 184 167 170
164 167 i r a
80 161 187 167 1(W 191 I K 167 169 51
168 191 47
183 teo 143 187 212 163 177 191
140
164 9.770
212 47
New
192
19 145 202 23
152 171 119 204 191 27
146 169 119 142 185
121 149 158 t23 140 191 124 ISO 203 139 158 192 137 159 217 60
173 192
84 147
5.187
217 19
LJS I
6
IWSonGalDnatfWWer FiteredPerRun
Old
41275 13.780 19.817 22.542
11.917 10382 24.125 13.834 19.668 21 . » 0 13.917 19.327 Z1.S25 13.666 126*9 20.875 12917 1O02S 23.675 12000 18.259 21.250
0166 10241 28.643
3.917 21.467
24.408 13.634 19127 22.841 13.657 20271 27.841
11.917
19.151 658.466
20643 3217
19.299
Naa 4S2S9 4233
31289 48254
4.821 32270 41220
25.425
43.272 432Z6
9280 30613 37296
22293
33.750 24209 2925* 33253 2S.7tlC 29230 38214 25.756 30243 41289 29.755 332S6 49.188 28284 as MS 49.013 13264 39269 44.175
13.434
32297 1.121.711
49213 4233
3308S
7
Mi l ta iGdansPer Day Par FiBer
O d
2704
2.791
2 .K8
2.777
2.604
2.590
2.770
2.736
2210
2.747
2.745
2201
33.103
2226 2.580
New
S208
2282
5290
S224
4.879
4.761
3 M 6
4299
S.16S
0232
S/479
S228
56213
8/479 2.082 4899
8 Total Amouidbi MOtan (Saltans or
wash Water Used
Otd
34.709
26.200
28.400
20000
22.600
26.400
27.000
38900
28.400
30200
27,900
28,808
347000
36200 22,800 28,017
New
60.100
96.700
65.700
66.1t9
63.000
63.100
64.400
67.000
64200
58.800
44.900
48,140
722.140
67200 44.900 60.178
9
MBkinCslCTisof Wash Water Uted
Per Run
Old
0273
0220
0209
0215
0240
0.300
0200
0.362
0.328
0200
0321
0313
3.779
0373 O240
ftJlfi
New
0.771
0210
1.133
0247
0.788
0.809
0205
0.909
0.823
079S
0702
OS87
9.775
1.133 OSS7 0,815
10
Percentage ol wash Water used
PcrRo i
Old 2.71 1.71 128 229 1.42 1.65 223 128 127 2.26 1.48 1.63 1.76
1.11 127 2.16 1/44 126 220 126 1.56 5.87 1.70 1.98 8.31 1.13 I.S2 2.17 123 l,S7 ^3S
1.24 1.68 2.63 1.12 1.63
73.37
8.32 1.11
_ L f f l
New 1820
1.71 2.41
1723 1.74 221 4.46
2.71 ZB2
14.17 1.95 2 . n 344
2.09
323 2.40 2 7 * 3.13
240 ^ 7 3 252
2.33 296
m 1.96 2.45 Z83 1.76 225 &29 1.43 1.78 4.37 1.33 123
138.62 1220 1.33 248
11
MUUaiGanansFlterer Per Acre Per Day
OU
82217
84.9)7
86.091
8423S
85.364
78253
84.319
83282
85.525
83.620
83.552
85249
1J007.664 88.091 70853 K>»72
New II
88.078
84.330
84.463
83274
80957
79.008
84264
81297
85.710
88.476
90222
88.757
1JM7.437 9292] 79J008

SEWERAGE AND WATER BOARD OF NEW ORLEANS
TABLE V1-B
MONTHLY SUMMARY OF ALGIERS FILTER OPERATIONS FOR THE YEAR ENDING: December 31 , 2012
< I
^0
1 ' •••
Mim«\
bsnuaiy
February
Maridi
kpr i i
May
Uiine
MuDr
Uugust
Scptcmbor
bciober
November
pecember
rolal
General
[ — 2 -
Max Min.
Max. Mm. kvg. IMax Min. Ava. IMax. Min. jAwfl. Max, Min. AwB. Max. Min. Avn. Max. Min. Avg. Max. Min. Avq. Max. Min. Avg. Max Mbt. Avg. Max Mbi. Avg. Max
Avq.
Max USn. Avg. 1
1 3 4 5 6 7 S 9 10 1
1 Total Miffian Gallans Water FBtarcd Difftng Montti of Runs
357.07
321.73
334.96
331.78
352.90
347.01
366.95
351.87
352.30
358.78
364.14
3842.30
29.11
Total Number or Runs
64
65
51
52
57
48
54
54
48
52
54
579
4
L e n ^ o f R u n s i n Hours
171 164 167 170 SS
154 171 165 167 171 48
I 164 193 144 167 191 141 167 171 164 167 192 I M 170 216 143 170 193 164 169 193 141 165
13 4
13
MttUon QaDons of Water FdterBil Per
Run
7,126.000.000 5.939,000.000 6.722.833.000 7.084.000.000
1 2,292.000.000 5.98S.745.0(K) 7.000,000.000 4J209.0(H).00O 6.391 £88.000 7.125,000.000 2,.958.000.000 6^44.980.000 8,041.000.000 4^47,000.000 6.594,738.000 7,958,000.000 5,875,000.000 &,722.8K.O0O 7.793,000.000 5.562.000.000 6,909.370.000 8,000,000.000 S.396.000.000 7J89.611.000 9.000.000.000 5.101.500.000 6.9S8.917.000 8.229.00a000 5.583,00aA00 6,918.846.000 8.229.000LOOO S.«M,000.000 6.743,370.000
212.335.489.000 750000.000 1910IH).000 635673JS6
Miinon GaOona Per Oaf Per Filer
966,156.00
932.999.00
918,566.00
913.900.00
947.746.00
968.165.00
992.9t>3.00
1.043,239.00
982.435.00
982.558.00
' 080,854.00
80.511.98
Total Amounl In MDllon Gallons of Wash Water Used
•7.01
6.68
6.23
6 J 7
7.86
62S
7.29
6.77
7.70
9.92
10.15
0.63
Miiiian GaDons or Wasti Water Used 1 Perf^n
129,722.000
121,364.000
122.157.000
122.403.000
137.807.000
130,729.000
134.«)7.000
125.370.000
160.416.000
190,769.000
187.963.000
t^icenlage of Wash Water Usetl
Per Run
2.18 1.82 1.93 5.30 1.71 2.03 2.90 1.75 1.91 4.13 1.72 1.96 2.97 1.71 2.09 2.23 1.64 1.94 2.43 1.73 1.95 2.32 1,57 1.70 3.14 1.78 2.31 3.42 2 J 2 2.76 3.35 2.28 2.79
77.77 0.44 0.13 0.201
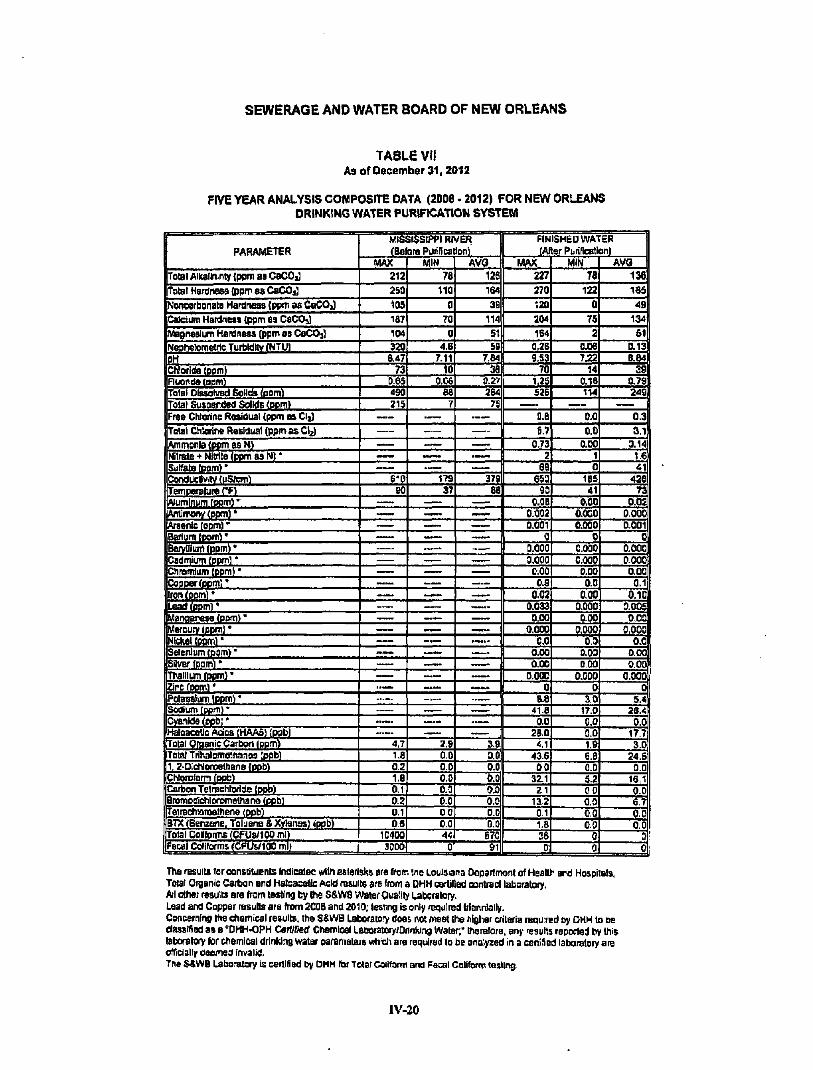
SEWERAGE AND WATER BOARD OF NEW ORLEANS
TABLE VII As of OecennberSI, 2012
FIVE YEAR ANALYSIS COMPOSITE DATA <2006 • 2012) FOR NEW ORLEANS DRINKING WATER PURIRCATION SYSTEM
PARAf«flETER
Total Aikallninty (ppm as CaCO]]
Total HartJrwss Ipprr as CBCOJJ
N'onoarbonate Hardness (ppm as CoCOj)
Caidam (hardness (ppm as CaCOj)
Magnesium Hardness (ppm es CaCOj}
Nephetometric Turbklitv (NTUI OH (^orlde (pom) FlooMte iBom^ Total Dissolved Soltek (pom) Total SusBBfided Solkls (ppm) Free Chlorine Residual (ppm as Ci}]
Total a<;erine Residual (ppm as Cl^)
Ammsnla (ppm as N) Nitrate + Nitrite (ppm as M ' Sulfate (pom)' Conducttvitv luSirni) remoeratJte (°f) Aluminum loom) * jAntirPWW(PPml* Arsenic (opm) * Barium tct tmr Beryllium (pom) * CadiT^u^ (ppm) * Oirtwnium (ppm) • ^oper(ODm; *
L o n t o o m r ||Lead(oomr ^annar>e$e(pom)-|Mefcuiy<BDml' micktti (ppm) • pelenium icom) * SilVBr (pom) * TTaiilum (ppm) * Zirc (oem) • Potassium (ppm) * Sodium (ppm)' Cyaild9(ppb;" Hatoacetic Atids (HAA51 !D0b] iTotai Organic Carbon (ppm) Tola) Trlhabmo^nanas (ppb) 1, Z-Dlettonoethane toob) Chlorotonn (ppfc) Carbon TetrachlDrtde (ppb) BromocflcMorcmethane (ppb) Tatmehitvoemene (ppb) 3TX (Benzene, Taluena S Xylenes) ippb) Total Collfonms(CFUsyiOO ml) Fecal Coli(orms(CFU5j'100 ml)
MISSISSIPPI RIVER (Bebre PJiincatlonl
MAX 212
2S0
105
187
104
320 S.47
73 0.65 490 215
6'0 90
__.
-—.
-.^
-_-
.._ —
4,7 1.8 0.Z 1.8 0.1 0 2 01 06
1C400
3C0O
MIN 78
110
Q
70
0 4,6
7.11
10 0.08
88 7
._.— 178 37
__ .__ .._
»—.
...». -.». __
__
»..«
2.9 0,0 0.0 O.O O.O 0.0 00
o.a 44
0
AVO 126 164
39
114
51 59
7.84
36 0.27
364 75
.__
379 86
_ .
>~.
—__ _ „ . .
- ^ . »... -~_ _—
3.9 0,0 0.0 O.O 0.0 0.0
o.c 0,0 B7C 91
FINISHED WATER
(After Ptiiiieatton)
MM. 227
270
120
204
164
0,26
9.53
70 1 1,25
526
a.B 6.7
0.73
2
ee 653
93 0.0B
0.002
0.001
0 0.O0Q
3.000
COO 0.9
0,03
0.033
0.0O
O.QCO
0.0 0.00
0.00
O.OOC
0 8.8
41.8
0.0 23,0
4,1 43,6
00 321 21
13.2
0,1 1.8 36 0
MIN 78
122
0
75
2 0X6 7^2
14 0.18
114
—-0.0
0.0 0.00
1 0
185 41
0,00 0.000 o.ooo
0 COQO
COOO
0.00
0.0 o.oa
0.000
aoo 0.000
0.3 0.03 BOO
0.000 0
30 17.0 0.0 0.0 1.9 €.8 0.6 5.2 00 OO OO 0.0
0 0
AVG 136
185
49
134
51 D.13 8.84
39 0.7S 249
0.3
3,1 114
1.6 41
426 73
0.02 aooo 0.001
0 0.000 aooo 0.00
0.1 0.10
D.005 0.00
COOO 0.(
ooc 0,00
0.000 0
5.4 2S.4
0.0 17.7 3.0
24.5 0.0
16.1 0.0 6.7 ao 0.0
3' 0|
The results foroanstitiienls Indlcatec tvlth esterislts are IToir, tne Louisiana Department of Health ard Ho&pliats, Total Organic Carton and Hatcacatic Acid results a.'e (rom a DHH certilted lantracl laboratory. All other results are from testing by the S&W8 Water Quality Labcratory. Lead and Copper results are from ZCOB and 2010; testing Is only required tiiennlally. Concerning ttie dtamical results, the S&WB Laboratory does not meet the nigher crileria tBqu:red by DHH to oe classified ss a "DHHOPH CettltJed Chemical LaDoratory/Oimkirtg trvater," therefore, any results reported t>y this latxirBtory for chemical drinking watar parameter wti'cli are required to be analyzed in a eenified laboratory am officially deemed invalid. The S&WB Laboratory is certified by DHH fbr Total Coiiform and Fscal CaUform testing.
lV-20
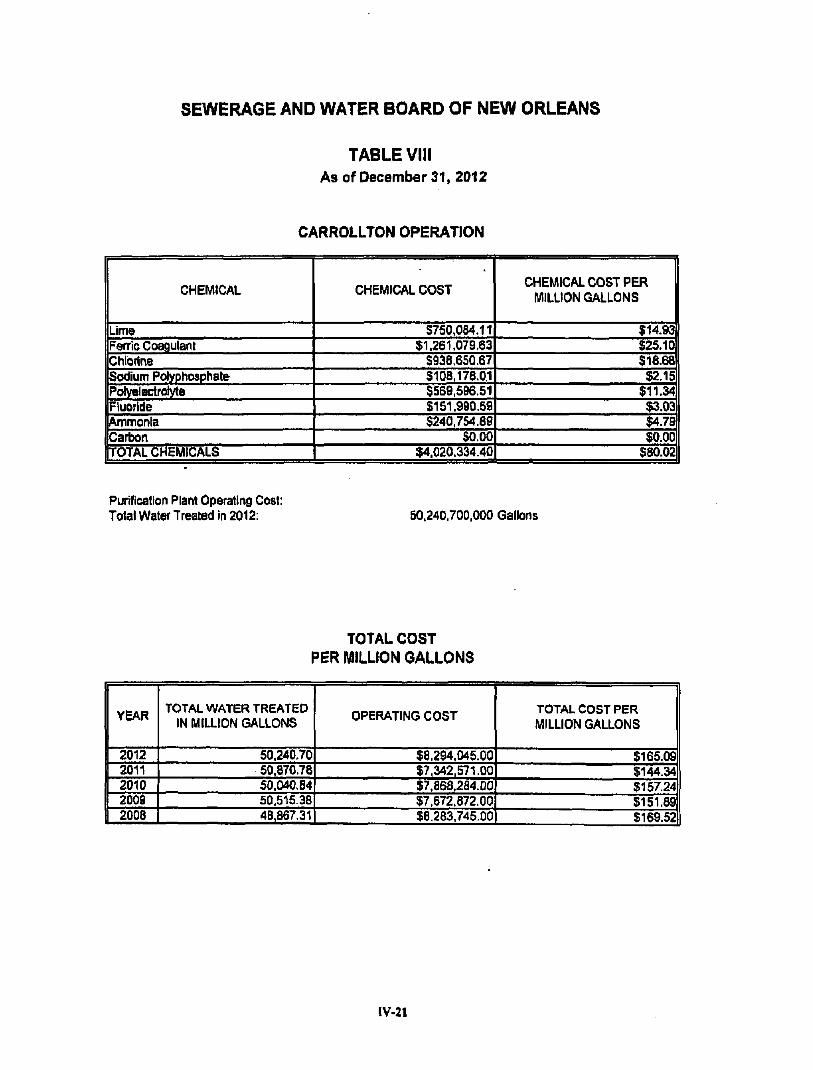
SEWERAGE AND WATER BOARD OF NEW ORLEANS
TABLE VIII As of December 31, 2012
CARROLLTON OPERATION
CHEMICAL
Lime Ferric Ccagulant Chlorine Sodium Pdyphosphale Polyelsctrolyte Fluoride Annmonia Carbon TOTAL CHEMICALS
CHEMICAL COST
5750,084.11 $1,261,079,63
3938.650,67 S108.178.G1 $569,596.51 S1S1,990.59 3240,754.89
SO.OO $4,020,334.40
CHEMICAL COST PER MILLION GALLONS
$14.93 $25.10 $16.6B
$2.15 $11.34
$3.03 $4.79 $0.00
$80.02
Purification Plant Operating Cost: Total Water Treated in 2012: 50,240,700,000 Gallons
TOTAL COST
PER MILLION GALLONS
[
YEAR
2012 2011 2010 2009 2008
TOTAL WATER TREATED IN MILLION GALLONS
50.240,70 50.870.78 50.040,84 50,515,38 48,867.31
OPERATING COST
$8,294,045,00 $7,342,571.00 $7,868,284.00 $7,672,872,00 $8,283,745,00
TOTAL COST PER MILLION GALLONS
$165.09 $144.34 $157.24 $151.89 $169.52
lV-21

SEWERAGE AND WATER BOARD OF NEW ORLEANS
TABLE IX As of December 31,2012
ALGIERS OPERATION
CHEMICAL
Lime Fenic Coagulant Sodiunfi Hypochlorite Sodium Polyphosphate Polyeleclrolyte Fluoride (100%) Ammonia Carbon I T O I A L CHEMICALS
CHEMICAL COST
$187,715.02 $129,863.75
$98,030.50 $28,758,63 $36,232.60 $16,188.92 $24,459.78
$521,249.21
CHEMICAL COST PER MILLION GALLONS
$44.40 $30.72 $23.19
S6.80 58.57 $3.83 $5.79 $0,00
$123.29
Purification Plant Operating Cost: Total Water Treated in 2012: 4,227.860.000 Gallons
TOTAL COST PER MILLION GALLONS
YEAR
2012 2011 2010 2009 2008 2007
TOTAL WATER TREATED IN MILLION GALLONS
4.227.86 4,280.S0 4,105.81 3,935.84 3.788.95 4.427.16
OPERATING COST
$2,061,032.00 $1,834,511.00 $1,995,926,00 $1,894,092.00 $2,029,729.00 $1,700,033.00
TOTAL COST PER MILLION GALLONS
$487,49 $428.56 $486.12 $481.24 $535.70 $384.00
IV-22

SEWERAGE AND WATER BOARD OF NEW ORLEANS
TABLE X As of December 31, 2012
SLUDGE REMOVED FROM THE "G" BASINS PRIMARY TREATMENT UNITS DOOR MONORAKE CONVENTIONAL SYSTEM
2012
Total Million Gallons Water Treated
Total Tons Dry Sludge Deposited in Basins Including suspended and Dissolved Solids Removed and Reacting Chemicals
Total Million Gallons Wet Sludqe Withdrawn from Basins Average Percent solids in Wet Sludge Total Million Gallons Water Used in withdrawlnq Sludge Percent of Total Water Treated Used fn Withdrawing Wet Sludqe
32.126.33||
4,270 187.95
0.54 187.52
0.59
TABLE X-A
SLUDGE REMOVED FROM THE "L" BASINS PRIMARY TREATMENT UNITS DOOR MONORAKE CONVENTIONAL SYSTEM
2012
Total Million Gallons Water Treated
Total Tons Dry Sludge Deposited in Basins Including suspended and Dissolved Solids Removed and Reacting Chemicals
Total Million Gallons Wet Sludge Withdrawn from Basins Average Percent solids in Wet Sludge Total Million Gallons Water Used In withdrawing Sludge Percent of Total Water Treated Used In Withdrawing Wef Sludqe
18,062.21
2,434 315.89
0.18 315.65
1.75
1V.23

SEWERAGE AND WATER BOARD OF NEW ORLEANS
TABLE XI As of December 31, 2012
2012 ANALYSIS DATA FOR NEW ORLEANS DRINKING WATER PURIFICATION SYSTEM
PARAMETER
Total AlKallnlnty (ppm as CaCO^
fotal Hardness {ppm as CaCOj)
Noncarbonate HanJness (ppm as CaCO^
Calcium hiardness (ppm as CaCOj)
Magnesium htardness (ppm at CaCCh)
Nephelometric Turliidity (NTU) DH
W o M e (ppm) Fluoride (ppmi Total Dissolved Solids (ppm) Total Suspended Solids (ppm) Free Chlorine Residual (ppm as C y
Total Chlorine Residual (ppm as Cli) Ammonia (ppm as N) 4lliBte(ppmasKI)' Sulfate (ppm)' Conductlvitv (uS^cm) Temperature ' f ) Mumlnum (pom) • Antimony (ppm) * Arsenic (ppm) * Sarium (ppm)' Beryllium (ppm) * Cadmium (ppm) * Chromium (ppm)' Ck)pper(ppm)* lron(ppml* Lead (ppm)' •langarese (ppm) • Nickel (ppm) * Selenium (ppm) * Silver (opm) • Ttialllum (ppm) * Zinc (ppm)* Potassium (ppm) * Sodium (ppm * Cyanide (ppb) • Haloacelic Acids (HAAS) (ppb) Total Organic Carbon (pgm) Total Tilhalometlunes (ppP) 1,2-DUiiloroelhBne (ppb) Chlorofbnn (ppb) ICaiton Telrachloiide (ppb) BremoolcMoromethane (ppb) TetracWoroethene (ppb) BTX (Benzene, Toluene & Xylenes) (ppb) Total Colilorms (CFUs/100 ml) Fecal Colifonns (CFUs/100 ml)
iaiggiS#H'fegEir '• (Before Purification)
MKK 154
214
1tW
165
100 159
a.47 53
0.65 445
95
__ 60&
e» __
___ —
_».
—
— _^. — — - « .
4.7 0.0 0.0 0.0 0.0 O.O 0.0 O.O
3400 310
MIN 81
l i s
19
80
10 5
7.11 23
0.06 200
9
J04 46
«__
___
»__
_ -
.—
2.9 0.0 0.0 0.0 0.0 0.0 0.0 0.0 67 0
A\/6 122
164
43
109
•55 34
7.87 37
0.37 302 37
4S2 6B
.__
._-
.__
.__
3,7 0.0 0.0 0.0 0.0 0-0 0.0 0.0 740 69
FINISHED WATER 1 (After Purification) 1
MAX 170
233
95
165
111 0.21 9.22
69 1.06 526
0.6
4.1 0.61
1 69
645 89
0.01 0.002 0.001
0 0.000 0.000
0.00 0.3
0.00 0.033
0.00 0.0
0.00 0.00
0.000 0
3.1 25.6 0.0
25.2 3.7
42.0 0.0
24.8 0.0
13.2 0.0 0.0
4 0
lullN
96
140
B
90
6 0.07 8.19
27 0.54 21S
0.0
0.2 0.03
1 57
377 51
0.01 0.002 0.001
0 0.000 0.000 0.00
0.0 0,00
0.000 0.00
0,0 0.00 0.00
0.000 0
3.0 23.5 0.0 8.6 1.9 6.8 0.0 8.1 0.0 0.0 0.0 0.0
0 0
AVG 1 133|
1881
58
133
55 0.12 8.66
42 0.78 333
0.2
2,9 0.16
1 63
611 73
O.OI 0.002 0.001
C
o.os< 0.00( 0.00
0.1 0.00
0.005 o.ot
0,0
coo o.oc
o.ooo (
3.1 24.7
0.C 15.2 2.«
21.3 0.C
12.3 0.0 6.C 0.0 0.C
0 0
The results for constituents indicated v/lth asterisks are f.-om the Louisiana Department of Health and Hospitals, Total Oniaiic Canson and Haloacelic Acid results are frpm a DHH certified contract laboratory. All other results are from tesUng by ll«e S&WB Water Quality Laboratory. Lead and Copper testing Is performed tiiennlally. These results are from 2010. Concerning Oie chemical results, the SSWB Latwraloiy does not meet the higher cdteria required by OHH to be dassified as a "OHH-OPH Certified Chemical Laboraiory/Drinklnfl Water;" iherefUre, any results reported by this laboratory for chemical drinking water parameters wtiich are required to be analyzed In a cerlilled iaboralor>' are offlciany deemed invalid. The S&WB Laboratory Is certified by DHH for Total Colifomi and Fecal Colifofm testing.
IV-24

SEWERAGE AND WATER BOARD OF NEW ORLEANS
TABLE XII
EXTRACTS FROM TABLES IV-E AND V As of December 31,2012
20 Year Period, 1993 to 2012 Inclusive Maximum, Minimum, and Average Amount of
Water Treated Per Day (M.G. per 24 Hours)
YEAR
1993
1994
1995
1996
1997
1998
1999
2O0O
2001
2002
2003
2004
2005
2008
2007
2008
2009
2010
2011
2012
CARROLLTON 1 MAX.
140.38
' 128.88
142.83
198.42
156.53
152.96
168.26
162.60
153.93
128.67
144.26
145.83
144,00
165.63
144.75
143.60
147,92
156.60
150.83 163.29
IU1IN.
103,25
103.88
104,67
91.59
112,70
98.48
122.55
126.71
107.75
87.00
90,75
102.92
0.00
115.33
124.00
114.08
129,83
125.33
127.17 117.96
AVG.
117,41
113.71
121,40
128.97
128.73
126.86
140.26
128.10
126.70
108.63
115.35
122.67
115.47
139.73
134.06
133.88
138.17
137.10
139.37
137.65
ALGIERS il MAX,
15.42
17.00
18.14
18.27
18.83
22.96
22.00
18.83
15.76
14.00
13.16
13.16
22.67
18.34
16.00
13.68
14.00
15.67
16.83
16.60
MIN.
7.62
8.00
9,00
9,00
9.58
12,00
8.90
7.58
6.00
6.66
8.00
8.00
7.00
8.00
10.00
6.92
8.00
8.00
10.00 10,00
AVG,
10.18
11.47
11.55
11.47
12.06
12.36
16.19
12.13
10.90
9.80
10.06
10.15
10.20
11.67
12.13
10.36
10.78
11.25
11.73 11.58
IV-2S

SEWERAGE AND WATER BOARD OF NEW ORLEANS
TABLE XIII
December 31,2012
Monthly Temperature (Degrees Farenhelt) of the Mississippi River Water at the Carrollton Plant
,„
January February March April May June July August Seotcmber October Noven:iber December
Maxjinum Minimutfl Averaqe
2003 48 48 51 60 70 73 79 61 80 73 65 53 83 4S 64
2004 49 47 54 62 71 79 83 84 81 74 65 53 87 45 67
2005 49 48 51 62 71 81 65 86
• »
76 66 51 80 42 66
2006 50 61 55 63 74 63 86 88 66 78 63 54 90 46 69
Ten Yea .
Maximum: Minimum: Average:
2007 52 47 56 83 71 79 82 85 82 75 63 56 89 40 68
r Period
90 37 66
2008 50 53 55 63 66 77 80 82 78 71 BH 55 65 42 66
2009 50 46 51 56 69 79 85 84 81 70 59 49
, 86 42 65
2010 41 41 48 62 71 81 85 86 83 72 61 50 89 37 65
2011 43 43 51 61 68 80 84 87 80 72 62 50 SO 40 65
1 2012 48 48 67 69} 74 61 85 87 82 72 60 55 89 4d 68l
* Data not available for September 2005 due to hurricane Katrina.
lV-26

SEWERAGE AND WATER BOARD OF NEW ORLEANS
TABLE XIV December 21, 2012
Monthly Temperature (Degrees Farenhelt) of the Tap Water at the Carrollton Plant
-
January
February March
April
May June
July August September
October
November December
Maxiumum
Minimum Average
2008 67 69 71 72 76 81 83 80 80 78 72 68 86 59 75
2009
66 65 68 70 74 78 80 78 77 74 69 65 88 51 72
Five Yei
Maximum:
Minimum:
Average;
2010 61 61 66 70 76 80 82 84 80 75 66 60 BB 41 72
it Period
90 41
73
2011
61 60 67 71 73 79 82 85 80 76 69 63 90 44 72
2012 64 65 69 74 77 82 84 79 78 73 69 68 89 51 73
IV-27

SEWERAGE AND WATER BOARD OF NEW ORLEANS
New Orloans tWGst Banli Sewerage Treabnont Plant 2012 Yearly Summary
P t a i l t E I F I a « r ( M G t > |
A n r s g a
Max lmun i
INFLUENT B O D ( m g f l j
Average
Uajdsnum
INFLUENT TSS ( m g f l j
A v s r i B S
RUixIinuni
I H F L U S r r B O O p i B f t t a y )
A n r a g a
MAXbnuni
INFLUENT TSS I D u M a y )
A v s n g a
M a x i m u m
B = F U I E M T B O D ( l l i g f l . |
A v e n g a
WacMy M s s l m u j n
B = F U J E H T T S S < i n s A j
AV9r309
W t a M y M n l m u n i
a V L U E N T B O O ( I b s M a y ) A m n g a
W K U y H a j d m u m
t f I ^UIEKT TSS ( l l n M a y )
A^mimQ
Week ly IBax tmu in
B T L U E N T C L 2 ( m a l L )
A v e n g e
B l u t m u m
B m U E H T C O U F Q R M ( o d n o O a l )
Averagt t | 0 » » )
w e e H y n m m u m i G e a )
EFFLUENT p H ( s u }
H In l in i i iD
D I 3 P O S E 0 S L U O O E ( d i y i o n * )
Average p e r d a y T a b I
RAINFALL ( I n d m x ) TOTAL
7.21S
11.160
148 8
240
1 M . S
468
e/rte 20.S91
9.593
40.151
I 1 J 13
S
10
691
S19
490
6 3 0
1.22 1.4
2
2
7 0 9
7.J4
4.6
95.S4
2 .31
9 . 7 M
20.1SG
1 W 193
120
216
e,7J7
13,MD
9.433
18.970
i i S 15
8 2
9
1.08/
1.40B
672
644
I J 1.4
2
C
7.28
7.S3
4.7
9 3 1 3
4.00
1D39Z
32.33t
1 1 2 J 2H1
124.1
344
8.574
21.700
1 0 6 8 0
52.416
U 2
i a
T.5
8
1 .1M 9 . 4 M
647
1.081
1.2 1.4
3
10
7 . M
7.S4
4.7
B9.SB
7.42
11.084
2S.!ISS
38
?99
8S.8
216
7.830 23.787
7 * 1 7
1 6 . 8 %
U S
17
8.4
I f
1.191
2.S70
823
1.6S3
1.16 M
5
24
7.29
7 j e9
9.34
112.1
7.42
6.616
0.253
119.7
191
147.7
376
S.5S3 9.742
8.215
2 5 J 0 2 4
11.3
I S
7
s
6 S 1 9 3 0
4 0 5
4 0 6
1 J M
1.4
8
1 0 0
7.04
7.18
9 8 1
eoiB
2 J 8
8 J 9 9 20.223 -
96.8
210
1 2 8 3
360
6.090 12.137
9.793
40/422
a.e 10
8.8
13
G52
834
679
1.084
l i
1.4
4
3 0
7.1ft
7 .3$
4 0 8
S1J6S
6.56
12.107 S . 1 7 5
0 4 2
222
7 5 3
37C
6.808 1 5 L 7 7 S
6.268
22.192
5.7
8
8
9
501
1.202
725
1.352
1.09 1.4
9
9 4
T.aa •
7.55
5 3 8
91.50
15.75
14.10
3 0 0 5 6
6 ^ 8
113
7 0 S
166
7.074 20^866
a i 3 3
19.151
7.1
9
9
882 1.324
1.051
1.324
0J9S
1 3 5
5 18
7 J 1
7.74
4 . K
8a.3S
0 * 7
8.072 1 6 2 8
89.7
227
81.1
3G2
e.322 13.42S
5.972
2 7 2 3 S
8 8 8
10.3
14
5 0 9
687
8 4 9
1 2 «
1.1 1.4
2 8
7.15
7.6
5.11
7f i ,63
1.34
' i S i ^ O e t Z ' ' . ' - :
7.398 14.878
9 7 J
13?
7 S B
148
5,843 7.824
4.616
8.453
7.1
B
7.3
1 0
4 5 6
6 7 3
4 8 3
8 4 1
1.18
1.4
9 142
7.02 7.4J
4.94
B5.5S
1.51
7 J » 4 1
11.05
SB
145
87.7
188
6.154
9.874
5.613
14JE01
8 £ I D
4.7
6
5 4 9
713
296 428
1 2 7
1.4
2
10
7 1 4
7.52
S.24
99.62
2.61
- -oae-T l
7.33 9 .61
1«» 154
68.1 168
6.487
9,043
5.303 9.665
i a 4 12
9.2
10
6 4 0
7 8 6
9$$ «5S
1 2 2 1.4
2
10
7.14
7.39
9.21
«8.S2
0.70
2 0 1 2
9 L 2 S
35.18
ua.ia 299
t03 .S2 4 a
7.129
23.787
7,582
52.415
9.78
14
T 4 T . M
2,570
6 4 0 J I »
1.««3
1.17 1.40
4 . M
142JI0
7.02
7.74
5
1.«»2
63.71
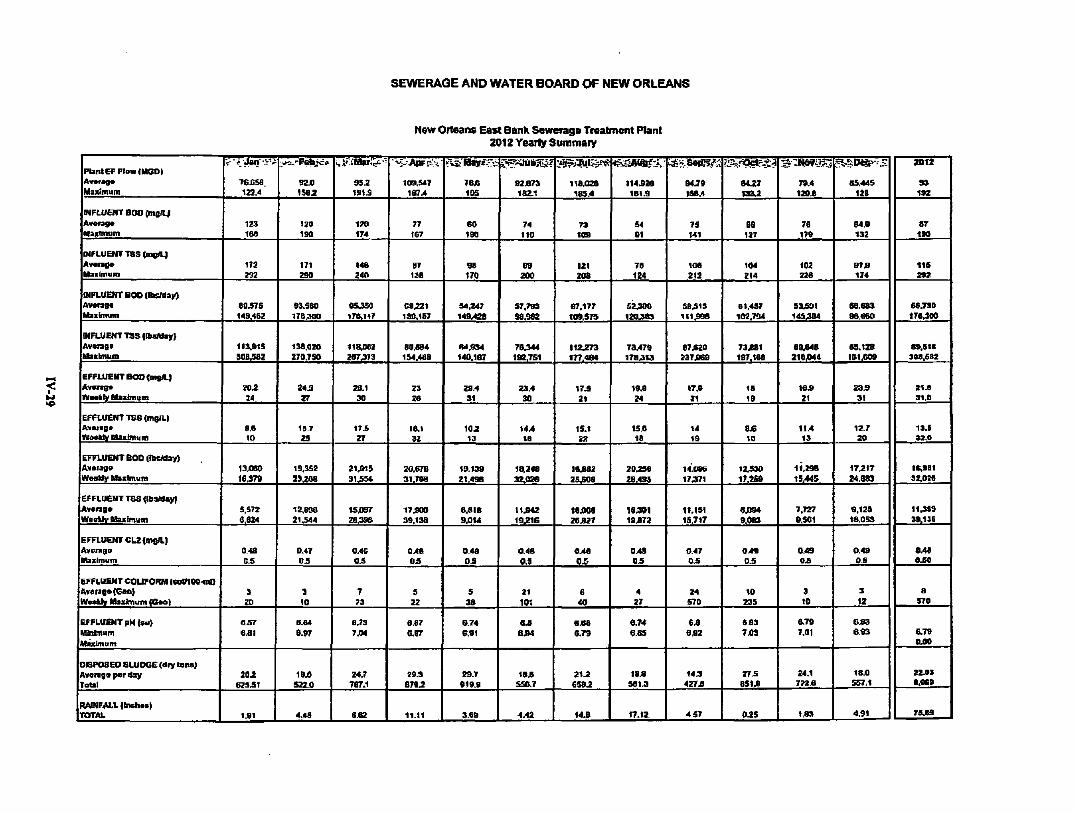
SEWERAGE AND WATER BOARD OF NEW ORLEANS
New Orleans East Bank Sewwags Treatment Plant 2012 Yearly Summary
I pbn lEF Flow (MOD) l/hntMgm iMajUmum
I N F L U E H T B O O (Btgfl4
lAvena* iMut inu in
INFLUENT TSS (mgAJ Avange Mn lmum
MFLUENTBOOIteMay) Avan9« t ta i imuni
MFLUENTTSS4lli«Miy> Avang*
|M» l inum
EFFLUENT BOO «ngA.| JAvaras* WMkfy Maximum
1 EFFLUENT TSS (mBlLI Avanga Wook^ t lanlmiim
EFFLUENT BOO (IbsMay) lAvaiage Waot^ Maxlmuni
EFFLUENT TSS (IbSMayJ JAvaraga WaaUyUaximum
EFFLUENT CLZfmga.} [Avorago iMUxbmnn
AFFLUENT COUFORM (coin OO-mD Avanga(Gaa) WaaUy Maximuffl gZM)
EFFLUENT pH(su) MMtnuni Maximum
DISPOSED SLUDGE (diy tana) Avenga par Hay Total
RA0)FALL(lnchaa) ITOTAL 1
76JDS8. 122.4
123 168
172 202
80.576 149.462
113.915 S0B.9B2
202 24
S.6 10
13.080 16.379
5.572 6.824
0.48 0.S
3 ZD
6.57 8.81
202 625.51
1.91 1
92e 1582
120 190
171 290
93.580 176.300
136.020 270.750
24i l 27
15.7 25
19,352 23,208
12,608 21.544
0.47 0.5
3 to
B.B4 e.97
18JO
522.0
4.(3
95.2 191.9
120 174
146 240
85,3» 176.117
118,062 267J73
26.1 30
17.5 27
21.015 31.554
1 S » 7 Z 8 3 S
0.46 OS
7
8.73
24.7 767.1
6:62 1
, •W.Apr , jVv
I 109.547 187.4
77 107
97 138
C9221 139,157
80.884 154/488
23 ZS
18.1 32
20,678 31.798
17:900 39.138
o>a 0.5
5 22
6.67 6.87
29.3 6792
11.11
IBS 10S
so 180
98 170
54.247 149.«8
64.934 140.187
29.4 31
102 13
19 .1» 21.498
6.818 9 ,0U
0.48 0.S
5 3&
6.74 6.81
29.7 919.9
3.69
82.873 182.1
74 110
99 200
57,793 98,362
78344 198.751
23.4 30
14^ IB
16,248 SZSOB
I1J42 19216
0.48 as
21 lot
6.8 BB*
1BJ6 SSS.7
4.42
118.026 185.4
73 109
121 208
67.177 tlS.5T9
112273 177,484
17.S 21
15.1 22
16J82 25.608
tsjoos 26.827
0j«8 OS
6 40
6J5B 6.79
212 6582
M.B
114.926 181.9
54 91
78 124
52J00 120.383
73.479 178.913
19.9 24
15.0 IS
202S6 26,495
16«>1 19.872
0/4S 0.5
4 27
6.74 6.85
18.8 581.3
17.tZ
94J» 1SS.4
75 141
106 212
S9.S15 111,999
87J620 237,089
•7.9 21
14 19
17371
11.151 15.717
0.47 0.5
24 570
6.9 6,B2
U 3 427.5
457
8427 1332
12T
104 214
61.457 102.794
73,881 197.166
18 19
8.6 10
12.5)0 17.259
«JI»4 9.083
0.49 0.5
10 235
6.83
27.5 851.8
025
79.4 120.B
78 179
102 226
S3,S»1 145,304
eajMB 2iej(>44
16.9 21
11.4 13
U.iSB 15,445
7,727 9.561
0.49 0.5
3 10
9.79 7.01
24.1 772,6
1,83
BS.44S 12S
84.9 1. 2
91» 174 1
56.683 96.660
65. I S 161,609
saj9 31
12.7 20
17217 Z4.8S3
9.125 18,053
0.49 0,5
3 12
C.83 6.93
18.0 557.1
4.91 1
1 2Dt2 1
1 S3
1 ^ 87
1 ** 115 2*2
66.790 ITB.300
89,6t« 1 308,682
1 '^•' 31.0
13.5 32.0
16.981 52,026
11,359 1 39.136
0.4B fluSO
1 8 570
6.79 0.00
ZZ.M a.«89
1 7a.«9
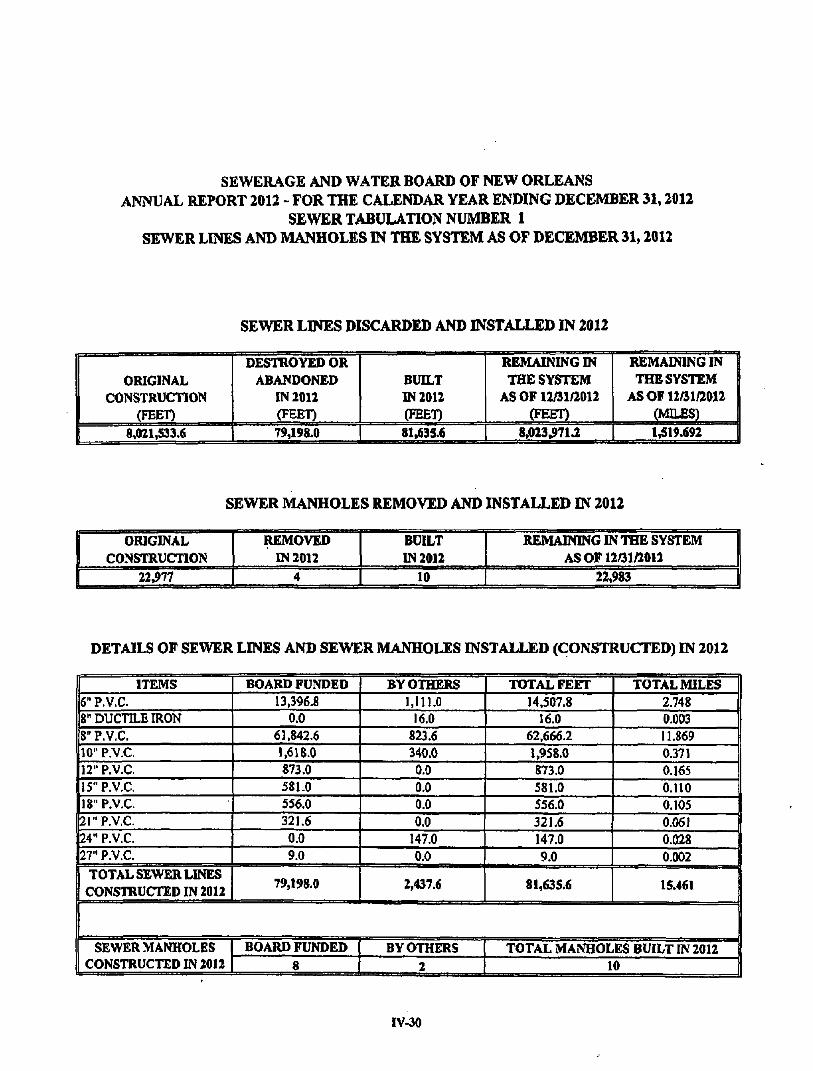
SEWERAGE AND WATER BOARD OF NEW ORLEANS
ANNUAL REPORT 2012 - FOR THE CALENDAR YEAR ENDING DECEMBER 31,2012
SEWER TABULATION NUMBER 1
SEWER LINES AND MANHOLES IN THE SYSTEM AS OF DECEMBER 31,2012
SEWER LINES DISCARDED AND INSTALLED IN 2012
ORIGINAL CONSTRUCTION
(FEED
8,021,533.6
DESTROYED OR ABANDONED
IN 2012 (FEET)
79,198.0
BUILT IN 2012 (FEET)
81,635.6
REMAINING IN THE SYSTEM
AS OF 12/31/2012 (FEET)
8,023.971^
REMAINING IN 1 THE SYSTEM
AS OF 12/31/2012 (MILES) 1,519.692
SEWER MANHOLES REMOVED AND INSTALLED IN 2012
ORIGINAL CONSTRUCTION
22,977
REMOVED IN 2012
4
BUILT IN 2012
10
REMAINING IN THE SYSTEM 1 AS OF 12/31/2012 |
22,983 1
DETAILS OF SEWER LINES AND SEWER MANHOLES mSTALLED (CONSTRUCTED) BV 2012
ITEMS 6" P,V,C. 8" DUCTILE IRON 8" P.V.C. 10" P.V.C. 12" P.V.C. 15" P.V.C, 18" P.V.C. 21" P.V.C. 24" P.V.C. 27" P.V.C.
TOTAL SEWER LINES CONSTRUCTED IN 2012
BOARD FUNDED 13,396.8
0.0 61.842.6 1,618.0 873.0 581.0 556.0 321.6 0.0 9.0
79,198.0
BY OTHERS 1,111.0
16.0 823.6 340.0 0.0 0.0 0.0 0.0
147.0 0.0
2,437.6
TOTAL FEET 14.507.8
16.0 62,666.2 1,958.0 873.0 581.0 556.0 321.6 147,0 9.0
81,635.6
TOTAL MILES 2.748 0.003 11.869 0.371 0.165 0.110 0.105 0.061 0.028 0.002
15.461
SEWER MANHOLES CONSTRUCTED IN 2012
BOARD FUNDED 8
BY OTHERS 2
TOTAL MANHOLES BUILT IN 2012 10
IV-30

SFWRRACE AND WAXCB BOADD OF NEW OIOKAN!; ANMIAL BErOKT 2»U - FOR TBE CALflfDAB YEAR Kiramc DOXMaER St, 1011
SEWEBTABUlAnONNUHBEX 2 LENCTTB OF SKWERIJNES OF EACH SIZC AND MATERIAl. mSCABBSP, BtOLT, AMD NOW RCMAININS IN TUE SYSTEM
s e x a. MATKBULOF SEWFK
TTSud i«S-Sted
« 6 - S t t d
66-CMcretc
SO* Sted
60*Cancietc
S r C c n c n t t
5 4 - S n d
S f l - j w x n t c
S I * C o m a s
JO-Sled
Ni-Stad
1 4 8 ' C o K n t a
! 48-P.V.C.
i A i ' C m m a
42-Stecl
42 'Cnnc rae
I T - B f i c k
29-Coaaxxx:
M - V h l t f o l C t a y
U - C M I m n
J « - S n d
35* F idnssc^ Concrete
J C R a n f t R w d C M C N t i
J«* P.V.C
T>*0 r i i 4
1 3 ' V i i r i a c i i a i y
n ' R a A n t a C o n a e a JO-Bi lcL
M - y i u i S c d O i y
WCaaboa M-Stec l
MOT n uCi pKfnl C oomtC-
JO'BCi l l l lHcnIOl i ien t t
30" P.V.C.
j r V m U W C h y
1 X r t M t i t b r c B H U a c r t i c
j r P.V.C
J < - V i t n i t e l U > v
24-Can ben 1 24'DiKinclnin
T O T A L L S N C T i l U I s r s T F j i A.S o r
U / 3 U 0 I I
JV.I81 4
9.06I.S
S 8 . W . J
13.740,7
J.577 7
7zz.a l.7«6.t
44.0145
1 7.0304
' 7.55«
I3S.0
I I , I 47 .J
10.117.6
|I>.»OOJ
}.«SJ.4
3.041.4
3.5801
I 9 . I 2 I J
t ) t . l
H.410,6
i M 9 . 1
431.0
« 2 . «
I1.Z7I.0
O.IKJT
lassoi) 3.110 4
S«JJ
I .MI .4
1,7*1.0
I L 7 3 1 2
4.3095
3J3J.2
4S10
j x s i a s iA.4ao.e
i»6 .0
Z4.449.4
IJJ90.4
3.in.o 3 1 , 5 7 1 !
I6.2e»
«'as
DF.m<nvKt)f lu ABAimOMlLVlN
1 lOlt
9 «
B U I L T C I 2 » U
a,0
NOWSEMADnNCCi iRcsrsTZMASor
29.IS2.4 9,aei.9
28.979.7
13.740 T
2 . 3 " . ?
7J2S
l.7«6,8
44,014.1
7,010.4
7M.9
I3J.0
* 1 , U 7 J
i0,IZ7.«
10.9001
3.efi3.4
3.0<1I4
3 .1WJ
19,121J
S12B
4,4108
1239.1
431.0
5 6 2 ^
11,271.0
9 J M . 7
tO:95aO
3 .150*
S 6 U
l , » l . 4
2.7WJ)
I I . 1 1 2 2
4 J 0 5 J
3,5352
4 H A
13.920.3
I6.400;0
996ua
24.440.4
I JJ90 .4
I.1S6.0
3 U 7 2 J
IC.2592
6 1 9 0
5 r » A MATEBULOF i smvER
Zl 'SutJ
24-RBcracedCoaattt Z4* Ajliecta, Ceasat
M" P V.C
I f RciAiTxilCaaaitc
21" P.V.C 2irDuaifeIiwPi|a
IB- P V r.
16-acd
l«-A*B«wCcinm
K-P.VX.
15-ViirifirfCl.T
15-P.V.C
l$ 'Phsii iTBia
U-Vnr iBtaOv
12-P.V.C
irvsri&dCh, 1 lO-.-ittd
1 irCosacte a r AAaaxCtmKt
W P.V.C
WPluneT taB
• •TonCbUa
l-VddialCfaT
1 l-(>glreB
• • n a a b b i n
B-Cwadc
y A t l K s m C a n e a
»" P.V.C
I'PbslIcT^un
8-Pbiii£
A- Terra Cam
6-Vmaiolciw 6 - U i t b i n
6-Al5eanOcmcst s-n.vi:.
1 O I SStlft lfUS9 e-piujic
4-C>dIuiii
4-Ductile Inn
14-P.V.C 14-plMlic
i T t a i i a c n t t a I T O I I I M B B
TOrTAI.LEKGTHDI SV&reMASOF
izni/ioii
DESTROreOOB ABARDONED IN
m l
»7(
2A,5<9.(
4 , » » 1 *.77B.<
I U » . 7
*,79».4
2.I3SJ
m s
I7.ra9,l 1
l»J< 28.4au
4747J
100.4BI.1
12,157.!
1,766.1
IIO,05».I 64,S14.<
l«4.09i.( 490.1 130,1
51,UOL3
4 .35«
IX3,3>7.<
5 , n 4 j
3 « J
231.4 3 M L $ 1 0 J I I I . $ 0 I . 9
4.29»,«24.( 1 5I ,«7 . I
WHO 3 74M
asaToti J,7M.«
3.887JJ
4J3.S41.C 7 » S
<a.643J 50^«
TW.TII.' 919S
9335
83 .8Uj | 4JW.4
*.ms 3»JM.*
5.IT4.
36S,»77.«
•74J
1104
6*3&9
I2&0
• j o n A i U 1.99010
m s I.I0I.5
7*.I9U 1S.O0O
BUILT IM M i l
147.0
3216
JStO
511,0
m o
l,9n.a
16 0
61MSJ
14.S07.8
aijtMjs •S.4U
NOWREMAWINGIN THKSVSTTMASOr
ivsinon »70
26,569.0
4.924.1
5.917.6
IU3«.I
5.1200
1,I35J l»,44Sll
120 0 j t , a a o
^7*7J
l0ai4gL9
12.«3I.9
I.7M*
liaU55.l «J.*47J>
IS1,U0,9 UO.O
satM.i 4.356.2
U7,MSJ
4,9»3.» XZ5.0I».6
4J4a,2I7.l
M.710.2 764 7
276,»«7.0
3,t«,9
49S.44J.7
68JJS5
699.l)i.9
9T>S
a j t l i S
4.2(M.4 4.«3.9
I43.4SIJ
W5I,3
I S t J l K l
«;u ltO.4
6 . n 6 » 126,0
«jin3.»TI.2 I.SI9.UX
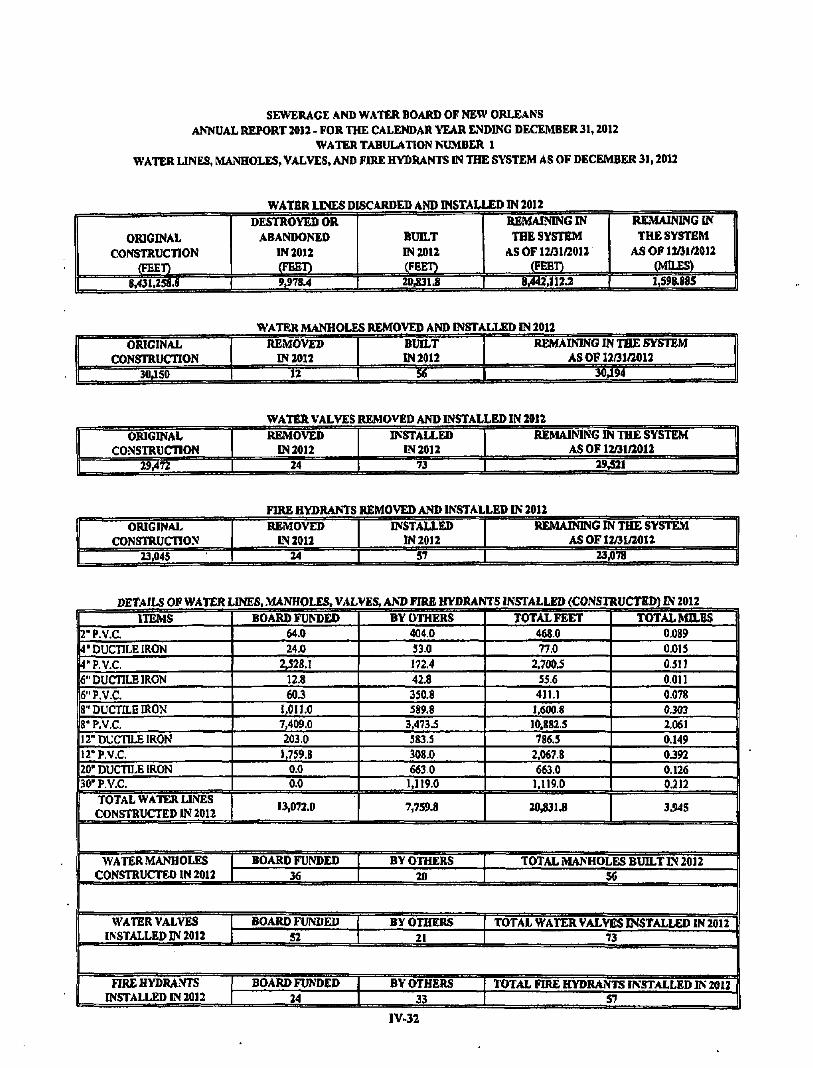
SEWERAGE AND WATER BOARD OF NEW ORLEANS ANNUAL REPORT 2012 • FOR THE CALENDAR YEAR ENDING DECEMBER 31,2012
WATER TABULATION NUMBER 1 WATER UNES, MANHOLES, VALVES, AND FIRE HYDRANTS IN THE SYSTEM AS OF DECEMBER 31,2012
ORIGINAL CONSTRUCTION
(FEET)
WATER USES DISCARDED AND INSTALLED IN 2012
DESTROYED OR ABANDONED
IN 2012 (FEET) 9,978.4
BUILT IN 2012 (FEET) 20,831.8
REMAINING IN THE SYSTEM
AS OF 12/31/2012 (FEET)
8,442,112.2
REMAINING IN THE SYSTEM
ASOF12ir)l/2012 (MILES) 1.S98.885
WATER MANHOLES REMOVED AND INSTALLED IN 2012
1 ORIGINAL CONSTRUCnON
1 3(1,150
REMOVED IN 2012
12
BUILT IN 2012
S6
REMAINING IN THE SYSTEM 1 AS OF 12/31/2012 |
30a94 1
WATER VALVES REMOVED AND INSTALLED IN 2012
1 ORIGINAL 1 CONSTRUCTION || 29,472
REMOVED IN 2012
24
INSTALLED IN 2012
73
REMAINING IN THE SYSTEM 11 A$OF12A}1/2012 1
29421 1
FIRE HYDRANTS REMOVED AND INSTALLED IN 2012
1 ORIGINAL CONCTRUCnON
1 23,045
REMOVED IN 2012
24
INSTALLED IN 2012
57
REMAINING IN THE SYSTE.\I AS OF 12/31/2012
23,078 1
DETAILS OF WATER LINES, .MANHOLES, VALVES, AND FIRE HYDRANTS INSTALLED (CONSTRUCTED) IN 2012
1 ITE>iS 2-P.V.C. 4" DUCTILE IRON 4" P.V.C, 6" DUCTILE IRON 6" P.V.C. 8" DUCTILE IRON 8" P.V.C, 12" DUCTILE IRON 12" P.V.C. 20" DUCTILE IRON 30" P.V.C.
TOTAL WATER LINES 1 CONSTRUCTED IN 2012
BOARD FUNDED 64.0 24,0
2,528.1 12.8 60.3
1,011.0 7,409,0 203,0 1.759.8
0.0 0.0
13,072.0
BY OTHERS 404.0 53.0 172.4 42.8 350.8 589.8
3.473.5 583.5 308.0 663,0 1,119,0
7,759.8
TOTAL FEET 468.0 77,0
2,700.5 55,6 411.1
1,600.8 10.882.S 786.5
2.067.8 663.0 1,119.0
20,831J
TOTAL MILES 11 0,089 0.015 1 0.511 1 0.011 0.078 0,303 2,061 0.149 0.392 0.126 0.212
3,945
1 " WATER MANHOLES 1 CONSTRUCTED IN 2012
BOARD FUNDED 36
BY OTHERS 20
TOTAL MANHOLES BUILT LN 2012 1 56 1
1 WATER VALVES 1 INSTALLED IN 2012
BOARD FUNDED S2
BY OTHERS 21
TOTAL WATER VALVES INSTALLED IN 2012 ||
' 3
1 1 1 FIRE HYDRANTS 1 INSTALLED IN 2012
BOARDFUNDED 24
BY OTHERS 33
TOTAL FIRE HYDRANTS INSTALLED IN 2012 1 57 1
IV.32

SeWEHAGE AND WATEK BOARD OF NEW' ORLEANS
ANNUALREPOI«T201> - FORTBECALENDAR VEAXENDINGDECCMBER31.2012
WATER TABULATIO.NNUMSSR >
LENGTH OF WATER LINCS OF SACH SIZE AND M A T E R I A U NUMBER OF VALVES OF BACH SIZE, BOTH CATE AKD CHECK,
0R1G1NAU.V IHStALLEP. THE q i M N T m E i DISCAKPEB OR BUgT, AND THE QUAWTITIM WQW REMAIWIHC »N THE DISTRIBUTION gYSTEM
1 W A T B R LINES 1
SIZE
54'
5C'
* r »8"
«8-
4J'
42'
42'
w W
i f
S6'
10*
30*
30*
iV }<f
W
^V
J l "
24*
21*
SC
s«-JO-
2tf-
20"
l«' w I f 16'
16'
I6' '
14"
12"
MATZnUL
C e n a i u Pipi
SttdPipe
Ottlmtfiot S n t l P l t e
C o n a ^ i K n
C u t IT w Pipe
C iS l ion Pipe
CenaMIt Pies
Can l i e i tP iM
E m I Plp«
ComnuP i^B
C s l I n n Pipe
Ouoil l* I n n Pipe
S i u l P i p t
CownnPloe
PronwwiCnwPw
RnnfercrfCoTOiilB
?.V.CPii>e
C u t Iran Pipe
Cenfftif l Pipe
P.V.C Pi««
C n l l m i T i p i
OuetililTDnPipe
Con cute Pip«
Prulreise4 Caserele
AibeaosCcraenl
RdnfetoedCgoCTiia
Cuit^popip* DueiHe Iran Pipe
Contttic Pi^t
Aifcenoi CeiMM
PV.CP ice
ReinEarctilCeiicfne
Cu ibaeP iee
i r >DiKnl>l ipnPi i»
: j "
12"
11"
10" 10"
18"
10"
r i r
1"
«• B"
«• i '
»'
SieilPipo
A l b f l W C e n i n l
P,V.C, Pipe
C i s l t a m P i n
Duciile l ien Pipe
ASbelun Ccaienl
P.V,C Pipe
C u i l ien Pipi
Ductile l ion Pipe
A*eJO»Cemtn:
P.V C Pipe
PiUTJt Pipe
Cdji l ien Piiie
Ojeti lelraniPije
AibeneiCcmeni
«' P V C P I M
«" p i i » t a P ; «
<'* 4"
4 '
t -4*
r 1 J-
2'
I :• 1"
C u t Iran Pipe
DuoUk l « n Pipe
AibatolCemer.!
P.V.C. Pipe
Plaaic Pipe
Ouvf imso • ipA
C i a Iron Pipe
GoJ^viInd Pipe
P.V.C. Pipe
Site: Pipe
T o i m U a t t r F e M
T t U I M i l c t
T O T A L LENGTH
I N SYSTEM AS
OP 1201/2011
7,535.1
n,4l4,B
12,7JM
u,ns,i 4,911.9
11.1:8.1
4,M9.<
J.M1.9
4.$»J
l<,76U
»1,«« 6tiS
K.S4C.I
3S.0
I9.U).I 73.r»3 M.«>4.4
3519.«
l .4B). l
3 0 / 8 0 , :
t j u r i I0.270J
» l , 99« l
l i . 2 1 2 1
ie ,7 j j ,8
2129
12.6810
»»s l lV I l t
>.1«,3
S.HI.S
<6.3M2
ie.517.1
i.tia.1 n 6 , n 4 . g
l'>.«M,6
iJTLt M j n \ . i mau.2 10356.1
610,0
I2.2S3.6
4.2»»,0
lJ<.99t,9 3 l l * 0 »
T)1.«M>
SS7.9I92
318.0305
2.«5«.5S5*
Jl.WOl
1.048.580,8
390,393,5
121.385 5
l8.CtS«
I.CM6
29.0858
IZ.3DIJ
3.231.1
3.J6I.1
19,313.9
».»0,0 ».46;.4
3.346.6
DESfROVED OR ABAKDONEOIN
2«n
1.1(10,0
450.0
BL lLT lN IO l l
l.lt9X
60.0
54}.ai
i M4J
B5.C
737,8
274,3
1,110 «
4,347,7
8.431,258,11 9,9n.4
l,(9<,829| 1,190
3.067 B
l.6».B
l0.8Bt,5
51,6
411.1
77,0
3,700,5
44tO
10JB3l.a
3.MS
KOWRE.MAININC INTRBSySTBM ASOFuaiaou
7.J3S.1
IB,4B4.B
!:.is».s
38.133.1
4.982,9
!).170ll 4J».«
9,3(1.9
4.S».1
16,781.2
)7.H4.1
67J.C J9.740.1
3S,0
19,863.1
72.JM,2
36,654,4
3.WP,a «iai
}9,4B0.1
4,082.5
l»J»D,5
9 ) J W . l
I3.l»,l 18.755,8
31},S
l3j6B8,a
970.5
1I7,4U. I
3,7273
5,«8).«
««,S44J
10,5774
l ,069J
w.m.] I8 .46M
1 ^ . 9
361.521.7
193J830
jnnt,7 £10.0
12.7«3,6
4.289,0
I36J7>,1
)S.14|.«
711.413.4
SSB,801,7
318,036.5
2,fi9S30«.>
22,035.7
1,044,233.1
390.801.6
I3I.38S.3
I8,9BB.6
2.171.6
29,0BS.8
is.o:-..B 3.237,1
3.341.7
i9.3U,9
9.(10.0
7««5,e SJ4S.0
8,4«t,IIU
1.598.685
VALVES 1
SIZE
48'
41'
3S'
30'
7«'
30"
l«' 14'
i r
IO-
r «• 4"
Total
EJCISTJNOIK SYSTEM AS OF
uuiaoit 16
4
18
63
39
131
193
3
woa
REMOVED IN20U
1
1
4
65
«^5S3 4
11,936 7
7.130 ( 7
29,478 1 >4
0<STALLED IN 1012
2
1
4
33
19
14
73
REfdAlNINCLS SYSTEM AS OF
ii.aioou 16
4
11
66
39
131
193
}
1168
65
6,591
I2J94S
7,137
19;S11
IV-33

SEWERAGE AND WATER BOARD O F NEW ORLEANS
Table of Rainfall in New Orleans As of December 31,2012
Last Tea Years
t
I v E A R
1 ""•
1 110
1 1 111
1 I I I
1 " 1 114
\ n
l i e
t u
i i a
n o
YEAR
t t a a BVO.
2004 emei e ^
c m i
2000 total
Coal
2000 l ob i
2009 lotst
2010 •otel
201 u a s ava.
•2012 total no .
JANWWT
n
0. fZ S0S.42
4,ez i . ! * a 4 6 aos ».cs 7.11 ao) ze> 9 2 t ftOI <1S>
13L83 0.12 6 . U
• 80.15 0.11 S L I S
2S.3I 0 2 2 I.J4
J T O l CL2;i ZB9
30D5
17,1 r i iTG
— " I
4
. . . 6 J B S02.M
l A t 8.10
14.18 0.13 9.03
2 3 J 1 0.21 2.72
2 5 . « fl.2S 1S1
27.T4 • 0 ? 4
SJM 33JU 0J» 3.97
38.J6 0.31 i .91
42 .2 ! o . j n I E )
43LES
0 , 9 ' 33 1
47 73 0,4)
UAKY
Sg 6L20
1.013.33 O J I
11.44 17.«4 0,10
1260 30,32 0 2 7 S..12
3504 0 3 2
41.57 0.-S
I1,8S cast
O . i ' a i s
• i . « » ass /.«»
8 9 3 2 0.39 4 59
73.91 0.03 5 1 2
79 03 0.66
ttAftCM
4
4.G5 ST1.8S
SJO 0.99 S04 OLOS
3B6 0.SO o o a 0 2 1 9 75 0.09 V38
11.13 0 1 0 2.S7
13 70 a i 2 fi.ir
19J7 0.1 f 2.74
22B1 0 19 6 4 9
•29.11) Q M
2S.10 0.24
il io .es
1,584,90 14.41 12.43 73 ?B
0.21 1654 39,S2 o a e 557"
45.19 n.4« 7 3 1
S2.T) 0.48
14A.1 C7 73
O.SI 14 J I 91.53
0 . /0 10/40 91.33
0,7 > 11.06
103^1 0.«7 M 2
108.12 0.91
- APWU
.';39 SSO/71
4JI2 S J J
13CS o.(i> 6.41
" ~ 2 0 L 1 7
0 1 0
- T i ! 2333
0,21 1B1
2514 0 2 7 7,88
3302 0 3 > 1 2 1
34.23 0 3 a 2.97
3/.Z> a 3 2
S7.4r a32
37,47 ' 0.31
IB 71 2,121,93
19J9
3697 0 3 3
21.02 5 9 * 9 0,54 9 7 3
6377 0 6 1 1112
77.S4 OlSB
7241 10025
0.87 IS S I
1117 1 1.0O
U S '
L10 1135
140.41 L I 1 S.12
i43j&g 17?
MAY
1 o
I ? 3 7
S26L24 4.7S 7 . : i a i 1 a t ! 4J I I
1 3 - « a i 2 0 7 1
14.47 0,13 a j i
22 ! 1 0 ^ t . r t
30.74 0J7 j y i
33.20 0 2 3
. - ,6.12 39.32
0,34 D.n
40 ? l 0.34
0 3 4
If i a j se
2 ,648J I 2'IX>7 7 8 1 7 4S.6r d-2
27.03 73 I B
0.66 •• 9 4 9
6319 0 74
17,63 1QDa2
DOB 31117
13009 1.14
179 i 149J0S
1 3 8
109,44 1/44
l i n e s 1.53 s.12
iw .a i i se
_ i * ^
a
17,79 017.8)
5,62 1 0 J I a.1»
" b j B 4.29
3 2 3 9 0.20 T i e
34 J S •"6 31
4.43 3 8 1 > 0,34
47.9 1 0.41 7,24
55,14 a 4 / 4. IS
59,37 OLS)
w.sz 0 5 0
il 3 6 S
S i T 4 , « ( 29 70 36.41 74,7 ' 0-tT
3 1 J 2
• m-T
o
3 9.17
71200 6,47 4.7 3
13116 0.13
11.83 IflftC II 2S.57
0.95 • l i e s
117.74 •• 1.04
22! ; i 1,1911
1 J 3 1)6 63
176.4 1 1.!S
7 0 ! ! 196.85
1,70 26173
223.S0 t.5 1
16.42 24001
I M 5.12
246.12 2S>
0.23 - a * i 3 3 J 7 • Q J O
• ' V.«6 4 I I 3 0 3 1 3.91
45J4 0.40 3 8 1
49.3) 0 4 3 S,61
54.98 0,47
11/46 66,4 3
OJS
66.«a O M
is eg
Aueusi
3 „ _ « ( # ! 1 3 i 3 3.968.11
X M * 3 S } 66.72 O S )
42.94 13161
1.11 2ac i
151.71 1.34
X 3 . n 161.43
1.59 404 3
222.CS — 193
24.11 246 21
2 1 2 37.15
279,56 2 3 9
27,91 306.47
2 6 0 s t z
311.98 2,62
643.56 \ t i 4.1 J 7,71 osn
14.SS 2 t 2 B
0,2) 6,40
28,68 0,25 1.64
30.5) 0 2 7 7.77
3S.C7 0 3 3 4JCZ
4269 O J 7 9 S )
_ _ S 1 Z 7 0.45 1.S7
S3.84 6 4 6
_ S3.64
it 49 J 5
4.a5BBS 42.09 4 ; j > 96.43 a«7
S7.«> ^Sisa
,.., ^^ 2a4S
180,817 1.60
31.31 211.73
1.61 48.37
zw.ro 2,2S
ZB.BO
SEPTEMBER 1
E
i S » 82a9Z
5.72 1.07 S,S7 0,C3 0,81
if OCTOBER
1 S1.5S Jl24
5,256.53 47.81 4a«5
100.01 0.90
56.35 4 4 9 156 35 B3B 2 J J 7J !
U% 79.11
187.69 OLC i 1.6S 4,/< !l 35.71
11.7. J 223.47 Oil H W ) 7 . 8 '
I f t M a i 7 7.<6
786.9 11 37.0 ! 2.4»l 0123
41:9 kl 2 2 9 ,XW.63
2 8 1 29.46
3W.31 3LC5 S.1Z
365.43 O A i f » 0 7
20.32 a2s • t !
39.31 o j a
- " j 9 ; i 0.33
_ _ . 5 6 a 4 279J^I
2.43 3835
315.91 2.72
44.19 SSOIS
3 0 8 3947
399.E2 3 J 3 S.13
40473 3A0
346J1I 3.17 0.55 8L7I QU09 OOi a.es 5 M 3 0 3
l u e i 6.11
1.1-62 23.S) 0 3 1 1 J >
244 1 0 3 2 7.S7
32/13 0 3 1 a 3 9
3 7 « 3 0 3 6 0 1 4
37 67 0 3 6
37.97 0 2 6
n 84,7)
5,6073!) 50.98 5 4 0 }
106.71 ass
« » 7 ) 1J49
37 37 t.aS7 . 1.77
47.4) 24a97
2 1 7 57 0 )
304.S7 -2 .65 4 3 8 2
348^39 3.00
4 4 J J 337 97
3.3 5 3961
432 56 a,C7 S.12
437.7 » 3.68
MOVEUSBR f-
S>1 408.4)
9.Vl O.I t
t 1 i » a i o i , n
1732
2 9 4
154! 0 1 4 1-21
WL47 a i 4 i O !
16.53 0,16 0 7 1
19 31 0.17 2 S 2
3 1 6 3 0.1) 1.81
2 3 2 1 6 i o
2 3 3 9 O i O
ii SB.es
ni jb iaes
f S C 1 i 1 9 « 1
1.08 5964
17957 " 1 i »
3 5 3 1 214.8 1
160 4 8 6 1
263.44 2.31
323.10 2.81
4 4 6 1 367.7 1
3.1 r 46.90
414.61 3.S4
41.27 48386
3116 6.12
46099 3B7
DBCetBER
< 2 1 1
512.19 4 66 2 7 1 4 J 7 OfM 3 9 t 7 8 3 0 0 7
10.55 18.38 a i 6 4 52
22.60 a20 I I S
24.76 0.22
1911 •4.57
. . . 0 38 1.5 »
46.1S as 9 a ? 9
4 6 j a aeo
46JIZ 0.39
1! 61.91
6J52a,3' 59,3S 6 2 6 4
174 73 1 17
6 2 6 0 167,35
1,67 4 5 t i
2 3 3 . i l 2 0 6
53 13 79834
2 5 1 S152
* l T . J i 3J02
64.4 1 41237
3.SS 4849
46078 3.94
4 2 M 602.6)
4 3 1 S.12
S07J1 437
III S L D
5 3 1
332
3.62
4 43
5,13
5 3 7
4 0 4
3,50
0 4 3
II g o 1 2561
"eai 1
43. j
SO! j
58.50^
6 a i 5
44 s s
37,1 1
0 1 5
1

SEWERAGE AND WATER BOARD OF NEW ORLEANS
COST OF OPERATIONS IDENTIFICATION PROGRAM BENCHMARKING 2012
ADMINISTRATIVE SERVICES DEPARTMENT Insurance Cost per Employee:
Workers' Compensation Auto Liability General Liability
ENGINEERING DEPARTMENT Total Capital Program Design and
Construction Contracts Cost Growth
ENVIRONMENTAL DEPARTMENT Cost of Typical Industry Sampling Event
FACIUTY MALNTENANCE DEPARTMENT Cost to set 5/8" water meter
MANAGEMENT SERVICES DEPARTMENT FINANCE:
Cost to Process a Miscellaneous Invoice Cost to Process a Vendor Invoice Cost to Process a Paycheck
INFORMATION SYSTEM: Cost to, Image a Document Cost lo Retrieve a Document
$
%
S
PERSOIWEL: Cost to Hire an Employee Cost to complete a Voluntary • Employee Turnover Rate Cost to Train an Employee
Employee Termination
PURCHASING: Cost to Process a Sundry Purchase Order
REVENUE: Cost to Read a Meter Cost to Render a Bill (Less Meter Reading) Cost to Manage a Customer by Phone Cost lo Manage a Customer by Mail Cost to Manage a Walk-in Customer Cost to Process a Mail-in Payment Cost to Process a Walk-in Payment
SUPPORT SERVICES DEPARTMENT Average Annual Maintenance Cost Per Piece of Equipment
$ $ $
S 5
$ $
$
$
$
S s $ $ $ s
1,248.00 225.93 83.58
6.8%
S 784.59
$ 94.59
39.10 12.47 6.25
0.32 0.49
164.86 19.85 8.67%
235.71
47.89
1.28 0.86 1.77 0.47 5,01
30.90 6.91
2,000.00 25%
IV-3S

(This page intentionally left blank)

SEWERAGE AND WATER BOARD OF NEW ORLEANS
SINGLE AUDIT REPORTS
DECEMBER 3L 2012
I J m S I Postlethwaite iSSiKI & Netterville
A Protessional Accounting Corporal ion
vfAvvv.pncpa.com

SEVS'ER-'iGE AND WATER BO.\RD OF NEW ORLEANS New Orleans, Louisiana
Single Audit Reports
December 31, 2012
Table of Contents
Page
Report on Internal Control Over Financial Reporting and on Compliance and Other Matters Based on an .Audit of Financial Statements Performed in Accordance with Gofvemtnent Auditing Standards 1
Report on Compliance For Each Major Federal Program; Report on Internal Control Over Compliance; and Report on the Schedule of Federal Awards Required by OlVEB Circular A-133 3
Schedule of Expenditures of Federal Awards 6
Notes to Schedule of Expenditures of Federal Awards 7
Schedule of Findings and Questioned Costs 9

• i r ahA i Postlethwaite M a i B & Netterville
^P.ofuiiitrrti' .\ci.t:jti'inj9 Cwnciijl.u" "ijiKiotod Olvcm i Piiic pol Ci'ioi o' itio UrtRd i m a
www pre pa, coin
REPORT ON CVTERNAL CONTROL OVER FINANCIAL REPORTING .AND ON COMPLUNCE AND OTHER MATTERS BASED ON AN AUDIT OF FINANCIAL STATEMENTS PERFORMED IN ACCORDANCE WITH
GOVERNMENT A UDITING STANDARDS
To the Members of the Board Sewerage and Water Board of New Orleans:
We have audited, in accordance with the auditing standards generally accepted in lhs United Stales of America and the standards applicable to financial audits contained in Government Auditing Standards issued by the Comptroller General of the United States, the fmancial statements of the Sewerage and Water Board of New Orleans (the Board), as of and for the year December 31,2012, and the related notes to the fmancial statements, and have issued our report thereon dated May 9,2013.
Internal Coptrol Over Financial Reporting
In planning and performing our audit of the fmancial statements, we considered the Board's internal control over financial reporting (internal control) to determine the audit procedures that are appropriate in the circumstances for the purpose of expressing our opinions on the fmancial statements, but not for the purpose of expressmg an opinion on the effectiveness of the Board's internal control. Accordingly, we do i]Ot express an opinion on the effectiveness of the Board's internal control.
A deficiency in internal control exists when the design or operation of a control does not allow management or employees, in the normal course of performing their assigned fiinctions, to prevent, or detect and correct misstatements on a timely basis. A material weakness is a deficiency, or a combination of deficiencies, in internal control such that there is a reasonable possibility that a material misstatement of the entity's fmancial statements will not be prevented, or detected and corrected on a timely basis. A significant deficiency is a deficiency, or a combination of deficiencies, in internal control that is less severe than a material weakness, yet important enough to merit attention by those charged with governance.
Our consideration of internal control over financial reporting was for the limited purpose described in the first paragraph of this section and was not designed to identify all deficiencies in internal confrol over financial reporting that might be material weaknesses or sipificant deficiencies. Given these limitations, during our audit we cUd not identify any deficiencies in internal control that we consider to be material weaknesses. However, material wealaiesses may exist that have not been identified.
Compliaoce and Other Matters
As part of obtaining reasonable assurance about whether the Board's financial statements are free of material misstatement, we performed tests of its compliance with certain provisions of laws, regulations, contracts, and grant agreements, noncompliance with which could have a direct and material effect on the determination of financial statement amounts. However, providing an opinion on compliance with those provisions was not an objective of our audit, and accordingly, we do not express such an opinion. The results of our tests disclosed no instances of noncompliance or other matters that are required to be reported under Governmem Auditing Standards.
30lh Ploof - Energy Centre • 1100 ?ovdras Street • Ns'.* Orleans, i;^ 70163-3000 • Tel: 504.569.2978
OneGalera Bv'o., Su'te'ilOO • Metaine. LA 70001 • Tel: 504.837,5990 - Fa i: 504.834,3609
Purpose of this Report
The purpose of this report is solely to describe the scope of our testing of internal control and compliance and the results of that testing, and not to provide an opinion on the effectiveness of die entity's internal control or on compliance. This report is an integral part of an audit performed in accordance with Government Auditing Standards in considering the entit>-'s internal control and compliance. .Accordingly, this communication is not suitable for any other purpose. However, under Louisiana Revised Statute 24:513, this report is distributed by the Legislative Auditor as a public document.
New Orleans, Louisiana May 9,2013
2-
P&N
• U ^ M Postlethwaite l l S 3 1 J & Netterville
A .^'nfj^'.i.iiHil /V£i,u.ii*ihir Luipt.f t j t a i > \ I : K at-jd OH'roi i" Pi f>c pol CilTm w Iho L'niud S'o<>:
www.pniipo.catn
REPORT ON COMPLIANCE FOR EACH MAJOR FEDERAL PROGRAM; REPORT ON INTERNAL CONTROL OVER COMPLLVNCE; AND
REPORT ON THE SCHEDULE OF EXPENDITURE OF FEDER.AL AWARD REQUIRED BY 0MB CIRCULAR A-133
To the Members of the Board Sewerage and Water Board of New Orleans:
Report on Compliance for Each Major Federal Program
We have audited Sewerage and Water Board of New Orleans' (tbe Board) compliance with the types of compliance requirements described in the 0MB Circular A-133 Compliance Si^plemenf that could have a direct and material effect on each of the Board's major federal programs for the year ended December 31, 2012. The Board's major federal programs are identified in tbe summaiy of auditors' results section of the accompan>ing schedule of findings and questioned costs.
Management's Responsibility
Management is responsible for compliance with the requirements of laws, regulations, contracts, and grants applicable to its federal programs.
Auditor's Responsibility
Our responsibility is to e.xpress an opinion oo compliance for each of the Board's major federal programs based on our audit of the types of compliance requirements referred to above. We conducted our audit of compliance in accordance with auditing standards generally accepted in the United States of America; the standards applicable to financial audits contained in Government Auditing Standards, issued by the Comptroller General of the United States; and OMB Circular A-133, Audits of States. Local Governments, and Non-Profit Organizations. Those standards and OMB Circular A-133 require that we plan and perform the audit to obtain reasonable assurance about whether noncompliance with the types of compliance requirements referred to above that could have a direct and material effect on a major federal program occurred. An audit includes examining, on a test basis, evidence about the Board's compliance with those requirements and performing such other procedures as we considered necessary ia the circumstances.
We believe that our audit provides a reasonable basis for our opinion on compliance for each major federal program. Hovvever, our audit does not provide a legal determination of the Board's compliance.
Opinion on Each Major Federal Program
In our opinion, the Board complied, in all material respects, with the types of compliance requirements referred to above that could have a direct and material effect on each of its major federal programs for the year ended December 31,2012.
:iOthFlof:!r - Energy Cer Ire • 1100 Poydras Street • New Orleans, LA 70" 63-3000 • Tel; 504,559.2978
One Galleria Blvd,, Suite 210G • Metairie, LA70C01 • Tel: 504.837.5990 • Fa.x: 5C4.B34.3G09
Report on Internal Control Over Compliance
Management of the Board is responsible for establishing and maintaining effective internal control over compliance with the t>pes of compliance requirements referred to above. In planning and performing our audit of compliance, we considered the Board's internal control over compliance with the types of requirements that could have a direct and material effect on each major federal program to determine the auditing procedures that are appropriate in the circumstances for the purpose of expressing an opinion on compliance for each major federal program and to test and report on internal control over comphance in accordance with OMB Circular A-133, but not for the purpose of expressmg an opinion on the effectiveness of internal control over compliance. Accordingly, we do not express an opinion on the effectiveness of the Board's internal control over compliance.
A deficiency in internal control over compliance exists when the design or operation of a control over compliance does not allow management or employees, in the normal course of performing their assigned funaions, to prevent, or detect and correct, noncompliance with a type of compliance requirement of a federal program on a timely basis. A material weakness in internal control over compliance is a deficiency, or combination of deficiencies, in internal control over compliaoce, such that there is a reasonable possibility that material noncompliance with a t>pe of compliance requirement of a federal program will not be prevented, or detected and corrected, on a timely basis. A significant deficiency in internal control over compliance is a deficiency, or a combination of deficiencies, in internal control over compliance with a type of compliance requirement of a federal program that is less severe than a material weakness in internal control over compliance, yet important enough to merit attention by those charged with governance.
Our consideration of internal control over compliance was for tiie limited purpose described in the fu^t paragraph of this section and was not designed to identify all deficiencies in internal control over compliance that might be material weaknesses or significant deficiencies. We did not identify any deficiencies in internal control over compliance that we consider to be material weaknesses. However, material weaknesses may exist that have not been identified.
The purpose of this report on internal control over compliance is solely to describe the scope of our testing of internal control over compliance and the results of that testing based on the requirements of OMB Circular A-133. Accordingly, diis report is not suitable for any other purpose.
Report on Schedule of Expenditures of Federal Awards Required bv OMB Circular A-133
We have audited the financial statements of the Board as of and for the year ended December 31, 2012, and have issued our report diereon dated May 9, 2013, which contained unqualified opinions on those financial statements. Our audit was performed for the purpose of forming our opinions on die financial statements as a whole. The accompanying schedule of expenditures of federal awards is presented for purposes of additional analysis as required by OMB Circular A-133 and is not a required part of the financial statements. Such information is the responsibility of management and was derived from and relates dkectly to the underlying accountbg and other records used to prepare the financial statements. The information has been subjected to the auditing procedures applied in the audit of the financial statements and certain additional procedures, including comparing and reconciling such information directly to the underlying accounting and other records used to prepare the fmancial statements or to the financial statements themselves, and other additional procedures in accordance Vkith auditing standards generally accepted in the United States of America, In our opinion, the schedule of expenditures of
- 4 -
P&N

federal awards is fairly staled in all material respects in relation to the fmancial statements as a whole.
This report is intended solely for the information of the Board, the Board's management and federal awarding agencies and pass-through entities; such as the Louisiana and Legislative .Auditor's Office, and is not intended to be and should not be used by anyone other than these specified parties. However under Louisiana Revised Statute 24:513, this report is distributed by the Legislative Auditor as a public document
New Orleans, Louisiana May 9,2013
5-
P&N
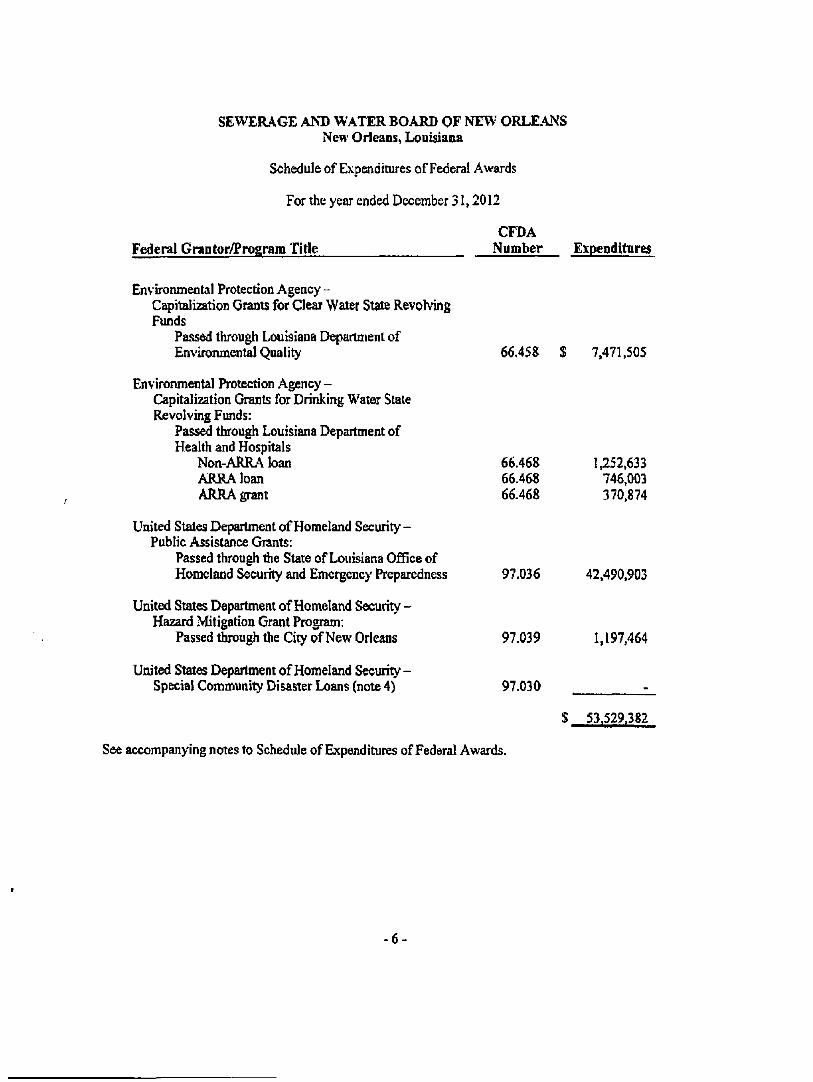
SEWERAGE AND WATER BOARD OF NEW ORLE.\NS New Orleans, Louisiana
Schedule of Expenditures of Federal Awards
For the year ended December 31,2012
CFDA Federal Grantor/Program Title Number Expenditures
Environmental Protection Agency-Capitalization Grants for Clear Water Stale Revoh-ing Funds
Passed through Louisiana Department of Environmental Quality 66.458 $ 7,471,505
environmental Protection Agency -Capitalization Grants for Drinking Water Slate Revolving Funds:
Passed through Louisiana Department of Health and Hospitals
Non-ARFLA loan ARRA loan ARRA grant
66.468 66.468 66.468
1,252,633 746,003 370,874
United States Department of Homeland Security -Public Assistance Grants:
Passed through tihe State of Louisiana Office of Homeland Security and Emergency Preparedness 97.036 42,490,903
United States Department of Homeland Security -Hazard Mitigation Grant Program:
Passed through the City of New Orleans 97.039 1,197,464
United States Department of Homeland Security -Special Community Disaster Loans (note 4) 97.030 -
$ 53.529.382
See accompanying notes to Schedule of Expenditures of Federal Awards.
-6 -

SE\^'ER.\GE AND WATER BOARD OF NEW ORLEANS New Orleans, Louisiana
Notes to Schedule of Expenditures of Federal Awards
December 31,2012
(1) General
The accompanymg Schedule of Expenditiues of Federal Awards presents the activity of the federal awards of the Sewerage and Water Board of New Orieans (the Board), The Board's reporting entitj' is defined in note 1 to the financial statements for the year ended December 31, 2012. All federal awards received firom federal agencies are included on the schedule.
(2) Basis of Accounting
The accompanying Schedule of Expenditures of Federal Awards is presented using the accrual basis of accounting, which is described in note 1 to the Board's financial statements for the year ended December 31.2012.
(3) Relationship to Basic Financial Statements
Federal awards are included in the statement of net assets and the statement of revenues, expenses and changes in net assets as follows:
Operating and maintenance grants S 8,523,429 Capital contributions 35,535,812 Bonds payable 9,470.141
$ 53,529.382
(4) Loans Payable to Federal Agency
The Board received a Special Community Disaster Loan (the "Loan") from the federal government in January 2006. In 2010, the Board was granted a partial forgiveness on the loan in the amount of $36,790,000. The Board was also granted a five year extension in the loan terms. The loan balance as of December 31, 2012 totaled $25,166,747. The terras of the Loan call for interest to accrue at various annual rates to be repaid with the principal when the Loan becomes due during 2016,
The Board entered into an agreement with the Louisiana Department of Health and Hospitals (the Department) whereby the Department has committed to loan the Board up to $3,400,000 to fund the installation of a new sodium hypochlorite storage and feed facility as well as the installation of a new sludge line into the Mississippi River (Project). The loan is to be advanced in incremental amounts as project costs are incurred. The debt will be paid in 20 principal installments. Principal payments of the amount repayable began February 1, 2011. Interest on the bonds is incurred at the rate of 2.95% and payment thereof began August 1,2010 and is due semi-armually thereafter. As of December 31, 2012, the Project has been completed, and the amount of advances totaled $3,113,636, A portion of the LADHH bonds payable is to be fimded whh amounts provided under the American Recoveiy and Rebvestment Act (ARRA), Up to $1,000,000 of the ARRA Loan can be forgiven. The Board received advances of $3,113,636 as of December 31, 2012. Of this amount, $1,000,000 has been forgiven, SI 15,000 has been repaid, and the reraaming balance of 51,998,511 is recorded as bonds payable at December 31,2012.
-7 -

SEWER.AGE AND WATER BOARD OF NEW ORLEANS New Orleans, Louisiana
Notes to Schedule of Expenditures of Federal Awards
December 31,2012
(4) Loans Payable to Federal .Agency (continued)
Reconciliation of total expenditures and outstanding LADHH bonds payable at December 31,2012 is as follows:
Non-ARRA loan ARRA loan Total expenditures Less: Repayments made in 2011 Less: Repayments made in 2012 Total loan balance at December 31,2012
Bonds payable, net of current maturity Bonds payable, current maturity Total bonds payable
The Board entered into an agreement with the Louisiana Department of Environmental Quality (LDEQ) whereby the LDEQ has committed to loan the Board $9,000,000 to fiind sewer main replacements, point repairs, replacement of associated service connections and laterals, server line rehabilitation by cured in-place pipe linmg and manhole rehabilitation. The loan is to be advanced in incremental amounts as project costs are incurred. The indebtedness to the LDEQ will be evidenced through the Sewerage Service Subordinate Revenue Bonds, Series 2011. Annual principal payments will be due beginning November 1, 2013 and continuing through November 1, 2032. Interest on the bonds is incurred at the rate of 0,45%, and the LDEQ administrative fee rate is 0.5%. Interest and administrative fee payments begin on May 1, 2012 and are due semi-annually thereafter. As of December 31,2012, $7,471,505 has been dravwi down on the loan and is recorded as bonds payable.
$ 1,313,636 800,000
2.113,636 (25.000) (90.000)
$
$
s
1,998,636
1,907,636 91,000
1,998,636
-8
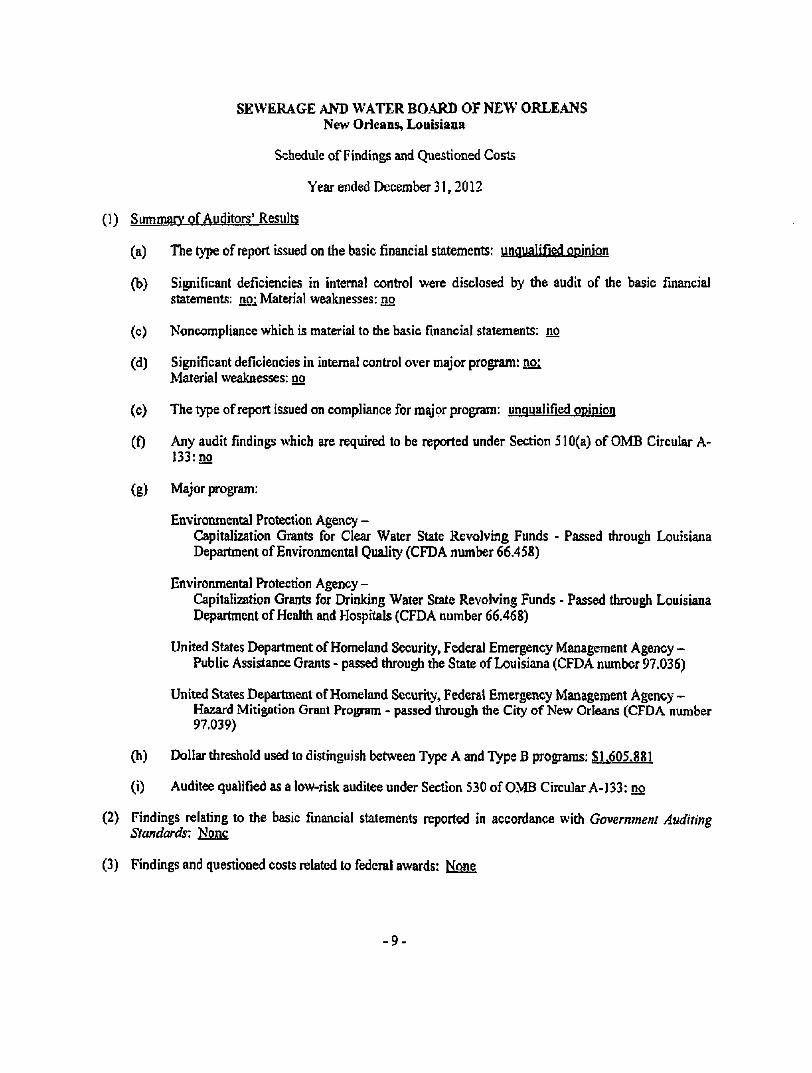
SEWERAGE AND WATER B0.4RD OF NEW" ORLEANS New Orleans, Louisiana
Schedule of Findings and Questioned Costs
Year ended December 31, 2012
(1) Summary of Auditors' Results
(a) The type ofreport issued on the basic fmancial statements: unqualified opinion
(b) Significant deficiencies in internal control were disclosed by the audit of the basic fmancial statements: no: Material weaknesses: no
(c) Noncompliance which is material to the basic financial statements: no
(d) Significant deficiencies in internal control over major program: no: Material weaknesses: no
(e) The type ofreport issued on compliance for major program: unqualified opinion
(f) Any audit findbgs which are required to be reported under Section 510(a) of OMB Circular A-133:no
(g) Major program:
Enviroiunental Protection Agency -Capitalization Grants for Clear Water State Revolving Funds - Passed through Louisiana Department of Environmental Quality' (CFDA number 66.458)
Environmental Protection Agency -Capitalization Grants for Drinking Water State Revolving Funds - Passed through Louisiana Department of Health and Hospitals (CFDA number 66.468)
United States Department of Homeland Security, Federal Emergency Management Agency -Public Assistance Grants - passed through the State of Louisiana (CFDA number 97.036)
United States Department of Homeland Security, Federal Emergency Management Agency -Hazard Mitigation Grant Program - passed through the City of New Orleans (CFDA number 97.039)
(h) Dollar threshold used to distinguish between Type A and TVpe B programs: $1.605.881
(i) Auditee qualified as a low-risk auditee under Section 530 of OMB Circular A-133: QQ
(2) Findbgs relating to the basic fmancial statements reported in accordance with Government Auditing Standards: Nong
(3) Findbgs and questioned costs related to federal awards: None
9-
• i i a i ^ l Postlethwaite i ^ a J & Netterville
A Pa 'fosiionot Accountmg Corporolion Associated Offices in Piincipal Ciltes of ifie United Stoles
www.pncpa.com
May 9, 2013
Members of the Board Sewerage and Water Board of New Orleans
We have audited the financial statements of the Sewerage and Water Board of New Orleans (the Board) as of and for the year ended December 31, 2012 and have issued our report thereon dated May 9, 2013. b plaimbg and performbg our audit of the fmancial statements of the Board, we considered the Board's btemal control over fmancial reporting (mtemal control) as a basis for designbg our auditbg procedures for the purpose of expressmg an opbion on the financial statements but not for the purpose of expressbg an opinion on the effectiveness of the Board's internal control. Accordmgly, we do not express an opinion on the effectiveness of the Board's btemal control.
During our audit of the financial statements of the Board as of and for the year ended December 31, 2011, we became aware of a matter that was an opportunity for strengtiienbg mtemal control. These comments and recommendations were discussed with the appropriate members of management and were blended to improve btemal control and are summarized as follows:
Current Year Comments
None
Status of Prior Year Comments
1. Monitorbg of Investment Credit Ratings
Observation: The Board's Employees' Retirement System bvestment policy guidelbes for bdividual security holdbgs state that for fixed bcome securities, non-rated bonds are not to exceed 1% of any sbgle bvestment manager's portfolio. At December 31, 2011, non-rated securities were 1.08% of the total fixed bcome securities.
Recommendation: The Board should implement policies and procedures to monitor compliance with the Board's policies periodically.
Status: Resolved
This report is intended solely for the information of the Board, the Board's management; federal, state and city awardbg agencies; and the Louisiana Legislative Auditor and is not intended to be and should not be used by anyone other than these specified parties. However, under Louisiana Revised Statute 24:513, this report is distributed by the Legislative Auditor as a public document.
Sbcerely.
Postiethwaite & Netterville, APAC
30th Floor - Energy Centre • 1100 Poydras Street • NewOrleans, LA 70163-3000 • Tel: 504.569.2978
One Galieria Blvd., Suite 2100 • Metairie, LA 70001 • Tel: 504.837,5990 • Fax: 504.834.3609