sewerage and water board of new orleans
TRANSCRIPT

Power Master Plan Sewerage and Water Board of New Orleans
Power Master Plan Report
PPS0122201258NWO | B
March 2020
.
Power Master Plan Report - DRAFT Sewerage and Water Board of New Orleans


Power Master Plan Report
Power Master Plan
Project No:
Document Title:
Document No.:
Revision:
Date:
Client Name:
Project Manager:
Author:
File Name:
SWBNWO08
Power Master Plan Report
PPS0122201258NWO
B
March 2020
Sewerage and Water Board of New Orleans
Amanda Gaze
Sonya Reiser
SWBNO_PMP_Report_RevB_2020Mar06
Jacobs Engineering Inc.
1515 Poydras Street, Suite 1260 New Orleans, Louisiana 70112 United States
www.jacobs.com
© Copyright 2020 Jacobs Engineering Inc. The concepts and information contained in this document are the property of Jacobs. Use or copying of this document in whole or in part without the written permission of Jacobs constitutes an infringement of copyright.
Limitation: This document has been prepared on behalf of, and for the exclusive use of Jacobs’ client, and is subject to, and issued in accordance with, the provisions of the contract between Jacobs and the client. Jacobs accepts no liability or responsibility whatsoever for, or in respect of, any use of, or reliance upon, this document by any third party.
Document history and status
Revision Date Description By Review Approved
A 01/2020 Draft for SWBNO Review SLR CRF AG
B 03/2020 Draft Final Report SLR CRF AG


Power Master Plan Report
PPS0122201258NWO i
Contents Abbreviations, Acronyms, and Definitions .............................................................................................. v
Executive Summary .................................................................................................................................... 1
1. Introduction ................................................................................................................................. 1-1 1.1 Background ...................................................................................................................... 1-1 1.2 Power Master Plan Problem Statement ........................................................................... 1-2 1.3 Evaluation Approach ........................................................................................................ 1-3
2. Right-sizing Analysis .................................................................................................................. 2-1 2.1 Inventory of Existing Assets ............................................................................................. 2-1
2.1.1 Asset Classification ............................................................................................. 2-5 2.1.2 SWBNO Demand Assets .................................................................................... 2-6 2.1.3 SWBNO Generating Assets ................................................................................ 2-8
2.2 Total Required Generation Capacity ................................................................................ 2-9 2.3 Firm Reliable Generation Capacity ................................................................................ 2-10
3. Alternative Development ............................................................................................................ 3-1 3.1 Key Considerations .......................................................................................................... 3-1
3.1.1 Public Welfare ..................................................................................................... 3-2 3.1.2 Efficiency, Sustainability, and Cost of Operation ................................................ 3-3 3.1.3 Equipment Selection ........................................................................................... 3-4 3.1.4 Substation Capacity ............................................................................................ 3-7
3.2 Alternative 0 – Extend Remaining Useful Service Life of Existing Plant ......................... 3-7 3.3 Alternative 1 – Install 50 MW Utility Substation, Reduce Steam Use and Convert
Loads to 60 Hz ................................................................................................................. 3-9 3.4 Alternative 2 – Install 50 MW Substation, Eliminate Steam Use, Add CTGs
and Convert Loads to 60 Hz .......................................................................................... 3-10 3.5 Alternative 3 – Install 50 MW Substation, Eliminate Steam Use, Add Engine Generators
and Convert Loads to 60 Hz .......................................................................................... 3-12 3.6 Alternative 4 – Install 120 MW Substation, Eliminate Steam Use, Add CTGs
and Convert Loads to 60 Hz .......................................................................................... 3-14
4. Comparison of Alternatives ....................................................................................................... 4-1 4.1 Evaluation Factors ........................................................................................................... 4-1
4.1.1 Life Cycle Cost .................................................................................................... 4-1 4.1.2 Improved Reliability / Resiliency ......................................................................... 4-3 4.1.3 Greenhouse Gas Emissions / Sustainability ....................................................... 4-3 4.1.4 Capital Cost ......................................................................................................... 4-4 4.1.5 Elimination of 25 Hz Assets ................................................................................ 4-5 4.1.6 Location ............................................................................................................... 4-5 4.1.7 Operability ........................................................................................................... 4-5 4.1.8 Maintainability ..................................................................................................... 4-6 4.1.9 Stakeholder Impact / Marketability ...................................................................... 4-6
4.2 Evaluation Matrix .............................................................................................................. 4-7
5. Phasing Plan ................................................................................................................................ 5-1 5.1 Basis of Phasing .............................................................................................................. 5-2 5.2 Power Inventory ............................................................................................................... 5-5
6. Recommendations ...................................................................................................................... 6-1
Power Master Plan Report
ii PPS0122201258NWO
Appendixes A Asset Lists B Site Layouts C Summary of Alternatives D Life Cycle Costs E Operation and Maintenance Costs F Sensitivity Analysis G Preliminary Cost Estimate H Phasing Diagrams
Tables
ES-1 Evaluation Matrix .............................................................................................................................. 3 ES-2 Alternative 3 Summary ..................................................................................................................... 4 1-1 Guiding Principles ......................................................................................................................... 1-2 1-2 Key Components and Subcomponents ........................................................................................ 1-3 2-1 Generators Connected to the SWBNO Power Distribution Network ............................................ 2-2 2-2 Frequency Converters Connected to SWBNO Power Distribution Network ................................. 2-3 2-3 Electric Demand Assets by Classification ..................................................................................... 2-6 2-4 Electric Generating Assets by Classification................................................................................. 2-8 2-5 Total Required Generation Capacity by Classification ............................................................... 2-10 3-1 Alternative Requirements .............................................................................................................. 3-1 3-2 Mitigation of Cooling Water Cross-Connection (as described in June 2019 mitigation plan) ....... 3-2 3-3 Drainage Pump Station Upgrades ................................................................................................ 3-5 3-4 Alternative 0 Solutions .................................................................................................................. 3-7 3-5 Alternative 1 Solutions .................................................................................................................. 3-9 3-6 Alternative 2 Solutions ................................................................................................................ 3-10 3-7 Alternative 3 Solutions ................................................................................................................ 3-13 3-8 Alternative 4 Solutions ................................................................................................................ 3-15 4-1 Evaluation Factors and Associated Points.................................................................................... 4-1 4-2 Life Cycle Cost Evaluation ............................................................................................................ 4-3 4-3 Improved Reliability / Resiliency Evaluation ................................................................................. 4-3 4-4 Greenhouse Gas Emissions / Sustainability Evaluation ............................................................... 4-4 4-5 Capital Cost Evaluation ................................................................................................................. 4-4 4-6 Elimination of 25 Hz Assets Evaluation ........................................................................................ 4-5 4-7 Location Evaluation ....................................................................................................................... 4-5 4-8 Operability Evaluation ................................................................................................................... 4-6 4-9 Maintainability Evaluation ............................................................................................................. 4-6 4-10 Stakeholder Impact / Marketability Evaluation .............................................................................. 4-7 4-11 Evaluation Matrix ........................................................................................................................... 4-7 5-1 Phasing Plan Solutions ................................................................................................................. 5-1 Figures
2-1 Power Master Plan Area Boundaries ............................................................................................ 2-2 2-2 Power Master Plan Electric Feeder Routes .................................................................................. 2-4 2-3 SWBNO 24, 25 and 60 Hz Power Distribution Network ............................................................... 2-5 2-4 Power Master Plan Asset Classification Distribution .................................................................... 2-6 2-5 Total Electric Demand Assets by Classification ............................................................................ 2-8 2-6 Total Reliable Generation by Classification .................................................................................. 2-9

Power Master Plan Report
PPS0122201258NWO iii
3-1 Alternative 0 Proposed Generation Assets ................................................................................... 3-8 3-2 Alternative 1 Proposed Generation Assets ................................................................................. 3-10 3-3 Alternative 2 Proposed Generation Assets ................................................................................. 3-12 3-4 Alternative 3 Proposed Generation Assets ................................................................................. 3-14 3-5 Alternative 4 Proposed Generation Assets ................................................................................. 3-16 5-1 Existing Power System Asset Schematic with Power Highways .................................................. 5-4 5-2 25 Hz Power Inventory, Largest 25 Hz Generator Out of Service ................................................ 5-6 5-3 60 Hz Power Inventory, Largest 25 Hz Generator Out of Service ................................................ 5-6 5-4 25 Hz Power Inventory, Largest 60 Hz Generator Out of Service ................................................ 5-7 5-5 60 Hz Power Inventory, Largest 60 Hz Generator Out of Service ................................................ 5-7 5-6 25 Hz Power Inventory, Largest 25 Hz Generator Out of Service, Current State ........................ 5-8


Power Master Plan Report
PPS0122201258NWO v
Abbreviations, Acronyms, and Definitions
CEMS continuous emissions monitoring system
CO carbon monoxide
CO2e carbon dioxide equivalent
CP Contract Package
CTG Combustion Turbine Generator - An electric generator coupled to a combustion turbine as the prime mover - Current units are CTG-5 (25 Hz) and CTG-6 (60 Hz).
CWP Carrollton Water Treatment Plant
Data Historian Electronic data collection and storage system
Diesel Engine Generator
Backup diesel generators located around the SWBNO power network. These units have blackstart capabilities due to local fuel oil storage on site.
Diversity Factor Percentage of maximum demand compared to maximum generating capacity.
DPS Drainage Pump Station
Drainage Pump Station Demand
Power required by pumps at drainage pump stations located at various locations throughout the city.
Dual Fuel Ability of equipment to operate on two types of fuel. (In this case natural gas and diesel).
EMD Electro-Motive Diesel Generator – Current units are EMD 01, 02, 03, 04, and 05
Feeders Medium- and low-voltage cables that connect the power generating sources to the loads or users in the power network.
Firm Generating Capacity (N-1)
Generating capacity of a network of generating units, if the largest unit is unavailable.
Frequency Changer / Converter
Equipment designed to convert the frequency of electricity from 60 Hz to 25 Hz, so the energy can be utilized by existing loads that operate at 25 Hz (conversion from 25 Hz to 60 Hz is also possible).
Fuel Oil Common source of liquid fuel to operate generating assets. Sometime used synonymously with diesel fuel, which is stored on site in a tank near the generator.
Generator SWBNO owned equipment that generates electricity for the SWBNO Power Distribution Network.
GHG greenhouse gas
GWh gigawatt-hour(s)
HMGP Hazard Mitigation Grant Program

Power Master Plan Report
vi PPS0122201258NWO
Hz hertz
IPP Independent Power Producer
Island Mode Operation
Operation of the SWBNO Power Generation and Distribution Network, while disconnected from the utility (i.e., independent from Entergy of New Orleans).
kV kilovolt(s), a measure of electric potential
LCC Life Cycle Cost - Total cost of ownership and operation over 30 years, inclusive of construction cost, purchased fuel and electricity, operation, maintenance and other expenses.
Load/Demand Equipment on the SWBNO Power Distribution Network that requires power to operate (stormwater drainage pumps, potable water pumps, sewage pumps).
Maximum generating capacity
Net amount of power available for use beyond the auxiliary loads of a generating unit.
MW megawatt(s), a measure of power
MWh megawatt-hour(s), a measure of electric energy equivalent to power consumption of one megawatt per hour
MVA megavolt ampere(s), a measure of apparent power in an electrical system
Nameplate generating capacity
Originally-designed capability of a generator connected to a prime mover. Does not consider any limitations which may be imposed by other critical system components such as auxiliary mechanical equipment, power distribution systems or controls.
Natural Gas Common source of fuel to operate generating assets. Natural gas is purchased from the local utility.
NOx nitrogen oxide
Old City Drainage The upriver portion of New Orleans bounded by the parish line between Orleans Parish and Jefferson Parish to the West, the Mississippi River to the South, Lake Ponchartrain to the North, and the Industrial Canal to the East.
PFC Plant Frequency Changer
psig pound(s) per square inch gauge
Redundancy The duplication of critical components or functions of a system to increase reliability. Redundancy prevents a larger system outage from occurring as the result of a single component failure.
Reliability Ability of a system or component to reliably and consistently serve its intended purpose.
Reliable Capacity The expected output from a system or component considering present day condition and external limitations which may be imposed by other critical system components such as auxiliary mechanical equipment, power distribution systems or controls.

Power Master Plan Report
PPS0122201258NWO vii
Resiliency An ability to recover from or adjust easily to change.
RFC Rotary Frequency Changer
RICE reciprocating internal combustion engine
SCADA Supervisory Control and Data Acquisition System
SFC Static Frequency Changer
STG An Electric Generator coupled to a Steam Turbine as the prime mover - Current units are STG-1, STG-3, and STG-4 (all 25 Hz).
Substation Electrical infrastructure and equipment used to transform high voltage electrical power to medium or low voltage power for distribution to consumers.
Sustainability For the purposes of this plan, sustainability refers to a focused mitigation or reduction of environmental impact.
SWBNO Power Distribution Network / System
All of the SWBNO-owned assets connected via a complex system of feeders (generators, frequency convertors, pumps, etc.).
Total Reliable Generating capacity
The sum of the reliable generating capacities of a network of generating units.
WPC West Power Complex


Power Master Plan Report
PPS0122201258NWO ES-1
0
5
10
15
20
25
STG-1 STG-3 STG-4 GTG-5 EMDs GTG-6
Relia
ble
Capa
city
(MW
)
SWBNO Generating Assets
0
10
20
30
40
50
60
25 Hz 60 Hz
Dem
and
(MW
)
SWBNO Demand Loads
Drainage Sewer Potable Potable Backup
Executive Summary STUDY OBJECTIVE: Identify, evaluate, and select the most beneficial alternative that addresses the goals included in the project Problem Statement.
STUDY RESULTS: The most beneficial alternative considers: (1) A new Entergy substation, which acts as the single interconnection point for all SWBNO demand loads; (2) Elimination of steam use for power generation; (3) Retirement of all 25 Hz generating assets, and addition of new 60 Hz generating assets; and (4) Conversion of all demand loads to 60 Hz.
EXISTING SYSTEM
The Sewerage and Water Board of New Orleans (SWBNO) is the agency responsible for the reliable operations and maintenance of three utility systems which are critical to the residents of New Orleans. These systems include drinking water treatment and pumping, sewer collection and treatment, and stormwater drainage. Each system requires a reliable and resilient source of electric power to operate effectively. Loss of electric power to any segment of these systems can result in conditions that compromise the health and safety of the residents of New Orleans. Currently, energy is provided by two main sources:
• SWBNO self-generation: SWBNO Power Distribution Network (25 Hz and 60 Hz)
• Entergy of New Orleans: Multiple connection points to purchase 60 Hz energy and natural gas.
PROBLEM STATEMENT
The Sewerage and Water Board of New Orleans is conducting a study to assess the needs and capabilities of the existing power generation and distribution network with a goal of defining an economic, efficient, and sustainable path toward modernizing and improving its electrical power system to meet all power demands with adequate redundancy and robust resiliency. The study results will be presented in a Power Master Plan, which will outline a path to the most reliable, resilient, and efficient energy use through a combination of self-generation and electricity purchase. The Power Master Plan will emphasize elimination of the current cooling water cross-connection and steam production, while transitioning away from 25 Hz to 60 Hz power production and use.
SWBNO POWER DISTRIBUTION NETWORK EXISTING ASSET INVENTORY
25 Hz Total Generation = 61.5 MW
Total Connected Demand Loads = 51.6 MW Max Instantaneous Demand Loads = 50.1 MW
60 Hz Total Generation = 22 MW
Total Connected Demand Loads = 16.6 MW Max Instantaneous Demand Loads = 9.1 MW

Power Master Plan Report
ES-2
ASSET CLASSIFICATION
RECOMMENDED GENERATION CAPACITY
This study focuses on the emergency scenario when Entergy is unavailable and all critical assets must be powered by SWBNO generating assets. This scenario is referred to as Island Mode Operation. In Island Mode, SWBNO should maintain enough generation capacity to meet the Total Required Generation Capacity even when the largest generation asset is unavailable due to a planned or unplanned outage. This is referred to as the Firm Reliable Generation Capacity.
Based on an evaluation of current loads and demands, it is recommended that the Firm Reliable Generation Capacity be maintained at a minimum of 77.3 megawatts (MW). Jacobs further recommends that SWBNO consider provisions for future generation capacity to allow for the connection of additional pumping stations that are geographically located near the existing Power Distribution Network feeders (Asset Classification 2). This will require a Future Firm Reliable Generation Capacity of 88.3 MW.
The following Firm Reliable Generation Capacity values have been used to develop the Power Master Plan alternatives:
Minimum Present Firm Reliable Generation Capacity = 77.3 MW Minimum Future Firm Reliable Generation Capacity = 88.3 MW
Class 1 - Asset is currently connected to the SWBNO Power Distribution Network
Class 1a - Asset is not on SWBNO Network but located at a pump station which is on SWBNO Network. Any 60 Hz asset not serviced by Central Control, but at a 25 Hz station.
Class 2 - Asset is not on SWBNO Network; there is SWBNO feeder near.
Class 3 - Asset is not on SWBNO Network.

Power Master Plan Report
PPS0122201258NWO ES-3
ALTERNATIVES EVALUATION
Jacobs developed five alternatives that meet the key components included in the SWBNO Power Master Plan Problem Statement. The alternatives were developed based on the evaluation of feasible options including Alternative 0, which is defined as a base case with the addition of essential upgrades to ensure ongoing and reliable operations of the Carrollton Water Plant to meet the basic threshold of reliable power.
During the Alternative Review Workshop with Jacobs and SWBNO on November 6, 2019, each alternative was evaluated and ranked against one another using an evaluation matrix. The results are presented in Table ES-1.
Table ES-1. Evaluation Matrix
Evaluation Factors Max Points
Evaluation Points Assigned to Each Alternative
0 1 2 3 4
Life Cycle Cost 35 0 35 28 32 18
Reliability /Resiliency 25 0 12.5 25 25 25
GHG Emissions /Sustainability 10 0 6 8 10 8
Capital Cost 5 5 3.5 2.5 2.5 2.5
Elimination of 25 Hz 5 0 2.5 5 5 5
Location 5 0 4 4 4 5
Operability 5 0 0 2.5 5 2.5
Maintainability 5 0 0 5 2.5 5
Stakeholder Impact 5 0 0 5 5 5
TOTAL 100 5 63.5 85 90.5 75.5
Capital Cost $508,271,000 $535,360,000 $575,672,000 $573,026,000 $579,040,000
Life Cycle Cost $1,071,115,000 $812,657,000 $830,146,000 $828,190,000 $886,671,000
LCC Savings $0 $258,458,000 $240,969,000 $242,925,000 $184,444,000
GHG Emissions (tons/yr) 120,232 79,832 78,116 77,788 77,820
tons/yr = tons per year
Based on this evaluation, Alternatives 2 and 3 are the best available options, with a reciprocating internal combustion engine (RICE) engine solution (Alternative 3) assessed as slightly more favorable than a combustion turbine solution, primarily due to cost and operational flexibility.
Alternative 0: Baseline
Alternative 1: New Substation, Reduce steam use; Convert demand to 60 Hz
Alternative 2: New Substation, Eliminate steam use Three new 22 MW CTGs Convert demand to 60 Hz
Alternative 4: New Larger Substation, Eliminate steam use Three new 22 MW CTGs Convert demand to 60 Hz
Alternative 3: New Substation, Eliminate steam use Three new 18 MW RICE
units Convert demand to 60 Hz

Power Master Plan Report
ES-4
0
5
10
15
20
25
0 0 0 012.5
2210.4
18 18 18MW
Alternative 3 Proposed Generation Assets
New 60 HzExisting 60 HzExisting 25 Hz
RECOMMENDED ALTERNATIVE
In Alternative 3, purchased utility power is the primary source of energy via a dedicated substation, and SWBNO Generation is needed only during significant rain events or when utility power is unavailable. This alternative eliminates all existing steam turbine generators and adds three new engine generators at a new West Power Complex.
Table ES-2 below outlines how Alternative 3 addresses the Key Components of the study.
Table ES-2. Alternative 3 Summary Key Component Solution
Public Welfare
Cooling Water System Cross-connection would be eliminated by the retirement of all existing cross-connected equipment.
Island Mode Operation The capacity of the new West Power Complex will exceed the system load by about 5 MW even if one generator is out of service.
Greenhouse Gas Emissions and Pollution Control
This option produces an estimated 77,800 tons per year of GHG emissions compared to 120,200 tons per year with Alternative 0. Each option will comply with applicable state and federal laws for emissions from generating equipment.
Efficiency, Sustainability and Cost of Operation
Reduced Steam Generation / Natural Gas Purchase
Retire all steam generation and use. Natural gas purchase would only be required when power demand exceeds substation capacity and SWBNO generating assets are running, or in an emergency situation when Entergy is not available.
Equipment Selection
Generating Assets Install three new Wartsila 18V50DF dual fuel engine generators with an approximate capacity of 18 MW each. Retire STG-1, STG-3, STG-4, Combustion Turbine Generator No. 5 (CTG-5), and boiler plant.
Frequency Conversion Install three 25 MW capacity static frequency changers (SFCs) (75 MW total capacity) to allow for retirement of T-1, T-3, T-4, T-5, and the boiler plant after new 60 Hz generators are installed but before drainage pump systems are converted to 60 Hz.
Electric Demand Assets Replace all 25 Hz pump motors with new 60 Hz motors and gearboxes installed above maximum considered flood elevation. This work will need to be phased over multiple years.
SWBNO Network Feeders All remaining 6.6 kV feeders in the SWBNO Power Distribution Network not previously replaced in the Hazard Mitigation Grant Program project will be replaced with new 13.8 kV feeders.
Substation Capacity
Entergy Feeders Install a new Entergy substation with 50 MVA total capacity All SWBNO generating assets become backup only for when Entergy is not available, or demand exceeds substation capacity.
CTG = combustion turbine generator; kV = kilovolt(s); MVA = megavolt(s) ampere; STG = steam turbine generator

Power Master Plan Report
PPS0122201258NWO ES-5
POWER SYSTEM PHASING
The phasing plan presented in this report considers installation of the new West Power Complex, including a new substation, new generators, and new SFCs with a clear point of demarcation before the rest of the assets are transitioned. The strategy is adaptable and may need to be modified to accommodate the availability of funding, coordination with other related projects, availability of qualified local contractors, and many other factors which are currently unknown.
Phase Description Detail
Baseline Existing power inventory, considering the operational status of all assets in November 2019
Phase 1A Installation of 25 MW SFC Add one 25 MW SFC.
Phase 1B Construction of West Power Complex Add two more 25 MW SFCs (one standby); install T7, T8, T9, and 60 Hz ring bus.
Phase 1C Retire All 25 Hz Steam Power Generation Turbines
Remove T1, T3, T4, and T5 and all associated equipment.
Phase 2A Convert Drainage Pump Stations to 60 Hz Connect Diesel Generators at Drainage DPS-6 and DPS-7; convert DPS-6, -7 (partial), -12, and -17 (partial) to 60 Hz.
Phase 2B Convert Drainage Pump Stations to 60 Hz and DPS-5 to an Independent Station
Convert the rest of DPS-7 to 60 Hz; connect Pritchard and I-10; Convert DPS-5 to an independent station.
Phase 2C Convert Drainage Pump Station to 60 Hz Connect Diesel Gen at DPS-19; Convert DPS-1 and DPS-2 (partial) to 60 Hz.
Phase 2D Convert Drainage Pump Station to 60 Hz and Retire Frequency Changers
Convert the rest of DPS-2, DPS-3, DPS-4, Panola, and Claiborne pump stations to 60 Hz; retire the Carrollton frequency changers and the Station D frequency changers.
The following graphs summarize the status of the 25 Hz assets and 60 Hz power inventory through the proposed phases of the power system. The Power Inventory Graphs represent the SWBNO available generation capacity when considering the largest 25 Hz generator out of service and the largest 60 Hz generator out of service. The proposed phasing shows that there is currently a generation capacity deficit, but that excess capacity is achieved and maintained through the multiple construction phases.

Power Master Plan Report
ES-6
RECOMMENDATIONS/NEXT STEPS
Based on the findings presented in this Power Master Plan report, the following items are recommended as next steps:
• Finalize negotiations on the new Entergy substation, and begin construction.
• Complete the work that is currently in progress:
– 1370A Switchgear / Transformer Project
– Procurement and installation of a new 25 MW SFC
– Upgrades to T-6 to allow for cold weather operation
• Begin preparation of performance specifications for major long-lead time equipment.
• Prepare a conceptual level design to accommodate updated cost estimates of preferred alternative to be used in financing discussions.
• Refine phasing of preferred alternative to mitigate loss of T-5.

Power Master Plan Report
PPS0122201258NWO 1-1
1. Introduction 1.1 Background
The Sewerage and Water Board of New Orleans (SWBNO) is the agency responsible for the reliable operations and maintenance of three utility systems which are critical to the residents of New Orleans. These systems include drinking water treatment and pumping, sewer collection and treatment, and stormwater drainage. Each system requires a reliable and resilient source of electric power to operate effectively. Loss of electric power to any segment of these systems can result in conditions that compromise the health and safety of the residents of New Orleans.
At the request of SWBNO, Jacobs developed and evaluated alternatives for power generation and Power Distribution Network improvements supporting the water, sewer, and drainage systems currently powered from the existing Carrollton Power Plant. The existing power distribution infrastructure is highly complex and extends to various pumping stations throughout the City. Many of the system components were constructed more than 100 years ago and are in immediate need of upgrades, modifications or replacement. The goal of the study is to identify the optimal strategy to improve the long-term reliability, resiliency, efficiency and sustainability of electric power to these critical systems.
To commence the study, Jacobs collected and reviewed the following historical studies and design documents prepared by various entities working on the SWBNO Power System:
• SWB Phase I Power Study, 1974 – Ford, Bacon, Davis • SWB Phase II Power Study, 1974 – Ford, Bacon, Davis • Power Study, 1994 – CH2M HILL • Power System Bid Package, 2000 – CH2M HILL • CP-1372 (T5) Specifications & Drawings, 2015 – Black and Veatch • CP-1373 (T3 Refurbishment) Specifications & Drawings, 2015 – Black and Veatch • Substation Estimate, 2016 – Entergy of New Orleans • City of New Orleans Root Cause Analysis Draft Report, 2018 – ABS Group • Power Alternatives Assessment, 2018 – Jacobs • Drainage System Conditions Assessment, 2018 – Veolia • Cooling Water System Analysis and Results, 2019 – Jacobs • DRAFT Resilience-Inclusive Cost Benefit Analysis of Microgrids for New Orleans, LA, 2019 – Sandia
National Laboratory
Additionally, Jacobs facilitated discussions with SWBNO operations staff, and attended tours of the power house and drainage pump stations (DPS) as noted:
• Discussions with SWBNO Boiler Plant Operations Staff • Discussions about ongoing and upcoming projects in the SWBNO system • Discussion on SWBNO Overall Operations with SWBNO’s Chief of Operations • Discussion on Drainage System and DPS Emergency Generation with SWBNO Engineering • Tour of DPS 6, DPS 7, DPS 17 (Pump Station D), Panola Station • Tour of T-6, Electro-Motive Diesel (EMD) Generators, Power House, High-Lift Building, and Low-Lift
Building
Review of past studies identified that most of the ideas still being assessed today have been evaluated previously, often more than once. The goal of this Power Master Plan is not to repeat work from prior studies. Rather, the intent is to leverage the options previously identified, and advance the assessment of those options to confirm a feasible and optimal path forward for SWBNO, incorporating current inputs and requirements provided by SWBNO as of 2019.
The most recent pre-feasibility power study conducted by Jacobs demonstrated that options which allow for SWBNO to transition from a primary system of power generation to a primary system of power purchase provide the best overall value in terms of life cycle cost (LCC). Therefore, the alternatives

Power Master Plan Report
1-2 PPS0122201258NWO
studied in this report will focus more specifically on feasible solutions that include reliable utility power from Entergy of New Orleans (Entergy), while still maintaining the ability to independently generate enough power to operate all critical systems in emergency situations or when utility power from Entergy may not be available.
Note: During this study, Combustion Turbine Generator Number 5 (CTG-5) was operational and was used in the evaluation of alternatives. On December 14, 2019, after the alternatives had been evaluated, CTG-5 experienced a failure event and is currently no longer operational. Due to the timing of this event, the impacts of this on the power generation portfolio and future are not evaluated in this study. For the purposes of this Power Master Plan, it is presumed that the lost generating capacity will be replaced.
1.2 Power Master Plan Problem Statement
During the Power Master Plan project kickoff meeting on May 29, 2019, the project purpose was established in the form of a problem statement with direct input from SWBNO. The following project Problem Statement provides a key reference point and series of guiding principles for the study.
The Sewerage and Water Board of New Orleans is conducting a study to assess the needs and capabilities of the existing power generation and distribution system with a goal of defining an economic, efficient, and sustainable path toward modernizing and improving its electrical power system to meet all power demands with adequate redundancy and robust resiliency. The study results will be presented in a Power Master Plan which will outline a path to the most reliable, resilient, and efficient energy use through a combination of self-generation and electricity purchase. The Plan will emphasize elimination of the current cooling water cross-connection and steam production, while transitioning away from 25 Hz to 60 Hz power production and use.
Based on the Problem Statement and further discussion with SWBNO during the Project Planning Review meeting on July 10, 2019, Jacobs prepared the following list of Guiding Principles and their relation to the Problem Statement (Table 1-1).
Table 1-1. Guiding Principles No. Guiding Principle Relative to Problem Statement
1 Reliability and resiliency of the proposed solution is critical. Meet all power demands with adequate redundancy and robust resiliency.
2 The proposed solution must include a practical construction plan. It is understood and expected that modifications to existing systems will need to be phased to maintain minimum reliability threshold of the overall system throughout construction.
Define an economic, efficient, and sustainable path toward modernizing and improving its electric power system.
3 Construction cost, energy efficiency, LCC and sustainability are important criteria that will help determine which solution is optimal, but not at the expense of reliability, resiliency or constructability.
Outline a path to the most reliable, resilient, and efficient energy. Meet all power demands with adequate redundancy and robust resiliency.
4 The recommended solution must include provisions to eliminate the current cooling water cross connection. The proposed construction phasing should allow for this work to be complete within 5 years.
Emphasize elimination of the current cooling water cross-connection and steam production.
5 The recommended solution must include provisions to maintain reliability in the absence of utility power (from Entergy) as well as natural gas fuel supply to the plant (i.e., all equipment must be capable of operating on back-up fuel stored on site.)
Outline a path to the most reliable, resilient, and efficient energy use through a combination of self-generation and electricity purchase.
6 The firm capacity of the plant shall be sized to meet the peak demand of any realistic operating scenario that could take place with the loads presently connected. Firm capacity for this project will be defined as the generation capacity of the plant with the largest generator unavailable (N-1).
Meet all power demands with adequate redundancy and robust resiliency. Assess the needs and capabilities of the existing power generation.
7 Prior studies have recommended a migration from 25 Hz power Transition from 25 Hz to 60 Hz power production

Power Master Plan Report
PPS0122201258NWO 1-3
Table 1-1. Guiding Principles
No. Guiding Principle Relative to Problem Statement
production to 60 Hz power production. This migration remains a key objective, but not at the expense of reliability, resiliency, or constructability.
and use while meeting all power demands with adequate redundancy and robust resiliency.
8 SWBNO generally has no preference regarding the combinations of self-generation equipment systems or electric utility interconnections to be evaluated or proposed. Jacobs will provide a brief design narrative to explain why the alternatives selected for the evaluation are the most beneficial.
Outline a path to the most reliable, resilient, and efficient energy use through a combination of self-generation and electricity purchase.
Jacobs organized the Guiding Principles into a table of Key Components and Subcomponents (Table 1-2). A version of this table was prepared for each Alternative, to clearly identify how the specific solutions meet the goals of the Problem Statement.
Table 1-2. Key Components and Subcomponents
Key Component Subcomponent Description
Public Welfare
Cooling Water System Each alternative must eliminate the cooling water cross-connection at the CWP. This is a requirement of the Louisiana Department of Health.
Island Mode Operation Each option must include provisions for 100% Island Mode self-generation to reliably operate all critical systems in a design event in the absence of purchased utility power.
Reduced Greenhouse Gas Emissions and Pollution
Each option must incorporate provisions for reduced greenhouse gas (GHG) emissions compared to the current baseline emission. Each option must comply with applicable state and federal laws for emissions from generating equipment.
Efficiency, Sustainability, and Cost of Operation
Reduced Steam Generation / Natural Gas Purchase
Each option must consider a reduction in steam generation. Steam is generated in the boiler house by burning natural gas and / or diesel fuel. Fuel costs can be reduced by reducing steam production.
Equipment Selection
Generating Assets
Each option studied which combines all loads onto a single 60 Hz Power Distribution Network must maintain a Firm Reliable Generation Capacity of 77.3 megawatts (MW).
Any new generating equipment must produce power at 60 Hz and have duel fuel operating capabilities.
Frequency Conversion The transition plan from 25 Hz generation and use to 60 Hz generation and use may require the inclusion of a frequency converter.
Electric Demand Assets
To meet SWBNO’s long-term system goals, electric demand loads at the drainage pump stations must be converted to 60 Hz and raised above the historic high-water line.
The recommended solution should include any fuel storage or handling modifications required to allow for 7 days of continuous operation without fuel delivery.
SWBNO Network Feeders All existing 6.6 kilovolt (kV) feeders in the SWBNO Power Distribution Network will be replaced with 13.8 kV feeders.
Substation Capacity
Entergy Feeders Each option must consider utility interconnection to a new industrial-grade Entergy substation instead of connection to local residential or commercial utility feeders.
1.3 Evaluation Approach
This report documents Jacobs’ effort in identifying, evaluating, and selecting the most beneficial alternative which addresses the goals included in the project Problem Statement.
Power Master Plan Report
1-4 PPS0122201258NWO
Jacobs’ review of SWBNO system assets facilitated the identification of five alternatives, which generally consider different types and sizes of generators, substation capacity, and incorporation or retirement of existing assets. With SWBNO’s input, an alternative was selected based on pre-determined evaluation factors. The evaluation factors include monetary and non-monetary aspects that align with the project Problem Statement. Finally, a phasing plan was prepared, which outlines a realistic sequence of construction for the selected alternative.
The evaluation approach for the Power Master Plan Alternatives included the following activities further described in the remainder of this report:
• Perform a right-sizing analysis of the SWBNO power system. The intent of the right-sizing analysis is to establish the optimal configuration and size range for the new equipment with consideration of the current and anticipated connected loads.
• Develop the alternatives to be evaluated in the study. The list of alternatives includes a “business as usual” case as a baseline. The other alternatives include proposed updates to the power system to accomplish the goals in the Problem Statement.
• Compare Alternatives. Each alternative has been evaluated based upon several factors which are deemed important to SWBNO and in alignment with the objectives of the Problem Statement. An Evaluation Matrix, including all evaluation factors, scores, and alternatives allows for a quantifiable method of determining the most beneficial alternative. Upon evaluation and discussion with SWBNO, the successful Alternative has been selected.
• Prepare a Phasing Plan for the selected Alternative.

Power Master Plan Report
PPS0122201258NWO 2-1
2. Right-sizing Analysis Entergy, the sole electric and natural gas utility in the city of New Orleans, has stated that it cannot guarantee power during significant tropical weather events. To maintain reliable critical operations, SWBNO requires adequate power to start and operate the potable water, sewer, and drainage pumps. Operation of the existing SWBNO network in Island Mode allows SWBNO to provide Orleans Parish residents confidence that critical services will still operate if the main utility, Entergy, is out of service. To confidently operate in Island Mode, the SWBNO system assets including generators, pumps, frequency converters, and feeders must be reliable and resilient.
The first step in providing a reliable and resilient system is confirming that there is sufficient Generation Capacity available to provide power to all the loads in the system. A clear understanding of the existing connected loads and power generating assets in the SWBNO Power Distribution Network is necessary to determine a recommended Total Required Generation Capacity, which is the basis of each Alternative evaluated in this Power Master Plan. Jacobs completed the following tasks to determine the Total Required Generation Capacity of the SWBNO generating assets:
• Compile a comprehensive inventory of all existing SWBNO assets including generators, pumps, frequency converters, and feeders. The inventory includes a description of the asset, its current location, year installed, capacity, and frequency.
• Identify system classification categories and separate the existing SWBNO assets based on their location in the SWBNO Power Distribution Network.
• Calculate the Total Required Future Generation Capacity of the Carrollton Power Plant. This capacity considers recommended changes in the SWBNO Power Distribution Network, such as the conversion of 25 Hz loads to 60 Hz, the connection of additional drainage pump stations to the network, and the disconnection of others.
• Calculate the minimum Firm Reliable Generation Capacity, which considers the necessary redundancy required for a resilient system.
2.1 Inventory of Existing Assets
Existing SWBNO power assets are located across Orleans Parish in the following areas:
• Old City • Algiers • New Orleans East • Lower 9th Ward
This Power Master Plan study focuses on SWBNO assets that are currently connected to or located near the existing SWBNO Power Distribution Network. Most of these pump stations fall within the Old City area. Old City is defined as the upriver portion of New Orleans bounded by the parish line between Orleans Parish and Jefferson Parish to the west, the Mississippi River to the south, Lake Pontchartrain to the north, and the Industrial Canal to the east. The drainage pump stations included in this area are the original and oldest drainage pump stations in the City. When these pump stations were originally designed and installed in the early 1900s, AC power in the United States was not yet standardized to 60 Hz frequency, and the pumps in the New Orleans system were designed to utilize power at 25 Hz frequency. Now that the United States are standardized to 60 Hz power, it is difficult and often costly to maintain the 25 Hz equipment. Several of the existing pump stations have only 25 Hz-powered equipment, while others have a combination of equipment using both 25 and 60 Hz. Only DPS 19 is solely 60 Hz-powered.
Figure 2-1 identifies the pump stations within the areas of Orleans Parish.

Power Master Plan Report
2-2 PPS0122201258NWO
Figure 2-1. Power Master Plan Area Boundaries
The existing SWBNO Power Distribution Network includes a network of feeders across the Parish that connect the Carrollton Power Plant to drainage pump stations, sewer pump stations, potable water pumping stations, river intake stations, and frequency changers. Loads currently connected to the SWBNO Power Distribution Network primarily run on 25 Hz power distributed from the Carrollton Power Plant. The Power Distribution Network also includes a smaller number of loads at specific pump stations that operate through a local 60 Hz connection to Entergy. Existing rotary-type frequency changers, located at the Carrollton Plant (Plant Frequency Changer), Drainage Pump Station 17 (also referred to as Pump Station D or Central Yard), and the Carrollton Frequency Changer allow for a limited amount of 60 Hz power from Entergy to be converted to 24 Hz power. Note that 24 Hz power (converted from the rotary frequency converters) and 25 Hz power (generated from the existing turbine generators) are different and cannot be combined. Many of the assets were originally installed in the early 1900s and are still operating today.
Tables 2-1 and 2-2 summarize the existing generating assets and frequency converters which provide power to the critical load assets throughout the current SWBNO Power Distribution Network.
Table 2-1. Generators Connected to the SWBNO Power Distribution Network
Hz Location Description Nameplate
Capacity (MW) Reliable Capacity
(MW) Year Installed
25 Carrollton Power Plant STG-1 6 6 1913
25 Carrollton Power Plant STG-3 15 6 1928
25 Carrollton Power Plant STG-4 20 17 1917/1954
25 Carrollton Power Plant CTG-5 20 20 1963
25 Carrollton Power Plant EMD 1-5 12.5 12.5 2018

Power Master Plan Report
PPS0122201258NWO 2-3
Table 2-1. Generators Connected to the SWBNO Power Distribution Network
Hz Location Description Nameplate
Capacity (MW) Reliable Capacity
(MW) Year Installed
60 Carrollton Power Plant CTG-6 22 22 2010
Note: Reliable Capacity considers known constraints to the existing generators. For the purposes of this study, it is assumed that the constraints on CTG-6 (such as cold weather operation and switchgear bus limits) and EMDs (such as shore power, fuel delivery and oil make-up) have been corrected.
Table 2-2. Frequency Converters Connected to SWBNO Power Distribution Network
Hz Location Description Nameplate
Capacity (MW) Reliable
Capacity (MW) Year
Installed
25/60 Plant Frequency Changer (Carrollton Power Plant)
PFC-1 3.75 3.75
24/60 Carrollton Frequency Changer
CFC-1 6 6
24/60 Carrollton Frequency Changer
CFC-2 2.5 2.5
24/60 Station D (DPS 17) FC-3 6 6
24/60 Station D (DPS 17) FC-4 6 6
25/60 Station C (Sewage) FC-1 Frequency converters at Station C and on the Westbank
are SWBNO owned assets, but located outside of the Old City area, therefore not included in this study
25/60 Station C (Sewage) FC-2
25/60 Westbank FC-3
To achieve high reliability of power to the critical infrastructure, both the power generation system and the distribution feeders providing that power must be robust. SWBNO assessed their power feeder system in the past, and some upgrades have been made. Recent testing conducted in 2017 showed a high percentage of the existing feeder system did not pass industry standard quality tests, and feeder failures are still occurring and disrupting power supply to the critical loads. The older feeders in the system are rated for 6.6 kV, while the more recently installed feeders are rated at a minimum of 13.8 kV. It is recommended that any additions or upgrades to the Power Distribution Network include cables rated as 13.8 kV at a minimum, to allow more power to be transferred through the same lines. Figure 2-2 shows the existing feeder network connecting the generating assets to the critical load assets in the SWBNO Power Distribution Network.

Power Master Plan Report
2-4 PPS0122201258NWO
Figure 2-2. Power Master Plan Electric Feeder Routes
Presently, SWBNO’s critical infrastructure includes additional 60 Hz assets (pumps) that are not connected to the feeder Power Distribution Network. These assets are fed from a nearby 60 Hz Entergy feeder with onsite backup diesel generation in most cases. The Entergy connections are via above ground residential or commercial feeds, which are generally unreliable, especially during storm events. Figure 2-3 details the highly complex network of assets (generation, loads, and feeders) connecting SWBNO’s critical infrastructure. This diagram and other documents provided by SWBNO were used to prepare a consolidated asset list, which is included in Appendix A.

Power Master Plan Report
PPS0122201258NWO 2-5
Figure 2-3. SWBNO 24, 25 and 60 Hz Power Distribution Network
2.1.1 Asset Classification
Before any alternatives can be defined, it was imperative to define the Required Generation Capacity for Island Mode operation of the SWBNO Power Distribution Network. Total demand of all electric loads (drainage, potable water, and sewage) connected to the SWBNO Power Distribution Network was identified as the basis of the system’s Required Generation Capacity.
This section includes a summary of existing electric demand assets and available generating assets classified into four categories and displayed on Figure 2-4:
• Classification 1 – Asset is currently connected to the SWBNO Power Distribution Network.
• Classification 1a – Asset is not on SWBNO Power Distribution Network, but is installed in a pump station that is currently serviced by the SWBNO Power Distribution Network, e.g., a 60 Hz asset at a 25 Hz station not serviced by Central Control.
• Classification 2 – Asset is not on SWBNO Power Distribution Network; however, there is an underground feeder in close proximity. Jacobs recommends planning for future addition onto the Power Distribution Network.
• Classification 3 – Asset is not on SWBNO Power Distribution Network, and not recommended for future addition due to isolated location relative to SWBNO Power Distribution Network.

Power Master Plan Report
2-6 PPS0122201258NWO
Figure 2-4. Power Master Plan Asset Classification Distribution
2.1.2 SWBNO Demand Assets
Table 2-3 summarizes the loads at each pump station and how they are currently assigned to each classification. This compilation of assets roughly differentiates between connected demand loads and maximum instantaneous demand where specific pumps do not operate at the same time as other pumps (i.e., back-up pumps).
Table 2-3. Electric Demand Assets by Classification Classification Hz Location Load (kW) 25 Hz Total (MW) 60 Hz Total (MW)
Class 1 Loads currently
connected to the SWBNO
Power Distribution
Network
25
DPS 1 4,300
50.1 max instant 51.6 connected
DPS 2 3,969
DPS 3 6,356
DPS 4 4,625
DPS 5 3,805
DPS 6 9,922
DPS 7 2,163
DPS 11 597
DPS 12 1,492
Oak Street Pump Station 1,492 max use 2,984 connected
Panola Pump Station 3,357
Claiborne Pump Station 2,685

Power Master Plan Report
PPS0122201258NWO 2-7
Table 2-3. Electric Demand Assets by Classification Classification Hz Location Load (kW) 25 Hz Total (MW) 60 Hz Total (MW)
Sewer Station A 1,865
Auxiliary Allowance 2,000
60
DPS 1 1,865 max use 3,730 connected
9.3 max demand 16.6 connected
Oak Street Pump Station 466 max use 932 connected
Panola Pump Station 1,679 max use 3,357 connected
Claiborne Pump Station 1,343 max use 2,685 connected
Low Lift Pump Station 261 max use 522 connected
High Lift Pump Station 1,679 max use 3,357 connected
Auxiliary Allowance 2,000
Total Class 1 51.6 16.6
68.2
Class 1a Loads at
SWBNO pump stations but
currently served by
Energy feeds
60
DPS 4 1,044
14.9
DPS 6 6,565
DPS 7 1,865
DPS 17 3,730
Sewer Station A 1,715
Total Class 1+1a 51.6 31.5
83.1
Class 2 Loads not on
SWBNO network but close to an
existing feeder
60
DPS 19 7,907
11.9 DPS I-10 3,245
DPS Pritchard 764
Total Class 1+1a+2 51.6 43.4
95.0
kW = kilowatt An auxiliary allowance of 2,000 kW 25 Hz and 2,000 kW 60 Hz represents an aggregate of loads too small to tabulate separately.
An additional 24.3 MW of load at Pump Stations 10, 11, 13, 14, 15, 16, 18, 20, Dwyer, Elaine, Grant, Monticello, Industrial Avenue, and all Underpass Stations are included in Classification 3. As noted above, Classification 3 assets are not currently connected to the SWBNO Distribution Network and are not recommended for future addition due to isolated location. Figure 2-5 summarizes the total 25 Hz and 60 Hz electric demand assets by classification.
Note: It is anticipated that the existing feeders which cross the Mississippi River and the Industrial Canal (Feeder 226) will be retired in the foreseeable future, due to difficult maintainability and increased rate of failure. When those feeders are retired, assets at DPS-5 and DPS-11 will no longer be included in the demand asset allocation. However, given the uncertainty in timing of this event, they are included herein for completeness.

Power Master Plan Report
2-8 PPS0122201258NWO
Figure 2-5. Total Electric Demand Assets by Classification
2.1.3 SWBNO Generating Assets
Existing 25 Hz generating equipment includes STG-1, STG-3, STG-4, CTG-5, and the EMDs. The sum of the 25 Hz generation is 73.5 MW (nameplate capacity if all equipment were restored to achieve maximum operational capacity). Due to present-day system constraints and equipment conditions, Jacobs estimates that the current reliable capacity of the existing 25 Hz generating assets is less than the sum of the nameplate capacities. With input from SWBNO, the total reliable capacity of these generating assets is estimated to be approximately 61.5 MW.
Existing 60 Hz generating equipment includes CTG-6 and the backup diesel generators installed at the drainage pump stations. As currently installed, these 60 Hz generation assets all serve segregated loads and cannot be used as redundant backup for one another. The only 60 Hz generation asset currently connected to the SWBNO Power Distribution Network is the 22 MW combustion turbine generator (CTG-6) at the Carrollton Power Plant. It is recommended that the distributed generators be connected to the Power Distribution Network. Under Classification 1a, an additional 10.4 MW of 60 Hz generating assets are located at drainage pump stations which are connected to the existing 25 Hz Power Distribution Network, and can be added to the system. Classification 2 adds another 10.0 MW of distributed generation to the SWBNO system. There is another 21.6 MW of distributed generation within the Classification 3 category, but the added benefit does not outweigh the cost associated with the addition.
Table 2-4 summarizes the generating assets in the SWBNO system and how they are assigned to each classification. Figure 2-6 summarizes the total 25 Hz and 60 Hz generators by classification.
Table 2-4. Electric Generating Assets by Classification
Classification Hz Description / Location Nameplate
Capacity (MW) Reliable Capacity
(MW) Total Reliable
(MW)
Class 1 Generators currently
connected to the SWBNO Distribution
Network
25
STG-1 / Carrollton Plant 6 6
61.5
STG-3 / Carrollton Plant 15 6
STG-4 / Carrollton Plant 20 17
STG-5 / Carrollton Plant 20 20
EMDs / Carrollton Plant 12.5 12.5
60 CTG 6 / Carrollton Plant 22 22 22.0
Total Class 1 83.5
010203040506070
Class 1 (68.2MW)
Class 1a Class 2 Class 3
51.6
16.6
14.9 11.924.3
MW
25 Hz 60 Hz

Power Master Plan Report
PPS0122201258NWO 2-9
Table 2-4. Electric Generating Assets by Classification
Classification Hz Description / Location Nameplate
Capacity (MW) Reliable Capacity
(MW) Total Reliable
(MW)
Class 1a Generators at SWBNO pump
stations but not connected to
SWBNO system
60
Permanent Diesel Generator / DPS 6 7.5 7.5
10.4
Permanent Diesel Generator / DPS 7 2.86 2.86
Total Class 1+1a 93.9
Class 2 Generators not
on SWBNO network but close to an
existing feeder
60
DPS 19 4 4
10.0 DPS I-10 4.7 4.7
DPS Pritchard 1.29 1.29
Total Class 1+1a+2 103.9
Figure 2-6. Total Reliable Generation by Classification
2.2 Total Required Generation Capacity
The Total Required Generation Capacity of the SWBNO generating assets is a critical value in the development of the SWBNO Power Master Plan because it is the base value that is used to determine the minimum Firm Reliable Generation Capacity of each alternative. The Required Generation Capacity value is based on the total load that the generating assets are expected to power at one time and is calculated by multiplying the total connected load by the SWBNO load diversity factor. The total connected load is the total capacity of all electric demand assets (Table 2-3). Since the Problem Statement requires eventual conversion of all assets to 60 Hz, the 25 Hz loads and 60 Hz loads are combined to obtain the total connected load.
𝑻𝑻𝑻𝑻𝑻𝑻𝑻𝑻𝑻𝑻 𝑹𝑹𝑹𝑹𝑹𝑹𝑹𝑹𝑹𝑹𝑹𝑹𝑹𝑹𝑹𝑹 𝑮𝑮𝑹𝑹𝑮𝑮𝑹𝑹𝑹𝑹𝑻𝑻𝑻𝑻𝑹𝑹𝑻𝑻𝑮𝑮 𝑪𝑪𝑻𝑻𝑪𝑪𝑻𝑻𝑪𝑪𝑹𝑹𝑻𝑻𝑪𝑪= (𝑇𝑇𝑇𝑇𝑇𝑇𝑇𝑇𝑇𝑇 25 𝐻𝐻𝐻𝐻 𝐿𝐿𝑇𝑇𝑇𝑇𝐿𝐿 + 𝑇𝑇𝑇𝑇𝑇𝑇𝑇𝑇𝑇𝑇 60 𝐻𝐻𝐻𝐻 𝐿𝐿𝑇𝑇𝑇𝑇𝐿𝐿)𝑥𝑥 𝐿𝐿𝑇𝑇𝑇𝑇𝐿𝐿 𝐷𝐷𝐷𝐷𝐷𝐷𝐷𝐷𝐷𝐷𝐷𝐷𝐷𝐷𝑇𝑇𝐷𝐷 𝐹𝐹𝑇𝑇𝐹𝐹𝑇𝑇𝑇𝑇𝐷𝐷
Load Diversity is the calculated percentage of an actual historical peak load compared to maximum connected load. For the purpose of this Power Master Plan, load diversity has been calculated based on records of historical events, including the May 12, 2019 storm event in which a peak 25 Hz load of 48 MW
0
20
40
60
80
100
Class 1 (83.5MW)
Class 1a Class 2 Class 3
61.5
22
10.4 10 21.6
MW
25 Hz 60 Hz

Power Master Plan Report
2-10 PPS0122201258NWO
was observed. These data were used to calculate a load diversity of 92.0% for the 25 Hz demand assets: 48 MW (peak load) / 51.6 MW (maximum connected load) = 0.93.
Although the historical peak demand of all 60 Hz sources is not known, Jacobs assumes that a similar diversity factor among presently connected 60 Hz loads is appropriate and conservative to assume for the purposes of developing power master plan alternatives. SWBNO has confirmed that this assumption is acceptable given 60 Hz operating history and knowledge.
The Total Required Generation Capacity has been calculated for each asset classification in the asset inventory. For Asset Classification 1, which includes only those 25 Hz and 60 Hz loads which are currently connected to the SWBNO Power Distribution Network, the recommended Total Required Generation Capacity of the Carrollton Power Plant is 63.4 MW.
𝟔𝟔𝟑𝟑.𝟒𝟒 𝑴𝑴𝑴𝑴 = (51.6 𝑀𝑀𝑀𝑀 + 16.6 𝑀𝑀𝑀𝑀)𝑥𝑥 0.93
It is the recommendation of Jacobs that SWBNO consider the generators and loads included in Asset Classifications 1+1a as the baseline requirement to establish the Power Master Plan alternatives. This classification combines all existing loads onto a single 60 Hz Power Distribution Network. When including Asset Classification 1a, the system load is increased to include an additional 14.9 MW of 60 Hz load from drainage Pump Stations 5, 6, and 7. Therefore, it is recommended that the Total Required Generation Capacity be maintained at a minimum of 77.3 MW.
𝟕𝟕𝟕𝟕.𝟑𝟑 𝑴𝑴𝑴𝑴 = (51.6 𝑀𝑀𝑀𝑀 + 16.6 𝑀𝑀𝑀𝑀 + 14.9 𝑀𝑀𝑀𝑀)𝑥𝑥0.93
Jacobs further recommends that SWBNO consider provisions for future generation capacity to allow for the connection of additional pumping stations which are geographically located near the existing Power Distribution Network feeders (Asset Classification 2) - DPS 19, Pritchard, and I-10. The additional 11.9 MW of load from these stations are nearly offset by the 10.0 MW of existing generation located at the Class 2 stations. Once connected, the existing generating assets at these stations will become part of the total generating assets, which contribute to the Total Required Generation Capacity of the 60 Hz Power Distribution Network. When including Asset Classification 2, it is recommended that the Total Required Generation Capacity be maintained at a minimum of 88.3 MW (Table 2-5).
𝟖𝟖𝟖𝟖.𝟑𝟑 𝑴𝑴𝑴𝑴 = (51.6 𝑀𝑀𝑀𝑀 + 16.6 𝑀𝑀𝑀𝑀 + 14.9 𝑀𝑀𝑀𝑀 + 11.9𝑀𝑀𝑀𝑀)𝑥𝑥0.93
Table 2-5. Total Required Generation Capacity by Classification
Classification 25 Hz Total (MW) 60 Hz Total (MW) Diversity Factor Total Required Generation Capacity
(MW)
Class 1 51.6 16.6
0.93
63.4
Class 1+1a 51.6 31.5 77.3
Class 1+1a+2 51.6 43.4 88.3
These calculations and recommendations were reviewed with SWBNO stakeholders at the Interim Alternatives Review Meeting on August 28, 2019. SWBNO concurred with these recommendations as the basis for the Alternatives evaluated in the subsequent sections of this report.
2.3 Firm Reliable Generation Capacity
It is not practical to assume that all equipment can be kept in service concurrently at all times. All mechanical equipment requires planned outages for maintenance and is vulnerable to unplanned outages regardless of condition. As such, it is Jacobs’ recommendation that SWBNO maintain enough generation capacity to meet the Total Required Generation Capacity even when the largest generation asset is unavailable due to a planned or unplanned outage. This is referred to as the Firm Reliable Generation Capacity. Based on the approved Total Required Generation Capacity described above, the following

Power Master Plan Report
PPS0122201258NWO 2-11
minimum Firm Reliable Generation Capacity values will be used to develop the Power Master Plan alternatives:
• Minimum Present Firm Reliable Generation Capacity = 77.3 MW • Minimum Future Firm Reliable Generation Capacity = 88.3 MW
For the purposes of this report, the Minimum Present Firm Reliable Generation value applies to the design of the generation capacity; while the Minimum Future Firm Reliable Generation value applies to the design of the electrical infrastructure such as switchgear, feeders, etc. The future firm value allows for expansion of the power system loads, without replacing the critical electrical infrastructure.


Power Master Plan Report
PPS0122201258NWO 3-1
3. Alternative Development Jacobs developed five alternatives which meet the key components included in the SWBNO Power Master Plan Problem Statement defined in Section 1. The Alternatives were developed based upon the evaluation of feasible options including Alternative 0, which is defined as a base case with the addition of essential upgrades to ensure ongoing and reliable operations of the Carrollton Water Plant to meet the basic threshold of reliable power. The following Alternatives were developed based on the key considerations outlined below:
• Alternative 0 – Extend Remaining Useful Service Life of Existing Plant
• Alternative 1 – Install 50 MW Utility Substation, Reduce Steam Use and Convert Loads to 60 Hz
• Alternative 2 – Install 50 MW Substation, Eliminate Steam Use, Add CTGs and Convert Loads to 60 Hz
• Alternative 3 – Install 50 MW Substation, Eliminate Steam Use, Add Engine Generators and Convert Loads to 60 Hz
• Alternative 4 – Install 120 MW Substation, Eliminate Steam Use, Add CTGs and Convert Loads to 60 Hz
Numerous options for locating new generating equipment were assessed. For efficiency of operation and maintenance, it is recommended that the new substation and generating assets be placed at the same location. Two main options were evaluated including a new West Power Complex (WPC) at the Carrollton site, and addition of assets at DPS 17 / Station D. Station D was removed from consideration due to low site elevation, distance from existing generation infrastructure, and substation hardening requirements. In coordination with SWBNO during the Interim Review meeting on August 28, 2019, it was determined that a new WPC could be developed at the location of the former sludge ponds on the west side of the Carrollton site. This option allows for new generation to be constructed before existing equipment is retired. The WPC would include a new utility substation as well as new generation assets, switchgear, and a power control station. See site layouts in Appendix B for additional information. After completion of the project, the existing power plant facilities could be repurposed for other uses.
3.1 Key Considerations
The Key Components of the project Problem Statement guide the development of the power master plan alternatives. To be considered a viable option, the alternative must include a solution to address the Key Components outlined in Table 3-1, which are further elaborated in this section.
Table 3-1. Alternative Requirements Key Component Solution
Public Welfare
Cooling Water System • Each alternative must eliminate the cooling water cross-connection at the CWP
Island Mode Operation • Each option must include provisions for 100% Island Mode self-generation to reliably operate all critical systems in a design event in the absence of purchased utility power
Greenhouse Gas Emissions and Pollution Control
• Each option must incorporate provisions for reduced GHG emissions compared to the current baseline emissions
• Each option must comply with applicable state and federal laws for emissions from generating equipment.
Efficiency, Sustainability, and Cost of Operations
Reduced Steam Generation / Natural Gas Purchase
• Each option must consider a reduction in steam generation due to the condition of the existing steam plant. Steam is generated in the boiler house by burning natural gas and / or diesel fuel. Fuel costs can be reduced by reducing steam production.

Power Master Plan Report
3-2 PPS0122201258NWO
Table 3-1. Alternative Requirements Key Component Solution
Equipment Selection
Generating Assets • Each option studied which combines all loads onto a single 60 Hz Power Distribution Network must maintain a Firm (N-1) Reliable Generation Capacity of 77.3 MW
• Any new generating equipment must produce power at 60 Hz and have duel fuel operating capabilities
Frequency Conversion • The transition plan from 25 Hz generation and use to 60 Hz generation and use may require the inclusion of a frequency converter.
Electric Demand Assets • Electric demand loads at the drainage pump stations must be converted to 60 Hz and raised above the historic high-water line.
• The recommended solution should include any fuel storage or handling modifications required to allow for 7 days of continuous operation without fuel delivery
SWBNO Network Feeders • All existing 6.6 kV feeders in the SWBNO Power Distribution Network will be replaced with 13.8 kV feeders.
Substation Capacity
Entergy Feeders • Each option must consider utility interconnection to a new industrial-grade Entergy substation instead of connection to local residential or commercial utility feeds
3.1.1 Public Welfare
3.1.1.1 Cooling Water System
Following completion of a cooling water system study in December 2018, SWBNO requested that Jacobs facilitate a Turbine Cooling Water Assessment Workshop to fully understand the impacts from various perspectives and chart a path forward to mitigate the cooling water cross-connection without impacting public health or hindering plant operations. One of the main goals of the workshop was to develop solutions to address the cross-connection. It was determined that changing the source of cooling for the 25 Hz turbines in the existing powerhouse building impacts several other projects and should be part of a larger strategic master plan to address efficiency and reduce risk to the power and potable water systems.
The use of potable water for equipment cooling constitutes an illegal cross-connection between an industrial and potable water system, per the Louisiana Plumbing Code adopted in 2014. The SWBNO has committed to mitigating the connections listed in Table 3-2, and submitted a mitigation plan in June 2019.
Table 3-2. Mitigation of Cooling Water Cross-Connection (as described in June 2019 mitigation plan)
Equipment Connection Short-term Resolution Long-term Resolution
Turbine 1 Condenser cooling water Continuously circulate water within cooling system pipes and install disinfection loop
Retire Turbine 1
Turbine 3 Condenser cooling water Continuously circulate water within cooling system pipes and install disinfection loop
Retire Turbine 3
Turbine 4 Condenser cooling water Continuously circulate water within cooling system pipes and install disinfection loop
Segregate cooling system from the clearwell
Turbine 5 Generator cooling water Send cooling water to drain Segregate cooling system from the clearwell

Power Master Plan Report
PPS0122201258NWO 3-3
These cross-connections need to be eliminated in a timely manner, to meet the requirements of the Louisiana Department of Health. Routing the T5 generator cooling water to drain is complete, and turbines 1 and 3 are the very last to be dispatched in the order of operations. Plans for a disinfection loop for Turbine 4 are currently under development, with options for segregating the Turbine 4 cooling system from the clearwell system to be evaluated later.
3.1.1.2 Island Mode Operation
Entergy has stated that it cannot guarantee power during significant tropical weather events. To maintain reliable drainage operations, SWBNO needs to have adequate power available for starting and operating their large drainage pumps, potable water pumps, and sewage pumps during Island Mode operation.
3.1.1.3 Greenhouse Gas Emissions and Pollution
Greenhouse Gas
GHG emissions are primarily comprised of CO2 and equivalent compounds and are a natural product of the combustion process. The quantity of GHG emitted by a particular process is proportional to the amount and composition of fuel burned. The City of New Orleans Climate Action Plan establishes an ambitious goal of reducing annual GHG pollution by 50% from 2017 levels. This plan is predicated upon citywide use of 100% low-carbon electricity among other strategies. Furthermore, the City has committed to lead by example in taking measurable and consistent steps to reduce GHG pollution from government facilities.
Based on a 2014 inventory of government facilities and operations, the City of New Orleans has calculated their total annual volume of GHG emissions at 204,136 metric tons of carbon dioxide equivalent (CO2e). Of this volume, 62% (approximately 162,500 metric tons) is attributed to the water and wastewater treatment facilities. As documented in the Problem Statement for this Power Master Plan, the goal of this Power Master Plan is to “define an economic, efficient, and sustainable path toward modernizing and improving its electrical power system” and to “outline a path to the most reliable, resilient, and efficient energy use through a combination of self-generation and electricity purchase.”
Pollution Control
Proper planning for emissions control and monitoring equipment should take place prior to development of major equipment requirements to ensure compliance with applicable state and federal regulations. The two most common pollutants associated with power producing facilities are nitrogen oxide (NOx) compounds and carbon monoxide (CO), both of which can be minimized through the use of emission control technology. Coordination with the Louisiana Department of Environmental Quality has not been performed at this time but will be required during design.
The existing power plant equipment has minimal provisions for control of emissions, and is not currently monitored with a continuous emissions monitoring system (CEMS). It is assumed for the purposes of this evaluation that new equipment will require some form of emission controls but likely not CEMS monitoring, since it will be operated primarily as emergency backup to utility power. As such, an allowance for emission control equipment has been included in the cost estimates and in the site layouts in the appendices. For alternatives that include the use of a gas turbine, it is assumed that a dry low-NOx engine design or a water injection system will be sufficient for pollution control. For alternatives that include the use of a reciprocating engine, selective catalytic reduction is assumed to be required.
3.1.2 Efficiency, Sustainability, and Cost of Operation
The total cost of ownership and operation for a power generation facility is greatly dependent upon the efficiency of the process by which power is generated. The environmental impact, also influenced by process efficiency, is greatly impacted by the quantity and types of fuels consumed as well. These factors are closely related, as discussed below.

Power Master Plan Report
3-4 PPS0122201258NWO
3.1.2.1 Sustainability and Renewable Generation
Renewable generation technologies that harvest wind or solar energy could be added to offset the daily consumption of energy, thereby further improving both operational efficiency and environmental sustainability. However, there are physical limits to the amount of energy that can be extracted from a given area of land. Therefore, the biggest constraint to renewable generation will be space available. For example, a photovoltaic solar plant which produces 1 gigawatt-hour (GWh) per year requires approximately 2.8 acres. Excluding all rain events, the base load for constant duty equipment powered from the Carrollton Water Treatment facility is approximately 8 MW, or 70.1 GWh per year. Partnering with Entergy to construct remote renewable generation assets could be a more practical alternative to on-site renewable generation assets which would require SWBNO in-house capabilities to operate and maintain these facilities.
Also, it should be noted that wind or solar generation assets are not suitable for use as a source of emergency backup generation, as the environmental factors they require to produce power are not constantly available. As such, these types of technologies are not included in the inventory of firm capacity assets required to operate the system in an emergency event. These assets can provide significant value to SWBNO’s power portfolio in reducing operating cost and GHG emissions; however, SWBNO does require 100% available power, regardless of environmental condition, to provide power to critical infrastructure, hence the focus in this study is on firm generation power assets.
3.1.2.2 Cost Reduction
Currently steam is generated in the boiler house by burning natural gas and / or diesel fuel. Fuel costs can be reduced by reducing or eliminating steam production and operating more efficient equipment.
The most critical factor that can influence the total cost of ownership and operation for the Carrollton facility relates to the amount of power that needs to be generated on site, which requires fuel and gas consumption. By constructing a dedicated and reliable utility substation, SWBNO can drastically reduce the amount of power produced onsite throughout the year. The reason that the cost of purchased utility power from Entergy is lower than the cost of power generated onsite stems from the diversity of generation sources in Entergy’s portfolio, including the contributions from renewable technologies and nuclear energy.
The second most critical factor influencing the total cost of ownership and operation relates to the cost of operation and maintenance to maintain a state of readiness for emergency events when utility power is not available. These costs can be greatly reduced by replacing the existing inefficient steam generation assets with new dual fuel engine or turbine driven generation equipment. The specific impact of these two factors are evaluated more closely in the subsequent sections for each alternative studied.
3.1.3 Equipment Selection
3.1.3.1 Generating Assets
The two primary generation technologies analyzed include combustion turbine generators and reciprocating internal combustion engine (RICE) generators. Both technologies are well suited to provide the required reliability and efficiency in power generation. Both generation technologies are proven, in wide use in many utility and industrial facilities, and are available with dual fuel capability. It is assumed for all options that seven days of fuel oil reserves will be kept on site as a backup to natural gas.
For the purposes of developing the conceptual cost estimates and equipment layouts in this power master plan, Jacobs selected GE LM2500 as the basis of design for combustion turbine generators. These units provide a power output of approximately 22 MW, which is the same combustion turbine as T-6. Standardizing around this model would have the advantages of familiar operating procedures and for sharing of spare parts, driving efficiency in operations and maintenance of these units. However, other engine manufacturers such as Solar, Siemens and Kawasaki have similar offerings to allow for competitive bid procurement.

Power Master Plan Report
PPS0122201258NWO 3-5
A Wartsila model 18V50DF was selected as the basis of design for the RICE generator. Wartsila currently has the most efficient offering of large capacity, dual fuel reciprocating engines in the market, which would allow SWBNO to install the fewest number of engines required to meet the Total Required Backup Generation Capacity. The 18V50DF provides a power output of 18.0 MW. Using three large capacity units is expected to reduce the total cost of installation and the land area or building footprint required compared to a larger number of smaller capacity units. Jacobs anticipates that other RICE generator manufacturers such as Jenbacher would be willing to provide competitive bids, but the fleet available may require a higher number of smaller capacity units. One notable advantage of RICE engine technology compared to combustion turbines is turn-down ratio (minimum-to-maximum range of operability). Combustion turbines operate most efficiently at or very near their full nameplate capacity, and when operated at partial load, the operating efficiency declines and the emission of GHG and pollutants increases. This can present a substantial constraint to an operations staff when operating a power network in Island Mode, particularly at times when demand is low. The RICE units can be operated efficiently at a percentage of their nameplate capacity to match a given demand load.
3.1.3.2 Electric Demand Assets
Currently, the large drainage pumps powered directly by SWBNO are operated at 25 Hz, 6,600 volts. However, modern electric generators and other electrical equipment are not designed to operate on 25 Hz power; unless designed in a custom configuration, which can add substantial cost. Furthermore, utility power in the United States is delivered at 60 Hz. For these reasons, conversion of the existing system to a 60 Hz Power Distribution Network has been recommended for many decades. Frequency changers (discussed in subsequent section) could help with construction phasing, allowing new 60 Hz generation assets to be installed and existing 25 Hz assets to be retired before converting the loads throughout the drainage pump station network. However, this should be considered a short-term solution. Due to energy losses sustained as a result of frequency conversion and the higher cost of operating and maintaining 25 Hz equipment, this report recommends that all 25 Hz pump motors throughout the drainage pump stations be replaced with new 60 Hz vertical synchronous motors mounted above the maximum considered flood elevation.
Upgrades at the drainage pump stations will be required to be compatible with the transition from 25 Hz to 60 Hz power production from SWBNO. Additional benefits of the 60 Hz pump motor conversion include improved maintenance costs and reduced lead times to source parts with the standardization to modern 60 Hz power.
Table 3-3 summarizes the upgrades that will be necessary for SWBNO to use these drainage pump station assets with 60 Hz power production.
Table 3-3. Drainage Pump Station Upgrades Upgrade Rating / Description
60 Hz Motor for Each Pump Located above base flood elevation
Gearbox for Each Pump Maintain current pump speed after motor conversion
New Motor Switchgear and Soft Starter 4,160 Volts, located above base flood elevation
Transformer(s) Inside Drainage Pump Stations 13.8 kV to 4,160 V, located above base flood elevation
New Feeder Switchgear Bus 13.8 kV, located above base flood elevation
New Feeder Cables Rated for 15 kV Minimum
The phasing of upgrading the drainage pump stations from 25 Hz to 60 Hz must be completed in such a way that:
• Adequate drainage can be performed as required throughout construction. (Pump configurations vary by pump station.)

Power Master Plan Report
3-6 PPS0122201258NWO
• Drainage pump stations are required to be at full capacity during hurricane season (June – November); that is, no pump can be out of service during this time frame.
• Redundant feeders with adequate ampacity for all loads are required.
• All new equipment must be received before work begins at each site to minimize pump down time.
These constraints are meant to protect the residents of New Orleans from flooding due to a large rain event or hurricane while the drainage pump stations are being upgraded.
3.1.3.3 Frequency Conversion
Existing rotary-type frequency changers allow for a limited amount of 60 Hz power to be converted to 24 Hz power. If the capacity for frequency conversion were to be substantially increased, it is reasonable to conclude that new 60 Hz generation assets could be installed and existing 25 Hz assets retired in advance of converting the loads throughout the drainage pump station network to 60 Hz.
Static frequency changer (SFC) sizing for each alternative must be determined by the maximum anticipated transfer of power between the 25 Hz and the 60 Hz electrical distribution systems, in either direction. It is strongly dependent on the Alternative chosen as well as the implementation plan or work phasing strategy ultimately chosen to complete the project. Under each alternative, the largest single generating source is assumed to be out of service during an emergency or maximum demand condition. This operating condition is assumed to occur at the completion of each phase of the project and the energy balance of the system is reviewed at that point. From this analysis, the maximum required power transfer across the SFC is determined.
For alternatives which do not convert the Power Distribution Network to 60 Hz, the connection of additional 60 Hz drainage pump stations to the 25 Hz Power Distribution Network would require new frequency changers and is not recommended.
3.1.3.4 SWBNO Network Feeders
The SWBNO Power Distribution Network is a mixture of 25 Hz and 60 Hz feeders that consist primarily of insulated cable belowground in duct banks with a very limited portion above ground as insulated cable or non-insulated overhead power lines. The physical duct bank infrastructure is a mix of aging tile formed ‘conduits’ and manholes, aging direct buried conduits and brick manholes, and contemporary concrete encased non-metallic conduit and precast concrete manholes. Many of the duct bank alignments are along public rights-of-way. The availability of vacant usable duct bank pathways is limited throughout the system.
The topology of the SWBNO managed Power Distribution Network is a hybrid of radial and looped feeders with multiple multi-feeder interconnection nodes. There are multiple power supply source interconnections throughout the SWBNO managed Power Distribution Network with a few of the major hubs being the Carrollton Water Treatment Plant Power Complex, the Carrollton Frequency Changer, and STA-D (DPS-17) Frequency Changer.
A portion of the SWBNO managed Power Distribution Network feeders have been replaced under the Hazard Mitigation Grant Program (HMGP). However, many more feeders still require replacement, as they exhibit signs of aging beyond their usable life with frequent failures. The nominal voltage of the 25 Hz portion of the SWBNO managed Power Distribution Network is 6600 V while the nominal voltage of the 60 Hz portion of the network is 4160 V. Feeders that have been replaced under the HMGP are 15 kV rated cable operating at 4160 V.
This Power Master Plan recommends replacement of feeders that have not yet been upgraded, and raising the distribution voltage to 13.8 kV in alignment with the upgrades associated with the HMGP. The conversion to a higher distribution voltage will allow more power to be delivered through the same conduits presently installed, garnering efficiencies in the Power Distribution Network.

Power Master Plan Report
PPS0122201258NWO 3-7
3.1.4 Substation Capacity
Another differentiator between the alternatives relates to the capacity of substation to be constructed. Jacobs analyzed two different sizes, a 50 MVA and a 120 MVA. The 120 MVA substation was sized based on the total connected loads of approximately 119 MW in Old City Drainage, allowing for all pumping power to be supplied by the Entergy substation now and in the future. In this scenario, SWBNO could purchase 100% of their power from Entergy on a regular basis, including heavy drainage events. The generation assets would not be needed for any pumping scenario as long as utility power is available. However, a disadvantage of purchasing large amounts of utility power is that SWBNO would incur a larger demand charge, therefore, increasing the total average cost of purchased electricity throughout the entire year.
The 50 MVA sized substation was nominally selected to analyze the potential savings of a smaller substation. This alternative would still be capable of supplying all power required by the SWBNO Power Distribution Network for typical operations up to 50 MW. However, during a peak demand event, the 50 MVA substation would not be able to deliver all the power required. Therefore, SWBNO would need to operate their generation assets during heavy drainage events in parallel with the utility power available. For the purpose of the economic analysis, Jacobs assumed that annual drainage activities requiring power in excess of 50 MVA will occur for approximately 300 hours per year on average.
3.2 Alternative 0 – Extend Remaining Useful Service Life of Existing Plant
Alternative 0 represents the current trajectory of operation and maintenance of the Carrollton Power Plant and Power Distribution Network if existing systems are upgraded to prolong useful service life for 30 years but are not replaced. Previous studies have conclusively demonstrated that continued operation of the power generation and Power Distribution Network as-is is not viable due to age and condition of equipment; therefore, investment is required in order to maintain use of the existing system, and provide an equivalent solution for comparison to the other alternatives in this Power Master Plan evaluation. Table 3-4 outlines how each of the key components of the Problem Statement are addressed in Alternative 0, and Figure 3-1 summarizes the proposed generation assets.
Table 3-4. Alternative 0 Solutions Key Component Solution
Public Welfare
Cooling Water System • A new “river cooling” heat exchanger system will be installed to eliminate the cooling water cross connect at the STG-1, STG-3, and STG-4 condensers.
• A fin-fan cooler would be installed to eliminate the cooling water cross connect at CTG-5
Island Mode Operation • Total Reliable Generating Capacity = 83.5 MW
• Firm Reliable Generating Capacity = 61.5 MW (note that this is less than the recommended value)
• Future Firm Reliable Generating Capacity = N/A (Connection of additional 60 Hz drainage pump stations to 25 Hz Power Distribution Network would require new frequency changers and is not recommended)
Greenhouse Gas Emissions and Pollution Control
• This option produces an estimated 120,200 tons/yr of GHG emissions
• Upgrades to equipment will include emissions controls and/or permitting revisions as required for compliance with state and federal laws
Efficiency, Sustainability and Cost of Operation
Reduced Steam Generation / Natural Gas Purchase
• Steam generation will not be reduced.
• Natural gas purchase will not be reduced.

Power Master Plan Report
3-8 PPS0122201258NWO
Table 3-4. Alternative 0 Solutions Key Component Solution
Equipment Selection
Generating Assets • Major equipment upgrades will be required at STG-1, STG-3 and CTG-5 to extend useful service life and facilitate parallel operation.
• Major upgrades to the boiler house will be required to extend the useful life of the system and to produce additional steam to improve the power output of STG-4.
Frequency Conversion • The existing rotary frequency changer in the plant frequency changer building will be replaced with a minimum 15 MW capacity SFC.
Electric Demand Assets • SWBNO would continue to operate with a power network and drainage pump stations bifurcated into 60 Hz and 25 Hz system components.
• All existing pump motors, switchgear and other electrical components sensitive to floodwaters would be relocated or replaced above the maximum considered flood elevation.
SWBNO Network Feeders • All remaining 6.6 kV feeders in the SWBNO Power Distribution Network not previously replaced in the Hazard Mitigation Grant Program project will be replaced with new 13.8 kV feeders.
Substation Capacity
Entergy Feeders • No new substation.
• The reliability of existing 60 Hz feeders from Entergy would not be improved.
Figure 3-1. Alternative 0 Proposed Generation Assets
0
5
10
15
20
25
30
35
T1 T3 T4 T5 EMDs T6 RemoteDPS
6 6
1720
12.56
15
20 20
12.5
22
0
MW
Alternative 0 Proposed Generation Assets
Existing 60 cycle Nameplate 25 cycle (Reference Only) Existing 25 cycle
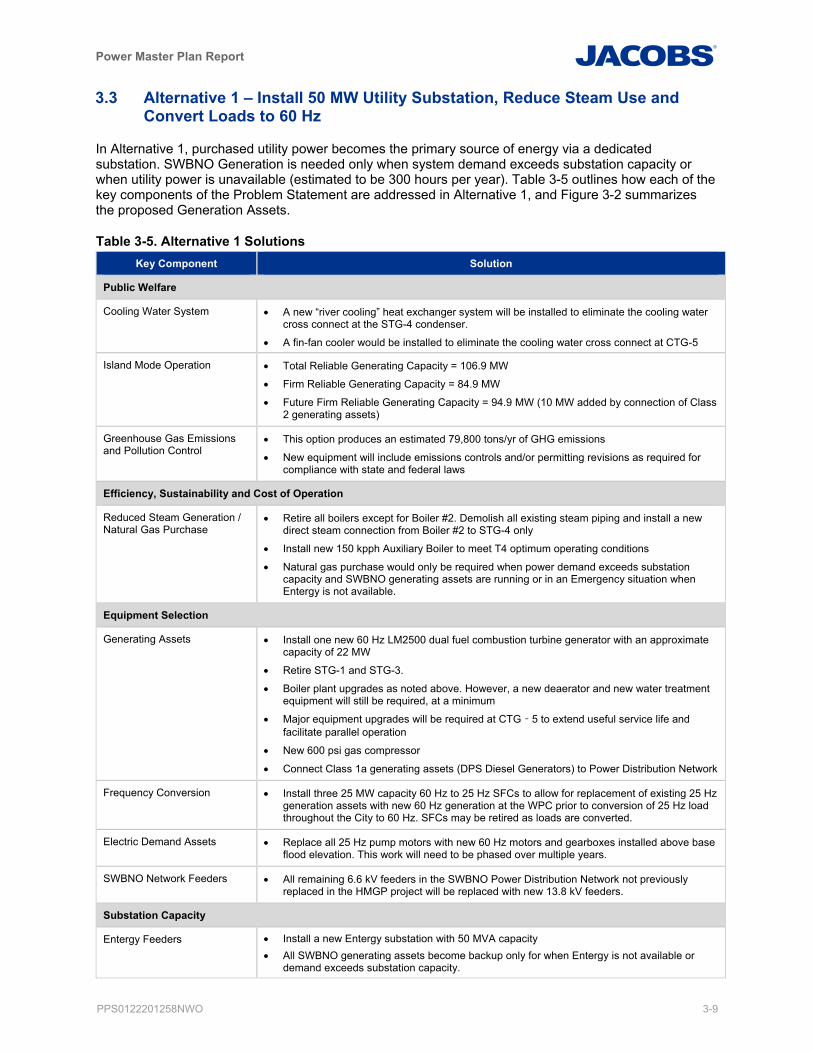
Power Master Plan Report
PPS0122201258NWO 3-9
3.3 Alternative 1 – Install 50 MW Utility Substation, Reduce Steam Use and Convert Loads to 60 Hz
In Alternative 1, purchased utility power becomes the primary source of energy via a dedicated substation. SWBNO Generation is needed only when system demand exceeds substation capacity or when utility power is unavailable (estimated to be 300 hours per year). Table 3-5 outlines how each of the key components of the Problem Statement are addressed in Alternative 1, and Figure 3-2 summarizes the proposed Generation Assets.
Table 3-5. Alternative 1 Solutions Key Component Solution
Public Welfare
Cooling Water System • A new “river cooling” heat exchanger system will be installed to eliminate the cooling water cross connect at the STG-4 condenser.
• A fin-fan cooler would be installed to eliminate the cooling water cross connect at CTG-5
Island Mode Operation • Total Reliable Generating Capacity = 106.9 MW
• Firm Reliable Generating Capacity = 84.9 MW
• Future Firm Reliable Generating Capacity = 94.9 MW (10 MW added by connection of Class 2 generating assets)
Greenhouse Gas Emissions and Pollution Control
• This option produces an estimated 79,800 tons/yr of GHG emissions
• New equipment will include emissions controls and/or permitting revisions as required for compliance with state and federal laws
Efficiency, Sustainability and Cost of Operation
Reduced Steam Generation / Natural Gas Purchase
• Retire all boilers except for Boiler #2. Demolish all existing steam piping and install a new direct steam connection from Boiler #2 to STG-4 only
• Install new 150 kpph Auxiliary Boiler to meet T4 optimum operating conditions
• Natural gas purchase would only be required when power demand exceeds substation capacity and SWBNO generating assets are running or in an Emergency situation when Entergy is not available.
Equipment Selection
Generating Assets • Install one new 60 Hz LM2500 dual fuel combustion turbine generator with an approximate capacity of 22 MW
• Retire STG-1 and STG-3.
• Boiler plant upgrades as noted above. However, a new deaerator and new water treatment equipment will still be required, at a minimum
• Major equipment upgrades will be required at CTG‐5 to extend useful service life and facilitate parallel operation
• New 600 psi gas compressor
• Connect Class 1a generating assets (DPS Diesel Generators) to Power Distribution Network
Frequency Conversion • Install three 25 MW capacity 60 Hz to 25 Hz SFCs to allow for replacement of existing 25 Hz generation assets with new 60 Hz generation at the WPC prior to conversion of 25 Hz load throughout the City to 60 Hz. SFCs may be retired as loads are converted.
Electric Demand Assets • Replace all 25 Hz pump motors with new 60 Hz motors and gearboxes installed above base flood elevation. This work will need to be phased over multiple years.
SWBNO Network Feeders • All remaining 6.6 kV feeders in the SWBNO Power Distribution Network not previously replaced in the HMGP project will be replaced with new 13.8 kV feeders.
Substation Capacity
Entergy Feeders • Install a new Entergy substation with 50 MVA capacity • All SWBNO generating assets become backup only for when Entergy is not available or
demand exceeds substation capacity.

Power Master Plan Report
3-10 PPS0122201258NWO
Figure 3-2. Alternative 1 Proposed Generation Assets
3.4 Alternative 2 – Install 50 MW Substation, Eliminate Steam Use, Add CTGs and Convert Loads to 60 Hz
In Alternative 2, purchased utility power is the primary source of energy via a dedicated substation, and SWBNO generation is needed only when system demand exceeds substation capacity or when utility power is unavailable. This alternative considers eliminating all steam production equipment, steam turbine generators, and CTG-5. Three new combustion turbine generators similar to the existing CTG-6 at the Carrollton Power Plant would be installed to replace this generation capacity. Table 3-6 outlines how each of the key components of the Problem Statement are addressed in Alternative 2, and Figure 3-3 summarizes the proposed Generation Assets.
Table 3-6. Alternative 2 Solutions Key Component Solution
Public Welfare
Cooling Water System • Cross connect concerns would be eliminated by the retirement of all existing cross connected equipment
Island Mode Operation • Total Reliable Generating Capacity = 110.9 MW
• Firm Reliable Generating Capacity = 88.9 MW
• Future Firm Reliable Generating Capacity = 98.9 MW (10 MW added by connection of Class 2 generating assets)
0
5
10
15
20
25
30
35
T1 T3 T4 T5 EMDs T6 DPSDiesel
GELM2500
0 0
20 20
12.5
22
10.4
22
MW
Alternative 1 Proposed Generation Assets
Existing 25 Hz (Refurbished) Existing 60 Hz New 60 Hz

Power Master Plan Report
PPS0122201258NWO 3-11
Table 3-6. Alternative 2 Solutions Key Component Solution
Greenhouse Gas Emissions and Pollution Control
• This option produces an estimated 78,100 tons/yr of GHG emissions
• New equipment will include emissions controls and/or permitting revisions as required for compliance with state and federal laws
Efficiency, Sustainability and Cost of Operation
Reduced Steam Generation / Natural Gas Purchase
• Retire all steam generation and use.
• Natural gas purchase would only be required when power demand exceeds substation capacity and SWBNO Generating assets are running or in an Emergency situation when Entergy is not available.
Equipment Selection
Generating Assets • Install three new LM2500 dual fuel combustion turbine generators with an approximate capacity of 22 MW each
• Three new 600 psi gas compressors
• Retire STG-1, STG-3, STG-4, CTG-5, and boiler plant
• Connect Class 1a generating assets (DPS Diesel Generators) to Power Distribution Network
Frequency Conversion • Install three 25 MW capacity 60 Hz to 25 Hz SFCs to allow for replacement of existing 25 Hz generation assets with new 60 Hz generation at the WPC prior to conversion of 25 Hz load throughout the City to 60 Hz. SFCs may be retired as loads are converted.
Electric Demand Assets • Replace all 25 Hz pump motors with new 60 Hz motors and gearboxes installed above base flood elevation. This work will need to be phased over multiple years.
SWBNO Network Feeders • All remaining 6.6 kV feeders in the SWBNO Power Distribution Network not previously replaced in the HMGP project will be replaced with new 13.8 kV feeders.
Substation Capacity
Entergy Feeders • Install a new Entergy substation with 50 MVA total capacity
• All SWBNO generating assets become backup only when Entergy is not available, or demand exceeds substation capacity.

Power Master Plan Report
3-12 PPS0122201258NWO
Figure 3-3. Alternative 2 Proposed Generation Assets
3.5 Alternative 3 – Install 50 MW Substation, Eliminate Steam Use, Add Engine Generators and Convert Loads to 60 Hz
In Alternative 3, purchased utility power is the primary source of energy via a dedicated substation, and SWBNO Generation is needed only when system demand exceeds substation capacity or when utility power is unavailable. This alternative considers eliminating all steam production equipment, steam turbine generators and CTG-5. Three new engine generators would be installed to replace this generation capacity. This option evaluates the LCC benefit of engine generators in lieu of combustion turbine generators. Table 3-7 outlines how each of the key components of the Problem Statement are addressed in Alternative 3, and Figure 3-4 summarizes the proposed Generation Assets.
0
5
10
15
20
25
30
35
0 0 0 0
12.5
22
10.4
22 22 22
MW
Alternative 2 Proposed Generation Assets
Existing 25 Hz Existing 60 Hz New 60 Hz

Power Master Plan Report
PPS0122201258NWO 3-13
Table 3-7. Alternative 3 Solutions Key Component Solution
Public Welfare
Cooling Water System • Cross connect concerns would be eliminated by the retirement of all existing cross connected equipment
Island Mode Operation • Total Reliable Generating Capacity = 98.9 MW
• Firm Reliable Generating Capacity = 76.9 MW
• Future Firm Reliable Generating Capacity = 86.9 MW (10 MW added by connection of Class 2 generating assets)
Greenhouse Gas Emissions and Pollution Control
• This option produces an estimated 77,800 tons/yr of GHG emissions
• New equipment will include emissions controls and/or permitting revisions as required for compliance with state and federal laws
Efficiency, Sustainability and Cost of Operation
Reduced Steam Generation / Natural Gas Purchase
• Retire all steam generation and use.
• Natural gas purchase would only be required when power demand exceeds substation capacity and SWBNO generating assets are running or in an emergency situation when Entergy is not available.
Equipment Selection
Generating Assets • Install three new Wartsila 18V50DF dual fuel engine generators with an approximate capacity of 18 MW each
• Retire STG-1, STG-3, STG-4, CTG-5, and boiler plant
• Connect Class 1a generating assets (DPS Diesel Generators) to Power Distribution Network
Frequency Conversion • Install three 25 MW capacity 60 Hz to 25 Hz SFCs to allow for replacement of existing 25 Hz generation assets with new 60 Hz generation at the WPC prior to conversion of 25 Hz load throughout the City to 60 Hz. SFCs may be retired as loads are converted.
Electric Demand Assets • Replace all 25 Hz pump motors with new 60 Hz motors and gearboxes installed above base flood elevation. This work will need to be phased over multiple years.
SWBNO Network Feeders • All remaining 6.6 kV feeders in the SWBNO Power Distribution Network not previously replaced in the Hazard Mitigation Grant Program project will be replaced with new 13.8 kV feeders.
Substation Capacity
Entergy Feeders • Install a new Entergy substation with 50 MVA total capacity
• All SWBNO generating assets become backup only for when Entergy is not available, or demand exceeds substation capacity.

Power Master Plan Report
3-14 PPS0122201258NWO
Figure 3-4. Alternative 3 Proposed Generation Assets
3.6 Alternative 4 – Install 120 MW Substation, Eliminate Steam Use, Add CTGs and Convert Loads to 60 Hz
In Alternative 4, purchased utility power is the primary source of energy via a new Entergy substation with 120 MVA total capacity. SWBNO Generation is needed only when utility power is unavailable. This option would likely result in higher charges for standby power capacity, but would also allow SWBNO to use generation assets less frequently during rain events. This option would allow SWBNO to assess the cost benefit of potentially selling power back into the transmission grid when the wholesale price of power is favorable. This alternative considers eliminating all steam production equipment, steam turbine generators and CTG-5. Three new combustion turbine generators similar to the existing CTG-6 at the Carrollton Power Plant would be installed to replace this generation capacity. Table 3-8 outlines how each of the key components of the Problem Statement are addressed in Alternative 4, and Figure 3-5 summarizes the proposed Generation Assets.
0
5
10
15
20
25
30
35
0 0 0 0
12.5
22
10.4
18 18 18
MW
Alternative 3 Proposed Generation Assets
Existing 25 Hz Existing 60 Hz New 60 Hz

Power Master Plan Report
PPS0122201258NWO 3-15
Table 3-8. Alternative 4 Solutions Key Component Solution
Public Welfare
Cooling Water System • Cross-connect concerns would be eliminated by the retirement of all existing cross-connected equipment
Island Mode Operation • Total Reliable Generating Capacity = 110.9 MW
• Firm (N-1) Reliable Generating Capacity = 88.9 MW
• Future Firm (N-1) Reliable Generating Capacity = 98.9 MW (10 MW added by connection of Class 2 generating assets)
Greenhouse Gas Emissions and Pollution Control
• This option produces an estimated 77,800 tons/yr of GHG emissions
• New equipment will include emissions controls and/or permitting revisions as required for compliance with state and federal laws
Efficiency, Sustainability and Cost of Operation
Reduced Steam Generation / Natural Gas Purchase
• Retire all steam generation and use.
• Natural gas purchase would only be required when Entergy is unavailable.
Equipment Selection
Generating Assets • Install three new LM2500 dual fuel combustion turbine generators with an approximate capacity of 22 MW each
• Three new 600 psi gas compressors
• Retire STG-1, STG-3, STG-4, CTG-5, and boiler plant
• Connect Class 1a generating assets (DPS Diesel Generators) to Power Distribution Network
Frequency Conversion • Install three 25 MW capacity 60 Hz to 25 Hz SFCs to allow for replacement of existing 25 Hz generation assets with new 60 Hz generation at the WPC prior to conversion of 25 Hz load throughout the City to 60 Hz. SFCs may be retired as loads are converted.
Electric Demand Assets • Replace all 25 Hz pump motors with new 60 Hz motors and gearboxes installed above maximum considered flood elevation. This work will need to be phased over multiple years.
SWBNO Network Feeders • All remaining 6.6 kV feeders in the SWBNO Power Distribution Network not previously replaced in the Hazard Mitigation Grant Program project will be replaced with new 13.8 kV feeders.
Substation Capacity
Entergy Feeders • Install a new Entergy substation with two 60 MVA peak rated transformers (120 MVA total capacity)
• All SWBNO generating assets become backup only for when Entergy is not available

Power Master Plan Report
3-16 PPS0122201258NWO
Figure 3-5. Alternative 4 Proposed Generation Assets
A comparative summary table of the alternatives is included in Appendix C.
0
5
10
15
20
25
30
35
0 0 0 0
12.5
22
10.4
22 22 22
Alternative 4 Proposed Generation Assets
Existing 25 Hz Existing 60 HZ New 60 Hz

Power Master Plan Report
PPS0122201258NWO 4-1
4. Comparison of Alternatives Each of the alternatives described in this report were evaluated and ranked against one another using an evaluation matrix, during the Alternative Review Workshop with SWBNO on November 6, 2019. Table 4-1 lists the evaluation factors and associated maximum points that were defined during the Workshop and utilized in the evaluation.
Table 4-1. Evaluation Factors and Associated Points Max
Points Evaluation Factor Rank / Reasoning
35 Life Cycle Cost (LCC) (1) SWBNO is interested in a long-term cost-effective solution for critical public health and safety services in Orleans Parish. The optimal solution for the power system will provide an opportunity to re-allocate funds from the aging power system to other infrastructure in the Parish.
25 Improved Reliability / Resiliency
(2) New Orleans’ critical infrastructure is crucial to the health and safety of residents and visitors. Because of its age and condition, the existing power system is unreliable. If a component stops working there is low confidence that it can start again in a timely manner. Confidence in the critical power infrastructure is important to SWBNO.
10 GHG Emissions / Sustainability
(3) Environmental considerations are important in climate change management. The Climate Action for a Resilient New Orleans plan was incorporated into the evaluation criteria.
5 Capital Cost (4) The remaining six evaluation factors contribute an equal weight to the overall ranking. Each of the factors is important to SWBNO, and helps differentiate each of the alternatives. 5 Elimination of 25 Hz Systems
5 Location
5 Operability
5 Maintainability
5 Stakeholder Impact / Marketability
100 Total The maximum amount of points is 100
4.1 Evaluation Factors
4.1.1 Life Cycle Cost
The LCC analysis calculates a total LCC in current-day dollars for each alternative, taking into account capital investment, annual purchased utilities, relative operation and maintenance costs, utility cost escalation, inflation, etc. The following assumptions apply to the LCC analysis:
• It is assumed that the transition of load from existing 25 Hz generation assets to new 60 Hz utility power or backup generation assets will be phased over at least 5 years. The LCC evaluation will be calculated based on an assumed completion date 5 years from now.
• Length of the economic study is 30 years after project completion
• Capital costs for procurement and installation of new plant equipment are spread over 30 years, with a 3.75% interim finance rate.
• Discount rate is 3.75%
• Inflation rate is 3%
• Operation and maintenance escalation rate is 3%
• Utility rate escalations are based on U.S. Department of Energy escalation projections for both natural gas and purchased electricity, specific to the state of Louisiana

Power Master Plan Report
4-2 PPS0122201258NWO
• End-of-year accounting convention is utilized
• It is assumed that backup (diesel) fuel will only be consumed when natural gas is unavailable. Because the loss of natural gas supply is unlikely to occur often, the use of backup (diesel) fuel is not considered in the analysis.
• Tax implications are not considered
LCC results (presented in Appendix D) summarize the spreadsheet-based analysis completed for each alternative. The Alternative 0 model includes major necessary upgrades to the existing plant and to the pump stations as required to achieve the fundamental goals of the project such as improved reliability, elimination of cooling water cross connections, etc. Without these Alternative 0 upgrades, the existing plant would be unreliable and inadequate to continue serving the current drainage load demand. This alternative is an important benchmark against which the cost and economic performance of other alternatives can be compared and evaluated.
For purposes of comparison, major generating equipment maintenance costs are based on Long Term Service Agreement (LTSA) budget quotes from the equipment manufacturers. It is understood that this is not necessarily the contractual mechanism by which this work will be done by SWBNO. The estimated cost of operation and maintenance for each option includes an approximation for the number and type of personnel required and the approximate cost per employee to adequately operate and maintain the on-site power generation systems at the Carrollton Power Plant and/or a new WPC. It does not attempt to capture the cost of operation and maintenance of other SWBNO-owned systems such as water treatment facilities, water distribution systems, or remote stormwater drainage and sewer pumping stations (Appendix E). Cost savings resulting from efficiencies gained with pump motor upgrades are not included in this analysis but should be considered in future master planning efforts.
The LCC analysis considers the cost of electric utilities. The 2018 utility bill spreadsheet provided to SWBNO from Entergy identifies multiple rate structures used to calculate charges for SWBNO’s various utility accounts. For the purpose of this evaluation, the cost and consumption of electric energy and natural gas for Alternative 0 is assumed to continue accordingly. Based on a meeting with SWBNO and Entergy on October 3, 2019, Entergy cannot definitively say what rate structure would be utilized to calculate the cost of utility power from the planned transmission level substation. However, two published rate structures were discussed as likely candidates. These include the High Voltage Service rate schedule (HV-24) and the Large Interruptible rate schedule (LIS-13). For the purpose of this analysis, Jacobs created a load profile based on the connected load and the estimated minimum connected load, along with the total kilowatt-hours purchased and produced in 2018. Both rate schedules were applied to Alternatives 1 through 4, and an associated LCC was calculated. Details of the analyses are included in Appendix E.
In addition to the baseline LCC comparison, the spreadsheets created for this evaluation allow for each option to be subjected to a sensitivity analysis to verify the stability of the LCC savings against unforeseen fluctuations in purchased utility costs. The intent of this analysis is to provide greater confidence that the recommended plant configuration will result in economic benefit to SWBNO over a broad range of potential market volatility as well as changes in utility rate structures. The following values may be manipulated with instant recalculation of LCC:
• Increased/decreased escalation of the fuel gas rate
• Increased/decreased escalation of the electric rate
A graphical representation of the sensitivity analysis is included in Appendix F. Based on the calculations, a fluctuation in the cost of fuel gas has the greatest impact on the LCC savings of each alternative, primarily due to the present day (Alternative 0) sensitivity to fuel cost.
Each alternative was ranked based on the LCC evaluation factor, and points were assigned based on the following six criteria listed in Table 4-2. The LCC contributes about 35% to the total evaluation.

Power Master Plan Report
PPS0122201258NWO 4-3
Table 4-2. Life Cycle Cost Evaluation Points Criteria
35 Lowest Cost Option
31.5 Within 2% of Lowest Cost Option
28 Within 4% of Lowest Cost Option
24.5 Within 6% of Lowest Cost Option
17.5 Within 10% of Lowest Cost Option
0 >10% Above Lowest Cost Option
4.1.2 Improved Reliability / Resiliency
Reliability describes the ability of a system or component to function under stated conditions for a specified period of time. Reliability is closely related to availability, which is typically described as the ability of a component or system to function at a specified moment or interval of time. Resilience is an ability to recover from or adjust easily to unforeseen events or change. This Plan addresses resilience by including a dependable connection to Entergy at a new substation as well as generator redundancy in the SWBNO system.
Reliability of each alternative was based on the following factors:
• Type of generating equipment – steam turbines vs. combustion turbines vs. reciprocating generators
• Equipment age – older equipment is less reliable
• Estimated equipment run time – day-to-day operation vs. operation during rain events vs. operation during Island Mode only
• Ease of operation and maintenance
• Availability of skilled talent
• Availability of spare parts
Each alternative was ranked based on the Improved Reliability / Resiliency evaluation factor, and points were assigned based on the criteria listed in Table 4-3. Improved Reliability / Resiliency contributes about 25% to the total evaluation.
Table 4-3. Improved Reliability / Resiliency Evaluation Points Criteria
25 Substation Installed All existing equipment (T1, T3, T4, and T5) replaced All steam generation retired
12.5 Substation installed Some existing equipment refurbished (T5 refurbished and power controls upgraded to allow for parallel operation) Some existing equipment (T1 and T3) replaced
0 Equipment refurbished, but not replaced Frequency conversion capacity improved No substation installed
4.1.3 Greenhouse Gas Emissions / Sustainability
Jacobs evaluated the volume of GHG currently being emitted by the SWBNO as a result of thermal energy generated at the Carrollton Power Plant and how those emission quantities would be affected by

Power Master Plan Report
4-4 PPS0122201258NWO
implementing each of the options studied. These calculations do not include GHG emissions attributable to other power-producing plants, power consumed at other substations, or other sources such as transportation emissions. Refer to Appendix D of this report for a summary and comparison of CO2 emissions for each option considered. All options other than Alternative 0 offer a significant reduction in annual GHG emissions.
Utility power in New Orleans is produced at a lower GHG intensity compared to self-generated power at the Carrollton Power Plant today. The utility power originates from many sources which include nuclear power plants in addition to fossil fuel plants and renewable sources. According to data published by the U.S. Energy Information Administration, the GHG emissions created in the production of all utility power in the region averages 1,125 pounds per megawatt-hour (MWh). Because all alternatives contemplated in this Power Master Plan propose the addition of a utility substation, SWBNO will be able to reduce plant emissions by approximately 36,650 metric tons per year (18% of the City of New Orleans calculated metric tons of CO2) simply by purchasing utility power in lieu of self-generation.
Each alternative was ranked based on the Greenhouse Gas Emissions / Sustainability evaluation factor, and points were assigned based on the six criteria listed in Table 4-4. Greenhouse Gas Emissions / Sustainability contributes about 10% to the total evaluation.
Table 4-4. Greenhouse Gas Emissions / Sustainability Evaluation Points Criteria
10 Lowest GHG Option
8 Within 1% of Lowest GHG Option
6 Within 3% of Lowest GHG Option
4 Within 5% of Lowest GHG Option
2 Within 10% of Lowest GHG Option
0 >10% Above Lowest GHG Option
4.1.4 Capital Cost
Preliminary cost estimates presented in Appendix G were prepared for each alternative. These construction cost estimates may have a margin of error of roughly ±30% for the scope of proposed construction. The costs are based on Jacobs’ database of previous project costs and estimates previously prepared for the SWBNO. These costs are prepared on a comparative basis, and should not be considered all-inclusive for an individual alternative. Additional costs for each alternative may include permitting, general site work, site lighting, and costs associated with construction phasing.
Each alternative was ranked based on the capital cost evaluation factor, and points were assigned based on the six criteria listed in Table 4-5. The initial capital cost contributes about 5% to the total evaluation.
Table 4-5. Capital Cost Evaluation Points Criteria
5 Lowest Cost Option
4.5 Within 1% of Lowest Cost Option
4 Within 2% of Lowest Cost Option
3.5 Within 5% of Lowest Cost Option
3 Within 7% of Lowest Cost Option
2.5 Within 10% of Lowest Cost Option

Power Master Plan Report
PPS0122201258NWO 4-5
4.1.5 Elimination of 25 Hz Assets
25 Hz power systems are increasingly becoming more difficult and expensive to maintain, as extremely few systems in the United States continue to operate at this frequency. Furthermore, most of the existing 25 Hz assets at the Carrollton Power Plant, aside from the recently refurbished T4 and the relatively new EMDs, have exceeded their useful service life. Because 25 Hz pump motors cannot operate on utility power without the use of frequency converters, a total transition away from the production and use of 25 Hz assets can substantially simplify the SWBNO system while improving both efficiency and reliability. This transition has been recommended in numerous previous engineering reports dating back to 1974 and remains a fundamental goal of this Power Master Plan. All alternatives except Alternative 0 and Alternative 1 consider complete transition to a 60 Hz system of generation and use.
Each alternative was ranked based on the Elimination of 25 Hz Assets evaluation factor, and points were assigned based on the three criteria listed in Table 4-6. Elimination of 25 Hz Assets contributes about 5% to the total evaluation.
Table 4-6. Elimination of 25 Hz Assets Evaluation Points Criteria
5 All 25 Hz assets (T1, T3, T4, and T5) replaced with 60 Hz generation capacity
2.5 Some 25 Hz assets (T1 and T3) replaced with 60 Hz generation capacity
0 All 25 Hz generation retained
4.1.6 Location
Each alternative was ranked based on the Location evaluation factor, and points were assigned based on the criteria listed in Table 4-7. Location contributes about 5% to the total evaluation. At the request of SWBNO, the cost analysis in this report assumes that new generating equipment will be installed in a new power plant building, though equipment enclosures are also available that would allow for outdoor installation potentially at reduced cost. In either case, acoustic enclosures will be required to mitigate noise transmission and ensure a safe working environment for plant personnel.
Table 4-7. Location Evaluation Points Criteria
5 All generation located at a new WPC, located further from residents Generation assets only operated when Entergy is not available (very rarely)
4 EMD assets near residents rarely operated Generation Assets only operated during drainage events Most Generation Assets elevated
0 Generation assets near residents at existing site, frequently in operation
4.1.7 Operability
Each alternative was ranked based on the Operability evaluation factor, and points were assigned based on the three criteria listed in Table 4-8. Operability contributes about 5% to the total evaluation. The primary operability goals of SWBNO include prompt start-up to respond quickly to weather or power availability events, as well as a significant engine turn-down rate to allow for one primary generator to be able to carry anticipated dry-weather connected load of approximately 6 to 10 MW, within the manufacturer’s recommended operating parameters of the equipment.

Power Master Plan Report
4-6 PPS0122201258NWO
Table 4-8. Operability Evaluation Points Criteria
5 New Engines can be started in less than 5 minutes Capacity of Single New Generator is limited to capacity of largest existing generators (resulting in an equivalent minimum generation capability) New Engine Power output can be turned down to 30%
2.5 New Engines can be started in less than 15 minutes Capacity of Single New Generator is higher than capacity of largest existing generator (resulting in a higher minimum generation capability) New Engine Power output can be turned down to 50%
0 Start-up requires heating up steam boiler - more than 1 hour
4.1.8 Maintainability
Each alternative was ranked based on the Maintainability evaluation factor, and points were assigned based on criteria listed in Table 4-9. Maintainability was primarily evaluated based on ease of procuring and storing spare parts, as well as training required for maintenance activities. Maintainability contributes about 5% to the total evaluation.
Table 4-9. Maintainability Evaluation Points Criteria
5 All Steam Generation and Aging Assets Retired, Uniform Engine Fleet
2.5 All Steam Generation and Aging Assets Retired, Diverse Engine Fleet
0 Retain Existing Aging Assets, including steam generation
4.1.9 Stakeholder Impact / Marketability
Significant infrastructure upgrades like those proposed in this Power Master Plan will likely require coordination and agreement among community stakeholders such as public interest groups, members of the political community, and potential funding partners. Some of the factors important to stakeholders may include the following:
• Timing and location of construction activities / temporary inconvenience to the community
• Availability of local jobs and/or workforce development opportunities
• Efficient use of funds and expeditious payback
• Reduced potential of street flooding and boil-water events due to power availability
• Resilience and / or expandability of system relative to climate escalation and/or drainage system expansion
• Environmental stewardship
• Implemented solution is equitable amongst stakeholders
• Solution is both practical and innovative in alignment with coastal city leaders like Singapore and the Netherlands
Each alternative was ranked based on the Stakeholder Impact / Marketability evaluation factor, and points were assigned based on the criteria listed in Table 4-10. Stakeholder Impact / Marketability contributes about 5% to the total evaluation.
Note that the majority of the factors discussed above are already factored into the Problem Statement and alternatives development; therefore, differentiation is based primarily on cost and sustainability.

Power Master Plan Report
PPS0122201258NWO 4-7
Table 4-10. Stakeholder Impact / Marketability Evaluation Points Criteria
5 Minimal Rate Impact Due to LCC Savings Substantial Improvement to Ambient Air Quality and Reduction to GHG Emissions
2.5 Moderate Rate Impact Due to LCC Savings Moderate Improvement to Ambient Air Quality and Reduction to GHG Emissions
0 Significant Rate Increase due to Poor LCC Savings No Improvement or Minimal Improvement to Ambient Air Quality and GGH Emissions
4.2 Evaluation Matrix
An evaluation matrix considering cost and non-cost factors provides an objective method to evaluate multiple alternatives. For this Power Master Plan, Table 4-11 was discussed and completed with SWBNO during the Alternatives Evaluation Workshop on November 6, 2019.
Table 4-11. Evaluation Matrix
Evaluation Factor Maximum
Points Alternative 0 Alternative 1 Alternative 2 Alternative 3 Alternative 4
Life Cycle Cost 35 0 35 28 32 18
Improved Reliability / Resiliency 25 0 12.5 25 25 25
Greenhouse Gas Emissions / Sustainability 10 0 6 8 10 8
Capital Cost 5 5 3.5 2.5 2.5 2.5
Elimination of 25 Hz Systems 5 0 2.5 5 5 5
Location 5 0 4 4 4 5
Operability 5 0 0 2.5 5 2.5
Maintainability 5 0 0 5 2.5 5
Stakeholder Impact / Marketability 5 0 0 5 5 5
Total 100 5.0 63.5 85.0 90.5 75.5
Based on this evaluation, Alternatives 2 or 3 are the best available options, with a RICE engine solution assessed as slightly more favorable than a combustion turbine solution, primarily due to cost and operational flexibility.


Power Master Plan Report
PPS0122201258NWO 5-1
5. Phasing Plan To validate the feasibility of the Power Master Plan, the evaluation team was tasked with preparing a feasible implementation strategy, including a phasing plan that outlines a path for continuous operation throughout construction. A preliminary phasing plan was prepared and discussed with SWBNO which estimated conversion of the entire 25 Hz system within 5 years, and included fewer SFCs. Due to the approximate $500 million cost, SWBNO suggested evaluation of a phasing plan where the 25 Hz demand loads could be transitioned opportunistically as funding becomes available.
The phasing plan presented in this report considers installation of the new West Power Complex including new substation, new generators, and new SFCs with a clear point of demarcation before the rest of the assets are transitioned. The strategy outlined in this document is adaptable and may need to be modified to accommodate the availability of funding, coordination with other related projects, availability of qualified local contractors, and many other factors which are currently unknown. The proposed phasing considers implementation of Alternative 2 or 3, which includes decommissioning all 25 Hz steam turbines, a new substation and three new 60 Hz generating units with a capacity of 18-22 MW each (referred to in the tables below as T7, T8, and T9).
To ensure that adequate emergency backup power is available at all times throughout implementation, the following basic phases prioritize the installation of new generation assets before existing generation assets are retired.
• Baseline: Existing power inventory considering the operational status of all assets in November 2019.
• Phase 1: Initial Work (Construction of new West Power Complex and deployment of new generating assets)
– Phase 1A: Add one 25 MW SFC (Note that SWBNO has already undertaken project planning for this work. Although it is anticipated that this equipment will be located within the existing power plant complex, it is considered new generation so is included in Phase 1.)
– Phase 1B: Add two more 25 MW SFCs (one standby); Install West Power Complex to include New Substation, T7, T8, T9, New Plant Control System and 60 Hz ring bus
– Phase 1C: Remove T1, T3, T4, T5, and all associated equipment.
• Phase 2: DPS Conversions and Power Distribution Network Upgrades (Upon completion of the new WPC, conversion of the loads from 25 Hz to 60 Hz can begin).
– Phase 2A: Connect Diesel Gens at DPS- 6, 7; Convert DPS-6, 7, 12, 17 to 60 Hz
– Phase 2B: Convert more 25 Hz load to 60 Hz
– Phase 2C: Connect Diesel Gen at DPS-19; Convert more 25 Hz load to 60 Hz
– Phase 2D: Convert all remaining 25 Hz load to 60 Hz
Aligning with the alternative evaluation and key Guiding Principles of the study, Table 5-1 identifies how the phasing plan addresses the overall Problem Statement.
Table 5-1. Phasing Plan Solutions Key Components Solution
Public Welfare
Eliminate Cooling Water Cross-Connection
Cross-connect concerns are eliminated when the existing 25 Hz generators are decommissioned at the completion of Phase 1C.
Island Mode Operation Island Mode capability exists today and will remain fully operational throughout construction. At the completion of Phase 1, this capability will transition to the new equipment at the WPC so that the older existing assets can be retired. Existing distributed generators at DPS 6 and DPS 7 will be added to the Power Distribution Network during Phase 2.

Power Master Plan Report
5-2 PPS0122201258NWO
Table 5-1. Phasing Plan Solutions Key Components Solution
Greenhouse Gas Emissions and Pollution Control
GHG emissions are reduced at the completion of Phase 1 once the substation is installed and SWBNO shifts to primarily energy purchase instead of energy production. Additionally, all new equipment installed in Phase 1 will include emissions controls and/or permitting revisions as required for compliance with state and federal laws.
Efficiency, Sustainability and Cost of Operation
Reduced Steam Generation All steam generation and use will be retired at the completion of Phase 1, and natural gas purchase would only be required when Entergy is unavailable or when demand exceeds substation capacity.
Equipment Selection
Generating Assets At the completion of Phase 1, three new turbines or reciprocating engines (T7, T8, and T9) will be in place at the West Power Complex. At the completion of Phase 1C, STG-1, STG-3, STG-4, CTG-5 will be retired. During Phase 1, 50 MW SFC capacity (plus 25 MW redundant backup capacity) will be installed to convert power from the newly installed 60 Hz generating assets to 25 Hz . The SFCs will be required until all 25 Hz loads are converted to 60 Hz at the end of Phase 2.
Frequency Conversion New SFCs will be in place to convert the 60 Hz power for distribution at 25 Hz.
Electric Demand Assets After completion of Phase 1, SWBNO may proceed with the opportunistic replacement of all 25 Hz pump motors, switchgear and other electrical components with new 60 Hz equipment and installation of gearboxes above maximum considered flood elevation. This work will be phased over multiple years. New equipment will be located above the maximum considered flood elevation.
SWBNO Network Feeders Through Phase 2, all remaining 6.6 kV feeders in the SWBNO Power Distribution Network not previously replaced in the HMGP project will be replaced with new 13.8 kV feeders.
Substation Capacity
Entergy Feeders Phase 1 includes installation of a new Entergy substation. Any other Entergy connections may be considered backup only. All SWBNO generating assets will become backup only for when Entergy is not available, or demand exceeds substation capacity.
5.1 Basis of Phasing
The following basis of project phasing was developed to maintain generation at or above demand during each phase.
This plan presented involves an aggressive development of the WPC for several reasons which include the following:
1) The existing power plant systems face a number of challenges related to age, condition, efficiency, and obsolescence that compromise the reliability and resiliency of service to the drainage pump stations. Prompt action is urgently needed to address these challenges.
2) Further investment in the rehabilitation of equipment and systems that have far exceeded their useful service life does not constitute good investment value.
3) Retirement of STG-1, STG-3, STG-4, CTG-5, and the boiler plant will allow for retirement of all remaining equipment which is cross-connected with City Water systems. This is a public health and safety concern that needs to be accomplished in a timely fashion.
4) Major cost savings are realized from the conversion of natural gas and diesel fueled equipment to purchasing electric power, which will have an immediate impact on reduced operational expense upon implementation.
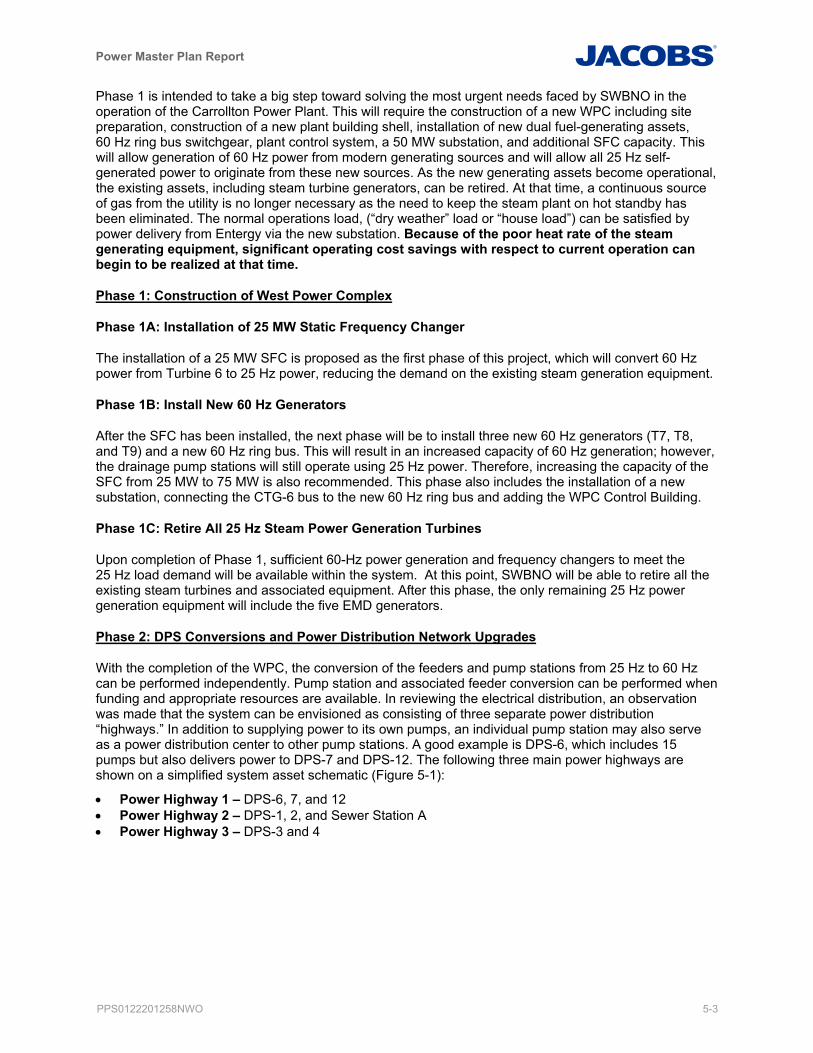
Power Master Plan Report
PPS0122201258NWO 5-3
Phase 1 is intended to take a big step toward solving the most urgent needs faced by SWBNO in the operation of the Carrollton Power Plant. This will require the construction of a new WPC including site preparation, construction of a new plant building shell, installation of new dual fuel-generating assets, 60 Hz ring bus switchgear, plant control system, a 50 MW substation, and additional SFC capacity. This will allow generation of 60 Hz power from modern generating sources and will allow all 25 Hz self-generated power to originate from these new sources. As the new generating assets become operational, the existing assets, including steam turbine generators, can be retired. At that time, a continuous source of gas from the utility is no longer necessary as the need to keep the steam plant on hot standby has been eliminated. The normal operations load, (“dry weather” load or “house load”) can be satisfied by power delivery from Entergy via the new substation. Because of the poor heat rate of the steam generating equipment, significant operating cost savings with respect to current operation can begin to be realized at that time.
Phase 1: Construction of West Power Complex
Phase 1A: Installation of 25 MW Static Frequency Changer
The installation of a 25 MW SFC is proposed as the first phase of this project, which will convert 60 Hz power from Turbine 6 to 25 Hz power, reducing the demand on the existing steam generation equipment.
Phase 1B: Install New 60 Hz Generators
After the SFC has been installed, the next phase will be to install three new 60 Hz generators (T7, T8, and T9) and a new 60 Hz ring bus. This will result in an increased capacity of 60 Hz generation; however, the drainage pump stations will still operate using 25 Hz power. Therefore, increasing the capacity of the SFC from 25 MW to 75 MW is also recommended. This phase also includes the installation of a new substation, connecting the CTG-6 bus to the new 60 Hz ring bus and adding the WPC Control Building.
Phase 1C: Retire All 25 Hz Steam Power Generation Turbines
Upon completion of Phase 1, sufficient 60-Hz power generation and frequency changers to meet the 25 Hz load demand will be available within the system. At this point, SWBNO will be able to retire all the existing steam turbines and associated equipment. After this phase, the only remaining 25 Hz power generation equipment will include the five EMD generators.
Phase 2: DPS Conversions and Power Distribution Network Upgrades
With the completion of the WPC, the conversion of the feeders and pump stations from 25 Hz to 60 Hz can be performed independently. Pump station and associated feeder conversion can be performed when funding and appropriate resources are available. In reviewing the electrical distribution, an observation was made that the system can be envisioned as consisting of three separate power distribution “highways.” In addition to supplying power to its own pumps, an individual pump station may also serve as a power distribution center to other pump stations. A good example is DPS-6, which includes 15 pumps but also delivers power to DPS-7 and DPS-12. The following three main power highways are shown on a simplified system asset schematic (Figure 5-1):
• Power Highway 1 – DPS-6, 7, and 12 • Power Highway 2 – DPS-1, 2, and Sewer Station A • Power Highway 3 – DPS-3 and 4
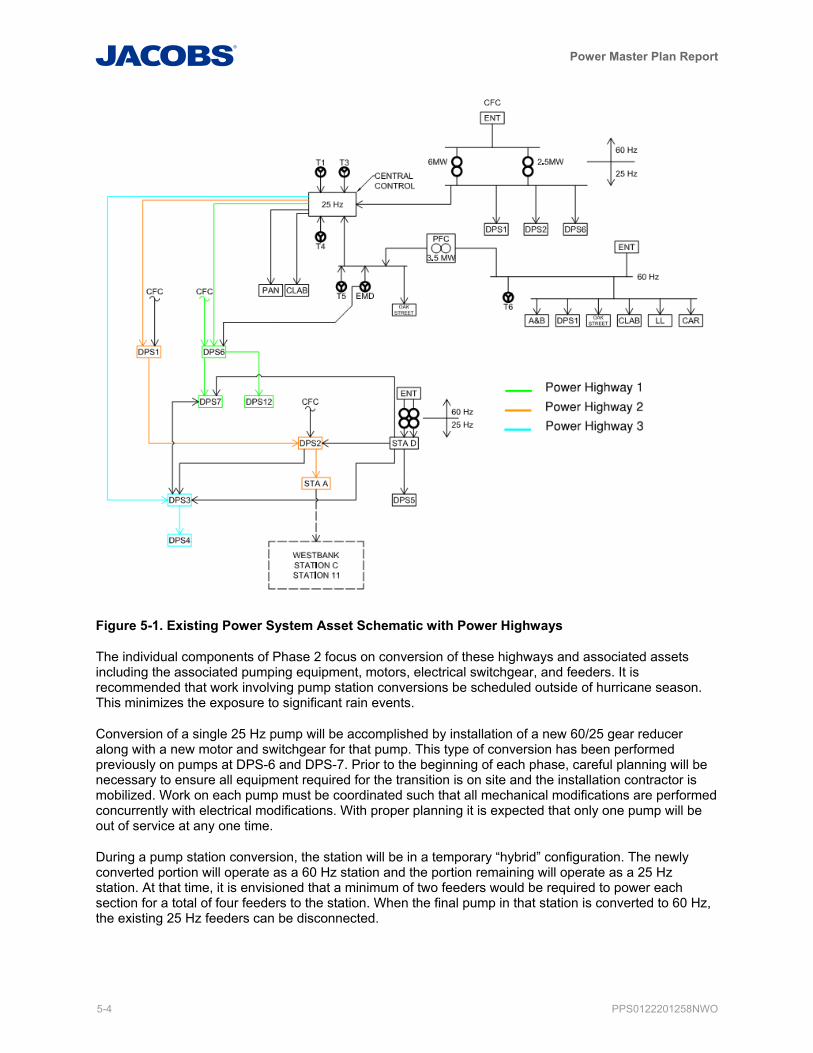
Power Master Plan Report
5-4 PPS0122201258NWO
Figure 5-1. Existing Power System Asset Schematic with Power Highways
The individual components of Phase 2 focus on conversion of these highways and associated assets including the associated pumping equipment, motors, electrical switchgear, and feeders. It is recommended that work involving pump station conversions be scheduled outside of hurricane season. This minimizes the exposure to significant rain events.
Conversion of a single 25 Hz pump will be accomplished by installation of a new 60/25 gear reducer along with a new motor and switchgear for that pump. This type of conversion has been performed previously on pumps at DPS-6 and DPS-7. Prior to the beginning of each phase, careful planning will be necessary to ensure all equipment required for the transition is on site and the installation contractor is mobilized. Work on each pump must be coordinated such that all mechanical modifications are performed concurrently with electrical modifications. With proper planning it is expected that only one pump will be out of service at any one time.
During a pump station conversion, the station will be in a temporary “hybrid” configuration. The newly converted portion will operate as a 60 Hz station and the portion remaining will operate as a 25 Hz station. At that time, it is envisioned that a minimum of two feeders would be required to power each section for a total of four feeders to the station. When the final pump in that station is converted to 60 Hz, the existing 25 Hz feeders can be disconnected.

Power Master Plan Report
PPS0122201258NWO 5-5
Phase 2A: Convert Drainage Pump Stations to 60 Hz and Install 60 Hz Switchgear
During Phase 2A, it is recommended that SWBNO begin to convert the drainage pump stations to 60 Hz. DPS-6, DPS-7 (partial), DPS-12, and DPS-17 (partial) are recommended to be the first drainage pump stations to be converted to 60 Hz since they are included on the first feeder highway. In addition to partially converting DPS-17 to 60 Hz, it is recommended that a new 60 Hz switchgear be installed at DPS-17 during this phase to allow for increased connectivity and flexibility to the rest of the SWBNO Power Distribution Network.
Phase 2B: Convert Drainage Pump Stations to 60 Hz and DPS-5 to an Independent Station
In this phase, SWBNO will continue conversion of the pump stations by completing the 60 Hz conversion of DPS-7 and replacing electrical feeders that are associated with DPS-7. It is also recommended that SWBNO connect the Pritchard and I-10 drainage pump stations to the network. Additionally, during this phase, DPS-5, located on the other side of the Industrial Canal, is removed from the SWBNO Power Distribution Network and converted to an independent 60 Hz drainage pump station by adding redundant generation capacity.
Phase 2C: Convert Drainage Pump Stations to 60 Hz
This phase continues converting drainage pump stations from 25 Hz to 60 Hz. In this phase, DPS-1 and DPS-2 (partial) will be converted to 60 Hz. Additionally, DPS-19 will be added to the network.
Phase 2D: Convert Drainage Pump Stations to 60 Hz and Retire Frequency Changers
This phase continues converting drainage pump stations from 25 Hz to 60 Hz. In this phase, the remaining equipment associated with DPS-2 will be converted; along with DPS-3, DPS-4, Panola and Claiborne potable water pump stations will be converted to 60 Hz. Additionally, the Carrollton Frequency Changers and frequency changers at DPS-17 will be retired, as 25 Hz demand has been removed.
Detailed Phasing Diagrams included in Appendix H outline the major work scope items, the approximate amount of power converted to 60 Hz, and the approximate quantity of new feeder cables added in each proposed phase.
5.2 Power Inventory
To validate the feasibility of any phasing strategy, the generating capacity vs. system demand must be examined at the completion of each phase. This involves a review of both 25 Hz and 60 Hz systems. Each system is analyzed assuming the largest 25 Hz generator is out of service, then repeated assuming the largest 60 Hz generator is out of service. These assumptions reflect variations of the Firm Reliable capacity requirement. Analysis of each system (25 Hz and 60 Hz) is important because generation capacity is shared across the frequency changers. Credit is taken for energy transfer across the SFC; however, appropriate limitations are applied which consider SFC capacity as well as the limitation of excess capacity from the adjacent system. The results are presented as eight data points at the completion of each phase.
The Power Inventory Graphs (Figures 5-2 through 5-6 on the following pages) represent the SWBNO power asset inventory when considering the largest 25 Hz generator out of service and the largest 60 Hz generator out of service. By utilizing a graphical summary of the power assets at each phase, any deficits in the power system are clearly evident. These graphs are also included in Appendix H after the phasing diagrams.

Power Master Plan Report
5-6 PPS0122201258NWO
Figure 5-2. 25 Hz Power Inventory, Largest 25 Hz Generator Out of Service
Figure 5-3. 60 Hz Power Inventory, Largest 25 Hz Generator Out of Service
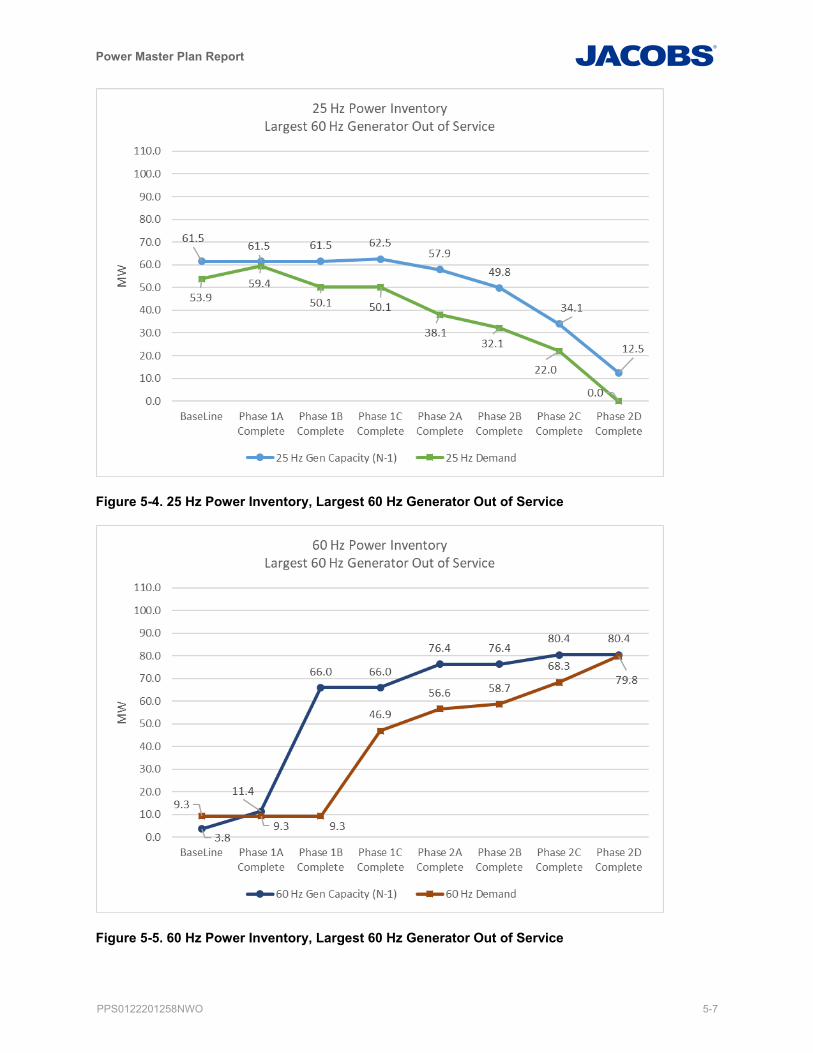
Power Master Plan Report
PPS0122201258NWO 5-7
Figure 5-4. 25 Hz Power Inventory, Largest 60 Hz Generator Out of Service
Figure 5-5. 60 Hz Power Inventory, Largest 60 Hz Generator Out of Service
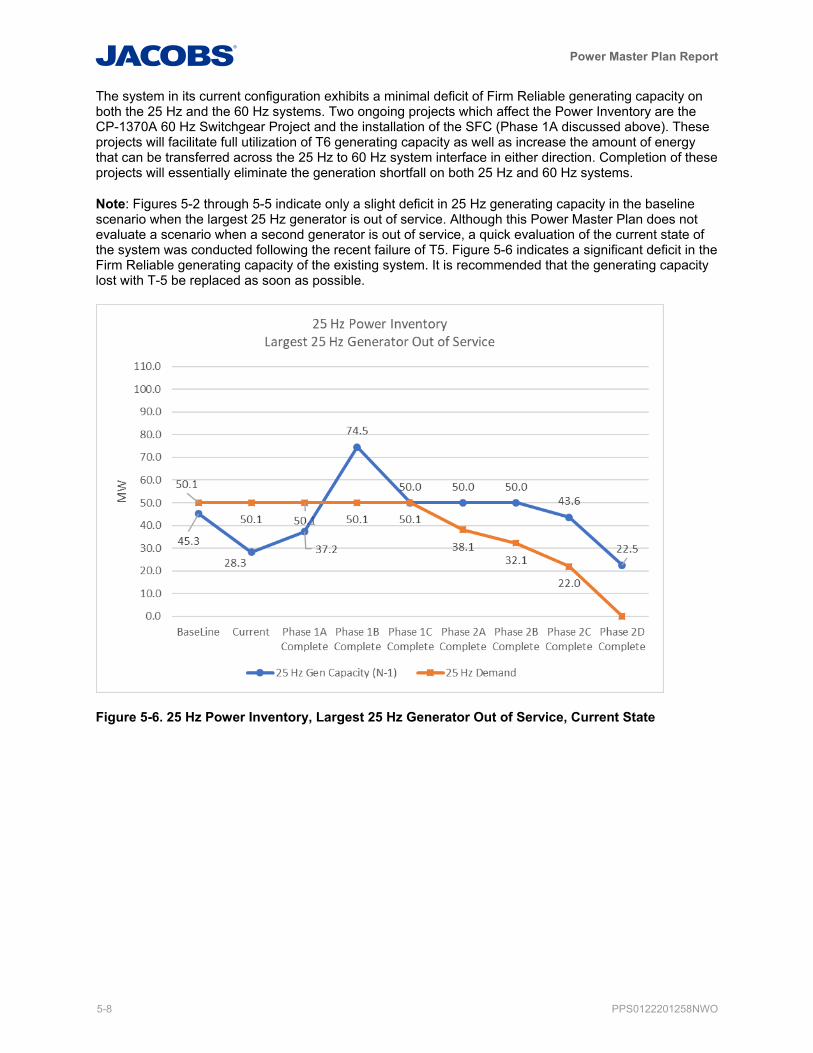
Power Master Plan Report
5-8 PPS0122201258NWO
The system in its current configuration exhibits a minimal deficit of Firm Reliable generating capacity on both the 25 Hz and the 60 Hz systems. Two ongoing projects which affect the Power Inventory are the CP-1370A 60 Hz Switchgear Project and the installation of the SFC (Phase 1A discussed above). These projects will facilitate full utilization of T6 generating capacity as well as increase the amount of energy that can be transferred across the 25 Hz to 60 Hz system interface in either direction. Completion of these projects will essentially eliminate the generation shortfall on both 25 Hz and 60 Hz systems.
Note: Figures 5-2 through 5-5 indicate only a slight deficit in 25 Hz generating capacity in the baseline scenario when the largest 25 Hz generator is out of service. Although this Power Master Plan does not evaluate a scenario when a second generator is out of service, a quick evaluation of the current state of the system was conducted following the recent failure of T5. Figure 5-6 indicates a significant deficit in the Firm Reliable generating capacity of the existing system. It is recommended that the generating capacity lost with T-5 be replaced as soon as possible.
Figure 5-6. 25 Hz Power Inventory, Largest 25 Hz Generator Out of Service, Current State

Power Master Plan Report
PPS0122201258NWO 6-1
6. Recommendations Based on the findings presented in this report, the following items are recommended as next steps:
• Finalize negotiations on the new Entergy substation, and begin construction.
• Complete the work that is currently in progress:
– 1370A Switchgear / Transformer Project
– Procurement and installation of a new 25 MW SFC
– Upgrades to T-6 to allow for cold weather operation
• Begin preparation of performance specifications for major long-lead time equipment.
• Prepare a conceptual level design to accommodate updated cost estimates of preferred alternative to be used in financing discussions.
• Refine phasing of preferred alternative to mitigate loss of T-5.


Appendix A Asset Lists


Pump StationDistribution
System*Motor Hz KW Equip. Number Pump
Installati
on Date
Pump
Capacity
(cfs)
Unit of
Measure
Rated
Pump
Head
Pump
Diameter
(ft)
Primary
Feeders
Secondar
y Feeders
1 1 60 1865 DPS01-HPF-PMP 11' F* 1991 1100 cfs 8 11 - -
1 1 60 1865 DPS01-HPG-PMP 11' G* 1100 cfs 8 11 - -
1 1 25 895.2 DPS01-HPC-PMP 14' C 1929 1000 cfs 14 46 2-AC
1 1 25 895.2 DPS01-HPD-PMP 14' D 1929 1000 cfs 14 202 204
1 1 25 895.2 DPS01-HPE-PMP 14' E 1929 1000 cfs 14 202 204
1 1 25 447.6 DPS01-HPA-PMP 12' A 1929 550 cfs 5.75 12 302 304
1 1 25 447.6 DPS01-HPB-PMP 12' B 1929 550 cfs 5.75 12 302 304
1 1 25 298.4 DPS01-VTP1-PMP 6' #1Vert. 225 cfs 6 302 304
1 1 25 298.4 DPS01-VTP2-PMP 6' #2Vert. 225 cfs 6 302 304
1 1 25 93.25 DPS01-CD1-PMP 3' CD #1 60 cfs 3 302 304
1 1 25 29.84 DPS01-CD2-PMP 2' CD #2 15 cfs 2 2-AC 46
2 1 25 1492 DPS02-HPC-PMP 11' C 1914 1000 cfs 11 18 46
2 1 25 1492 DPS02-HPD-PMP 11' D 1914 1000 cfs 11 24 304
2 1 25 447.6 DPS02-HPA-PMP 12' A 1914 550 cfs 12 204 224
2 1 25 447.6 DPS02-HPB-PMP 12' B 1914 550 cfs 12 204 224
2 1 25 44.76 DPS02-CD2-PMP 42" CD #2 1974 25 cfs 3.5 204 224
2 1 25 44.76 DPS02-CD3-PMP 42" CD #3 1974 25 cfs 3.5 204 224
3 1 25 1492 DPS03-HPC-PMP 14' C 1930 1000 cfs 14 340 180
3 1 25 1492 DPS03-HPD-PMP 14' D 1930 1000 cfs 14 312 432
3 1 25 1492 DPS03-HPE-PMP 14' E 1930 1000 cfs 14 506 508
3 1 25 895.2 DPS03-HPA-PMP 12' A 1916 550 cfs 5.14 12 432 408
3 1 25 895.2 DPS03-HPB-PMP 12' B 1916 550 cfs 5.14 12 432 408
3 1 25 44.76 DPS03-CD1-PMPL 3' CD 1 (L/R) 1916 40 cfs 3 506 508
3 1 25 44.76 DPS03-CD2-PMPL 3' CD 2 (L/R) 1916 40 cfs 3 340 180
4 1 25 1492 DPS04-HPC-PMP 14' C 1957 1000 cfs 12 14 340 432
4 1 25 1492 DPS04-HPD-PMP 14' D 1957 1000 cfs 14 400 432
4 1 25 1492 DPS04-HPE-PMP 14' E 1957 1000 cfs 14 400 432
4 1a 60 522.2 DPS04-VTP1-PMP 8' #1* 1938 320 cfs 8 - -
4 1a 60 522.2 DPS04-VTP2-PMP 8' #2* 1938 320 cfs 8 - -
4 1 25 149.2 DPS04-CD1-PMP 3' CD 80 cfs 3 400 432
5 1 25 895.2 DPS05-HPA-PMP 12' A 1914 550 cfs 14 12 410 20
5 1 25 895.2 DPS05-HPB-PMP 12' B 1914 550 cfs 14 12 20 410
5 1 25 1492 DPS05-HPB-PMP 12' D 1914 550 cfs 14 12 510 410
5 1 25 261.1 DPS05-CD1-PMP 3' CD 1 (L/R) 40 cfs 3 410 20
5 1 25 261.1 DPS05-CD2-PMP 3' CD 2 (L/R) 40 cfs 3 410 20
5 N/A 60 0 DPS05-VTP1-PMP 7' #1* 300 cfs 7 - -
5 N/A 60 0 DPS05-VTP2-PMP 7' #2* 300 cfs 7 - -
6 1a 60 2238 DPS06-HPH-PMP 11' H* 1984 1100 cfs 12 11 - -
6 1a 60 2238 DPS06-HPI-PMP 11' I* 1984 1100 cfs 12 11 - -
6 1 25 1492 DPS06-HPC-PMP 14' C 1928 1000 cfs 14 14 130 14CD
6 1 25 1492 DPS06-HPD-PMP 14' D 1928 1000 cfs 14 14 216 130
6 1 25 1492 DPS06-HPE-PMP 14' E 1928 1000 cfs 14 14 216 130
6 1 25 1492 DPS06-HPF-PMP 14' F 1928 1100 cfs 14 14 316 314
6 1 25 1492 DPS06-HPG-PMP 14' G 1984 1000 cfs 14 516 612
6 1 25 895.2 DPS06-HPA-PMP 12' A 1914 550 cfs 12 414 416
6 1 25 895.2 DPS06-HPB-PMP 12' B 1914 550 cfs 12 414 416
6 1a 60 522.2 DPS06-VTP1-PMP 6' #1V* 1983 250 cfs 16 6 - -
6 1a 60 522.2 DPS06-VTP2-PMP 6' #2V* 1983 250 cfs 16 6 - -
6 1a 60 522.2 DPS06-VTP3-PMP 6' #3V* 1983 250 cfs 16 6 - -
6 1a 60 522.2 DPS06-VTP4-PMP 6' #4V* 1983 250 cfs 16 6 - -
6 1 25 335.7 DPS06-CD1-PMP 3' CD #1 1984 90 cfs 3 216 130
6 1 25 335.7 DPS06-CD2-PMP 3' CD #2 1984 90 cfs 3 216 130
7 1a 60 1865 DPS07-HPD-PMP 14' D* 1908 1000 cfs 14 - -
7 1 25 895.2 DPS07-HPA-PMP 12' A 1931 550 cfs 12 314 312
7 1 25 895.2 DPS07-HPC-PMP 14' C 1908 1000 cfs 14 14CD 180
7 1 25 186.5 DPS07-CD1-PMP 3' CD #1 70 cfs 3 414 412
7 1 25 186.5 DPS07-CD2-PMP 3' CD #2 70 cfs 3 414 412
10 3 60 522.2 DPS10-VTP1-PMP 6' #1* 1984 250 cfs 21.5 6 -
10 3 60 522.2 DPS10-VTP2-PMP 6' #2* 1984 250 cfs 21.5 6 -
10 3 60 522.2 DPS10-VTP3-PMP 6' #3* 1984 250 cfs 21.5 6 -
10 3 60 522.2 DPS10-VTP4-PMP 6' #4* 1984 250 cfs 21.5 6 -
11 3 60 932.5 DPS11-HPD-PMP 12' D* 1990 570 cfs 12 12 - -
11 3 60 932.5 DPS11-HPE-PMP 12' E* 1990 570 cfs 12 12 - -
11 1 25 298.4 DPS11-HPA-PMP 8' A 1953 250 cfs 8 8 28A 28B
11 1 25 298.4 DPS11-HPB-PMP 8' B 1952 250 cfs 8 8 28A 28B
11 3 60 111.9 DPS11-CD1-PMP 30" CD #1* 1953 50 cfs 8 2.5 - -
12 1 25 1492 DPS12-HPD-PMP 14' D 1961 1000 cfs 14 14 612
13 3 60 1865 DPS13-HP4-PMP 10' #4-D* 1981 1000 cfs 12 10
13 3 60 1865 DPS13-HP5-PMP 10' #5-D* 1981 1000 cfs 12 10
13 3 60 1865 DPS13-HP6-PMP 10' #6* 1981 1050 cfs 11 10
13 3 60 1865 DPS13-HP7-PMP 10' #7* 1981 1050 cfs 11 10
13 3 60 522.2 DPS13-VTP1-PMP 6' #1* 1981 250 cfs 6
13 3 60 522.2 DPS13-VTP2-PMP 6' #2* 1981 250 cfs 6
13 3 60 111.9 DPS13-CD3-PMP 3' CD #3* 1981 50 cfs 9.5? 3
14 3 60 596.8 DPS14-VTP1-PMP 6' #1* 300 cfs 17 6
14 3 60 596.8 DPS14-VTP2-PMP 6' #2* 300 cfs 17 6
14 3 60 596.8 DPS14-VTP3-PMP 6' #3* 300 cfs 17 6
14 3 60 596.8 DPS14-VTP4-PMP 6' #4* 300 cfs 17 6
15 3 60 373 DPS15-VTP1-PMP 5' #1* 250 cfs 5
15 3 60 373 DPS15-VTP2-PMP 5' #2-D/E* 1975 250 cfs 5
Asset List - Pump Loads
Pump Loads
Page 1 of 3

Pump StationDistribution
System*Motor Hz KW Equip. Number Pump
Installati
on Date
Pump
Capacity
(cfs)
Unit of
Measure
Rated
Pump
Head
Pump
Diameter
(ft)
Primary
Feeders
Secondar
y Feeders
Asset List - Pump Loads
15 3 60 373 DPS15-VTP3-PMP 5' #3-D/E* 1975 250 cfs 5
16 3 60 596.8 DPS16-VTP1-PMP 63" #1* 1966 290 cfs 16 5.25
16 3 60 596.8 DPS16-VTP2-PMP 63" #2* 1966 290 cfs 16 5.25
16 3 60 596.8 DPS16-VTP3-PMP 63" #3* 1966 290 cfs 16 5.25
16 3 60 596.8 DPS16-VTP4-PMP 63" #4* 1966 290 cfs 16 5.25
17/Station D 1a 60 1865 DPS17-HPA-PMP 3' A* 1975 150 cfs 3
17/Station D 1a 60 1865 DPS17-HPD-PMP 3' D* 1975 150 cfs 3
18 3 60 93.25 DPS18-VTP1-PMP 3' #1* 1983 62 cfs 3
18 3 60 93.25 DPS18-VTP2-PMP 3' #2* 1983 62 cfs 3
19 2 60 2238 DPS19-HP3-PMP 10' #H1* 1975 1100 cfs 12.8 10
19 2 60 2238 DPS19-VTP1-PMP 10' #H2* 1975 1100 cfs 12.8 10
19 2 60 2238 DPS19-VTP2-PMP 10' #H3* 1975 1100 cfs 12.8 10
19 2 60 596.8 DPS19-HP1-PMP 6' #V1* 1975 310 cfs 15.1 6
19 2 60 596.8 DPS19-HP2-PMP 6' #V2* 1975 310 cfs 15.1 6
20 3 60 447.6 DPS20-VTP1-PMP 6' #1* 1989 250 cfs 8.5 6
20 3 60 447.6 DPS20-VTP2-PMP 6' #2* 1989 250 cfs 8.5 6
Dwyer 3 60 857.9 DPSDWY-VTP1-PMP 68" #1* 356 cfs 5.67
Dwyer 3 60 857.9 DPSDWY-VTP2-PMP 68" #2* 356 cfs 5.67
Dwyer 3 60 857.9 DPSDWY-VTP3-PMP 68" #3* 356 cfs 5.67
Elaine 3 60 44.76 DPSELN-HP1-PMP 30" #1* 45 cfs 2.5
Elaine 3 60 44.76 DPSELN-HP2-PMP 30" #2* 45 cfs 2.5
Grant 3 60 298.4 DPSGRT-VTP5-PMP #5* 70 cfs 1.167
Grant 3 60 298.4 DPSGRT-VTP6-PMP #6* 70 cfs 1.167
Grant 3 60 14.92 DPSGRT-VTP1-PMP 14" #1* 8 cfs 1.167
Grant 3 60 14.92 DPSGRT-VTP2-PMP 14" #2* 8 cfs 1.167
Grant 3 60 14.92 DPSGRT-VTP3-PMP 14" #3* 8 cfs 1.167
Grant 3 60 14.92 DPSGRT-VTP4-PMP 14" #4* 8 cfs 1.167
I-10 2 60 932.5 DPSI10-VTP1-PMP 60" #1* 250 cfs 31.5 5
I-10 2 60 932.5 DPSI10-VTP2-PMP 60" #2* 250 cfs 31.5 5
I-10 2 60 932.5 DPSI10-VTP3-PMP 60" #3* 250 cfs 31.5 5
I-10 2 60 447.6 DPSI10-CD1-PMP 40" CD #1* 100 cfs 38 5
Oleander N/A 60 0 DPSOLR-VTP1-PMP 30" #1* 1979 33 cfs 2.5
Oleander N/A 60 0 DPSOLR-VTP2-PMP 30" #2* 1979 33 cfs 2.5
Oleander N/A 60 0 DPSOLR-VTP3-PMP 30" #3* 1979 33 cfs 2.5
Pritchard 2 60 373 DPSPTC-VTP1-PMP 48" #1* 125 cfs 22.65 4
Pritchard 2 60 373 DPSPTC-VTP2-PMP 48" #2* 125 cfs 22.65 4
Pritchard 2 60 18.65 6" CD #1* 3 cfs 22.65 0.5
Monticello 3 60 74.6 1
Monticello 3 60 74.6 2
Monticello 3 60 74.6 3
Oak St. 1 25 1119 A1
Oak St. 1 25 0 A2
Oak St. 1 25 1119 B1
Oak St. 1 25 0 B2
Oak St. 1 25 746 C1
Oak St. 1 25 0 C2
Oak St. 1 60 932.5 D
Industrial Ave. 3 60 373 1
Industrial Ave. 3 60 373 2
Industrial Ave. 3 60 373 3
Panola 1 25 1678.5 1
Panola 1 25 1678.5 2
Panola 1 60 1678.5 1
Panola 1 60 1678.5 2
Claiborne 1 25 1342.8 1
Claiborne 1 25 1342.8 4
Claiborne 1 60 1342.8 2
Claiborne 1 60 1342.8 3
Low Lift 1 60 261.1 6
Low Lift 1 60 261.1 7
High Lift 1 60 1678.5 A
High Lift 1 60 1678.5 B
Sewer Station A 1 25 932.5 2
Sewer Station A 1 25 932.5 3
Sewer Station A 1a 60 1715.8
Sewer Station C N/A 60 0
Sewer Station C N/A 25 0
Underpass 1 3 60 0 PMP-1 0.18 cfs
Underpass 1 3 60 0 PMP-2 0.18 cfs
Underpass 10 3 60 0 PMP-1 13 cfs
Underpass 10 3 60 0 PMP-2 13 cfs
Underpass 10 3 60 0 PMP-3 13 cfs
Underpass 11 3 60 0 PMP-1 33 cfs
Underpass 11 3 60 0 PMP-2 33 cfs
Underpass 11 3 60 0 PMP-3 33 cfs
Underpass 12 3 60 0 PMP-1 10.5 cfs
Underpass 12 3 60 0 PMP-2 10.5 cfs
Underpass 2 3 60 0 PMP-1 10 cfs
Underpass 2 3 60 0 PMP-2 10 cfs
Underpass 2 3 60 0 PMP-1 10 cfs
Pump Loads
Page 2 of 3

Pump StationDistribution
System*Motor Hz KW Equip. Number Pump
Installati
on Date
Pump
Capacity
(cfs)
Unit of
Measure
Rated
Pump
Head
Pump
Diameter
(ft)
Primary
Feeders
Secondar
y Feeders
Asset List - Pump Loads
Underpass 3 3 25 0 PMP-1 14 cfs
Underpass 3 3 25 0 PMP-2 14 cfs
Underpass 4 3 25 0 PMP-1 5 cfs
Underpass 4 3 25 0 PMP-2 5 cfs
Underpass 5 3 60 0 PMP-1 24 cfs
Underpass 5 3 60 0 PMP-2 24 cfs
Underpass 6 3 60 0 PMP-1 6 cfs
Underpass 6 3 60 0 PMP-2 6 cfs
Underpass 7 3 60 0 PMP-1 7 cfs
Underpass 7 3 60 0 PMP-2 7 cfs
Underpass 8 3 60 0 PMP-1 7 cfs
Underpass 8 3 60 0 PMP-2 7 cfs
Underpass 8 3 60 0 PMP-3 7 cfs
Underpass 9 3 60 0 PMP-1 24 cfs
Underpass 9 3 60 0 PMP-2 24 cfs
Underpass 9 3 60 0 PMP-3 24 cfs
Carrollton Plant 1 25 2000 25 Hz Aux Allowance
Carrollton Plant 1 60 2000 60 Hz Aux Allowance
NOTES:
Sources of information: Asset_Registry_GIS.xls
*System Classification:
1 Currently on SWBNO Power Distribution Network
1a Not on SWBNO Power Distribution Network but at a pump station that is currently serviced by SWBNO Network
2 Not on SWBNO Power Distribution Network but there is an underground feeder close by, therefore, should be added to the Network
3 Not on SWBNO Power Distribution Network and should not be included due to isolated location or capacity of generation
Classification Hz kW Total
1 25 50,121 66,705
60 16,584
1+1a 25 50,121 81,625
60 31,504
1+1a+2 25 50,121 93,542
60 43,422
1+1a+2+3 25 50,121 117,862
60 67,741
Pump Loads
Page 3 of 3

LocationFrequency
(Hz)Asset Class
Nameplate
Capacity
(MW)
Reliable
Capacity
(MW)
Equip.
NumberType
Install
Date
Gen-
VoltageNotes
Power Plant 25 1 6 6 STG-1 Steam Turbine 1913 6,600
Power Plant 25 1 15 6 STG-3 Steam Turbine 1928 6,600Capacity limited due to condition of equipment,
turbine is at the end of its useful life.
Power Plant 25 1 20 17 STG-4 Steam Turbine 1917/1954 6,600
Capacity limited due to steam pressure. T4 requires a
higher steam pressure than the boiler plant can supply
it.
Power Plant 25 1 20 20 CTG-5 Gas Turbine 1963 6,600
Power Plant 60 1 22 22 CTG-6 Gas Turbine 2010 13,800
Assumption that 1370A will be complete and T6 will
be upgraded for full, continuous operation (emissions,
anti-icing).
Power Plant 25 1 2.5 2.5 EMD-1 EMD 2018 6,600
Power Plant 25 1 2.5 2.5 EMD-2 EMD 2018 6,600
Power Plant 25 1 2.5 2.5 EMD-3 EMD 2018 6,600
Power Plant 25 1 2.5 2.5 EMD-4 EMD 2018 6,600
Power Plant 25 1 2.5 2.5 EMD-5 EMD 2018 6,600
Power Plant 25 1 3.75 3.75 FC-1 Frequency Convertor 6,600
Carrollton FC 24 1 6 6 FC-1 Frequency Convertor 6,600 60 Hz from Entergy converted to 24 Hz for SWBNO
Carrollton FC 24 1 2.5 2.5 FC-2 Frequency Convertor 6,600 60 Hz from Entergy converted to 24 Hz for SWBNO
Station D 24 1 6 6 FC-3 Frequency Convertor 6,600 60 Hz from Entergy converted to 24 Hz for SWBNO
Station D 24 1 6 6 FC-4 Frequency Convertor 6,600 60 Hz from Entergy converted to 24 Hz for SWBNO
Station C 25 1 FC-1 Frequency Convertor 6,600
Station C 25 1 FC-2 Frequency Convertor 6,600
Westbank 25 1 FC-3 Frequency Convertor 6,600
DPS 3 60 3 0.08 0.08 60 Hz Gen. Permanent Generator 4,160 Not utilized for distributed power.
DPS 5 60 3 3.58 3.58 60 Hz Gen. Permanent Generator 4,160 Not utilized for distributed power.
DPS 6 60 1a 3.75 3.75 60 Hz Gen. Permanent Generator 4,160
DPS 6 60 1a 3.75 3.75 60 Hz Gen. Permanent Generator 4,160
DPS 7 60 1a 2.864 2.864 60 Hz Gen. Permanent Generator 4,160
DPS 11 25 3 0.5 0.5 25 Hz Gen. Permanent Generator 4,160 Not utilized for distributed power.
DPS 11 60 3 1.45 1.45 60 Hz Gen. Permanent Generator 480 Not utilized for distributed power.
DPS 13 60 3 0.23 0.23 60 Hz Gen. Permanent Generator 480 Not utilized for distributed power.
DPS 13 60 3 0.23 0.23 60 Hz Gen. Permanent Generator Not utilized for distributed power.
DPS 13 60 3 3 3 60 Hz Gen. Permanent Generator Not utilized for distributed power.
DPS 13 60 3 3 3 60 Hz Gen. Permanent Generator Not utilized for distributed power.
DPS 14 60 3 2.665 2.665 60 Hz Gen. Permanent Generator Not utilized for distributed power.
DPS 16 60 3 2.665 2.665 60 Hz Gen. Permanent Generator Not utilized for distributed power.
DPS 19 60 2 2 2 60 Hz Gen1 Permanent Generator
DPS 19 60 2 2 2 60 Hz Gen2 Permanent Generator
DPS 20 60 3 1.5 1.5 60 Hz Gen1 Permanent Generator Not utilized for distributed power.
DPS 20 60 3 0.2 0.2 60 Hz Gen2 Permanent Generator Not utilized for distributed power.
I-10 60 2 2.35 2.35 60 Hz Gen1 Permanent Generator
I-10 60 2 2.35 2.35 60 Hz Gen2 Permanent Generator
Pritchard 60 2 1.285 1.285 60 Hz Gen Permanent Generator
Dwyer 60 3 3 3 60 Hz Gen Permanent Generator Not utilized for distributed power.
Station D 60 3 2 2 A1 Temporary Generator Not utilized for distributed power.
Station D 60 3 2 2 A2 Temporary Generator Not utilized for distributed power.
Station D 60 3 2 2 A3 Temporary Generator Not utilized for distributed power.
Station D 60 3 2 2 A4 Temporary Generator Not utilized for distributed power.
Station D 60 3 2 2 A5 Temporary Generator Not utilized for distributed power.
Station D 60 3 2 2 A6 Temporary Generator Not utilized for distributed power.
Station D 60 3 2 2 B1 Temporary Generator Not utilized for distributed power.
Station D 60 3 2 2 B2 Temporary Generator Not utilized for distributed power.
Station D 60 3 2 2 B3 Temporary Generator Not utilized for distributed power.
Station D 60 3 2 2 B4 Temporary Generator Not utilized for distributed power.
Station D 60 3 2 2 B5 Temporary Generator Not utilized for distributed power.
Station D 60 3 2 2 B6 Temporary Generator Not utilized for distributed power.
DPS 4 60 3 2 2 Gen. 1 Temporary Generator Not utilized for distributed power.
DPS 10 60 3 2 2 Gen. 1 Temporary Generator Not utilized for distributed power.
DPS 10 60 3 2 2 Gen. 2 Temporary Generator Not utilized for distributed power.
DWYER 60 3 2 2 Gen. 1 Temporary Generator Not utilized for distributed power.
DWYER 60 3 2 2 Gen. 2 Temporary Generator Not utilized for distributed power.
CFC 60 3 2 2 Gen. 1 Temporary Generator Not utilized for distributed power.
CFC 60 3 2 2 Gen. 2 Temporary Generator Not utilized for distributed power.
CFC 60 3 2 2 Gen. 3 Temporary Generator Not utilized for distributed power.
CFC 60 3 2 2 Gen. 4 Temporary Generator Not utilized for distributed power.
CFC 60 3 2 2 Gen. 5 Temporary Generator Not utilized for distributed power.
CFC 60 3 2 2 Gen. 6 Temporary Generator Not utilized for distributed power.
Underpass 1 60 3 0.2 0.2 Gen. 1 Temporary Generator Not utilized for distributed power.
Underpass 2 60 3 0.2 0.2 Gen. 1 Temporary Generator Not utilized for distributed power.
Underpass 3 60 3 0.2 0.2 Gen. 1 Temporary Generator Not utilized for distributed power.
Underpass 4 60 3 0.2 0.2 Gen. 1 Temporary Generator Not utilized for distributed power.
Underpass 5 60 3 0.2 0.2 Gen. 1 Temporary Generator Not utilized for distributed power.
Underpass 6 60 3 0.2 0.2 Gen. 1 Temporary Generator Not utilized for distributed power.
Underpass 7 60 3 0.2 0.2 Gen. 1 Temporary Generator Not utilized for distributed power.
Underpass 8 60 3 0.2 0.2 Gen. 1 Temporary Generator Not utilized for distributed power.
Underpass 9 60 3 0.2 0.2 Gen. 1 Temporary Generator Not utilized for distributed power.
Underpass 10 60 3 0.2 0.2 Gen. 1 Temporary Generator Not utilized for distributed power.
Underpass 11 60 3 0.2 0.2 Gen. 1 Temporary Generator Not utilized for distributed power.
Underpass 12 60 3 0.2 0.2 Gen. 1 Temporary Generator Not utilized for distributed power.
DPS 18 60 3 0.5 0.5 Gen. 1 Temporary Generator Not utilized for distributed power.
Asset List - Generators
Generation
Page 1 of 2
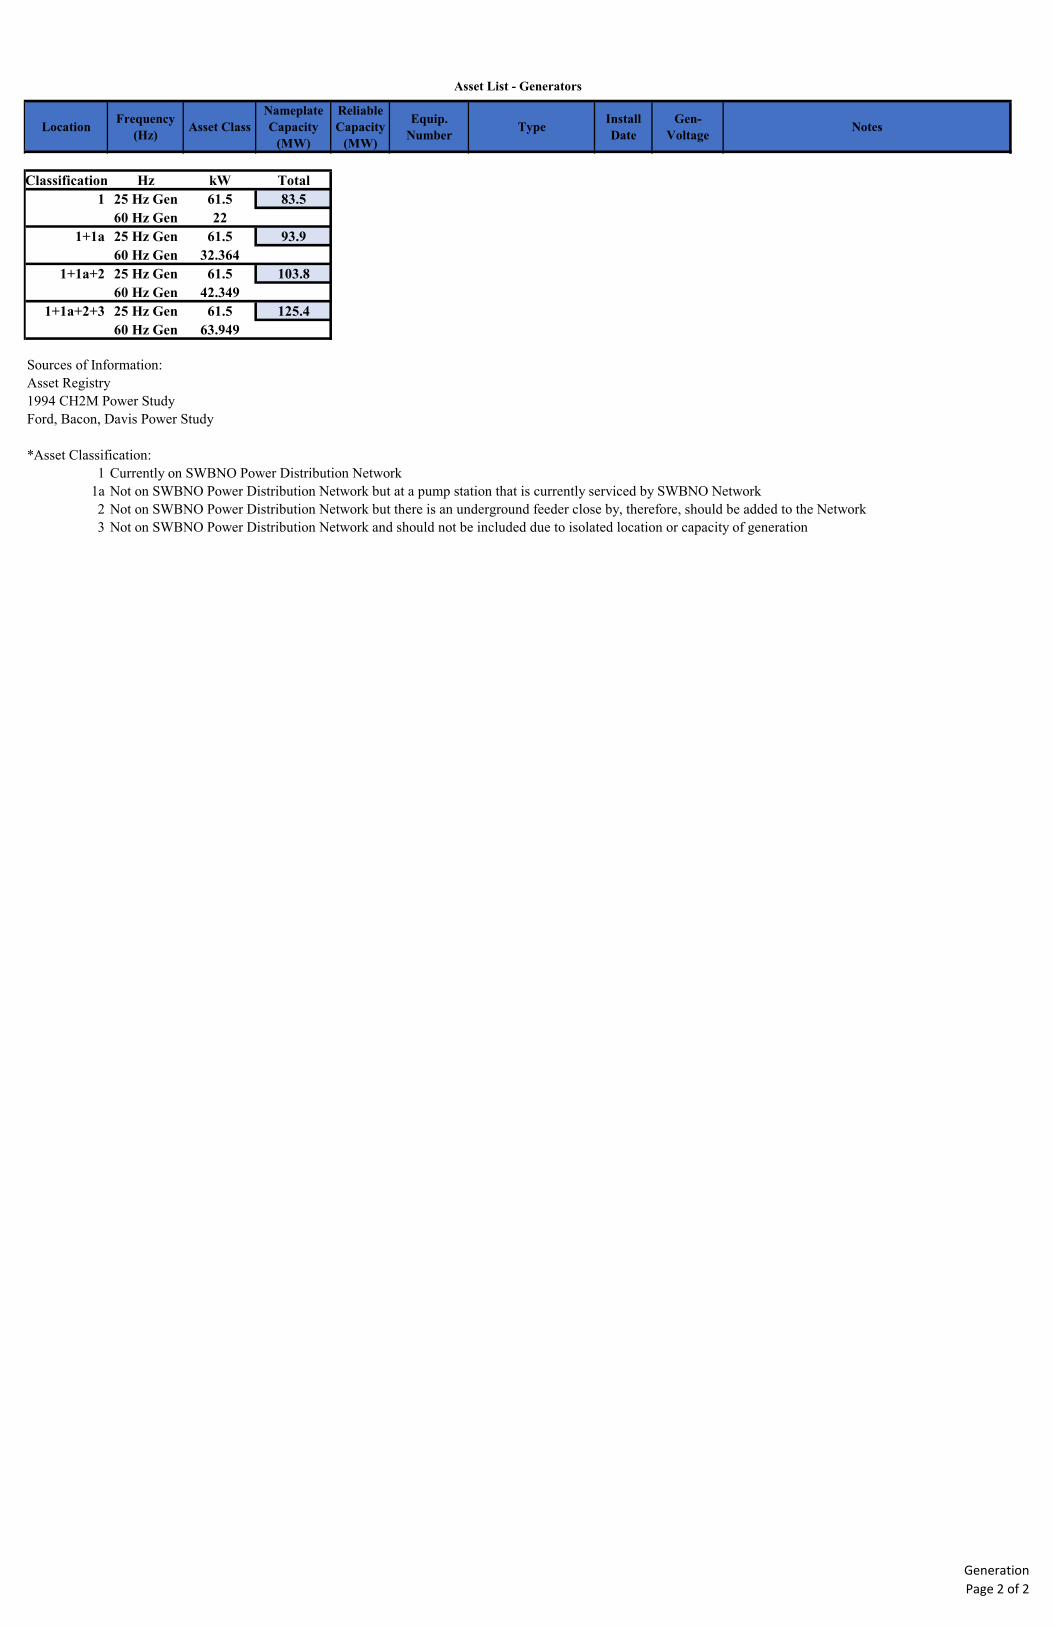
LocationFrequency
(Hz)Asset Class
Nameplate
Capacity
(MW)
Reliable
Capacity
(MW)
Equip.
NumberType
Install
Date
Gen-
VoltageNotes
Asset List - Generators
Classification Hz kW Total
1 25 Hz Gen 61.5 83.5
60 Hz Gen 22
1+1a 25 Hz Gen 61.5 93.9
60 Hz Gen 32.364
1+1a+2 25 Hz Gen 61.5 103.8
60 Hz Gen 42.349
1+1a+2+3 25 Hz Gen 61.5 125.4
60 Hz Gen 63.949
Sources of Information:
Asset Registry
1994 CH2M Power Study
Ford, Bacon, Davis Power Study
*Asset Classification:
1 Currently on SWBNO Power Distribution Network
1a Not on SWBNO Power Distribution Network but at a pump station that is currently serviced by SWBNO Network
2 Not on SWBNO Power Distribution Network but there is an underground feeder close by, therefore, should be added to the Network
3 Not on SWBNO Power Distribution Network and should not be included due to isolated location or capacity of generation
Generation
Page 2 of 2


Appendix B Site Layouts


DWG. No.
SEWERAGE AND WATER BOARDOF NEW ORLEANS
SEWERAGE AND WATER BOARD
POWER MASTER PLAN
XXXXX-W-XX
1515 POYDRAS STREET
NEW ORLEANS, LA 70112
PRELIMINARY FOR
REVIEW ONLY
THESE DOCUMENTS ARE FOR
CONCEPT DESIGN AND NOT
INTENDED FOR CONSTRUCTION
BIDDING OR PERMIT PURPOSES.
THEY WERE PREPARED BY, OR
UNDER SUPERVISION OF:
NAME
REGISTRATION # DATE
XX/XX/2018XXXXXX
MECH ENGINEER
JACOBS ENGINEERING GROUP INC.
ALTERNATIVE 0:
CONCEPTUAL SITE LAYOUT
GA-100
GENERAL NOTES
A. INSTALL A STATIC FREQUENCY CHANGER TO SHARE LOAD
BETWEEN THE 25 HZ AND 60 HZ SYSTEMS.
KEYNOTES
001 15 MW STATIC FREQUENCY CHANGER
002 RIVER COOLING HEAT EXCHANGER SERVICING T1, T3, AND T4 TO
ELIMINATE CROSS CONNECTION OF COOLING WATER. LOCATE IN
LOW LIFT ROOM.
003 FIN-FAN COOLER SERVICING T5 TO ELIMINATE CROSS
CONNECTION OF COOLING WATER. LOCATED NEAR T5.
004 REFER TO ALTERNATIVES FOR DETAILS ON CARROLLTON POWER
PLANT AND BOILER HOUSE UPGRADES
TRUE
NORTH
PLAN
NORTH
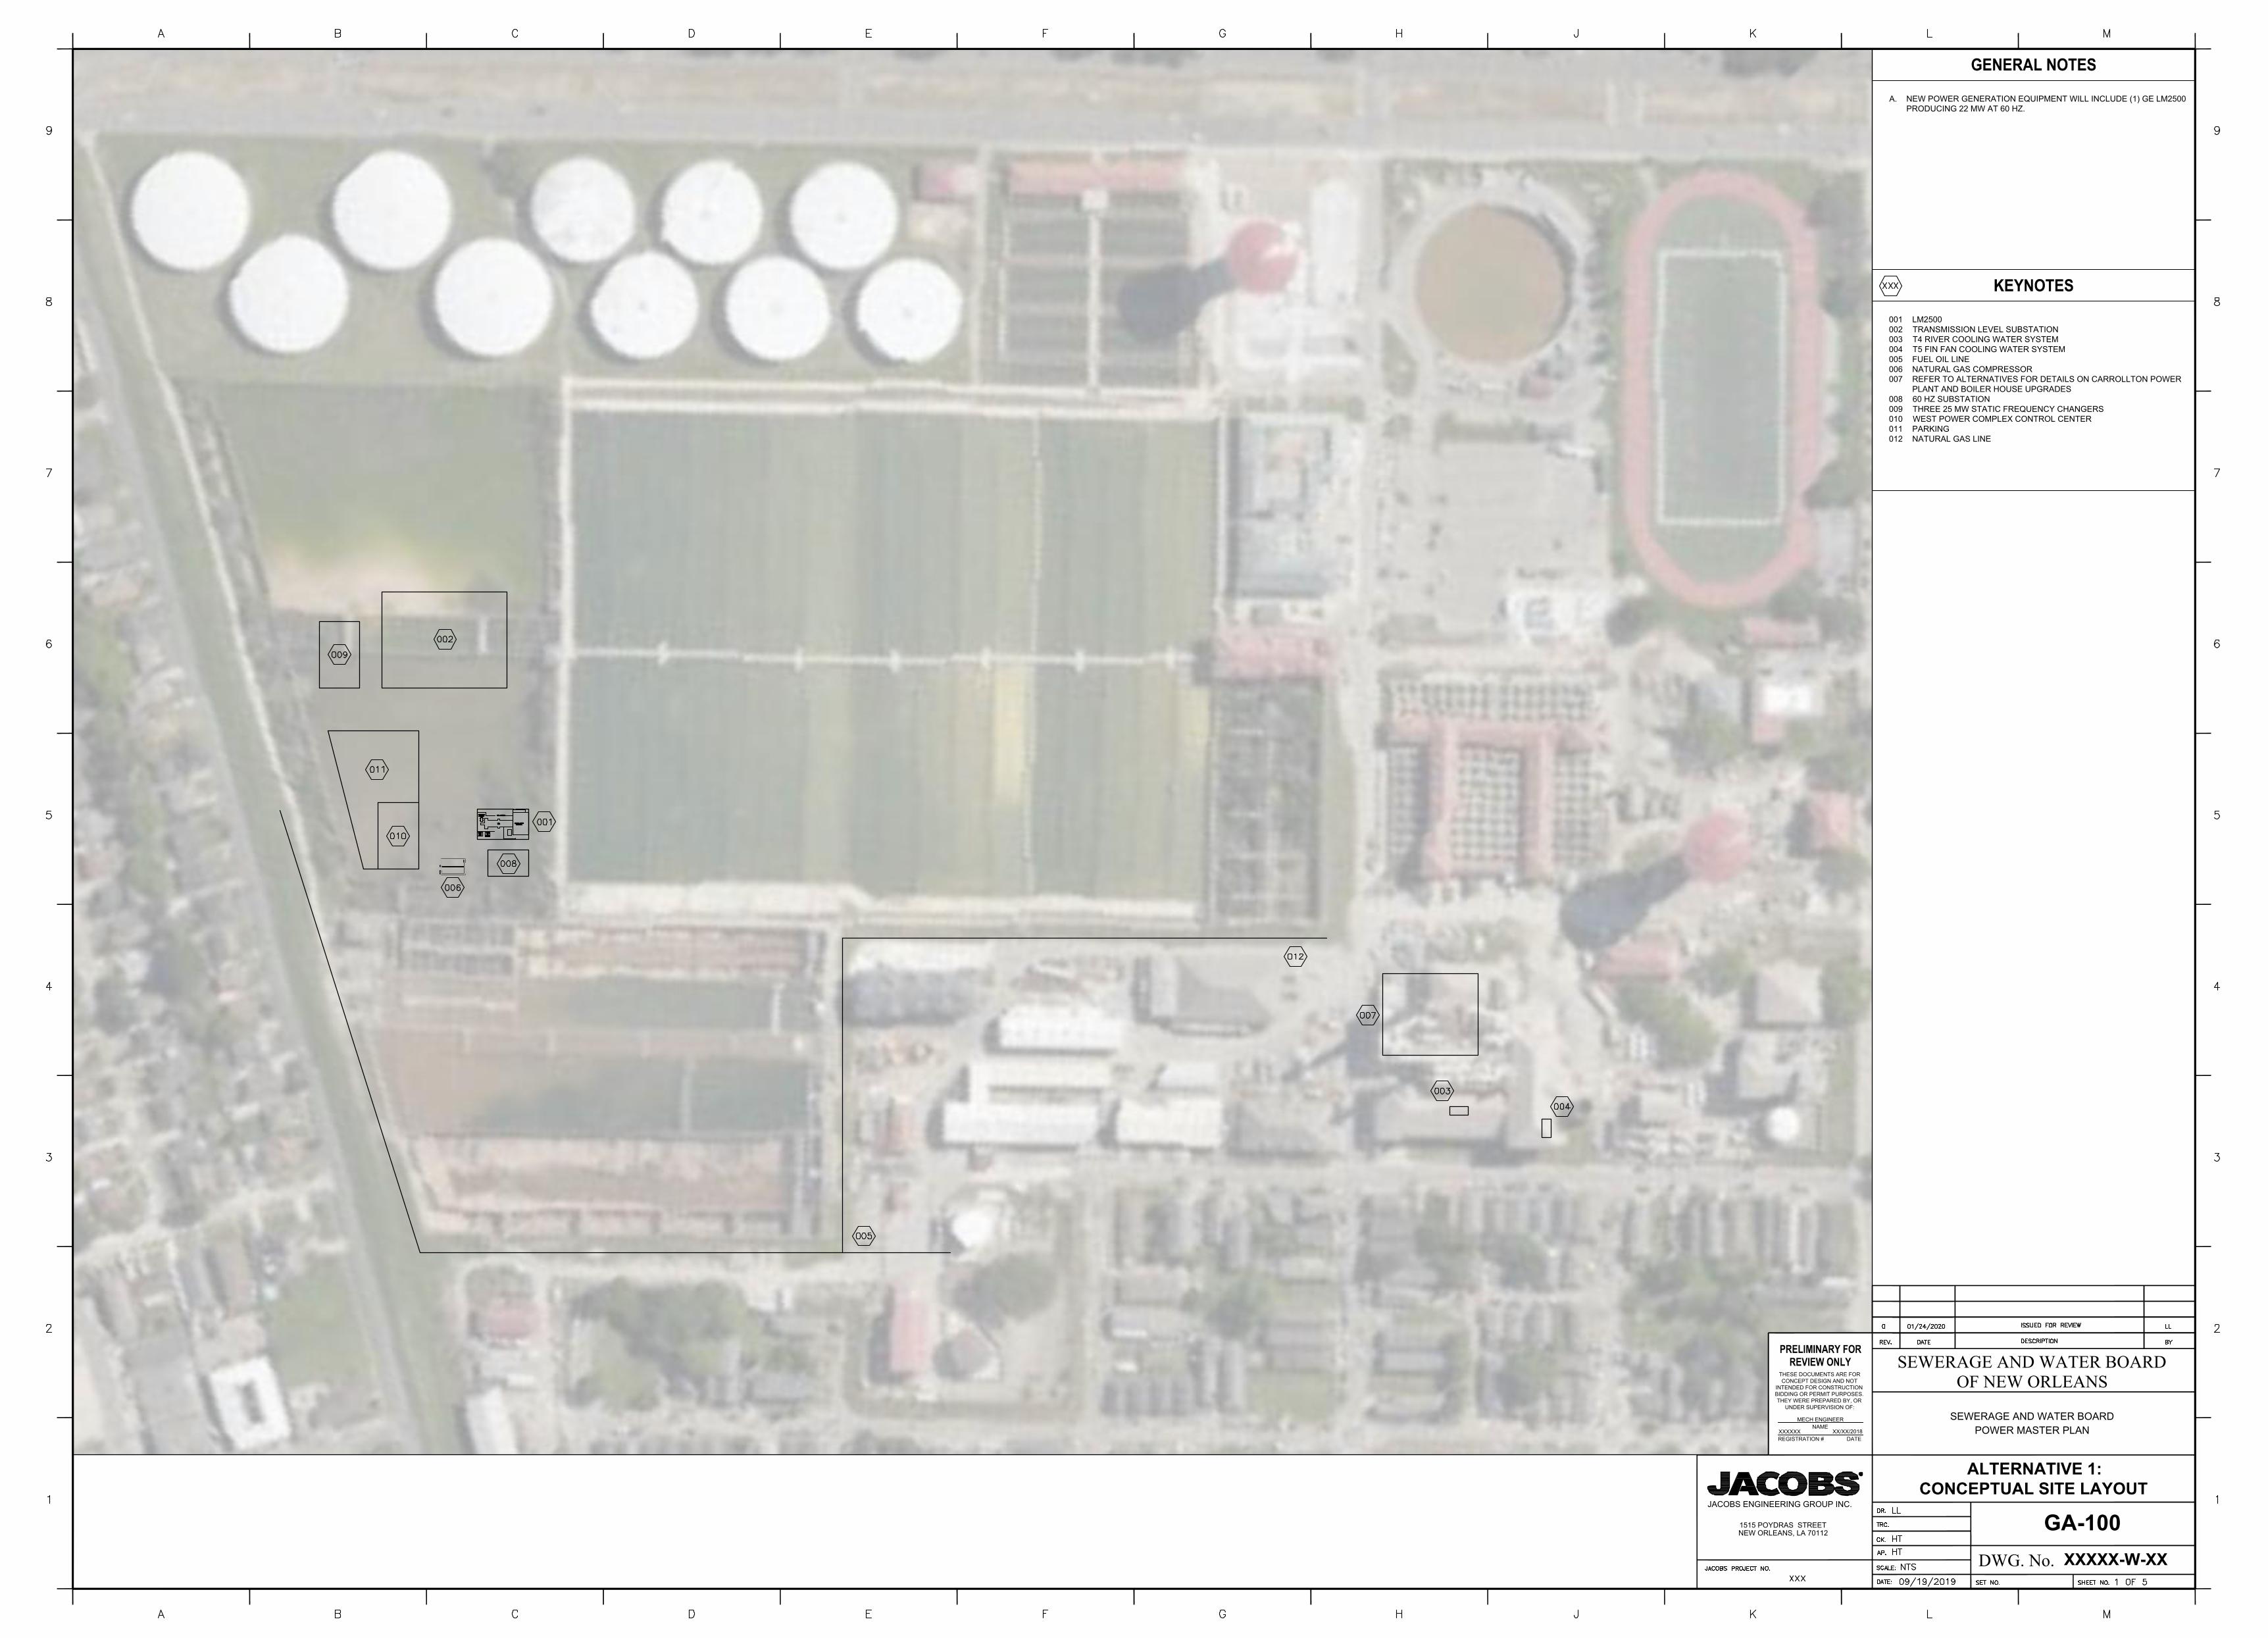
DWG. No.
SEWERAGE AND WATER BOARDOF NEW ORLEANS
SEWERAGE AND WATER BOARD
POWER MASTER PLAN
XXXXX-W-XX
1515 POYDRAS STREET
NEW ORLEANS, LA 70112
PRELIMINARY FOR
REVIEW ONLY
THESE DOCUMENTS ARE FOR
CONCEPT DESIGN AND NOT
INTENDED FOR CONSTRUCTION
BIDDING OR PERMIT PURPOSES.
THEY WERE PREPARED BY, OR
UNDER SUPERVISION OF:
NAME
REGISTRATION # DATE
XX/XX/2018XXXXXX
MECH ENGINEER
JACOBS ENGINEERING GROUP INC.
ALTERNATIVE 1:
CONCEPTUAL SITE LAYOUT
GA-100
GENERAL NOTES
A. NEW POWER GENERATION EQUIPMENT WILL INCLUDE (1) GE LM2500
PRODUCING 22 MW AT 60 HZ.
KEYNOTES
001 LM2500
002 TRANSMISSION LEVEL SUBSTATION
003 T4 RIVER COOLING WATER SYSTEM
004 T5 FIN FAN COOLING WATER SYSTEM
005 FUEL OIL LINE
006 NATURAL GAS COMPRESSOR
007 REFER TO ALTERNATIVES FOR DETAILS ON CARROLLTON POWER
PLANT AND BOILER HOUSE UPGRADES
008 60 HZ SUBSTATION
009 THREE 25 MW STATIC FREQUENCY CHANGERS
010 WEST POWER COMPLEX CONTROL CENTER
011 PARKING
012 NATURAL GAS LINE

DWG. No.
SEWERAGE AND WATER BOARDOF NEW ORLEANS
SEWERAGE AND WATER BOARD
POWER MASTER PLAN
XXXXX-W-XX
1515 POYDRAS STREET
NEW ORLEANS, LA 70112
PRELIMINARY FOR
REVIEW ONLY
THESE DOCUMENTS ARE FOR
CONCEPT DESIGN AND NOT
INTENDED FOR CONSTRUCTION
BIDDING OR PERMIT PURPOSES.
THEY WERE PREPARED BY, OR
UNDER SUPERVISION OF:
NAME
REGISTRATION # DATE
XX/XX/2018XXXXXX
MECH ENGINEER
JACOBS ENGINEERING GROUP INC.
ALTERNATIVE 2 OR 4:
CONCEPTUAL SITE LAYOUT
GA-100
GENERAL NOTES
KEYNOTES
001 LM2500 (TYP. 3)
002 TRANSMISSION LEVEL SUBSTATION
003 THREE 25 MW STATIC FREQUENCY CHANGERS
004 60 HZ SUBSTATION
005 NATURAL GAS LINE
006 FUEL OIL LINE
007 NATURAL GAS COMPRESSOR
008 WEST POWER COMPLEX CONTROL CENTER
009 PARKING
A. NEW POWER GENERATION EQUIPMENT WILL INCLUDE (3) GE LM2500
PRODUCING 22 MW AT 60 HZ EACH.

DWG. No.
SEWERAGE AND WATER BOARDOF NEW ORLEANS
SEWERAGE AND WATER BOARD
POWER MASTER PLAN
XXXXX-W-XX
1515 POYDRAS STREET
NEW ORLEANS, LA 70112
PRELIMINARY FOR
REVIEW ONLY
THESE DOCUMENTS ARE FOR
CONCEPT DESIGN AND NOT
INTENDED FOR CONSTRUCTION
BIDDING OR PERMIT PURPOSES.
THEY WERE PREPARED BY, OR
UNDER SUPERVISION OF:
NAME
REGISTRATION # DATE
XX/XX/2018XXXXXX
MECH ENGINEER
JACOBS ENGINEERING GROUP INC.
ALTERNATIVE 3:
CONCEPTUAL SITE LAYOUT
GA-100
GENERAL NOTES
A. NEW POWER GENERATION EQUIPMENT WILL INCLUDE (3) WARTSILA
18V50DF.
KEYNOTES
001 WARTSILA 18V50DF (TYP. 3)
002 TRANSMISSION LEVEL SUBSTATION
003 60 HZ SUBSTATION
004 NATURAL GAS LINE
005 FUEL OIL LINE
006 THREE 25 MW STATIC FREQUENCY CHANGERS
007 WEST POWER COMPLEX BUILDING WITH CONTROL CENTER
008 PARKING
009 SCR, STACK, AND EXHAUST SYSTEM PER ENGINE (TYP. 3)
010 AMMONIA STORAGE TANK

Appendix C Summary of Alternatives


SWBNO Power Master Plan
Alternatives Summary
March 2020
Alternative Description
Distribution System from
Carrollton Plant Pump Stations Utility Connection Steam Generation Capacity Elimination of Cross Connection
New Gas
Compressor
Upgrades Required to Existing
Generation Assets
Alternative 0
Business as Usual,
Extend Remaining
Useful Service Life of
Existing Plant
25 Hz, Operated at 6.6 kV
Replace 24 existing
feeders
-25 Hz Pumps remain powered by 25Hz
Generators at Carrollton Power Plant
and/or Frequency Changers (from utility
power)
-60 Hz Pumps reamain powered locally
by unreliable Entergy sources, backed up
by local Emergency Diesel Generators
Utilize existing Entergy connections,
which are a combination of residential
and commercial quality
Major upgrades required required to
upgrade boiler plant and maintain
reliability for the duration of the Life
Cycle Cost (LCC) evaluation.
T1 - River Cooling (pretreatment stream)
T3 - River Cooling (pretreatment stream)
T4 - River Cooling (pretreatment stream)
T5 - Install Fin-Fan Cooler or send cooling water
to drain
Not Required
-Replace existing PFC with a 15 MW Static
Frequency Changer
-Major equipment upgrades required at
STG1, STG3 and CTG5 to improve system
reliability for the duration of the LCC
evaluation.
-T6 upgrades required to mitigate
emissions
-All pump motors, switchgear and
electrical equipment susceptible to water
damage must be raised.
Alternative 1
Install 50 MW Utility
Substation, Reduce
Steam Use and
Convert to 60Hz
Converted to 60 Hz, 13.8
kV.
Replace 24 existing
feeders
Replace 25 Hz pump motors with new 60
Hz vertical sychronous motors mounted
above the maximum considered flood
elevation in the pump stations. New
gearboxes installed.
New industrial / utility grade
substation, two 15/20/25 MVA
transformers
Install three 25 MW Static Frequency
Changers to share power power
across 25 and 60 Hz, as needed.
All generation assets become backup
only for when Entergy is not available
or demand exceeds substation
capacity.
-Decommission all boilers except #2
-Install new 150 kpph Auxiliary Boiler
-Install new steam piping from Boilers #2
and Aux. to T-4
-Decommission all existing steam piping,
including main header
-New Deaerator and Water Treatment
Systems required, but less extensive
boiler house upgrades compared to full
1370 project scope.
T1 - retire, no action needed
T3 - retire, no action needed
T4 - River Cooling (pretreatment stream)
T5 - Install Fin-Fan Cooler or send cooling water
to drain, or river cooling
Yes - 600 PSI gas
requiredMajor equipment upgrades required at
CTG5 to improve system reliability.
Alternative 2
Install 50 MW
Substation, Eliminate
Steam Use, Add CTGs
and Convert to 60Hz
same as Alternative 1 Same as Alternative 1 same as Alternative 1 Retire all steam generation & use
T1 - retire, no action needed
T3 - retire, no action needed
T4 - retire, no further action needed
T5 - retire, no action needed
Yes - 600 PSI gas
requiredMinimal
Alternative 3
Install 50 MW
Substation, Eliminate
Steam Use, Add
Engine Generators
and Covert to 60 Hz
same as Alternative 1 Same as Alternative 1 Same as Alternative 1 Retire all steam generation & use Same as Alternative 2 Not Required Minimal
Alternative 4
Install 120 MW
Substation, Eliminate
Steam Use, Add CTGs
and Convert to 60 Hz
same as Alternative 1 Same as Alternative 1
New industrial / utility grade
substation, two 60 MVA transformers
Install three 25 MW Static Frequency
Changers to share power power
across 25 and 60 Hz, as needed.
All generation assets become backup
only for when Entergy is not available
or demand exceeds substation
capacity.
Retire all steam generation & use Same as Alternative 2Yes - 600 PSI gas
requiredMinimal
Page 1 of 2

SWBNO Power Master Plan
Alternatives Summary
March 2020
Alternative
Alternative 0
Alternative 1
Alternative 2
Alternative 3
Alternative 4
25 Hz Generation Assets 60 Hz Generation Assets Future Generation Assets
Total Reliable Capacity of
SWB assets
Firm (n-1) Reliable Generation Capacity at
Carrollton Pwr Plant and Connected DPS
Future Firm (n-1) Reliable Capacity at
Carollton Plant and Connected DPS
T1 (STG) - 6.0 MW (6.0 MW reliable)
T3 (STG) - 15 MW (6.0 MW reliable)*
T4 (STG) - 20 MW (17.0 MW reliable)*
T5 (CTG) - 20 MW (20.0 MW reliable)
EMDs - 12.5 MW (12.5 MW reliable)
TOTAL - 73.5 total/61.5 reliable
Carrollton Power Plant:
T6 (CTG) - 22 MW
Remote Drainage Pump Stations -
60 Hz Backup Generators Not Connected
Connection of additional 60 Hz drainage pump
stations would require new frequency changers
and is not recommended.
Carrollton Power Plant
83.5 MW*
*Frequency changers used
to convey power between
25Hz and 60Hz sytems as
needed
Carrollton Power Plant
61.5 MW
60 Hz Pumps at Drainage Pump Stations
Varies by Station
N/A
Connection of additional 60 Hz drainage
pump stations to 25 Hz power distribution
system would require new frequency
changers and is not recommended.
T1 (STG) - retire
T3 (STG) - retire
T4 (STG) - 20 MW (20.0 MW reliable)
T5 (CTG) - 20 MW (20.0 MW reliable)*
EMDs - 12.5 MW (12.5 MW reliable)
TOTAL - 52.5 total/52.5 MW reliable
*T4 reliable capacity further reduced due to
reduction in steam generation capacity
T6 (CTG) - 22 MW
DPS diesel generators - 10.4 MW
(1) New Gas Turbine Dual Fuel LM2500 - 22
MW
TOTAL - 54.4 MW
DPS diesel generators - 10.0 MW*
TOTAL - 10.0 MW
*existing generators currently not on SWBNO
distribution (ex. DPS 19)
106.9 MW 84.9 MW 94.9 MW
T1 (STG) - retire
T3 (STG) - retire
T4 (STG) - retire
T5 (CTG) - retire
EMDs - 12.5 MW (12.5 MW reliable)
TOTAL - 12.5 MW
T6 (CTG) - 22 MW
DPS diesel generators - 10.4 MW
(3) New Gas Turbines, Dual Fuel LM2500
(22MW each)
TOTAL - 98.4 MW
Same as Alternative 1110.9 MW
88.9 MW 98.9 MW
Same as Alternative 2
T6 (CTG) - 22 MW
DPS diesel generators - 10.4 MW
(3) Wartsila 18V50DF - 18 MW
TOTAL - 86.4 MW
Same as Alternative 1 98.9 MW 76.9 MW 86.9 MW
Same as Alternative 2 Same as Alternative 2 Same as Alternative 1110.9 MW
88.9 MW 98.9 MW
Page 2 of 2

Appendix D Life Cycle Costs


Natural Gas Escalation: 0.0% Natural Gas Adder: 0.0%
Purchased Electricty
Escalation:0.0% Purchased Electricity Adder: 0.0%
Incremental
Fuel Electricity Annual O&M Costs
Alternate 0 $508,271,100 $10,427,424 $2,935,752 $4,813,909 $1,071,114,925 N/A 120,232 - -
Alternate 1 $509,409,000 $330,396 $6,236,753 $2,674,588 $785,732,477 $285,382,448 79,832 0.12 26.81
Alternate 2 $549,721,000 $246,884 $6,236,753 $1,866,300 $803,221,334 $267,893,591 78,116 4.64 28.56
Alternate 3 $547,075,000 $206,961 $6,236,753 $1,943,157 $801,265,547 $269,849,378 77,788 4.31 28.35
Alternate 4 $553,089,000 $1,351 $8,472,857 $1,800,000 $859,746,716 $211,368,209 77,820 6.36 36.19
Natural Gas Escalation: 0.0% Natural Gas Adder: 0.0%
Purchased Electricty
Escalation:0.0% Purchased Electricity Adder: 0.0%
Incremental
Fuel Electricity Annual O&M Costs
Alternate 0 $508,271,100 $10,427,424 $2,935,752 $4,813,909 $1,071,114,925 N/A 120,232 - -
Alternate 1 $509,409,000 $330,396 $3,362,831 $2,674,588 $705,152,351 $365,962,574 79,832 0.09 20.90
Alternate 2 $549,721,000 $246,884 $3,362,831 $1,866,300 $722,641,208 $348,473,717 78,116 3.57 21.95
Alternate 3 $547,075,000 $206,961 $3,362,831 $1,943,157 $720,685,421 $350,429,504 77,788 3.32 21.83
Alternate 4 $553,089,000 $1,351 $4,568,945 $1,800,000 $750,287,329 $320,827,595 77,820 4.19 23.84
Notes:
1. Electric costs are the same in Alt 1-3 since the total KWH and rate schedule used are consistent.
2. Alternate 0 Fuel and Electric Costs were taken from the 2018 Utility spreadsheets provided by SWBNO.
3. A value of 1,125 lbs/MWh of emissions was used to calculated the Purchased Power Emissions; US Energy Information Administration for the New Orleans region.
4. Fuel usage and emissions were calculated using 300 hours based on actual usage included in the 2018 Utility spreadsheets provided by SWBNO.
5. Per the EPA it is estimated that are 0.0551 tons of emissions per Mcf of natural gas, this value was used to calculate the emissions in alternate 0.
LARGE INTERRUPTIBLE RATE SCHEDULE - SUMMARY OF LIFE CYCLE COST COMPARISONS
SWBNO Power Master Plan
Sensitivity Adjustments -->
Option
Estimated Installed
Costs
Annual Purchased Utility Costs
30-Year Life Cycle Cost 30-Year LCC Savings Emissions (tons/yr)
Payback Period
(yrs)
WPC Payback
Period (yrs)
Annual Purchased Utility Costs
HIGH VOLTAGE RATE SCHEDULE - SUMMARY OF LIFE CYCLE COST COMPARISONS
SWBNO Power Master Plan
Sensitivity Adjustments -->
Option
Estimated Installed
Costs 30-Year Life Cycle Cost 30-Year LCC Savings Emissions (tons/yr)
Payback Period
(yrs)
WPC Payback
Period (yrs)


Appendix E Operation and Maintenance Costs


Item Quantity Interval (Years) First Year Cost / Each Cost/Interval
Gas/Steam Turbine LTSA (per kW-h) 109,374,768 1 1 $0.0055 $601,561
Water Consumption (gal) 6,364,800 1 1 $0.008 $50,918
Ammonia Consumption (gal) 2,858 1 1 $0.50 $1,429
Misc. BOP O&M 1 1 1 $1,250,000 $1,250,000Annual Labor
Plant Manager 1 1 1 $200,000 $200,000
Plant Engineer 4 1 1 $150,000 $600,000
Turbine Specialist 1 1 1 $100,000 $100,000
Operation Supervisors 3 1 1 $100,000 $300,000
Steam Plant Operator 5 1 1 $80,000 $400,000
Power Plant Operator 3 1 1 $80,000 $240,000
Mechanic 4 1 1 $80,000 $320,000
Electrician 4 1 1 $80,000 $320,000
I&C/Controls 2 1 1 $80,000 $160,000
Administrative 2 1 1 $60,000 $120,000
Boiler 1 Re-Tube 1 25 25 $750,000 $750,000
Boiler 2 Re-Tube 1 25 15 $750,000 $750,000
Boiler 3 Re-Tube 1 25 25 $750,000 $750,000
Boiler 4 Re-Tube 1 25 27 $750,000 $750,000
Boiler 5 Re-Tube 1 25 27 $750,000 $750,000
Boiler 6 Re-Tube 1 25 28 $750,000 $750,000
Notes:
LTSA based on actual hours used in 2018 based on Utility bills provided by SWBNO.
Assumed emissions control by SCR (selective catalytic reduction) ammonia consumption: 0.12 gal/MMBTU fuel consumed at average load, based on industry standard
Water consumption was based on using max steam plant output for 900 hrs/yr and min output for remaining of year.
Water consumption was calculated as 4% makeup water only, based on industry standard.
BOP O&M includes preventative maintenance budget items for various valves, pipes, building, electrical, etc.
Total Annual O&M $4,813,909
Applied a complexitity factor increase of 25% to the LTSA and the BOP O&M, due to the limited amount of parts and labor
for 25 Hz equipment in comparision to modern equipment.
Non-Annually Recurring
Alternate 0: O&M Cost EstimateSewerage and Water Board of New Orleans
Annually Recurring

Item Quantity Interval (Years) First Year Cost / Each Cost/Interval
Gas/Steam Turbine LTSA (per kW-h) 7,800,000 1 1 $0.0096 $74,588
Water Consumption (gal) 0 1 1 $0.0080 $0
Ammonia Consumption (gal) 0 1 1 $0.50 $0
Misc. BOP O&M 1 1 1 $450,000 $450,000
Plant Manager 1 1 1 $200,000 $200,000
Plant Engineer 4 1 1 $150,000 $600,000
Turbine Specialist 1 1 1 $100,000 $100,000
Operation Supervisors 2 1 1 $100,000 $200,000
Steam Plant Operator 2 1 1 $80,000 $160,000
Power Plant Operator 3 1 1 $80,000 $240,000
Mechanic 2 1 1 $80,000 $160,000
Electrician 2 1 1 $80,000 $160,000
I&C/Controls 2 1 1 $80,000 $160,000
Administrative 2 1 1 $60,000 $120,000
Boiler 2 Re-Tube 1 25 15 $750,000 $750,000
Aux Boiler Re-Tube 1 25 25 $750,000 $750,000
Notes:
LTSA values based on 26 MW and 300 hrs run time.
Assumed emissions control by SCR (selective catalytic reduction) ammonia consumption: 0.12 gal/MMBTU fuel consumed at average load
Water consumption is zero due to operating the gas turbines prior to operating T4.
Ammonia consuption is zero due to operating the gas turbines prior to operating the boilers for T4.
BOP O&M includes preventative maintenance budget items for various valves, pipes, building, electrical, etc.
Total Annual O&M $2,674,588
Alternate 1: O&M Cost EstimateSewerage and Water Board of New Orleans
Annually Recurring
Non-Annually Recurring
Applied a complexitity factor increase of 12.5% to the LTSA and the BOP O&M, due to the limited amount of parts and
labor for 25 Hz equipment in comparision to modern equipment.
Annual Labor
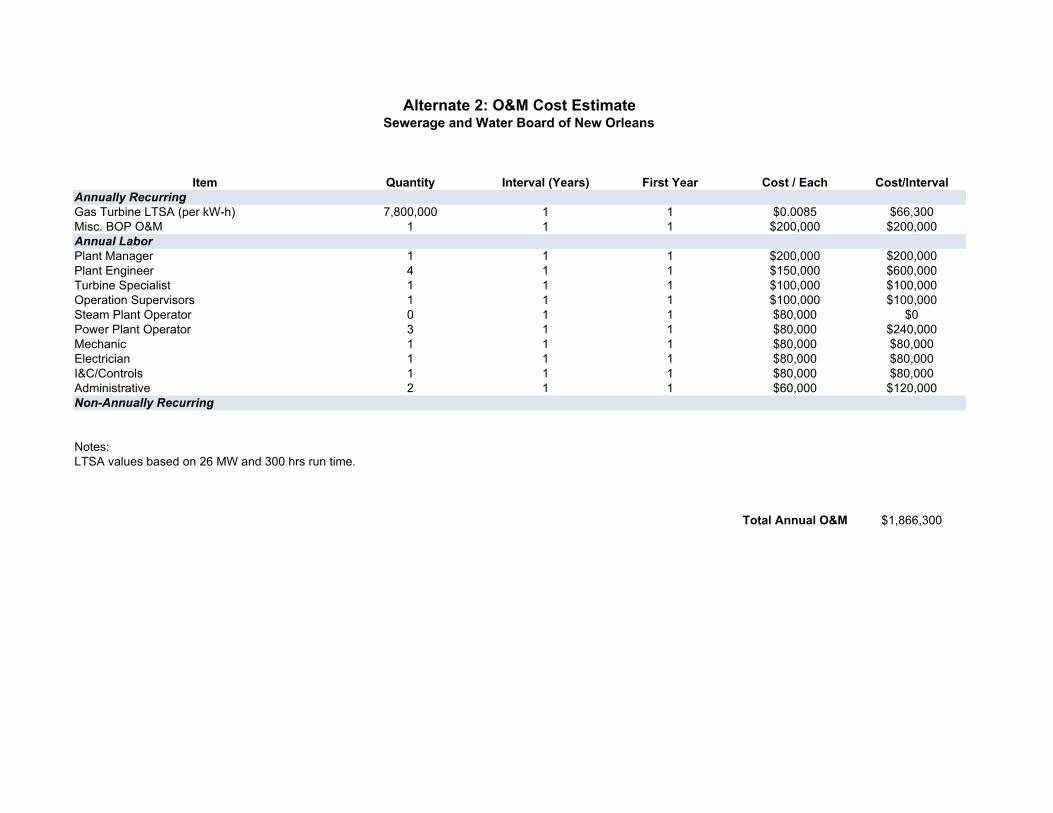
Item Quantity Interval (Years) First Year Cost / Each Cost/Interval
Gas Turbine LTSA (per kW-h) 7,800,000 1 1 $0.0085 $66,300Misc. BOP O&M 1 1 1 $200,000 $200,000
Plant Manager 1 1 1 $200,000 $200,000Plant Engineer 4 1 1 $150,000 $600,000Turbine Specialist 1 1 1 $100,000 $100,000Operation Supervisors 1 1 1 $100,000 $100,000Steam Plant Operator 0 1 1 $80,000 $0Power Plant Operator 3 1 1 $80,000 $240,000Mechanic 1 1 1 $80,000 $80,000Electrician 1 1 1 $80,000 $80,000I&C/Controls 1 1 1 $80,000 $80,000Administrative 2 1 1 $60,000 $120,000
Notes:LTSA values based on 26 MW and 300 hrs run time.
Total Annual O&M $1,866,300
Alternate 2: O&M Cost EstimateSewerage and Water Board of New Orleans
Annually Recurring
Non-Annually Recurring
Annual Labor

Item Quantity Interval (Years) First Year Cost / Each Cost/Interval
Reciprocating Engine LTSA (per kW-h) 7,800,000 1 1 $0.0214 $202,524Ammonia Consumption (gal)* 81,266 1 1 $0.50 $40,633Misc. BOP O&M 1 1 1 $200,000 $200,000
Plant Manager 1 1 1 $200,000 $200,000Plant Engineer 4 1 1 $150,000 $600,000Turbine Specialist 0 1 1 $100,000 $0Operation Supervisors 1 1 1 $100,000 $100,000Steam Plant Operator 0 1 1 $80,000 $0Power Plant Operator 3 1 1 $80,000 $240,000Mechanic 1 1 1 $80,000 $80,000Electrician 1 1 1 $80,000 $80,000I&C/Controls 1 1 1 $80,000 $80,000Administrative 2 1 1 $60,000 $120,000
Notes:Assumed SCR ammonia consumption: 0.12 gal/MMBTU fuel consumed at average load, based on industry standard.LTSA values based on information from Wartsila provided 10/22/2019
Total Annual O&M $1,943,157
Alternate 3: O&M Cost EstimateSewerage and Water Board of New Orleans
Annually Recurring
Non-Annually Recurring
Annual Labor

Item Quantity Interval (Years) First Year Cost / Each Cost/Interval
Gas Turbine LTSA (per kW-h) 0 1 1 $0.0085 $0Misc. BOP O&M 1 1 1 $200,000 $200,000
Plant Manager 1 1 1 $200,000 $200,000Plant Engineer 4 1 1 $150,000 $600,000Turbine Specialist 1 1 1 $100,000 $100,000Operation Supervisors 1 1 1 $100,000 $100,000Steam Plant Operator 0 1 1 $80,000 $0Power Plant Operator 3 1 1 $80,000 $240,000Mechanic 1 1 1 $80,000 $80,000Electrician 1 1 1 $80,000 $80,000I&C/Controls 1 1 1 $80,000 $80,000Administrative 2 1 1 $60,000 $120,000
Notes:LTSA values are based on run time. In this alternative, it is assumed that all normal demand will be provided by Entergy and the new generators will not run.
Total Annual O&M $1,800,000
Alternate 4: O&M Cost EstimateSewerage and Water Board of New Orleans
Annually Recurring
Non-Annually Recurring
Annual Labor


Appendix F Sensitivity Analysis


$0
$50
$100
$150
$200
$250
$300
$350
2025 2030 2035 2040 2045 2050
Cu
mm
ula
tiv
e L
CC
Sa
vin
gs
(in
Mil
lio
ns)
Year
Alternate 1: Utility Rate Sensitivity Analysis
Baseline
Natural Gas 25%
Natural Gas -25%
Electricity 25%
Electricity -25%

$0
$50
$100
$150
$200
$250
$300
$350
2025 2030 2035 2040 2045 2050
Cu
mm
ula
tiv
e L
CC
Sa
vin
gs
(in
Mil
lio
ns)
Year
Alternate 2: Utility Rate Sensitivity Analysis
Baseline
Natural Gas 25%
Natural Gas -25%
Electricity 25%
Electricity -25%

$0
$50
$100
$150
$200
$250
$300
$350
2025 2030 2035 2040 2045 2050
Cu
mm
ula
tiv
e L
CC
Sa
vin
gs
(in
Mil
lio
ns)
Year
Alternate 3: Utility Rate Sensitivity Analysis
Baseline
Natural Gas 25%
Natural Gas -25%
Electricity 25%
Electricity -25%

$0
$50
$100
$150
$200
$250
$300
2025 2030 2035 2040 2045 2050
Cu
mm
ula
tiv
e L
CC
Sa
vin
gs
(in
Mil
lio
ns)
Year
Alternate 4: Utility Rate Sensitivity Analysis
Baseline
Natural Gas 25%
Natural Gas -25%
Electricity 25%
Electricity -25%

Appendix G Preliminary Cost Estimate


SEWERAGE AND WATER BOARD OF NEW ORLEANS
POWER MASTER PLAN SWBNWO08
PROJECT COST ESTIMATE 3/3/2020
Phase 1 Phase 2A Phase 2B Phase 2C Phase 2D Total
Alternative 0 111,268,290$ 136,594,778$ 80,943,023$ 105,435,904$ 74,028,838$ 508,271,000$
Alternative 1 188,914,079$ 124,205,383$ 44,576,025$ 90,813,927$ 86,850,037$ 535,360,000$
Alternative 2 231,488,224$ 123,394,439$ 44,284,986$ 90,220,997$ 86,282,988$ 575,672,000$
Alternative 3 230,424,219$ 122,827,273$ 44,081,436$ 89,806,309$ 85,886,400$ 573,026,000$
Alternative 4 232,842,559$ 124,116,365$ 44,544,077$ 90,748,840$ 86,787,792$ 579,040,000$
Preliminary Cost EstimatePage 1 of 6

SEWERAGE AND WATER BOARD OF NEW ORLEANS
POWER MASTER PLAN SWBNWO08
PROJECT COST ESTIMATE 3/3/2020
ALTERNATE 0 - BASELINE
DESCRIPTION QTY UM UNIT $$ TOTAL
Full 1370 Boiler Upgrades 1 LS 44,806,000$ 44,806,000$ 20% 20%
Elimination of Cross Connect to T1, T3, T4 and T5 1 LS 4,168,000$ 4,168,000$ 20% 30%
Development and installation of integrated communications & control system, Old Equip 1 LS 15,000,000$ 15,000,000$ 20% 30%- LS -$ -$
SubTotal (2019 Dollars) 63,974,000$ 12,795,000$ 14,712,000$
Escalated Total 67,212,684$ 13,442,747$ 15,456,795$
Reconditioning of T1 1 EA 24,550,000$ 24,550,000$ 20% 30%
Alt 0 - Phase 2A Waterproofing motors & switchgear inside DPS buildings 1 EA 24,480,000$ 24,480,000$ 20% 30%Phase 2A Feeder Replacements 1 EA 25,721,250$ 25,721,250$ 20% 30%
SubTotal (2019 Dollars) 74,751,250$ 14,950,000$ 22,425,000$
Escalated Total 82,511,393$ 16,502,003$ 24,753,004$
Reconditioning of T3 1 LS 24,550,000$ 24,550,000$ 15% 15%
Alt 0 - Phase 2B Waterproofing motors & switchgear inside DPS buildings 1 EA 8,520,000$ 8,520,000$ 20% 30%Phase 2B Feeder Replacements 1 LS 9,091,500$ 9,091,500$ 20% 30%
SubTotal (2019 Dollars) 42,161,500$ 7,205,000$ 8,966,000$
Escalated Total 48,894,414$ 8,355,591$ 10,397,811$
Reconditioning of T5 1 LS 17,839,000$ 17,839,000$ 15% 15%
Alt 0 - Phase 2C Waterproofing motors & switchgear inside DPS buildings 1 EA 17,790,000$ 17,790,000$ 20% 30%
Phase 2C Feeder Replacements 1 LS 16,644,000$ 16,644,000$ 20% 30%
SubTotal (2019 Dollars) 52,273,000$ 9,563,000$ 13,006,000$
Escalated Total 63,689,575$ 11,651,587$ 15,846,548$
Phase 2D Feeder Replacements 1 LS 22,543,500$ 22,543,500$ 20% 30%
Alt 0 - Phase 2D Waterproofing motors & switchgear inside DPS buildings 1 EA 12,390,000$ 12,390,000$ 20% 30%
LS -$
SubTotal (2019 Dollars) 34,933,500$ 6,987,000$ 10,480,000$
Escalated Total 44,717,833$ 8,943,951$ 13,415,286$
Combined Material and Labor Subtotal (including escalation) 307,026,000$
General Conditions and Project Staff (9%) 1 LS 27,632,340$ 27,632,340$
Overhead (5%) 1 LS 15,351,300$ 15,351,300$
Bond and Insurance (1.35%) 1 LS 4,144,851$ 4,144,851$
General Contractor Fees (5%) 1 LS 15,351,300$ 15,351,300$
Material Sales Tax 1 LS -$ -$ - LS -$ -$
SubTotal 62,480,000$
Total Construction Contingency 58,895,878$
Total Design Contingency 79,869,444$
Total Construction Cost 508,271,000$
Items Specifically Excluded from Estimate
Private Communication Network (assumes use of third party fiber)
Phase 2D
Phase 2C
Phase 1 Work
2021
2023
2025
2027
Design
Contingency
Miscellaneous Contractor Costs
CONSTRUCTION Construction
Contingency
Escalation
Year
Phase 2A
Phase 2B
2029
Preliminary Cost EstimatePage 2 of 6

SEWERAGE AND WATER BOARD OF NEW ORLEANS
POWER MASTER PLAN SWBNWO08
PROJECT COST ESTIMATE 3/3/2020
ALTERNATE 1 - INSTALL 50 MW SUBSTATION, REDUCE STEAM USE AND CONVERT TO 60 HZ POWER
DESCRIPTION QTY UM UNIT $$ TOTAL
Partial Boiler Upgrades (Keep Boiler 2, Add Aux Boiler, DA and Wtr Trtmt) 1 LS 10,800,000$ 10,800,000$ 20% 30%
Demolition of T1, T3 and Auxiliaries 1 LS 700,000$ 700,000$ 20% 30%
Partial Boiler House Equipment Demolition 1 LS 1,600,000$ 1,600,000$ 20% 30%
Elimination of Cross Connect to T4 and T5 only 1 LS 4,168,000$ 4,168,000$ 20% 30%
New 50 MVA Substation 1 LS 14,000,000$ 14,000,000$ 20% 20%
West Site Redevelopment and Retention Pond Removal 1 LS 5,000,000$ 5,000,000$ 20% 30%
LM2500 - Complete Outdoor Package with Gas Compressor - Installed 1 LS 16,240,000$ 16,240,000$ 20% 20%
Gas Compressor for LM2500 1 LS 750,000$ 750,000$ 20% 20%
Turbine Install (Struct, Mech, Elec, I&C) 1 LS 5,000,000$ 5,000,000$ 20% 20%
Plant Building to House Engine Generators and Control Room 1 LS 7,200,000$ 7,200,000$ 20% 30%
Fuel Gas and Fuel Oil Lines to West Power Complex 1 LS 731,700$ 731,700$ 20% 30%
New 60 Hz Ring Bus at WPC or PFC Building 1 LS 2,500,000$ 2,500,000$ 20% 30%
New Aux Ring Bus at DPS 3 - LS 1,200,000$ -$ 20% 30%
New 25 MW Static Frequency Changer 3 LS 7,250,000$ 21,750,000$ 20% 30%
Power Plant Control System 1 LS 4,000,000$ 4,000,000$ 20% 30%
New Carrolton Feeders From West Power Complex to Loads 1 LS 1,860,000$ 1,860,000$ 20% 30%
Development and installation of integrated communications & control system, New Equip 1 LS 10,000,000$ 10,000,000$ 20% 30%- LS -$ -$
SubTotal (2019 Dollars) 106,299,700$ 21,260,000$ 28,291,000$
Escalated Total 111,681,122$ 22,336,288$ 29,723,232$
Phase 2A DPS 60 Hz Conversions (New Xfmrs, Swgr, 60 Hz Motor, Gearboxes, etc) 1 EA 40,800,000$ 40,800,000$ 20% 30%
Phase 2A Feeder Replacements 1 LS 25,721,250$ 25,721,250$ 20% 30%
- LS -$ -$ - EA -$ -$
SubTotal (2019 Dollars) 66,521,250$ 13,304,000$ 19,956,000$
Escalated Total 73,427,013$ 14,685,127$ 22,027,690$
Phase 2B DPS 60 Hz Conversions (New Xfmrs, Swgr, 60 Hz Motor, Gearboxes, etc) 1 EA 14,200,000$ 14,200,000$ 20% 30%
Phase 2B Feeder Replacements 1 LS 9,091,500$ 9,091,500$ 20% 30%LS -$ -$
SubTotal (2019 Dollars) 23,291,500$ 4,658,000$ 6,987,000$
Escalated Total 26,352,194$ 5,270,099$ 7,905,149$
Phase 2C DPS 60 Hz Conversions (New Xfmrs, Swgr, 60 Hz Motor, Gearboxes, etc) 1 LS 29,650,000$ 29,650,000$ 20% 30%
Phase 2C Feeder Replacements 1 LS 16,644,000$ 16,644,000$ 20% 30%LS -$ -$
SubTotal (2019 Dollars) 46,294,000$ 9,259,000$ 13,888,000$
Escalated Total 53,686,847$ 10,737,601$ 16,105,822$
Phase 2D DPS 60 Hz Conversions (New Xfmrs, Swgr, 60 Hz Motor, Gearboxes, etc) 1 LS 20,650,000$ 20,650,000$ 20% 30%
Phase 2D Feeder Replacements 1 LS 22,543,500$ 22,543,500$ 20% 30%
LS -$ -$
SubTotal (2019 Dollars) 43,193,500$ 8,639,000$ 12,958,000$
Escalated Total 51,343,498$ 10,269,056$ 15,402,990$
Combined Material and Labor Subtotal (including escalation) 316,491,000$
General Conditions and Project Staff (9%) 1 LS 28,484,190$ 28,484,190$
Overhead (5%) 1 LS 15,824,550$ 15,824,550$
Bond and Insurance (1.35%) 1 LS 4,272,629$ 4,272,629$
General Contractor Fees (5%) 1 LS 15,824,550$ 15,824,550$
Material Sales Tax 1 LS -$ -$ - LS -$ -$
SubTotal 64,406,000$
Total Construction Contingency 63,298,171$
Total Design Contingency 91,164,883$
Total Construction Cost 535,360,000$
Items Specifically Excluded from Estimate
Hardening DPS buildings to prevent flood water intrusion
Private Communication Network (assumes use of third party fiber)
2026
CONSTRUCTION Construction
Contingency
Design
Contingency
Escalation
Year
Phase 1
Phase 2A
2021
Phase 2B
Phase 2C
Phase 2D
Miscellaneous Contractor Costs
2023
2024
2025
Preliminary Cost EstimatePage 3 of 6

SEWERAGE AND WATER BOARD OF NEW ORLEANS
POWER MASTER PLAN SWBNWO08
PROJECT COST ESTIMATE 3/3/2020
ALTERNATE 2 - INSTALL 50 MW SUBSTATION, ELIMINATE STEAM USE, ADD CTGs AND CONVERT TO 60 HZ POWER
DESCRIPTION QTY UM UNIT $$ TOTAL
Demolition of T1, T3 and Auxiliaries 1 LS 700,000$ 700,000$ 20% 30%
Demolition of T4, T5 and Auxiliaries 1 LS 700,000$ 700,000$ 20% 30%
Complete Boiler House Equipment Demolition 1 LS 1,700,000$ 1,700,000$ 20% 30%
New 50 MVA Substation 1 LS 14,000,000$ 14,000,000$ 20% 20%
West Site Redevelopment and Retention Pond Removal 1 LS 5,000,000$ 5,000,000$ 20% 30%
LM2500 - Complete Outdoor Package with Gas Compressor - Installed 3 LS 16,240,000$ 48,720,000$ 20% 20%
Gas Compressor for LM2500 3 LS 750,000$ 2,250,000$ 20% 20%
Turbine Install (Struct, Mech, Elec, I&C) 2 LS 5,000,000$ 10,000,000$ 20% 20%
Plant Building to House Engine Generators and Control Room 1 LS 7,200,000$ 7,200,000$ 20% 30%
Fuel Gas and Fuel Oil Lines to West Power Complex 1 LS 731,700$ 731,700$ 20% 30%
New 60 Hz Ring Bus at WPC or PFC Building 1 LS 2,500,000$ 2,500,000$ 20% 30%
New Aux Ring Bus at DPS 3 - LS 1,200,000$ -$ 20% 30%
New 25 MW Static Frequency Changer 3 LS 7,250,000$ 21,750,000$ 20% 30%
Power Plant Control System 1 LS 4,000,000$ 4,000,000$ 20% 30%
New Carrolton Feeders From West Power Complex to Loads 1 LS 1,860,000$ 1,860,000$ 20% 30%
Development and installation of integrated communications & control system, New Equip 1 LS 10,000,000$ 10,000,000$ 20% 30%- -$ -$
SubTotal (2019 Dollars) 131,111,700$ 26,222,000$ 31,837,000$
Escalated Total 137,749,230$ 27,549,489$ 33,448,748$
Phase 2A DPS 60 Hz Conversions (New Xfmrs, Swgr, 60 Hz Motor, Gearboxes, etc) 1 EA 40,800,000$ 40,800,000$ 20% 30%
Phase 2A Feeder Replacements 1 LS 25,721,250$ 25,721,250$ 20% 30%
- LS -$ -$ - EA -$ -$
SubTotal (2019 Dollars) 66,521,250$ 13,304,000$ 19,956,000$
Escalated Total 73,427,013$ 14,685,127$ 22,027,690$
Phase 2B DPS 60 Hz Conversions (New Xfmrs, Swgr, 60 Hz Motor, Gearboxes, etc) 1 EA 14,200,000$ 14,200,000$ 20% 30%
Phase 2B Feeder Replacements 1 LS 9,091,500$ 9,091,500$ 20% 30%LS 24,550,000$ -$
SubTotal (2019 Dollars) 23,291,500$ 4,658,000$ 6,987,000$
Escalated Total 26,352,194$ 5,270,099$ 7,905,149$
Phase 2C DPS 60 Hz Conversions (New Xfmrs, Swgr, 60 Hz Motor, Gearboxes, etc) 1 LS 29,650,000$ 29,650,000$ 20% 30%
Phase 2C Feeder Replacements 1 LS 16,644,000$ 16,644,000$ 20% 30%LS -$ -$
SubTotal (2019 Dollars) 46,294,000$ 9,259,000$ 13,888,000$
Escalated Total 53,686,847$ 10,737,601$ 16,105,822$
Phase 2D DPS 60 Hz Conversions (New Xfmrs, Swgr, 60 Hz Motor, Gearboxes, etc) 1 LS 20,650,000$ 20,650,000$ 20% 30%
Phase 2D Feeder Replacements 1 LS 22,543,500$ 22,543,500$ 20% 30%
LS -$ -$
SubTotal (2019 Dollars) 43,193,500$ 8,639,000$ 12,958,000$
Escalated Total 51,343,498$ 10,269,056$ 15,402,990$
Combined Material and Labor Subtotal (including escalation) 342,559,000$
General Conditions and Project Staff (9%) 1 LS 30,830,310$ 30,830,310$
Overhead (5%) 1 LS 17,127,950$ 17,127,950$
Bond and Insurance (1.35%) 1 LS 4,624,547$ 4,624,547$
General Contractor Fees (5%) 1 LS 17,127,950$ 17,127,950$
Material Sales Tax 1 LS -$ -$ - LS -$ -$
SubTotal 69,711,000$
Total Construction Contingency 68,511,372$
Total Design Contingency 94,890,400$
Total Construction Cost 575,672,000$
Items Specifically Excluded from Estimate
Hardening DPS buildings to prevent flood water intrusion
Private Communication Network (assumes use of third party fiber)
2025
CONSTRUCTION Construction
Contingency
Design
Contingency
Escalation
Year
Phase 1
2021
Phase 2D
2026
Miscellaneous Contractor Costs
Phase 2A
2023
Phase 2B
2024
Phase 2C
Preliminary Cost EstimatePage 4 of 6

SEWERAGE AND WATER BOARD OF NEW ORLEANS
POWER MASTER PLAN SWBNWO08
PROJECT COST ESTIMATE 3/3/2020
ALTERNATE 3 - INSTALL 50 MW SUBSTATION, ELIMINATE STEAM USE, ADD ENGINE GENERATORS AND CONVERT TO 60 HZ POWER
DESCRIPTION QTY UM UNIT $$ TOTAL
Demolition of T1, T3 and Auxiliaries 1 LS 700,000$ 700,000$ 20% 30%
Demolition of T4, T5 and Auxiliaries 1 LS 700,000$ 700,000$ 20% 30%
Complete Boiler House Equipment Demolition 1 LS 1,700,000$ 1,700,000$ 20% 30%
New 50 MVA Substation 1 LS 14,000,000$ 14,000,000$ 20% 20%
West Site Redevelopment and Retention Pond Removal 1 LS 5,000,000$ 5,000,000$ 20% 30%
Wartsila 18V50DF - Installed 3 LS 19,800,000$ 59,400,000$ 20% 20%
Plant Building to House Engine Generators and Control Room 1 LS 7,200,000$ 7,200,000$ 20% 30%
Fuel Gas and Fuel Oil Lines to West Power Complex 1 LS 731,700$ 731,700$ 20% 30%
New 60 Hz Ring Bus at WPC or PFC Building 1 LS 2,500,000$ 2,500,000$ 20% 30%
New Aux Ring Bus at DPS 3 - LS 1,200,000$ -$ 20% 30%
New 25 MW Static Frequency Changer 3 LS 7,250,000$ 21,750,000$ 20% 30%
Power Plant Control System 1 LS 4,000,000$ 4,000,000$ 20% 30%
New Carrolton Feeders From West Power Complex to Loads 1 LS 1,860,000$ 1,860,000$ 20% 30%
Development and installation of integrated communications & control system, New Equip 1 LS 10,000,000$ 10,000,000$ 20% 30%- -$ -$
SubTotal (2019 Dollars) 129,541,700$ 25,908,000$ 31,523,000$
Escalated Total 136,099,749$ 27,219,593$ 33,118,852$
Phase 2A DPS 60 Hz Conversions (New Xfmrs, Swgr, 60 Hz Motor, Gearboxes, etc) 1 EA 40,800,000$ 40,800,000$ 20% 30%
Phase 2A Feeder Replacements 1 LS 25,721,250$ 25,721,250$ 20% 30%
- LS -$ -$ - EA -$ -$
SubTotal (2019 Dollars) 66,521,250$ 13,304,000$ 19,956,000$
Escalated Total 73,427,013$ 14,685,127$ 22,027,690$
Phase 2B DPS 60 Hz Conversions (New Xfmrs, Swgr, 60 Hz Motor, Gearboxes, etc) 1 EA 14,200,000$ 14,200,000$ 20% 30%
Phase 2B Feeder Replacements 1 LS 9,091,500$ 9,091,500$ 20% 30%LS 24,550,000$ -$
SubTotal (2019 Dollars) 23,291,500$ 4,658,000$ 6,987,000$
Escalated Total 26,352,194$ 5,270,099$ 7,905,149$
Phase 2C DPS 60 Hz Conversions (New Xfmrs, Swgr, 60 Hz Motor, Gearboxes, etc) 1 LS 29,650,000$ 29,650,000$ 20% 30%
Phase 2C Feeder Replacements 1 LS 16,644,000$ 16,644,000$ 20% 30%LS -$ -$
SubTotal (2019 Dollars) 46,294,000$ 9,259,000$ 13,888,000$
Escalated Total 53,686,847$ 10,737,601$ 16,105,822$
Phase 2D DPS 60 Hz Conversions (New Xfmrs, Swgr, 60 Hz Motor, Gearboxes, etc) 1 LS 20,650,000$ 20,650,000$ 20% 30%
Phase 2D Feeder Replacements 1 LS 22,543,500$ 22,543,500$ 20% 30%
LS -$ -$
SubTotal (2019 Dollars) 43,193,500$ 8,639,000$ 12,958,000$
Escalated Total 51,343,498$ 10,269,056$ 15,402,990$
Combined Material and Labor Subtotal (including escalation) 340,909,000$
General Conditions and Project Staff (9%) 1 LS 30,681,810$ 30,681,810$
Overhead (5%) 1 LS 17,045,450$ 17,045,450$
Bond and Insurance (1.35%) 1 LS 4,602,272$ 4,602,272$
General Contractor Fees (5%) 1 LS 17,045,450$ 17,045,450$
Material Sales Tax 1 LS -$ -$ - LS -$ -$
SubTotal 69,375,000$
Total Construction Contingency 68,181,476$
Total Design Contingency 94,560,503$
Total Construction Cost 573,026,000$
Items Specifically Excluded from Estimate
Hardening DPS buildings to prevent flood water intrusion
Private Communication Network (assumes use of third party fiber)
2025
CONSTRUCTION Construction
Contingency
Design
Contingency
Escalation
Year
Phase 1
2021
Phase 2D
2026
Miscellaneous Contractor Costs
Phase 2A
2023
Phase 2B
2024
Phase 2C
Preliminary Cost EstimatePage 5 of 6
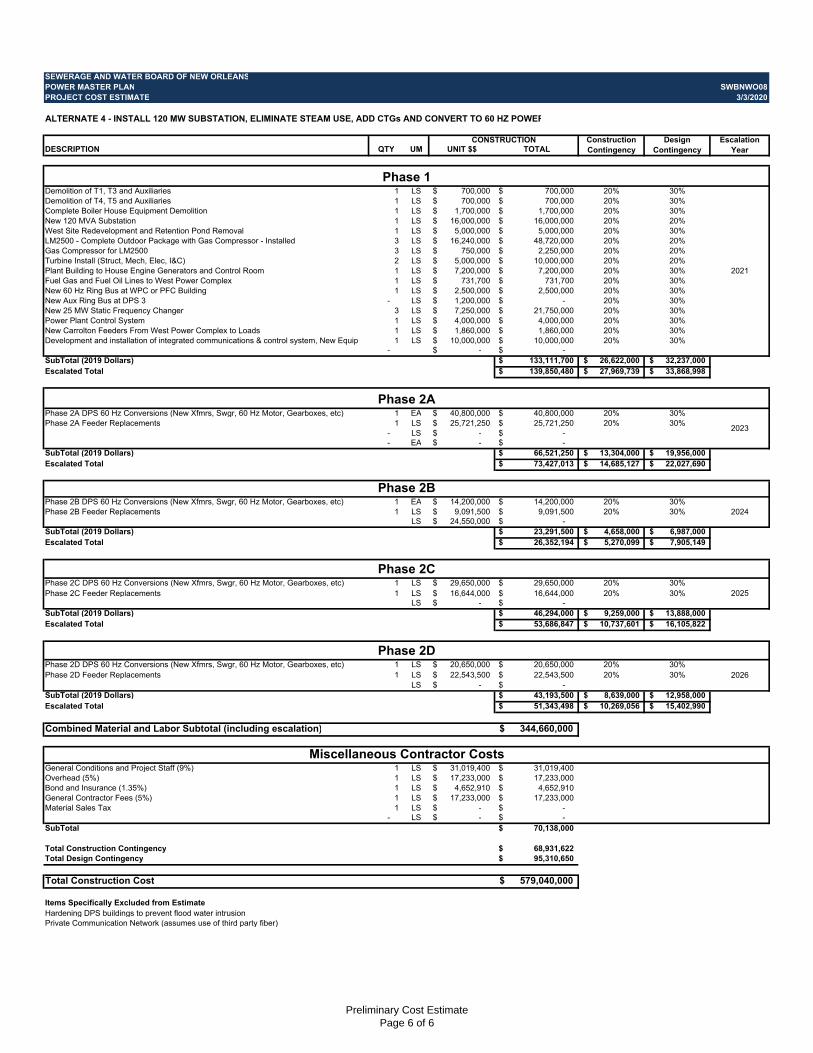
SEWERAGE AND WATER BOARD OF NEW ORLEANS
POWER MASTER PLAN SWBNWO08
PROJECT COST ESTIMATE 3/3/2020
ALTERNATE 4 - INSTALL 120 MW SUBSTATION, ELIMINATE STEAM USE, ADD CTGs AND CONVERT TO 60 HZ POWER
DESCRIPTION QTY UM UNIT $$ TOTAL
Demolition of T1, T3 and Auxiliaries 1 LS 700,000$ 700,000$ 20% 30%
Demolition of T4, T5 and Auxiliaries 1 LS 700,000$ 700,000$ 20% 30%
Complete Boiler House Equipment Demolition 1 LS 1,700,000$ 1,700,000$ 20% 30%
New 120 MVA Substation 1 LS 16,000,000$ 16,000,000$ 20% 20%
West Site Redevelopment and Retention Pond Removal 1 LS 5,000,000$ 5,000,000$ 20% 30%
LM2500 - Complete Outdoor Package with Gas Compressor - Installed 3 LS 16,240,000$ 48,720,000$ 20% 20%
Gas Compressor for LM2500 3 LS 750,000$ 2,250,000$ 20% 20%
Turbine Install (Struct, Mech, Elec, I&C) 2 LS 5,000,000$ 10,000,000$ 20% 20%
Plant Building to House Engine Generators and Control Room 1 LS 7,200,000$ 7,200,000$ 20% 30%
Fuel Gas and Fuel Oil Lines to West Power Complex 1 LS 731,700$ 731,700$ 20% 30%
New 60 Hz Ring Bus at WPC or PFC Building 1 LS 2,500,000$ 2,500,000$ 20% 30%
New Aux Ring Bus at DPS 3 - LS 1,200,000$ -$ 20% 30%
New 25 MW Static Frequency Changer 3 LS 7,250,000$ 21,750,000$ 20% 30%
Power Plant Control System 1 LS 4,000,000$ 4,000,000$ 20% 30%
New Carrolton Feeders From West Power Complex to Loads 1 LS 1,860,000$ 1,860,000$ 20% 30%
Development and installation of integrated communications & control system, New Equip 1 LS 10,000,000$ 10,000,000$ 20% 30%- -$ -$
SubTotal (2019 Dollars) 133,111,700$ 26,622,000$ 32,237,000$
Escalated Total 139,850,480$ 27,969,739$ 33,868,998$
Phase 2A DPS 60 Hz Conversions (New Xfmrs, Swgr, 60 Hz Motor, Gearboxes, etc) 1 EA 40,800,000$ 40,800,000$ 20% 30%
Phase 2A Feeder Replacements 1 LS 25,721,250$ 25,721,250$ 20% 30%
- LS -$ -$ - EA -$ -$
SubTotal (2019 Dollars) 66,521,250$ 13,304,000$ 19,956,000$
Escalated Total 73,427,013$ 14,685,127$ 22,027,690$
Phase 2B DPS 60 Hz Conversions (New Xfmrs, Swgr, 60 Hz Motor, Gearboxes, etc) 1 EA 14,200,000$ 14,200,000$ 20% 30%
Phase 2B Feeder Replacements 1 LS 9,091,500$ 9,091,500$ 20% 30%LS 24,550,000$ -$
SubTotal (2019 Dollars) 23,291,500$ 4,658,000$ 6,987,000$
Escalated Total 26,352,194$ 5,270,099$ 7,905,149$
Phase 2C DPS 60 Hz Conversions (New Xfmrs, Swgr, 60 Hz Motor, Gearboxes, etc) 1 LS 29,650,000$ 29,650,000$ 20% 30%
Phase 2C Feeder Replacements 1 LS 16,644,000$ 16,644,000$ 20% 30%LS -$ -$
SubTotal (2019 Dollars) 46,294,000$ 9,259,000$ 13,888,000$
Escalated Total 53,686,847$ 10,737,601$ 16,105,822$
Phase 2D DPS 60 Hz Conversions (New Xfmrs, Swgr, 60 Hz Motor, Gearboxes, etc) 1 LS 20,650,000$ 20,650,000$ 20% 30%
Phase 2D Feeder Replacements 1 LS 22,543,500$ 22,543,500$ 20% 30%
LS -$ -$
SubTotal (2019 Dollars) 43,193,500$ 8,639,000$ 12,958,000$
Escalated Total 51,343,498$ 10,269,056$ 15,402,990$
Combined Material and Labor Subtotal (including escalation) 344,660,000$
General Conditions and Project Staff (9%) 1 LS 31,019,400$ 31,019,400$
Overhead (5%) 1 LS 17,233,000$ 17,233,000$
Bond and Insurance (1.35%) 1 LS 4,652,910$ 4,652,910$
General Contractor Fees (5%) 1 LS 17,233,000$ 17,233,000$
Material Sales Tax 1 LS -$ -$ - LS -$ -$
SubTotal 70,138,000$
Total Construction Contingency 68,931,622$
Total Design Contingency 95,310,650$
Total Construction Cost 579,040,000$
Items Specifically Excluded from Estimate
Hardening DPS buildings to prevent flood water intrusion
Private Communication Network (assumes use of third party fiber)
2025
CONSTRUCTION Construction
Contingency
Design
Contingency
Escalation
Year
Phase 1
2021
Phase 2D
2026
Miscellaneous Contractor Costs
Phase 2A
2023
Phase 2B
2024
Phase 2C
Preliminary Cost EstimatePage 6 of 6

Appendix H Phasing Diagrams


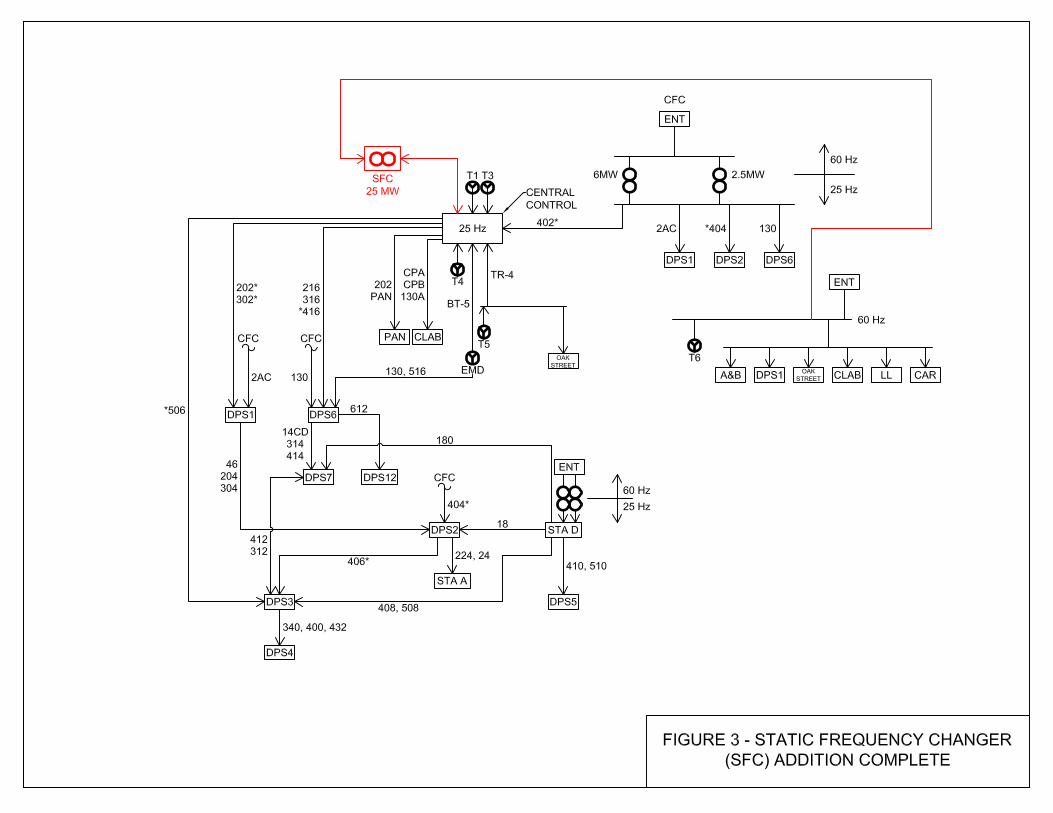


COMPLETE - RETIRE STEAMGENERATORS


TRANSITION TO PHASE 2A

2A COMPLETE

TRANSITION TO PHASE 2B

2B COMPLETE

TRANSITION TO PHASE 2C

2C COMPLETE

TRANSITION TOPHASE 2D

2D COMPLETE

45.3
54.2
91.5
50.0 50.0 50.0
43.6
22.5
50.1
50.1 50.1 50.1
38.1
32.1
22.0
0.0
10.0
20.0
30.0
40.0
50.0
60.0
70.0
80.0
90.0
100.0
110.0
BaseLine Phase 1A
Complete
Phase 1B
Complete
Phase 1C
Complete
Phase 2A
Complete
Phase 2B
Complete
Phase 2C
Complete
Phase 2D
Complete
MW25 Hz Power Inventory
Largest 25 Hz Generator Out of Service
25 Hz Gen Capacity (N-1) 25 Hz Demand

22.0 22.0
88.0 88.0
98.4 98.4102.4 102.4
13.017.9
17.9
59.3
69.1 71.2
80.8 79.8
0.0
10.0
20.0
30.0
40.0
50.0
60.0
70.0
80.0
90.0
100.0
110.0
BaseLine Phase 1A
Complete
Phase 1B
Complete
Phase 1C
Complete
Phase 2A
Complete
Phase 2B
Complete
Phase 2C
Complete
Phase 2D
Complete
MW
60 Hz Power Inventory
Largest 25 Hz Generator Out of Service
60 Hz Gen Capacity (N-1) 60 Hz Demand

61.561.5 61.5 62.5
57.9
49.8
34.1
12.5
53.9
59.4
50.1 50.1
38.132.1
22.0
0.00.0
10.0
20.0
30.0
40.0
50.0
60.0
70.0
80.0
90.0
100.0
110.0
BaseLine Phase 1A
Complete
Phase 1B
Complete
Phase 1C
Complete
Phase 2A
Complete
Phase 2B
Complete
Phase 2C
Complete
Phase 2D
Complete
MW25 Hz Power Inventory
Largest 60 Hz Generator Out of Service
25 Hz Gen Capacity (N-1) 25 Hz Demand

3.8
11.4
66.0 66.0
76.4 76.480.4 80.4
9.3
9.3 9.3
46.9
56.6 58.7
68.3
79.8
0.0
10.0
20.0
30.0
40.0
50.0
60.0
70.0
80.0
90.0
100.0
110.0
BaseLine Phase 1A
Complete
Phase 1B
Complete
Phase 1C
Complete
Phase 2A
Complete
Phase 2B
Complete
Phase 2C
Complete
Phase 2D
Complete
MW60 Hz Power Inventory
Largest 60 Hz Generator Out of Service
60 Hz Gen Capacity (N-1) 60 Hz Demand