new orleans sewerage and water board - louisiana ... water-meter sewerage and water board of new...
TRANSCRIPT

S o ^
WATER-METER
Sewerage and Water Board OF NEW ORLEANS, LOUISIANA
Under provisions of state law, this report is a public document. Acopy of the report has been submitted to the entity and other appropriate public officials. The report is available for public inspection at the Baton Rouge office of the Legislative Auditor and, where appropriate, at the office of the parish clerk of court.
Release Date "^ i^j iO
COMPREHENSIVE ANNUAL FINANCIAL REPORT
FOR THE YEAR ENDED DECEMBER 31, 2009

About The Cover:
The Dwyer Road Drainage Punnping Station project consists of building a new station with a capacity of 1,050 cubic feet per second (ofs). It is located at the intersection of Dwyer Road and Jourdan Road and includes a new building to house three pumps and all the necessary mechanical and electrical components. Hurricane Kalrina disrupted the project's progress, but constructbn has resunr>ed and it is scheduled for completbn in the summer of 2010 at a cost of $19.3 million with 75 per cent Federal funding and 25 per cent local funds. Other associated projects are a new $58.8 million concrete box culvert beneath Dwyer Road to be completed in 2009 and an Outfall Canal, which was completed in 2004. The station will improve flood protection tor a large portion of eastern New Orleans, including the Academy Park, Pines Village and Kenilworth areas.

SEWERAGE AND WATER BOARD OF NEW ORLEANS
New Orleans, Louisiana
Comprehensive Annual Financial Report For The Year Ended December 31, 2009
Prepared by: Finance Administration
Ethel H.Wmiams Utility Financial Administrator

MISSION STATEMENT
: To be one of the best and most respected suppliers of sewer water, and drainage service in the south-central United States by providing quality,
reliable, and cost effective service to our Customers while maintaining fair and ethical treatment of our well-trained and highly motivated employees.
OUR VALUE
Open, honest, communication Trust and respect for each other
Offering and encouraging education and opportunity to employees Fostering enthusiasm among employees through example of the
managers/supervisors Providing direction and planning and encouraging interdeparment
teamwork Assuring reliability in providing services to customers
KEY RESULT AREAS
Customer Satisfaction Cost Effectiveness
Employee Satisfaction Capabilities Improvement through Training

SEWERAGE AND WATER BOARD OF NEW ORLEANS
Comprehensive Annual Financial Report
Year ended Decwnber 31, 2009
TABLE OF CONTENTS
INTRODUCTORY SECTION PAGE(S^
Transmittal Letter 1-1
Graph 1-10
Certificate of Achicvcmeit for Excellence in Financial Reporting M1
Officers of the Sewerage and Water Board of New Orleans M 3
Members of Sewerage and Water Board of New Orleans 1-14
Committees of the Sewerage and Water Board of New Orleans I-l 5
Organizational Chart 1-16
Division Heads of Dcpu^ Director 1-17 Division Heads of General Superintendent 1-18 Department Heads ofManagcment Services Director 1-19
FINANCIAL SECTION
•\-Independent Auditors' Report 11-i Managonent's Discussion and Analysis
(Required SupplcmCTitary Information) 11-3 Basic Financial Statements:
Government-Wide Financial Statements - Enterprise Fund: Statements of Net Assets 11-15 Statements of Revenues, Expenses and Changes in Net Assets 11-17 Statements of Cash Flows 11-18
Fund Finemcial Statanents - Fiduciary Fund Statements of Net Assets - pension Trust 11-20 Statements of Changes in Plan Net Assets-Pension Trust Fund 11-21
Notes to Financial Statements 11-22
Required Supplementary Information under GASB Statement No. 25 11-53 GASB Statement No. 45 11-54

SEWERAGE AND WATER BOARD OF NEW ORLEANS
Comprehensive Annual Financial Report
Year ended December 31, 2009
TABLE OF CONTENTS
FINANCIAL SECTION fContinuedl
Supplementary Information:
Net assets by Department Enterprise Fund - Schedule 1 11-55
Revenues, Expenses, and Changes in Net A s s ^ by Department Enterprise Fund - Schedule 2 11-57
Schedule of Property, Plant, and Equipment in Service by Department - Schedule- 3 11-58
Schedule of Bonds Payable-Schedule 4 11-59
Schedule of Cash Receipts and Disbursements -Debt Service and Debt Service Reserve Required by Bond Resolution - Schedule 5 11-60
Schedule of Changes in Self Insurance Liabilities by Department - Schedule 6 U-61
III. STATISTICAL INFORMATION fUNAUDrfED^
This part of the Board's comprehensive annual financial report presents detailed information as a context for understanding what the information in the financial statements, note disclosures, and required supplementary information says about the Board's overall financial health.
Financial Trends These schedules contain trend information to help the reader understand how the Board's financial performance and well-being have changed ovef lime.
Net Assets by Component - Last Nine Years lll-l
Changes in Net Assets by Compraicnt - Last Nine Fiscal Years III-2
Revenues and Expenses by Source - Enterprise Fund
Last Ten Fiscal Years 111-3
Revenue Capacity These schedules contain irformation to help the reader assess the Board's most signtficant local revenue source, the property tax.
Assessed and Estimated Actual Value of Tax^lc Property - Last Ten Fiscal Years . UI-4
Property Tax Rates - Direct and Overlapping Governments Number of Mills - Last Ten Fiscal Years llJ-5
Ten Largest Taxpayers -December 31,2009 andNinc Years Ago Ul-6

SEWERAGE AND WATER BOARD OF NEW ORLEANS
Comprehensive Annual Financial Report
Year ended December 31, 2009
TABLE OF CONTENTS
111. STATISTICAL INFORMATION (UNAUDITED) Continued
Property Tax Levies and Collections by the City of New Orleans - Last Ten Fiscal Years 111-7
Water and Sewer Rates - Last Four Fiscal Years 111-8
Debt Capacity These schedules present irformation to help the reader assess the qffordability of the Board's current levels of outstanding debt and the Board's ability to issue additional debt in the future.
Ratio of Outstanding Debt by Type - Last Four Fiscal Years 111-9
Computation of Direct and Overtapping Debt-December 31,2009 111-10
Revenue Bonds Debt Service Coverage: Water Bonds - Last Ten Fiscal years IIM1 Sewer Bonds - Last Ten Fiscal years 111-12
Demoe-aphic and Economic Information These schedules offer demographic and economic indicators to help the reader understand the environment within which the Board's financial acttifities take place.
Demographic Statistics-Last Three Fiscal Years 111-13
New Orleans Area Principal Employers (Non-Public) -Last Ten Fiscal Years 111-14
Operating Information These schedules contain service and irfrastructure data to help the reader understand how the information in the Board's fmancial report relates to the services the Board provides and the activHies it performs.
Capital Expenditures by Department - Enterprise Fund 111-15 Lasl Ten Fiscal Years
Schedule of Future Debt Payments: Water 111-16 Sewer 111-17 Drainage 111-18 Total 111-19
Property Value, New Construction and Bank Deposits Last Ten Fiscal Years 111-20
Capita] Asset Statistics by Function - Last Four Fiscal Years III-21

SEWERAGE AND WATER BOARD OF NEW ORLEANS
Comprehensive Annual Financial Report
Year ended December 31,2009
TABLE OF CONTENTS
IV. SUPPLEMENTAL INPQRMATION mNAUDITED\
2009 Actual Capital Expenditures - Water Department IV-1
2009 Actual Capital Expenditures - Sewerage Department IV-2
2009 Actual Capital Expenditures - Drainage Department IV-3
2009 Actual Capital Expenditures-PowerProjects lV-4
2009 Actual Capital Expenditures - General Budget Items • IV-5
Analysis of Pumping and Power Department
Power Purdiased and Produced - 2000 Throu^ 2009 IV-6
Pumping and Power Department Power Purchased and Produced - 2009 lV-7
Water Pumped and Consumed - 2009 lV-8
Gallons Metered-Pay Water consumption - 2009 lV-9
•- Monthly Water and Sewerage Rate Collections • 2009 IV-10
Table of Water Purification Operations and
Table of Water and Sewerage Distnbution System IV-11 thru IV-34
Table of Rainfall in New Orleans -1894 Through 2009 lV-35 thru lV-40
Bcnchmaiking IV-41
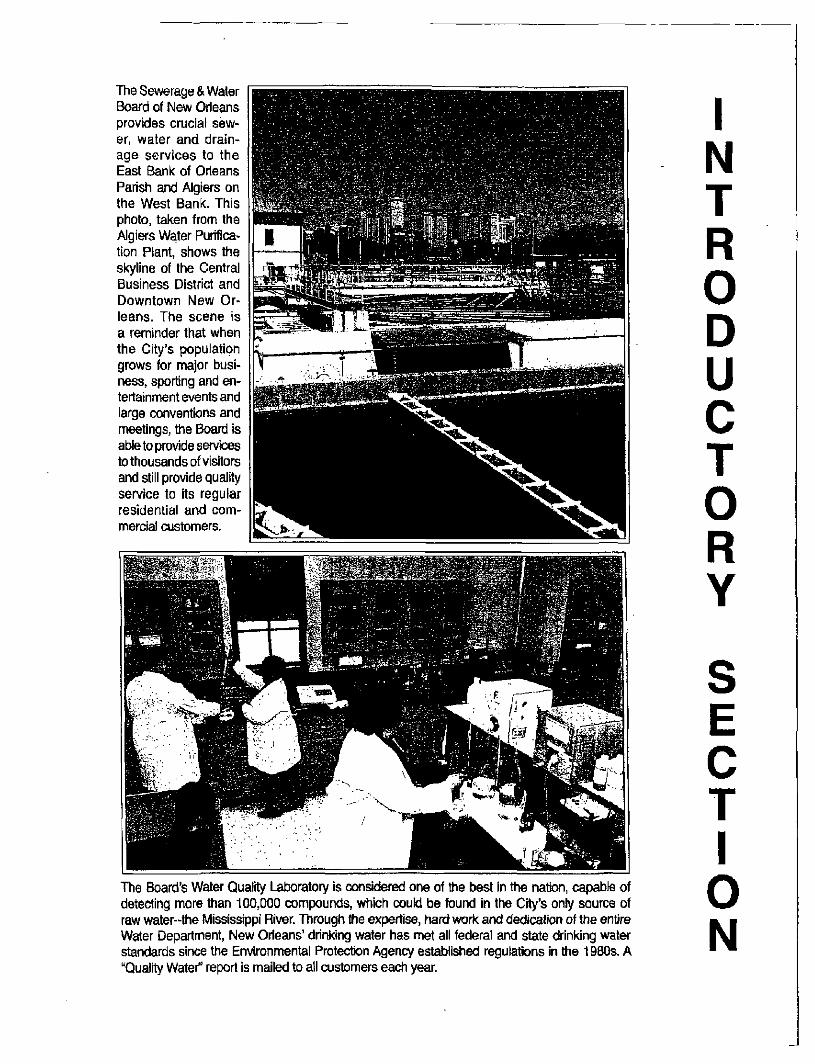
The Sewerage & Water Board of New Orleans provides crucial sewer, water and drainage services to the East Bank of Orleans Parish and Algiers on the West Bank. This photo, taken from the Algiers Water Purification Plant, shows the skyline of the Central Business District and Downtown New Orleans. The scene is a reminder that when the City's population grows for major business, sporting and ^ -tertainment events and large conventkjns and meetings, the Board is abte to provide servfces to thousands of visitors and still provide quality service to its regular residential and commercial customers.
The Board's Water QuaRty Laboratory is considered one of the best in the natbn, capable of detecting more than 100,000 compounds, whrch couW be found in the City's only source of raw water-the Mississippi River. Through the expertise, hard work and dedication of the entire Water Department, New Orleans' drinking water has met all federal and state drinking water starxiards since the Environmental Protection Agency established regulattons in the 1980s. A "Quality Water" report is mailed to all customers each year.
I N T R O D U 0 T O R Y
S E 0 T I O N

{This is page intention<y left bfank)

WATEB>METEB
"RE-BUlLDlNG THE CfTrS WATER SYSTEMS FOR THE 21^'^ CENTURY"
Sewerage & Water B o a r d OF NEW ORLEANS 625 ST. JOSEPH STREET
mrCHELL J. LANDRIEU, President NEW ORLEANS, LA 70165 . 604-529-2837 OR S2W-ATBR JOfO/UBA. VASSEL, Prasldent Pro-Tan vnvw,swbnola.org
June 30, 2010
THE HONORABLE PRESIDENT AND MEMBERS OF THE SEWERAGE AND WATER BOARD OF NEW ORLEANS
We are pleased to present the Comprehensive Annual Financial Report of the Sewerage and W^CT Board of New Orleans for the year ended December 31, 2009. Responsibility for both the accuracy of the data and the completeness and fairness of the presentation, including all disclosiires, rests solely with the Sewerage and Water Board. To the best of our knowledge and belief, the accompanying data, as presented, is accurate in all material aspects and is presented in a manner designed to feiriy present the financial position, results of operations, and cash flows of the Board's Enterprise and Pension Trust Funds, All disclosures necessary to enable the reader to gain an understanding of the Sewerage and Water Board's financial activities have been included.
COMPREHENSIVE ANNUAL FINANCLAL REPORT SECTIONS
The Comprehensive Annual Financial Report is presented in four (4) major sections: Introductory, Financial, Statistical and Supplemental. The Introductory Section includes the transmittal Idter and listings of the officers, members and committees of ^ e Board of Directors. This section also includes the Board's organizational chart and a reproduction of the 2008 Certificate of Achievement for Excellence in Financial Reportmg awarded by tiie Govenunent Finance OfBcers Associatica The Financial Section includes the independent auditors' report, along with the basic financial statements, required supplementary information, accompanying notes and other supplementary information. The individual fimd statements for the Enterprise and Pension Trust Funds are included. Required supplementary includes management's discussion and analysis and a schedule of pension fimding progress and contributions. The Statistical Section includes selected financial and demographic information, generally m a multi-year presentation. Additional information relative to the Sewerage and Water Board's operations is included in a Supplemental Section.
The independent audit of the financial statements of the Sewerage and Water Board was part of a broader, federally mandated **Smgle Audit" designed to meet the special needs of federal grantor agencies. The standards governing single Audit engagements require the independent auditor to report not only on the fair presentation of the financial statOTients, but also on the audited government's intemal controls and compUance with legal requirements, with special emphasis on intemal controls and legal requirements involving the adnunistration of federal awards. Thiese reports are available in the Sewerage and Water Board's separately issued Single Audit Report
The Sewerage and Water Board meets die criteria for classification as an "other stand-alone government" as described in Governmental Accounting Standards Board Statement No. 14. The reporting entity mcludes the Enterprise Fund and the Pension Trust Fund. The Enterprise Fxmd is composed of tiiree (3) mdependent systems: Water, Sewerage and Dramage. The Board adopted Govemmental Accounting Standards Board Statement No. 34 - Basic Financial Statements - Managemenf s Discussion and Analysis ~ for State and Local Government in 2002, The Board has adopted Govemmental Accountmg Standards Board Statement No. 45 -Accounting and Fmancial Reporting by Employers for Post-en^loyment Benefits Other Than Pensions in 2007.
I-l
Membei^oftheBoaid: ALAN ARNOLD * JACQUELYN B. CLARKSON * ARNIEHELKOW * KAREN HENLEY-RAYMOND ^ MITCHELL J. LANDRIEU » GLEN PIUE FLORENCE W. SCHORNSTEIN • TOMKNEA VASSEL • G£RA£D WILUAMS, PHD # LOYCE P. WRiGHT
'An Bquei Opportunity Bnpktyef

GAAP reqmre that management provide a narrative introduction, overview, and analysis to accompany the basic financial statements in the form of Management's Discussion and Analysis (MD&A). This letter of transmittal is designed to complement MD&A and should be read in conjunction with it. The Sewerage and Water Board's MD&A can be found immediately following the report of the independent auditors.
PROFILE OF THE SEWERAGE AND WATER BOARD OF NEW ORLEANS
Sewerage and Water Board of New Orleans is a pohtical subdivision created in 1899 by Louisiana State Statutes. The Sewerage and Water Board was established as a "special board" operating independently of city government. The Mayor of New Orleans serves as the President of the Board of Dhectors which is con^osed of three (3) representatives of the City Council, two (2) representatives of the Board of Liquidation, City Debt and seven (7) ^pointees as designated by the State statutes. The Board is charged with construction, operation, and mamtenance of Water, Sewerage and Drainage Systems for the City of New Orleans. By agreement, approximately 2,550 acres of adjourning Jefferson Parish is served by the Board's drainage facilities for which Jefferson Parish pays it's pro rata share of expenses. In addition, the Board provides sewerage services to Jefferson Parish busmesses, the majority of which are restaurants located in the West End neighbOThood near the Lakefront Additionally, the Board provides watw and sewerage SCTvices to the Plaquemines Parish Industrial Park.
ECONOMIC CONDITION AND OUTLOOK
According to the September 2009 Metropolitan Report: Economic Indicators for the New Orleans Area prepared by the Division of Busmess and Economic Research, University of New Orleans, 1,800 jobs (or 0.3%) were lost fix>m New Orleans area employment in the last year. This follows a year when 14,800 jobs were added. Though this loss is small, it may be taken as a sign that the national economic recession has reached New Orleans. The fact that the loss is so small compared to the national loss of 4.2% of all jobs during the same time period points to a combmation of recovery growth still going on m some sectors while recessioi^ry factors force contraction m others.
The current total number of jobs in the New Orleans area is 519,500. This means that 93,700 jobs have been recovered and retained in the New Orleans area since the lowest point in tiie autumn of 2005. According to tiie report, 85,000 jobs need to be recovered before old pre-Katrina levels would be reached. Job growth is anticipated to be sluggish as the national recession gradually lifts with some support fix)m remaining recovery spending.
The dollar value of contracts let for roads and levees as well as commercial buildings are still above twice then pre-Katrina level, at 193% and 231% respectively; however, residential construction has slowed and now shows up as one of the worst performing sectors, ciuxently at about 67% of old levels.
Tourism has been one of the slowest segments of the local economy to recover. Though there has been a general upward trend, some of the tourism indicators are some of the most damaged 4 years later. Accommodation employment at 74% recovered remams tiie most damaged employment sector. Airport capacity in seats is only at 69%, It was higher, hitting 80% last summer but was a victim of national trends whidi mcluded a regional airline ExpressJet going out of busmess and a national push among ahlines to fly with less empty seats.
The port is showing a grovrih this year to reach 119% of export tonnage; howev^, imports of steel and other goods, unport tonnage remains at only 77% old levels. Airport cargo tonnage remains one of the most heavily damaged mdicators at only 64% of old levels.
1-2

In Orleans Parish, eamings and taxable sales are trending upwards; flirting with 100% of old levels but the number of jobs and people are just ^preaching 70%. - Public school enrollment is barely 50%, which hints at major shifts m demogrqihic in the City of New Orlrans that proportionally has fewer children than it used to have.
WATER SYSTEM MAJOR INITIATIVES
Carrollton Water Purification Plant
Design for a new disinfection storage and feed facility is completed. This project, which replaces chlorine delivered in rail cars with sodium hypochlorite, includes bulk storage and pumping facitities for hypochlorite, the addition of a second dismfectant addition pomt, and some water plant SCADA system improvements. This project is being financed through the Department of Health and Hospital State Revolvmg Loan Program aiid ARRA stimulus fimding will result in $1,000,000 of principal forgiveness for the S&WB. When complete, the Carrollton Plant will no longer house 55 ton rail cars of diJorine, significantiy reducing die risk of e^qwsure to the plant staff and the surrounding community and environment to a toxic chlorine release.
Overhaul of fiocculation-sedimentation basin G3 is near completion. A new complete flocculation drive system was installed Also, nr^rovements to tiie mono-rake system will increase the efficiency of sludge removal from the sedimentation basin.
Improvements to the h i ^ lift flow measuring system are ongomg. Degassmg valves have been installed on some of the units, which are now providmg reliable flow measurement Outstanding repairs include the damaged^lugged venturi plumbing and repair or replacement of the punq) infi-astmcture.
A second sludge Ime to the riv^ is ciirrentiy in the design phase. This will add redundancy and flexibility to the operations.
The Board is performing in-house repairs to the L4 flocculation equipment and mono-rake system. The Welding and Fabrication Shop and the Machme Shop anticipate the work to be completed by die second quarter of 2010, Algiers Water Purification Plant
The installation of a sodium.hypochlorite generation system is complete and the equipment has been in service since April 2009. This system is currentiy suppCErting the daily normal plant needs for disinfectant in the potable water treatment process. The use of ton cylinders of chlorine has been discontinued at this facility significantly redudng the risk of exposure to the plant staff and die surrounding community and environment to a toxic chlorine release.
The ferric sulfate storage and feed equipment was moved fi'om the old river station to a temporary location within die Algiers Plant. A new bulk storage containm^it stmcture has been built wittiin the plant Efforts are currently underway to begin moving part of the storage and feed equipment into this new fecihty.
Water Pumping & Power
The total capacity of the plant is 41 MW, Turbme 4 (20 MW) was rebuilt and is available for emergency use at an estimated reduced capacity of 12 MW. Design is underway to replace tiie steam path, rotor and condenser, install 8 transmitters, update the govemor control system and replace the turbine with 25Hz motor on tiie condensate pump. The project is scheduled to bid m mid-2010.
A new Boiler No. 2 was installed November 2009. The repair of turbme 4 witii tiie new boiler shall return the power plant to the original potential capacity of 61 MW.
1-3

The local power company is continuing design of a new hi^-pressure natural gas line into the power plant. The new line will eliminate tiie need for the gas corc^ressors located at the power plant The project is scheduled to be constructed by November 2010.
The New River Intake Station is operational and has sufficient capacity to supply the raw water requirements for tiie Carrollton Water Purification Plant The Oak River Intake Station is currently out of service for repairs to the pumps, switchgear and intake pipes, ;r
Specifically for the New River Intake Station^ all three raw water pumps have been returned to service. One pump has been refurbished with new pump bearings, line shaft bearing, couplings etc. viiereas the other two pumps have yet to be refhrbished One of the three pump motors has been refurbished FEMA is fundmg the repair or replacement of flie suction, discharge and check valves.
The "three high lift pump stations are operational The Claiborae Hig^ Lift Pump Station and the DeLaval steam driven turbine located at the powCT plant are of sufficient capacity to meet the finished water requirements. The second DeLaval steam driven distribution pumps is scheduled for reconditioning. FEMA is fiinding the repair of both pinnps. The Panola Street High Lift Pung) Station s^Yes as a backup m the event of an emergency.
Tlie Corps of Engineers mitiated construction of a new 15 MW, 60-Hertz gas turbine genea^tor in November 2009. The $31.2 M project shall supplement the current power available from j^tergy to serve the water treatment plant and the raw water intake stations.
The Corps of Engineers has several projects in design fi>r die power plant including construction of an I-wall around &e power plant and other critical water treatment plant assets to protect agamst flooding, storm proofing the bmldings contained in the power plant, the Oak River and New River Intake Stations, and the building housing die frequency changer.
Water Distribution System:
The leak detection program continues to utilize Permalog Leak D^ectors to locate leaks m the distribution network for repairs. In 2009, the Pennalogs were installed in New Orleans East Some still remain in the original piloted area m tiie Central Business District and succeeding area of the Lower Nintii Ward Over 2400 detectors are currently located in water distribution system.
The leak detection program also utilized (he SmartbaJl to investigate 15 miles of water mains. The device is effective but very labor intensive m its requir«nent of a shutdown to insert the tool.
Over 11,000 service requests were responded to m 2009. These included mvestigations of 382 water leaks, inspection of 715 water values, repairs to 8,951 water services lines, 1,989 wafer mains, 605 valves and 47 water roffliholes. Additionaily, staff removed 9,517 water meters and mstalled 727 new water meters. Preventative mmntenance of fire hydrants is continuing in coordination witii tiie local fire department. Of the 16,500 fire hydrants mapped, the Board performed preventative mamtenance for 2,021.
The Board is continuing to coordmate with the City of New Orleans Department of Pubhc Works (DPW) m repair/replacement of water lines associated with die Submerged Roads Program.
1-4

SEWER SYSTEM MAJOR INITTATIVES
East Bank Wastewater Treatment Plant:
All buildings have been repaired including a new control room equipped with a state of the art SCADA system for oversight and control of plant processes. The administration building contaming the laboratory was destroyed by fioodwaters and demolished. The laboratoiy analyses are being performed off site, vrfiile the administrative ofBces are bemg housed in office trailers. Currentiy a new administration building with laboratory is at the 30% level of design.
With tiie excq)tion of the backup multiple hearth incinerator and the cryogenic oxygen production fecility, all pre-disaster equipment has been repaired and is operational including all eight final clarifiers. The oxygen reactors have heea restored to fidl flmctionalrty providmg essential secondary treatment
At present, a Vacuum Swing Adsorption (VSA) oxygen production plant capable of producmg 70 tons of oxygen at greater than 93% purity has been purchased and is in the fabrication phase of the project Shipment and deUveiyis expected to begm in October 2010 with an estimated completion and start up of April 2011. Oxygen is currectly tmcked m. at significant cost and the new oxygen production fecility will significantiy reduce expenses. Cmrentiy the oxygen reactors require a consun^tion of approximately 30-tons per day.
FEMA has reviewed and approved a sludge dryer system as an alternative method of sludge disposal and backup to the Fluid Bed Incinerator (FBI). This sludge processing equipment is in the prelimmary and pre-bid phase of the project This initiative involves the procurement and installation of a ten (10) dry ton per day sludge dryer to blend into the existing shidge stream prior to mcineration. The resulting sludge quality will be greater tiian 33% Total Solids (TS) allowing for an autogenous bum, which will require fuel only for start tips, greatiy reducing diesel and natural gas expenses. Theprojectshallbeadvertisedfordesign'in2010.
Two new gravity thickener and belt filter press combination units have been installed in addition to the two existing belt presses. The new units have Increased the sludge cake dryness from -22% TS to slightiy greater tiian 24% TS. The increased dryness has led to significant redtictions m diesel and natural gas expenses to incinerate the sludge.
At present, fhe influent TSS and BOD concentration are approximately 130 milligrams per liter (mg/L) and 95 mg/L, respectively. This is significantiy lower tiian normal concentrations, which is probably die result of. a significant increase m the amount of inflow mfiltration in the collection system following the hurricane requiring treatment at the plant. Effluwit quaUty has been good over the year, with zero permit violations or process overflows in 2009.
A new 4-MW diesel generator was purchased in August 2009 to provide backup power for tiie wastewater treatment plant Design ofthe generator building is underway.
Construction of die building and installation ofthe generator is scheduled to be bid in early 2010.
Biodiesel is being investigated as a green energy alternative to diesel fiiel currentiy utilized at the plant A pilot is proposed to use biodiesel and track fhe expected cost savings relative to energy and operations and maintenance.
The Board was successful m appealing FEMA to fund the mitigation effort to the benn around die wastewater treatment plant Design of an earth^stmctural benn is underway. Constmction is tentatively scheduled to begm m late 2010,
1-5

West Bank Wastewater Treatment Plant:
A new in-plant drainage pumping station has been installed, greatly improving the plant drainage edacity. All plant runofif is collected in this system and is returned to^the treatment process and ultimately pumped to the Mississippi River.
A new gaseous chlorine handling system was installed including a new chlorinator, automatic shutoffs, leak detectors, and alarms.
Major overhauls were completed to the effluent pumping system, mcluding replacement ofthe rotating units for the two large 12-MGD pumps.
A new solids treatment building and belt filter press is currently at 65% level of design for tiie plant.
A new sodium hypochlorite system including tanks and pumps is at 65% level of design.
A new chemical (BioCat) is used instead of hydrogen peroxide for odor control in tiie collection system. A significant benefit has been realized m the effluent quality of the trickling filtei* plant since tiie new chemical does not adversely hnpact tiie biofilm in the trickluig filter, altiiough tiie chemical cost is ^proxunately 20% hi^er dian using hydrogen peroxide.
Sewage Pumping and Lift Stations:
AU the sewer pump stations are operaiional; however some facilities are continuing to utilize temporary pumps. The majority of die stations require rehabilitation, le., electrical repair, bearing replacement, and flood proofing. Approxunately 40% of the electrical woric has been con^leted. Bearing repair work has not been initiated, and tile final phase of flood proofing has not started to date.
FEMA is funding repairs to tiie sewer pump stations to pre-Katriria conditions. Designs for the repau: and/or replacement to 62 stations are underway. Construction contracts shall be awarded in the first quarter of 2010 and constmction completed by the end ofthe 2010 or early 2011 for the majority of die stations.
Con^mction of fhe replacement of Michoud Sewer Pump Station was completed. The fecility was commissioned in November 2009.
The Board is proposing FEMA fund the mstallation of transfer switches at the sewage pumping stations. The switdi will provide tiie ability for tiie pumps to be powered by a generator m the event of electrical power loss.
Hazard Mitigation Funds have been provided to elevate eight sewer pump stations and ensure continuous opemtions during flooding events. Preliminary design reports shall be submitted in early 2010 for review and comment
Sewer Collection System:
Sewer rehabilitation projects were completed in the Mid-City and Lowra- Nintii Ward areas.
Construction projects for rqjlacement of sewer mains from manhole to manhole for various sites throughout Orleans Parish were awarded. Design projects are continuing for multiple point repair and replacement of sanitary sewers in tiie Carrollton, Lower Nintii Ward and Mid-City areas. Constmction for tiiese projects shall be completed by 2015,
The Board is continuing to coordinate with DOTD and DPW in repair of sewer Imes associated vrith the Submerged Roads Program
1-6

Preventative maintenance of the collection system included inspection of 896,750 feet of sewer hne utilizmg closed circuit television and smoke testing, cleaning of 1,019,777 ft, of the sewer system, mspection of 7,415 sewer manholes and repairs to 3,089 sewer breaks. Thirty-three air release valves were inspected and mamtahied and 168 force main isolation valves were inspected and exercised. Alignment inspection of 102 miles ofthe force main was also accomplished.
Cathodic protection survey is performed annually on tiie 22 systems in place m the collection system. Staff is seddng FEMA support in repairing tiie systems damaged as a result of Katrina.
DRAINAGE SYSTEM MAJOR INITIATIVES
Pump Stations:
All 24 drainage and 12 underpass pumping stations have been maintained and are operational. Most motors have been rewound and are in service witiiin the dramage stations.
The Board has been able to perfiirm bi-house febrication of stop logs, repair the vertical pumps and two sluice gates that have been out of service since Katrina at Dramage Pumping Station (DPS). 19, repair "D" pump impeller by welding 5 out of 8 blades at DPS 3 and repair Med #1 screen cleaner at DPS 6.
The Coips has committed $204 M for storm^roofing projects at potentially 22 of tiie drainage pump stations. Design is underway for procurement and mstallation of two 200 cfs pumps a generator at DBS 5, a new building to house ia generator at DPS 20, and electrical, mechanical and stmctural upgrades to the other stations.
The $58.8 M e^qiansion of Dwyer Road Punq)ing Station from 125 cfs to 1000 cfe is still in constmction. The project is 100% federally funded and scheduled to be completed m tiie spring of 2010.
The replacement of the Elaine Pumpmg Station was-awarded in July 2009. The $3.2 M Corps project is scheduled to be completed in 2011.
The Board has been working with the Corps and fhe Coastal Restoration and Recovery Authority to review the amendment to the project partnership agreement and the request for proposal for the design build of three new permanent pump stations at 17* Street, Orleans and London Canal at Lice Pontchartrain. The $804 M project would provide both fixjntal protection and allow for easier and more efticient pumping of water to the Lake.
Dwyer Road Intake Canal is currentiy under constmc^on. The $58.8 M project is 100% federally funded and consists of 6,800 linear feet of new concrete boxed culvert into the Dwyer Road Pumping Station.
Florida Avenue Canal Phase I proposals for construction were received by the Corps November 2009. The $49.2 M project is 100% federally fiinded and consists of an open concrete canal within fhe Florida Avenue right of way between
Mazant Street and Drainage Pump Station # 19. Phase I is expected to be awarded m January 2010 for completion by late 2011. Florida Avenue Canal Phases II and III fix>m Peoples Avenue to Mazant Street are currentiy undef design.
Odier Southeast Louisiana Urban Flood Control Program (SELA) projects under design inchide Napoleon Avenue Canal Phases II and Iff fironi South Claiborne Avenue to Carondelet Street, Claiborne Avenue Canal Phases I and 11 from Monticello Street to Lowerline Street, Jefferson Avenue Canal Phase I and 11 and Louisiana Avenue Canal, both from South Claiborne Avenue to Constance Sheet
1-7

Louisiana DODT awarded in December 2009 the installation of drainage pipe, asphalt overlay and related work on General Degaulle Drive at its mtersection witiiWall Boulevard, Life Center Drive, Seine Court, Wesfbend Parkway, Befarman Place and MacArthur Boulevard. The design, funded by the Board will provide for in^roved drainage and flood control in the six locations. The $21 M construction (partially fiinded by tiie Board) is scheduled to be complete by mid-2012.
A five-year Capital Program budget of $2,924,297,000 was approved by Sewerage^ and Water Board in .December 2009. The ^proved amount for Drainage projects was $2,259,097,000, of tiiat amount; $ 1,666,273,000 is participation by others.
FIN ANCL\L INFORMATION
Managanent of the Sewerage and Water Board is responsible for designing and maintaining an intemal control structure sufScient to safeguard tiie Board's assets gainst loss, tiieft or misuse and to ensure the reliability of financial records for preparing financial statements in conformity whh generally accepted accounting principles. The intemal control structure is designed to provide reasonable, but not absolute assurance that these goals are met. The concept of reasonable assurance recognizes that: (1) the cost of intemal controls should not exceed tiie benefits e)qpected to be derived and (2) the valuation of costs and benefits require tiie exercise of judgment by management
The Enterprise Fund's water and sewerage systems are finanped by user fees. The unique characteristics ofthe services provided by tiie Dramage System of New Orleans requires tiie use of Enterprise Fund accoimting in order to obtain a meaningful measure of the cost of providing the services and capital maintenance. On March 21, 2007, the Board approved a scries of five annual water rate mcreases begmning witii tiie first increase, on November 1,2007 followed by four additional mcreases to be implemented on July 1 of each year, 2008 tiirough 2011. The New Orieans City Council ^proved tiie annual water rate increases on October 4, 2007. Revenues from the three- (3) mill, six- (6) mill, and nine- (9) mill ad valorem taxes, which are restricted exclusively for drainage sarices, finance the Drainage System. These ad valorem taxes are the operating revenues^of flie drainage systani'
Budgetary Control:
The Sewerage and Water Board maintains an intemal budgetary control through the preparation and monitoring of an annual operating and capital budget for the Water, Sewerage, and Drainage fimds. Monthly budget reports are provided to department level managers to assist them in then* fiscal responsibihties.
GcpCTal Operations:
Tlie change in net assets for the year ended December 31, 2009 was an increase of approximately $68.3 million, as opposed to a decrease in net assets of approximately $50.1 miUion for fhe year ended December 31, 2008. The Board's total operating revenues mcreased by 11.1% to ^proximately $121.1 million, and total operatmg expenses deceased 3.4% to ^proximately $165.4 inilUon. The decrease in power and pumping expenses in 2009 of approximately $ 1.2 million or 8.7% is primarily due to a decrease in cost of natural gas. The increase m payroll related expenses in 2009 of $3.5 milHon of 11.2% is primarily due to salary increases in accordance witii City of New Orleans Civil Service and an increased number of employees.
Debt Administration:
The Board of Liquidation, City-Debt has responsibility for the administration of tiie Board's debt Drainage debt services payments are supported by ad valorem tax collections, \;\Wle ixser fees are used to provide debt services for die Water and Sewerage System bonds.. TTie Board's Sewerage and Water and Drainage bmds outstanding as of Decemb^ 31, 2009 totaled $242,330,000.
1-8

Otiier Information:
State Statutes and covenants governing outstanding bond issues require an annual audit ofthe Board's financial records by mdependent certified public accountants. The accounting firm of Postlethwaite & Netterville was selected by the Board to perform this audit through a competitive bid process. Tht independent auditors' report on the basic financial statements is included in the Financial Section of the report. The Government Finance OfBcers Association of the United States and Canada (GFOA) awarded a Certificate of Achievement for Excellence in Financial Reporting to Sewerage and Water Board of New Orleans for its Comprehensive Annual Fmancial Report for the fiscal year ended December 31, 2008. The Certificate of Achievement is a prestigious national award-recognizing conformance with the highest standards for preparation of state and local government financial reports.
In order to be awarded a Certificate of Achievement, a government unit must publish an easily readable and efiScientiy organized comprehensive annual financial report whose contents conform to program standards. Such CAFR must satisfy botii generally accepted accounting principles and applicable legal requirements.
A Certificate of Achievement is valid for a period of one (1) year only. The Sewerage and Water Board of New Orleans has received a Cwtificate of Achievement for twenty-sbc (26) years. We believe our current report continues to conform to the Certification of Achievement Program requirements and we are submittmg it to GFOA.
ACKNOWLEDGMENTS
The Comprehensive Annual Financial Report was prepared by the dedicated staff of the Director's OfScc, particularly the Finance Administration and Printing D^artment Additionally, we realize that the cooperation of each Department of tiie Sewerage & Water Board of New Orleans is essential, and we appreciate tiie willingness to work together toward this endeavor.
We also wish to thank the members of the Board for theh interest and support m our efforts to achieve greater fiscal efBciency and accoimtability.
Yours very traly,
Marcia A. St Martin !gthel H. Wfiliams Executive Du-ector Finance Administrator
1-9

(This is page intentionally left blank)

2009 Revenues
Derticr»ted Taxes 26.54%
,^-'—^'
z - - ^ '
OpHrttiugiUHl Maintenance
Giants 0.00%
~ " • — ^ - ^
• ^
Inleiest Inooiike 2.32^.
OtUei-^ ^ Revenue 1 ^ ^ 1-63%
Sewei' Sei'vice Qiarges 40.71%
Water SH vice Clkaiges 29.00%
Depreciation and Amortization
18.34*0
2009 Expenses
Ditere.st Expeiuse 0.99»o
Maintenance of General Plant
19.35»ft
Pi o\ision for Doubtful Accounts
0,72%
Piovision for Oaiin.s
0.34»o Power and Pumping
8.20* 0
PayroU Related " I8.2500
Treatment 10.55%
Transmission and Distribution
10.99«fl
tstomer Accounts 1.5"'»&
A-dministrntion ami Cieneral
8. 8*M
Customer Service 1.92«o
1-10

(This is page intentionally left blank)

Certificate of Achievement for Excellence
in Financial Reporting
Presented to
Sewerage and Water Board of New Orleans, Louisiana
For its Comprehensive Annual
Financial Report
for the Fiscal Year Ended
December 31,2008
A Certificate of Achievement for Excellence in Financial Reporting is presented by the Government Finance Officers
Association of tiie United States and Canada to government units and public employee retirement
systems whose comprehensive annual financial reports (CAFRs) achieve the highest standards in government accounting
and finaiKial reporting.
President
Executive Director

(This is page intentionally left blank)

OFFICERS
ofthe
SEWERAGE AND WATER BOARD OF NEW ORLEANS
December 31,2009
C.RAYNAGIN President Mayor, City of New Orleans
TOMMIE A. VASSEL Presidaat Pro Tern
MARCIA A. ST. MARTIN Executive Dkector
ROBERT MILLER Deputy Director
JOSEPH BECKER General Superintendent
MADELINE F.GODDARD : Deputy General Superintendent
GERARD A. VICTOR Special Counsel
M3

MEMBERS OF SEWERAGE AND WATER BOARD OF NEW ORLEANS
December 31,2009
C.RAYNAGIN Mayor
ALAN C.ARNOLD Member-Board of Liquidation, City Debt
JACQUELYN CLARKSON CouncUwoman-At-Large
BENJAMIN L. EDWARDS. SR. RESIGNED... 11/21/09 At-Large
ARNIEFIELKOW Councilman-At-Large
KAREN HENLEY-^RAYMOND Councilwoman-At-Large District D
FLORENCE W. SCHORNSTEIN Councilwoman District B
TOMMIE A. VASSEL Councihnanic District C
CYNTHLA WILLARD-LEWIS , Councihnanic District E
DR. GERALD WnXLVMS Member-Board of Liquidation-City Debt
LOYCE P. WRIGHT At-Large Appomtment
1-14

COMMITTEES OFTHE
SEWERAGE AND WATER BOARD OF
NEW ORLEANS December 31,2009
EXECUTIVE COMMFTTEE
TOMMIE A VASSEL - Chairpown
LOYCE P. WRIGHT FLORENCE W. SCHORNSTEIN
FINANCE AND OPERATIONS COMMTTTEE
LOYCE P. WRIGHT - Chaiipason
FLORENCE W. SCHORNSTEIN KAREN HENLEY-RAYMOND JACQUELYN CLARKSON DR. GERALD WILLIAMS
INFRASTRUCTURE COMMriTEE
FLORENCE W. SCHORNSTIEN - Cbairpcnon
KAREN HENLEY-RAYMOND BENJAMIN EDWARDS resigned 11/21/09 CYNTHIA WILIARD-LEWIS
PLUMBING COMMnTEE ARNIE FELKOW-Chairperson
CYNnHA WILLARD-LEWIS BENJAMIN EDWARDS ALAN C ARNOLD
PENSION COMMnTEE
TOMMIE A VASSEL - Chairperson
ARNIE FIELKOW HAROLD HELLER CYNTHIA WniARD-LEWIS WARREN J. LAWRENCE DR, GERALD WILLIAMS GERALD TILTON.
JOHN WILSON MICHAEL CONEFRY & COMPANY. ACTUARY
M5

B ^ p o (U
1 (= 1 <D E
1 t i ! (Q i ^
(L>
<= . 1 (0
i t3> (D
_ 1
-& C 3
•c , o Q -Q .
o c= <u
o Q .
E ai (0 3
o-UJ
3
m
en B c CD > m
b
8 a 1
i ?
rs
c
Ul
iiD
Is o '•l 01
O "
.5: Q
g* •c 0) ID c
•5) c
111
n o
b n a. Q
E iu
ra c CO
c tn
"O =1
CQ •D C ta _c 'c-c ra
Q_
E (0
Zi c
a><
O O
" 5
C
o
(A
'£ E < .£ '« <a x: u
1-16

THE SEWERAGE AND WATER BOARD OF NEW ORLEANS
DIVISION HEADS OF DEPUTY DIRECTQR
December 31,2009
ROBERT MILLER DEPUTY DIRECTOR
ADMINISTRATIVE SERVICES DIVISION LYNNCOBETTE
ENVIRONMENTAL AFFAIRS DIVISION
GORDON C.AUSTIN
MANAGEMENT SERVICES DIVISION
VACANT
PLANNING AND BUDGET DIVISION
DEXTER JOSEPH
SUPPORT SERVICES DIVISION
JOHN WILSON
M 7

THE SEWERAGE AND WATER BOARD OF NEW ORLEANS DIVISION HEADS OF GENERAL SUPERINTENDENT
December 31,2009
JOSEPH BECKER GENERAL SUPERINTENDENT
MADELINE F. GODDARD DEPUTY GENERAL SUPERINTENDENT
ENGINEERING DIVISIQN
JOHN (JACK) HUERKAMP
FACILITY MAINTENANCE DIVISIOK
GABE SIGNORELLI
NETWORKS DIVISION
RUDY AUGUST
OPERATIONS DIVISION
BOBMOEINIAN
PLUMBING DIVISION
JAMES L ARNOLD
1-18

THE SEWERAGE AND WATER BOARD OF NEW ORLEANS DEPARTMENT HEADS OF MANAGEMENT SERVICES DIRECTOR
December 31,2009
VACANT MANAGEMENT SERVICES DIRECTOR
FINANCE ADMINISTRATION
ETHEL H-WILLL^JviS
INFORMATION SYSTEMS ADMINISTRATION
MELINDA NELSON
PERSONNEL ADMINISTRATION
KEVm F.WALSH
PURCHASING ADMINISTRATION
WILLIE M MINGO JR
REVENUE AND CUSTOMER SERVICES ADMINISTRATION
JACQUELINE K. SHINE
1-19

(This is page intentionally left blank)

When one of the pumps at Drainage Pumpkig Station No. 3 began to "chatter" and make a loud noise, it was discovered that 5 of the 8 impeller blades were cracked. The Board's own em-ptoyees from Facility Maintenance disassemt led the pump, gouged out the cracked areas and weW-repaired the blades. Additional work was done on the shaft while the casing was off. The pump, which has been in servrce for more the 80 years, was reassembled, test run and put back in service. The station is located at North Broad and London Avenue. On many jobs, the Board's employees can make repairs more cheaply and quk^ly than contractors not as familiar with the Board's complex machinery.
s E C
I O N

•i Postlethwaite & Netterville
A Profoiilonai Acownling Cofpofotion Aiuxlat»d OFflcet in Prinapal Ohm of Itw United Slalet
www.pncpa.com
INDEPENDENT AUDITORS' REPORT
Members ofthe Board Sewerage and Water Board of New Orleans:
We have audited the basic financial statements ofthe Sewerage and Water Board of New Orleansr (fhe Board) as of and for the years ended December 31, 2009 and 2008, as listed in the table of contents. These basic financial statements are the responsibility ofthe Board's management. Our responsibility is to express an opinion on these financial statements based on our audits.
We conducted our audits in accordance with auditing standards generally accepted in the United States of America and the standards applicable to financial audits contained in Government Auditing Standards, issued by the Comptroller General of the United States. Those standards require that we plan and perform, the audit to obtain reasonable assurance about whether the financial statements are free of material misstatement. An audit includes consideration of intemal control over financial reporting as a basis for designing audit procedures that are appropriate in the circumstances, but not for the purpose of expressing an opinion on the effectiveness of the Board's internal control over fmancial reporting. Accordingly, we express no such opinion. An audit includes examining, on a test basis, evidence supporting the amounts and disclosures in the financial statements. An audit also includes assessing the accounting principles used and the significant estimates made by management, as well as evaluating the overall financial statement presentation. We believe that our audits provide a reasonable basis for our opinion.
In our opinion, the basic financial statements referred to above present fairly, in all material respects, the financial position ofthe Board as of December 31,2009 and 2008, and the results of its operations and its cash flows for the years then ended in conformity with accounting principles generally accepted in the United States of America.
In accordance with Government Auditing Standards, we have also issued our report dated June 29, 2010, on our consideration ofthe Board's intemal control over fmancial reporting and on our tests of its compUance with certain provisions of laws, regulations, contracts, and grant agreements and other matters. The purpose of that report is to describe the scope of our testing of intemal control over fmancial reporting and compliance and the results of that testing, and not to provide an opinion on mtemal control over financial reporting or on compliance. That report is an integral part of an audit performed in accordance with Govemrmnt Auditing Standards and should be considered in assessing the results of our audits.
II-l
30th Floor - Energy Centre • 1100 Poydras Street • New Orleans, LA 70163-3000
One Galleria Blvd.. Suite 2100 • Metairie, LA 70001 • Tel: 504.837.5990 •
• Tel: 504.569.2978
Fax: 504.834.3609

Accounting principles generally accepted in the United States of America require that the management's discussion and analysis on pages 11-3 through 11-14 be presented to supplement the basic fmancial statements. Such information, although not a part of die basic fmancial statements, is required by the Govemmental Accountmg Standards Board, who considers it to be an essential part of financial reporting for placing the basic financial statements in an appropriate operational, economic, or historical context. We have applied certain limited procedures to the required supplementary information in accordance with auditing standards generally accepted in the United States of America, which consisted of inquiries of management about the methods of preparing the information and comparing the information for consistency with management's responses to our inquiries, the basic financial statements, and other knowledge we obtained during our audit of the basic financial statements. We do not express an opinion or provide any assurance on the information because the limited procedures do not provide us with sufficient evidence to express an opinion or provide any assurance.
Our audits were conducted for the purpose of forming an opinion on the financial statements that collectively comprise the Board's financial statements as a whole. The introductory section. Schedules 1 through 6, the Statistical Information section, and Supplementary Information section are presented for purposes of additional analysis and are not a required part ofthe financial statements. Schedules 1 through 6 are the responsibility of management and were derived fi'om and relate du-ectly to the underlying accounting and other records used to prepare the financial statements. The information has been subjected to the auditing procedures applied in the audit of the fmancial statements and certam additional procedures, including comparing and reconciling such information directly to the underlying accounting and other records used to prepare the financial statements or to the financial statements themselves, and other additional procedures in accordance with auditing standards generally accepted in the United States of America. In our opinion, the information is fairly stated in all material respects in relation to the financial statements as a w^ole. The Statistical hiformation and Supplementary Information sections have not been subjected to the auditing procedures applied in the audit of the basic financial statements and, accordingly, we do not express an opinion or provide any assurance on it.
-3 , / -
New Orleans, Louisiana June 29^2010
n-2

SEWERAGE & WATER BOARD OF NEW ORLEANS
MANAGEMENT'S DISCUSSION AND ANALYSIS YEAR ENDED DECEMBER 31,2009
This section ofthe Sewerage & Water Board of New Orleans' (the Board) armual financial report presents a discussion and analysis ofthe Board's fmancial performance during the fiscal year that ended December 31, 2009. Please read it in conjunction with'the Board's fmancial statements, which follow this section.
FINANCIAL mCHLIGHTS
Recovery from Hurricane Katrina and fhe resulting flooding continued to be the most significant event to occur during 2009. Repairs to water, sewerage, and drainage systems, building repairs, and vehicle and equipment replacements continued throughout 2009.
Enterprise Fund
The major hi^ights in the Board's enterprise fund were as follows:
2009
• The Board's additions to its major systems approximated $130,4 million. • The SELA project ^^ich is a major upgrade to the drainage system by the Corps of Engineers
resulted in additions of approximately $23.9 million to work in progress during the year. • Federal Emergency Management Agency (FEMA) Disaster Public Assistance grants expended
totaled approximately $49.9 million, of which approximately $30.5 million were coital contributions and approximately $19.4 million were for operating and maintenance expenses.
• The Board refunded the $24,030,000 Sewerage Service Refimding Bond Anticipation Notes, Series 2006, using the proceeds ofthe $23,375,000 Sewerage Service Revenue Refunding Bonds Series 2009 and $2,161,565 of excess debt service reserve funds. As part ofthe refunding, the Board paid $1,172,452 of bond costs, which are amortizable through the date of maturity ofthe bonds. The bonds are secured by a pledge of revenues ofthe Sewerage Fund.
2008
The Board's additions to its major systems approximated $76.1 million. The SELA project which is a major upgrade to the drainage system by the Corps of Engineers continued to be postponed during 2008 with no additions to work in progress recorded during the year. Federal Emergency Management Agency (FEMA) Disaster PubUc Assistance grants expended totaled $16.0 million, of which approximately $16.0 million were capital contributions and approximately $25,000 were for operating and maintenance expenses.
IL-3

Pension Trust Fund
2009
The major highlight in the Board's pension trust fund was the strengthening fmancial performance in the stock naarket as compared to 2008 and the resulting appreciation of $29.0 million in the market value of tiie investments held by the plan during 2009, as opposed to the depreciation of $60.7 million in the market value of the investments during 2008. The plan net assets available for benefits increased to $184.8 million.
2008
The major hi^ili^t in the Board's pension trust fund was the weakening fmancial performance in the stock market as compared to 2007 and the resulting depreciation of $60.7 million in tiie market value of the investments held by the plan during 2008, as oppos^ to the appreciation of $5.2 million in the market value of the investments during 2007. The plan net assets available for benefits decreased to $162.4 miUion.
OVERVIEW OF THE FINANCIAL STATEMENTS
This financial report consists of five parts: rnanagement^s discussion and analysis (this section), the financial statements, the notes to the financial stateinents, required supplementary information, and other supplementary information.
Government-wide Financial Statements - Enterprise Fund
The Board*s principal activities of providing water, sewerage, and drainages services are accounted for in a single proprietary fimd - the enteiprise fimd. Enterprise fimds are used to report business activities. Since th^ enterprise fund is.the Board's single, activity, its financial statements -are presented as the Board's govemment-wide financial statements.
The financial statements provide both long-teim and short-term information about the Board*s overall financial status. The financial statements also include notes that explain some of the information in the financial statements and provide more detailed data. The statements are followed by a section of required supplementary information and otber supplemMitary information that further explain and support the information in the financial statanents.
The Board's financial statements are prepared on an accrual basis in conformity with accounting principles generally accepted in the United States of America (GAAP) as applied to government units. Under this basis of accounting, revenues are recognized in the period in which they are earned, expenses are recognized in the period in which they are incurred, and depreciation of assets is recognized in the Statements of Revenues, Expenses, and Changes in Net Assets. AU assets and liabilities associated with the operation ofthe Board are included in the Statements of Net Assets.
The Statement of Net Assets reports the Board's net assets. Net assets - the difference between the Board's assets and liabilities - are one way to measure fhe Board's financial health or position.
n-4

Fund Financial Statements - Pension Trust Fund
The Board's fimd fmancial statements consist of its pension trust fund As a fiduciary fund, the pension trust fund is held for the benefit of employees and retirees ofthe Board. The pension trust fimd is not reflected in the govemment-wide financtals because the resources are not available to the Board for its activities. The accounting for the pension trust fund is much like that used by the enteiprise fund.
FINANCIAL ANALYSIS OF THE BOARD'S
ENTERPRISE FUND
2009 Net Assets
The Board's total assets at Deceihber 31, 2009 were approximately $1.8 billion, a 3.9% increase from December 31,2008 (see Table A-1).
Table A-1 Sewerage & Water Board of New Oriewia
Net Assets
Current unrestricted assets RoEtricted assets Property, plant and oqu^nnent - net • Otber assets
Total 99 lets
Current liabilJties ' Long-tcnn fiairiHtEs
Total Uabilltfef
Net assets; Invested in capital assets, not of related debt Restricted
Total netaisets Total UabUJHei and aet assets
1009
S • 96.709,930 128,818,918
1,604,392^42 2.174^76
$ 1,832.095,466
$ 126,535376 398.993,489 525^28,865
1^67,130,463 (60.563.862)
i;j06.566.601 $ 1.832,095,466
2008
S 85,536,897 164,746,871
1,509.805,388 1,698.192
J U761,7S7.348
$ 152,039,186 374.212,806 526^1,992
•U06,08S,162 f70.549.806>
1.235.535.356 $ 1,761.787.348
Increase {Decreased
S 11,173,033 (35,927,953) 94,586,954
476,084 $ 70308,118
S (25,503^10) 24,780.683
(723.127)
61,045301 9.985,944
71,031>i5 $ 70308.118
Increase | OHcrca&e)
13.1% ^21.8%
6.3% 28.0% 4.0%
-16.8% 6.6%
-0.1%
4.7% -14.2%
5.7% 4.0%
The increase in total assets of $70.3 million resulted primarily due to an increase in property, plant, and equipment of $94,6 million, offeet by a decrease in investments restricted for construction of $47.2 million. Current liabilities decreased by $25,5 million, and long-term liabilities increased by $24.8 million in 2009, as compared to 2008 due to the refunding of the Sewer Revenue Bonds Anticipation Notes, Series 2006, in tiie amount of $24.0 million and the issuance of the Sewer Service Revenue Refunding Bonds, Series 2009, in the amount of $23.3 million.
n-5

2008 Net Assets
The Board's total assets at December 31, 2008 were approximately $1.8 billion, a 1.6% decrease from December 31,2007 (see Table A-1).
Table A-2 Sewerage A Water Board of New Orieans
Net Assets
Current assets Restricted assets Property, pJanl and equipment - net Otfaorasscts
Total awets
Curreot Ilabflitics Long-tenn UabilitiM
Total UabOftltt
Net assets: Invested ia capital assets, net of related debt Restricted
Total net aiiets Total liablUtiH anfi act assets
1008
S 85.536.8?7 164,746,871
1,509.805,388 1.698.192
$ 1,761,787.348
$ 152.039,186 374.21Z806 526.251.992
1,306,085,162 r70.549.806^
1.235.535,356 % 1.761.787.348
2007
S 130.654.155 191.182,517
1,465.225.933 4.185.361
$ 1,791.247.966
$ 115,274,616 390,323.513 505.598.129
l,265,078>t0 20.571.597
1,285.649.837 S 1.791.247.966
Increase fDecrease)
$ (45.117.258) (26,435.646) 44.579,455 (2,487,169)
J (29.460.618)
( 36,754.570 (16.110,707) 20,653.863
41,006,922 (91.121.403) (50.114.481)
J (29.460.618)
lucre aw (Decreaie)
-34.5% -13.8%
3.0% -59.4%
-1.6%
31,9% -4.1% 4,1%
3.2% -442.9%
-3.9% -1.6%
The decrease in total assets of $29.5 million resulted primarily firom a write off of $48.0 miUion of FEMA receivables due to prior expenditm^ currently in dispute and subject to appeal or oqjenditures that were disallowed by FEMA, offset by an increase in propwiy, plant, and equipment of $44.6 miUion due to $16.5 milUon in construction funds e?q>ended and $1S.1 miUion of capital contributions less liie amiual provision for depreciation of $31.5 milUon, payments made on bonds of $12.6 miUion offeet by new loans of $12.8 milUon borrowed through the Debt Service Assistance program, and an oveqiayment of FEMA grant funds in the amount of $21,1 milUoa Current liabilities increased by $36.8 million and long-term liabilities decreased by $16.1 million in 2008 as compared to 2007 due primarily to debt service payments made on bonds offset by additional debt from the Debt Service Assistance Fund loan and an overpayment of FEMA grant ibnds of $21.1 million.
2009 Changes in Net Assets
The change in net assets for the year ended December 31, 2009 was an increase of approximately $71.0 mUlion, as opposed to a decrease in net assets of approximately $50.1 million for the year ended December 31, 2008. The Board*s total operating revenues increased by 11.1% to ^proximately $121,1 mUUon, and total operating expenses decreased 3.4% to approximately $165.4 miUion. The changes in net assets are detaUed in Table A-3; operating expenses are detaUed in Table A-4.
n-6

Tabic A-3
S f w e i ^ e &WatcrBoardofNcwOrleaas Reveaaes , ExpCDSCB and Change In Net At ic t i
Oper^ing revenues: Chargss fbr services Other
Total operating rcvcDoci
Operating expenses (Tabfc A-3)
Operatfflg loss
Koiwjperatmg revenues: Property taxes Other taxes
Operating and masTlenance p^ntB Investmea inconie (expense)
Total non-ope rating revenaei
Income befiDre capital contrfcutkms
Capital ccctributitms
Clui^e i n n e t u t e t s
Net assets, beginning of year
Net assets, end cf year
2009
S •' 117,264.448 3,814,564
121,079.012
165,4<r7.457
(44328,445)
36,198,099 371,006
1 9 ^ . 1 8 5 (880,830)
55,061.460
10,733.015
60;29B;J30
71.031,245
1,235,535,356
S 1^06.566.601
2008
$ 106,463,582 2,487,983
108.951,565
171,174.171
(62.222,606)
39.702,436 515.735
(3.973) 1,825,534
42,039,732
(20.182.874)
(29.931j507>
(50,114,481)
1,285,649,837
$ 1^235^5356
Inert (tsc (Deere t i e )
$ 10,800,866
U26381 12.127,447
(5.766,714)
17,894,161
(3,504337) (144,729)
19377.158
(^706364) 13.021,728
30.915,889
90,229337
121.145,726
(50.114.481)
$ 71,031,245
Increase (Decrease)
10.1%
53.3%
11.1%
-3.4%
28.8%
-8.8% -28.1%
-487721.1% - -1483%
31.0%
-153.2%
-301.5%
-241.7%
-3.9%
5.7%
Property taxes decreased by $3.5 million in 2009 due to uncollected prior year receivables written off in 2009.
Coital contributions from federal grants and construction of Board property was approximately $60.3 million resulting primarily firom capital additions reimbursable under the FEMA Disaster Public Assistance grant of approximately $30.5 million and approximately $23.9 million of capital contributions by the Army Corps of Engineers. In 2008, the Board had grant revenues of approximately $18.1 million offset by a write off of approximately $48.0 million of receivables due to FEMA Disaster Public Assistance grant expendhures that were disallowed or currently in dispute and subject to appeal. Operating and maintenance grants increased to $19.4 million in 2009 due to the reimbursement of current and prior year expenses for water system point repairs under the FEMA Disaster Public Assistance grant.
T a b l e A-4 1 S e w e r a g e & W a t e r
Opermttdg Expe
P o Tvor and pumping Treatment Transmss ton and dBtrS)utk)o Cus to met acco unts Cos to mer s ervic« Administration and general Payroll related Maintenance ofgenemlplant Depieciatbn Amoitsation P r o v c b n for do ubtfulaccounts P ro VB io n fo r claims
Total operatbg expenses
2009 $ 2^50,788
P.910.557 21.466.523 3,044.936 3.4 n ^ 9 E,504.125
35,085.953 24,828,902 34,692,628
140,917 (3,693.97D
58.860 ' $ 165,407,457
$
• j
B o a n ) n a e i
2 0 0 8 M,r78.641
B.243.782 18^94^09 2,7B,594 3.323,696 15,173.190
31,549.622 33.455.074 3^546.017
158,019 i;i44.862 587.465
FII74.T71
£picrea ie ( D e c r e a i e t
S (1,227.853) 1666.775 2.4723 M
325,342 93.543
a669.065) 3,536331
(8.626,172) , 3,M6,611
07,102) (4,938,833)
(528.6051 $ (5.766.7 K)
b c r e a s c ( D e c r e a s e )
-8.7%
9.m 13.0% 12.0% 2.8%
-110% 1U%
-25.8% M.0%
-10.8% -396.7%
-90.0% -3.4%
n-7
The decrease in power and pumping expenses in 2009 of approximately $ 1.2 million or 8.7% is primarily due to a decrease in cost of natural gas. The increase in treatment expenses in 2009 of $1.7 million or 9.1% is primarily due to an increase in the costs of chemicals. The increase in transmission and distribution expenses in 2009 of $2.4 million or 13.0% is primarily due to an increase in contractor cost and materials. The mcrease in payroll related expenses in 2009 of $3.5 million or 11.2% is primarily due to salary increases in accordance with City of New Orleans Civil Service and an increased number of j^mployees. Tlie decrease in maintenance of general plant in 2009 of $8.6 million or 25.8% resulted primarily from lack of personnel to address repass and lacks of fund to purchase parts and material. Provisions for doubtful accounts decreased by approximately $4.9 million, or 396.7%, in 2009 as a result of fewer new closed accounts in 2009 as well as the collection of accounts written off in prior years. Provisions for claims decreased by $528 thousand in 2009, as compared to 2008. Claims expense varies due to the number and severity of the claims during any period. Tlie decrease is due primarily to a decrease in reserves recognized during 2009 offset by claims payments made during 2009.
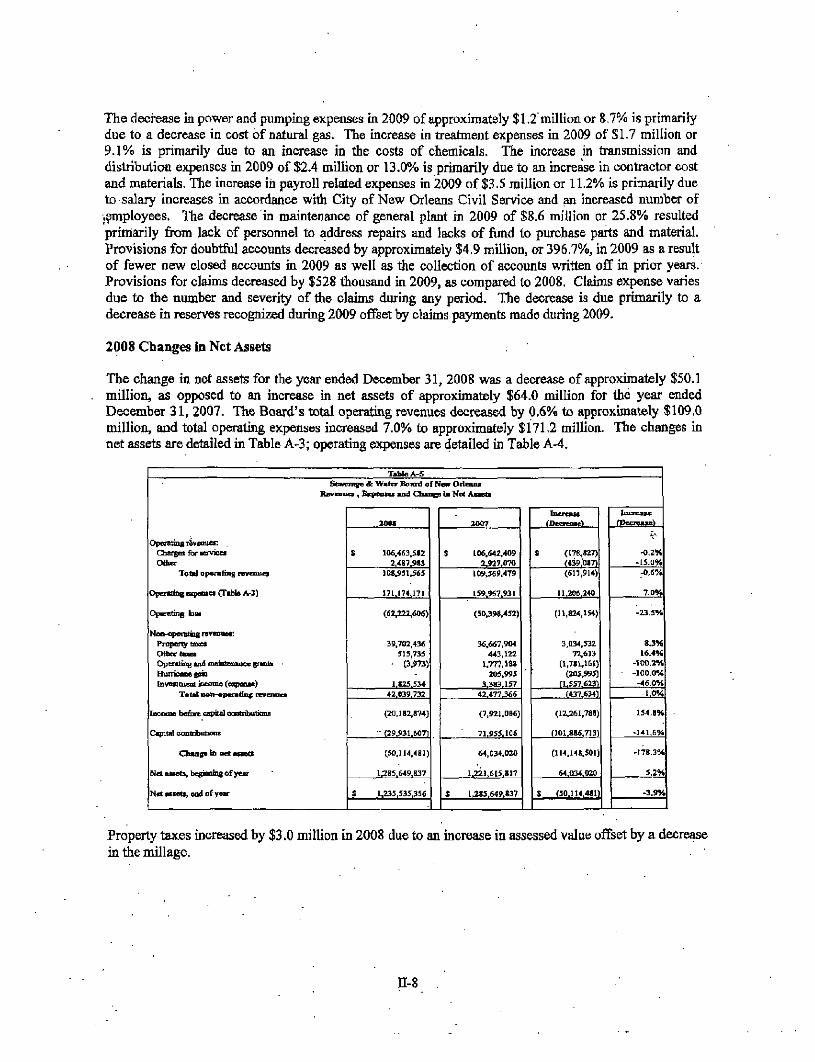
2008 Changes in Net Assets
The change in net assets for the year ended December 31, 2008 was a decrease of approximately $50.1 million, as opposed to an increase in net assets of approximately $64.0 million for the year ended December 31, 2007. The Board*s total operating revenues decreased by 0.6% to approximately $109.0 million, and total operating expenses increased 7.0% to approximately $171.2 million. The changes in net assets are detailed in Table A-3; operating expenses are detailed in Table A-4.
T«UeA-5 1 Sewcnge & Water Boaird of New Orieaiu
RevniiKa , BxpcoKi m d C h u c B 1« Ne< AsMti
Oporatina rivonue*: , Cbafgn for •ervicei Odicr
Total operating rsvcnuei
OperaJing tacfoota (TBhle Ar3)
Oparrting b u
Noo-<ipeiUKig revenuer P i r p e n y l t t e j CHbor UuBi Opcratine and mBkoanaocc snnix • Hunioono g u i lavestmool kicome (expcoaa)
Total iwa-«pefBdiie t e v a i u a
locome before capital ocntributiona
Capital (XHttributkns
Net auots , boBimniB of year
Net Bcnts, eod of year
I M I
$ 106,463.512 2,487.9a3
108.951,565
171.174.171
(67,777,606)
39,702.436 515,735
• P.973)
1.825.534 42.039.732
(20.182,874)
- (29.931.5071
(50,114,481)
1;285.649,837
$ 1^5 .535356
ZOO7
S 106.642,409 2.927.070
109,569,479
159.967.931
(50.398.452)
36.667.904 443,122
1,777,188 205.995
3.383.157 42.477.366
(7,921.086)
71.955.106
64,034.020
1.221.615.817
J 1,285.649.837
Inercau (Decreaiel
S (178,827) (439.0171 (617,914)
11.206.240
(11.824,154)
3.034,532 72,6)3
(1,781,161) (205,995)
fLS57.623) (437.634)
(12,261,788)
f 101.886.7131
(114,148,501)
64.034.020
$ (50,114.481)
I n o u u e rt>ecrBaw)
-0.2% -15.0%
-0.6%
7.0%
-23.5%
8 J % 16.4%
-100.2% • -100.0%
-46.0% -1.0%
154.8%
-141.6%
-178.3%
5.2%
-3 .9%
1 ,.
Property taxes increased by $3.0 million in 2008 due to an increase in assessed value offset by a decrease in the millage.
n-8

Capital revenue from federal grants and construction of Board property was approximately ($29.9) million as a result of grant revenues of ^proximately $18.1 million offket by a write off of approximately $48.0 million of receivable^ due to FEMA Disaster Public Assistance grant expenditures that were disallowed or currently in dispute and subject to appeal. Operating and maintenance grants decreased by 100.2% to ($3,973). Capital contributions and operating and maintenance grants are primarily related to FEMA Disaster Public Assistance grants.
Table A-6 Sewerage & Water Board
Operating Expenses
Povrarand pumping Treatment Transmission and distribution Customer accwmts Ciistomorsernctt Administration and general PayroB related Kbintenance of genei&I plant Depreciation Amortcsation Pnwision for doubtful accounts Provision fijr claims
Total cipciatinfi expenses
2008 $ - W, 178,641
18^3,782 %9H;m 2,719,594 3,323.696 15,P3.190
3;549.622 33.455.074 31,546,00
158,0© 1,244.862 587.465
% I7in4.r7i
2007 $ 13,041,954
16,280,975 19,832,226 2,290.092 2,670,145
W.899fl28 28^9,815 26,993,626 25,377,733
158,0© I2.6D,283 a44R565>
'$ 159^7.931
Increate ^Oecrcasel
$ ;B 6 ,687
1,962,807 (838.017) 42S,502 653,551 274,162
3,289.807 6,461448 6,168,284
. (1U68,42P
. 3.036.430 J IL206.240
Increase | njecreajiel
8.7% E.1%
-4.2% 18.8% 24.5%
18% U6%
23.9% 24.3%
- 0.0% -90.B o
-C4.0% 7.0%
The increase in power and pumping expenses in 2008 of $1.1 million or 8.7% is primarily due to an increase in salaries. The increase in treatment expenses in 2008 of $2.0 million or 12.1% is primarily due to an increase in the costs of chemicals. The decrease in transmission and distribution expenses in 2008 of approximately $838 thousand or 4.2% is primarily due to a decrease in repairs due to damage incurred during natural disasters. The increase in payroll related expenses in 2008 of $3.3 million or 11.6% is primarily due to salary increases in accordance witii City of New Orleans Civil Service as well as an-increased number of employees and $8.5 million recognized for an increase in the other postretirement benefits liability. The increase m maintenance of general plant in 2008 of $6.5 million or 23.9% resulted prunarily from increases in the cost of high pressure gas, materials, supplies, contracts, fuel and electricity for all facilities and increases in payroll related costs, ^Hxifessional services, and consulting costs. Provisions for doubtful accounts decreased by $11.4 million or 90.1% in 2008 as a result of a smaller increase in closed accounts which are fully reserved than in 2007 and additional reserves for amounts not expected to be collected following Hurricane Katrina recognized during 2007, Provisions for claims mcreased by $3.0 million m 2008 as compared to 2007. Claims e3q>ense varies.due to the number and severity of the claims during any period. The increase is due primarily to a large increase in reserves recognized during 2008 offiset by claims payments made during 2008.
PENSION TRUST FUND
2009 Flan Net Assets
The Board's total plan net assets of its pension trust fund at December 31, 2009 was ^proximately $184.8 million, a 13.8% increase from December 31,2008 (see table A-7). Total assets increased. 14.8% to $191 million.
n-9

Table A-7 Sewerage & Water Board of New Orleans
Plan Net Assets
Cash Investments Receivables Other assets
Total assets
DROP participant payable Total liabilities
Plan net assets
2009
$ 764,400 190,173,791
38,703 47,249
191,024,143
6,247,599 6,247,599
$ 184,776,544
2008
$ 776,446 165,246,434
120,733 274,483
166,418,096
4,034,240 4,034,240
$ 162383,856
Increase (Decrease)
$ (12,046) 24,927,357
(82,030) (227,234)
24,606,047
2^13,359 2,213359
$ 22392,688
Increase (Decrease)
-1.6% 15.1%
-67.9% -82.8%
14.8%
54.9% -54.9%
13.8%
Plan net assets increased by $22,3 million in 2009 primarily due to realized and unrealized gains on investments recognized in 2009.
2008 Plan Net Assets
The Board's total plan net assets of its pension trust fimd at December 31, 2008 were approximately $ 162.4 million, a 28.7^0 decrease from December 31, 2007 (see table A-7). Total assets decreased 28.2% to $166.4 million.
Table A-8 Sewerage & Water Board of New Orieans
Plan Net Assets
Cash Investments Recervabfcs Other assets
Total assets
DROP participant payabfc Total Uabilities
Plan n e t ^ s e t s
2008
$ 776,446 165;246,434
120,733 274,483
166,418,096
4,034,240 4,034;240
S 162383,856
2007
$ 102,653 231,011,414
420,795 257,562
231,792,424
3,966,600 3,966,600
$ 227,825,824
Increase (Decrease)
$ 673,793 (65,764,980)
(300,062) 16,921
(65374328)
67,640 67,640
$ (65.441,968)
Ittcrease (Decrease)
656.4% -28.5% -71.3%
6.6% -28-2%
1.7% -1.7%
, -28.7%
Plan net assets decreased by $65.4 million in 2008 primarily due to realized and unrealized losses on investments recognized in 2008.
n-10

2009 Changes in Plan Net Assets
Table A-9 Sewerage «& WaterBoardof NewOrleans
Change in Plan Net Assets
Additions: Contributions Net income on investments
Total additions
Deductions: Benefits Employee refunds Emp loy ee DROP oontributions
Total deductions
Change in net assets
Plan net assets, beginning of year
Plan net assets, end of year
2009
$ • 6.925,168 29,699,396 36,624,564
(11,140.341) (85.524)
(3.006,011) (14,231.876)
22,392,688
162,383,856
$ 184,776.544
2008
$ 7,017,975 (59,190.144) (52,172,169)
(10,782.636) (133.779)
(2^53.384) (13,269.799)
(65,441,968)
227.825,824
$ 162,383,856
Increase (Decrease)
$ (92.807) 88,889.540 88.796,733
(357,705) 48.255
(652,627) (962.077)
87,834,656
(65.441.968)
$ 22.392,688
Increase (Decrease)
-1,3% 150.2%
-170.2%
3.3% -36.1% 27.7%
7.3%
-134.2%
-28.7%
13.8%
Net income on investments increased by $88.9 million or 1502% during 2009 due to increasing performance in the stock market as compared to 2008. The mcrease in the change in plan net assets~of $87.8 million resulted primarily from an increase in unrealized gains on investments in 2009.
2008 Changes in Plan Net Assets Table A-10
Sewerage & Water Board of New Orleans Change in Plan Net Assets
Additions: Contributions Net iDcome on investments
Total additions
Deductions: Benefits Emptoyee refunds Employee DROP contributicHis
Total deductions
Change in net assets
Plan net assets, begjnmng of year
Plan net assets, rnd of year
2008
$ 7,017.975 (59.190.144) (52,172.169)
(10,782,636) (133.779)
(2^53,384) (13;i69,799)
, .(65,441,968)
227,825,824
$ 162383,856
2007
$ 6,753,824 7,947,645
14.701.469
(10,625,533) (215,746)
_Q^71,448) (12,812.727)
1,888,742
225,937,082
$ 227.825,824
Increase (Decrease)
$ 264.151 (67,137,789) (66.873,638)
(157,103) 81.967
(381.936) (457,072)
(67330,710)
1.888,742
$ (65^441,968)
. Increase (Decrease)
3.9% -844.8%
, -454.9%
1.5% -38.0% 19.4% 3.6%
-3564.8%
0.8%
-28.7%
n-11

Net income on investments decreased by $67.1 million or 844.8% during 2008 due to declinmg performance in the stock market as compared to 2007. The decrease m the change in plan net assets of $67.3 million resulted primarily from a decrease in imrealized gains on inve^ents in 2008.
CAPITAL ASSET AND DEBT ADMINISTRATION
2009 Capital Assets
As of December 31, 2009, the Board had invested ^proximately $2.2 billion in capital assets. Net of accumulated depreciation, the Board's net capital assets at December 31,2009 totaled approximately $1.6 billion. This amount represents a net increase (including additions and disposals, net of depreciation) of approximately $94.6 million or 6.3% over December 31, 2008.
At December 31, 2008, the Board's budget for its five year capital improvements program totaled approximately $2.9 billion including $238.6 million for water, $426.5 million for sewerage and $2.2 billion for drainage. Due to certain regulatory and legislative changes, additional capital improvements will probably be requked. Future capital improvement program expenditures may requne the issuance of additional debt depending on the amount and timing of expenditures. As of December 31, 2009, the Board has committed or appropriated $80.7 million in investments for use m fiiture cq)ital projects and has $6.2 million of bond proceeds remauiing for construction. The capital project investments are included in restricted assets.
The capital improvements budget for 2009 is $646.4 million, including $304.9 million for projects, which are expected to be fiinded by federal grants and programs. Significant projects included in property, plant and equipment in progress as of December 31, 2009 include the following:
Hurricane Katrma related Repairs and Replacement Southeast Louisiana Flood Control Program
Sewer System Sanitation Evaluation and Rehabilitation Program Drainage Pumping Stations and Canals
Eastbank Sewer Treatment Plant Westbank Seww Treatment Plant
See Note 4 for detailed capital asset activity during 2009.
2008 Capital Assets
As of December 31, 2008, the Board had invested approximately $2.1 billion in capital assets. Net of accumulated depreciation, the Board's net capital assets atDecember 31, 2008 totaled approximately $1.5 billion. This amount represents a net increase (including additions and disposals, net of depreciation) of approximately $44.6 million or 3.0% over December 31,2007.
At Dec^nber 31, 2008, the Board's budget for its five year capital improvements program totaled approximately $2.2 billion including $295.6 million for water, $520,3 miUion for sewerage and $1.4 billion for drainage. Due to certain regulatory and legislative changes, additional capital improvements will probably be required. Future capital improvement program expenditures may require the issuance of additional debt depending on the amount and timmg of expenditures. As of December 31, 2008, the Board has committed or appropriated $67.8 million in investnients for use in fiiture capital projects and has $54.2 million of bond proceeds remaining for constmction. Tlie capital project mvestments are included in restricted assets.
n-12

The capital improvements budget for 2009 is $625.8 million, includmg $293.8 million for projects, which are expected to be funded by federal grants and programs.
2009 Debt Administration
The Board continues to make its regularly scheduled payments on its bonds. During 2009, $37.3 million in principal-payments were made. '•
The Board entered into a Cooperative Endeavor Agreement with the State of Louisiana in July 2006 to borrow up to $77.5 million from the Debt Service Assistance Fund. During 2009, the Board made no additional draw downs on the loan program.
See Note 7 for detailed long term debt activity during 2009.
2008 Debt AdmLinistration
The Board continues to make its regularly scheduled payments on its bonds. During 2008, $12.6 million in principal payments were made.
The Board entered into a Ck)operative Endeavor Agrisement with the State of Louisiana in July 2006 to borrow up to $77.5 million from the Debt Service Assistance Fund. During 2008, the Board made additional draw dovms of $12.8 million on the loan program.
ECONOMIC FACTORS AND RATES
There are continued significant other revenues and expenses which impact the Board. State and federal grants related to the disaster are expected to have a significant impact on 2010. Total FEMA debris removal, mitigation, and cqjital replacement grants are expected to exceed $297 million. Of these approximately $247.4 million has been recognized through 2009. FEMA revenues will continue to be recognized as buildings, systems, and other reimbursable assets are repaired or replaced. In 2010, the Board will recognize additional portiotis of these revenues but much ofthe constmction and replacement will not have been completed and the revenues altibough measurable may not be readily available due to the delays in actual receipts of FEMA fimds.
On March 21, 2007, liie Board approved a series of five annual water rate increases beginning with the first increase on November 1, 2007 followed by foin additional increases to be implemented on July 1 of each year, 2008 through 2011. The New Orleans City Council approved the annual water rate increases on October 4, 2007. The rate increase scheduled for July 1.2010 is 5%.
The number of open accounts has decreased from approximately 121,000 at the end of 2005 to ^proximately 117,900 at the end of 2009, a decrease of 2.6%. The number of open accounts decreased significantly in 2006 and 2007. However, the number of open accounts increased in 2009 by approximately 7,100.
n-13

CONTACTING THE BOARD'S FINANCIAL MANAGEMENT
This financial report is designed to provide our bondholders, patrons, and other interested parties with a general overview of the Board's fmances and to demonstrate tiie Board's accountability for the money it receives. If you have questions about this report or need additional financial information, contact the Sewerage & Water Board of New Orleans at (504) 585-2356.
n-14

BASIC FINANICAL STATEMENTS

(This is page intentionatly left blank)

SEWERAGE AND WATER BOARD OF NEW ORLEANS STATEMENTS OF NET ASSETS
December 31,2009 and 2008
ASSETS
Noncurrent assets:
2009 2008
Property, plant and equipment Less: accumulated depreciation
Property, plant and equipment, net
Other assets: Bond issuance costs Deposits "Net pension asset (liability)
Total other assets
Total noncurrent assets
$ 2,248,235,760 I 643,843,418
1,604.392,342
2,122,961 51,315
-2,174;276
1,606,566,618
5 2,122.573,459 612,768,071
1,509,805,388
1,091,426
51,315 555,451
1,69,8,192
1,511,503,580
Current assets: Unrestricted: Cash Accounts receivable:
Customers (net of allowance for doubtful accounts) Taxes Interest Grants Miscellaneous Due from City of New Orleans, current Due from other fund
Inventory of supplies prepaid expenses
Total unrestricted
Restricted: Coital projects Constmction funds Debt service reserve Customer deposits Health insurance reserve Other
Total restricted
Total current assets
21,158,918
7,602,052
11,676,566 42,201
38,122,491 4,793,131
-47,249
12,576.264 691,058
96,709,930
80,594,752 6,221,641
30.040,670 6,550,885 5,195,970
212,000 128,818,918
225,528,848
34,588,256
7,301,967 10,323,398
322,318 13,116,853 5,036.848
122,812 290,778
12,887,851 1,545,816
85,536,897
67,781.695 54,206,676 32,075,521
5,390,167 5.080,812
212*000 164,746,871
250,283,768
Total assets 1,832,095,466 1,761,787,348
n-15

SEWERAGE AND WATER BOARD OF NEW ORLEANS STATEMENTS OF NET ASSETS
(Continned)
NFT ASSETS AND LIABILITIES 2009 2008
Net Assets: Invested in capital assets - net of related debt
Restricted For: Debt saVice Opital projects
Total restricted for net assets
Total net assets
Liabilities: Long-term liabilities:
Claims payable "Net pension obligation Olher postretirement benefits liability Bonds pay^Ie (net of current maturities) Special Community Disaster loan payable Debt Service Assistance Fund loan payable
Total long-term liabilities
Current liabilities (payable from current assets): Accounts payable Due to City of New Orleans Due to other governments (Note 14) Retainers and estimates payable Due to pension trust fund Accrued salaries Accrued vacation and sick pay Claims payable Other liabilities
1,367,130,463 $ 1,306,085,162
30,040,670 (90,604,532)
(60,563,862)
1,306,566,601
4,338,126 1,885,642
24,474,061 228,878,520
61,956,747 77,460,393
398,993,489
39,284,548 106,332
28,988,864 U23,443
58,158 1,096,653
10,048,113 16,265,665 5,877,666
32,075,521 (102,625,327)
(70,549,806)
103^49,442
1.235,535,356
4,873,176
15,186,702 220,644,423
61,956,747 77,460,393
380,121,441
36,048,591 151,333
28,928,619 2,253,676
90,290 1301,684 9,435.109
18,253,689 4,149,709
100,612,700
(Current liabilities (payable fh)m restricted assets): Accrued interest Bonds payable Retainers and estimates payable Chistomer deposits
Total current liabilities
Total liabilities
Total net assets and liabilities
See accompanying notes to financial statements.
993,480 14,605,000
1,136,569 6,550,885
23,285,934
126,535,376
525,528,865
1,832,095,466
1,032,516 37,282,479
1,812,689 5390,167
45,517,851
146,130,551
526,251,992
1,761,787348
11-16

SEWERAGE AND WATER BOARD OF NEW ORLEANS STATEMENTS OF REVENUES, EXPENSES AND CHANGES IN NET ASSETS
For the years ended December 31,2009 and 2008
2009 2008 Operating revenues:
Sales of water and delinquent fees Sewerage service charges Plumbing inspection and license fees OtliGT revenue
Total operating revenues
Operating Expenses: Power and pumping Treatment
Transmission and distribution Customer accounts Customer service Administration and general Payroll related Maintenance of general plant Depreciation Amortization
Provision for doubtful accounts Provision for claims
Total operating eiqjcnses
Operating loss
Non-operating revenues (expenses): Three-mill tax ( Six-mill tax Nine-mill tax Other taxes
OpCTating and maintenance grants Interest income Interest expense
Total non-operating revenues (expenses)
Income (loss) before capital contributions
Coital contributions
Change in net assets
Net assets: Bc^nning of year
End of year
See accompanying notes to finandal statements.
$ 50,677,054 66.102,946
484,448 3,814,564
121,079,012
12,950,788 19,910,557 21,466,523
3,044.936 3,417,239
13,504,125 35,085,953 24,828,902 34,692,628
140,917 (3,693,971)
58,860
165,407,457
(44328,445)
10,302,545 10,410,5?4 15,485,030
371,006 19373,185
885,723 (1.766,553)
55,061,460 .
10,733,015
60,298,230
71,031,245
1,235^35356
$ 1,306,566,601
$ 43,995,732 61,877,246
590,604 2,487,983
108,951,565
14,178,641
18,243,782 18,994,209 2.719,594 3,323,696
15.173,190 31,549,622 33,455,074 31,546,017
158,019 1,244,862
587,465
171,174,171
(62,222,606)
11,294,822 11,406,361 17,001,253
515,735 (3,973)
3,545,564 (1,720,030)
42,039,732
(20,182,874)
(29,931,607)
(50,114.481)
1,285,649,837
$ 1,235,535.356
n-n

SEWERAGE AND WATER BOARD OF NEW ORLEANS STATEMENTS OF CASH FLOWS
ENTERPRISE FUND For the years ended December 31,2009 and 2008
2009 2008 Cash flows fratb operating activities
Cash received from customers Cash payments to suppliers for goods and services Cash payments to employees for services Otiier revenue
Net cash used in operating activities
Cash flows from noncapital financing activities Proceeds from property taxes Proceeds from federal operating and maintenance grants Cash received from (paid to) an other government (Note 14)
Net cash provided by noncapital financing activities
Cash flows from coital and related financing activities Acquisition and construction of capital assets Proceeds from Debt Service Assistance Fund loan Principal payments on bonds payable Proceeds from bonds payable Payments for bond issuance costs Interest paid on bonds payable Principal payments on coital lease Interest paid on c&pital lease Proceeds from construction fund, net (Note 14) Capital contributed by developers and federal grants
Net cash used in capital and related financing activities
C ash flows from investing activities Payments fbr purchase of investments Proceeds fix)m maturities of investments Investment income
Net cash provided by investing activities
Net increase in cash
Cash at the begiiming ofthe year
Cash at the end of flie year
Reconciliation of cash and restricted cash (Note 2) Current assets - cash Restricted assets rcash
Total cash
• $ 120,128,884 (67,905,381) (62,192,851)
4,542,729
(5,426,619)
35;215,937 16,600,789
(18,098,192)
33,718,534
(106,953,016) -
(37,300,000) 23,040,889 (1,172,452)
(14,226,040) --
18,158,437 38,187,800
(80,264382)
(487,546,256) 595,423,939
1.454,458
109332,141
57359,674
. 35,522,908
$ 92.882,582
$ 21,158,918 71,723,664
$ 92,882,582
$ 113,557,045 (72,538,365) (56.968,728)
2.692,029
(13,258,019)
34,444378 695,562
21.097,027
56,236,867
(81327,975) 12,805371
(12,635,000) -- .
(14,485,620) (104,445)
(1.409) 7,831,592
28,612316
(59,305370)
(482,917302) 510,268,751
6,119,988
33,471,437
17,145,015
. 18377,893
$ 35,522,908
$ 34,588356 934,652
$ 35,522,908
(Continued)
n-18

SEWERAGE AND WATER BOARD OF NEW ORLEANS
STATEMENTS OF CASH FLOWS (Continued)
ENTERPRISE FUND
For the years ended December 31, 2009 and 2008
2009
Reconciliation of operating loss to net cash used m operating activities is as follows: Opwating loss Adjustments to reconcile net c^erating loss to net cash
used in operating activities: Depreciation Provision for claims Provision for (recovery of) doubtful accounts Amortization Change in operating assets and liabilities:
Decrease in custtHnw and other receivables (Increase) decrease in inventory (Increase) decrease in prepaid expenses
and other receivables Decrease in net pension asset Increase (decrease) m accounts paj^le Increase in accmed salaries, due to
pension and accrued vacation and sick pay Increase in net otiier postretirement benefits liability Decrease in other liabilities
Net cash used in operating activities
2008
$ (44,328,445) $
34,692,628 58,860
(3,693,971) 140,917
3393,885 .311,587
1342,004 2,441,093
(8.549399)
375,841 9,287359 (898,978)
$ (5,426,619) ;
(62,222,606)
31,546,017 587,465
1,244,862 158,019
7.559,667 (711,121)
(511,949) 2,231,244 2,066,541
893310 8,511,992
. (4,611,460)
5 (13,258,019)
See accompanying notes to financial statements.
n-i9

SEWERAGE AND WATER BOARD OF NEW ORLEANS STATEMENTS OF PLAN NET ASSETS
PENSION TRUST FUND December 31,2009 and 2008
See accompanying notes to financial statements.
2009 2008
Assets: Cash Receivables:
Investment income Employee contributions receivable
Due from other fimd Investments:
Money market LAMP Corporate bonds Equities
Total assets
Liabilities: DROP participants payable
Total liabilities
Plan net assets available for pension benefits
764,400 776,446
27,794 10,909 47,249
19,549,539 5,863.469
83,959,767 80,801,016
191,024,143
6.247,599
6.247.599
$ 184,776,544 $ - — ^ • ^ =
103,710 17,023
274,483
979,756 4,035,743
71,876305 88354,730
166,418,096
4,034,240
4,034,240
162383,856
11-20

SEWERAGE AND WATER BOARD OF NEW ORLEANS STATEMENTS OF CHANGES IN PLAN NET ASSETS
PENSION TRUST FUND For the years ended December 31,2009 and 2008
2009 2008
Additions: Ck)ntribiitions: Employee contributions Employer contributions City annuity and other transfers in
Total contributions
Investment income: Interest income Dividend income Net appreciation (depreciation)
Less: investment expense .
Net investment income Ooss)
Total additions
Deductions: Benefits • Employee refunds Employee contributions to DROP
Total deductions
Change in plan net assets
Plan net assets at beginning of year
Plan net assets at end of year
$
$
1,161,744 $ 5,247,031
516393 6.925.168
29,818 863,785
28,992.832 . 29.886,435
(187,039)
29,699396
36.624,564
(11,140341) (85.524)
(3,006.011)
(14331,876)
22392,688
162383,856
184,776,544 $
1,143,858 4,915,512
958,605 7,017,975
(27,774) 1.812,649
(60,658,710) (58,873,835)-
(316309)
(59.190,144)
(52,172,169)
(10,782.636) (133,779)
(2,353384)
(13,269,799)
(65,441,968)
227,825.824
162,383,856
See accompanying notes to financial statements.
n-21

(This is page intenttonally left blank)

NOTES TO BASIC FINANICAL STATEMENTS

(This is page intentionally left blank)

SEWERAGE AND WAtER BOARD OF NEW ORLEANS
NOTES TO FINANOAL STATEMENTS
(1) Summary of Significant Accounting Policies
History and Organization
The major operation of the Sewerage and Water Board of New Orleans (the Board) is providing water, sewerage and drainage services for the City of New Orleans (the City). The Sewerage and Water Board of New Orleans was created by Act 6 ofthe Louisiana Legislature of 1899 as a special board independent of the City's government to construct, maintain and operate a water treatment and distribution system and a public sanitary sewerage system for the City. In 1903, tlie Legislature gave the Board control of and responsibility for the City's major drainage system and relieved the City of the duty of providing in its annual operating budget or otherwise for the maintenance and operations ofthe water, sewerage and drainage systems.
In accordance with the Louisiana Revised Statutes (LRS) 33:4096 and 4121, the Board has the axitfaority to establish the water and sewerage rates to charge to its customers. The rates are based on the actual water consumed and on the costs of maintenance and operation of the water and sewerage systems, including the costs of improvements and replacements. The collections of water and sewerage revenue are to be used by the Board for the maintenance and operation of the systems, the cost of improvements, betterments, and replacements, and to provide for the payments of interest and principal on the bonds payable. On March 21,2007, the Board approved a series of five annual water rate increases beginning with the first increase on November 1, 2007 followed by four additional increases to be implemented on July 1 of each year, 2008 througji 2011. The New Orleans City Council approved the aimual water rate increases on October 4, 2007.
The Board has also been given the authority to levy and collect various tax millages which are used for the operation and maintenance ofthe drainage operations. All excess revenues collected are made available for capital development ofthe system. The proceeds ofthe rate collections and tax millages are invested in such investments as authorized by the LRS. These investments are reflected in. the combined statement of net assets, as "restricted assets," as they are restricted to the pmposes as described above.
The Board, is composed of thirteen members, including the Mayor of the City, the two Council Members-at-Large, and one District Councilman selected by the City C!ouncil, two members ofthe Board of Liquidation and seven citizens appointed by the Mayor. The appointed members ofthe Board serve staggered nine year terms.
The Board's accountmg policies conform to accounting principles generally accepted in the United States of America as applicable to utilities and to govemmental nnits. The following is a summary ofthe more significant policies.
(A) Reporting Entity
In conformity with the Govenunental Accoimting Standards Board's definition of a reporting entity, the Board includes an enterprise fund and a pension trust fimd for financial reporting purposes. The Board is considered a reporting entity based on the following criteria:
n-22

SEWERAGE AND WATER BOARD OF NEW ORLEANS
NOTES TO FINANCLVL STATEMENTS (Continued)
(1) Summary of Sigruficant Accounting Policies (continued'
(a) Responsibility for surpluses/deficits. The Board is solely responsible for its surpluses/deficits. In accordance with Louisiana Revised Statutes, no other governmental unit is responsible for the Board's deficits or has a claim to its surpluses. The Board's operations are self-sustairung; revenues are generated through charges to customers and dedicated property taxes. Other than grants, no funding is received from the State of Louisiana or the City of New Orleans.
(b) Budget Approval. The Board is solely responsible for reviewing, approving and revising its budget
(c) Responsibility for Debt The Louisiana Revised Statutes authorize the Board to issue bonds; such bonds must bear on their face a statement tiiat they do not constitute a debt of the City, The Board is solely responsible for payments to the bondholders. No other govenunental unit is required by statute to make any payments to bondholders nor have any payments to bondholders ever been made by any govemmental imit, except the Board.
(d) Designation of Management The Board controls the hiring of management and employees.
(e) Special Financial Relationship. The Board has no special financial relationships with any other govenmiental unit
(f) Statutory Authority. The Board's statutory authority was created by the State of Louisiana as an independent governmental unit Only an amendment to state statutes can change or abolish the Board's authority.
The Board is a stand-alone entity as defined by Governmental Accountirig Standards Board Statement 14, The Financial Reporting Entity. The Board is a legally-separate govemmental organization that does not have a separately elected governing body and does not meet the definition, of a component unit. As iv result of a Louisiana Supreme Court decision on March 21, 1994, the Board was declared to be an autonomous or self-governing legal entity, legally independent of the city, state and other governments, created and organized pursuant to Louisiana Revised Statutes 33:4071 as a board, separate and independent ofthe governing authorities ofthe City and vested with autonomous or self governing authority. No other government can mandate actions of the Board nor impose specific financial bm^ens. The Board is fiscally independent to operate under its bond covenant and tiie provisions of Louisiana Revised Statute provisions.
The City of New Orleans includes the Board as a component unit in the City's financial statements.
11-23

SEWERAGE AND WATER BOARD OF NEW ORLEANS
NOTES TO FINANCIAL STATEMENTS (Continued)
(1) Summary of Significant Accounting Policies (continued)
(B) Basis of Financial Statement Presentation
The Board's basic financial statements consist ofthe govemment-wide statements which include the proprietary fimd (the enterprise fimd) and the fimd financial statements which includes the fiduciary fund (the pension trust fimd). The operations of the Board are accounted for in the following fiind types:
Proprietary Fund Type
The proprietary fimd is used to account for the Board's ongoing operations and activities which are similar to those often found in the private sector. The proprietary fimd is accounted for using a flow of economic resources; measurement focus. With this.measurement focus, ail assets and all
, Habilities associated with the operation of these funds are included on the statement of net assets. Net assets are segregated into amounts invested in capital assets (net of related debt), restricted for debt service, restricted for coital projects and unrestricted. The Board's restricted assets are expendable,for their pmposes. The Board utilizes available unrestricted assets before utilizing restricted assets. The operating statements present increases (revenues) and decreases (expenses) in net assets. The Board maintains one proprietary fimd type - the enterprise fimd. The enterprise fimd is used to account for operations (a) that are financed and operated in a manner similar to private business enterprises-where the intent of the governing body is that the cost (expMises, including depreciation) of providing goods or services to ihe general public on a continuing basis be financed or recovered primarily through user charges; or (b) where the governing body has decided that periodic determination of revenues earned, expenses incurred, and/or net income is appropriate for capital maintenance. The presentation ofthe financial statements ofthe enterprise fimd follows the format recommended by the National Association of Regulatory Utility Commissioners (NARUC).
, The statement of net assets arrangement for a utility reflects the relative iniportance ofthe various accounts. "Property, plant and equipment" is the first major category on the asset side, and long-term capitalization categories of net assets are listed first on the Uabiiity side. Current assets and current liabihties are assigned a relatively less important position in the center of tiie statement of net assets, rather than being placed first as in the statement of net assets of commercial and industrial enterprises.
Operating revenues include aU charges for service; otho- revenues include reconnection fees and other miscellaneous charges. Operating expenses include the costs associated with providing water, sewerage and drainage services. Interest income, int^est expense and tax revenues are presented as non-operating items.
The enterprise fund is presented in the govemment-wide financial statements.
n^24

SEWERAGE AND WATER BOARD OF NEW ORLEANS
NOTES TO FTNANCLO. STATEMENTS (Continaed)
(1) Summary of Significant Accounting Policies (continued)
Fiduciary Fund Type
The fiduciary fiind is used to account for assets held by the Board in a trustee capacity or as an agent for individuals, private organizations, other govemmental units and/or other fiinds. The Board maintains one fiduciary fimd type - the pension tmst fund. The pension trust fiand uses the flow of economic resources measurem^t focus. All assets and liabilities associated with the operation of this fiind are included in the statement of plan net assets. The pension tmst fiind is used to account for the activity ofthe Board's employee retirement plan.
The pension trust fimd is presented in the fijnd financial statements.
The Board applies all apphcahle FASB pronouncements issued on or before November 30, 1989 in accounting for its enterprise fimd and pension trust fimd operations unless those pronoimcements conflict witii or contradict GASB pronouncements.
(C) Basis of Accounting
The enterprise fimd and the pension trust fimd prepare their financial statements on the accrual basis of accounting. Unbilled utiUty service charges are not recorded as management considers the
. effect of not recording such imbilled receivables as not material. Property taxes are recorded as revenue in the year for which they are levied. Plan member contributions are recognized in the period in which contributions are due. Employer contributions to the pension plan are recognized when due and the employer has made a commitment to provide the contributions. Benefits and refunds are recognized when due and payable in accordance with the terms of tiie plan.
(D) Investments
Investmoits are reported at fair value, except for short-term investments (maturity of one year or less) which are reported at amortized cost, which approximates fair value. Securities traded in a national or international exchange are valued at the last reported sales price at current exchange rates. Investments that do not have an established market are reported at estimated fair value.
(E) Inventory of Supplies
Inventory of supplies is stated at the lower of cost or market Cost is determined by the first-in, first-out method.
(F) Property, Plant and Equipment
Property, plant and equipment are carried at historical cost. The Board capitalizes moveable equipment with a value of $10,000 or greater, stationary, network and other equipment witii a value of $5,000 or greater and all real estate. The cost of additions includes contracted work, direct labor, materials and allocable cost Donated ci^ital assets are recorded at tiieir estimated fan value at the date of donation.
n-25

SEWERAGE AND WATER BOARD OF NEW ORLEANS
NOTES TO FINANCLAL STATEMENTS (Continued)
(1) Summary of Significant Accounting Policies (continued)
Interest is capitalized on property, plant and equipment acquired and/or constmcted witii tax exempt debt. Depreciation is computed using the straight-lme method over the estimated usefiil life ofthe asset When assets are retired or otherwise disposed of, the cost and related accumulated depreciation are removed from the accounts and any resulting gain or loss is recognized in revenue for the period. The cost of maintenance and repairs is charged to operations as incurred and significant renewals and betterments are capitalized. Deduction is made for retirements resulting fi'om renewals or betterments.
(G) Vacation and Sick Pay
Vacation (annual leave) and sick pay (sick leave) are accmed when eamed. Annual leave is accmed at the rate of .6923 of a workday for each bi-weekly accrual period for all employees on the payroll as of December 31.1978. Employees hired after that date earn leave at a rate of .5 of a workday per bi-weekly pay period.
All employees on the payroll as of December 31, 1978 receive three bonus days each year; aU employees hired after that date receive three bonus days each year for five through nme calendar years of continuous service; six bonus days each year for ten through fourteen years; nine bonus days each year for fifteen tiirough nineteen years; and, twelve days for twenty or more years of continuous service. Civil Service's policy permits employees a limited-amount of eamed but unused aimual leave which will be paid to employees upon separation firom the Board. The amount shall not exceed ninety days for employees hired before January 1, 1979, and forty-five days for employees hired after December 31,1978.
Sick leave is accimiulated on a bi-weekly basis by all employees hired prior to December 31,1978 at an accrual rate of .923 of a workday. For employees hired subsequent to December 31, 1978, the accrual rate is .5 of a workday for each bi-weekly period, plus a two day bonus each year for employees with six through fifteen calendar years of continuous service, and seven bonus days each year for employees with sixteen or more calendar years of continuous service.
Upon separation fi'om the Board, an employee can elect to convert unused sick leave for retirement credits or cash. The conversion to cash is determined by a rate ranging fi'om one day of pay for five days of leave for the 1 st througji 100th leave day to one day of pay for one day of leave for all days in excess ofthe 400th leave day. The total habihty for unconverted sick leave as December 31, 2009 and 2008 is approxhnately $13,783,000 and $12,949,000, respectively. The amount included in tiie statements of net assets as of December 31, 2009 and 2008 is $10,048,113 and $9,435,109, respectively, which represents the annual leave and the converted sick leave since virtually all employees convert their sick leave to cash. The amounts for compensated absences include the salary cost as well as certain salary related costs, such as the Board^s share of social security expense. The following table summarizes changes in the Board's vacation and sick pay liability.
OirrentYear Beginning of Eamed and Changes End of
'. Year Year Liability in Estimate Payments Year Liability 2009 9,435,109 7,239,848 (6,626,844) 10,048,113 2008 8,982,354 7,087,823 (6,635,068) 9,435,109
n-26

SEWERAGE AND WATER BOARD OF NEW ORLEANS
NOTES TO FINANCLU. STATEMENTS (Continued)
(1) Summary of Significant Accountmg Policies (continued)
(H) Pension
The Board funds the accmed pension cost for its contributory paasion plan which covers substantially all employees. Annual costs are actuarially computed using the entry age normal cost method.
(I) Dramage System
In 1903, the Legislature gave the Board control of and responsibility for the City's drainage system. The Drainage System was established as a department of the «iterprise fimd to account for the revenues fix>m three-mill, sbc-mill and nine-mill ad valorem taxes designated exclusively for drainage services. These revenues have been supplem^ited by inspection and license fees collected by the Board. There exists a potential for additional financkig by additional user service charges. Expenditures from the system are for the debt service of three-mill, six-mill and nine-mill tax bonds and drainage related operation, maintenance and constmction.
(J) SelP-Insurance/Risk Management
The Board is self-insured for general liability, workers* compensation, unemployment , compensation and hospitalization benefits and claims. The accmed liabihty for the various types of claims represents an estimate by management ofthe eventual loss on the claims arising prior to year-end, includmg claims incurred and not yet reported including estimates,of both future payments of losses and related claims adjustment and expraise. Estimated expenses and recoveries are based on a case by case review.
(K) Coital Contributions
Contributions fi-om developers and others, and receipts of Fedwal, State and City grants for acquisition of property, plant and equipment are recorded as capital contributions in the statemeat of revenues, expenses and changes m net assets.
(L) Bond Issue Cost and Refinancing Gains (Losses)
Costs related to issuing bonds are capitalized and amortized based upon the methods used to f^proximate the interest method over the life of the bonds. Beginning with fiscal years in 1994 and thereafter, gains and losses associated with refimdings and advance refundmgs are being deferred and amortized based upon the methods used to approximate the interest method over tiie life of the new bonds or the remaining term on any refunded bond, whichever is shorter. Premiums associated with bond issues are amortized over the interest yield method.
(M) Cash Flows
For purposes of the statement of cash flows, only cash on hand and on deposit at financial institutions are considered to be cash equivalents. Certificates of deposits, treasury bills and other securities are considered investments.
n-27

SEWERAGE AND WATER BOARD OF NEW ORLEANS
NOTES TO FINANCTAL STATEMENTS (Continued)
(1) Simimarv of Significant Accounting Policies (continued)
(N) Use of Restricted Assets
When restricted and unrestricted resources are available to cover expenses, imrestricted resources are first applied.
(O) Use of Esthnates
The preparation of fmancial statements in conformity with accounting principles generally accepted in the United States of America requires management to make estimates and assumptions that affect the reported amounts of assets and liabilities and disclosure of contingent assets and liabilities at the date of the financial statements and the reported amounts of revenue and
. expMiditures during the period. Actual results could differ fi-om those estimates. The cunent economic envirorunent has increased the degree of imcertainty inherent in those estimates and assumptions.
(P) Net Assets
The Board classifies net assets into two components: invested in coital assets, net of related debt and restricted. These components are defmed as follows:
Invested in capital assets, net of related debt - This component of net assets consists of capital assets, net of accumulated depreciation and reduced by the outstanding debt attributable to the acqtiisition, constmction, or improvement of those assets. If there are significant unspent related debt proceeds at year-end, the portion of tiie debt attributable to the unspent proceeds is not included in this component of net assets, Rathw, that portion of debt is mcluded in the same component of net assets as the unspent proceeds.
Restricted - This component reports those net assets with externally imposed constraints placed on their use by creditors (such as through debt covenants), grantors, contributors, or laws or regulations of other governments or constraints unposed by law through constitutional provisions or enabling legislation.
Unrestricted - This component reports net assets that do not meet the definition of either of the other two components.
(2) Cash and Investments
The Board's investments and cash consist primarily of investments in direct obligations of the United States or agencies thereof and deposits with financial institutions.
n-28

SEWERAGE AND WATER BOARD OF NEW ORLEANS
NOTES TO FINANCLVL STATEMENTS (Continaed)
(2) Cash and Investments (continued)
Custodial Credit Risk - Deposits - Custodial credit risk is the risk that in the event of a bank failure, the government's deposits may not be returned to h. Statutes require that fhe Board's cash and certificates of deposit be covered by federal depository insurance or collateral. At December 31, 2009, tiie Board's deposits with banks consisted of cash totaling $28,440,023 and certificates of deposit of $42,191,060, At December 31, 2008, the Board's deposits with banks consisted of cash totalmg $40,291,215 and certificates of deposit of $138,370,437. Of tiie cash bank balance at December 31, 2009 and 2008, $1,250,000 and $815,258, respectively, is covered by federal deposhory insurance. The remaining amount ofthe Board's cash bank balances and all certificates of deposit for 2009 and 2008 were covered by collateral held by custodial agents of the financial institutions m the name ofthe Board.
In accordance with GASB 40, unless there is information to the contrary, obligations ofthe U.S. Government are.not considered to have credit risk and do not require disclosure of credit quahty.
The followuig are the compon^its ofthe Board's cash and mvestments as of December 31:
Uarestricted Restricted Total 2009 Enterprise Fund: Cash and money market funds
dCertificates of deposit
Investments Total cash and investments at fair value
21,158,918 $ 71,723,664 $ 92,882,582 42,191,060 42,'^91,060
21,158,918 113,914,724 14,904,194
135,073,642 14^904,194
21,158,918 $ 128,818,918 $ 149,977,836
2008 Unrestricted Restriicted Total Enterprise Fund:
Cash and money market fimds $ 34,588,256 $ 934,652 $ 35,522,908 Certificates of deposit 138^70,437 138,370,437
34,588,256 139,305,089 173,893,345 Investments 25,411,782 25,441,782
Total cash and investments at fair value $ 34,588;256 $ 164,746,871 $ 199,335,127
The composition and carrying value of investments is as follows:
2009 Enterprise Fund: LAMP U.S. Government securities and
instrumentalities
2008
$ 6,007,861 $ 7,814,883
8,896,333 17,596,899
$ 14,904,194 $ 25,411,782
n-29

SEWERAGE AND WATER BOARD OF NFiW ORLEANS
NOTES TO FINANCLVL STATEMENTS (Continaed)
(2) Cash and Investments (continued)
2009 2008 Pension Trust Fund: Money market $ 19,549,539 $ 979,756 LAMP 5,863,469 4,035,743 Corporate bonds 83,959,767 71,876,205 Equities 80,801,016 88,354,730
$ 190,173,791 $ 165,246,434
Investments - Statutes authorize the Board to invest m obligations ofthe U.S. Treasury, agencies, and instrumentalities, commercial paper rated A-1 by Standard & Poors Corporation or P-l by Moody's Commercial Paper Record, repurchase agreements, and the Louisiana Asset Management Pool (LAMP). In addition, the pension trust fimd is authorized to invest m corporate bonds rated A or better by Standard & Poors Corporation or AAA or better by Mood/s Investors Service, and equity securities.
LAMP is administered by LAMP, Inc., a non-profit corporation organized under the laws of the State of Louisiana, Ortiy local government entities having contracted to participate in LAMP have an investment interest in its pool of assets. The primary objective of LAMP is to provide a safe environment for the placement of public fimds in ^ort-tenn, high quality mvestments. The LAMP portfolio includes only securities and other obligations in which local governments in Louisiana are authorized to invest m accordance with Louisiana R.S. 33:2955. Accordingly, LAMP investments are restricted to securities issued, guaranteed, or backed by the U.S. Treasury, the U.S. Govemmeint, or one of its agencies, enterprises, or instrumentalities, as well as repurchase agreements collateralized by tiiose secxirities. The dollar weighted average portfolio maturity of LAMP assets is restricted to not more than 90 days, and consists of no securities with a maturity m excess of 397 days. LAMP is designed to be h i ^ y liquid to provide unmediate access to participants. The fau- market value of investments is determined on a weekly basis to monitor any variances between amortized cost and market value. For purposes of determining participants' shares, investments are valued at amortized cost LAMP is subject to the regulatory oversight of the state treasurer and LAMP'S board of directors. LAMP is not registered with the SEC as an investment company.
Under the provisions of its benefit plan and state law, the Board's pension benefit trust engages in securities lending to broker dealers and other entities for cash collateral that will be returned for the same securities in the future. The cash collateral cannot be liquidated by the Board unless the borrower defeults. Cash collateral is initially pledged at 102.58% of tiie market value of securities lent and additional collateral is provided by the next business day if the value falls to less than 100% ofthe market value ofthe securities lent No collateral exposure existed as of December 31, 2009 and 2008. The value of securities lent at Decemb^ 31, 2009 and 2008 was $23,642,221 and $38,883,529. The maricet val]ie of tiie cash collateral at DecCTiber 31, 2,009 and 2008 was $24,253,164 and $40,559,644.
n-30

SEWERAGE AND WATER BOARD OF NEW ORLEANS
NOTES TO FINANCLVL STATEMENTS (Continaed)
(2) Cash and Investments fcontumed)
Interest Rate Risk - Interest rate risk is the risk that changes m market interest rates will adversely affect the fair value of an investment In general, the longer tiie maturity of an investment, the greater the sensitivity of its fair value to changes m market interest rates. The Board has a formal investment policy that states that the investment portfolio shall remain si^cientfy liquid to meet all operating and ccq>ital requirements that may be reasonably anticipated and that maturities of investments are to be structured cojicurrent with cash needs to meet anticipated demand. As of December 31, 2009 and 2008, the Board's Enterprise Fund investments in U.S. Government Securities and Instrumentalities included U.S. Treasury Bills and Strips totaling $8,896,333 and $17,596,899, respectively, all of which have a remaming maturity of less tiian one year.
Credit Risk - State law limits investments in securities issued, or backed by United States Treasury obligations, and U.S. Govenunent instmmentalities, which are federally sponsored. The Board's investment policy does not further limit its investment choices., LAMP is rated AAAm by Standard & Poor's. The Pension Trust Fund's mvestment policy requues that fixed income investments be investment grade (BBB or higher as rated by Standard & Poor's or Baa or higher as mted by Moody's. Bonds rated below BBB/Baa are not to exceed 15% ofthe portfolio and non-rated bonds are not to exceed 1% ofthe portfolio.
(3) Defined Benefit Pension Plan
The Board has a smgle-employer contributory rethement plan covering all fiill-time employees, the Pension Trust Fund (PIT). The Board's payroll for current employees covered by PTF for the years ended December 31, 2O09 and 2008 was $29,947,906 and $29,466,571, respectively; such amounts exclude overtime and standby payroll. Total payroll, including overtime and standby payroll, was $45,742,506 and $42,733,299 for tiie years ended December 31, 2009 and 2008, respectively. At December 31, the PTF membership consisted of:
2009 2008 Retirees and beneficiaries currently receiving benefits and terminated employees entitled to benefits but not yet receiving them 771 752
Current employees: Vested Non-vested
Total
The benefit provisions were established by action of the Board in 1956 in accordance with Louisiana statutes. The Board retains exclusive control over the plan tiirough the Pension Committee of the PTF. Effective January 1, 1996, tiie plan became quahfied under Internal Revenue Code Section 401(a) and thus is tax exempt
585 251 836
1,607
604 223 827
1,579
n-31

SEWERAGE AND WATER BOARD OF NEW ORLEANS
NOTES TO FINANCIAL STATEMENTS (Continued)
(3) Defmed Benefit Pension Plan (continued)
The plan provides for rethement benefits as-well as death and disability benefits. All benefits vest after ten years of service. Employees who retire at or after age sixty-five with ten years of credited service are entitled to an annual rethement benefit, payable biweekly for life, in an amount equal to two percent of theh average compensation for each year of credited service up to ten years, increasing by (1) one-half percent per year for service years over ten years, (2) an additional one-half percent per year for service years over twenty years and (3) an additional one percent per year for service years over thirty years, for a maximum of four percent for each year of credited service. Averse compensation is the average annual eamed compensation (prior to 2002, less $1,200) for the period of thirty-sbc successive months of service during which the employee's compensation was the highest. Employees witia thirty years or more of credited service may retire without a reduction in benefits. Employees may retire prior to age sbcty-two without thirty years of service with a reduction in benefits of three percent for each year of age below the age of sixty-two. If an employee leaves covered employment or dies before three years of credited service, the accumulated employee contributions plus related mvestment eammgs are refunded to the. employee or designated beneficiary.
The retirement allowance for retirees over age sixty-two is subject to a cost of living adjustment each January 1, provided that the member retired on or after January I, 1984. The adjustment is based on the increase in the Consumer Price Index for all urban wage earners published by the U.S. Department of Labor, but is limited to an aimual gnaximum of two percent on the first $10,000 of initial retirement benefits.
Effective September 23, 1993, employers may. transfer credit between the Board's plan and the City of New Orleans retirement system with full credit for vested service. The Board and its employees are obligated under plan provisions to make all requhed contributions to the plan. The required contributions are actuarially determined. Level percentage of payroll employer contribution rates is determined using the entry age normal actuarial fimding method. Employees are required to contribute four percent of their regular salaries or wages.
The Board had attained fuU fimding of the actuarially computed pension liability in 2000. Effective June 19, 2002, however, as a result ofthe adoption of several plan changes in accordance with the Board's reciprocity agreement with the City of New Orleans, the plan became unfunded. These changes impacted the plan's funding requirements by $20,333,835, which is being amortized over a 10 year period. Key changes adopted included: (a) amendment to benefit formula; (b) adoption of a ''Rule of 80" retirement; (c) change in the years of service required for a terminating employee to qualify for a later separation benefit from 10 years to 5 years; and (d) elimination ofthe exclusion ofthe first $1,200 of eamings form benefits and contributions.
The annual required contribution for the current year was determined as part ofthe December SI, 2009 actuarial valuation using the entry age normal cost method. The actuarial assumptions iiicluded (a) 7.0% investment rate of return (net of administrative expenses) and (b) projected salary increase of 5.0%.per year. Both (a) and (b) included an inflation component of 2.0%. The actuarial value of assets was determined using a seven-year weighted market average.
n-32

SEWERAGE AND WATER BOARD OF NEW ORIXANS
NOTES TO FINANCIAL STATEMENTS (Continued)
(3) Defmed Benefit Pension Plan (continued)
The Board*s net pension asset for fhe years ended December 31 was as follows:
2009 200S
Annual requhed contribution $ 7,591,495 $ 7,146,527 Interest on net pension obligation (38,882) (195,069) Adjustments to annual required contribution 76,654 384,575
Annual pension cost 7,629,267 7,336,034
Contributions made 5,188,175 5,104,788
Decrease m net pension asset 2,441,092 2,231,245
Net pension asset, beginning of year 555,451 2,786,696
Net pension (liability) asset, end of year $ (1,885,642) $ 555,451
The net pension asset is being amortized over 10 years as of December 31, 2009, usmg the level dollar closed method and using tiie same interest, salary increase and mflation factors as the plan.
Trend information for Board and employee contributions is as follows:
Fiscal year ending: December 31,2009 December 31, 2008 December 31,2007
$ $ $
Annual Pension
CostfAPO
7,629,268 7,336,034 4,833,202
Percentage of APC
Contributed
68% $ 70% $ 86% $
Net Pension
(Liability) Asset
(1,885,642) 555,451
2,786,695
The actuarially determined contribution requirement for the Board was 25.349% for 2009 and 24.253% for 2008. The contribution requirement for employees is 4.0%. The actual Board's and employees' contributions (including contributions for transferred employees fi-om other pension plans) for years ended December 31 were as follows:
2009 2008 Employer and otiier transfers $ 5,763,424 $ 5,874,117 Employee . 1,161,744 1,143,858
Total contributions $ 6,925,168 $ 7,017,975
n-33

SEWERAGE AND WATER BOARD OF NEW ORLEANS
NOTES TO FINANCIAL STATEMENTS (Continued)
(3) Defined Benefit Pension Plan ^continued)
' Funded Status and Funding Progress
The funded status ofthe Plan as of December 31, 2009 and 2008, respectively, is based on the most recent actuarial valuation as follows:
Valuation pate
2009 2008
Actuarial Vahiecf A5^et9,
$ 228,999,660 $ 222,598,640
$ $
Actuarial Accrued liability (AAL)
269,506,028 260,616,822
Unfimded Actuarial Accrued
liability OJKAU
$ 40,506,368 $ 38,018,182
Funded Covered Ratio Pavroll
84.97 $ 29.947,906 85.41 $ 29,466,571 ,
UAAL as a Percent^e of Covered
Payroll
135-26% 129.02%
The projection of benefits for financial reporting purposes does not expHcitiy mcorporate the potential effects of legal or contractual fimding limitations.
DROP
Begitming yi 1996, the Board offered employees a "Defened Retirement Option Plan" (DROP), an optional retirement program which allows an employee to elect to freeze his or her retirement benefits, but continue to work and draw a salary for a minimum period of one year to a maximum period of five years. While continuing emplo3anent, the retirement benefits are segregated fixmi overall plan assets available to other participants. As of December 31, 2009 and 2008, 119 and 99 employees, respectively, participated in the plan. The amount of plan assets segregated for tiiese individuals was $6,247,599 and $4,034,240 as of December 31,2009 and 2008, respectively.
A separate report on the pension tmst fund is not issued.
(4) Property, Plant and Equipment
The useful lives of property, plant and equipment consisted ofthe following:
Power and pumping stations - buildings Power and pumping stations - machinery Distribution systems Sewerage collection Canals and subsurface drains Treatment plants Connections and meters Power transmission General plant General buildings
57 years 40 years 75 years 75 years 75 to 100 years 50 years 50 years 50 years 12 years 25 years
n-34

SEWERAGE AND WATER BOARD OF NEW ORLEANS
NOTES TO FINANCLVL STATEMENTS (Continned)
(4) Property, Plant and Equipment (continued)
Property, plant and equipment consisted of the following as of December 31;
2009
Cost
Real estate rights, non depreciable Power and punning stations -buildings
Power and puTr5)ing stations -machinery
Distribution systems
Sewerage collection
Canals and subsurfece drainage
Treatment plants
Cormections and meters
Power transmission
Gsneral plant
General buildings Total property, plant and equipment in service
Constmction in progress Total property, plant and equipn^nt
Accumalated De[a*eciation Power and punqjing stations -buildings Power and pumping stations -nmchinery
Distribution systems
Sewerage collection
Canals and subsurface drainage
Treatment plants
Connections and meters
Po wer trans mis s ion
General plant
General buildings
Total accumilated depreciation
Net property, plant, and equipment
Begiiming
Balance
$ 8.639,525
293,642,441
234,833301
121,666,788
. 253,843,280
281,960,990
120,712,279
42^276,929
23,607,668
189,714,618
7 ,586^7
1,578,484366
544,089,093
2,122,573,459
90,747^17
113,230,781
41,988,200
32,598^35
56,509,673
44,608,802
27,249,874
11,942,955
188,607,718
5 3 3 , 6 1 6
612,768,071
$ 1,509,805388
Additions
$ 33,033
31,111,254
7,580,510
3.004,246
53,90i;236
28,112,411
15,203313
3,699,472
-
11,813306
-
154,458,781
130362.767
284,821,548
5.697.911
6,059,457
1.648,851
4,133,470
3.191,916
2,718312
906,071 -
472,153
9,561,024
303,463
34,692,628
$ 250,128,920
Deletions
$
-
-
(697,242)
(2.151,765)
-
-
(672,852)
-
(95,422)
-
(3,617,281)
(155^41,966)
(159,159,247)
-
(697,242)
(2,151,765)
-
-
(672,852)
-
(95.422)
-
(3.617,281)
$ (155341,966)
Ending
Balance
$ 8,672,558
324,753,695
242,413,811
123,973,792
305,592,751
310,073,401
135,915392
45303349 •
23,607,668
201,432,502
7386,547
1,729,325,866
518,909,894
2,248.235.760
96,445,428
119,290,238
42,939,809
34380,640
59,701389
47,327,114
27,483,093
12,415,108
198,073.320
5387,079
643.843,418
$ 1,604,392342
11-35

SEWERAGE AND WATER BOARD OF NEW ORU^ANS
NOTES TO FINANCIAL STATEMENTS (Continued)
(4) Property, Plant and Equipment (continued)
Cost Real estate ri^its, non depreciable Power and pumping stations -buildings Power and pumping stations -machinery
Distribution systems
Sewerage collection Canals and subsurface drainage Treatment plants
Connections and meters Power transmission
General plant
General building? Total property, plant and equipment in service
Construction in progress Total property, plant and equipment
Accumulated Depreciation Povrer and pumping stations -buildings Povrer and pumping stations -machinery
Distribution systems
Sewerage collection
Canals and subsurface drairu^ Treatment plants
Connections and meters
Power transmission
General plant
General building? Total accumulated depreciation
Net property, plant, and equipment
-
Beginning
Balance
$ 8,639325
287,862377
224,489,768
121,812303 234,788,244
281,803343
116,746390 38,521,713
23,607,668
180,041,127 7386347
1,525,899,205
522334354
2,048,433,759
85,608,774
107360,835
40,813.481
30,615,649 53,661390
. 42.194356
26,460,858
11,470,802
180,041,127
4,980.154
583,207,826
$1,465,225,933
2008
Additions
$
5,780,064
10343333
288,776 20,447,865
157,647 3,965,689
3,811,737 -
9,775,622 -
54370.933
76,074,913
130,645,846
5,138.743
5,869,946
1,609,010
3376,115
2,848,083 2,414,246
845337
. 472,153 8,668,722
303,462
31,546,017
$99,099,829
1
Deletions
$
-
-
(434,291) (1392,829)
--
(56,521)
-
(102,131) -
(1,985.772)
(54,520374)
(56306,146)
-
-(434,291)
(1392.829)
-
-
(56321) -
(102,131) -
(1,985,772)
$(54,520374)
Ending
Balance
$ 8.639325
293,642.441
234,833301 121,666,788 253,843,280
281,960,990 120,712,279
42,276,929
23,607.668
189,714,618
7386,547
1378,484366
544,089,093
2,122373,459
90,747317
113,230,781
41,988;200
32,598,935
56309,673
44.608,802 , 27,249,874
11,942,955
188,607.718
5,283,616
612,768,071
$ 1309,805388
n-36

SEWERAGE AND WATER BOARD OF NEW ORLEANS
NOTES TO FINANCIAL STATEMENTS (Continued)
(4) Property. Plant and Equipment (continued)
Interest capitalized was as follows for the years ended DecemhOT 31:
2009 Interest income Interest expense Net interest c^italized
490,410 (11310,812)
(5)
2008 $ 1,966331
(12,293,962) $ (10,820,402) $ (10,327,431)
Customer Receivables
Customer receivables as of December 31 consist ofthe following:
(6)
2009
2008
Water Sewer
Water Sewer
$ "
$
$
$
Customer Accounts 18,995,980 22,704,895
41,700,875
21,675,663 27,092,747
48,768,410
Due from the Citv of New Orleans
$ "
$ •
$
•
Allowance forBonbtfoI
Accounts 13,918,777 20,180,046
34,098,823
16,652,907 24,813,536
41,466,443
$ "
$
$
$
Net. 5,077,203 2,524,849
7,602,052
5,022,756 2,279,211
7301,967
In accordance with the terms of an agreement with the City of New Orleans, the Board and tiie City agreed to offset $2,098,687 (net of unearned discount $285,696) owed by the City to the Board at the rate of $200,000 annually in lieu of civil service charges through 2009. As of December 31, 2009 and 2008, $0 and $122,812, respectively, was due from the City of New Orleans.
n-37

SEWERAGE AND WATER BOARD OF NEW ORLEANS
NOTES TO FINANCIAL STATEMENTS (Coiitiuued)
(7) Changes in Long-term Obligations
a. Bonds Payable
Bonds payable consisted of the following as of December 31: Principal Balances
2009 2008 5,00% to 6.25% sewerage revenue bonds, series 1997 (initial average interest cost 5.36%), due in annual principal instalhnents rangmg from $1,100,000 to $2,425,000; fmalpaymentdue June 1,2017 $ 16,115,00C $ 17,685,00(
4.125% to 6.125% water revenue bonds, s^es 1998 (initial average mterest cost 4.82%), due in aimual principal mstallments ranging from $625,000 to $1,220,000; tinal payment due December 1,2018 9,190,0( 10,000,OOC
4.125% to 6.000% sewer revenue bonds, series 1998 (initial average interest cost 4.82%), due m annual principal installments ranguig from $950,000 to $1,910,000; final payment due June 1,2018 14360,00( 15,625,00C
4.10% to 6.10% drainage system bonds, series 1998 (initial average interest cost 4.84%), due in annual principal mstallments ranging from $370,000 to $760,000; fmal payment due December 1,2018 5,675,000 6,175,000
5.25% to 6.50% sewer revenue bonds, series 2000 (initial average interest cost 5,48%), due in annua! principal installments ranging fix)m $820,000 to $2,205,000; final payment due June 1,2020 18,425,000 19,585,000
5.00% to 7.00% sewCT revenue bonds, series 2000B (initial average intw^st cost 5.43%), due in annual principal installments ranging from $640,000 to $1,660,000; final payment due June 1,2020 14,010,OOC 14,905,00C
4.40% to 6.70% sewer revenue bonds, series 2001 (mitial average interest cost 5.02%), due in aimual principal installments ranging fit>m $1,100,000 to $2,455,000; final payment due December 1,2021 23,O15,00C 24,435,00C
n-38

SEWERAGE AND WATER BOARD OF NEW ORLEANS
NOTES TO FINANCIAL STATEMENTS (Continued)
(7) Changes in Long-term Obligations (continued)
a. Bonds Payable (continued)
3.00% to 5.00% sewerage service revenue bonds, series 2002 (initial average interest cost 4.36%>; due in annual principal installments rangmg from $1,635,000 to $4,520,000; final payment due June 1,2022.
3.00% to 5.00% water revenue bonds, series 2002 (initial average interest cost 4.57%, due in armual principal installments ranging from $945,000 to $3,658,000; final payment due December 1, 2022.
3,45% to 6.00% dramage system bonds, series 2002 (initial average mterest cost 4.46%), due in aimual principal instalhnents ranging from $510,000 to $2,155,000; final payment due December 1, 2022.
2^0% to 5.00% sewerage service revenue bonds, series 2003 (initial average interest cost 4.45%); due in annual principal instalhnents rangmg fiom $140,000 to $395,000; final payment due June 1,2023.
3.25% to 6.00% sewerage service revenue bonds, series 2004 (initial average interest cost 4.62%i); due m annual principal instalhnents rangmg from $945,000 to $3,685,000; final payment due June 1,2024.
5.02% sewerage service refimding bond anticipation notes, series 2006; due in one principal installment of $24,030,000 on July 15, 2009.
3.40% to 6.25% sewerage service revenue refunding bonds, series 2009 (initial average interest cost 6.68%); due in annual principal instalhnents ranging from $680,000 to $1,945,000; final payment due June 1. 2029.
Principal Balances 2009 2008
$ 43,485,00( $ 45,740,00C
27,560,000 28,770,000
15,850,000
4,260,000
27,010.000
16,535,000
4,490,000
28,280,000
24,030,000
23375,000
Plus bond premiums
total Less current maturities Bond payable, long-term
242,330,000 1,153,520
256,255,000 1,671,902
243,483,520 257,926,902 14,605,000 37,282,479
$ 228,878,520 $ 220,644,423
n-39

SEWERAGE AND WATER BOARD OF NEW ORLEANS
NOTES TO FINANCIAL STATEMENTS (Continued)
(7) Changes m Long-term Obligations (continued)
a. Bonds Payable Tcontinued)
The changes in long-term debt were as follows:
2009 2008
Balance, begmning of year $ 256,255,000 $ 268,890,000 Payments (37300,000) (12,635,000) Proceeds 23375.000 ^
Balance, end of year $ 242330,000 $ 256,255,000
The annual requhements to amortize all bonds payable as of December 31,2009, are as follows:
Year Principal Interest Total
2010 2011 2012 2013 2014 2015-2019 2020-2024 2025-2029
Total
$ 14,605,000 $ 15335,000 16,085,000 16,880.000 17,730,000 95,950,000 57,120.000 8,625,000
$ 242330,000 $
11,777,975 $ 11,110,839 10385,994 9,609,297 8,755348
29,164,816 8,104,288 1,414,844
90,323,600 $
26,382,975 26,445,839 26,470,994 26,489,297 26,485,548
125,114,816 65,224,288 10,039,844
332,653,600
The amount of revenue bonds and tax bonds payable as of December 31,2009, are as follows:
Year
2010 2011 2012 2013 2014 2015-2019 2020-2024 2025-2029
Total
Revenue Bonds
$ 13370,000 $ 14,035,000 14,725,000 15,455,000 16,240,000 87,405,000 50,950,000 8,625,000
$ 220,805,000 $
Tai Bonds
1,235,000 $ 1,300,000 1360,000 1.425,000 1,490,000 8,545,000 6,170,000
-
21325,000 $
Total
14,605,000 15,335,000 16,085,000 16.880.000 17,730,000-95,950,000 57,120,000
8,625,000
242330,000
n-40

SEWERAGE AND WATER BOARD OF NEW ORLEANS
NOTES TO FINANCIAL STATEMENTS (Continued)
(7) Changes in Long-term Obligatioi^ (continued)
a. Bonds Payable (continued)
In 2009, the Board refunded tiie $24,030,000 Sewerage Service Reiundmg Bond Anticipation Notes, Series 2006, using the proceeds of the $23,375,000 Sewerage Service Revenue Bonds Series 2009 and $2,161,565 of excess debt service reserve funds. The Series 2009 bonds are payable m instalhnents beginning in 2010 through 2029. As part ofthe refimding. the Board paid $1,172,452 of bond costs, which are amortizable through the date of maturity ofthe bonds. The bonds are secured by a pledge of revenues ofthe Sewerage Fund.
The indentures under which these bonds were issued provide for the establishment of restricted funds for debt service as follows:
1. Debt service fimds are required for Ihe payment of mterest and principal on the revenue and tax bonds. Monthly deposits on revenue bonds, excluding bond anticipation notes, are required to be made into tiiis fund from operations in an amount equal to 1/6 of the interest falling due on the next interest payment date, and an amount equal to 1/12 of the principal falling due on the next pruicipal payment date. All debt service fimds are administered by the Board of Liquidation. The requhed amount to be accumulated in this fiind was $7,659,179 and $6,926,669 at December 31, 2009 and 2008, respectively; the accumulated balance at December 31, 2009 an4 2008 was $9,948,166 and $9,821,453 respectively. Monthly deposits to the debt service funds were temporarily suspended due to debt service payments being paid directly by the State of Louisiana through a Cooperative Endeavor Agreement and resumed as of June 2008. See note (7) c. for additional information.
2. A debt service reserve is required for an amount equal to but not less than fifiy percent of the amount required to be credited m said month to the debt service fund until there shall be accumulated in the debt service reserve account the largest amoxmt required in any future calendar year to pay the principal and int^est on outstanding bonds, except for the water and sewer bonds. The water bonds require an amount equal to the largest amount required m any future calendar year to pay the principal of and interest on outstanding bonds. There is no debt service reserve required for the 1998 and 2002 drainage 9 mill tax bonds. The sewer bonds require an amount equal to 125% of average aggregate debt service. The required amount to be accumulated in tiiis fimd was $19,771,985 and $22,289,918 at December 31, 2009 and 2008 respectively; the accumulated balance at December 31, 2009 and 2008 was $20,092,504 $22,254,068, respectively.
The Board is in compliance with the requirements of its long-term debt agreements for the Water Department for the year ended December 31, 2009. The net operating revenues of fhe Water Department for the year ended December 31, 2008 did not meet the bond indenture required debt service coverage of 130 percent.
The net operating revenues ofthe Sewerage Department for the year ended December 31, 2009 did not meet the bond indenture required debt service coverage of 130 percent The Board was in compliance ynth the requirements of its long-term debt agreements for the Sewerage Department for the year December 31, 2008.
n-41

SEWERAGE AND WATER BOARD OF NEW ORLEANS
NOTES TO FINANCIAL STATEMENTS (Continued)
(7) Changes in Long-term Obligations (continued)
b. Special Community Disaster Loan Payable
During January 2006, the Board entered into a long-term agreement witii the Federal Emergency Management Agency under the Community Disaster Loan Act of 2005 as a result of the major disaster deplaration of August 29, 2005 for Hurricane Katrina. The Board made draw downs totahng $61,956,747 as of December 31, 2009. The loan is for a term of five years, which may be extended, and shall bear interest at the latest five-year Treasury rate at the tune ofthe closing date of the loan, plus one percent. Simple interest accmes fix)m the date of each disbursement Payments of principal and mterest are deferred until the end of the five year period. As of December 31, 2009 and 2008, approximately $5.8 million and $4.1 million of mterest was accrued, respectively. Interest rates and maturity dates for the draw downs are as follows:
Maturity Date January 23.2011 June 21,2011 August 27,2011
Interest Rate 2.66% 3.12% 2.93%
Principal $ 22,298,689
6,013,905 33.644,153
$ 61.956,747
Operating revenues are pledged as security for the loan. Debt service requirements relating to the loan due m 2011 include $61,956,747 of principal and $8,475,957 of mterest
The Board has submitted an application for forgiveness ofthe loan, t,
c. Debt Service Assistance
In July 2006, the Board and the State of Louisiana (the State) entered mto a Cooperative Endeavor Agreement whereby the State agreed to lend up to $77,465,247 from State fimds on deposit in the Debt Service Assistance Fund, authorized by the Gulf Opportunity Zone Act of 2005 and Act 41 of the First Extraordinary Session ofthe Louisiana Legislature of 2006, to assist in payment of debt service requirements fit)m 2006 through 2008 due to disruption of tax bases and revenue streams caused by Hurricanes Katrina and Rita, Draw downs on the loan will be made as debt service payments become due. No prkicipal or interest shall be payable during the initial five year period ofthe loan. After the expiration ofthe initial five year period, the loan shall bear interest at a fixed rate of 4.64 percent Principal payments on the bonds begin in July 2012 and the loan will mature in July 2026. Interest is payable semi-annually on January 15 and July 15 beginning January 2012. The loan may be prepaid without penalty or premium. The Board has the right to request one extension of its obligation to begin payments under the loan not to exceed five years. As of December 31,2009 and 2008, tiie Board has drawn down $77,460,393 on tiiis agreement
Debt service requirements relating to the bond are as follows:
Years Ending June 30 Principal Interest Total 2012 2013 2014 2015-2019 2020-2024 2025-2026
n-42
$ 3,688.291 3.859,428 4,038,505
23,183384 29,084,760 13,606,025
$ 77,460393
$ 3394387 3,423,251 3.244,173
13,230,008 7,328,632
954,477 $ 31,774,928
$ 7.282,678 7,282.679 7,282,678
36.413,392 36,413,392 14360,502
$ 109,235321

SEWERAGE AND WATER BOARD OF NEW ORLEANS
NOTES TO FINANCIAL STATEMENTS (Continned)
(8) Due to Citv of New Orleans
' ^ e Board bills and collects sanitation charges on behalf of the City of New Orleans (the City). The Board is not liable for any uncollected sanitation charges.
Additionally, amounts mcluded in accounts payable due to the City were $5,130,226 and $2,763,866 at December 31, 2009 and December 31, 2008, respectively.
(9) Property Taxes
Property taxes are levied by the City of New Orleans. Taxes on real and personal property attach as an enforceable lien on the property as of January 1. Taxes are levied on January 1, are payable on January 1, and are delinquent on February 1,
The assessed value ofthe property Is determined by an elected Board of Assessors. The assessed value for 2009 and 2008 was $2,916,739,334 and $2,836,995,254, respectively. The oombmed tax rate dedicated for the Board for the years ended December 31, 2009 and 2008 was $16.03 and $16.43, respectively, per $1,000 of assessed valuation. These dedicated fimds are available for operations, maintenance, construction and extension ofthe dramage system (except for subsurface systems).
(10) Commitments
a. Coital Improvements
At December 31, 2009, the Board's budget for its five year capital improvements program totaled $2,924,297,000 includmg $238,696,000 for water, $426,504,000 for sewerage and $2,259,097,000 for drainage.
Due to certain regulatory and legislative changes, additional coital improvwnents will probably be required. Future capital improvement program expenditures may require the issuance of additional debt depending on the amount and timing of expenditures. As of December 31, 2009, the Board has committed or appropriated $84,040,831 in investments for use in future capital projects and has $6,221,641 of bond proceeds remaining for construction. The capital project investments are included in restricted assets.
The capital unprovements budget for 20.10 is $646,435,000 includmg $304,957,000 for projects, which are expected to be funded by federal grants and programs. Significant projects included in property, plant and equipment in progress as of December 31,2009 include ihe following:
Hurricane Katrina related Repairs and Replacement Southeast Louisiana Flood Ck)iitrol Program
Sewer System Sanitation Evaluation and RehabiUtation Program Drainage Pumping Stations and Canals
Eastbank Sewer TreatmOTit Plant Westbank Sewer Treatment Plant
11-43

SEWERAGE AND WATER BOARD OF NEW ORLEANS
NOTES TO FINANCIAL STATEMENTS (Continued)
(10) Commitments (continued)
b. Self-insurance
The Board is self-msured for general liability, workers' compensation, and hospitalization benefits and claims, Settied claims have not exceeded excess coverage in any ofthe past three fiscal years. Hospitalization benefits are charged to payroll related expense.
General liability claims are segregated internally by "clahns" and "suits" depending on the scope and type of claim, and are handled by the Office of the Special Counsel and Administrative Services. Individual general liability losses have ranged from $100 to $7,500,000, illustrating the volatility of this exposure. The provision for claims expense for 2009 and 2008 amounted to $4,115,223 and $3,990,705, respectively.
Worker's compensation expense provision for 2009 and 2008 amounted to $309,679 and $1,530333, respectively.
The hospitalization self-msurance benefits are administered by Blue Cross of Louisiana, The Board's expense provision in excess of employee contributions for 2009 and 2008 was approximately $12,868,061 and $11,871,000, respectively, and is mcluded m payroll related expenses.
Changes in the claims payable amount are as follows (health payments are reflected net):
Current Year Clahns and
Beginning Estimate Claim Fiscal Year of Year Change Payments End of Year
2009 $ 23,126,865 $ 8336,589 $ (10,859,663) $ 20,603,791 2008 28,980,804 11361,649 (17,215388) 23,126,865
The composition of claims payable is as follows:
2009 2008
Short-term: Workers'Compensation $ 1,328,026 $ 1,170,516 Health hisurance. 2,046,601 2,144,600 General Liabihty 12,891,038 14,938,573
Total short-term 16,265,665 18,253,689
Long-term: Workers'Compensation 4,338,126 4,873,176 Total long-term 4,338,126 4,873,176
Total $ 20,603,791 $ 23^126,865
n-44

SEWERAGE AND WATER BOARD OF NEW ORLEANS
NOTES TO FINANCIAL STATEMENTS (Continuedl)
(10) Commitments (contmued)
c. Regulatory Matters p
The Board, as well as other utilities, is subject to environmental standards imposed by federal, state and local envirormiental laws and regulations. The Board has entered into a consent decree with the United States which allows the Board to go forward vwth its major program to repair and rehabilitate the sewerage system. The overall costs ofthe program are estimated at $408.2 million over a period ending in 2015. The Board is in compUance with the decree.
The Board is also participating m Federal fmancial award programs, which are subject to financial and compliance audits by various agencies. No disallowed costs have been identified. As part of Federal and. other govemmental agency funding, the Board is required to match a portion of funding received. The Board beheves it has sufficient funds to meet its matching requirements.
d. Postemployment Healthcare Benefits
Plan Description - The Board's postemployment benefit is a smgle-employer defined benefit plan. The Board's post-employment medical benefits for retirees are provided through a self-insured medical plan and are made available to employees upon actual retirement
The retirement eligibiHty (D.R.O.P. entry) provisions are as follows: 30 years of servi_ce at any age; age 62 and 10 years of service; age 65 and 5 years of service; age 70 regardless of service; or, if age plus service equals at least 80. Complete plan provisions are contained in the official plan documents. Currently, the Board provides post employment medical benefits to 584 retired employees.
Contribution Rates - Employees do not contribute to their post employment benefits costs until they become retirees and begin receiving those benefits. The plan provisions and contribution rates are contained in the official plan documents.
Fund Policy - Until 2007, tiie Board recognized the cost of providing post-employment medical benefits (the Board's portion of the retiree medical benefit premiums) as an expense vyhen the benefit premiums were due and thus fiuanced the cost of the post-employm^t benefits on a pay-as-you-go basis. In 2009 and 2008, the Board's portion of health care funding cost for retired employees totaled $5,487,971and $5,673,616, respectively.
Effective January 1, 2007, the Board implemented Government Acciounting Standards Board Statement Number 45, Accounting and Financial Reporting by Employers for Post employment Benefits Other than Pensions (GASB 45). This amount was applied toward the Net OPEB Benefit Obligation as shown m the following tables.
n-45

SEWERAGE AND WATER BOARD OF NEW ORLEANS
NOTES TO FINANCLU. STATEMENTS (Continued)
(10) Commitments (contmued)
d. Postemployment Healthcare Benefits (continued)
Armual Requhed Contribution - The Board's Annual Required Contribution (ARC) is an amount actuarially determined in accordance witii GASB 45. The ARC is the sum ofthe Normal Cost plus the contribution to amortize the Actuarial Accrued Liability (AAL). A level dollar, open amortization jjeriod of 30 years (the maximum amortization period allowed by GASB 43/45) has been used for the post-employment benefits. The actuarially computed ARC is as follows:
2009 2008 Normal cost 30-year UAL amortization amount Annual required contribution (ARC)
4395,288 10,650,824
4.013.401 10,291,219
$ 15,046,112 $ 14304,620
Net Post-employment Benefit Obligation - The table below shows the Board's Net Other Post-employment Benefit (OPEB) Obligation for fiscal years epding December 31:
Beginning Net OPEB Obligation
Annual required contribxition
Interest on Net OPEB Obligation ARC Adjustment OPEB Cost Contribution Current year retiree premium Change m Net OPEB Obligation Ending Net OPEB Obhgation
2009 2008 15,186,702 $ .
15,046,112
607,468 (878.250)
14,775,330
(5,487,971) 9,287,359
24,474.061 $
6,674,710
14,304,620
266,988 (386,000)
14,185,608
(5,673,616) 8311,992
15,186,702
The following table shows the Board's aimual post employment benefits (PEB) cost, percentage of the cost contributed, and the net unfunded post employment benefits (PEB) liability:
Fiscal Year Ended December 31,2009 December 31,2008
Annual OPEB Cost $ 14,775330
14,185,608
Percentage of Annual Cost Contributed
37,14% 40.00%
Net PEB LiabiUty (Asset)
$24,474,061 15,186,702
n-46

SEWERAGE AND WATER BOARD OF NEW ORLEANS
NOTES TO FINANCIAL STATEMENTS (Continned)
(10) Commitments Tcontinued)
d. Postemployment Healthcare Benefits (continued) -
Funded Status and Funding Progress - In 2009 and 2008, the Board made no contributions to its post employment benefits plan. The plan is not fimded, has no assets, and hence has a funded ratio of zero. As of January I, 2009, the most recent actuarial valuation, the Actuarial Accrued Liability (AAL) was $184,174,734 which is defined as that portion, as determined by a particular actuarial cost method (the Board uses the Unit Credit Cost Metiiod), of the actuarial present value of post employment plan benefits and expenses which is not provided by normal cost
2009 2008 Actuarial Accrued Liability (AAL) $ 184,174,734 $ 177,956339 Actuarial Value of Plan Assets (AVP) -_ i_ Unfimded Act Accrued Liabihty (UAAL) $ 184,174,734 $ 177.956339
Funded.Ratio (AVP/AAL) 0.00% 0.00%
Covered Payroll (active plan members) $ 33,883,192 $ 29,466,571 UAAL as a percentage of covered p^TX)ll 543.56% 604.93%
Actuarial Methods and Assumptions - Actuarial valuations involve estimates of the value of reported amounts and assumptions about the probability of events far into the future. The actuarial valuation for post employment benefits includes estimates and assumptions regarding (1) tumover rate; (2) retirement rate; (3) health care cost trend rate; (4) mortality rate; (5) discount rate (investment return assumption); and (6) the period to which the costs apply (past, current, or future years of service by employees). Actuarially determined amounts are subject to continual revision as actual results are compared to past e3q>ectatioiis and new estimates are made about the fiiture.
The actuarial calculations are based on the types of benefits provided under the terms of the substantive plan (the plan as understood by the Board and its employee plan members) at the time of the valuation and on the pattern of sharing costs between the Board and its plan members to that pomt. The projection of benefits for financial reporting purposes does not explicitly incorporate the potential effects of legal or contractual funding limitations on the pattern of cost sharing between fhe Board and plan members in the fiiture. Consistent witii the long-term perspective of actuarial calculations, the actuarial methods and assumptions used include techniques that are designed to reduce short-term volatility in actuarial liabilities and the actuarial value of assets.
Actuarial Cost Method - Ihe ARC is determined using the Unit Credit Cost Method. The employer portion of the cost for retiree medical care in each future year is determined by projecting the current cost levels using the healthcare cost trend rate and discounting this projected amount to the valuation date using the oth^ described pertinent actuarial assumptions, including the investment return assumption (discount rate), mortality and tumover.
Actuarial Value of Plan Assets - There are not any plan assets. It is anticipated that in fiiture valuations a smoothed market value consistent with Actuarial Standards Board ASOP 6, as provided in paragraph number 125 of GASB Statement 45.
11-47

SEWERAGE AND WATER BOARD OF NEW ORLEANS
NOTES TO FEVANCML STATEMENTS (Continned)
18-26-41-
-25 -40 -54
55+
(10) Commitments (continued)
d. PostemployrSent Healthcare Benefits (continued) ''•'
Tumover Rate - An age-related turnover scale based on actual experience has been used. The rates, when ^plied to the active employee census, produce a composite average annual tumover of approximately 7%. In addition to age related tumover, it has additionally been assumed that 10% of future eligible retirees will decline coverage upon retirement. The rates for each age are below:
Age Percent Tumover 10.0% 8.0% 5.0% 4.0%
Post employment Benefit Plan Eligibility Requirements - It is assumed that entitiement to benefits will commence five years after earliest ehgibility for retirement (D.R,O.P. entry). The five years is to accommodate the anticipated period ofthe D.R,O.P. Also, if the initial eligibiUty for D.RO.P. entry is prior to age 55, an additional one year delay has been assumed, and it has been assumed that members eligible for tiie "Rule of 80" retirement formula delay three years beyond that earliest retirement date. Medical benefits are provided to employees upon actual retirement The retu-ement eligibihty (D.R.O.P. entry) provisions are as follows: 30 years of service at any age; age 62 and 10 years of service; age 65 and 5 years of service; £^e 70 regardless of service; or, if age plus service equals at least 80. Entitlement to benefits continues through Medicare to death.
Investment Return Assumption (Discount Rate) -. GASB Statement 45 states that the investment return assumption should be the estimated long-term investment yield on the investments that are expected to be used to finance the payment of benefits (that is, for a plan which is fimded). Based on the assumption that the ARC will not be firaded, a 4% annual investment return has been used m this valuation. This is a conservative estimate of tiic expected long term return of a bedanced and conservative investment portfolio under professional management
Health Care Cost Trend Rate - The expected rate of increase in medical cost is based on projections performed by the Office of the Actuary at the Centers for Medicare & Medicaid Services as published in National Health Care Expenditures Projections: 2003 to 2013, Table 3: National Health Expenditures, Aggregate and per Capita Amounts, Percent Distribution and Average Annual Percent Change by Source of Funds: Selected Calendar Years 1990-2013, released m January, 2004 by the Health Care Fuiancing Administration (www.cms.hhs.goy). "State and Local" rates for 2008 through 2013 from tiiis report were used, with rates beyond 2013 graduated down to an ultimate aimual rate of 5.0% for 2016 and later.
Mortahty Rate - The 1994 Group Annuity Reserving (94GAR) table, projected to 2002, based, on a fixed blend of 50% ofthe unloaded male mortality rate and 50% of the unloaded female mortality rates, was used. This is the mortality table which the Intemal Revenue Service requires to be used m determining the value of accrued benefits in defined benefit pension plans. Since GASB 45 requh^s the use of "unblended" rates, the 94GAR mortality table described above was used to "imblend" the rates so as to reproduce the composite blended rate overall as the rate structure to calculate the actuarial valuation results for life insurance.
n-48

SEWERAGE AND WATER BOARD OF NEW ORLEANS
NOTES TO FINANCLU. STATEMENTS (Continned)
(10) Commitments (continued)
d. Postemployment Healthcare Benefits ^continued)
Method of Determinmg the Value of Benefits - The "value of benefits" has been assumed to be the portion ofthe premium after retirement date expected to be paid by the employer for each retuee and has been used as the basis for calculating the actuarial present value of OPEB benefits to be paid. The current premium schedules for active and retired are "unblended" rates, as required by GASB 45.
e. Southeast Louisiana Project
In 2009, the Coastal Protection and Restoration Authority of Louisiana entered into agreements (SELA PPA and SELA DPA) witii the Department of the Army for the Soutiieast Louisiana, Louisiana Project in Jefferson and Orleans Parishes (the Project). The purpose ofthe Project is to provide flood damage reduction and interior drainage for Orleans and Jefferson Parishes in southeast Louisiana, The agreements set forth the obUgations ofthe federal government and nonfederal sponsors, including the Board, regarding the construction and the operation, maintenance, repair, rehabilitation, and replacement ofthe Project For the projects, the federal government is liable for 65% ofthe project costs and the non-federal sponsors are liable for the remaining 35%. Under the agreement, the Department ofthe Army, subject to the availabihty of funds appropriated by the Congress ofthe Unhed States, shall design and constmet specified work at 100% federal e^qiense. The Board will be allowed to defer payment of its required non-federal contribution of fimds of 35% and to pay said contribution of funds with interest over a period of not more than 30 years fi'om the date of completion ofthe projector separable element of the project. The interest rate to be used in computing the interest shall be determined by the Secretary of the Treasury, taking into consideration average market yields on outstanding marketable obligations of the United States with remaining periods of maturity comparable to the payment period during the month preceding the Government fiscal year in which the fust federal constmction contract for such separable element is awarded to the SELA PPA, plus a premium of one-eighth of one percentage point for transaction costs. As of December 31, 2009, the Board has not incurred a liability under the agreement
(11) Deferred Compensation Plan
The Board offers its employees a deferred compensatioii plan created m accordance with Intemal Revenue Code Section 457. This plan, available to all employees, permits them to defer a portion of their salary until future years. The deferred compensation is not available to employees until termination, retirement, death, or unforeseeable emergency. All amounts of compensation deferred under the plan, all property, and rights purchased with those amounts, and all income attributable to those amounts, property or rights are held in trust for the employees, therefore the assets ofthe plan are not mcluded in these financial statements.
H-49

SEWERAGE AND WATER BOARD OF NEW ORLEANS
NOTES TO FINANCIAL STATEMENTS (Continued)
(12) Budgets
Ojierating and capitai expenditure budgets are adopted by the Board on a basis consistent with accounting principles generally accepted in the United States. While not legally required, this budgetary information is employed as a management control device during the year. Comparison between actual and budgeted expenses is not a required presentation for an Enterprise Fund,
(13) Segment Information
The Board issued revenue bonds to finance its water and sewerage departments which operate the Board's water and sewerage treatment plants and distribution and collection systems. These bonds are accounted for in a single fund; however, investors in the revenue bonds rely solely on the revenue generated by the individual activities for repayment.
Summary financial information for these departments as of and for the years ended December 31 is as follows:
Condensed Statements of Net Assets Water
Assets: Property, plant and equ^anent Current xmrestricted assets Restricted assets Otiier assets Total assets
Net assets: Invested in capital assets,
net of related debt RcstTKted Total net assets
LiaWSties: Current Current Babilities payable from restricted assets Noncurrent Babilities Total Eabifities Total liabilities and net assets
Sewer 2009
1 299330 $ 5,084
20,867 181
2008 (amounts
289,624 980
23384 470
inthoi
$
2009 jsands)
667,273 $ 57,426 49,649
1,915
2008
618.416 53,642 72,237
1,021 $ 325,462 $ 314,458 $ 776,263 $ 745316
$ 262375 $ 251.873 $ 487342 $ 463395 (103.967) (113,993) (11323) (15393) 158,608 137,880 475.819 448,002
41,615
8,973 116,266 166,854 325.462 $
56,732
7,834 112,012
37,957
12,774 249,713 300.444
28,252
36,294 232,768
176378 300.444 297314 314,458 $ 776,263 $ 745316
n-50

SEWERAGE AND WATER BOARD OF NEW ORLEANS
NOTES TO FINANCIAL STATEMENTS (Continued)
(13) Segment Information fcontinued)
Condensed Statements of
Service cbarges, pledged against bonds
DepreciatiDn expense Other operating expenses
Operatiig income Nonoperating revenues (eiq^enses):
Investment eamings Otiier Capital contributions
Change in not assets B eginning net assets Ending net assets
Revenues. Exoenses and Cbanges :
$
$ _
Water 2009
52,641 $ (13,878) (50,857) (12,094)
117 14.999 17,706 20,728
137.880 158,608 $
2008
in Net Assets Sewer
2009 (amounts in tiwusands)
45366 $ (13321) (67.867) (36.122)
410 (1.464)
(11.956) (49.132) 187.012 137.880 $
66.734 $ (9357)
(47.442) 9,735
293 2,980
14,809 27,817
448,002 475.819 $
2008
62,461 (8,078)
(42,649) 11,734
987 255
(15,053) (2,077)
450,079 448,002
Condensed Statements of Cash Ftows Water
Net cash provided by (used in): Operating activities Ncaicapted financing activities C E ^ ^ I and related financing
activities Investing activities Net increase (decrease) Cash and cash equivatents:
Beginning of year End of year
Sewer
$
—
$ ~
2009
20,070 $ (1332)
(14,115) 6,633
U;256
5,434
2008 (anv>unls i
(321) 21,434
(8331) 4,461
I73't3
(11,909) 5,434
nthc
$
-
$"
2009 )usaDds)
(342)$ 205
(45344) 40318 (4^3 )
22381 17.618 $
2008
?,?,781 405
(25.707) 4.930 2.409
20,172 22381
n-51

SEWERAGE AND WATER BOARD OF NEW ORLEANS
NOTES TO FINANCIAL STATEMENTS (Continued)
(14) Natural Disaster
As of December 31, 2009 and 2008, tiie Board has cumulatively received $169,320,233 and $140,969,811, respectively, of cash reunbursements fi-om tiie Federal Emergency Management Agency (FEMA). Included in accounts receivable as of December 31, 2009 and 2008 are $34,670,897 and $13,046,853, respectively, of reunbursements due fi'om FEMA. In 2008, approximately $48 million of receivables were written ofT as a result of expenses previously submitted to FEMA for reimbursement that are currently in dispute and subject to appeal or due to e)q>enses that have been disallowed by FEMA. Eligible FEMA grants totaling in excess of $297 million are in various stages of the approval process and include amounts for system repairs, building repairs, vehicle and equipment repairs and replacements, temporary power, supphes and other costs.
On June 29, 2007, the Board entered into a (Imperative Endeavor Agreement with the State of Louisiana, City of New Orleans, Louisiana, and the Louisiana PubUc Facilities Authority (LFPA). The LFPA agreed to issue its bonds to provide the cash capital investment to pay for capital improvements of the City of New Orleans and the Board. The establishment of the constmction fund permits the Board and City of New Orleans to publicly bid contracts that are subject to a Project Worksheet that has been obligated by FEMA or for which an award letter has been received and encumber such amounts. The State of Louisiana, City of New Orleans, and Sewerage and Water Board agree that as FEMA pays any reimbursement amounts related to projects for which disbursements have been made, or the City or the Sewerage and Water Board recei iss monies related to the hazard mitigation grant program for which disbursements have been made from the constmction fimd, the full amount of such projects shall be deposited in the constmction fund and used to fund additional projects until all City of New Orleans and Sewerage and Water Board improvements are completed. The total.amount made available to the Board under the agreement was $100,000,000. At December 31, 2009 and 2008, the Board had an outstandmg obligation under the agreement of $25,990,028 and $7,831,591 included as a liability in due to other governments on the statements of net assets, which represent amounts not yet reimbursed by FEMA and deposhed back into the constmction fimd.
In 2008, the Board received an excess payment of FEMA funds m the amount of $21,097,027. This balance is included as a liability in due to other governments on the statements of net assets as of December 31, 2008. The Board paid $18,098,192 to FEMA m 2009. As of December 31, 2009, the outstanding balance was $2,998,835.
n-52

(This is page Lntentionally left blank)

REQUIRED SUPLEMENTARY INFORMATION (GASB STATEMENTS N0.25 AND N0.45)

(This is page inteutionally left blank)

SEWERAGE AND WATER BOARD OF NEW ORLEANS Required Supplementary Information Under GASB Statement No. 25
SCHEDULE OF FUNDING PROGRESS For the years ended December 31,2009 and 2O08
Actuarial Valuation
Date December 31
2009
2008
2007
2006.
2005
20O4
2003
2002
Actuarial Value of Assets
$ 228,999,660
222,598,640
223,583,589
217,274,416
209,829,340
204,706,452
196,697,432
187,892,716
Actuarial Accrued Liability (AAL)
$ 269,506,028
260,616,822
245,202,189
235,664,407
225,544,886
218.155,395
205.362,089
197.323.094
(Overflinded) Unfuttded
AAL
$ 40,506,368
38,018.182
21.618,600
18,389.991
15,715,546
13,448,943
8,664,657
8,664.657
Funded Ratio
84.97%
85.41%
91.18%
92.20%
93.03%
93.84%
95.78%
95.22%
Covered Payroll
(millions)
30
29
27
26
30
30
28
29
Unfunded AALasa
Percentage of payroll
135.26%
129.02%
81.44%
70.92%
52.30%
44^8%
30.46%
30.00%
SCHEDULE OF EMPLOYER CONTRIBUTIONS
Year Ended
2009
2008
2007
2006
2005
2004
2003
2002
Annual Required
Contribution
$ 7,591,507
7.146,647
4,598,587
4,073,502
4,702354
4.271.797
3.193,339
3.190,707
Actual Contribution
$ 5,247,031
4.915,512
3,885,124
3,343,713
3,716,381
3,721,034
3,391,537
2,931,065
Percentage Contribution
69.12%
68.78%
84.49%
82.08%
79.03%
87.11%
106.21%
91.86%
See accompanying notes to financial statements.
11-53

SEWERAGE AMD WATER BOARD OF NEW ORLEANS Required Sopplementary Information Under GASB Statement No. 45
SCHEDULE OF FUM)ING PROGRESS For the years ended December 31,2009 and 2008
Actuarial Valuation
bate December 31
2009
2008
2007
Actuarial Value of Assets
$
Actuarial Accrued Liability (AAL)
$ 184,174,734
177.956,339
147.995,856
(Overfunded) Unfunded
- • AAL
$ 184,174.734
177.956.339
147.995,856
Funded Ratio
0.00%
0.00%
0.00%
Covered Payroll
(millions)
$ 34
29
27
Unfiinded AALasa
Percentage " of payroll
543.56%
603.93%
557.54%
SCHEDULE OF EMPLOYER CONTRIBUTIONS
Year Ended
2009
200S
2007
Annual Required
Contribution
$ 14,775,330
14,185,608
12.818.364
Actual Contribution
$ 5,487,971
5.673.616
6.143.654
Percentage Contribution
37.14%
40.00%
47,93%
Sec accompanying notes to financial statements.
11-54

SUPPLEMENTARY INFORMATION

(This is page intentionally left blank)

O L r -l A 1--
•*- °, t ^ oo' r - \ o V . r -r ^ K f N — — \ o ( N
M
BO 0 0
n t r , O DO
o. ' o •ri_
—
O <£, C \
• o
( CV
« • ^
• ^ i M
( A
<rs
5 f ^ • " j -w . m T • o
<~) -T -p " .
M O x n
3 •o .
—
V3 Wl -H ( N " Irt
r .
CT. • * ^ ^ . " „ .—• .— i r t 0> <A X I 0 _ i n
O oo
n C ) C)
*.-» * .
« t ~
«| — m ^.
J Tf
S w- i
^' O • o
t - oo CO f , oo
0 \ M m » 5
—'' m ' r f • « vo
•J- l o
^. 0 0 r-. I - -^i>
l O f -
^. • o o
( x f V I
_ rS
• <n r -o _ CN m
r~->£»
O Wv
•n U l
r s
» o 0 0 o_ wi"
_ t ^ CO
vo I f r -
3
• o • o r -n " M r 4 O *
M
M • *
C'V
r-^ oo C--
o
v o
3 • o «o r -
^ o
« < N
-»
1
Ov "T
a ,-, M
t n D>
5 3 o i n f - - o • * h
oo
>/> O
». —< t n
( S — O I A O O m - * t - » r - o r-_ v q M>_ w t > 5 • ^ — o c>' oo' r-i
C? vO O ^ ' .rt
oo
o eo IXI
oo' f-*
0 0 T CO
oo rn <o v l ' <N f S
X ^ O DO » f^.
M r-I-- o .-. -00 w
M
n ( N 'S-, <r\ vo t~ ;
i
f
O O i n
S ? 3 g 2 S
»o
£ r.|
r -
3 Pf 2 S
00 o
( N V O
< DO t -
V O OO
' . r -
^. c- ' m vo
vo r- "o
<n r4 S
r- o f ^ * o <n vrf (*f t o m T f C3_ r~ ^
f i vo
CT-' O M
OO V I • o w-i'
o^
s'
s
3. r-'
' vg m r - m v5 Ov r - ^ n » t ^ , <~1. vo m « o *
. £ " S £ .— "n •—
00 . -• 3 o a t - . - ^
Ov O m S ( % 0 m CT-Ov f l - O
—'
<N vD • «
a \ 0
O M
T T O
s
r -- o r - . t ^ .
5 s
r- o Jo § (N Ov m t^, r-_
o*
^ r i O
n oo «n
1 r f o n rv)
o\
O
^. o t~-
n o
I
• n i n
Si5 O - . j -r - m • • o vo oo 00 - o t - r=.
* 4
O
5. <o
'* oo*
S
1—. tr .
S ^ — oo" DO o -n^i. f-l ir» S •"-oO —
« r^ t -
tn t -vo O
S: S S O . CTi vo >i3 t - vO (T, ™ V£> oo —
s ( C i
§ r-' CO
-*. CTv
3
Ov "O n ^ 5
IN
g s
-- ^
pf
S CO 7 - 3 " 0< " vO
(N Wl 00 ^ -rf- IO
» . = o. 5 n o r r j op t S CO £>. ^
— r - rti - 1 - a . T f CTv
q . ' CTv t -
I CK i f t vo
it •* o tn o
s^-
r -
• o t - '
3 r^
i r .
CT-OO o S
I T ) I N
T l r -o vo
" 1 . • n
•*
f i r-- l o
t - V ^ ^
m r -r-;
vO
3 Ov V
^ 00 TJ-' t ~ -o t--' o
oo IT*
:3 * o
< v O r~-t -
w
o oo \ o
Ov
0 \
rs "O
*»
^ Ov
>o
•n 3 t N
vO DO V
a •o
s (N
> - • . - .
— o « CTl • n i X
^ s I N r*!
V.-1 (M
W
o
1*1
o f t
a ( N
h- o o •* "rt t -— o. ^ vi" rs (N f- <N t -V - , rt
t -VO
^ o r -•i*-
t n Ul f~-
o CT> (N
o
5 OO
o t -
2 •0 Ch
a
l l e |
EN vo r- i o ST o r -V I vo 00 vo o c~ — (-• • * ( ^ O. t-- Ov "O
3 as; ' ' ' '
11-55

• ^ V I
S r N
<N C N '
::i 3
<n e^ m (N • * o -
^ . <%n.
,644
,9
56
,460
o — t -CS vo t--< N
? f N
o ' 0 0 m
VO (N .— o r * f o (N i r *0 Ol •* ON "~. vo_ o v> r - iH^ oo' lo * " f " oo' vo' o (T, 00 r - r - l o O
' - ' M C T ' v o O ^ C T v Q ' O v r O " - t - O v a o o » " ^ t o -O -O f N vo .-•__ - t ^ SO —' t a r n O • " ' v i " t n O , — ov, c { t n -v* fv^ >0 eo ( N - - ' ON oo
CO oo (»i fO v ) >o
S « 00 (O w vo o 00 o i V) p-
(N - ^ Ov V) o
(O o<3 O , f ^
o r-00 vo
- ' g eo r^ — t ^
_ 0 0
r--'
•^ -1 • r t T l
o t o
•o T T
( N
5 V I
o* vo t S
v>
oo
1 -
ec r-;
vo
"*, o, «a <*=i t o V) vO O Ov O t o V I CTv i £ — V-,
• n m Ov l o «o
", ^
<o r -n «-i t o VI
vo'
•n vo DO CO* t^l
n a VI
s ^ Vl CTv c> fN t o OO
o \
CT-^, Ov V)
_ s o . to* VI v o
oC 3
00 o o o r i o .
c-
s vo*
o m vo
s a
3 t o * ( N V I
" r-00 t o
as; w
00 v> t o o —. vo vrf - , -00 —
^. *-*. — o
lO o t o
r-j. o o 3 Vl' .-.'
oo t s
CT. t o
S n
? ^ VO_.
n
t o O
o ' vo n <N v^
( N -O vO O
s. 5; s s vo CO -^r c • ^ 00 «/S o i •W lO (N IN vD O •»*•
vO_
00 V t
• »-4 V»
^ s
K CT.
Ss t o •*. ^ ?
CO o a I-- S 00 CT^ o * \ 00 v i •**"
w v^ V I
oo' m V t
( N M v o
m '
^ a
^ ( t -
o-* PJ 00 V I
s • ^
0 t -
n
s
vo CTv
— V I O V I
m 1 * ^ & vo
t o eo "O t-- V I
10 Ol 00 3" -^
V I • »
'n " • Ov f ^
VO 1 0
( N CO
eo. t o
f:. o i 3
0 0
r-o_ V 'n t~-
a
V ) t ~ 0 .
vo
R V I
ro S" S3S V I o^' 53 (N <^ V I
ss
vo Si r-
^. V l
-*
3 t»^
• ^ -C vo vo
fq Ov rN VO vo O VO V I V I r - r o (--
n OS u->
^.
t o t o VI
*.
-_ ^ -*, 00 t o 0 . 00 — <N 0 . <N
VI r ^
SSJ ^ ' -
«s r -t -
• *
p:. CN
0 r~ V l
- m 0 VI
IN t o vO
i • 0 Vl VI fN • 0
s o t -
1 ^
s *" oo t o to <o ffv t-r iN *N 0 0 u-1 oC
DO 0^ •^ 0 DO 00 t ^ tn
%l ^. "-i ^ °°.
T O r n O ( N ' O t o t - - O v t O v i v i ' * f - - > - > v c . o r i . < ^ r-^ <% . - , w oo_ r-_ ~ »~- ^ ' 3 " 00' vo ' Ov
" € 3 Ov r -r - 0 f N l o 0 , «=•. o- - , V 0 CT- 0 v> r s VO 0 . ^ 0 , ( N t ^
( N V I
r» 1 0
" m m 0 0
r-'
0 0 r -
S, O-
5 «
D O 0
^. r-tH vo t -
V O 0
•". t ^ V ( • I t , "4 ?0
r- o
g;" a s' £ v ^ CT- CTl -o - * • — vO' . - CO VD
\ '^
S I N — l a - g p o r v t o v o r O ' V i i ^ C T - i O O i V i v o
( ^ M W (N • * O^ vi_ icj^ v6 .— - o v o ' - V ^ 00' v T o c T o t-T v i O r - o O t N - T j - o o K f —
s g g C-- V I O i o
a .-. P »i . 0 0
s s •".
s
s V I
3 eo
s
oc
V
G • ^
S rn
a E : m < 3
g <
to (A < 13 2
•B s *S c c
1
g 1 e
! ^
ill :-M
s ;
I I
1-56

Sv n. ®. "1
— ( N 2 ! 3 - 5 0 M * f l y W O C T . O i O i t N r ^ ' O t ^ t N V l ' O ' - . ' O O
-.?v •1 n * i •^ 00 00 M to V)
oo O, w VI - . — vo vo O O 00 •"T
-.< - H »o
_ r-r-<
g ™
m
8
rv'
£
(N " (O "O f*] ^ O a vo Vl fO r> VO i n
f ^ o i •*-, Oj^ " ^ o 5-" If) - ^ i n p VI o ' Ov o o —• ' - ' T* M r^, ^ o "^ <?!. t -
f; s ^ t o
^ Ov tN w
0 ?
^. • ' — S' ^
r* oo
oT 3 S ^
o>
v> ro
^ VI
R M
2 | l f:'8S vq v- •<r
s« V i
3 n w, IO
rj
o. g; o (N
5 1 R . ^ . ^ . ^ Ov O^ ^ O ^_ v ^ O^ 00 ( f Ov* —" to* m *o "W V —• —• M —1 n (N
vo O^ *V oo r f O m 00
IN
X f-o • * ,
VI
5 w (N
-n J
Vl •^ o iS ^ (N ro 5 V) v ^ O O , r* o V I r-i t o VI vo o — » f^ r^ 00 v6 fo ^ •tj- CO (*^ 00 t^^ O o ' V l '
V\ to fo 00 N v^
Ov —
VI O
5 R f o OO P ?{ °* • s
V I
?
§. t ^
vo
Si V )
R s
_ g
* 9
$ S 2 ofl VI eo
CN lO —
3 2 ' C! S vO o
s t ^
CT\ s C>v"
en
R ^ s. P-*
c
e — fO
An •'T *0 —I pv O O 9 ^ ^
o, o^
o OB
m"
s. s Ov
^ OO
s
--vo
CO
s o ' 3
' o 3 5
S2 ' S g 2 Ov oo OO oe <N
v6 vo
R"
' s v o
n t n
5
V I O V
rn t ^
*. f O • V
c? >o c-. oo vo
^ 5
• ^ r i (O v , v ^ O CT O VI o —1 oo
O O Vl
I O
3 !-.__ CN
oa Ov MS
£5 • *
pf
S R l O
S
Ov
s ^
5 vo
•O C4 00 O i O O O O - d - g " * " ' ' ' ' *
*T. ^ . ' ^ ^ * . " 'T, ^
i £ o o a o v i i O M r - > V ) t ^ O i , V > f O ^ O C I ^ - ^ o^_ f n c ^ v o — i — ' V O v ' ^ -
Ov CN Ov M vo vo — VO <> n --. f^ t^ O. 3; — r~ CN 00 t o O —t fO (N 00* ^
.-s. § o V I
Ov 0 0
n g.
m t o lO M
(N Ov W 3 S
m
^ m u-i o v^'
G
»o h-o_ CN • > _ >
m
»' t ^ o . o V I
^
r .
Si - g 00 ' I -
6 *
:#S?5 ^ ^ 2 O • * DO -H (N m
s
» (W m t--
s"
vp 00 oo eo (N t:*
00 1* r- — 00 oo vo eo •<- >^ O r-> f^ CO •^ v> t-» O (N r f oo —T —." oe* —1
a s p s -- *i. n --r* K o JO Vl -M g-» r~. VI .-• Vl "^ Ov ^
eo VI 00 o o. o\ o i . . m vj^
IG tf ^ o S Ov CN k (N
^ l O
H 0 0
•
Ov ( N Ov__ V l
oo_ h- ' CH
^ " - I O o . oo
5
l O CN
CT. t ; - '
DO vT
^
3 s o! S VQ
Vl —1 vo fjv — r*. f VP 00 Vl vo o »£>_ r 5 r ^ c ^ - o i r •«»- ocf o — — ^ -
00 r s <^
55 CS
o
o oo' 00 fnj oo
s: ro • *
3 »o' C
g ^ § 5 v^ o , r^ - -Ov ^ O Ov
to
V I * t *
r-' f i O
s: vT v »
f i
•—• •
(
«*1
Ov* "V l i
en
1 o (--* eo —
00
1 «o DO
r-" CO
M
•— O C N t n - ^ M » 0 " f c o — « ( N O y ? O v ^ "'I 'T. ^ . ^ . ^ ^ ***. t-~ vo vp ^ 00* 00 r * CN " O C S M ^ O c o V i v d • ^ " ^ "*. "'V * \ •"". ''V ' " -^ t ^ < ? v * ' - ' i - ' — CNfO
s s | § gs'?s 2 6
:e ." fO
3
S • *
1
t*-t o
o t -. - 1
en V I
^ l O l O t - .
CN r~
n -vo .—1 . - 1
12
eo
P V I
r-^
oo
S
s R*
00
R t ^ CO
lO
r«-'
DO V I
n-s7

SEWERAGE AND WATER BOARD OF NEW ORLEANS SCHEDULE OF PROPERTY, PLANT, AND EQUIPMENT BY DEPARTMENT
For Year Ended December 31,2009
Schedule 3
Waler Scwcr Drainage Total Real estate rights, non depreciable $ power and pumping stations - buildings power and pumping stations - machinery Distribution systems Sewerage coDection Canals and subsurface drainage Treatment plants Connections and meters power transmission General plant Goieral buildings
Total piupcrty, plant and equipment in service
Confitruction in progress
Total propCTly, plant and equipment
Accumulated depreciation
Net property, plant and eqiupment $
Kcal estate rights, non depreciable S power and pumping stations - bmldings power and pumping stations - madiinery Dislributian systems Sewerage collection Canals and subsurface drainage Treatment plants Connections and meters power transmission General plant General buildings
Total property, plant and equipment in service
Construction in progress
Tcrtal proper^, plant and equipment
Accumulated dq)reciafion
Net property, plant and eqiupment $
2,898,138 $ 57,740.918
113,776.934 123,973,792
---
33,214,620 7.479,863
91.166,878 2,525,548
432.776,691
119,618.920
552.395.611
253.065,301
299,330,310 $
Watcr 2,898,138 $
56,724.971 111,389,487 121,666.788
---
. 32,006.706 7,479,863
88.536,884 2.525.548
423.7?^.385
106,701,295
529,929.680
240.306.194
289,623,486 $
963,472 $ 37,303,566 29.875.339
-305,592,751
-135.915,592
12,088,929 5.006,170
60.734,134 1,093.325
588,573,278
253.908,643
842.481,921
175,208,513
4,810.948 $ 229,709,211
98,761,538
--
310,073,401
--
11,121.635 49,531,490 3.967.674
707.975.897
145,382,331
853,358,228
215,569,604
667,273,408 $ 637,788.624 $
2008 Sewer
930,439 S 29,675,231 28,330.218
-253,843,280
-120.712,279
10,270,223 5.006.170
57,330,449 1,093.325
507.191,614
279,279,361 '
786.470,975
168,054,495-
618,416,480 $
Drainage 4,810,948 $
207,242,239 95,113.596
--
281,960,990
--
11.121,635 43,847,285 3.967,674
648,064,367
158.108.437
806,172,804
204,407,382
601,765,422 $ i i i M i w 'r 1 i i i l i n i i m i -
8.672.558 324,753,695 242.413,811 123.973.792 305.592,751 310,073.401 135,915,592
45,303,549 23,607.668
201,432,502 7,586,547
1.729.325,866
518,909,894
2,248,235.760
643,843,418
1.604.392.342
Total 8;639,525
293.642,441 234,833,301 121.666,788 253.843,280 281.960,990 120,712.279 42,276,929 23,607,668 .
189,714,618 7.586.547
1,578,484,366
544,089.093
2,122,573,459
612,768,071
1,509,805.388
See indqieadent auditors' report
. n-58

11 I-
„ g ^ Vl
w
e->
S 2
8 ffi I-H
s o
vo-
*»
s o V|'
• ^
o o '
s
g g
s
s s ^
1 "f-
o. 8 VI
s
VI
i
g o Vl
(-_ vO fO
o
o to
n M -* (N
«
g o 8. r - .
O
s »'
1 «r to
1 c \
*%
if " l is
:3 =5 § § § § § ! §
J" 4! ^ I S ^ 5 S 5 t S § i
II 2 S vB S
§ § § F-I . ^ ,1H
3* S S
S S B 3 5 5
111 ;S 3; ^ ;?
i S 5 ? ;S ^ ^ ;? g <0 '4- VO V l M
§, i
IIII
•a I I s
^ &
E-59

g
Tf CN
3 i ^
^
I 1 -* <N
3 • ~ t
^ V i
o oa
CO
1 .
o
Q < U S "
o w w 2 6k
^1
O
' VO
3 S
g oo' vo
1
§ oo « o VI
o\ oo •". VI o> .—< H-
Ov OO
n •n Ov
^
o. oo
n VI Ol
cS*
Ov oo '^ »o o\
7i
I
M
r-«. <s
=s. 5
VI
T>; CO 00
J?i
• 1
5;, 5
« s _ n 5
Ov
P t—I
1 *
**00
Vi
& n vo m Ov ro"
cN O •n. r-m o v"
VI
oo o' <n < m
VI 'O oo
o' CO
«» C<1
l^ CO • ^
s .— M
n-60

SEWERAGE AND WATER BOARD OF NEW ORLEANS CHANGES IN SELF-INSURANCE UABEUTIES BY DEPARTMENT
» FOR - n i E YEAR ENDED DECEMBER 31,2009
Schednk 6
WATER
Shoit-tcnn: Workers' compensation Health insurance General liability
Total short-term
Beginning
of Year
390,172 1,050,854 3.185.841 4.626.867
Cnrrent Year
Qaimi and
Estimate Change
; 281,576 J 4,726,452 (397 J4S)
4.610,683
Payments
229,073 5,101,927
150.000 5.481000
End of
Year
442,675
675379 2,638,496 3,756.550
Long-tcnn: Workere" compensation 1.624,392
General liability ; __ Total long-term 1.624392
Total
(178350)
(178.350)
1,446,042
t.446.042
$ 6,251.259 y 4.432^33 S 5.481.000 $ 5,202.592
Short-term; Workers' compensation Health insurance General Hability
Total short-tcnn
390.172 $ 621,934
2.603,111 3.615,217
281,577 $ 229,074 $ 3;224367 3,150,456
(38345) 3,467.599
ISOjOOO
3,529^30
442.675 695.845
2.414.766 3,553,286
Long-term: Workers' compensation General Uabiiity
Total long-term
Total
DRAINAGE
Shon-tcnn: Workers' compcnfiation Health insurance General liability
Total shOTt-term
1.624.392
1.624392
390.J72 471.812
9.149.621 10.011,605
(178350)
(178350)
281376 S 2,218325
(1.706.745)
793356 l.&49.n2
1,446,042
1,446,042
$ 5.239.609 S 3.289.249 S 3.529330 S 4,999328
229.072 J 442,676 2,014,960 675377 (394.900) 7.837.776
8.955.829
Long-term: Woriccra' compensation
Total long-tenn
Total
1.624392 1,624392
% 11.635.997 S
(178350) (178350)
615.006 $ 1.849^132 $
1.446.042 1.446,042
10,401,871
TOTAL
Short-term: Workers' compensation HeaHb insurance Generalliability
Total diort-tcnn
1,170316 $ 2,144,600
14.938373 18,253,689
687,219 10,267343
(94.900)
8,87i;638 10.859.662
844.729 $ 10.169.344 (2.142.435)
$ 1328,026 2.046,601
12,891.038 16,265,665
Long-temu Worker^ compensation
• Gwieral liability Total iong-tenn
4,873,176
4.873.176
(535,050)
(535.050)
4338.126
4338,126
Total
See independent auditors' report
20.603,791
11-61
(This is page intentionally left blank)

The Sewerage & Water Board has begun construction to install a 15-megawatt generator, which win give the Board's Division of Pumping and Power the capability to improve the operation of the pumping system in emergencies. The generator, the size of a locomotive, would be put into service if commerciai power would fail or become unavailable, or If the Board's own power generation system would go out of service. The $3.5 million project is funded 100% by the U. S. Army Corps of Engineers as part of a storm-proofing prpjed for Orleans Parish and will greatly enhance pumping and power operations. The generator, to be located on the grounds of the Carrollton Water Purification Plant, is scheduled for coniple-tlon in October of 2011.
BHOHB^^^^^^^^^^^^HM^^Bfl j^^^^^^^^^^^^^^^^^^^^^Hl^a^^^^-^
HH^^^^^^^^^^Hv^Hfl^^^^^^^^^^^^HHH^^^^'^ l
^ ^ ^ ^ ^ ^ ^ ^ ^ ^ ^ ^ ^ ^ ^ ^ ^ ^ ^ ^ ^ ^ ^ H I H ^ ^ ^ ^ B ^ B 9 P B D ^ ^ ^ ^ ^ ^ ^ ^ ^ ^ ^ ^ ^ ^ ^ ^ ^ ^ ^ ^ ^ ^ ^ ^ ^ ^ ^ ^ ^ ^ ^ ^ H
^^•Hl^^SHH^H ^^^^^^^^^^nBlBnl
^^^^^IH^^^H
f ^ ^ ^^ l ^ ^^^^^^p^ f ^g lH '^^^^^^^^^S^^^^'''-'^^^^^^ '^HH^M^^^^^^^^^^^S ^^^^HJ^H^^^^^^^Hl ^ ^^^H^^^H^^^^^^^ ^^^^^^^^^Hi^^^^^
Km^MHHfH^HS^HraB^^^Hi^^^HHHHsl^B KsSmtm \ii i--- ^^^uBriay^^^^^^^^^^^H^KB^StBBvBBBBt uBM * iL^M^:9^ lBHH^^^B9i^^^ f l ^^^^ri^B B*'!!'')"! JH^HBjBHlw^^KtHz^^^L^^^^^^|B||^^BS4^^^^^^K|MHiUiJ
l ^Kj ^HiHi ^^^H^^^^9m^^K KV^H '^^^^^^^^ I IHHSB98HI^9
[^Kt^B^^f f ia l^ l@ff i^^^^raj^Bi)M
i^S^^M^^S^n^^^m^^n^^&HHRlB^^B^^S^H^'^^^^^^^^^^^^^^^Kl^^^^^^^^^^^^^^^^^^lBB''^^'^i^^
^ ^ | ^ ^ ^ H M B ( B W ^ B B P | ^ \ ^ ^ ^^sis^^i^^BS''''^'''^ '~' 1' ' I ^ S ^ B ^mSB^L^n^^il iSI^^'.^^ M^W^^K^A'' \ \ • ^ ^ ^ B
^ ^ ^ m ^^•JggSmSf 1 > ^ | ^^J^;i'V' : J ^ ^ K B B ^ ^ ^ ^ M ^ ^ r . j . /^t^BK^r ••'"i ^^a^^ '' ^ ': '! M^^^BSKss^ ^m-
BBfil .^^^^Bev^~-3-$^^^^^^^II^^^^^^^Hi^^^^M
w^&"^-'^i':'''' ^ S H H l ^ n ^ ^ H H M --.k. K' ' ^ j « i ^ '- 'W' ' ^ ^^V^^^^K^^mE^S^H^H^^^^B
m m i ^^^^^ j jmmpjBmi •HBHHI. The Board's Machine and Welding Shop, a part of the Facilities Marrtenance Department can fabricate parts as small as a :rew or as targe as an impeller for the Board's drainage pumps to exacting specifications. With this capability, the o p can supply in-frause manufactured parts (no longer available commercially) to employees in the field, enabling them to restore service to customers in record time. The shop's team takes pride in its ability to manufacture parts no longer available "off the shelf for tfie many unique pumps, valves and equipment used throughout the water, sewerage and drainage systems.
s T A T I S T I C A L
S E C T I O N u N A U

^ >o
0 f-
f ^" f. -n - -v - <o
• *
a> n tn so. 1 — <
r-
-fl CTl
• ^ .
a V
o '
=
CS so
^ - . 5;
t * 1
t—
". o <n
•* oT O t
Oi l l <o{ n ^ i - «
Ci. t^ \a o^
"-v»
t -oo
'^ J? - ^0 O.
O 0> r-
S ' . r-* f^
»" M
^ ••_
s
s •—1
s
si
a]
^
* • * • * •
51 ^ Q ^ 9 •— * «. so tn CS
ti->
2 oo" .—1 TT
o f^
^ x^i
' -l
v.
g o f tn
8 r^ o
C-
i oC
^
CS (n •n
s *o
g
^ (S V3 " l , 3 " s -
<=> "*?.
441
n
ra-1

i n <n o\ -< -3 J5
-^ IO *s <o
S S 3 S ff> r»> <s O
3C3 ^
5 = 2 V r.f rn tn
« G S 8
h~ o-i - 4 -~<
t o w
^ 5 ° p- m ^ 0>
(S *0 » m
^
o. °i r '^ ( = ^ 3 3
• 5 ' o . r - '-f t ^ m m yf je V — r^
oC XI r- ( f f.f ^ ^ ' ' oC ' j " —f t~
s a 2 ? S 3 P s ? s * * m «^ f^" 3 —' m* r> o " -J" o r f •*' t ^ [ u \ r { t ^ S ^ o o i n — A th >o m « c^ r^ 2 2 S -
o
H t -f l
r-r m
-r-t
S i n
n 5 A rJ «f r* V--
m (^ oo -o Oi -f O CO o 1/^ p \ ^^ »r >rt W M m t - (^ "^ m o JT. >o 00 tn ». rw" C ( ^ p f p i
•n *S c- «
s s a a "SE;
«i n ^ rS in r* in Oi
tn t>i_ •-• t^ !-• tn a l i - ^
. ^ ? SP
g s o. 2
i C; V
a w
9 a s EG a ^ S H ^ - - s V .-7 ig" *ft" vC « V ^ O ti-T orf ID '
r f t-" cT c* r f * * oJ o" id" << r i M « cH -^ « « ^
5 P 3 5 3 2 ^ , ^ h ^ S ^
t? s s s* a 2f ^ ^ s ^
t Si S . B | M
13 S'
o P:
S
H ^g r r^ H
^
r i "A
1 g . W^ v ^
o R % S =r o- cJ e ' P » » o" Ff ^ :2" tf
m -J vo ^
3 EfS
p' s s 2 a R 5' -• (^ ffi r^ 'T. "^. "^ - • eo D<r r f m R
f f E 5 SS
^
rs a ^ R Fl 2 s S 3 ^ ^ : § 3 '5"S3 s 'sfs a'l
m m iTi . — fn M <n
t -
9 1* s
f j .
9 n. ? •---
o -o o *q. *0
*"* Sf G*« g «»l VI ffi f--c f c f u-i
c-' J o>' to o* BSPF: -J ' - J - «
1 iv f ' * •
«i"
S •o
r~' • *
rT "-1
3 1^"
S
1 d-
r*-Wl
^ c?r t n
s i —
r-o w%
S <r\ t n
S oo_
R :?
• 2 *
s ""
4 t n
2 H -s - J
1 g S"
S
^ K
S
R
R V
i n
S
* H - J
!l m J
S in S 3 N N '^ "i o. 1 n. ' "•.
5f S '^ s sf S . ^ r _ B *T. r«^ ^
•-" en n O f* N * a Oi Q cj w o ^ V
3 B B^ « o^ M (^ M, oT of (*> Vl 1-" r f
r4 (rt
l §
S n » o r i n » ip " '' S 8
_r — _ - _r _ - _f
' M "* <*> "^ P" ^ I O
S S H P S S 3 w* trf « in" m' >ri o A o Q »- •—' ^ r ) r ( * o «! " \ r-_> _r r-* . ^ K
n
5{S8 IS
iSS
h-
•9
r-
!a R a
m P 3 rT
t o
n ^ 3
—I
!fl 1 s
f~
• • » .
3
s
i rf 1 H-
•0 O
E^ P 1 5 S
3
E **
0 \
g •»r
f 1 o' i>r & G
1 2 ,
3.
^ 3
^ t o
5i 9
s >a !
»4
^ «='-i} l ! 1 .gs
III-2

^ ^ ? £
2 ^ ? S g .n to f i :$ £•
C/1
S 3
p\ o t^ O ^
i 5. S I 5 pi o -J -, ' r-f
3 §
§ s Vl" (W'
:= R *" S
"O
S P"
>o
"
ro
5 m 13
oo
*. V> ' O
:J
t^
p 3'
"
S R
1 oT
s 5-r~
P' 3 vC
2 ^ S ?;
« o —
"TT <O"
F2 p
P G
« (h
S 3 - «' o »n
V )
s s £ ?5 n. ° 5 S •"•
M
S i tn 0)
i"" v»
00 IO
o *n
S. o
I
r--o
« VO
-r
o
^ ^ t n
•o
oo o
• '
V
a r-'
s r f
1 n
f'T
otf' o "a r t
P t n
I - l
otT . « •
^ M
P I
I^
• 5 V )
5 f i (o o
z M
s s
--§ <s
2 "S
m •-• S fc of «
r-' o V •^
v>
g S. 5 s
M
"O >o •n p. O). vi_
5 ? M
fO V I w i (S 00 *P Ov - J r-l 5i o^ w t n 00 i f ^ m
5 5 S 5 : ti " ^
III
"^ oo
— oo
r- — '
3 SI
p p
ra-3

SEWERAGE AND WATER BOARD OF NEW ORLEAJSS ASSESSED AND ESTIMATED ACTUAL VALUE OF TAXABLE PROPERTY
Last Ten Fiscal Years (Unaudited - amounts in thousands)
Fiscal Year
2000 2001 2002 2003 2004 2005 2006 2007 2008 2009
Net Assessed Value Real Estate
1,159,821 1,214,098 1,231,764 1,248,743 1,423,261 1.492,750 1,103,604 1,362,097 2,004,624 2,042,426
Personal Property
628,860 651,744 619,368 650,595 679,826 620,797 565,287 483,200 539,492 557,039
Total Net Assessed Value
1,788,681 1,865,842 1,851,132 1,899,338 2,103,087 2,113,547 1,668,891 1,845,297 2,544,116 2,599.465
Total Estimated Actual Value(l)
14,133,694 14.751,485 14,687,067 15,040.781 16,731,518 16,774,183 13,245,167 14,645;214 20,698,664 21,974,841
Patio of Total Net Assessed
to Total Estimated
Actual Value
• 12.7% 12.6% 12.6% 12.6% 12.6% 12.6% 12.6% 12.6% 12.3% 11.8%
Source: City of New Orleans
(1) Amoimts are net ofthe homestead exemption.
in-4

SEWERAGE AND WATER BOARD OF NEW ORLEANS PROPERTY TAX RATES - DIRECT AND OVERLAPPING GOVERNMENTS
Last Ten Fiscal Years (Unaadited)
Fiscal -Year .
2000 2001
2002 2003 2004 2005 2006 2007
2008 2009
City of New Orleans
77.09 77.09
. 77.09
77.09 78.59 71.90
85.39
78.89 58.44 57.57
(Per
Orleans
Levee Board
12.76 12.76 12.01 12.01 12.76 12.76 12.76 12.76
9.65 10.95
Number of Mills
$1,000 of assessed value)
Sewerage &
Water Board
. of New Orleans
22.59** 22.59** 22.59**
22.59** • 22.59**
22.59** 22.59** 22.59** 16.43**
16.43**
Orleans
Parish
School Board
52.70
53.05* 52.98
52.83 52.80 52.80
58.55 52.90
38.47
38.47
Audubon
Paric& Zoo
4.55 4.55 4.55
" 4.55 4.55
4.55 4.55
4.55
3.31 331
Total
169.69 170.04 169.22 169.07 171.29
171^9 186.84
175.19
119.55 118.28
Source: City of New Orleans
*The Homestead Exemption is not allowed for Ihe new 9-Mill Police and Fire Tax.
=3 mills adopted in 1967 Expires in 2017
**6 mills adopted in 1978 Expires in 2027
**9 mills adopted io 1982 expires in 2032
in-5

SEWERAGE AND WATER BOARD OF NEW ORLEANS TEN LARGEST TAXPAYERS
December 31,2009 and Nine Years Ago (Unaudited)
Name of Taxpayer
Entergy Service BellSouth Telecommunications Harrah's Capital One/Hibemia Bank Whitney National Bank J P Morgan Chase Bank International River center Marriott Hotel Properties Poydras Properties Hertz Properties
' : •
Name of Taxpayer
Entergy Service BellSouth Telecommunications Banc One Hibemia National Bank Whitney National Bank International River Center Jazzland A T & T Communications Harrah's Tenet
Type of Business
Electric and gas utilities Telephone utilities Hospitality and gaming Financial institution Financial institution Financial institution Hospitality Real Estate Real Estate Real Estatft
Type of Business
Electric and gas utilities Telephone utilities Financial institution Banking Banking Real Estate Theme Park Telecommimications Hospitality and gaming Managed Care
2009 Assessed
Vahie
$ 70,461,810 58,463,976 42,809,120 39,140,930 36,091,150 19,728,650 17,466,490 16,096,314 12,827,310
1,884,180 $ 314,969,930
V
2000 Assessed
Vahie
$ 72,612,000 61,875,000 37.504,000 30,972,000 26,610,000 14,241,000 14,811,000 14,687,000 ??,688,000 13.328,000..
$ 309,328,000
Percentage of Total Assessed
Value
2.73% 2.27% 1.66% 1.52% 1.40% 0.76% 0.68% 0.62% 0.50% 0.46%
.12.60%
Percentage of Total Assessed
Value
4.15% 3.53% 2.14% 1,77% 1.52% 0.81%
. 0.85% 0.84% 1.03% 0.76% 15.62%
Source: City of New Orleans
in-6

SEWERAGE AND WATER BOARD OF NEW ORLEANS PROPERTY TAX
LEVIES AND COLLECTIONS BY THE CITY OF NEW ORLEANS Last Ten Fiscal Years
(Unaudited - Amounts in Thousands)
Fiscal Year
Real Estate Taxes:
2000 2001 2002 2003 2004 2005 2006 2007 2008 2009
Personal Property 2000 2001 2002 2003 2004 2005 2006 2007 2008 2009
fotal Levied
199,666 209,441
214,088 217,039 247.328 267,327 , 219.991 250.462 269,746 275,227
Taxes: 105,951 110,058 105,378 110,691 115,676 106.354 99,477 82.046 67,548 69,875
Collected Through December 31, 2009
Amount
197,442 207,052 211.242 214,320 243,594 262,376 213,778 238.101 259,343 257,219
•r
99,637 100,619 96,728
103.756 109,234 100,809 91,023 75,241
62,119 63,118
Percent
98.89 98.86 98.67 98.75 98.49 98.15 97.18 95.06 96.14 93.46
94.04 91.42 91,79 93.73 94.43
94.79 91.50 91.71 91.96 90.33
Balance Outstanding December 31
Amount
2,224 2,389 2,846 2.719 3.734 4,951 6,213
12,361 10,403 18,008
6.314 9,439 8.650 6.935 6,442 5.545 8.454 6,805 5.429 6.757
,2009 Percent
1.11 1.14 1.33 1.25 1.51 1.85 2.82 4.94 3.86 6.54
5.96 8.58 8.21 6.27 5.57 5.21 8.50 8.29 8.04 9.67
Collected during 2009
Amoimt
192
195 187 175 444 265
1.784 4,929
16,139 257.219
------
1.336 1,388 2,474
63,118
* 2005 and prior personal property receivables were considered prescribed and no longer legally enforcible during 2009.
Source: City of New Orleans
in-7

SEWERAGE AND WATER BOARD OF NEW ORLEANS WATER AND SEWER RATES
Last Four Fiscal Years (Unaudited)
Water Sewer
Year
2006 2007 2008 2009
Montiily Base Rate
$ 3,50 $ 3.50 $ 3.50 $ 3.70
First 3,000
Gallons
$ 2.31 . $ 1.94
$ 2.35 $ 2.47
Rate per 1,000 Gallons Next Next 17,000 980,000 Gallons Gallons
$ 2.31 $ 2.07 $ 3.31- $ 2.60 $ 4.01 $ 3.15 $ 4.21 $ 3.31
All Gallons Over
1,000,000
$ 1.59 $ 2.19 $ 2.65 $ 2.78
Monthly Base Rate
$ 11.60 $ 11.60 $ 11.60 $ 11.60
Rate per 1,000
Gallons
$ 4.04 $ 4.04 $ 4.04 $ 4.04
Note: Rates are based on 5/8" meter, which is the standard household meter size.
in-8

! / l
M
^
^
^ O Tj- Ov ^ OO r^ c^
t , n -^ o fcO t / i &q V i
SS i? S? ^ t » r^ t - <N rn oo oo o m m C*S TT
o^ (S t N —* r - 00 Tj- vo ^ - CN, o _ ' O o C oC •^' ' Q --- «ri - ^ S n ^. n <^ O) t - t - CN r - Ov o \ OO m o c* (^ &0 « ^ &q fr^
r4 ^n
\£) O
M V i « «
m (N m ro t - *N 0 \ CTv '='. ^. ^ n. Tf W-i O Q (J, Wl VO ^ Tf vo r r ^ Q " •^'' t-." t-T ^ v i t-- t -V ^ ( A «% V )
VD t-^ r^ r--VO ^ rf •V w r-- t~- t-* r J vo" VO VD ^ »ri «n >n l£> - J . - " - J ^ vo VO VD
4 4 b9 &0 6 4
o o o o S o Q O
^ O o , o _ wn" vn o " trf O r o ^ (S Oj, oo t ^ VI TT" rn r f •—" (N CN ' CM cs « *^ VI 44
OO OO (N —I vo \D C3 (N oo_ Ov o\ *n t -T C--" ^C oo
S o —« «n ^ 0 \ (N Ov
00 vp *o T-T • n •* <Ti CN (N CN CN CS
*4 VJ 64 *4
00 m m o vo •-< m »o t ^ . - ( 00 oo O 00 ^ " ->*" T-i o o —< «r> cN <N m ir>
JS
1 S- 1 ° e S
^ I 1 S so . «
o oo oo oo vo. vo vo ^O
m rn cj^ r r |
44 04 44 V3
VO 1 ^ 00 Ov O O O O o o o o (N fS <N (N
••3
ni-9

SEWERAGE AND WATER BOARD OF NEW ORLEANS COMPUTATION OF DIRECT AND OVERLAPPING DEBT
Pecember31,2009 (Unaudited)
Direct debt
Net Outstanding
Debt Percentage Overlapping
Overlapping Debt
Sev/erage and Water Board, net of debt service funds (tax bonds only)
$ 21,525,000 100% $ 21,525,000
Overlapping debt: City of New Orleans Audubon Park Commission Orieans Parish School Board (1) Orleans Levee Distnct (1)
672,663,000 31,813,572
131,560,000 4,330,000
100% 100% 100% 100%
672,663,000 31,813,572
131,560,000 4,330,000
Total overlapping debt 840,366,572 100% 840,366,572
Total direct and overlapping debt $ 861,891,572 100% $ 861,891,572
(1) The fiscal year ofthe Orleans Parish School Board and Orleans Levee District ends CHI June 30tii; overlapping debt is based on June 30,2009 fmancial infonnation.
in-10

r r4 ro* u-i <N
i n
^
cc en r^
oo 1—1
<s vd
o"
jri 0
s
'Il
O o5 m
s g e g
vo m
00
00 VD
o
m 00 (Tl ^
Ov o o
ci vo
oo vo o
o 00 00
00 vo CS vo" 00 00
en
+-1
03 i n
- a i ^
vo m '^. en <S o r .
'"'
00 t—( oo
^ s
oo s o O
»> <s 0 0 t—
OS V-) o cT c^ - ^ c-f
T t o\ o t ^ t ^ 1—1
„ t l CN
i n i n .—1
o" 1—4 t—I
« (S
-^ c^ »n
r> O j r o O
f
(N
00 vo o
r>
o oo Ov^ 1—1-
,—) fO 1—4
fL
c-OS
r. T—t
00 < i CN T-.^
I > I>-^ •—'
%
PL,
o S o o " ON t n CS
o o o
f t i n CTv CTv
o o o o " i n o
CJ o o
f\ o <M o
o o . o^ i n " t ^ i n
o o <=> i n -m vo >—<
o o o^ v ^ CO t ^
e'
o o o o " (N 00
o o o
»1 o CS Ov r—1
o o o^ i n " 1—< 1—(
CvT
d ,o
3 o
1
ill
00 m
Q a ^ O «
Os CO ro »s
r<) vo vo r i
Os
i n 0 0 T—1
Oi oo '^ vo"
o O N 1—t
»\ oo vo o (% o r—1
t^ o »—( s vo A
OS
Ov t--''t VO O CS
vo"
,-—, >n rv) o^ • ^
ro t--cs"
/— w% i n o sf i n i n - w '
,—N
oo - ok i o\ o vo CO CS
J — ^
ON
o t ^ r .
CO »n i n
oC
CS .. O N -oo t>r CS CS
oo 1—1
>> o ^ -2 • J
1 2 S
SH ST
00 oo CS"
c^ 00
s Os »n
o CO cs" vo Os
C^ in
'=^ o oo in
CS
C--00
r, vn m
vo 00 oo
00 o" >n in
»n
00 CO
vo in
Os i>r in
00 T—l
Os d-in • ^ ^
CO
m
CO
o\ 00 vo" C5
r^ oo ^ o oo" ON" O 00 t^ ON
0\ o 00
00 ON
oo m S
in vo CS 00* t^ CO •> vo ro
vo . in T—I
CS C-- vo ". <n. <>: 00 in ^H Ov CO . 1—1 S , " -x f „ in t^ o CO Tj- 1 -
I I
5 <s
I
^
o o o CS
r - t
o o CS
CS
o o CS
CO o o c^
• ^
o o CS
»n o o o(
-vo o o o»
r-- oo ON o o o o o o CS CS CS
m-ii

OS VO'
CO r - , CS
vo CO Os § 00
i n ON
t/3
VO oo vo c-CS
VO ^ CJN C---v o -:J-
n n ^ VO r- . o oo"
i n vo VO^
co"
o . CTs Os^ ocT
vo oo vo ci oo vo
vo Os VO
IS
c^
o o o
o o o o SI
vo
SD
i n vo vo oo" 0 0 CTv
o o
i n
oo
5 CO
n
o
o o o »n 1—1
vo"
OS m
o o o i n •o
oo
i n cs^
? CO Os"
i n
o
o o o o" CO 1—1
Os"
oo Ov
1—( CO v o - H CO CO
oo"
oo CO i n vo" c^
n. CO
o o
i n " CO
o c-»
oo
oo m o crC
o
g r.
m i n CS
iM
m I-l <^
1^2 .8
ill
vo vn ON
oo" CS
s CS vo" CO
vo" CS CS
CO
00 i n ol cS CS
0 0 CS VO^
i n C^ 0 \ cs" CO
o Cv)
' ^
o " CO
oo Os o m oo s
oo
CO vo m
*i
CS
vo
OQ
00
i n o oT
i n m CO
m o oo
CO
Os"
i n c
oo CO
o r—(
Os i n
ON CO
f O CO
oo so o i n
CO
S §; oo CO
oo m m CO
CS
00 n
O s c -oo
ft* fli
Ope
ratin
R
even
u)
1—1
C--ON
ST r-vo o" • ^
Os c--Tt cs" o Os "1—1
m
i>-1~X
•r-in Os I—(
^ in
o r oo t^ CO oo •\ o vo
CO CO t ^" CO • ^
cs" .t>
CO . vo ON ^" Os • ^
»v
OD in
oo oo CO c-r o Ov
r . . CO
vo
o ^-1
o o «n t • ^ •
so
oo 00 Os vo CO 00
. o" t--
00 CO -"d-
f t
o in K
Os VO
u P H
o o o cs
,—, . o o cs
cs . o . o CS
CO o o cs
• ^
o o cs
in o • o
cs
VD
" o . o r
O o o , cs
• 0 0
o o cS
Os o o cs
in-12

SEWERAGE AND WATER BOARD OF NEW ORLEANS DEMOGRAPfflC STATISTICS
Last Four Fiscal Years (Unaudited)
Fiscal Year
2006 2007 2008 2009
Population(l)
210,768 288,113 311,853 354,850
$ $ $ $
Personal Income(2)
(in thousands)
12,563,610 15,394,618 15,394,618 15,394.618
(4) (4)
Per Capita Personal Income
$ $ $ $
59,609 53,433 49,365 35,507
Unen^)loyment Rate (3)
4.30% 3.50% 4.40% 6.80%
(1) www.census.gov/popest/counties/tables/CO-EST2007-01-22.xls (2) Estimates- Bureau of Economic Analysis (3) U.S. Bureau of Labor Statistics (4) Most recent available is 2007
ni-13

-^ t*\
f f
S s
f a
I
Ov m 8 0 oi >«• g vo v>
o f cj" o) 01
Ov"
• "
0
V
•*' • *
( N
go
of
- r-
g • 0
*-, ( N
g ;} —. 0 0
g
•~-. [ *V
g • —
vo
0 1-H
•~ VO
2,15
0
2.0
00
2,0
00
•- •o
0
•~ 0 ^
•- - t ^ 00
M"
^ 2
1 —. 0 .
— o 00 v^ s§?
C D t J v l f J Q O ^ t ^ O j
r*v VO r - DC <o
g g l S g i n c n S a * - - . - . - . S; S >f •».
^ 00 ov
o Ov o z ;
in .*! ^^ cs
-^ «n VD i i
•fl-" vo" ^" irt' rN" iri" c i oT r^
f n " - ^ t s v o r - o v o o 2
m-14

SEWERAGE AND WATER BOARD OF NEW ORLEANS CAPITAL EXPENDITURES BY DEPARTMENT
ENTERPRISE FUND Last Ten Fiscal Years
(Unaudited)
Year Waler Sewer Drainage Total
2000
2001
2002
2003
2004
2005
2006
2007
2008
2009
13,001,122
12,586,744
11,540,814
14,531,801
15,772,218
10380,889
36,481,683
19,053,142
19,938,659
22,465,931
21,609,266
51,226,639
43,269,622
49,419,442
67,424,755
46,550,580
49,891,752
56,093,058
25,608,236
56,010,946
12,976,071
52,859,310
57,048,889
64,155,080
38,407,889
23,709,553
19,515,232
16,250,996
28,592,805
47,185,424
47,586,459
' 116,672,693
111,859,325
128,106,323
121,604,862 *
80,641,022
105,888,667
91,397,196
74,139,700
125,662,301
Includes contributed assets
ni-15

SEWERAGE AND WATER BOAlUO OF NEW ORLEANS SCHEDULE OF FUTURE DEBT PAYMENTS
December 31,2009 (Unaudited)
Water Revenue Bonds
2010
2011
2012
2013
2014
2015
2016
2017
2018
2019
2020
2021
2022
Total Pri Total Int( Total Fut
Principal Interest
Principal
Interest
Principal
Interest
Principal Interest
Principal Interest
Principal Interest
Principal Interest
Principal Interest
Principal Interest
Principal Interest
Principal Interest
Principal Interest
Principal Interest
ncipal a^st ure Debt Payments
Series 1998
845,000 436,493
885.000
398,468
925.000
358,643
. 965.000 315.630
1.015,000 269.793
1.060,000 221,580
l.UO.CKK) 170,700
1,165.000 116.865
l;220.000 59.780
9,190,000 2.347352
$ • 11,537.952 $
Series 2002
1,270.000 1,334,775
1,335,000
1,287.150
1,400,000
1,233.750
1,470.000 1,177,750
1,530.000 1,104,250
1,595,000 1.027.750
1,665,000 948.000
1,740.000 864,750
1,820,000 777,750
3,195.000 686,750
3,345,000 527.000
3,510,000 359,750
3.685,000 184.250
27,560,000 11,513.675 39,073.675
All Bond Issues
2,115,000 1.771.268
2,220,000
1,685,618
2,325,000
1.592,393
2,435,000 1,493,380
2,545.000 U74.043
2,655,000 1,249,330
2.775,000 1,118,700
2.905.OOO 981,615
3.040,000 837.530
3,195,000 686.750
3.345.000 527,000
3,510.000 359,750
3,685,000 184,250
36,750,000 13.861.627
$ 50,611,627
ni-16

f l
£i
M §« §§ I I i t 1^ H i9 I I H U a^ 15 ?^ 3.3 ^s s | | 5 g | rjf» 3*^ 3"* '»'> •nwi 2""" •••'« 2 " 3 "
gK ss sn f 153 s ;
2 8 8
n-* *.• U RS ass
Ik I I 13. IS. I i s I?. I£ IS In 19 ^S i | 13. 1^ 1^ I I 1^ 1= -..-. -... .-. -.-- .^ ^ g | g§ S | S^ s | S § - | | £ | | s p p p p §= |5 |S p |S 1^
1^ | s 11 i | 1^ 15 §R i s in 15 i s | | I I IR I §1 E !-5 1^ P I- 3^ ¥ P •!« I ' E" P I- I
i ^ |g. 15 i ^ §5 §S i s §S IS ,IR gR §8 1^ 1^ SS SS S= fS gs ^^ g^ S^ Ss S® g'' ' ^ ' ^^ ft"
l| |§ II I?. |§ II i^ II i§ si 11 15 II
I ! l i i§ gi I? l i 5 a P p 1 §i 1
II IS ig II i* II li 1^ §1 1^ II H si si p h - nt |l II d §t p ss |s
|g. i | 1^ IS IS §3 lis p i^ 15 §s gp iS i s ?? S^ ^f ^^ i s Is g5" |«
I I §1 p . la IS gg ig i l i l §g iq |5 | S p P p p ?. |S 1= s5 I*
li R | l | 5 gS §S i s i s i U u i^ ^i P R
gi §g
11 | 3 | 3 SS %l i | | g • " - " T>«f p r f «»rr = « f > r i o r < | S s3 •^ g s
R'-^
j ! i liliiriiiiii lililMMiiJ !i !i ir il II a 2 « c
a a s
m-17

SEWERAGE AND WATER BOARD OF NEW ORLEANS SCHEDULE OF FUTURE DEBT PAYMENTS
December 31,2009 (Unaudited)
Drainage Special Tax Bonds
2010
2011
2012
2013
2014
2015
2016
2017
2018
2019
2020
2021
2022
Total Pri: Totallnti Total Fut
Principal • Interest
Principal
Interest
• Principal
Interest
Principal Interest
Principal Interest
Principal Interest
Principal Interest
Principal Interest
Principal Interest
Principal Interest
Principal latcrest
Principal Interest
Principal Interest
adpal srcst me Debt Payments
Series 1998
520,000 272,722
545,000
249,582
570,000-
224.786
595.000 198,280
625,000 170,018
655.000 140,018
685,000 108,250
720,000 74,000
760,000 38.000
5,675,000 1,475,656
$ 7.150.656 $
Series 2002
715.000 675.016
755.000
647.310
790,000
621,263
, 830,000 593,218
865.000 560.018
900,000 525,418
940,000 4S9,418
985.000 450.878
1,030,000 38,000
1,870.000 365,21 g
1,960,000 282,938
2,035.000 194,738
2.155,000 100,208
15.850,000 5,543,636
21,393.636
All Bond Issues
1,235,000 947.738
1.300,000
896,892
1,360,000
846.049
1,425,000 791.498
1.490,000 730,036
1.555.000 665.436
• 1,625,000 ^ 597,668
1,705,000 524,878
1,790,000 76.000
1,870.000 365,218
1.960,000 282,938
2,055,000 194,738
2,155,000 100,208
21,525.000 7,019,292
$ 28,544,292
in-18

SEWERAGE AND WATER BOARD OF NEW ORLEANS
SCHEDULE OF FUTURE DEBT PAYMENTS
December 31,2009 (UtuudUcd)
2010
2011
2012 •
2013
2014
2013
2016
2017
2018
2019
2020
2021
2022
2023
2024
2025
202fi
2027
202S
2029
Prindpil lotBTOat
Prindpa]
Interest
Pitnripiil
Intaefl
Prino^al
Intdcet
PriDopal IntBuat
l-rincipol Imcteei
Principal Interest
Prinripfll Tmerost
Prmcipa latorett
liuereri
Prmctpal Interest
Interest
Prioolpal
Inlerort
Princjptl
Intorwt
PiindpM
Intereot
Prmcipfll
Interest
Prindpal Intcrat
Pmcipfll Intataf
Priooipal
tntenst
iHfCRSt
Total Priooipal
TotHlInterert Total Future Debt Paymaitf f
W i t t r
2,115.000 1,771,268
2.220,000
1.683.618
2,325,000
1,592,393
2.433,000 1,493.380
2,545,000 1,374,043
2,655,000 U49,330
2,775,000 1,118,700
2,903,000
981,615
3,040,000 837,530
3.195,000 686,750
3>13,000"
527,000
3,510,000
359,750
3.683,000
184,250
36,750.000 13.861,627 50,611627
AH l>epartineati
SCTTW
11,255,000
9.058,968
11,815,000
8.328,329
12,400,000
7.947,553
13,020,000 7.324,420
13.695.000 5,651.469
14.405,000
5,937,938
15,165,000 5,188,754
15,975,000
4,393,251
14.265,000
3.620,723
13.025.000
2,921,028
13,725.000
2,228.091
10,390.000
1,611,499
8,375,000
1,143,888
4.060,000 833,328
3,860.000
636,600
1,515,000
491,719
i,615,000 393,906
1,720.000 '
289.688
1.830,000 178,750
" 1,945,000
60,781
184,055,000
69.442.680
J 253.497,680 J
Drabuce
1,235,000 947,738
1,300.000
896.892
1.360,000
846,<M9
1.425.OO0 791,498
1,490,000 730,036
1,555,000 665,436
1,625,000 397,668
1,705,000 524,878
1,790.000
76.000
1.870,000
365,218
1,960,000 282,938
2,033,000 194,738
2,155.000
100,208
21,525,000 ' 7,019,292
28.544.292 J
Tott l
14,605.000 ] 1,777,975
15,335,000
11.110,839
16.085.000
10,385.994
16.880,000 9.609,297
17.730.000 8,753.548
18,615,000 7,852,703
19,563,000 6,905.121
20.585.000 5,899,743
19,095.000 4,334,253
18.090.000 3,972,996
19,030,000 3.038,028
15,955,000 2,165,986
14,215,000
1.428,345
4,060.000
835;528
3,860.000 636,600
1,515,000
491,719
1,615.000 393,906.
1.720,000 289,688
1.830,000 178,750
1,945,000 60.781
242,330,000
9O323.600 t 332.653,600
TII-19

en I-H t ^
r - i 00
•+ • <n »n \o
3 c ^ 1 I I
t--. . , Os 5^ )S ' O 00 ^
S w rn 'O o& m in 'O Tf 0\ vo rj- in >n
rf lo' oo" 'O lO I-H" tS cf n'i' o" i / i m ^ i u - i i n ^ i o o o 00^ r>^ •* 0 \ (S o <n ^ ^
S" oo" r--" oo oT oo ^ o o" cT
> 5
ys ^ o Cs n 00 o IT) " * »n "o 00^ c ^ \o^ m "O '-T rn" rn* r^" r^ T-( f r i wn >0
a O ^ (N 'O r- (-«• o r-
< „ n = 'n, (N H OJ cS c s
u-j fl-) r^ OO 'sO vo O »n IT) r-< vc - j ^ o Tt t--
" w \ o ^ •^'" tn f - vo m
»n
»n m in ^ t -d r ' l o o o \ n f*i r«i r n en
12 ^
o »-• cs o o o o o o CM M (S
m " * .00
<s
<n v£> t ; e- O O O S> r s d CS CS c^
g
in-20

SEWERAGE AJSD WATER BOARD OF NEW ORLEANS CAPITAL ASSET STATISTICS BY FUNCTION
Last Four Fiscal Years (Unaudited)
Year
Water.
Sewer:
Water mains (miles) Waler lines in system (miles) Water valves Fire hydrants Water manholes
Sewer pipe (miles) Sewers (miles) Sew«" manholes
2006
1.723 1,807
29^19 22,771 29,576
2,259 1,486
22,829
2007
1.789 . 1,784
29.420 22,780 29,632
2,575 1,460
22,922
2008
1,791 1,579
29,480 22.785 29.673
2,568 1.460
22,902
2009
1,794 1,560
29,449 24,894 29,741
1,573 1,453
22,787
ni-21

(This is page inteationally left blank)

The new Lamb Road Sewer Pump Station will replace one tjuift in 1962 to serve the areas of Pines Village, Kenilworth and other nearby subdivisbns. Hurricane Katrina caused catastrophic damage to mechanical equipment, electrical switches, motors, controls and other operational parts to the old station. All of the equipment in the station vault was submerged for several weeks and the above-ground electrical enclosure was partially submerged for several days. The new Lamb Road Station is largely located underground with only the electrical power disconnect, metering cabinet and SCADA (supervisory control and data acquisition) panel above ground at grade level. Constnjclion began in October of 2009 and the station will be completed in at a cost of $1.4 million. This important project will result in increased sewer pumping capacity for the area and improved data collectbn.
s u p p L E M E N T A L
S E C T I O N

SEWERAGE AND WATER BOARD OF. NEW ORLEANS
2009 ACTUAL CAPITAL EXPENiDITURES
WATER DEPARTMENT
110 112 135 160 175
WATERWORKS
NonnaJ Extension & Replacement Modernization to Oak Street Row Water Intake Station Improvement of Chemical System Hurricane Katrina Expense for WatCT Water Hurricane Recovery Bonds
TOTAL WATERWORKS
209,807.60 60,510.00
520,077.70 (78.724.78)
11,398.501.20
12,110,171.72
214 215 216 239
600 800
WATER DISTRIBUTION
Nonnai Extension & Replacement Reiiabilitation - Mains, Hydrants & Services Water Systems Replacement Program Mains DPW Contracts
TOTAL WATER DISTRIBUTION
POWER PROJECTS EMERGENCY AKD GENERAL BUDGET
Water Share of 'Power Projects Water Share of General Budget Items
TOTAL POWER PROJECTS. EMERGENCY AND GENERAL BUDGET
TOTAL WATER DEPARTMENT
1,480^07.68 71,468.00 18,000.00
2,830.563.88
4,400,239.56
$
$
$
109,305.45 5,763,439.72
5,872,745.17
22,383^^56.45
NOTE: These figures do not include proration of interest expense.
IV-1

SEWERAGE AND WATER BOARD OF NEW ORLEANS
2009 ACTUAL CAPITAL EXPENDTTURES
SEWERAGE DEPARTMENT
C P J SEWERAGE SYSTEM
313 Extensions & Replacements-Sewer Force Mains EPA Consent Decree 317 Normal Extensions & Replacement of Gravity Mains 318 Rehabilitation Gravity Sewer System 326 Extensions & Replacement to SBWOT Pumping Stations 339 Main in Streets Dept Contracts 348 Normal Extensions & Replacements 367 Collection System Eval/Survey Uptown 368 Wetlands assimilation Project 369 Hurricane Katrina Expenses for Sewer System 375 Sewerage Hurricane Recovery Bonds 381 Modification & Extension of WBSTP to 20/50 MGD
3,390,996.48 15,167,637.20 2,748,534.45
176,191.76 2,429,133.89 1,654.636.73
3.439.08 119,436.79 27,914.00
19,088.354.27 73,872,74
TOTAL SEWERAGE SYSTEM
SEWAGE TREATMENT
44,880,147.39
600 800
POWER PROJECTS AND GENERAL BUDGET
Sewerage Share of Power Projects Sewerage Share of General Budget Items
TOTAL POWER PROJECTS AND GENERAL BUDGET
TOTAL SEWERAGE DEPARTMENT
NOTE: These figures do not include proration of interest expense.
27,326.36 4,437,71939
4,465.045.75
49,345,193.14
IV-2

SEWERAGE AND WATER BOARD OF NEW ORLEANS
2009 ACTUAL CAPITAL EXPENDITURES
DRAINAGE DEPARTMENT
C.P.# CANALS
418' Normal Extension & Replacements $ 30,026.95
439 Mjyor Dramage Participation in DPW Projects 2,930,584.69 471 SELA Program Management 1,154,943.14 476 Hollygrove Canals (SELA-A) 86,255.93 486 Napoleon Avenue Canal Improvements (SELA-B) 106,835.80 496 . General DeGaulle Canal (SELA-C) 6;272,037.94 497 Florida Ave. Canal - DPS#19 to Peoples Ave. (SELA-B) 159,892.39 498 Dwyer Intake Canal (St Charles to Dwyer (DPSXSELA-A) 1.048,1-47.13
NOTE". These figures do not include proration of interest expense.
. TOTAL DRAINAGE CANALS $ 11,788,723.97
PUMPING STATIONS
511 Nonnal Extension & RepVStations $ 2,111;290.83 554 Expansion of Dwyer DPS (SELA-A) 16,219.85 575 Drainage Hurricane Recovery Bonds 1,819,924.84
TOTAL DRAINAGE PUMPING STATIONS $ 3.947,435.52
POV^ER PROJECTS AND GENERAL BUDGET
600 Drainage Share of Power Projects $ 3;244.671.35 800 Drainage Share of General Budget Items 3,662,346.17
TOTAL POWER PROJECTS AND GENERAL BUDGET $ 6,907,017.52
TOTAL DRAINAGE DEPARTMENT $ 22,643,177.01
IV-3

3 o H
o o \o O Os (N S r> *r, o en 'O
. lo .-^ en (N -« K oo Ch o oo o "
o o o o
cs 00 oo
o ,
3 M
vo *o o_
>o 0\
?! ^ o tn
o so w Ci 00 oo yry \C> (> rn \D O
r
yD
n vo CS en r-" (N
O ^. CS m 00
f
tr~-cs
*n o en r-TJ- f ^
00
»n • ^
lO o m oC o
0
w CQ
O O
II O S ^
tn Tf \ o "O
lV-4

•3 O
H
1—(
O) t^ CN
•*" eo
O O o o o cs"
Q
o 00
-( m
o Oi o t-en r-^ tn
oo vq CT\
•* >n lO vo ( c
o q o vn •<t
o\ >o ON
cs q • ^
r-<^ oo CS T—l
o o o o q tn" VD
o q r-i i cs" vn •^^ — <
t- ,
TT I—(
t--; vn
o O OS t^ OS
o" oo O i •—1
00
<>1 <n o vn en vo oo en
DO
1—<
O N
t--
rs ».
s 6^
'
1
O q o G) c* ».
O vq tn vo
o ( t--cs
vo I—<
c> vn Tl-
o" I—1
0 \ t—c
d vn • ^
o"
00 •<a-
a\ 00 •^ • ' T ' ON 00
cs"
o\ vo 0 \ r-
en O
1
o q .vn cs .r ^ oC r;
1—<
in
d WT^
^ r-
VO c 00
m o K r--*
00
s o\ t—r
^ tn OS
»n
vn 00
s ON r—1
o I>
• 0\
<^ Tt o\ vn
te
o vn q o •n 00
o ^ o o oo vo (N ^ --: cs O 0\ t~-- Os m vn ON en C-
I
I
u
1 I O •d
<u
en t-~ o o oo 00
o (S o ^ ^ cs DO OO OO S S
CS m vn »n vo vo. vo t-00 OO 00 oo
rv-5

rv-6

POWER PURCHASED AND PRODUCED NATURAL GAS AND FUEL OIL CONSUMED - 2009
ELECTRIC POWER PURCHASED ELECTRIC AND STEAM POWER GENERAiHD BY THE S.& W.B,*
TOTAL
KW-HOURS 80,935,638
37,716,720
118,652^58
COST H $11386^09.43|
$11,681,938,761
$23,068,148.19
NOTE: *NATURAL GAS CONSUMED IN OPERATION WAS 1,448.540 MCF AT A COST OF $10,651,094. FU^L OIL CONSUMED WAS 0 GALLONS AT A COST OF $0.
IV-7

SEWERAGE AND WATER BOARD OF NEW ORLEANS
WATER PUMPED AND CONSUMED - 2009
Number of Meters
9 36 16 12
103 244 76
161
Free metered process water to various City departments and charitable institutions;
Display Fountains Fire Department Swimming Pools Libraries Municipal Parks and Playgrounds Police Department Schools
657
216 Free metered process water by Sewerage and Water Board
Gallons
3,838,700 9,435,600 9,876,000 6,410,000
28,452,600 295,093,200
54,689,100 1S3>352,100 561,147,300
410,735,500
Percent
1.03%
0.75%
Allowance for leaks on private property
Free unmetered process water:
Unmetered use, such as: extinguishment of fires, cleaning streets, flushing sewers, drains, and gutters, cleaning markets and
other public buildings
321,461,800 0.59%
38,577,718,300 70.85%
Leaks in distribution system as measured by
Water Conservation Service Company (WCSC)
1,201,521,600 2.21%
Water sold to customers 13,378,635,500 24.57%
Total Water Pumped 54,451,220,000 100.00%
IV-8

SEWERAGE AND WATER BOARD OF NEW ORLEANS
Gallons Metered - Pay Water Consumption - 2009
Month Monthly
Coasumption
January
February
March
April
May
June
July
August
September
October
November
December
1,114^54,600
1,036,613,600
1,060^35,200
935,161,600
1^18,714,000
1,122^84,400
1,152,646,400
1,207,280^00
1,028,407,900
1,281,340,900
1,060,830,200
1,159,367,600
Gross Total 13,378,635,500
IV-9

SEWERAGE AND WAT3ER BOARD OF NEW ORLEANS MONTHLY WATER CHARGES COLLECTED - 2009
Mon&B
January February March April. May June July August September October November Decfmbcr
Water Service -OiarKes & Fees
$ 4,097;247.08 3,806,017^7 • 5,067.546.52 4,251,911.23 4,250,276.35 4,580,048.14 4,722,024.49 4,114.043.37 4.649.419.20 4,674.813.83 3,959,365.72 4,821,459.81
$ 52^994,173.01
Delinquent Fees
$ 85,384.64 86.144.71
114,820.90 92,098.45 74,925.05 82.144.51
145,580.32 79.738.77 92,872.85 91,456.44 82,042.53 84.784.73
$ 1,111.993.90
Total
$ 4,182.631.72 3,892,161.98 5,182,367.42 4,344,009.68 4.325.201,40 4,662,192.65 4,867.604.81 4.193.782.14 4,742,292.05 4,766.270.27 4,041.408.25 4,906.244.54
$ 54.106,166.91
SEWERAGE AND WATI^l BOARD OF NEW ORLEANS MONTHLY SEWERAGE CHARGES COLLECTED - 2009
Months
January February March April May June July August S^rtember October November Decetnber
Sewerage Service CharKes
$ 5,841.975.19 5,043.104.94 6,324.479.66 5.517,156.42 5,061,688.07 5,874,629.78 5,974,673.91 5,396,988.56 5,676,477.94 5,815.062^27 4,966.506.13 5,975,73421
$ 67,468,477,08
Delinquent Fees
• $ 57.025 J1
$
57.530.06 76.661.80 61,50304 50,054.22 54,873.16 97.167^5 53,261.60 62,023.45 61,085.04 54,799.40 56,636.66
742,621.29
Total
$ 5,899,000.50 5,100,635.00 6,401,141.46 5,578,659.66 5,111,742.29 5,929.502.94 6.071,841:26 5,450.250.16 5.738.501.39 5,876,147.31 5,021.305.53 6,032.370.87
$ 68^211,09837
rv-10

SEWIKRAGE AND WATER BOARD OF NEW ORLl^ANS
TABLE I CARROLLTON TURBlDfTIES
Maximum
l^%ilmum ftveiBBe
River
(NTU) 2D05
142 2
38
2006
187 2
40
2007 248
3 66
2008 165
7 67
2009
320 5
71
Effluent Settling Resecvoirs
(NTTJ) 2005
17 0.9 ^ 8 j
2008
24 0.8 3 . l |
2O07 13 1.0 4.1
2008
15 1.0 4.9
2009 19 1.1 3.1
Filters (^4TU)
2006 O.SO 0.07 0.15
2006
0.66 0.08 0.12
2007
0.39 0.09
2008 0.00
0.09
0.14 0.13
20091
0.78^ O.OQ!
0.14|
TABLE I! CARROLLTON ALKAUNITIES
PARTS PER MILLION
^todmum wanlmum Average
River 2005
154 84
120
2006
177 83
J^^
2007
173 86
124
2008
183 78
U 1 7
2009 186 83
1 121
Effluent Settling Reservotrs 2005
163 80
121
2006 146 66
1 loel
2007
167 66
114
Filters i 2008 2009)2005
171 63
107
175 72
114
157 81
1 12Q|
' A m 158 76
114
2007 182 78
131
2008 202
71 124
2008[ 200|
80 134
TABLE 1! A CARROLLTON HARDNESS
PARTS PER MILLION
liMaxtmum fVHnlmiim
b«2fl^
NON-CARBOhlAtE HARDNESS | RIVER
TOOfi
77 11 40
2006
70 11 38
2007 88 10 47
2008 70 4
38
2009 91
0 33
FILTERS 1 2005
84 20 52
7008
79 14 48
2007 90 12 54
21X18
78 15 50
200E
92
TOTAL HARDNESS i RIVER
2005 207
0 91 40 159
?nnR 200 108 164
2007 230 113 171
2008 250 114 155
2009 211 110 153
FILTERS II 2005
210 132 172
2006
198 120 161
2007
240 120 186
2008
250 114
1 1751
20oa 2 ^ 13G 173
TABLE III CARROLLTON BACTERIAL CHARACTERISTICS
Totaf Conform Analysis
2009
Maximum (Colonies / 1(K) ml)
Minimum (Colordes / 1 0 0 ml) Average (colonlea / 1 0 0 ml)
Number of Samples Number of Samples Negative Number of Samples Positive
River
5.400 86
880 334j • 0
334
Plant Tap
0 0 0
361 351
0
DliBEi-m 1 System |
4 0 0
2.392^ 2 ^
^
None Of these seven total colifomn poativa samples were focal coilfonn positive, and none resulted In a violation of ttie Total Coltfomi Rule.
iv-n

i
«!
•? , l
1'
i ill ^ o i l ^ *-
§ 1
Pi
11
II
1*1
II
8 ^ o o
to <=» o
Ml
S 8 ^ 8. 8, S ^ ^ g. O O O O O O O O "'
li
n
s.s
n
o o o
mm
%%
O CI o
II
3
8 8
?e
sss o o o
Hi
1
8.S.
o o
o o o c ; <:? C5 o o o
^ ^
sss O O O
IMI iii
o o o o o
ss
w< iAA
IV-12

n
RS
n^
s: ws
^
SS
8 55 5^^ SS
l^s
l £
35 M to r i V r» rt 8S^
m f-i (*, « m m s ^ s ^ 33 r J tn
i IP K1
I p o o q o o
1 1 ^
S 8 S S 8 o o o'
3 8 G» a* C3
o o o 8 g o o o o o o
o » o o o o o d o cC O C> O C> o d o o
o o o
1 1
Hill ^ 3 ^ S SS fSS Rf2 ?
111! ^ i 5 n a I 1^ <\1
iii ill ill Ml ill ill it mi iU mm II
I
IV-13

fe. -§
•a ^
n
O *0 M H H
TO 5p 51
a -r r i rn ifi ci
r \ ' € i a> <T t n <n c>
^^i:^;^ " * •-' M
in k
l a i tip-' P' S &*
s s g o o o o o o 3 8 S Cr C> O
S S S o o o
s g g O cf o
s g s o o C> o | o o o o o o
c f o o ' l c a o o o c f o g
cf d
S £ « 1 1
3 5 ESQ
^ i I ill
I
IV-14

i
i 3
• o * ta a '-I
is ^ ^
Hi I
s
SI
§ 1 ^
•SB
t l
ni
U
-flea
0 . B, (S;
I 1
^ iS p
1^1
I -SI • a g O Of
i?&
a
g g
o o d cJ
§ 1 8 c i o o
s c i t d
O f l
g g g
II
g g g g g g g g g g g g g g g C> o o o o o o
d o
S-^P
o •=.
g d • o
g c> d
o o o o o d
IV-15

8g
o 3 a 3 O J-@ P f
il
II
l i
i l Mill
Hi M
Hi
M I
B
w Itlii
illil
ml
a s a
s s s
i s «
I I
as
a
E: 8
I
^sil
115
5 iS
y
IFIFI
I
IS
3§S
SS IBS
53
• |
iSS
P
2s§
5S
f § l 5
1
ssg
RiR
I I
s ^ 0
^^1
gag
22 gfi
B. ?
' sS
s^^
1
iii
jljljiMjailjafljailjiilijI^jijIj
2 i 3 g35 SS3
3g 5?
sua
3S
2S3
I
ff
3 IB
I Hi &; a V n
5 1 1
a§
I
d 3 3 d d 3
^
MiM^WW
§!
iii
rv-16

t •
I g
?|l|
111 il
roS
II^SI
niin
m U m
If
ssg
Rg
1 I 1
g & I t)g Si SjS 3; B| | * i R 8 S'
3 3 _; o* di J c' cS
saet
s«g^sfe^?pg
liis;^^^.
Il II
•II
II iiiiii li
^ilfii iiiii
53i
13^
8 ? Sgs
?«
If
fslfflsfl
Uli
23
siaig
ssa
51=. gsi§t
iilli
^S3 mn
siaiaiis
51
3:5:
351
3 3 ^
sssi
pj^spfflfeaa
a s fas;
§5^
o n
immm
Baa 31
sissiassa
SsS sigs^g
§333
SSaS53!
S 8 t j ci
as
!«&.
13
^ 1 1 ^
iSI
IM
^n
ssa
i d
m
5
psp
53^35
g l 3 I-
R*a
33:
3 a
551
P.
aK«
331
isaiiaisi
93
1^1^
539 as fS :
SIS
llle^i^Eisi^ ae
Si i
ss
533
asi
3§3I
aa
Ml
i§a
m. S3
§ i 3 p g
li
|Sg
Hiiii
Ssl
0< W)
m
mm
gs^
P;
mm
R
? I a
l i i i i
.IS
s s a
^
l i
IV-.17

T
i
^& ^ 5 5
* s s H J ^
ff s e wi l< l i
% I S
3 aa
3 3B
§1
FTI
9 4 «
? ^
? 3
"I r l ^
3 5
3 2S
^ ^
^ a
t?. e
|i
8 i 2 e
sn
UAIJI
1
ill & s a
s a 9
3 1 ^ *. 3 a; * « "
§ ?S'5 B5
S ^ n
2 ~ ^ (4 »^ I-l
5 §
a 0
S S 2
mjjj l l l
ly
S£
9 M S
ITS
r o
3 3 5
^ s
s &
3 3 3
fe e
3 35
5 Bs 5 B -2
TTll
3 35
S 35
S K 3
s s
ill Hi Hi
j I i
R 3 a
s s oi -5 rt
5 5S
H
^ ^
3 ^ 7 A
i ^
S 3 1 1 9
C S S
a § l
PI
H - «
Iii
R R
H?
1^ ft s;
S 3 S
S 3 ^
m H M
9 "
15
1^1
a R
ft s c
i iu a Hi
& z ^
3i U
iii
IV-18
vHr>. ,^ .

SIS a am g aiS 51 SIS S Sl? S SIS 3 212 S S|3 S 5| . a oi'
f^
?:SSI
IY-19

SEWERAGE AND WATER BOARD OF NEW ORLEANS
TABLE VII
FIVE YEAR ANALYSIS COMPOSITE DATA (2005 - 2009) FOR NEW ORLEANS DRINKING WATER PURIFICATION SYSTEM
J J PARAMEThR
Total Alkalinlnty (p^m as CaC03) Total Hardness (ppm as CaC03) ^ncarfaonata Ha itlness (ppm as CaCOS> CakiluTn Hardness {ppm as CaC03) Maqneslum Hafdneas (ppm as-CaC03) NepheJomeiricTuftkiftv fNT.U.) PH Chloride fppm) Fluoride (ppm) Total Dissolved Solids (ppm) Total Suspended SoSds (poml Free (ihlorine Residual fppm as CU) ToteJ (^lorlne Residual (ppm as CU) Ammonia (opm as Nl Nttrate + Nllrtto (DPm as N) * Conduotlvttv (umh08/om) TemperatuTB fDofi. F,) Akimlnum fppb) • Antimoiw (ppb) • Araente(ppb)* Barium (ppb) * 3arvlllum (pph) * 3admium(0OW* Chromium (pph l ' Copper ( p p b ) " Iron (ppb) * ^ad fppb ) * * . r utanaanese (ppb) * Wercurv (ppb) *
JNlckel(ppb>* Selenium (ppb)* Silver (ppb)* nifllllum fppb) * Zlnc(ppb)* Potassium fppm) * Sodium fppm) * HaloacettcAcfds OHAAei fpoM Total Ornanlo Cartxin fppm) Total Trihalomothanes (ppb) 1.2-01cti(cire&iane(DDb) Ghforoform (ppb) carbon Tetrachloride (ppb) BromodlohlorDmathane (ppb) Tetrachloroelhene (ppb) BTX (Bemena, Toluene & Xvtenes) (pob) Total Conforms (cokmtes/l 00 mD Fecal conforms (cotonies/lOO mTt
MISSISSIPPI RIVER i FINISHEDWATER j f Before Purification) 1 (Attar Puriflcaflon) 1
MAX 186 2fi0
70 186 96
320 8.63
88 0 ^ 342 216
692 80
.—
6.0 18 0.2 1 ^ 0.1 0.2 0.1
49.7 1680G
41(M1
MIN 78 fil
0 75
D 2
7.15
17 0.10
88 7
177 40
• -
2,9 0.0 0.0 0.0 O.C D.O O.C O.t
D t
AVG MAX
120 , 205
1 M 242
39 • 94
112 46 56
180 08
0.44 7.8ZJI 9.301
43 0.24
238 71
345 67
98 1.26 298
3.4 5.7
0.99
2 595 90 10 0 1
BB 0 0 0
0.3 40
0.031
30 — 1 0
4.0 0.0 0.0 0.0 0.0 0,(
o.c 0.1
100C
0 0 0 0
43 S.2
24.7 82 3.S
154.4
6.4 102.7
2.1 43.-
0.' r.€ 185
1401 C
MIN 72
124 0
82 3
0,07 7.02
21 0.12
114
•0.0
0.0 0.00
1 80 52
0 0 0 0 0 0 0
0.0 0
0.000
0 0 0 0 0 0 0
2.7 11.6
0 1.8 7.9
o.a 6.2 O.C O.E 0.1 Q.C
( 1
AVG 124 174 60
126 . 48
0.13 8.59
44 0.60
213
0.4 2.7
0,13
• 1.5 386
74 3 0 0
23 0 0 0
0.1 12
0.0Q6 2 0 0 0 0 0
11 3.8
2oi^ IS
2.81 29.71
Q.Q 19.3
0.0 i 8.4 ) O.OJ ) oi^ ] o|
) q
* Note: TTie resuhs for consfftuente indicated with astsrieke are from ih& Louisiana Department of Health and HospRals. Total Orgai^c Carbon and HaloaceClc Acid resutts are from a PHH-OPH certified contract lab. All ott>er resultsara from testing by V M S&W8 Water Qualtty Laboratoiy. Concembig tt)3 ohemloal resulCa, tlTo S&WB Water Quality Labbratory does not meet the tilgher critarta required by DHH-OPH to be dasaffled as a •DHH-pPH Germed Chemical LaboratoryflMnkfrig Watar^" Iherefoce, any results reported 1 ^ this laboratory for chemical drtnkkig water parameters wtifch are required lo be analyzed In a certtned laboratory are ofOdalty deemed InvaGd, The S&WB Laboratory Is cerfifled for Total Collfbrm and Fecal CoBform bacteriological testtng.
** ^tote: The lead and caipper tesflng was poifonned In 2008 by LA DHH.
rv-20

SEWERAGE AND WATER BOARD OF NEW ORLEANS
TABLE Vra
CARROLLTON OPERATION
r ' - ^ — ' • — ' - ^ ^ ^ CHEMICAL
Ume Ferric Coagnlant (3ilornie Sodium Polyphosphate Potyelectrotyte Fluoride AmizLoiua Carbon rOTAL (CHEMICALS
CHEMICAL COST
$413^87.69 $1,765,612.78
$857,840.11 $96,935.63
$376;il6.37 5362,552.35 $212,098.90
$0.00 $4,084,543.84
CHEMICAL COST PER MILLION GALLONS
$8.18 $34.95 $16.98 $1.92 S7.45 $7.18 $4.20 $0.00
$80,86
Purification Plant Operating Cost Total Water Treated in 2009: 50,515,380,000 Gallmis
TOTAL COST PER MILLION GALLONS
YEAR
2009 2008 2007 2006 2005
TOTAL WATER 50,51538 48,86731 48,931.79 51,000.17 47^74.62
OPERATING COST
$7,672,872.00 $833,745.00 $6,499,521.00 $5,591,146.00 $5,006,994.00
TOTAL COST PER MILUON GALLONS
$151.89 $16932 $132.83 $109.63 $105.25
IV-21

SEWERAGE AND WATER BOARD OF NEW ORLEANS
TABLE IX
ALGIERS OPERATION
CHEMICAL
iLnne Ferric Coafiulant Sodium Hypoohlorite{purchflsed) Sodium Polyphosphate Polyelectrotyte Fluoride (100%)
llAmmonia ISodtura Chloride* Sodium Hydroxide* • Sodium Bisulfite*
bydrochloric Acid* BCarbon PTOTAL CHEMICALS
CHEMICAL COST
$145,760.71 $177,914.75 $46,072.24 $40,093.03 $30,616.69 $24,67227 $19,513.30 $36,981.19 $10,011.00 $4,794.00 $3,776.00
$0.00 $540,205.18
CHEMICAL COST PER MOJJON GALLONS
- $37.03 $45.20 $11.71 $10.19 $7.78 $6.27 $4,96 $9.40 $2.54 $1.22 $0.96 $o.od
$137.25]
*iisedia on-site generation of chloriDe\hypochIorite
Pmifio^on Plant Operating Cost Total Water Treated m 2009: 3,935,840,000 Gallons
TOTAL COST PERMILLION GALLONS
YEAR
2009 2008 2007 2006 2005
j 2004
TOTAL WATER
3.935.84 3,788.95 4,427.16 4,261.05 3,723.03 3,705.98
OPERATING COST
$1,894,092.00 $2,029,729.00 $1,700,033.00 $1,435,527.00 $1,678,615,00 $1,312,385.00
TOTAL COST PKt H MGLLION GALLONS 1
$481.24| $53S.7W $384.00 $336.90
• • $450.87 $354.13
IV-22

SEWERAGE AND WATER BOARD OF NEW ORLEANS
TABLE X
SLUDGE REMOVED FROMTHE "G" BASINS PRIMARY TREATMENT UNITS DOOR MONORAKE CONVENTIONAL SYSTEM
2009
Total MiUion Oalloiis Water Treated
Total Tons Dry Sludge Deposited m Basins lacluding suspended and Dissolved Solids Removed and Reacting Qiemicals
Tolal Million Gallons Wot Shidpe Witiidrawn firom Basins lAveffage Percent solids in Wet Shidee Total Million Gallons Water Used m withdrawhiK SludKe Percent of Total Watca: Treated Used in WitlMlfewinK Wet Shidgc
29.697.47ll
17,473 187.95
2.18 18620
0.63
TABLE X-A
SLUDGE REMOVED FROM THE "L" BASINS PRIMARY TREATMENT UNITS DOOR MONORAKE CONVENTIONAL SYSTEM
2009 ^
|Total Million Gallons Water Treated
jTotal Tons Dry Sludge Deposited m Basins [ncluding suspended and Dissolved Solids |Removed and Resactinff Chemicals
jTotal MilUon Gallons Wet Shidge Withdrawn fiwn. Basins kvaBRe Pffoent solids in Wet Sludfte |rotal Million Gallons Water Used in wiflidrawinR Sludfie ItPcrcent of Total Water Treated Used m Withdrawing Wet Sludfie
20.685.63
12,142 686.32
0.42 685.10
.,- - 3.32|
^ • "23

SEWERAGE AND WATER BOARD O F N E W ORLEANS TABLE XI
2009 ANALYSIS D A T A F O R N E W O R L E A N S DUTNKING W A T E R P t O R m C A T J O N S Y S T E M
PARAMETER
Total Alkalininty (ppm as CaC03) Total Hardnow fppm as CaC03) Noncarbonate Htirdncss (wra as CoC03) 2arotum Hardness ( v m as CaC03) MaffKafuni Hardno« fppm as CiC031 MBiAdorortrio Taibidhy (N.T.U.') pH 3iloridofpiHn) Fluoride fwm) Total OissatTod Solids (ppm) Total SosDoided Solids fppm) Eree CWorine Residual (ppm as CI2> roW CSitorino Bjssldiifll (waa as O l ) Anuntxuafppm asN) Nftraie+l^tritefpiHii as N) * Sulfate (ppm)* ConduotMly (unohoa/am) r«fflperaiurB(I>0R.F,) AJurotnum (vfon) * Aitfinuxiy fmrtti) * Areailcfmiii)* Barium (pcro) * • BfflyUiam (ppm) • Cadmima fiJUoO • OiromHun fppm) • Copper (ppm)** Ijoii(wm)* Coadfppm)** WangancsD fppm) * MiarQury (p(Hn) * Nictidfppm)* Sdcniura (ppm) • Sthrar(ppin)*
| lUnium(ppin>* jlZTnofppm)* iPotassfumfppm)* Sodium (ppm)* Cyanide (ppb)* Haioaootic Aoida (HAAS) f-ppb) Total OtRanic Carbon fppb) Total TrihalDnKsttwDcs (ppb) I, S-DichlOTBtlmne fppb) cadorofijrm (pph) Carbon Tetrachloride (ppb) Broroodichlaromeftiww (ppb) r^raahloTDetbctto (pi^) BTJC (Benaeno, Tolnene & Xylenes) (pfb) Total CoUfimM (cotentertOO ml) Fcoal CoHforms foolom«/100 ml)
MISSISSIPPI RIVER. J FMISHHD WATER | (BefctoPurificdioB) 1 (After Pttriflcation) " U
MAX ISS 211
91 160 • 96 310 832
52 0.52
- 288 104
399 86
4.6 0.0 0.0 CO 0.0 O.C O.C O.C
5400 150C
MIN 83
110 0
76 0 5
72 17
0.12 5S 7
209 42
.
3J 0.0 0.0 0.0 D.O O.C 0.C 0.C 8
c
AVG 121 153 33
106 47 71
7.82 33
041 241
59 •
290 65
, . • •
MAX ••205
240 94
180 93
053 9J9
55 U
272
0.6 5.0
05S 2
43 463
88 0.00
0.000 0.001
0 0.000
. 0.000 0.00 03
0.02 0.031 0.00
O.ODO 0.0
0.00
— 8 o.oc
3.5 O.C O.C O.C O.C O.C
n 0.000 0
5 i 21.5 0.(
26.0 3.5
40.1
n - 32.1
1 0-c ) | 12.1
0.0 o,c 0.0 0.1
880 i 92 (
MIN S3
126 . 0 89 5
0.09 7.22
21 0.18 114
0.0 1.7
0.01 2
43 229 52
OXJO 0.000 0.001
0 0.000 OiKH)
0.00 0.0
0.02 0.000
0.00 0.000
0.0 0-00 0.00
0.000 0
5.2 21.5
0.0 9.0 2 i 9.' O.C 6.S O.C 2.( O.C
) O.C
\ ( )
AVG \ 134fl
• ^'4 41
o.nl 8.81
35 0.78
0.3 3.1
0.14 2
43 340 72
o.oci O.OOQ O.OOI
0 O.OOCJ O.OOOfl
0.00 a i
1
0.0211 0.006
0.00
o.ooo 0,011
o.oc 0,00
o.ooc oM
5.2 2ht
ox I8.f
3.0J 2431 o.oi
16^8 » o.oi ) 6.41 1 O.OI
) O.oi ^ ^ 31 oJ
* N o t c : l i t e irQSQltsibrcamtituoatB]ndicatiaiwi& asterisks are fiom fhe I ^ i r i ^ H o ^ l t a b . Total Organic Carbon and H a b a c e d c Acid results are from MWHLabara to r l e i . Alt other rcsutts are from testing by Iho S & W B Water (Juality Laboratory. Couceinlng fiie chemical resultB, Hw S&WB Water CJoalfty Laboratoiy does not meet the h%bor c r i t e i a requhwJ T q / D H H - O P H to be c l a ^ •DHB-OPHCen t f l ad Chemical l^iboratory/Dridkinfi Water;" flwrcforc, any rocalts r ^ M r t e d b y this laboratory fbr cbeimtcaldnn long vmtsrpanmetBQwlidohero required to be analyzed in a certified tabotitory are off icial^ deemed invaUd. Tbo S & W B Laboratory is certified t x Total CoU&tm and Fcaal Colifijnn baotodokigical testing.
** Note: The lead and cMppcr testing WHS performed In 200S by LA DHH.
IV-24

SEWERAGE AND WATER BOARD OF NEW ORLEANS
TABLEXn
EXTRACTS FROM TABLES IV-E AND V 20 Year Period, 1990 to 2009 Inclusive
Maxlinzzm, Minimum, and Average Amount of Water Treated Per Day
(MG. per 24 Hours)
YEAR
1990 1991 1992 1993 1994 1995 1996 1997 1998 1999 2000 2001 2002
. 2O03 2004 2005
1 2006 1 2007 1 200R I 2009
-.1 -I " • - '1 --— • " -•••• - • • • • I s e g a
CARROLLTON | MAX.
\6Z5Q 133-29 139.00 140.38 128.88 142,83 198.42 156.53 152.96 168 J25 152^0 153,93 128.67 144J26 145.83 144.00 165.63 144.75 143.50 147.92
MIN. AYO. 1 100.46 98.92 97.00
10325 103.88 104.67 91-59
UZ70 98.48
122.55 126.71 107.75 87.00 90.75
102.92 0.00
115.33 324.00 114.08 129.83
119.611 U4.79 115.22 U7.41 113.71 121.40 128.97 128.73 126.86 140.26 128.10 I26.7C 106.63 115.35, 122.57 115.47 139.73 134.0^ I33.8S 138.17
ALGIERS ll MA:X:
14.78 12.50 13.88 15.42 17.00 18.14 18:27 18.83 22.96 22.00 18.83 15.76 14.00 U 1 6 13.16 2Z67 1 8 ^ 16.00 13.58 14.00
MtN. 8.00 8.0Q 8.00 7.62 8.00 9.00 9.00 9.58
12.00 8.90 7.58 6.00 6.66 8.00 8.00 7.00 8.00
10.00 6.92
Ava. 1 10.44 9.6o| 9.88
10.18 11.47 11.55 11.47
. 12.06 1236 15.19 l i l 3 10.90 9.8o|
I0.06| io.d 10.2(| 11,67| 12.13J 10.38i
8.00| 10.781
IV-25
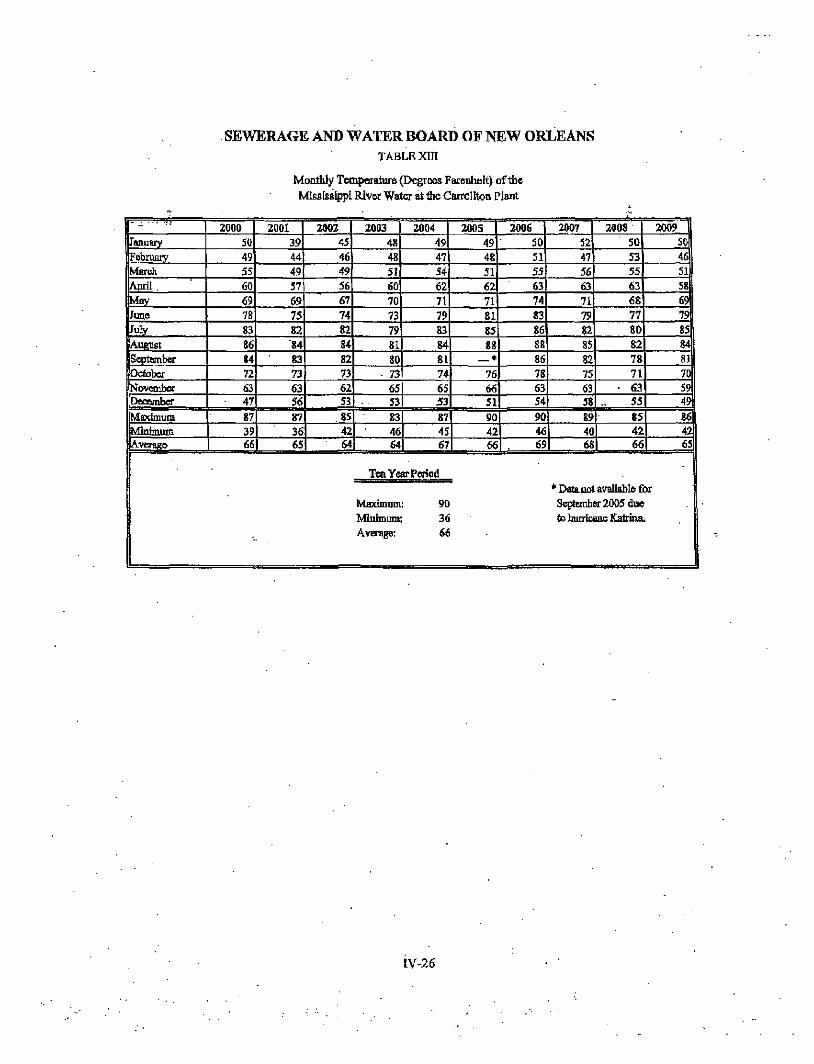
SEWERAGE AND WATER BOARD OF NEW ORLEANS TABLE Xm
Moa&ly Tcmpea-ature (Degrees Farenheit) of tiic
Mississippi Rlvor Water at flie Carrollton Plant
r ^ ^
January'
JFefaruary Warch April, May
June
July August Scptnmber October Novanbor Docembcf
Maximum N^nimum Averaw
2000 50
49 55 60 69 78 83 86 84 72 63
• 47
87 39 66
2001 39 44
49 37 69 75 82 84 83 73 63 56
87 36 65
2d02 45 46 49 56
67
74 82 84 82 73 62 53 85 42 64
2003 48 48 51 60 70 73 79 81 80
• 73 65 53
83 46 64
2004
49 47 54 62 71 79 83
84 81 74 65 33
87 45 67
Tai Year Period
Maximum; 90 Minimum; "A
Average: 66
2M5 49 48 51 62
71 81
85 88 *
76 66 51
90 42 66
2006 50 51
SS 63 74
83 86 88 86 78 63 54
90 46 69
2007 52 47 56 63 71 79 82 85 82 75 63 58
89 40
1 68
2fl08 50 53 55 63 68 77 80 82 78 71
• 63 55
85 42 66
•Data-notavftilRWfifi ScpTftrabeff 2005 due to inuricane Katrina
2009 50 46 51 58
69 79
85 84 81 70 S9 49
86 42 65
or
IV-26

SEWERAGE AND WATER BOARD OF NEW ORLEANS
TABLE XIV
Monthly Temperature (Degrees Farenheit) of the Tap Water ai the Carrollton Plant
January pebruaiy IMarcli lApril May
|jmic
July August September October November December Maxlnmnm Minimum Average
. . .
2O0S 67 66 68 75 79 82 84 87
*
77 75 68 90 61 75
2006 66 64 71 77 79 84 84 86 84 81 72 67 90 54 76
Five Year PCTiod
MJaximum 90 Mmimum 51 Average 74
2007 65 64 70 72 76 76 79 78 77 77 74 71 85 58 73
=
2008 67 69
71 72 76 81 83 80 80 78 72 68 86 59 75
2009 66 65 68 70 74 78 80 78 77 74 69
- 65 88 51 72
• *I>ata not available for Scplf mbex of 2005 due to hrancaneKatrina, . «
rv-27

3a iga l i s
I l i 2s
I 5§ 13
0 a;*
I 3
9 * o Is
i s ? I
fla
J S3 5S 22
I M^ ts
i^
Ss
i s 33 13
IP
E l
3 aS SS
i si
I 5S
* Si
n
9 ?:
I ?^
M
JS
ss
3s
ss
«g
3a
35 iis
S o
ai S t
^s 51 33
!§
£ S
s l i
SI
i l i i §
li
li
15
51
8 S5
s!
= SE
I I II
Mil
S 8
!
3 3
33
Sg l a ! F |5
55
33
£5
g3
:S?
as S2
5s
35
11
4 3S
a M 33
Sa
o ^ "»
P5 pg 3
&
= y
ill
Ba
if
33
s i 53
§i
53 3-2
5S
5S
II
33
-S
59
h
19 §
I I s
I i
iv-aa

SEWERAGE AND WATER BOARD OF NEW ORLEANS
Animal Report 2009
SEWER TABULATION NO. 1
Sewer Lines Laid During 2009
QUANTITIES OF PIPE MEASURED IN FEET
ITEMS 6" P.V.C. 8" P.V.C. 8" D.I. 10" P.V.C. 12" P.V.C. 15" P.V.C. 18" P.V.C. 21" P.V.C. 4" P.V.CVS.F.M. TOTALS
M.K'S
BY CONTRACT 11,828.00 30.558.10
0.00 2,212.00
448.00 845.00 616.00 455.00
0.00 46,962.10
24
BY OTHERS 12,986.00 12,533.70.
0.00 737.30 149.80 281.60
0.00 0.00 0.00
26,688.40
84
TOTAL FEET 24,814.00 43,091.80
0.00 2,949.30
597.80 1,126.60
616.00 455.00
0.00 73,650.50
TOTAL MILES 4.69 8.16 0.00 0.55 0.11 0.21 0.11 0.03 0.00
13.86 Total Manholes Constructed in 2009 -j'
108 1
Seveer Lines Laid in 2009
1 ORIGINAL "* CONSTRUCTION
(IN FEET) 3,806,870.90
Removed and Replaced
44,446.60 ' "-L-sirr = -= r i
Total Remaining in Feet
3,762,424.30
u.
Total Remaiming in Miles
712.83
Sewer Manholes in 2009
BUILT IN 2009
108
Removed in 2009
84
Total Modifioations in 2009
24
Sewer Valves as of 2009
SIZE AND TYPE 48" Gate Valve 36" Gate Valve 24'Gate Valve }l2" Gate Valve
. EXISllNG -
/ • ~ j
r - j
. • V
INSTALLED IN 2008
REMOVED IN 2008
lUlAL VALVES EsTSTALLED AS
OF 2008
1 .
IV-29

rv-30

K O S
h i s £ ^ 5
'4 5 1
IV-31

Annual Report 2008 WATER-TABULATION NO. 1
Water lines Laid During 2008 QUANTTnES OF HPE MEASURED IN FEET
ITEMS b" P.V.C. .r k" P.V.C. 6" P.V.C. B" P.V.C. 8" D.I. e" D.I. 12- D.I.
10" P.V.C. l O - I R O N 12- P.V.C. 16" P.V.C. 20" P.V.C. 2 1 - P.V.C. TOTALS R R E HYDRANTS VALVES M,H.'S
BY CONTRACT
61 0
1.596.80 13.B94.20
• 1.048.40 0.00 0.00 0.00 0.00 0.00 0.00 0.00 0.00
16.600.40 40.00 34.00
38
BY OTHERS
0 0
1,168.80 2,422.00
48.40 0.00 0.00 0.00 0.00 0.00
160,00 1,159.60
0.00 4.9S8.80
5.00 6.00
10
TOTAL FEET
61 0
2.761.60 16,316.20 .1,098.80
0.00 •" 0.00
0.00 0.00 0.00
160.00 1.159.60
O.OD 21.555.20
Total Fire Hydrants Total Valves In 2008
TOTAL MILES
0:01 0
0.52 3.08 0.20 0.00 0.K)
0.00 D.OO 0.00 0,03 0.21 0.00 4.0s
45.00 4O.O0I
Total Manholes 1
Removed or Abandoned 16640.8 ft
Water ValvAS as of 2008
Fire Hydrants as of 2008
Instated
45
' Removed
36
Total Hydrants Romalng 22.785
Water Manholes as of 2008
BUILT
40
Removed
31
Total ModKicaaons
29,673
Water Unes In S^tem BB of 2008 i . Instaled 1 21.555.20
Abandoned 16,640.80
. Total Feet 9,456,00
TOTAL MILES 1 1.79 1
IV-32

^ g c CQ
E (D ^ • o
> o E 0)
« - ^ OT — 2 -n
II x . =
u
W
S "& cz Q E 0)
_K
« "2
§ 1 T3 ©
B « c
J _c
O 2 Z i
K S yen m 2 . a :
0= ^
S LU 5 Q :
R
1 H « Z
2
o
o
"o
"o
N h -
O
o
c7 K
S o d m CO
?*
o
o"
o o
ro*
1
1 e
i
CM CO O CM
g
o O)
eg o o CM
OJ oo t o
CM
^
KT CO
in N ro CM
T -
o VJ IT)
i?
LTJ" CO
g
^
^ CM
O
CO N-
^r
g c
5
1 1
CO N.
^
o
o
"^ CO h-.
^
"F^ CM en
-
o
o
NT CM CD
m 2 ps CO CM r-
o
o
CO
^ (O
h -
1
v.
CD O)"
o
o
hT t— CO o>
To O CM
O
o"
(O
R
CO
ai
o CM 1—
o"
o
00
oi CM O o
(A
1 (5 Q.'
_i
f . 4 -
'E
Sll
o c
f o
o o j o l
CM a l o a
CD *« CO •
o c
o c
CD •" CO '
CO i-
O) t
SE
o c
o c
CO t
1 - I a> '
S!
1
"5 m
) • < -
' ?
• • » -
^ §
3 O
P O
^ §
P ^. 1 C3J — f_ M O) 0 - f
CM
3 O
D O
n N
sg r- T-
^S
1
h
3 > O O O g g O 5 ( D O CO
o •^" 1 - CM
o o o o o o o o t o
o c D o o o c o o i n T - '»3-
O J O O O C O C O O ^
"^ ro S 00 d •*" > - CM
• ^ O O O O l O t - OJ
CM
o o o o o - ^ C D g
O O O D O C M O • * T- rv.
• • - O O O O I ^ T - f -CO O CM CM
s ^ s CM
C O O J O O C M - « - C M Q
• ^ ^ CM i n O OJ
CM ..^.
CJj"
O C D O O O m O CD
2 ' 1 1
O O O O O h - O •<-
§ s O lO CM • ^
C D O ) O O C M O ) C M O
?S ^ 5 g d CO T - N- CM m i n CM CO CD CM OJ CD
" ^ 8 s oT
•E K 2 ^-
JU O LU
«J ,1 1 i m k. rf* _J CO LU
P l i s ! §
3" i n
J ^ CO
00
g r
U i
i
IV-33

SEWERAGE. AND WATER BOARD OV NEW ORLEANS
Aimual Rqmrt 2009 WATER TABUIATION N 0 3
LENOTH OP WATER MAINS OF EACH SIZB AND MATERIAL, NUMBER OF VALVES OF BACH S12E, BOTH OATE AND CHEOK, ORIGINALLY INSTALLED. THE QUANTmES REMOVED OR
ABANDONED. AND THE QUANTTnES REMAININO IN THE DISTRIBUrrON SYSTEM AND HYDRANTS, AS 0 ? THE CLOSE OF 2 « »
W A T E R MAINS |
Siw
M* 50" 48' « •
48' 43" 42" 42-36-
36* 36* 36-30" SO-SO" SO-SO-SO-30-24-24-21-20-20-20-20-
20" 1«-16-I fi
le-16-16-15-
i r 17
i r J2-12-12' 10" 10-10-10" 8-8-8-8 ' 8-6* 6-6* 6-
s-4-2" 4-2-3-4-4'
4-2-I-
MaieriBl
CociorewPipo SttttPipe Steel PipB ConoreiflPipe Cu t Iron Pipa C « t Iron Pipe ConoictBPipo Cut Iron Pipo Cut Iron Pipe Stadfipa CoDoretaPipe Ptutmjsed Concnte Cast Iron Pipe PrcstfSttcd Conorete R.C.P.Pipe DootilD Iron Pipe
StcdPipe Cononite Pipe P.V.C. Pipe ConomePipe Cut Iron Pipe P.V.C Pipe Cut Iron Pipe A>beeto> Cemont Coi>ora<« Pipe. Ductile Iron Pipe PrBstmfed Concrate R. C. P. Pipe Call Iron Pipe CooorotoPrpe Ductile Iron Pipe P.V.C Pipe Acbeetof Ccmeiit. ' R. C P. Pipe CBB Iron Pipe Ductile Iron Pipe Stool Pip-Asbeatd. Coimt Ductile Iron Pipe P.V.C Pipe Cast IiDD Pipe Ductile Iran Pipe AdMtiM CancQt P.V.C Pipe PlKdoPipe Out Ltm Pipe AAertm Cemcnl Ductile Iron Pipe P.V.C Pipe P.V.C. Pipe Cnst Iron Pipe AflbulOB Cement PlutioPipo Duotile Iran Pipe Ductile Iron Pipe Coit Iron Pipe Cait Iron Pipe GalvmiMPipe Oahndio Pipe
AabaslDt Cenxnt PLutJoPipe P.V.C. Pipe P.V.C Pipe Steel Pipe
Lioea rFce tTo la l Total Miles
.BMrtrng
7^S5.10 88,484.80 36,835.10 4,98Z90
12,75930 11.170.10 9,3fil.90 4,349.60 4,52330
16,761.20 37,374.70
675.00 60,840.10 36,654.40 3,919.60
35.00
19,602J0 72,724.20
• 1,483.10 102.50
30,480.20 101270.50 91.999.10 12,688.00 18,755JW 13,212.10
21Z50 970.50
117,498.10 5,681.60 3,21230 6,475^5
66,344 JO •1.06930
813.720.00 13,957.10 1,271.90
363,743.10 15JW7.10
I57J4730 10J56.70
610,00 12,763.60 3,534.00
320.44930 138.857.90 721,454.90
21,59X60 358.128.40 379.11050
2.787,347.30 1.099,009,70
12UB5.S0 19,39920
71250 20,592.10 19,926.10 9.620.00 3,361.70
29.455,30 3,237.10 8,62630
61,128.90 5346.60
8523.430.10 . US7.47
Uae«rFeet Installed
0.00 0.00 Q.OQ
0.00
0.00
0.00
0.00
0.00
O.O0
0.00
0.00
0.00
0.00
0.00
0.00
O.DO
0.00
o.oo 0.00
0.00
O.OQ
0.00
0.00
0.00
0.00
0.00
0.00
0.00
0,00
.O'M
160,00 1.15930
0.00 0.00 0,00 0.00 0.00 0,00
aoo 3,714.60
0.00 0.00 0.00 0.00 0.00 0.00 0.00
622.90 37,936.40
1.476.00 0.00
aoo 0,00 0,0Q 0.00 0.00 0.00 0.00 0,00 0,00 0,00
136,00 ]26,a
O.OG
45.L55.9C
8.35
UneorFeet Remcwed
0.00 0.00 0.00 0.00 0.00 O.W 0.00 0.00 QM O.DO
O.DO
0.00
O.OO
0.00
0.00
0.00
0.00
o.oo aoo 0.00
aoo aw aoo aoo aoo aoo aoo aoo 0.00
0.00
0.00
0.00
l.OSO.OO
aoo 85a20 • aoo 0.00
787.40 O.OQ aoo 0.00 aoo 0.00 aoo
2.412.80
aoo 9.758.00
I aoo aoo aoo
6 J 14.40 . 754550
aoo O.OQ
0.00
0.00
100.00
aoo • o.oc • 0.00
0.00
aoo 0.00 0.00
29,566.00 5.60
Linear Feet Remiiiniog
7.535.10 88.484.80 36.835.10
4.98Z90 12.75930 ll,17aiO 9,361.90 4,349.60 4,52330
16,76150 37,374.70
675.00 60,B40.IO 36.654.40
3J16.60 35.00
19.60250 72,72450
1.483.10 102.50
3a480J0 10570.50 91,999.10 12,688.00 18.755.90 13512.10
21Z50 970.50
117,498.10 5.681.60 3,37250 8557.60
66344,20 1,06930
812,869.80 15,957.10 1572.9<
363555.70 15.937.10
160,971.90 10356.70
610.00 12.763.60 3.534.00
318.036.50 138357.90 711,696.90
22505.50 396,064.80 38038650
2.781.032.90 1,091,764.50
121385.50 19.39950
. 7J250 20.592,10 19.826.10 9.620.00 3361.70
29.45530 3537.10 8.762.30
623M.90 5 3 « . 6 0
8539.020.00 1360.42
S i a
48-42" 36" 30-24-20-16-14-
i r 10-8-6-4"
ratal
VALVES
Bxitting
16 4
18 63 39
133 190
3 2,282
65 6523
13,092 7,139
29569
InndlBl
0
0 0 0 0 0 0 0 6 0
49 9
10
74
Ranc fwd
0 0 0 0 0 0 0 0 3 0
22 23 4
52
ReroBinice
16 4
11 65 39
133 190
3 2589
65 6550
13.078 7.145
29,291

s
I
i < S M
il m
anvuaAv AlIUMDn
B |
m
2a
^ l U l t
?^
ss
i5
5S
El^Slg
^ 8 ;
e??5
3S
s i^ i ies i f i
^ 2 ' '
g ^
s ^ t
?? .# m a
g?f
R '
3^3
353
s
gs
?5
2 • 2R
S P
as
g i e i H s i s i i e i i s
^ 3 .
a j ^
s;g;
0 "^Ma
S 4
^ ?! »i
5 "
g l^
?1«
1
3 «
i l U l t
3 " S*?
SlSSH
IV-35

AIBLMOH TYDHU*
uvaoi TViOl
• r
I
RS.
aS
§*
^« ^s
^ 5
B5
! ? •
^n .0 ^^
55
^ - •
^ 2
5=*J^
as
uvaoJ. TVlOI.
= e
Ci?
S ^ Vl M «-l aa ss
:^
da dd
52 as !?^
S J ^ S 5lg
as
R3 Ȥ
IfiSlE lg l ^ i l ^ ^ l g | ie | |g | ie | !g5 i l | ig |2e IS siggiisie i t ^ i t
IV-36

81
9 H <
I
si
rovauv xmuMcm ivn»wv
uvaoL TVIUI
l^
ss
ISalssims sifi
S|^
E in
E
Ss
i t n t
%
m * V
n rJ
^
2 3 3 9
3i
siiq
SlSs1£ i l t l l f i i l « f lS
*^.•n^ . If, i n 1^ •n
a^
as
m 0.
^^
?t^
IS j lS
^^
e^ -n ^
^
- S ~i ^
33S
!
I f i l l Si
n3
B5
a tr m
It sis
IV-37

CD 5 L
yog
hi
III
?!
A ' m U J Q H
•vrmnn
0
s ies is l es i s
r
? 3
isslfi
! 9
g"
IS i lS
"i *
Vl «
sjei
^^
e.s*
i l g S l f i i l S | l §
5 -
so
?§
§5
;qs.
3.-o
5 5*
Si
§1
OS
t l t l l t
a
^ 5 n
R g S C K\
l es is 119
ris
= ^
32
S3;
55
s^a
* i s ;
^«
S|g£ l£ sie
IV-38

10VB3AV AIBIMOM TVftMMV
11
Pi ill
eg ig
K Z
1
uvaoL
a?
U £ |ggU£lg | l £
^§
SIS?
^ P
? ?
us
K !t|
l e g i e
r s q
ig
^*3
as
SlfisUiH
!.
52
^ 3
sl.i
R^
?R
?^ S?5i
2?l 3
5^
R^
35
=
ri^
R S
O • • >i>
3
T ••> >o
3S
7a;
s
31 s; 3
Slfi£lfi5.HslSSlSglSslg
s^
B3
S:5 61
rv-39

I D V O A V AIHIMOM TV7UWV
ill IP
PS r-^ we
ESi '
P13
I
l I H l t
^5^
3S
S I 2
3 3
S [ |
g^
S S
P
i i gg ies l ^ i i s
; ^ se
i s
8 = S
a SIS;
3if:
^e
^ R
n Fi M
n
.
35
§^
S3
3;3
ss
S 5
" 0
8 ^
F : S P
^ q
lf|lS|K
Si^f
3:
3 9 9
¥
•^ p-
3 31^ 32!
St
3 S
3
| l ? | i e K
IV^W

SEWERAGE AND WATER BOARD OF NEW ORLEANS COST OF OPERATIONS IDENTIFICATION PROGRAM
BENCHMARKING 2009
ADMINISTRATIVE SERVICES DEPARTMENT Insurance Cost per Employee:
Workers* Compensation / ' $ 333.75 Auto Liability $1,732.94 General Liability $ 95.45
$ 941.91 ENGINEERING DEPARTMENT
Cost to Design a Project* 6.8%
ENVIRONMENTAL DEPARTMENT Cost of Typical Industry Sampling Event $ 390.18
FAClLiry MAINTENANCE DEPARTMENT Cost to set 5/8" water meter $ 82.25
MANAGEMENT SERVICES DEPARTMENT FINANCE:
Cost to Process a Miscellaneous Invoice Cost to process a Vendor Invoice Cost to process a Paycheck
INFORMATION SYSTEM: Cost to Image a Document Cost to Retrieve a Document V
PERSONNEL: Cost to Hire an Employee . Cost to complete a Voluntary Employee Termination Employee Turnover Rate
Cost to Train an Employee
PURCHASING: Cost to Process a Sundry Purchase Order $ 39.08
REVENUE: Cost to Read a Meter $ 2.07 Cost to Render a Bitl
(Less Meter Reading) $ 0.78 Cost to Manage a Customer by Phone $ 3.01 Cost to Manage a Customer by Mail $ 4.64 Cost to Manage a Walk-in Customer $ 3.64 Cost to Process a Mail-in Payment $ 0.41 Cost to Process a Walk-in Payment $ 0.90
SUPPORT SERVICES DEPARTMENT Average Annual Maintenance Cost Per Piece of Equipment $1,000.00
15%
$ $ $
$ $
$
$
40.08 6.37 6.74
0.37 1.88
121.84 N/A
16.68 8.58%
N/A
rv-41

SEWERAGE AND V^ATER BOARD OF NEW ORLEANS
SINGLE AUDIT REPORTS
DECEMBER 31. 2009
| J 9 | A I Postlethwaite mSSMM & Netterville
A Professionot Accounting CorpoTolkin
www.pncpa.com

SEWERAGE AND WATER BOARD OF NEW ORLEANS New Orleans, Louisiana
Single Audit Reports
December 31,2009
Table of Contents
Page
Report on Internal Control over Financial Reporting and on Compliance and Other Matters Based on an Audit of Financial Statements Perfontied in Accordance with Government A uditing Standards 1
Report on Compliance with Requirements Applicable to the Major Program, on Intemal Control over Compliance in Accordance witli 0MB Circular A-133 and the Schedule of Expenditures of Federal Awards 3
Schedule of Expenditures of Federal Awards 5
Notes to Schedule of Expenditures of Federal Awards 6
Schedule of Findings and Questioned Costs 7
Summary Schedule of Prior Audit Findings 11

I B j a i ^ l Postlethwaite U S i U & Netterville
A Profouionol Accounting Corporalion Associaloii OflicBJ in Prirtcipal Cilie* ot iSe United States •
www.pncpa.cofn
REPORT ON INTERNAL CONTROL OVER FINANCLVL REPORTING AND ON COMPLLVNCE AND OTHER MATTERS BASED ON AN AUDIT OF FINANCIAL STATEMENTS PERFORMED IN ACCORDANCE WITH
GOVERNMENT A UDITING STANDARDS
To tlie Members of tlie Board Sewerage and Water Board of New Orleans:
We harve audited-the financial statements ofthe Sewerage and Water Board of New Orleans (the Board), as of and for the year December 31, 2009, and have issued our report thereon dated June 29, 2010. We conducted our audit in accordance with auditing standaids generally accepted in the United States of Amedca and the. standards applicable to fmancial audits contained in Government Auditing Standaids, issued by the Comptroller General ofthe United States.
Intemal Control Over Financial Reporting
In planmng-and-perfbrming our audit, we considered the Board*s intemal control over fmancial reporting as a basis for designing our auditing procedures for the purpose of expressing our opinion on the financial statements, but not for the purpose of expressing an opinion on the effectiveness ofthe Board's internal control over fmancial reporting. Accordingly, we do not express an opinion on the effectiveness of the Board's intemal control over fmancial reporting.
A deficiency in internal control exists when the design or operation of a control does not allow management or employees, in the normal course of performing their assigned functions, to prevent, or detect and correct misstatements on a timely basis, A material weakness is a deficiency, or a combination of deficiencies, in mtemal control such that there is a reasonable possibility that a material misstatement ofthe entity's financial statements will not be prevented, or detected and corrected on a timely basis. We consider the deficiency described in the accompanying schedule of findings and questioned costs, indexed as 2009-1, to be a material weakness.
Compliance and Other Matters
As part of obtaining reasonable assurance about whether the Board's fmancial statements are free of material misstatement, we performed tests of its compliance with certain provisions of laws, regulations, contracts, and grant agreements, noncompliance with which could have a direct and material effect on the determination of financial statement amounts. However, providing an opinion on compliance with those provisions was not an objective of our audit, and accordingly, we do not express such an opinion. The results of our tests disclosed no instances of noncompliance or otiier matters that are required to be reported under Government Auditing Standards. Tlie results of our tests disclosed an instance of noncompliance or other matters that is required to be reported under Government Auditing Standards and which is described in the accompanying schedule of findings and questioned costs as item 2009-2.
- 1 -
30th Floor - Energy Centre • 1100 Poydras Street • New Orleans, LA 70163-3000 • Tel: 504.569.2978
One Galleria Blvd.. Suite 2100 • Metairie, LA 70001 • Tel: 504.837.5990 • Fax: 504.834.3609

We noted certain matters that we reported to management of the Board, in a separate letter dated June 29, 2010.
The Board's responses to the findings identified in our audit are described in tlie accompanying schedule of fmdings and questioned costs. We did not audit the Board's responses and, accordingly, we express no opinion on the responses.
This report is intended solely for the information and use of the Board, the Board's management and federal awarding agencies and pass-through entities, such as the State of Louisiana and Legislative Auditor's Office and is not intended to be and should not be used by anyone other than these specified parties. However, under Louisiana Revised Statute 24:513, this report is distributed by tlie Legislative Auditor as a public document.
New Orleans, Louisiana June 29,2010
- 2 -
P&N

Postlethwaite & Netterville
A ProlBsiiDno! Accounting Corporalkin Auockrted Officns in Principal Ciliei of lh« United States
www.pncpa.cofn
REPORT ON COMPLIANCE WITH REQUIREMENTS APPUCABLE TO THE MAJOR PROGRAM, ON INTERNAL CONTROL OVER COMPLLVNCE IN ACCORDANCE WITH
OMB CIRCULAR A-133 AND THE SCHEDULE OF EXPENDITURES OF FEDERAL AWARDS
To the Members ofthe Board Sewerage and Water Board of New Orleans:
Compliance
We have audited the compliance of Sewerage and Water Board of New Orleans (the Board), with the types of compliance requirements described in the U. S. Office of Management and Budget (OMB) Circular A-J33 Compliance Supplement that are applicable to each of its major federal programs for the year ended December 31, 2009. The Board's major federal programs are identified in the summary of auditor's results section ofthe accompanying schedule of findings and questioned costs. Compliance with the requirements of laws, regulations, contracts, and grants applicable to each of its major fedeml programs is the responsibility ofthe Board's management. Our responsibility is to express an opinion on the Board's compliance based on our audit.
We conducted our audit of compliance in accordance with auditing standards generally accepted in the United States of America; the standards applicable to financial audits contained in Government Auditing Standards, issued by the Comptroller Genera! of the United States; and OMB Circular A-133, Audits of States, Local Governments, and Non-Profit Organizations. Those standards and OMB Circular A-133 require that we plan and perfonn the audit to obtain reasonable assurance about whether noncompliance with the types of compliance requirements referred to above that could have a direct and material effect on a major federal program occurred. An audit includes examining, on a test basis, evidence about the Board's compliance with those requirements and perfonning such otiier procedures as we considered necessary in the circumstances. We believe that our audit provides a reasonable basis for our opinion. Our audit does not provide a legal determination ofthe Board's compliance with those requirements.
In our opinion, the Board complied, in all material respects, with the requirements referred to above tliat are applicable to each of its major federal programs for the year ended December 31, 2009. However, the results of our auditing procedures disclosed an instance of noncompliance with those requirements, which is required to be reported in accordance with OMB Circular A-133 and which is described in the accompanying schedule of findings and questioned costs as item 2009-3.
hitemal Control Over Compliance
Management ofthe Board is responsible for establishing and maintaining effective intemal control over compliance with the requirements of laws, regulations, contracts, and grants applicable to federal
30th Floor - Energy Centre • 1100 Poydras Street • New Orleans. L^ 70163-3000 • Tel: 504569.2978
One Galleria Blvd., Suite 2100 • Metairie. U\ 70001 • Tel: 504.837.5990 • Fax: 504.834.3609

programs. In planning and peifonning our audit, we considered the Board's intemal control over compliance with the requirements that could have a direct and material effect on a major federal program in order to detennine our auditing procedures for the purpose of expressing our opinion on compliance and to test and report on intemal control over compliance in accordance with OMB Circular A-133, but not for the purpose of expressing an opinion on the effectiveness of intemal control over compliance. Accordingly, we do not express an opuiion on the effectiveness of the Board's intemal control over compliance.
A deficiency in intemal control over compliance exists when the design or operation of a control over compliance does not allow management or employees, in the normal course of performing their assigned functions, to prevent, or detect and correct, noncompliance with a type of compliance requirement of a federal program on a timely basis. A material weakness in internal control over compliance is a deficiency, or combination of deficiencies, in intemal control over compliance, such that there is a reasonable possibility that material noncompliance with a type of compliance requirement of a federal program will not be prevented, or detected and corrected, on a tunely basis.
Our consideration of intemal control over compliance was for the limited purpose described in the first paragraph of this section and was not designed to identify all deficiencies in intemal control over compliance that might be deficiencies, significant deficiencies or material weaknesses. We did not identify any deficiencies in intemal control over compliance that we consider to be material weaknesses, as defined above.
Schedule of Expenditures of Federal Awards
We have audited the financial statements of the Board as of and for the year ended December 31, 2009, and have issued our report thereon dated June 29, 2010. Our audit was performed for the purpose of formmg our opinion on the Board's basic financial statements. The accompanying schedule of expenditures of federal awards is presented for purposes of additional analysis as required by OMB Circular A-133 and is not a required part ofthe basic fmancial statements. Such information has been subjected to the auditing procedures applied in the audit of the basic financial statements and, in our opinion, is fairly stated, in all material respects, in relation to the basic financial statements taken as a whole.
The Board's responses lo the findings identified in our audit are described in the accompanying schedule of fmdings and questioned costs. We did not audit the Board's responses and, accordingly, we express no opinion on the responses.
This report is intended solely for the infonnation of the Board, the Board's management and federal awarding agencies and pass-through enfities, such as the Louisiana and Legislative Auditor's Office, and is not intended to be and should not be used by anyone other than these specified parties. However under Louisiana Revised Statute 24:513, this report is distributed by the Legislative Auditor as a public document.
New Orleans, Louisiana June 29,2010
P&N

SEWERAGE AND WATER BOARD OF NEW ORLEANS New Orleans, Louisiana
Schedule of Expenditures of Federal Awards
For the year ended December 31, 2009
CFDA Federal Grantor/Program Title Number Expenditures
Department of Housing and Urban Development -Community Development Block Grants
Passed through State of Louisiana Office of Community Development 14.228 $ 3,284,531
Environmental Protection Agency -Research & Technology Foundation: The Lake Pontchartrain Basin Program:
Passed through University of New Orleans 66.606 93,986
Environmental Protection Agency -Capitalization Grants for Drinking Water State Revolving Funds:
Passed through Louisiana Department of Health and Hospitals - ARRA 66.468 1,273
United States Department of Homeland Security -Public Assistance Grants:
Passed through the State of Louisiana Office of Homeland Security and Emergency Preparedness 97.036 49,834,596
Department of Homeland Security-Hazard Mitigation Grant
Passed through the State of Louisiana Office of Homeland Security and Emergency Preparedness 97.039 33,500
United States Department of Homeland Security -Special Community Disaster Loans (note 4) 97.030 -
$ 53,247,886
See accompanying notes to Schedule of Expenditures of Federal Awards.

SEWERAGE AND WATER BOARD OF NEW ORLEANS New Orleans, Louisiana
Notes to Schedule of Expenditures of Federal Awards
December 31, 2009
(1) General
Tlie accompanying Schedule of Expenditures of Federal Awards presents the activity ofthe federal awards ofthe Sewerage and Water Board of New Orleans (the Board). The Board's reporting entity is defined in note I to tlie financial statements for the year ended December 31, 2009. All federal awards received from federal agencies are included on the schedule.
(2) Basis of Accounting
The accompanying Schedule of Expenditures of Federal Awards is presented using the accrual basis of accounting, which is described in note 1 to the Board's financial statements for the year ended December 31, 2009.
(3) Relationship to Basic Financial Statements
Federal awards are included in statement of revenues, expenses and changes in net assets as follows:
Operating and maintenance grants $ 19,373,185 Capital contributions 33.874,701
53,247,886
(4) Loans Payable to Federal Agency
The Board received a Special Community Disaster Loan (the "Loan") from the federal govenunent in January 2006. Total draw downs as of December 31, 2009 total $61,956,747. The tenns ofthe Loan call for interest to accrue at various annual rates to be repaid with the principal when the Loan becomes due during 2011.
-6

SEWERAGE AND WATER BOARD OF NEW ORLEANS New Orleans, Louisiana
Schedule of Findings and Questioned Costs
Year ended December 31, 2009
(1) Summary of Auditors' Results
(a) The type of report issued on the basic financial statements; unqualified opinion
(b) Significant deficiencies in internal control were disclosed by the audit of the basic financial statements: no; Material weaknesses: yes
(c) Noncompliance which is material to the basic financial statements; no
(d) Significant deficiencies in mtemal control over major program: no; Material weaknesses: no
(e) The type of report issued on compliance for major program: unqualified opinion
(f) Any audit findings which are required to be reported under Section 510(a) of OMB Circular A-133: yes
(g) Major program:
Department of Housing and Urban Development -Community Development Block Grants - Passed through State of Louisiana Office of Community Development (CFDA number 14.228)
United States Department of Homeland Security, Federal Emergency Management Agency -Public Assistance Grants - passed through the State of Louisiana (CFDA number 97.036)
(h) Dollar threshold used to distmguish between Type A and Type B programs; $1,597,437
(i) Auditee qualified as a low-risk auditee under Section 530 of OMB Circular A-133: no
(2) Findings Relatuig to the Basic Financial Statements Reported ui Accordance with Government Auditing Standards:
2009-J - Internal Control over Financial Reporting
Condition: General ledger account reconciliations for some significant accounts or transaction classes were not performed by management in a timely manner.

SEWERAGE AND WATER BOARD OF NEW ORLEANS New Orleans, Louisiana
Schedule of Findings and Questioned Costs (continued)
Year ended December 31, 2009
(2) Findings Relating to the Basic Financial Statements Reported in Accordance with Govemment Auditing Standards (continued):
2009-1 - Intemal Control over Financial Reporting (continued)
Criteria: The definition of intemal controls over financial reporting is that policies and procedures exist that pertain to an entity's ability to initiate, record, process, and report financial data consistent with the assertions embodied in tlie annual financial statements, which for the Board is that financial statements are prepared in accordance with generally accepted accounting principles (GAAP). Our responsibility under current audit standards requires us to communicate this issue to management and the Board of Commissioners.
Effect As part of the audit process; we have historically assisted management in drafting the financial statements and related notes for the year-end audit procedures. During the course of our audit procedures we identified significant adjusting entries to general ledger accounts. Because our involvement is so important to the financial reporting process and due to the significance of the financial statement adjustments, this is an indication that the intemal control over financial reporting ofthe Board meets the definition of a significant deficiency and reaches the level of a material weakness.
Cause: Management did not perfonn the reconciliations of some general ledger accounts in a timely manner.
Auditor's recommendation: All general ledger accounts should be reconciled in a timely manner and reviewed by management. This review should be documented.
Management response: Loss of key personnel in Accounting and Information Technology affected timely completion of financial acfivities. Finance has established stronger procedures to enhance Accounting Pei"sonnel knowledge of reconciliations and intemal controls. More management oversight has been implemented.
2009-2 - Debt Compliance
Criteria: The sewerage service revenue bond agreements have a bond debt service coverage covenant that requires that the Sewerage Fund produce revenues over and above the amount required for the operation and maintenance of the Sewerage Fund which shall not be less than 130% ofthe maximum of debt service due in any calendar year on all outstanding bonds.

SEWERAGE AND WATER BOARD OF NEW ORLEANS New Orleans, Louisiana
Schedule of Findings and Questioned Costs (continued)
Year ended December 31,2009
(2) Findings Relating to the Basic Financial Statements Reported in Accordance with Government Auditing Standards (continued):
2009-2 - Debt Compliance (continued)
Condition: The bond debt service coverage for the Sewerage Fund was 97% for the year ended December 31, 2009.
Cause: Revenues were not sufficient to meet bond debt service coverage due to increased expenses and increased debt service requh^ments.
Effect: The Sewerage Fund is in violation ofthe bond debt service coverage requirement.
Recommendation: The Board should consider ways to increase revenues or decrease expenses to provide sufficient debt service coverage.
Management's response: The Sewerage and Water Boaid of New Orleans is cunent with all debt service payments and has not made any withdrawals from the debt service reserve fiinds. The Board has engaged Raftelis Financial Consultants to perform a comprehensive financial analysis and rate study for the sewer, water, and drainage systems. The Board has faced significant financial challenges following Hurricane Katrina. Water revenues decreased immediately with the loss of population and businesses, while maintenance expenses and capital requirements soared. The Sewerage and Water Board met these challenges by obtaining emergency loans and grants, by significantly reducing staff levels, by eliminating nearly all discretionary expenses, and through modest increases in water rates, which were proposed prior to Hurricane Katrina. In addition, the federal and state governments have provided large amounts of capital funding to rebuild portions ofthe water, sewerage, and drainage systems that were damaged or destroyed by the fioodwaters fi'om the failed levees. However, despite these efforts and govemment funds, the revenues of the systems have been inadequate to meet important operational needs and bond covenants for debt service coverage. The financial planning and rate study project is intended to result in recommendations to increase revenues that, upon approval and implementation by midyear 2011, will meet or exceed all coverage requirements and should ensure at a very high degree of likelihood that all bonded indebtedness would be immediately rated at a level of minimum investment grade or higher.
- 9 -

SEWERAGE AND WATER BOARD OF NEW ORLEANS New Orleans, Louisiana
Schedule of Findings and Questioned Costs (continued)
Year ended December 31, 2009
(3) Findings and Questioned Costs relating to Federal Awards
2009-3 — Supporting Documentation for Expenditures Public Assistance Grants (CFDA number 97.036)
Criteria:, Only actual costs incurred can be charged to a program (OMB Chcular A-87 and GMB Circular A-133 Compliance Supplement).
Condition^ The Board enters information from approved manual work papers into an electronic work order system. The electronic work orders are submitted to the state govemment agency in order to be reimbursed for labor, materials, and equipment usage. Ofthe 200 manual work orders selected for testing, 5 could not be located by the Board. We noted a net error of $2,194 during the testing of $262,355 of work orders.
Cause: The Board does not have a system to review manual work orders after they are entered into the electronic work order system to ensure accuracy. In addition, the Board does not have procedures in place to ensure that all manual work orders are maintained in a central location.
Effect: Some of the electronic work orders did not agree to the approved manual work orders, and some work orders could not be located by the Board.
Recommendation: The Board should put procedures and controls in place to ensure that information from work orders entered into the electronic work order system is accurate, and manual work orders should be maintained in a central location.
Management response: The Board's staff will implement procedures and controls to insure that data from work orders entered into the automated work order system is correct. Additionally, procedures will be implemented to ensure that manual work orders will be maintamed in a centralized location.
10-

SEWERAGE AND WATER BOARD OF NEW ORLEANS New Orleans, Louisiana
Summary Schedule of Prior Audit Findings
Year ended December 31, 2009
2008-] — Intemal Control over Financial Reporting
Condition: General ledger account reconciliations for some significant accounts or transaction classes were not performed by management in a timely manner.
Effect: As part of the audit process; we have historically assisted management in drafting the financial statements and related notes for the year-end audit procedures. During the course of our audit procedures we identified significant adjusting entries to general ledger accounts. Because our involvement is so important to the financial reporting process and due to the significance of the financial statement adjustments, this is an indication that the intemal control over fmancial reporting of the Board meets the definition of a significant deficiency and reaches the level of a material weakness.
Current Status: Not resolved. See repeat fmding at 2009-1.
11 -

1 1 a.
Postlethwaite & Netterville
A Prolok itifiol Ai-cotjniing Cotpfjfaf'On AsvjfH i'ed OHicei In Piincifxil CiNei of rhe Uni'od Sto'e
.pncpa.com
June 29, 2010
Members ofthe Board Sewerage and Water Board of New Orleans:
We have audited the financial statements ofthe Sewerage and Water Board of New Orleans (the Board) as of and for the year ended December 31, 2009 and have issued our report thereon dated June 29, 2010. In planning and performing our audit of tlie financial statements of the Board, we considered internal control as a basis for designing our auditing procedures for the purpose of expressing our opinion on tlie financial statements but not for tlie purpose of expressing an opinion on the effectiveness of the City's internal control. Accordingly, we do not express an opinion on the effectiveness of the Board's intemal control.
During our audit we noted certain matters involving intemal control and other operational matters that are presented for your consideration. These comments and recommendations, all of which have been discussed with the appropriate members of management, are intended to improve internal control or resuh in other operating efficiencies and are summarized as follows:
1. Supporting Documentation for Workers' Compensation
Observation: The Board could not locate files for 2 ofthe 15 employees selected for testing. Of the 13 employee files tested, 2 ofthe files did not have supporting documentation for the employee's injuiy and rehabilitation.
Recommendation
Management's Response:
The Board should implement processes and procedures to ensure that the supporting documentation is maintained for each employee receiving workers' compensation documentation on the employee's injuiy and rehabilitation.
The Workers' Compensation Office will review existing processes and files to verify that fiilly documented files are maintained on all active Workers' Compensation cases.
2. Overtime Authorization
Observation:
Recommendation:
The Board could not provide an approved overtime pre-authorization form for 14 out of 60 employees tested. Tlie overtiine was subsequently approved before the time sheets were processed.
Implement processes and procedures to ensure that overtime is properly authorized in advance.
30th Floor - Energy Centre • 1100 Poydras Street • New Orleans, LA 70163-3000 ' Tel: 504.569.2978
One Galleria Blvd., Suite 2100 • Metairie, IA 70001 • Tel; 504.837.5990 • Fax: 504834.3609

Management's Response: Management will review the control procedures for preauthorization of overtime with supervisory personnel and will monitor compliance to ensure effectiveness.
Sincerely,
-2-
1 1 Km 1