notes o cestodes. proc. helminth. soc. uscle tissue. proc. helminth
TRANSCRIPT

from plerocercoids from Salmo lewisi.
notes o cestodes. Proc. Helminth. Soc.
PATHOLOGY OF THE BLACK BEAR-King, et al. 111
CHRISTIAN, J. J. AND H. L. RATCLIFFE. 1952. Shock disease in captive wild mam-mals. Am. Jour. Path. 28(4): 725-737.
COFFIN, D. L. 1953. Manual of Veterinary Clinical Pathology. Comstock Pub. Assoc., Ithaca, N. Y.
COOLEY, R. A. 1938. The genera Dermacentor and Otocentor (Ixodiglae) in the United States, with studies in variation. U. S. Nat. Inst. of Health BO. 171: 1-89.
HENSHAW, H. W. AND C. BIRDSEYE. 1911. The mammals of flitter Root Valley, Montana, in relation to spotted fever. U. S. Bur. Biol. Surv.:Circ. 82: 1-24.
HERMAN, C. W. 1944. Eyeworm, Thelazia californiensis, infection in deer in Cali-fornia. Calif. Fish and Game. 30: 58-60.
ecovery of encapsulated infectike larvae of Trichinella HILL, C. H. 1951. The uscle tissue. Proc. Helminth. fc•c. Wash. 18: 114-120. spira/is relatively free of
HOPICINS, G. H. E. 1954. tes on some Mallophaga from bears. Entomologist 87(1094): 140-146.
HORSTMAN, B. N. 1949. A sur ey of parasites of th Colorado. M.S. thesis, Colo do A. & M. Colic
KING, J. M. 1959. Veterinary ne ropsy technique.
RANSOM, B. H. 1916. Effects of
frigeration u Jour. Agr. Res. 5: 819-854.
RICHTER, C. P. AND E. H. UHLENHUTH. 1954. mparison of the effects of gonadec- tomy on spontaneous activity of wi • and do esticated Norway rats. Endocrin. 54(3): 311-322.
SCANLON, J. 1955. The Anoplura and phaga of the mammals of New York.
M.S. thesis, Cornell Univ. Library.
SCOTT, J. N. 1934. Diphyltobothrium cor urn in Yellowstone bears. Colorado-Wyoming Acad. Sci. Jour. 1: 6.
SCOTT, J. N. AND R. HONESS. 1934. R Colorado-Wyoming Acad. Sci. Jour.
SKINNER, M. S. 1935. Miscellaneous Wash. 2: 68.
STILES, C. W. AND C. E. BAKER. 19 5. Key cat ogue of parasites reported from carnivora with their possible pu lc health impo ance. U. S. Nat. Inst. Health Bull. 163: 913-1223.
SVIHLA, A. H., H. BOWMAN AND R. EARSON. 1955. Uood picture of the American black bear, Ursus americanus. our. Mamm. 35: 134-135.
YOUATT, W. G. AND A. W. ERIC N. 1958. Notes on hematology of Michigan black bears. Jour. Mamm. 39: 8-589.
black bear in southwestern Library.
Cornell Vet. Coll. (mimeo.)
on larvae of Trichinella spiralis.

FACTORS IN HATCHERY POND DESIGN'
David C. Haskell
Richard 0. Davies
James Reckalm2
Fish Hatchery Foreman New York State Conservation Department
Fish Hatchery Helper New York State Conservation Department
Fish Hatchery Helper New York Conservation Department
ABSTRACT
Three aspects of pond design were investigated as applied to rectangular rearing ponds, i.e., water circulation, water aeration, and screen size. It was found that for best circulation the inlet and outlet should be the same width as the pond. Any of the tested modifications of a simple dam at pond outlets improved aeration. A flat rack with its upstream edge on top of the dam was one of the most effective aeration devices. Screen areas sufficient to provide 1 square foot of usable (underwater) screen for each 25 gallons per minute flow are recommended.
Three aspects of the design of rectangular hatchery ponds, i.e., water circulation, water aeration and screen area were investigated and the results are presented under these topics. Several minor features of pond design are also discussed.
WATER CIRCULATION
The study of pond circulation was based on statements of 0. R. Kingsbury, both in his paper (1951) and in private conversations. Briefly, he believes that the potential production of a trout hatchery may be esti-mated on the basis of the supply of spring water, and that production should be at least 40 pounds per year per gallon per minute of the spring-water supply. Further, the required pond space for this production may be estimated according to the rule that each cubic foot of rearing space should produce at least 2 pounds of trout per year. Kingsbury's data apply specifically only to ponds 2 feet deep.
Kingsbury also believes that in order to attain this production it is essential for the rearing facilities to be so designed that, in a given unit, each cubic foot of water is as nearly as possible like each other cubic foot. This requires ponds of essentially uniform depth with straight sides. It also requires an even flow of water through any cross section of the pond. With good fish-cultural practices, if the requirements of good circulation and even depths are met, the fish will use all parts of the pond equally, the tendency for different habits in various parts of the pond will be elimi-nated, growth will be at a maximum, and even growth of all fish will be promoted.
Poor water circulation in hatchery ponds probably has many physio-logical and biological effects on fish. Two effects on the water chemistry have been observed. First Brockway, personal communication and as reported by Phillips et al. (1949), studied the accumulation of metabolic products, as measured by ammonia, in series of ponds. In addition to a
A contribution of Federal Aid in Fish and Wildlife Restoration Project F-1 I-R. 2 Now a graduate student at Cornell University.

HATCHERY POND DESIGN —Haskell, et al. 113
general increase in the concentration of ammonia as tests were made from the head to the foot of the series, he found spots in each pond where the concentrations were higher than average. He termed these "hot spots", and concluded that they were almost certainly caused by uneven circulation of the water.
A second example of the effect of poor circulation was observed at the conclusion of the series of pond-aeration tests reported here. After a good means of increasing aeration had been developed, such a device was installed on the dam at the foot of one of the large "Bath" type ponds—a type of pond in which the circulation is poor. Oxygen levels were measured above and below the dam both with and without the device in place. On successive trials the measured rise in oxygen as water passed over the dam varied erratically from 0 to 0.5 p.p.m. and no difference could be correlated with the presence of the aeration device. In order to study this phenomenon, a series of oxygen samples were taken, all above the dam and about 1 foot upstream from it. Three duplicate samples were taken at the water surface, one on either side of the 6-foot spillway and one in the center. Corresponding samples were also taken from points 2 feet below the water surface. These samples varied errati-cally, the maximum observed difference being 0.7 p.p.m. Evidently the uneven water circulation caused greater depletion of the oxygen in those parts of the pond where the circulation was poorer.
It appears quite possible that the differences in ammonia accumula-tion and oxygen depletion due to poor circulation may be important deterrents to optimum growth and health of fish.
Four types of rearing ponds are in use in New York State fish hatcheries.
1. "Bath" type (Figures 1 and 2). Two sizes are in use. One is approximately 50 feet long by 15 feet wide by 2 feet deep and the bottom is flat except for a slope of about 3 inches from end to end. Its volume is 1,250 cubic feet. The other is of the same proportions but considerably larger, being 100 feet long, 30 feet wide and 3 feet deep with a volume of 7,100 cubic feet.
2. "Rome" type (Figure 3). The dimensions are the same as in the Bath type, and except for the inlet and outlet the two are identical. The Bath type is "throated" at the ends with 3-foot spillways, while the Rome type with three spillways at the inlet and at the outlet approaches a design in which the inlet and outlet would occupy the entire width of the pond.
3. "Dirt" ponds. These are 60 feet long by 12 feet wide by 15 inches deep. They have sloping sides and the inlets and outlets are 3 feet wide. The cross section of these ponds is that com-monly called "dish-shaped".
4. Circular ponds. This type was not included in this study.

114 NEW YORK FISH AND GAME JOURNAL, VOL. 7, No. 2, JULY 1960
Figure 1. Pattern of water circulation in small "Bath" type hatchery pond as indi-cated by dyed inflow. Sequence is from top to bottom; waterflow, from right to left.

HATCHERY POND DESIGN—Haskell, et al. 115
Figure 2. Pattern of water circulation in large "Bath" type hatchery pond as indi-cated by dyed inflow. Sequence is from top to bottom; waterflow, from right to left. (Scale two-thirds that of Figure I.)

116 NEW YORK FISH AND GAME JOURNAL, VOL. 7, No. 2, JULY 1960
Figure 3. Pattern of water circulation in "Rome" type hatchery pond as indicated by dyed inflow. Sequence is from top to bottom; waterflow, from right to left. (Scale same as that of Figure 1.)
Tests were made in each of the first three types to determine the water circulation. For this, fluorescein dye was mixed with water and poured evenly across the foot of the pond above the test pond. During the time required for the fluorescein to pass through the test pond, colored photo-graphs were taken at intervals. The results for the small Bath type pond are given in Figure I, for the large Bath type pond in Figure 2, and for

HATCHERY POND DESIGN—Haskell, et al. 117
the Rome type in Figure 3. Examination shows clearly that the Rome type most nearly approached an even circulation, and the conclusion seems warranted that, for best circulation in this type of pond, the inlet and outlet should be the full width of the pond.
Historically, it is interesting that rearing races 4 feet wide, about 30 feet long and 1 foot deep, were in the 1920's and 1930's found very unsatis-factory for small fingerlings. The inlets and outlets were about 1 foot wide. Recently the same type of raceway, but with an inlet and outlet of full width, has proven very satisfactory.
In the study of the large Rome type pond, it was repeatedly noted that the fluorescein, as it entered the pond, always moved toward the right side. It was finally discovered that a large valve, on a by-pass line which was located in the spillway on the left side just below the dam, so obstructed the water as to direct the flow to the right. By putting the boards in another slot below the valve the effect of the valve was reduced and the fluorescein went down the center of the pond. The circulation obtained was no more even than before, but at least it was symmetrical with respect to the pond width since the major current was in a narrow strip down the center. The obvious conclusion is that, for even circulation, one of the requirements is that spillways at the inlet and outlet should be symmetrical and free of obstructions.
No results from the dirt type pond are given because the photographs were poor. However, the circulation was, if anything, poorer than for the other types.
WATER AERATION
In a series of rearing ponds, in which the water is used several times, the oxygen content of the water often is a limit of capacity. The oxygen content in the lower pond of the series depends on (1) the oxygen of the water supply feeding the head of the series, (2) the amount of oxygen removed by the fish and (3) the amount of oxygen added to the water by aeration as it passes from pond to pond. Since, ordinarily, the dis-solved oxygen in the water supply is not controllable, maintenance of adequate oxygen in the lower ponds of the series depends primarily on the aeration which occurs as the water falls over the dams at the end of each pond. It is, therefore, of great importance that the dams be de-signed to produce the maximum aeration possible.
This problem was suggested by low oxygen in certain ponds at the Rome Hatchery. In a series of four ponds with only 4 inches fall from pond to pond, the aeration was known to be small. These ponds were about 15 feet wide. They had three spillways at the inlet, each 40 inches wide, so that the total dam length was 10 feet (Figure 3). The flow through the pond series was 500 gallons per minute. Two similar series side by side fed into the head of a series of four ponds (Figure 2) in which
118 NEW YORK FISH AND GAME JOURNAL, VOL. 7, No. 2, JULY 1960
the flow was, therefore, 1,000 gallons per minute. This lower series of four ponds had only 8 inches drop between ponds. They had single 6-foot spillways at the inlets and outlets. Annually in September, with high temperatures and heavy fish loads, the oxygen content of the water in the last pond was very low. The problem was whether changes in the dams would increase the aeration. Three questions needed to be answered.
1. In the upper ponds would the aeration be better or worse if the flow were confined in one spillway instead of three?
2. Would flat screens on top of the dams in the upper ponds reduce or increase the aeration?
3. Would some modification of the dams in the lower ponds increase the aeration?
Tests were made at the outlet dams to evaluate variables including (1) height of fall, (2) depth of water below the dam, (3) flow per unit length of dam and (4) devices added to the dam either to increase aeration or for some other purpose, such as screens or racks at the crest to prevent fish jumping over the dam.
METHODS
During July and August of 1958, one of the water supplies (lake water) of the Rome Hatchery had an oxygen content of about 4 p.p.m. Using this supply and a rectangular concrete pond, a series of tests were made in which the fall, depth of water below the dam, and flow per unit length of dam were varied. The efficiency of aeration was determined from the increase in oxygen as the water passed over the dam, as measured by comparing the oxygen content of the water above and below. After a considerable number of tests had been made, it was found that the aeration provided by a single fall was so small that the differences between the effects of 6-inch and 12-inch falls could not be measured with enough accuracy to be of use. The results, therefore, indicated general trends, but provided no reliable detailed information.
To increase the accuracy of the measurements, a modification of these tests was conducted using an oxygen atmosphere over the dam in-stead of air. A dam, 1 foot in width, was built in a hatchery raceway, with provision for varying the height of fall, the depth of water below the dam, and the flow. To this was added a hood which covered the dam and an area above and below it, and which dipped into the water on all sides to provide a water seal. In this hood the air atmosphere was re-placed by oxygen. At the beginning of each test, the water level in the raceway was raised so as to flood the hood. Oxygen was then introduced at a rate of 1 cubic foot per minute; the hood had distributed small leaks so that the oxygen flow could escape. This rate of flow was sufficient to change the entire air volume about once every 12 minutes.

HATCHERY POND DESIGN—Haskell, et al. 119
Tests were made with the oxygen atmosphere for varied conditions of fall, flow, depth below dam, etc. Since the percentage efliciency of aeration, in terms of the oxygen content of the water, equals
actual rise X 100
possible rise
these results may be converted to the equivalent values for air aeration by the following two equations.
B — A (1) percentage efficiency = X 100 S — A
percentage efficiency X (S — A) (2) expected rise =
100 in which,
A = oxygen content above dam B = oxygen content below dam S = saturation value
For example, if A = 4 p.p.m., B = 5 p.p.m., and S = 10 p.p.rn., then
5 — 4 percentage efficiency = 10 — 4 X 100 = 16.7
In this hypothetical case the aeration raised the oxygen content of the water 1 p.p.m. or one-sixth of the maximum amount that would be possible with perfect aeration.
Air is approxmately one-fifth oxygen, so that the saturation value for an oxygen atmosphere is 4.85 times that for air. Thus, in the fore-going example, the equivalent aeration in air would be derived from the second equation, in which A = 4 p.p.m., S = 48.5 p.p.m., and per-centage efficiency = 16.7, as follows:
expected rise = 16.7 X (48.5 — 4)
100 = 7.4 p.p.m.
Increasing the value for the rise in oxygen content from 1 p.p.m. to 7.4 p.p.m. by this means results in greater accuracy in determining efficiency. It also permits experiments with water that is high in oxygen by normal standards of air aeration. The results of such experiments may be applied to air aeration by the use of the equations given.
For calculating the results of the experiments, the saturation values listed in Table 1 were used.
The first tests evaluated the efficiency of a simple dam such as is used at the outlet of many hatchery ponds. Although the crest of such a dam is usually shaped according to the edge of the lumber used, all of this series were made with a sharp-edged crest (as used in a weir for measuring waterflow), the crest consisting of the edge of a thin sheet of iron.

120 NEW YORK FISH AND GAME JOURNAL, VOL. 7, No. 2, JULY 1960
TABLE 1. VALUES FOR SATURATION OF OXYGEN AS USED TO DETERMINE EFFICIENCY OF AERATION
Temperature in degrees F. Saturation value (p.p.m.)
Air atmosphere Oxygen atmosphere
45 ............................................................... 12.1 58.7 46 ............................................................... 11.9 57.7 47 ............................................................... 11.8 57.2 48 ............................................................... 11.6 56.3 49 .................. 11.5 55.3 50 ............................................................... 11.3 54.8 51 ............................................................... 11.2 54.3 52 ............................................................... 11.0 53.3 53 ............................................................... 10.9 52.9 54 ............................................................... 10.8 52.4 55 ............................................................... 10.7 51.9 56 ................................................ 10.5 50.9 57 ............................................................... 10.4 50.4 58 ............................................................... 10.3 50.0 59 ............................................................... 10.2 49.5 60 ............................................................... 10.0 48.5
EFFECT OF HEIGHT OF FALL
Tests were made for falls varying from about 3 inches to 12 inches,
and the results are shown in Figure 4. Aeration increases as the fall
increases and appears to be approximately proportional to the fall. Thus
two 6-inch falls are approximately equivalent to one 12-inch fall, and
conversely one 12-inch fall produces twice the aeration of a 6-inch fall.
EFFECT OF DEPTH OF WATER BELOW DAM .
The effect of the depth of water below the dam is shown in Figure 4.
It appears that, for flows of 25 to 100 gallons per minute per foot of dam
length and for falls of 4 to 15 inches, the depth of water below makes
little or no difference. When the depth of water below the dam is zero, or as nearly so as possible, the aeration is very greatly reduced. "Zero"
depth will be discussed later.
EFFECT OF FLOW PER UNIT LENGTH OF DAM
Tests were made using f.cws of 25, 50 and 100 gallons per minute
per foot of dam length. The results are shown in Figure 5. The differ-
ences were not great, so that it seems to matter little whether the flow is
spread over a wide dam or concentrated in a narrow one. A flow of 50 gallons per minute per foot of dam length was somewhat less efficient than 25 or 100. Since the reason seems obscure, this point was checked
repeatedly, and the results were consistent.

121
PERCEN
TAG
E EF
FICIE
NCY
HATCHERY POND DESIGN—Haskell, et al.
. 3.4 '5
3.4
#53
1 0 —
o .3 0 5 2 05.5
111
1 2
1 0
•
a
15
• 11 12
10 • 3.0
• 2.0
• 5 0
• 5.5
• 2.2
• 2.3
1G
DEPTH IN INCHES
Figure 4. Comparative efficiency of aeration for a simple dam in relation to depth of water below dam for three rates of flow: (top) 25 gallons per minute; (middle) 50 gallons per minute; (bottom) 100 gallons per minute. (Figures opposite plotted points represent fall in inches.)

-
,
Si
10
o•fic.o
•
• •
/ • 3.7 • 1.0
10
,•°1411.11
la
leSott,
11.
122
NEW YORK FISH AND GAME JOURNAL, VOL. 7, No. 2, JULY 1960
eo FALL IN INCHES
Figure 5. Comparative efficiency of aeration for a simple dam in relation to height of fall for three rates of flow: (top) 25 gallons per minute; (middle) 50 gallons per minute; (bottom) 100 gallons per minute. (Figures opposite plotted points represent depth in inches of water below dam.)

HATCHERY POND DESIGN—Haskell, et al. 123
MODIFICATION OF A SIMPLE DAM
The remainder of the tests led to the conclusion that any modification
of a simple dam improves aeration. They were made with a flow of 50
gallons per minute, a fall of 8.6 inches, and a 4-inch depth of water below
the dam. These conditions probably are typical of many hatchery situa-
tions where aeration is inadequate. Although the efficiency of a simple
dam was not greatly affected by differences in the rate of flow, over the
range of the tests, it is likely that such differences may considerably affect
the efficiency of some of the modified dams.
ZERO WATER DEPTH BELOW DAM
In the experimental set-up used, it was impossible to get a water
sample below the dam when the water was falling into the empty raceway.
Therefore, to simulate such shallow-water conditions, a small wooden
platform was placed below the dam with its surface A. to 1/2 inch above the water (Figure 6).
Water samples were collected through the board just below where
the water hit it, and aeration was found to be small (Table 2). However, samples taken from the raceway below the board showed a marked in-
crease in oxygen content. Observation indicated that the falling water did not splash as it hit the board, but rather flowed off the board in a
rapid, thin sheet and hit the raceway water with a high horizontal velocity.
Tests confirmed that this motion produced an aeration of up to 14 per cent,
the amount varying with the height of the flat surface above the water
surface below. Having the flat surface about 1/2 inch above the water surface appeared best.
It appeared that any method which would convert the momentum
of falling water into horizontal velocity, shearing the surface of the water
below and creating turbulence, would produce good aeration. Several
arrangements of chutes were tried, and produced values up to 11.7 per cent depending on the exact arrangement. One of these devices is illustrated
in Figure 7.
DEVICES PLACED ON DAM
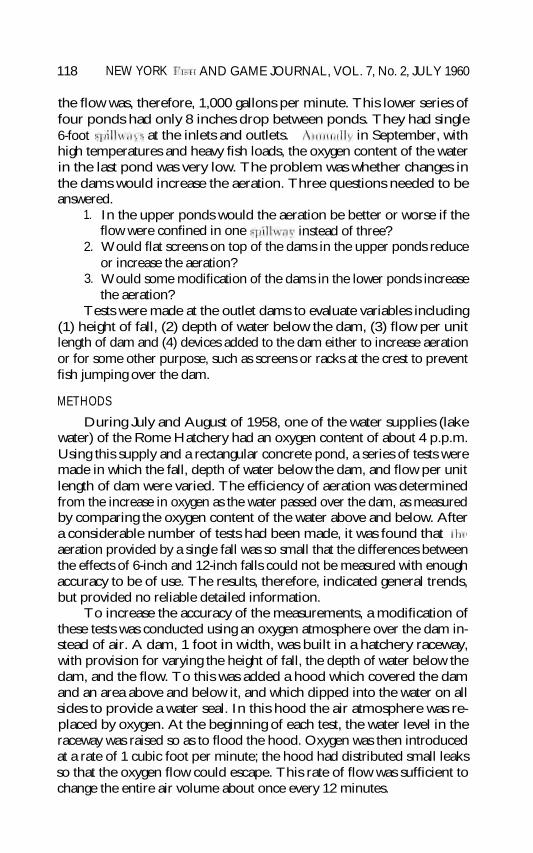
Many hatcheries use a rack or screen placed on top of a dam with one edge over the dam and the remainder extending out level on the
downstream side. These are normally employed to prevent fish from
jumping up over the dam. The efficiency of several such arrangements
(Figures 8-10) as aeration devices was tested. The results are included
in Table 2. The finer the screen the greater the efficiency and, by the
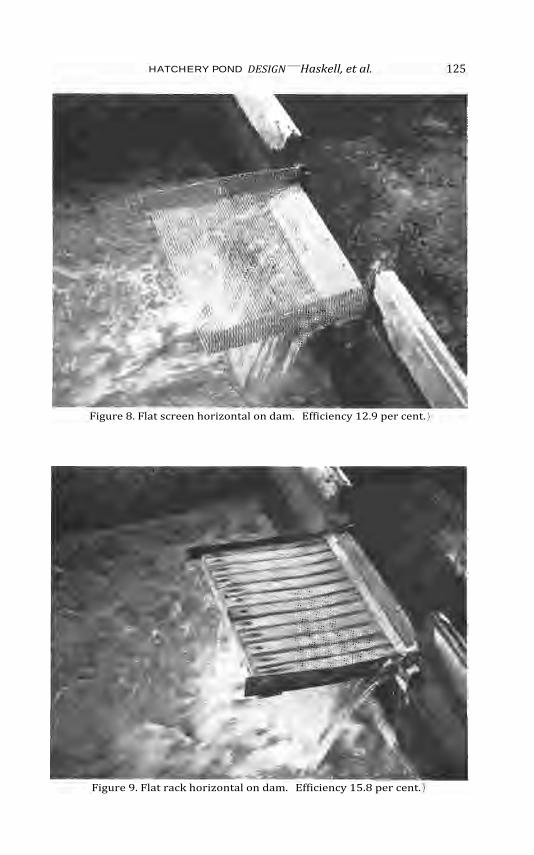
same token, the screens were more efficient when somewhat plugged with dirt. The flat rack with slats spaced 14 inch apart was more efficient
than any of the screens, in fact it was the most efficient device tested. Its
efficiency was 15.8 per cent at a flow of 50 gallons per minute, 17.7

124 NEW YORK FISH AND GAME JOURNAL, VOL. 7, No. 2, JULY 1960
Figure 6. Simple dam with flat board just above water level below dam. (Efficiency 14.1 per cent.)
Figure 7. Chute to produce high horizontal velocity below dam. (Efficiency 11.7 per cent.)
HATCHERY POND DESIGN—Haskell, et al. 125
Figure 8. Flat screen horizontal on dam. (Efficiency 12.9 per cent.
Figure 9. Flat rack horizontal on dam. (Efficiency 15.8 per cent.

126 NEW YORK FISH AND GAME JOURNAL, VOL. 7, No. 2, JULY 1960
Figure 10. Flat board, with holes, on top of dam. (Efficiency 15.6 per cent.)
per cent at 25 gallons per minute, and 14.4 per cent at 100 gallons per
minute. With this type of rack it is important that the slats be wide
enough, in this case 3/4 inch, to prevent the streams of water through
adjacent slots from immediately recombining.
TABLE 2. COMPARATIVE EFFICIENCY OF AERATION FOR VARIOUS MODIFICATIONS OF A SIMPLE DAM *
Efficiency in per cent
6.2 0.5
14.1 11.7 13.7 15.1 12.9 15.8 8.8
15.6 10.8 14.6 12.5
11.0 13.5
Modification
simple dam narrow board just above water level, sample taken through board narrow board below dam chute below dam j8"-inch-mesh flat screen, dirty window screen 1/4-inch-mesh, flat screen flat rack, 1/4-inch spacing flat sheet metal on top of dam flat board with 16 1-inch holes rockpile below dam vertical rack vertical board with four rectangular holes (1 inch wide by 11/2 inches
high) 25/4 inches apart vertical board with four slots 1 inch wide by 31/4 inches high vertical board with seven 1-inch holes
*Waterflow was 50 gallons per minute; height of fall, 8.6 inches; depth of water below dam, 4 inches.

*ow i i. Vertical rack on top (a d‘on i. Efficiency 14.6 per cent.
HATCHERY POND DESIGN—Haskell, et al. 127
It was theorized that, if the horizontal velocity of the water were increased before it started to fall, the aeration might be increased. To test this, a chute or trough was placed on top of the dam to raise the velocity of the water. The resulting efficiency of 8.8 per cent was not impressive.
Another device tested was a flat piece of 3/4-inch plywood placed on top of the dam with 1-inch holes bored through it in sufficient numbers to accommodate the waterflow. This is illustrated in Figure 10. Its efficiency of 15.6 per cent at a flow of 50 gallons per minute was essen-tially the same at a flow of 100 gallons per minute provided the board size was increased and the number of holes made sufficient to handle the increased flow.
Since racks, etc. placed horizontally on top of a dam were effective, tests were made to determine the results with the same devices set on top of the dam vertically (Figures 11-13). In general, they provided quite good aeration, particularly the rack and board with holes which was nearly as effective as when placed horizontally.
ROCKPILE BELOW DAM
In line with the widely accepted theory that "breaking water up" provides effective aeration, a "pile of rocks" was placed below the dam and the water hit on this while still falling through the air. Its rather

128 NEW YORK FISH AND GAME JOURNAL, VOL. 7, No. 2, JULY 1960
Figure 12. Vertical board, with slots, on top of dam. (Efficiency 11.0 per cent.)
Figure 13. Vertical board, with round holes, on top of dam. (Efficiency 13.5 per cent.)
HATCHERY POND DESIGN—Haskell, et al. 129
low efficiency of 10.8 per cent indicated that this is not a particularly good aeration method, at least in the arrangements used here.
SCREEN AREA
An important factor in pond design is provision for adequate screen area at the head of ponds in a series. Inadequate screen area increases the labor of cleaning enormously and even contributes a hazard to sur-vival of the fish. On the other hand, experience indicates that screen area can be too great, so that debris is not actually drawn to the screen in a degree which facilitates its removal.
The various ponds at the Rome Hatchery, as well as some that have been reconstructed in varied designs, have permitted observations on the efficient screen areas for different degrees of flow. These may be sum-marized briefly. Defining "working screen area" as the area under water during normal conditions, then a good ratio of working screen area to flow is 1 square foot for each 25 gallons per minute. Greater flows per square foot can be tolerated, but in one group of ponds with a flow of 85 gallons per minute per square foot the screen was quite inadequate and required continuous maintenance except under extremely favorable conditions. In another series of ponds, 60 gallons per minute per square foot proved somewhat inadequate.
LITERATURE CITED PHILLIPS, A. M., D. R. BROCKWAY, E. 0. ROGERS, M. BRYANT, H. GOODELL, C. WALKER,
P. FRANK AND H. NEWMAN. 1949. The nutrition of trout. Cortland Hatchery Report No. 17, N. Y. S. Cons. Dept., Albany.
KINGSBURY, 0. R. 1951. Production statistics and costs in relation to fish hatcheries. Trans. Am. Fish. Soc. 80: 148-153.

USE OF CLOSED CONIFER PLANTATIONS BY WILDLIFE'
James A. Bailey
Maurice M. Alexander
Graduate Assistant in Forest Zoology State University College of Forestry at
Syracuse University
Assistant Professor of Forest Zoology State University College of Forestry at
Syracuse University
ABSTRACT
To obtain specific data on the relationship of wildlife to conifer plantations a sum-mer study was made of the birds and mammals in a 256-acre closed plantation of red pine, white pine and Norway spruce on the Tully Forest. Ruffed grouse was the principal game species. Chickadees, robins, black-throated green warblers and tow-hees were common in the plantation. Information was also gathered on various mammals including deer and cottontail rabbits.
Grouse used the outer 5 chains of the plantation as long as other good habitats adjoined it. Where old hedgerows, scattered apple trees, hardwood clumps or brushy openings occurred within the plantation, grouse were found in the vicinity. There was a tendency for the grouse to use the plantation more during the middle of the day and at night, but to move to surrounding habitats during the morning and late afternoon.
Results support the principle that, where game is an important consideration, large plantations of conifers should be broken up with openings that will provide an interspersion of brushy cover.
Large areas of pure, dense, conifer plantations with closed canopies have been severely criticized as wildlife habitat. Most criticism has been based largely on general observation, the actual value of such plantings to wildlife having received little intensive investigation. This paper is the result of a field study of closed conifer plantations as wildlife habitat.
Reforestation with coniferous species was one of the earliest forest practices given wide application in the United States. Although the planting of large areas was most pronounced between 1934 and 1938 as influenced by the work of the Civilian Conservation Corps, a resurgence is now occurring which is being greatly accelerated by the Soil Bank program. For instance, in New York, the production of conifer seedlings in State-operated nurseries is expected to be about 60 million by 1961.2 This total will exceed the number distributed during 1935, a peak year of Civilian Conservation Corps activity (Baar, 1956). Similar trends are evident in other eastern and midwestern states.
It is apparent that the conifer plantation will be a major forest ele-ment in the United States for at least several decades. Eventually, some of these on the heavier soils will be converted to hardwood stands; but most of those on the lighter soils, which are better suited to the production of conifers, will be retained as coniferous stands. With an increased
The authors acknowledge the assistance given by members of the faculty and graduate students of the Department of Forest Zoology and by the staff of the Tully Forest throughout the project.
2 E. J. Eliason, N. Y. S. Cons. Dept., personal communication, 1957.