nov 05, 2014 blue bird - pt trimegah sekuritas indonesia tbk filept trimegah securities tbk -...
TRANSCRIPT

COMPANY FOCUS PT Trimegah Securities Tbk - www.trimegah.com 1
Best taxi company in Indonesia, possibly in Asia
We initiate Blue Bird Taxi (BIRD) with a Buy rating and a Rp8,300
target price. BIRD is the largest taxi company in Indonesia (nearest
competitor is less than half the size) by far has the best reputation
among locals and tourists alike. It should benefit from rising middle
income group in Indonesia, potential growth in trade and tourism,
and government’s plan to improve infrastructure. Blue Bird is sched-
uled to start trading on 5 Nov at Rp6,500/share, which implies a
15.3x 2015PE and 12.6x 2016PE.
Concerns abound, but already reflected in share price
We have concerns over the fair value of land to be bought from
insiders using IPO funds and continuing legal disputes by other fami-
ly members, but we view BIRD’s current valuation to have sufficient-
ly reflect those concerns (initial IPO range was Rp7200-9300). We
expect earnings to grow at 16% CAGR in 2015-18 on the back of
8% fleet CAGR and higher fleet utilization rate in later years.
Use of IPO proceeds
The Rp2.4tr received from IPO will be used for: 1) 53.0% (~Rp1.3tr)
to pay debt, and 2) 47.0% (~Rp1.1tr) for expansion; consisting
~Rp720bn for fleets and ~Rp412bn for land acquisition. Blue Bird
plans to buy several land areas, scattered in Jakarta and Medan,
totaling to 63,660sqm worth Rp392.7bn from several members of
director and commissioner (affiliated parties) or Rp6.2mn per sqm.
Buy with TP of Rp8,300/sh (+28% up side)
Blue Bird’s IPO price at Rp6,500 is equivalent to 14PE of 19.4x,
based on our calculation. Hence, we are applying 15PE target same
as the IPO PE of 19.4x to arrive at our target price of Rp8,300/sh
(+27.7% upside).
The biggest taxi operator in Indo-
nesia with 17 area coverage and
30.4% market share. It owned
21,756 regular taxi as of Dec’13.
Share Price Rp6,500
Sector Transportation
Price Target Rp8,300 (28%)
Year end Dec 2012 2013 2014F 2015F 2016F
Sales (Rpbn) 3,099 3,921 4,908 6,351 7,355
Net Profit (Rpbn) 118 708 840 1,064 1,286
EPS (Rp) 47 283 336 425 514
EPS Growth (%) 98.0 500.1 18.8 26.7 20.8
DPS (Rp) - 17 - 134 170
BVPS (Rp) 392 455 1,754 2,045 2,389
P/E (x) 137.9 23.0 19.4 15.3 12.6
Div Yield (%) - 0.3 - 2.1 2.6
Blue Bird Company Focus
BUY Rp8,300
Maria Renata
Nov 05, 2014
Reuters Code BIRD.JK
Bloomberg Code BIRD.IJ
Issued Shares (m) 2,527
Mkt Cap (Rpbn) 16,426
Avg. Value Daily 6 month (Rpm)
na
52-Wk range na
Pusaka Citra Djokosoetono 36.8%
Purnomo Prawiro 9.5%
Public 14.8%
EPS 14F 15F
Consensus (Rp) na na
TRIM vs Cons. (%) na na
Initiate with 28% upside
Company Update
Stock Data
Major Shareholders
Consensus
Stock Price
Companies Data

PT Trimegah Securities Tbk - www.trimegah.com COMPANY FOCUS 2
Industry and company outlook
Company in brief
PT Blue Bird Tbk (BIRD) started its commercial operation in 2001 as part of the Blue Bird Group
(BBG). The business scope includes taxi operator such as regular taxi and executive taxi, car, and bus
rental. BBG operates in 17 areas across Indonesia consisting 61 pools in which 44 of them are located
in Greater Jakarta Area (Jadetabek) and the remaining are scattered in Medan, Pekanbaru, Padang,
Batam, Palembang, Cilegon, Bandung, Semarang, Solo, Yogyakarta, Surabaya, Bali, Lombok, Balikpa-
pan, Manado, and Makasar. Market shares for Blue Bird taxi stood at 30.4% for Indonesia and 37.3%
for Greater Jakarta as of Dec’13. By Apr’14, Blue Bird operated 23,932 regular taxis, 1,252 executive
taxi, and still had un-used of 7,504 regular taxi licenses and 68 executive taxi licenses, and operated
4,524 car rental, and 590 units of bus.
The company has four core business:
1. Regular taxi: Providing regular taxi services under two brands: 1) Blue Bird Taxi, and 2) Pusaka
Taxi; which are available in 13 areas in Indonesia with major fleets are located in Jakarta, Suraba-
ya, and Bali. Regular taxi contributed 79.5% to consolidation revenues from 21,756 fleets owned
as of Dec’13.
2. Executive/premium taxi: Through its subsidiary, Silver Bird (99.01% shares), providing execu-
tive taxi under brand of “Silver Bird”. The company owned 1,177 executive taxis as of Dec’13 with
revenues contribution accounted for 6.7% to revenue.
3. Car rental or limousine: Through its subsidiary, Pusaka Prima Transport (99.67% shares), the
company provide car rental with or without the driver for daily use or long term rent, under the
brand of “Golden Bird”. The company owned 4,488 units of car rental by end Dec’13 and gave
9.1% revenues contribution in Dec’13.
4. Bus rental: Providing bus for rent under “Big Bird” brand through its subsidiary, Big Bird Pusaka
(99.12% shares). The company owned 612 unit buses as of Dec’13, which generated 4.7% of
FY13 revenues.
Figure 1. Service area coverage
Source: Company

PT Trimegah Securities Tbk - www.trimegah.com COMPANY FOCUS 3
Figure 3. Blue Bird's subsidiaries through direct ownership
No. Name Date of acquisition Business Established Shares
1 PT Silver Bird (SLB) 28-Nov-12 taxi 1992 99.01%
2 PT Pusaka Nuri Utama (PNU) 28-Nov-12 taxi 1997 97.77%
3 PT Big Bird Pusaka (BGP) 28-Nov-12 bus rental 2000 99.12%
4 PT Lombok Taksi Utama (LTU) 28-Nov-12 taxi 1999 99.01%
5 PT Lintas Buana Taksi (LBT) 28-Nov-12 taxi 1994 99.42%
6 PT Pusaka Satria Utama (PSU) 28-Nov-12 taxi 2000 99.58%
7 PT Morante Jaya (MRT) 28-Nov-12 taxi 1971 99.27%
8 PT Cendrawasih Pertiwijaya (CPJ) 28-Nov-12 taxi 1996 99.38%
9 PT Prima Sarijati Agung (PSA) 28-Nov-12 taxi 2000 99.03%
10 PT Irdawan Multitrans (IMT) 28-Nov-12 taxi 1994 99.06%
11 PT Central Naga Europindo (CNE) 28-Nov-12 taxi 2001 99.72%
12 PT Luhur Satria Sejati Kencana (LSK) 28-Nov-12 taxi 1997 99.01%
13 PT Pusaka Prima Transport (PPT) 28-Nov-12 car rental 2001 99.67%
14 Praja Bali Transportasi (PBT) 28-Nov-12 taxi 1994 99.67%
15 PT Blue Bird Pusaka (BBP) 28-Nov-12 taxi 2000 99.01%
Source: Company
Figure 2. Four core business
Source: Company
Figure 4. The number of Blue Bird Group fleets
(as of Dec) 2009 2010 2011 2012 2013 Apr'14
Blue Bird or Pusaka (regular taxi) 11,558 12,992 15,170 17,916 21,756 23,392
Silver Bird (executive taxi) 800 737 779 939 1,177 1,252
Golden Bird (limousine or car rental) 2,483 2,769 3,671 3,990 4,488 4,524
Big Bird (bus rental) 404 446 478 515 612 590
Total 15,245 16,944 20,098 23,360 28,033 29,758
Source: Company

PT Trimegah Securities Tbk - www.trimegah.com COMPANY FOCUS 4
The training center
Blue Bird Group owns 3 training centers; two are located in Jakarta and one is in Tangerang. Blue Bird
conducted more than 2,640 sessions of training during 2013 for driver of regular taxi and rental car
and bus, and more than 200 sessions of training was provided for executive taxi driver in Jakarta.
Partnership and incentive
Driver’s compensation consists of: commission, bonus, and incentives. Company implements payment
scheme to driver based as a commission which is calculated from total revenues obtained. The drivers
have option to join car ownership program, in which they have an option to buy the taxi when compa-
ny decided not to use that taxi anymore.
Competitor
BIRD’s closest competitor in regular taxi is Express Taxi (TAXI), while for car rental business is TRAC,
and HIBA Utama for bus rental. Based on data from Euromonitor, as of Dec’13, Blue Bird owned
30.4% of taxi market shares in Indonesia, while in terms of numbers of vehicle, company stands at
the fifth biggest car rental company, and the seconds biggest bus rental.
Figure 5. Operational license as of Apr’14
No. Name Status No of license Taxi operate Idle license
Regular taxi
1 Blue Bird Company 7,111 5,328 1,783
2 Blue Bird Pusaka Subsidiary 2,640 1,458 1,182
3 Cendrawasih Pertiwijaya Subsidiary 2,650 1,950 700
4 Central Naga Europindo Subsidiary 5,300 4,748 552
5 Irdawan Multitrans Subsidiary 650 450 200
6 Lintas Buana Taksi Subsidiary 2,585 2,098 487
7 Luhur Satria Sejati Kencana Subsidiary 1,800 1,500 300
8 Lombok Taksi Utama Subsidiary 200 200 -
9 Morante Jaya Subsidiary 2,100 1,151 949
10 Pusaka Nuri Utama Subsidiary 1,700 1,200 500
11 Prima Sarijati Agung Subsidiary 2,200 2,100 100
12 Pusaka Satria Utama Subsidiary 1,500 999 501
13 Praja Bali Transportasi Subsidiary 1,000 750 250
Total 31,436 23,932 7,504
Executive taxi
14 Silver Bird Subsidiary 1,320 1,252 68
Bus rental
15 Big Bird Pusaka Subsidiary 700 590 110
Car rental
16 Pusaka Prima Transport Subsidiary 300 4,524 na
Source: Company

PT Trimegah Securities Tbk - www.trimegah.com COMPANY FOCUS 5
Regular taxi services
The Company provides services for regular taxi under two brands: Blue Bird and Pusaka that operates
in 13 areas in Indonesia: Jadetabek, Bali, Bandung, Batam, Cilegon, Lombok, Manado, Medan, Pa-
dang, Palembang, Pekanbaru, Semarang, and Surabaya. Cars used for Pusaka Taxi also have Blue
Bird’s attributes as facility to customers for identifying the taxi as a part of the group.
Blue Bird regular taxi is using Toyota Limo
Most of the Company’s vehicles are bought from Astra International (ASII), Mercedes Benz Indonesia,
and Nissan Motor. Most of regular taxi uses Toyota Limo while some uses Nissan Almera. Toyota Limo
is a variant from Toyota Vios, all regular taxis are using 1,500cc powered cars. It could take a year to
book fleets until the fleets are sent to the pools due to massive order and car modification. As of
Apr’14 around 75% of company’s fleets are using car released on 2011 forward.
In Mar’14, company has ordered 1,899 units of Toyota Limo in which 475 of them was sent to the
Company by Apr’14. Additionally, BIRD has ordered 1,000 units of Nissan Almera, in which 500 of
them has been received in Apr14.
Figure 6. Regular taxi
Unit 2009 2010 2011 2012 2013 Apr'14
No of fleets by YE Unit 11,558 12,992 15,170 17,916 21,756 23,932
Revenue generated Rp mn 1,511,905 1,756,064 2,019,093 2,439,178 3,116,590 1,195,963
Revenue per taxi per day Rp 476,006 490,982 488,240 517,917 557,969 583,853
Source: Company
Luxury car for Silver Bird
Blue Bird’s executive taxi, Silver Bird, fleet uses several type of luxury car such as: Mercedes Benz
C200 CGI & C230 elg & E200 CGI & E200 K, Toyota Vellfire, Toyota Alphard & Toyota Camry Altis. Sil-
ver Bird is primarily conceived to accommodate all sorts of executive needs from airport transfers to
chauffeuring for VIPs and dignitaries. They can be found mostly at four- and five-star hotel around
Jakarta and Surabaya as well as at the Soekarno-Hatta International Airport and Juanda International
Airport.
Figure xxx. Executive taxi or Silver Bird
Figure 7. Executive taxi or Silver Bird
Unit 2009 2010 2011 2012 2013 Apr'14
No of fleets by YE Unit 800 737 779 939 1,177 1,252
Revenue generated Rp mn 125,016 169,005 183,159 213,974 261,458 87,522
Revenue per taxi per day Rp 612,719 765,334 814,617 874,973 971,945 938,670
Source: Company
Average revenue per taxi per day
The Company’s revenue is strongly depended on “average revenue per taxi per day”, which is backed
by occupancy rate for each taxi owned by the Company. BIRD calculates the occupancy rate based on
a percentage of mile journey made by passengers. Executive taxi provides higher average revenue
per taxi per day than regular taxi. However, direct cost for executive taxi is higher than regular’s
backed by type of the vehicle which cause higher fuel cost. The luxurious cars are not allowed to use
subsidized fuel and it consumes more fuel than regular cars.

PT Trimegah Securities Tbk - www.trimegah.com COMPANY FOCUS 6
To accommodate all vehicles owned, Blue Bird operates 61 pools that is scattered in its services area.
Around 80% of regular taxi operate in Jadetabek area, hence, 44 pools owned are located in
Jadetabek area. However, Blue Bird’s utilization rate stands at ~70-73% for regular taxi and ~62%
for executive taxi, due to delay on delivery from car manufacturer, maintenance, and driver availabil-
ity.
Figure 9. Average fleets operates and utilization rate
2009 2010 2011 2012 2013 Apr'14
Avg number of fleet operates
Regular taxi Unit 8,702 9,799 11,330 12,903 15,303 17,070
Executive taxi Unit 559 605 616 670 737 777
Utilization rate
Regular taxi % 75.3% 75.4% 74.7% 72.0% 70.3% 71.3%
Executive taxi % 69.9% 82.1% 79.1% 71.4% 62.6% 62.1%
Source: Company
Figure 10. Pools breakdown
2009 2010 2011 2012 2013 Apr'14
Jadetabek 17 18 20 32 44 44
Non-Jadetabek 10 11 12 13 17 17
Total 27 29 32 45 61 61
Source: Company
Business for car rent and bus rent
Contract for rental cars and busses are made specifically for every customer based on the specifica-
tion required by customer, such as: type of vehicle, number of vehicle, rental duration, etc. Rental
tariffs are reviewed periodically and are not regulated by government regulations. Most of company’s
clients are institutional customers with long term contract.
Figure 8. Bus rental (Big Bird)
Unit 2009 2010 2011 2012 2013 Apr'14
No of fleets Unit 404 446 478 515 612 590
Revenue per bus Rp mn 74,741 80,850 100,021 139,926 185,921 67,610
Source: Company

PT Trimegah Securities Tbk - www.trimegah.com COMPANY FOCUS 7
Fixed assets
Currently Blue Bird operates 61 pools which are directly owned and under lease. Blue Bird owns
197,469sqm of land area, while the remaining is under leasing scheme that consist of: 1) 14,198sqm
of land is leased from independent parties, 2) 157,765sqm of land is leased from affiliated parties,
and 3) 43,608sqm is leased from third parties.
Intangible assets – intellectual property rights
The company owns property rights for 5 brands which are registered under the Company’s subsidiary,
Pusaka Citra Djokosoetono (PCD), they are: 1) Blue Bird, 2) Silver Bird, 3) Golden Bird, 4) Big Bird,
and 5) Pusaka. Based on agreement with PCD, the members of Blue Bird Group are permitted to use
the brands based on a contract which has 10 year duration and automatically be extended for more
10 years until a condition terminate the agreement. Up until 24 Jul’23, a subsidiary that used the
brand needs to pay no royalty to PCD as the brands holder, but after that the royalty charge is 2%
from net revenue, which will be paid yearly at the end of the year. PCD will recalculate the royalty
charge for every 15 years that the next review will be occurred in 2028.
Capex and depreciation scheme
Capex is used for purchasing vehicles (for taxi and rental), pools acquisition, and develop mainte-
nance center. All vehicles are recorded under fixed assets accounts and depreciation expenses are
calculated based on straight line method. Based on company’s regulation, economic life for car (taxi
and car rental) is set at 5 year with 40% of the acquisition value accounted as salvage value.
Resell of used fleets
Periodically, the Company will conduct a rejuvenation of vehicles when vehicle used has reached age
of 3-5 years. Funds obtained from resells of used vehicles have significant contribution to BIRD’s cash
flow. Historically, value of resells of the vehicle is higher than its book value, backed by the car condi-
tion and nature of car market in Indonesia.

PT Trimegah Securities Tbk - www.trimegah.com COMPANY FOCUS 8
Figure 12. Ratio fleets and driver available (driver/fleets)
2009 2010 2011 2012 2013 Apr'14
Blue Bird or Pusaka (regular taxi) 1.30 1.40 1.30 1.32 1.31 1.26
Silver Bird 1.78 2.00 1.85 1.46 1.15 1.09
Golden Bird 0.47 0.46 0.41 0.41 0.49 0.45
Big Bird 0.84 0.77 0.74 0.74 0.65 0.67
Source: Company
Figure 11. Number of driver
(as of Dec) 2009 2010 2011 2012 2013 Apr'14
Blue Bird or Pusaka (regular taxi)
Jadetabek 11,828 14,096 15,051 18,379 22,115 23,419
Non - Jadetabek 3,208 4,132 4,727 5,253 6,424 6,826
Silver Bird 1,425 1,472 1,438 1,372 1,358 1,361
Golden Bird 1,167 1,268 1,519 1,644 2,185 2,042
Big Bird 339 345 353 382 400 393
Total 17,967 21,313 23,088 27,030 32,482 34,041
Source: Company
The driver availability is very important for company operational. Ratio driver-to-fleets-owned for reg-
ular taxi stands stable at ~1.3 for the past 5 years, indicating that the Company may operate the ad-
ditional fleets from expansion backed by the driver availability. Ratio below 1 for Golden Bird indicates
that most of the customer asked for car rent services only, excluding the driver. Meanwhile, for Big
Bird the ratio indicates that not all busses could be operated due to lack of driver. However, the ratio
has not reflect the number of operation fleet properly due to car in maintenance and driver’s joining
time.
Numbers of driver
Numbers of drivers as of Apr’14 stood at 34,041 driver, up from 32,482 drivers at the end of 2013.
The Company put a standard for driver recruitment, driver candidates must have driving license and
pass several tests related with driving skills, medical check-up, knowledge of the streets and places,
attitude, personal character and manner, and emotional stability. After passing all the exams, all can-
didates will have 3 months of probation period. The candidate will become a driver partner after pass
the probation period, historically the pass rate is ~30%-40%. The drivers have the opportunity to
move their services based on their pretension and experiences. However, especially for executive taxi,
the driver must come from internal group, not through new recruitment.
Driver’s working time
Regular taxi drivers provide services based on daily shift. There are 2 option of shift: 1) morning shift;
driver operates taxi from 3a.m. to midnight, and 2) night shift; from 2p.m. to midday on the day af-
ter. The drivers work for two days in a row and have one day off after that. Company gives flexibility
to the driver to determine their working hours.

PT Trimegah Securities Tbk - www.trimegah.com COMPANY FOCUS 9
Industry
Demand for taxi, car rental, and bus rental are strongly influenced by several factors: 1) macroeco-
nomic of Indonesia, such as: GDP growth, urbanization, consumer’s income and consumption, 2) con-
dition of infrastructure especially public transportation, 3) regulation of private car ownership, and 4)
tourism.
Licenses needed
There are two types of license that must be obtained for operating the business.
1. Business license; Its corporate license as an taxi operator
2. Operational license; or the taxi license. The permit that is needed for any taxi that operates.
This license is attached to specific vehicle.
Taxi license obtained from local government through auction
For running the business, BIRD must obtain taxi licenses from regulator and provide the fleet, includ-
ing competent drivers. The Company obtained the license from local government where the taxi is op-
erated through an auction or tender offer. For granting the license, government has several consider-
ations such as: BIRD’s financial condition, size of fleets, number of driver, number of pool and pool
facility, and type of vehicle used for taxi.
Figure 13. Number of license owned
(as of Dec) 2009 2010 2011 2012 2013 Apr'14
License currently owned
Regular taxi (Blue Bird and Pusaka) 13,205 14,555 19,255 29,816 31,211 31,436
Executive taxi (Silver Bird) 1,220 1,220 1,220 1,220 1,320 1,320
Total 14,425 15,775 20,475 31,036 32,531 32,756
Airport taxi
Regular taxi (Blue Bird and Pusaka) 230 378 378 403 652 652
Source: Company

PT Trimegah Securities Tbk - www.trimegah.com COMPANY FOCUS 10
Tariff for regular taxi and executive taxi are subjected to local government’s regulation
Organda (Organisasi Angkutan Daerah or organization of local public transportation) for each region
will propose a tariff for public transportation for being approved and implemented by the government.
Government implements 2 types of tariff for regular taxi: “tariff atas” (ceiling price) and “tariff
bawah” (floor price). Both tariffs have ~20% spread. Even though Blue Bird adopts the ceiling price,
company’s brand awareness makes company surviving the business. Blue Bird’s closest operator,
TAXI, implements the floor price with number of fleets reaches ~10,000 units or less than half of the
company’s fleets. Meanwhile, for executive tariff, company implements different tariff based on type
of the car is used.
Current tariff has been used since Sep’13
The current tariff used in Jadetabek area for regular taxi has been implemented by Blue Bird since 1
Sep’13, following the fuel price hike in 22 Jun’13. Passengers are subjected to three types of charges:
1) flag-fall tariff, which stands at Rp7,000, 2)tariff per km; reaches Rp3,600/km, and 3) waiting time
tariff; at Rp42,000/hour. The tariff hikes and time implementation are different for each region.
Figure 14. Blue Bird's closest competitor tariffs are ~20% cheaper
Type of tariff Unit Blue Bird Express Taksi (TAXI) Blue Bird vs. TAXI
Flag fall fixed rate 7,000 6,000 16.7%
Tariff per km Rp/km 3,600 3,000 20.0%
Waiting time Rp/hour 42,000 36,000 16.7%
Source: Company
Figure 15. Tariff for Blue Bird’s fleets since 1 Sep’13 (Jadetabek area)
Regular fleets Executive Taxi Silver Bird)
Previous 1 Sep'13 Growth Previous 1 Sep'13 Growth
Flag fall fixed rate 6,000 7,000 16.7% 6,000 7,000 16.7%
Tariff per km Rp/km 3,000 3,600 20.0% 3,000 3,600 20.0%
Waiting time Rp/hour 30,000 42,000 40.0% 30,000 42,000 40.0%
Source: Company

PT Trimegah Securities Tbk - www.trimegah.com COMPANY FOCUS 11
Financial overview
Revenue
Company’s net revenue consists 3 contributor: 1) Taxi revenues (regular taxi and executive taxi).
Revenue from taxi business accounts for ~86% of net revenues. The amount is calculated based on
passenger’s transactions through cash, voucher, and payment; 2) Limousine (car rental) and bus
rental, which accounts for ~14% of net revenues. Approximately 37.5% of bus rental revenue is in
USD; 3) Surcharge revenue; is additional revenues generated form additional tariff charged at ob-
taining the passengers from airport.
Figure 16. Revenue breakdown
Source: Company
Taxi86%
Rental (car and
bus)
13.8%
Surcharges
0.2%
2013
Taxi86%
Rental (car and
bus)
13.5%
Surcharges
0.2%
2014
Blue Bird’s revenue grew by 21.1% CAGR09-14 backed by more regular taxi fleet (+16.4%CAGR09-
14) and higher tariff. In FY13, regular taxi contributed ~79% to revenue, followed by car and bus
rental (14%), executive taxi (7%), and surcharge (0.2%). We expect revenue to grow by +13.2%
CAGR15-18, backed by unchanged tariffs and gasoline prices.
Regarding the government plans to increase gasoline price, we assume the new Premium price at
Rp9,000/lt (now: Rp6,500/lt) and Solar at Rp8,000/lt (now: Rp5,500/lt). Hence, we expect the com-
pany will increase its tariff at least by Mar/Apr in 2015 by ~20% from current tariff.
Blue Bird current tariff has been implemented since 1 Sep’13, backed by fuel price hike in Jun’13. At
that time, the company increased its tariff/km by ~20% to Rp3,600/km (previous: Rp3,000/km),
while flag fall tariff had been increased to Rp7,000 (+16.7%; previous: Rp6,000).

PT Trimegah Securities Tbk - www.trimegah.com COMPANY FOCUS 12
Figure 17. Assumptions
2012 2013 2014 2015 2016 2017 2018
Vehicle owned - by YE (unit)
Regular taxi 17,916 21,756 24,656 28,156 31,436 33,436 35,436
Executive taxi 939 1,177 1,252 1,320 1,370 1,420 1,470
Car rental 3,990 4,488 4,788 5,088 5,388 5,688 5,988
Bus rental 515 612 642 692 742 792 842
Additional vehicle (unit)
Regular taxi 2,746 3,840 2,900 3,500 3,280 2,000 2,000
Executive taxi 160 238 75 68 50 50 50
Car rental 319 498 300 300 300 300 300
Bus rental 37 97 30 50 50 50 50
Average vehicle operates (unit)
Regular taxi 12,903 15,303 17,259 19,709 22,791 26,749 28,349
Executive taxi 670 737 814 858 891 1,136 1,176
Car rental 3,192 3,590 3,830 3,562 4,310 4,550 4,790
Bus rental 361 428 449 484 594 634 674
Utilization rate (%)
Regular taxi 72.0% 70.3% 70.0% 70.0% 72.5% 80.0% 80.0%
Executive taxi 71.4% 62.6% 65.0% 65.0% 65.0% 80.0% 80.0%
Car rental 80.0% 80.0% 80.0% 70.0% 80.0% 80.0% 80.0%
Bus rental 70.0% 70.0% 70.0% 70.0% 80.0% 80.0% 80.0%
Revenue per vehicle per day
Regular taxi (Rp/car/day) 517,917 557,969 626,715 735,161 728,450 721,805 721,805
Growth (% YoY) 6.1% 7.7% 12.3% 17.3% -0.9% -0.9% 0.0%
Executive taxi (Rp/car/day) 874,973 971,945 987,945 1,177,534 1,177,534 1,177,534 1,177,534
Growth (% YoY) 7.4% 11.1% 1.6% 19.2% 0.0% 0.0% 0.0%
Car rental (Rp/car/day) 271,055 290,801 334,421 356,716 386,442 425,086 467,595
Growth (% YoY) 14.1% 7.3% 15.0% 6.7% 8.3% 10.0% 10.0%
Bus rental (Rp/bus/day) 1,084,219 1,163,204 1,337,684 1,426,863 1,545,769 1,700,346 1,870,380
Growth (% YoY) 14.1% 7.3% 15.0% 6.7% 8.3% 10.0% 10.0%
Regular taxi
No of months 12 4 12 12 12 12 12
Flag fall tariff @YE 6,000 7,000 7,000 8,000 8,000 8,000 8,000
Tariff/km @YE 3,000 3,600 3,600 4,320 4,320 4,320 4,320
Average tariff/km 3,000 3,200 3,600 4,320 4,320 4,320 4,320
Distance per taxi per day 157 159 159 155 154 152 152
Distance rev. per taxi per day (Rp) 469,917 507,303 570,715 671,161 664,450 657,805 657,805
Executive taxi
No of months 12 4 12 12 12 12 12
Flag fall tariff @YE 12,000 15,000 15,000 17,000 17,000 17,000 17,000
Tariff/km @YE 6,000 6,000 6,000 7,200 7,200 7,200 7,200
Average tariff/km 6,000 6,000 6,000 7,200 7,200 7,200 7,200
Distance per taxi per day 130 145 145 145 145 145 145
Distance rev. per taxi per day (Rp) 778,970 867,945 867,945 1,041,534 1,041,534 1,041,534 1,041,534
Source: TRIM Research

PT Trimegah Securities Tbk - www.trimegah.com COMPANY FOCUS 13
Figure 18. Revenue grew by 21% CAGR09-14
Source: TRIM Research
Driver commission
The biggest component for direct cost is driver cost that accounts for ~42% of direct cost. Driver cost
and fuel cost encompass 30%-50% of average-revenue-per-taxi-per-day. Since May’13, the driver
obtained higher commission rate for the compensation of fuel cost since the fuel cost has become
driver’s responsibility. Taxi driver will obtain higher commission rate based on their performance. For
car rental and bus rental, the driver obtains salary including extra payment based on services per-
formed.
Figure 19. Direct cost breakdown
Source: TRIM Research
Driver42.0%
Fuel28.8%
Depreciation
18.9%
Maintenan
ce
5.9%
Licenses2.1%
Insurance0.3%
Others1.8%
2013
Driver39.3%
Fuel31.3%
Depreciation 19.3%
Maintenance
5.7%
Licenses2.2%
Insurance0.3%
Others1.9%
2014
1,883 2,209
2,564 3,099
3,921
4,908
6,351
7,355
8,599 9,210
-
1,000
2,000
3,000
4,000
5,000
6,000
7,000
8,000
9,000
10,000
2009 2010 2011 2012 2013 2014 2015 2016 2017 2018
PT Trimegah Securities Tbk - www.trimegah.com COMPANY FOCUS 14
Fuel cost
Fuel cost is a significant item on operational expenses since its accounts ~19% of company’s reve-
nues. Company bears the cost of gasoline for car and bus rental and as a subsidy for taxi drivers –
regular and executive taxi. The driver buys the fuel on local gas station and have refill at gas station
inside pools. Fuel cost are subjected to 1) total fuel consumed backed by type of vehicles (car for ex-
ecutive taxi consume more gasoline than regular taxi) and the number of vehicles operates, and 2)
price of gasoline.
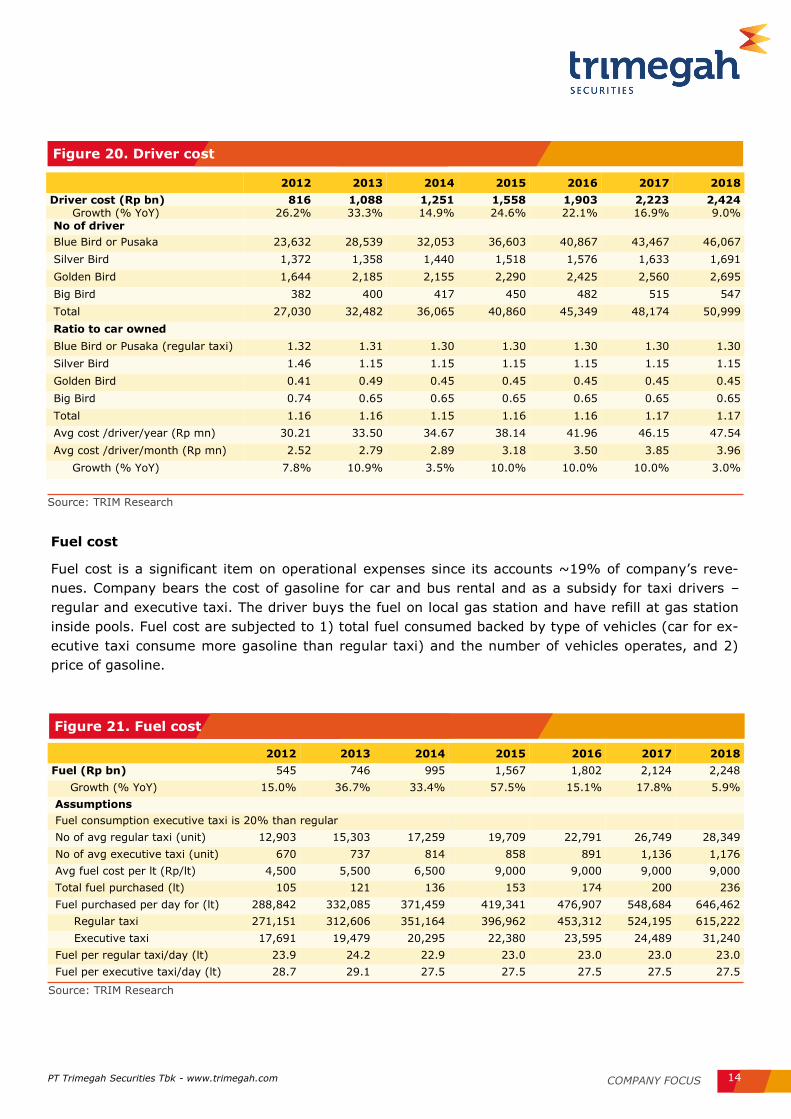
Figure 20. Driver cost
2012 2013 2014 2015 2016 2017 2018
Driver cost (Rp bn) 816 1,088 1,251 1,558 1,903 2,223 2,424 Growth (% YoY) 26.2% 33.3% 14.9% 24.6% 22.1% 16.9% 9.0% No of driver Blue Bird or Pusaka 23,632 28,539 32,053 36,603 40,867 43,467 46,067
Silver Bird 1,372 1,358 1,440 1,518 1,576 1,633 1,691
Golden Bird 1,644 2,185 2,155 2,290 2,425 2,560 2,695
Big Bird 382 400 417 450 482 515 547
Total 27,030 32,482 36,065 40,860 45,349 48,174 50,999
Ratio to car owned Blue Bird or Pusaka (regular taxi) 1.32 1.31 1.30 1.30 1.30 1.30 1.30
Silver Bird 1.46 1.15 1.15 1.15 1.15 1.15 1.15
Golden Bird 0.41 0.49 0.45 0.45 0.45 0.45 0.45
Big Bird 0.74 0.65 0.65 0.65 0.65 0.65 0.65
Total 1.16 1.16 1.15 1.16 1.16 1.17 1.17
Avg cost /driver/year (Rp mn) 30.21 33.50 34.67 38.14 41.96 46.15 47.54
Avg cost /driver/month (Rp mn) 2.52 2.79 2.89 3.18 3.50 3.85 3.96
Growth (% YoY) 7.8% 10.9% 3.5% 10.0% 10.0% 10.0% 3.0%
Source: TRIM Research
Figure 21. Fuel cost
2012 2013 2014 2015 2016 2017 2018
Fuel (Rp bn) 545 746 995 1,567 1,802 2,124 2,248
Growth (% YoY) 15.0% 36.7% 33.4% 57.5% 15.1% 17.8% 5.9%
Assumptions Fuel consumption executive taxi is 20% than regular No of avg regular taxi (unit) 12,903 15,303 17,259 19,709 22,791 26,749 28,349
No of avg executive taxi (unit) 670 737 814 858 891 1,136 1,176
Avg fuel cost per lt (Rp/lt) 4,500 5,500 6,500 9,000 9,000 9,000 9,000
Total fuel purchased (lt) 105 121 136 153 174 200 236
Fuel purchased per day for (lt) 288,842 332,085 371,459 419,341 476,907 548,684 646,462
Regular taxi 271,151 312,606 351,164 396,962 453,312 524,195 615,222
Executive taxi 17,691 19,479 20,295 22,380 23,595 24,489 31,240
Fuel per regular taxi/day (lt) 23.9 24.2 22.9 23.0 23.0 23.0 23.0
Fuel per executive taxi/day (lt) 28.7 29.1 27.5 27.5 27.5 27.5 27.5
Source: TRIM Research

PT Trimegah Securities Tbk - www.trimegah.com COMPANY FOCUS 15
Figure 22. Margins
Source: TRIM Research
Net income
We calculate core net income by excluding 3 accounts from net income, they are: 1) gain/(loss) on
disposal of FA, 2) gain/(loss) on forex, and 3) adjustment from restructuring transactions of entities
under common control due to the implementation of new accounting standard. In years 2010-2011
those three accounts had reduced company’s net income by more than Rp200bn, yearly.
Blue Bird’s core net income grew by 81.2% CAGR09-14 vs. 158% of net income growth. We expect
net income to grow by +18.8% YoY in FY14 (to Rp840bn) and +26.7% YoY in FY15 (to Rp1.1tr), and
+16.0% CAGR15-18
Figure 23. Net income and core net income
Source: TRIM Research
0%
10%
20%
30%
40%
50%
2009 2010 2011 2012 2013 2014 2015 2016 2017 2018
Gross margin Op. margin EBITDA margin Core net margin
7 41 60 118
708 840
1,064
1,286
1,548 1,661
0
200
400
600
800
1,000
1,200
1,400
1,600
1,800
2009 2010 2011 2012 2013 2014 2015 2016 2017 2018
Net income (Rp bn) Core net income (Rp bn)

PT Trimegah Securities Tbk - www.trimegah.com COMPANY FOCUS 16
IPO; Half from initial target
Based on supplementary information published on Bisnis Indonesia (30 Oct’14), Blue Bird is conduct-
ing an IPO by selling 376.5mn shares, or 15.047% stake to public, including shares under Employee
Stock Allocation/ESA program of 3.0mn shares (0.797%). The IPO price set at Rp6,500/sh resulting
~Rp2.4tr of proceeds. The price is lower than indicative price at range Rp7,200-9,300/sh, while the
number of shares offered is lowered than initial plans of 531.4mn shares (~20%stake). Hence, pro-
ceeds from IPO reaches Rp2.4tr or ~USD204mn (Rp12,000/USD); half than initial target of USD308-
398mn.
Blue Bird also has MESOP (management and employee stock option) program by issuing 25mn new
shares, or around 1.0% of post-IPO. Hence, after the program Blue Bird’s number of shares has be-
come 2.53bn shares, translating into Rp16.4tr market cap (~USD1.4bn).
Figure 24. IPO proceeds reaches Rp2.4tr (15% stake @Rp6,500/sh)
Source: TRIM Research
IPO (listing date: 5 Nov 14)
IPO price (Rp/sh) 6,500
Nominal shares price (Rp/sh) 100
I) No of shares sell through IPO (bn sh) 0.377
Shares (%) 15.047%
a. To public 0.374
Shares (%) 14.927%
b. Employee Stock Allocation (ESA) 0.003
Shares (%) 0.120%
Total number of shares after IPO (bn sh) 2.502
IPO proceeds - gross
Shares capital (Rp bn) 38
Add. Paid in capital (Rp bn) 2,410
IPO cost (%) 1.5%
IPO cost (Rp bn) 36.7
IPO proceeds - net
Shares capital (Rp bn) 38
Add. Paid in capital (Rp bn) 2,373
II) Management and employee stock option (MESOP) by issuing new shares
No of shares on MESOP (bn sh) 0.025
Shares (%) 0.990%
Total number of shares after MESOP (bn sh) 2.527
Source: Company, TRIM Research

PT Trimegah Securities Tbk - www.trimegah.com COMPANY FOCUS 17
Post IPO , before MESOP POST MESOP
Shareholder No of shares % No of shares %
Pusaka Citra Djokosoetono 930.0 37.169% 930.0 36.801%
Purnomo Prawiro** 239.1 9.557% 239.1 9.462%
Kresna Priawan Djokosoetono* 149.5 5.973% 149.5 5.914%
Sigit Priawan Djokosoetono** 149.5 5.973% 149.5 5.914%
Bayu Priawan Djokosoetono* 149.5 5.973% 149.5 5.914%
Indra Priawan Djokosoetono 149.5 5.973% 149.5 5.914%
Noni Sri Ayati Purnomo* 119.6 4.778% 119.6 4.731%
Adrianto Djokosoetono** 119.6 4.778% 119.6 4.731%
Sri Adriyani Lestari* 119.6 4.778% 119.6 4.731%
Public 373.5 14.927% 373.5 14.780%
Under ESA program 3.0 0.120% 3.0 0.119%
Under MESOP program - - 25.0 0.990%
Total 2,502.1 100.0% 2,527.1 100.0%
Figure 25. Shareholder structure POST IPO and POST MESOP
Note:
*member of board of commissioner
**member of board of director
Source: Company
IPO proceeds and material transaction
The funds from IPO will be used for: 1) 53.0% (~Rp1.3tr) to pay debt, and 2) 47.0% (~Rp1.1tr) for
expansion; consisting ~Rp720bn for fleets and ~Rp412bn for land acquisition. Blue Bird plans to buy
several land areas, scattered in Jakarta and Medan, totaling to 63,660sqm worth Rp392.7bn from
several members of director and commissioner (affiliated parties). This transaction is considered as
material transaction since the value is equivalent to ~26% of company’s equity (above 20%). The
company has obtained fairness opinion from independent appraisal.

PT Trimegah Securities Tbk - www.trimegah.com COMPANY FOCUS 18
Valuation
We have a Buy recommendation with TP of Rp8,300/sh (+28% up side)
Blue Bird’s IPO price at Rp6,500 is equivalent to 14PE of 19.4x, based on our calculation. Hence, we
are applying 15PE target same as the IPO PE of 19.4x to arrive at our target price of Rp8,300/sh
(+27.7% upside).
2013 2016 2017 2018 2014 2015
Net income 708 1,286 1,548 1,661 840 1,064 Rp bn
Growth (% YoY) 500.1% 20.8% 20.4% 7.3% 18.8% 26.7% %
EPS - fully diluted 283 514 619 664 336 425 Rp/sh
Current PE 23.0 12.6 10.5 9.8 19.4 15.3 x
PEG 1.44 0.79 0.66 0.61 1.21 0.96 x
Target 15PE 19.4 x
Current price 6,500 Rp/sh
Fair price at 20.0x of 15PE 8,253 Rp/sh
Target price 8,300 Rp/sh
Upside/(downside) 27.7% %
Earnings CAGR15-18 16.0% x
PEG15 at TP x 1.2
Figure 26. We apply 15PE target at 19.4x same as IPO 14PE
Source: TRIM Research
Figure 27. TAXI PE Band
Source: Bloomberg, TRIM Research
9
11
13
15
17
19
21
23
25
27
29
Nov-…
Dec-
…
Jan-1
3
Feb-…
Mar-
…
Apr-
…
May-…
Jun-1
3
Jul-13
Aug-…
Sep-…
Oct-
13
Nov-…
Dec-
…
Jan-1
4
Feb-…
Mar-
…
Apr-
…
May-…
Jun-1
4
Jul-14
Aug-…
Sep-…
Oct-
14
23.5x
19.3x
15.1x
The 2015 PE target of 19.4x is justifiable given historical PE of BIRD’s sole listed competitor, TAXI,
which is 19.3x

PT Trimegah Securities Tbk - www.trimegah.com COMPANY FOCUS 19
Income Statement (Rpbn)
Year end Dec 2012 2013 2014F 2015F 2016F
Revenue 3,099 3,921 4,908 6,351 7,355
Revenue Growth (%) 20.9 26.5 25.2 29.4 15.8
Gross Profit 1,080 1,332 1,729 2,102 2,344
Opr. Profit 606 990 1,312 1,562 1,756
EBITDA 964 1,492 1,939 2,295 2,626
EBITDA Growth (%) 19.8 54.8 30.0 18.4 14.4
Net Int Inc/(Exp) (117) (174) (188) (138) (65)
Gain/(loss) Forex (19) (66) (76) (79) (86)
Other Inc/(Exp) 117 207 82 86 124
Pre-tax Profit 586 956 1,129 1,431 1,728
Tax (146) (243) (282) (358) (432)
Minority Int. 0 6 7 9 10
Extra. Items (322) - - - -
Reported Net Profit 118 708 840 1,064 1,286
Core Net Profit 406 646 864 1,083 1,285
growth (%) 20.8 59.3 33.6 25.4 18.7
Dividend per share - 17 - 134 170
growth (%) - - - - 26.7
Dividend payout ratio - 35.4 - 40.0 40.0
Balance Sheet (Rpbn)
Year end Dec 2012 2013 2014F 2015F 2016F
Cash and equivalents 590 267 2,708 1,584 1,104
Other curr asset 135 290 235 305 353
Net fixed asset 3,070 4,342 5,121 6,239 7,248
Other asset 65 113 103 131 139
Total asset 3,859 5,012 8,168 8,258 8,844
ST debt 930 985 982 318 368
Other curr liab 465 670 772 921 1,037
LT debt 1,090 1,725 1,595 1,397 883
Other LT Liab 331 426 363 438 512
Minority interest 63 67 67 67 67
Total Liabilities 2,816 3,807 3,712 3,073 2,800
Shareholders Equity 980 1,138 4,389 5,117 5,977
Net (debt) / cash 1,430 2,443 (132) 131 146
Total cap employed 3,000 3,848 6,965 6,832 7,227
Net Working capital (670) (1,098) 1,189 650 52
Debt 2,020 2,710 2,577 1,715 1,250
Cash Flow (Rpbn)
Year end Dec 2012 2013 2014F 2015F 2016F
Core Net Profit 406 646 864 1,083 1,285
Depr / Amort 358 502 627 733 871
Chg in Working Cap 101 108 (132) 55 48
Others 175 (261) 168 40 30
CF's from oprs 1,041 995 1,527 1,911 2,233
Capex (1,072) (1,802) (1,396) (1,878) (1,888)
Others 49 91 34 41 65
CF's from investing (1,023) (1,711) (1,363) (1,837) (1,823)
Net change in debt 570 690 (133) (862) (464)
Others (935) 454 2,411 (336) (426)
CF's from financing (365) 1,144 2,277 (1,198) (890)
Net cash flow (348) 428 2,441 (1,125) (479)
Cash at BoY 397 590 267 2,708 1,584
Cash at EoY 50 1,018 2,708 1,584 1,104
Free Cashflow (31) (807) 130 32 346
Key Ratio Analysis
Year end Dec 2012 2013 2014F 2015F 2016F
Profitability
Gross Margin (%) 34.9 34.0 35.2 33.1 31.9
Opr Margin (%) 19.5 25.2 26.7 24.6 23.9
EBITDA Margin (%) 31.1 38.0 39.5 36.1 35.7
Core Net Margin (%) 13.1 16.5 17.6 17.1 17.5
ROAE (%) 11.9 66.8 30.4 22.4 23.2
ROAA (%) 3.5 16.0 12.8 13.0 15.0
Stability
Current ratio (x) 0.5 0.3 1.7 1.5 1.0
Net Debt to Equity (x) 1.5 2.1 (0.0) 0.0 0.0
Net Debt to EBITDA
(x)
1.5 1.6 (0.1) 0.1 0.1
Interest Coverage (x) 4.5 5.2 6.6 7.6 15.6
Efficiency
A/P (days) 21 24 24 24 24
A/R (days) 7 11 8 8 8
Inventory (days) 1 1 1 1 1
Interim Result (Rpbn)
3Q13 4Q13 1Q14 2Q14 3Q14
Sales
Gross Profit
Opr. Profit
Net profit
Gross Margins (%)
Opr Margins (%)
Net Margins (%)
Capital History
Date
05-Nov-14 IPO@Rp6,500

PT Trimegah Securities Tbk
Gedung Artha Graha 18th Floor
Jl. Jend. Sudirman Kav. 52-53
Jakarta 12190, Indonesia
t. +62-21 2924 9088
f. +62-21 2924 9150
www.trimegah.com
DISCLAIMER
This report has been prepared by PT Trimegah Securities Tbk on behalf of itself and its affiliated companies and is provided for information
purposes only. Under no circumstances is it to be used or considered as an offer to sell, or a solicitation of any offer to buy. This report has
been produced independently and the forecasts, opinions and expectations contained herein are entirely those of Trimegah Securities.
While all reasonable care has been taken to ensure that information contained herein is not untrue or misleading at the time of publication,
Trimegah Securities makes no representation as to its accuracy or completeness and it should not be relied upon as such. This report is
provided solely for the information of clients of Trimegah Securities who are expected to make their own investment decisions without reliance
on this report. Neither Trimegah Securities nor any officer or employee of Trimegah Securities accept any liability whatsoever for any direct or
consequential loss arising from any use of this report or its contents. Trimegah Securities and/or persons connected with it may have acted
upon or used the information herein contained, or the research or analysis on which it is based, before publication. Trimegah Securities may in
future participate in an offering of the company’s equity securities.