trim daily - trimegah · pt trimegah securities tbk - trim daily 1 jci has fallen for three days...
TRANSCRIPT

TRIM DAILY PT Trimegah Securities Tbk - www.trimegah.com 1
JCI has fallen for three days in a row but we remain cautious as flow of re-
sults are generally negative and expect earnings downgrade cycle to contin-
ue. Results: BTPN, BDMN, JPFA, AUTO below. Upcoming bank results today:
BJTM and BBCA (expect both to report in-line results with more downside on
BJTM due to higher NPL risk). The 2Q result season is likely to disappoint
overall with few exceptions such as TLKM, TMAS (not yet published) and
BBTN, AKRA (already published).
TRIM Daily
TRIM Highlights
Jul 29, 2015
Jakarta Composite Index (JCI) down by 56 point or 1.2% to 4714 yesterday. Index movers were mostly driven by finance, property construction and basic industry. Total transaction value was Rp4.6tr. IDX recorded Rp527bn net sell by foreign investors. JCI is a long term bearish. However, we expect an upside for JCI in the short-term to close its price-gap and reach the re-sistance level of 4,771. We believe JCI to move between the range of 4,695-
4,771 for today.
Technical Market View
Global investors were looking for any signals from the Fed on the timing of first rate increase when a two-day policy meeting concludes on Wednesday (U.S time). No move on rates is expected this week.
Global Wrap
Technical analysis: trading picks
JCI 4,714.7
Global Indices
Dual Listing (NYSE)
Others
(USD) (Rp) Chg %
42.4 14,266 0.58 1.4TLKM
Change -1.18%
Transaction Volume (m) 4,547
Transaction Value (Rpbn) 4,617
Mkt Cap (Rptr) 4,843
Market 2015 P/E (x) 12.0
Market Div. Yield (%) 2.4%
Price Chg %
Dow Jones 17,630.3 189.7 1.1
Nasdaq 5,089.2 49.4 1.0
Nikkei 20,328.9 -21.2 -0.1
ST Times 3,281.1 -32.3 -1.0
FTSE 6,555.3 50.1 0.8
Hang Seng 24,503.9 152 0.6
Chg %
USD IDR 13,465 2 0.0
10 yr Indo Govt bond (%) 8.53 0.2 1.9
10 yr US govt bond (%) 2.3 0.04 1.8
Spread (%) 6.27 0.12 0.1
EIDO 22.0 -0.0 -0.1
Foreign YtD (USDmn) (1,251) -82 7
Stock Price Rating Reason
PTBA 6425 Spec Buy
PTBA formed a long white candle yesterday. PTBA would create a technical rebound today, in our view. MACD indicator formed golden cross, our view that PTBA would break its 6550 resistance and formed a bullish pattern post today’s technical rebound. We expect the stock to be traded be-tween the range of 6300-6550 for today.
PGAS 3935 Spec Buy PGAS is a long term bullish with possible upside movement for today between the range of 3860-3990
KLBF 1655 Buy
KLBF remains on the long term bullish pattern.
Stochastic oscillator indicates an oversold while MACD would form a golden cross. KLBF is a Buy, in our view, with today’s range of 1630-1750
GGRM 47975 Buy
GGRM is a long term bearish. However, we ex-pect the stock would form a short-term up-trend as the stock formed white soldier with increasing volumes. We expect GGRM to further increase today within the range of 46500-48550
AKRA 6025 Sell
With the last two weaks days increase, KLBF is Overbought, in our view. We expect a technical correction for the stock today within the trading range of 5800-6200. Sell AKRA at level 6200.
BDMN 4085 Sell
BDMN remains in a long term bullish pattern. However, it formed a short term down-trend channel. Thus we believe the stock would weaken and forms a short-term bearish pattern. Today’s range is 4030-4150

PT Trimegah Securities Tbk - www.trimegah.com TRIM DAILY 2
Result 2Q15
BTPN: 2Q15 result Below
• BTPN reported Rp928bn net profit as at 1H15 (Rp448bn on a QoQ basis), booked -6.8% YoY growth. The realization
makes up 46/42% of ours and consensus’ FY15 estimates, mainly due to slower revenue growth.
• We noted a declining NIM by ~10bps QoQ to 11.2%. This was mainly driven by slower loan growth in 2Q15 (4.9%
YoY vs 12.3% YoY in 1Q15) to Rp52.5tr. This led ROE to decrease by ~360bps YoY to 14.2%. Meanwhile, deposits
also grew slower at 2.8% YoY to Rp54.4tr, bringing LDR to 97%.
• Asset quality shows an improvement as reflected by gross NPL ratio decline by 11bps to 0.75%, which also brings
slower growth of provisioning expense by 2.1% YoY to Rp206bn.
• Overall, the result was below ours and consensus expectation. However, we have a Buy recommendation on BTPN
with Rp4,300 TP (1.8x 2015F PBV) on the back of: 1) its market leader position in pensioners niche market, 2) low
deteriorating asset quality risk from its loan book, and 3) expectedly strong fee-based income growth from branch-
less banking and bancassurance business. The stock currently trades at 1.4x 2015F PBV.
2Q14 1Q15 2Q15 QoQ
chg (%)
YoY chg (%)
1H15 YoY chg
(%)
2Q15/2Q15F
(%)
1H15/FY15F
(%)
1H15/FY15F
cons
Net Int. Inc. 1,799 1,845 1,890 2.4 5.0 3,734 5.7 89.2 46.6 45.5
Net Revenue 1,985 2,054 2,083 1.4 4.9 4,137 7.2 87.4 45.7 46.3
Op. Profit 686 657 624 (5.0) (9.0) 1,281 (5.6) 69.2 43.1 41.6
Net Income 502 481 448 (6.8) (10.9) 928 (6.8) 71.9 45.9 42.3
NIM 11.1 11.3 11.2 (0.1) 0.1
ROE 17.8 15.3 14.2 (1.1) (3.6)
ROA 2.8 2.5 2.3 (0.2) (0.5)
PT Trimegah Securities Tbk - www.trimegah.com TRIM DAILY 3
Result 2Q15
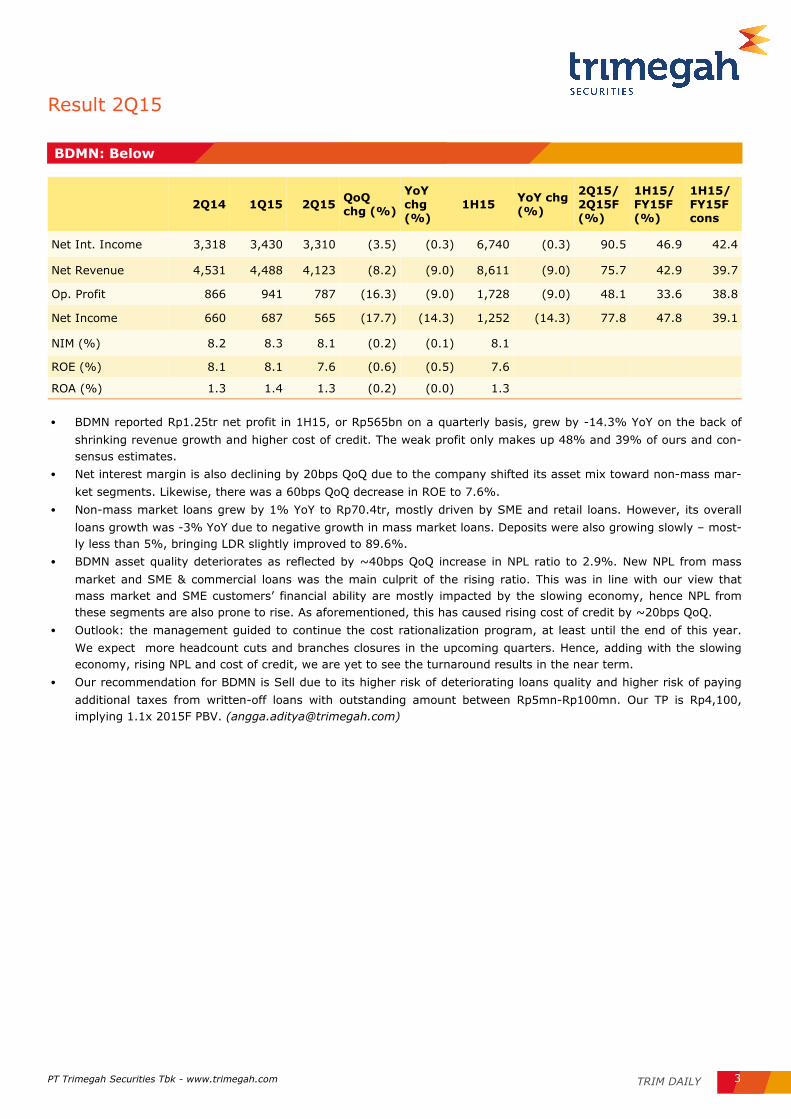
• BDMN reported Rp1.25tr net profit in 1H15, or Rp565bn on a quarterly basis, grew by -14.3% YoY on the back of
shrinking revenue growth and higher cost of credit. The weak profit only makes up 48% and 39% of ours and con-
sensus estimates.
• Net interest margin is also declining by 20bps QoQ due to the company shifted its asset mix toward non-mass mar-
ket segments. Likewise, there was a 60bps QoQ decrease in ROE to 7.6%.
• Non-mass market loans grew by 1% YoY to Rp70.4tr, mostly driven by SME and retail loans. However, its overall
loans growth was -3% YoY due to negative growth in mass market loans. Deposits were also growing slowly – most-
ly less than 5%, bringing LDR slightly improved to 89.6%.
• BDMN asset quality deteriorates as reflected by ~40bps QoQ increase in NPL ratio to 2.9%. New NPL from mass
market and SME & commercial loans was the main culprit of the rising ratio. This was in line with our view that
mass market and SME customers’ financial ability are mostly impacted by the slowing economy, hence NPL from
these segments are also prone to rise. As aforementioned, this has caused rising cost of credit by ~20bps QoQ.
• Outlook: the management guided to continue the cost rationalization program, at least until the end of this year.
We expect more headcount cuts and branches closures in the upcoming quarters. Hence, adding with the slowing
economy, rising NPL and cost of credit, we are yet to see the turnaround results in the near term.
• Our recommendation for BDMN is Sell due to its higher risk of deteriorating loans quality and higher risk of paying
additional taxes from written-off loans with outstanding amount between Rp5mn-Rp100mn. Our TP is Rp4,100,
implying 1.1x 2015F PBV. ([email protected])
2Q14 1Q15 2Q15 QoQ chg (%)
YoY chg (%)
1H15 YoY chg (%)
2Q15/2Q15F (%)
1H15/FY15F (%)
1H15/FY15F cons
Net Int. Income 3,318 3,430 3,310 (3.5) (0.3) 6,740 (0.3) 90.5 46.9 42.4
Net Revenue 4,531 4,488 4,123 (8.2) (9.0) 8,611 (9.0) 75.7 42.9 39.7
Op. Profit 866 941 787 (16.3) (9.0) 1,728 (9.0) 48.1 33.6 38.8
Net Income 660 687 565 (17.7) (14.3) 1,252 (14.3) 77.8 47.8 39.1
NIM (%) 8.2 8.3 8.1 (0.2) (0.1) 8.1
ROE (%) 8.1 8.1 7.6 (0.6) (0.5) 7.6
ROA (%) 1.3 1.4 1.3 (0.2) (0.0) 1.3
BDMN: Below

PT Trimegah Securities Tbk - www.trimegah.com TRIM DAILY 4
News of the Day
Government to introduce law limiting land bank
ownership by property developer
Rule is Ministry of Agrarian Rule No 5/2015. This limits
the amount of land bank by developers to 400ha per
province and 4,000ha for whole country. However the
rule does not affect listed companies and SOEs. Source
Kontan. [email protected]
Ministry of Energy stated half of land for 35,000
MW program are ready to be cleared
Minister Sudirman Said stated that 100 out of 212 total
land parcels for power plant project are ready to be
cleared. Government is aiming for contract signing by
next year. Government will also start ground breaking in
Grati, East Java; Gorontalo; Mine Mouth area in South
Sumatera. Ground breaking for Batang power plant will
be done in October this year. Government claims that it
has solved all the land acquisition problem and received
license from governor. PLN is using the Land Acquisition
Law No 2/2012 as basis. However government cautioned
that if there is a court case then there will be potential
delay. Source Kontan. [email protected]
Import tariff for 4W is not well targeted
Industry players perceives the import tariff increase for
4W is not well targeted given that most imports is still
dominated by Free-Trade agreement countries. Source:
Bisnis Indonesia ([email protected])
SSMS: Reported flat net profit in 1H
Net profit is Rp351.3bn, down 1.01% yoy. Revenue is
slightly down from Rp1.31tn to Rp1.3tn. Source Kontan.
PTBA: Recorded 2% volume growth in 1H15
Company sold 9.03mn tonnes if coal, up 2% yoy. Compa-
ny targets 24mn tonnes coal sales or up 33% yoy. Source
Kontan.
HERO: Booked Rp32bn losses for 1H15
This comes on the back of higher salary expenses, higher
inventories and outlet rationalization. Net revenue is up
15.09% yoy. HERO has closed 63 outlets year to date, 39
being Starmart outlets. HERO is considering a different
strategy for its convenient store biz. Source Kontan.
BSDE: Sinarmas Land considering venture to Batam
area
Master plan is currently being developed and will be
announced in September with land bank of 288ha.
Source Kontan.
INVS: To sell 20% shares to A Hongkong based com-
pany
The HK based investor is Fortune Phoenix Investment
Holding. This will be executed after INVS shares start
trading again. INVS will use the proceeds to acquire prop-
erty and financial services firm. INVS will also divest its
coal asset. Source Kontan. [email protected]
Bintan Alumina Indonesia asked for government
support in land acquisition
Smelter will occupy 2,700ha area in Bintan, Riau. Land
acquisition setback may delay completion from 2016 to
2017. Currently the company has acquired 2,000ha land.
Total investment for the whole project is US$6bn bu
Nanshan Aluminium Co and Bintan Alumina. Source Kon-
tan. [email protected]
AUTO: 1H15 net profit down 66.5% YoY, way below
FY15 consensus target
Astra Otoparts (AUTO) 1H15 revenue reached IDR5.7trn (-
8.1% YoY) with relatively stable gross margin of 14.4% vs
14.8% in 1H14. However higher opex led to an operating
profit drag (-46.7% YoY) and a net profit severe decline (-
66.5% YoY). 1H15 net profit only accounts 25% of FY15
net profit consensus target. Source: Company
Auto 2000 targets sales of 275k units of 4W this
year, down 11.6% YoY
Auto 2000 targets sales of 275k units of 4W this year,
down 11.6% YoY compared to 2014’s actualization of 311k
units. 1H15 Auto 2000 sold 131k units contributing 78% of
Toyota Indonesia sales. Auto 2000 plans to add 3 dealer
units this year in Majalengka, Bali and Bogor with invest-
ment of ~IDR50bn per dealer (including land). Note that
Auto 2000 is part of ASII’s main selling agent for its 4W
s e g m e n t . S o u r c e : B i s n i s I n d o n e s i a
1H15 1H14 YoY
Revenue 5,724 6,227 -8.1%
Gross profit 824 922 -10.6%
Gross margin 14.4% 14.8%
Op. profit 161 302 -46.7%
Op. margin 2.8% 4.9%
626 -69.6% Pre-tax profit 190
Pre-tax margin 3.3% 10.0%
Net profit 152 454 -66.5%
Net margin 2.7% 7.3%
Source: Company
PT Trimegah Securities Tbk - www.trimegah.com TRIM DAILY 5
News of the Day
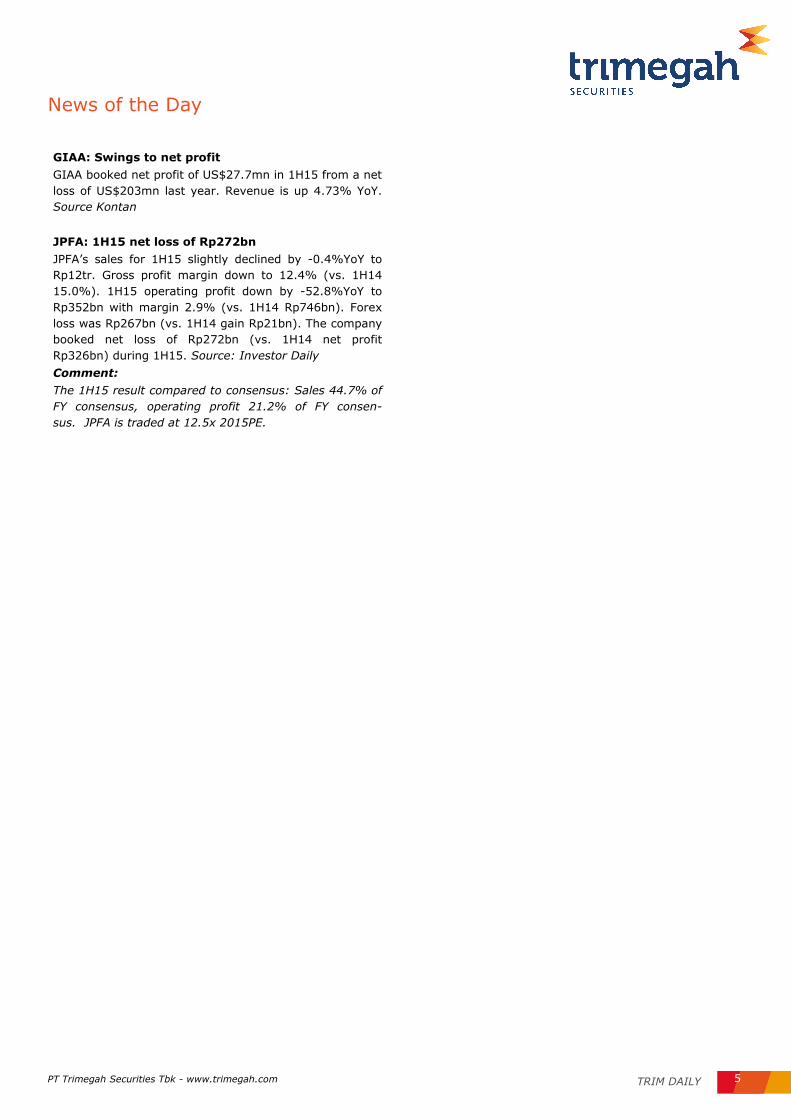
GIAA: Swings to net profit
GIAA booked net profit of US$27.7mn in 1H15 from a net
loss of US$203mn last year. Revenue is up 4.73% YoY.
Source Kontan
JPFA: 1H15 net loss of Rp272bn
JPFA’s sales for 1H15 slightly declined by -0.4%YoY to
Rp12tr. Gross profit margin down to 12.4% (vs. 1H14
15.0%). 1H15 operating profit down by -52.8%YoY to
Rp352bn with margin 2.9% (vs. 1H14 Rp746bn). Forex
loss was Rp267bn (vs. 1H14 gain Rp21bn). The company
booked net loss of Rp272bn (vs. 1H14 net profit
Rp326bn) during 1H15. Source: Investor Daily
Comment:
The 1H15 result compared to consensus: Sales 44.7% of
FY consensus, operating profit 21.2% of FY consen-
sus. JPFA is traded at 12.5x 2015PE.

PT Trimegah Securities Tbk - www.trimegah.com TRIM DAILY 6
Table
Indo Market PE vs Regional (Weekly)
Indo Market PE vs 10yr Bond Yield
Oil Price (Brent), Coal Price (Newcastle), Gold
Foreign Fund Flow in last 5 & 30 days
5yr Bond Yield Indo (USD) vs US Bond Yield
CPO Price, Soybean Price (both 1m Futures)
6.0
8.0
10.0
12.0
14.0
16.0
18.0
20.0
22.0
2010
2010
2011
2012
2013
2014
2015
(x)
Weekly Hang Seng Singapore Thailand Philippines Malaysia Indonesia
0.0
0.5
1.0
1.5
2.0
2.5
3.0
3.5
4.0
4.5
Jul-
14
Aug-14
Aug-14
Sep-1
4
Sep-1
4
Oct-
14
Oct-
14
Nov-1
4
Nov-1
4
Dec-14
Dec-14
Dec-14
Jan-15
Jan-15
Feb-15
Feb-15
Mar-
15
Mar-
15
Apr-
15
Apr-
15
May-15
May-15
Jun-1
5
Jun-1
5
Jun-1
5
Jul-
15
Jul-
15
(%) Bond Yield US Ind 5yr Bond Yield Indo in USD
-94 -90
-888
-291
-2-109
-152-179
-1,970
-799
77
790
(2,500)
(2,000)
(1,500)
(1,000)
(500)
0
500
1,000
IND
ON
ESIA
PH
ILIP
PIN
ES
SO
UTH
KO
REA
TH
AIL
AN
D
VIE
TN
AM
IND
IA
(USDmn) 5 Days 30 Days
500
700
900
1,100
1,300
1,500
40
50
60
70
80
90
100
110
120
Jul-
14
Aug-14
Sep-1
4
Sep-1
4
Oct-
14
Nov-1
4
Dec-14
Dec-14
Jan-15
Feb-15
Feb-15
Mar-
15
Apr-
15
Apr-
15
May-15
Jun-1
5
Jun-1
5
Jul-
15
(USD/ Troy oz.)(USD)
Brent Crude Oil (bbl) (LHS) Coal (mt) (LHS) Gold (RHS)
900
950
1,000
1,050
1,100
1,150
1,200
-
500
1,000
1,500
2,000
2,500
3,000
Aug-14
Sep-1
4
Oct-
14
Nov-1
4
Dec-14
Jan-15
Feb-15
Mar-
15
Apr-
15
May-15
Jun-1
5
Jul-
15
(USD Bushels)(MYR Tons)
CPO Malaysia (LHS) Soybean (RHS)
6.0
6.5
7.0
7.5
8.0
8.5
9.0
12.0
12.5
13.0
13.5
14.0
14.5
15.0
Jul-
14
Aug-
14
Sep-
14
Oct-
14
Nov-
14
Dec-
14
Jan-
15
Feb-
15
Mar-
15
Apr-
15
May-
15
Jun-
15
Jul-
15
(%)(X) JCI PE (LHS) Indo 10Yr Bond Yield (RHS)

PT Trimegah Securities Tbk - www.trimegah.com TRIM DAILY 7
Table
INCO, ANTM vs Nickel price (LME)
Coal Price (Newcastle) vs Coal Sector
TINS vs Tin price (LME)
ANTM vs Gold price
CPO Price (1m Futures in Malaysia) vs CPO Sector
GIAA vs Brent Crude Oil
150
175
200
225
250
275
50
55
60
65
70
75
Jul-
14
Aug-14
Sep-1
4
Oct-
14
Nov-1
4
Dec-14
Jan-15
Feb-15
Mar-
15
Apr-
15
May-15
Jun-1
5
(USD/MT)Coal (LHS) COAL Sector (RHS)
50
55
60
65
70
75
80
85
1,500
1,600
1,700
1,800
1,900
2,000
2,100
2,200
2,300
2,400
2,500
Jul-
14
Aug-14
Sep-1
4
Sep-1
4
Oct-
14
Nov-1
4
Dec-14
Dec-14
Jan-15
Feb-15
Feb-15
Mar-
15
Apr-
15
Apr-
15
May-15
Jun-1
5
Jun-1
5
Jul-
15
(MYR / Ton)
CPO Malaysia (LHS) CPO Sector (RHS)
-
5,000
10,000
15,000
20,000
25,000
-
500
1,000
1,500
2,000
2,500
3,000
3,500
4,000
4,500
5,000
Jul-
14
Aug-14
Sep-1
4
Sep-1
4
Oct-
14
Nov-1
4
Dec-14
Dec-14
Jan-15
Feb-15
Feb-15
Mar-
15
Apr-
15
Apr-
15
May-15
Jun-1
5
Jun-1
5
Jul-
15
(USD /MT)(Rp)
INCO (LHS) ANTM (LHS) Nickel LME (RHS)
500
600
700
800
900
1,000
1,100
1,200
1,300
1,400
500
600
700
800
900
1,000
1,100
1,200
1,300
1,400
Jul-
14
Aug-14
Sep-1
4
Sep-1
4
Oct-
14
Nov-1
4
Dec-14
Dec-14
Jan-15
Feb-15
Feb-15
Mar-
15
Apr-
15
Apr-
15
May-15
Jun-1
5
Jun-1
5
Jul-
15
(USD troy oz.)(Rp) ANTM (LHS) Gold (RHS)
10,000
12,000
14,000
16,000
18,000
20,000
22,000
24,000
500
700
900
1,100
1,300
1,500
1,700
Jul-
14
Aug-14
Sep-1
4
Sep-1
4
Oct-
14
Nov-1
4
Dec-14
Dec-14
Jan-15
Feb-15
Feb-15
Mar-
15
Apr-
15
Apr-
15
May-15
Jun-1
5
Jun-1
5
Jul-
15
(USD/MT)(Rp) TINS (LHS) Tin LME (RHS)
40
50
60
70
80
90
100
110
120
300
350
400
450
500
550
600
650
700
Jul-
14
Aug-14
Sep-1
4
Sep-1
4
Oct-
14
Nov-1
4
Dec-14
Dec-14
Jan-15
Feb-15
Feb-15
Mar-
15
Apr-
15
Apr-
15
May-15
Jun-1
5
Jun-1
5
Jul-
15
(USD bbl)(Rp)
GIAA (LHS) Crude Oil Brent (RHS)
PT Trimegah Securities Tbk - www.trimegah.com TRIM DAILY 8
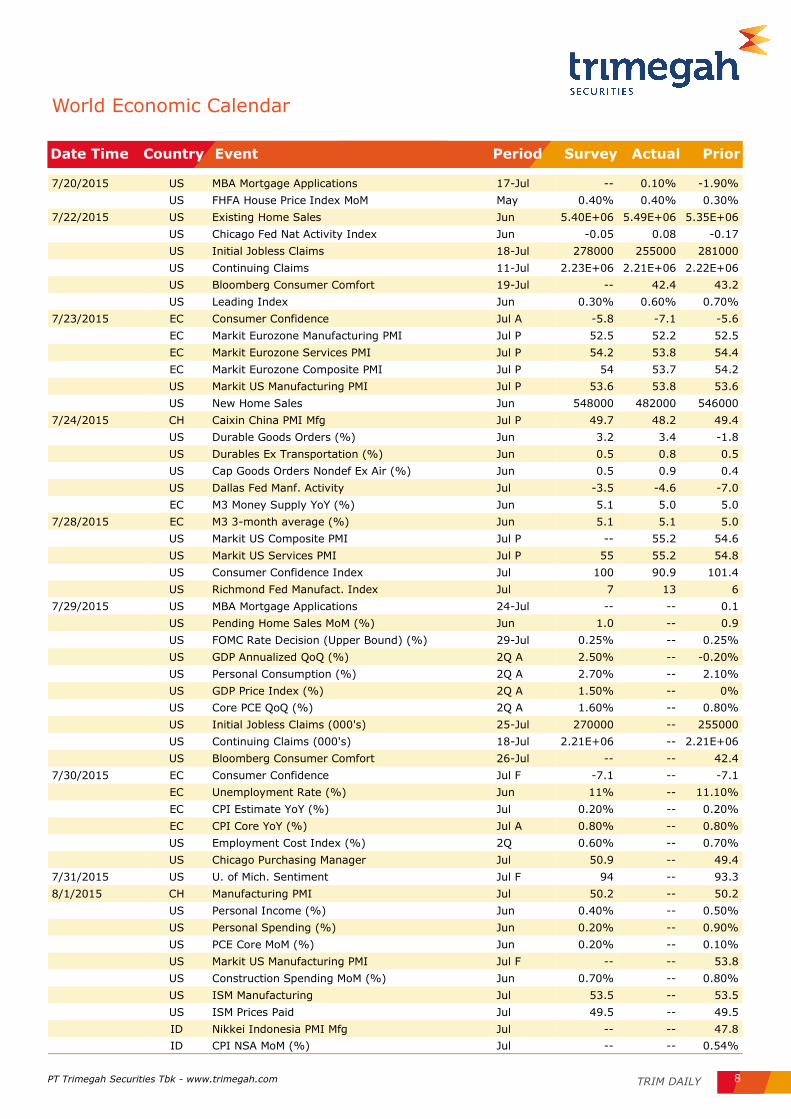
World Economic Calendar
Date Time Country Event Period Survey Actual Prior
7/20/2015 US MBA Mortgage Applications 17-Jul -- 0.10% -1.90%
US FHFA House Price Index MoM May 0.40% 0.40% 0.30%
7/22/2015 US Existing Home Sales Jun 5.40E+06 5.49E+06 5.35E+06
US Chicago Fed Nat Activity Index Jun -0.05 0.08 -0.17
US Initial Jobless Claims 18-Jul 278000 255000 281000
US Continuing Claims 11-Jul 2.23E+06 2.21E+06 2.22E+06
US Bloomberg Consumer Comfort 19-Jul -- 42.4 43.2
US Leading Index Jun 0.30% 0.60% 0.70%
7/23/2015 EC Consumer Confidence Jul A -5.8 -7.1 -5.6
EC Markit Eurozone Manufacturing PMI Jul P 52.5 52.2 52.5
EC Markit Eurozone Services PMI Jul P 54.2 53.8 54.4
EC Markit Eurozone Composite PMI Jul P 54 53.7 54.2
US Markit US Manufacturing PMI Jul P 53.6 53.8 53.6
US New Home Sales Jun 548000 482000 546000
7/24/2015 CH Caixin China PMI Mfg Jul P 49.7 48.2 49.4
US Durable Goods Orders (%) Jun 3.2 3.4 -1.8
US Durables Ex Transportation (%) Jun 0.5 0.8 0.5
US Cap Goods Orders Nondef Ex Air (%) Jun 0.5 0.9 0.4
US Dallas Fed Manf. Activity Jul -3.5 -4.6 -7.0
EC M3 Money Supply YoY (%) Jun 5.1 5.0 5.0
7/28/2015 EC M3 3-month average (%) Jun 5.1 5.1 5.0
US Markit US Composite PMI Jul P -- 55.2 54.6
US Markit US Services PMI Jul P 55 55.2 54.8
US Consumer Confidence Index Jul 100 90.9 101.4
US Richmond Fed Manufact. Index Jul 7 13 6
7/29/2015 US MBA Mortgage Applications 24-Jul -- -- 0.1
US Pending Home Sales MoM (%) Jun 1.0 -- 0.9
US FOMC Rate Decision (Upper Bound) (%) 29-Jul 0.25% -- 0.25%
US GDP Annualized QoQ (%) 2Q A 2.50% -- -0.20%
US Personal Consumption (%) 2Q A 2.70% -- 2.10%
US GDP Price Index (%) 2Q A 1.50% -- 0%
US Core PCE QoQ (%) 2Q A 1.60% -- 0.80%
US Initial Jobless Claims (000's) 25-Jul 270000 -- 255000
US Continuing Claims (000's) 18-Jul 2.21E+06 -- 2.21E+06
US Bloomberg Consumer Comfort 26-Jul -- -- 42.4
7/30/2015 EC Consumer Confidence Jul F -7.1 -- -7.1
EC Unemployment Rate (%) Jun 11% -- 11.10%
EC CPI Estimate YoY (%) Jul 0.20% -- 0.20%
EC CPI Core YoY (%) Jul A 0.80% -- 0.80%
US Employment Cost Index (%) 2Q 0.60% -- 0.70%
US Chicago Purchasing Manager Jul 50.9 -- 49.4
7/31/2015 US U. of Mich. Sentiment Jul F 94 -- 93.3
8/1/2015 CH Manufacturing PMI Jul 50.2 -- 50.2
US Personal Income (%) Jun 0.40% -- 0.50%
US Personal Spending (%) Jun 0.20% -- 0.90%
US PCE Core MoM (%) Jun 0.20% -- 0.10%
US Markit US Manufacturing PMI Jul F -- -- 53.8
US Construction Spending MoM (%) Jun 0.70% -- 0.80%
US ISM Manufacturing Jul 53.5 -- 53.5
US ISM Prices Paid Jul 49.5 -- 49.5
ID Nikkei Indonesia PMI Mfg Jul -- -- 47.8
ID CPI NSA MoM (%) Jul -- -- 0.54%

PT Trimegah Securities Tbk - www.trimegah.com TRIM DAILY 9
Corporate Action
Code Price
Exercise Maturity Emiten Description
INVS-W 165 8-May-15 Inovisi Infracom WARAN SERI I INOVISI INFRACOM
SUGI-W 100 21-May-15 Sugih Energy WARAN SERI II SUGIH ENERGY
MCOR-W 200 10-Jul-15 Bank Windu Kentjana International WARAN SERI I BANK WINDU KENTJANA INTERNATIONAL
GAMA-W 105 16-Jul-15 Gading Development WARAN SERI I GADING DEVELOPMENT
SUPR-W 4800 28-Aug-15 Solusi Tunas Pratama WARAN SERI I SOLUSI TUNAS PRATAMA
NIRO-W 110 11-Sep-15 Nirvana Development WARAN SERI I NIRVANA DEVELOPMENT
BSIM-W 149 11-Dec-15 Bank Sinar Mas WARAN SERI I BANK SINAR MAS
Warrant
PT Trimegah Securities Tbk - www.trimegah.com TRIM DAILY 10
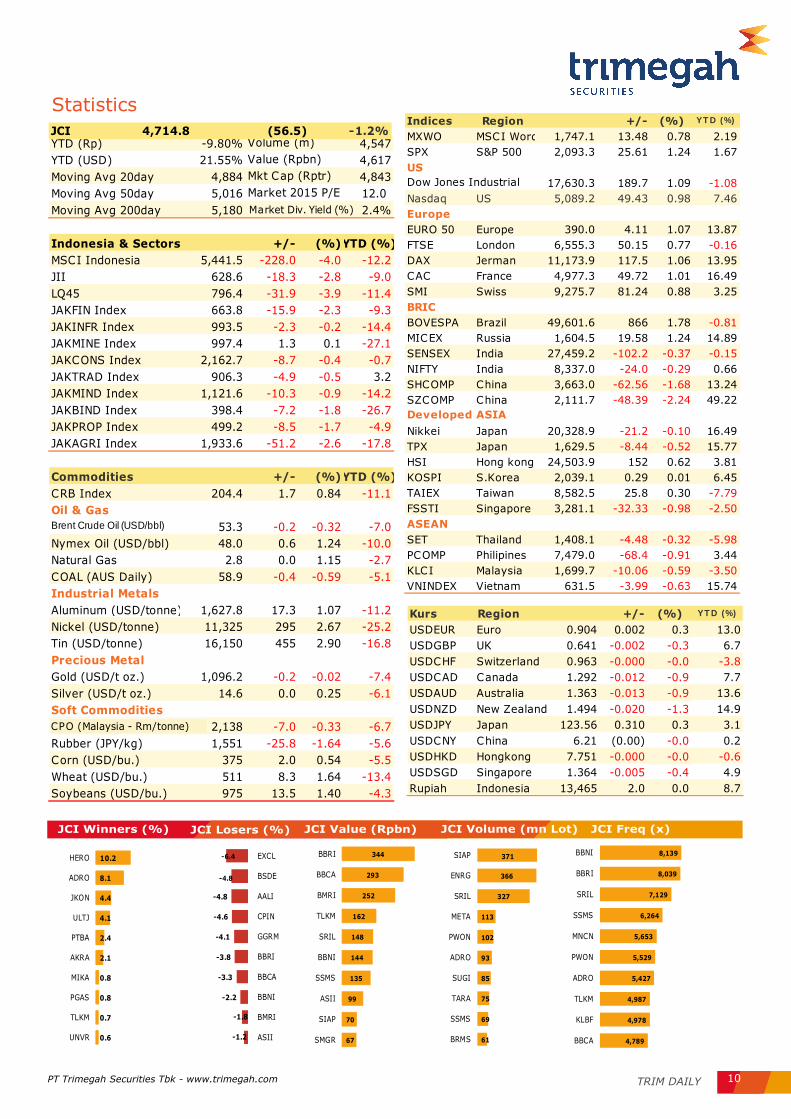
Statistics
-1.2
-1.8
-2.2
-3.3
-3.8
-4.1
-4.6
-4.8
-4.8
-6.4
ASII
BMRI
BBNI
BBCA
BBRI
GGRM
CPIN
AALI
BSDE
EXCL10.2
8.1
4.4
4.1
2.4
2.1
0.8
0.8
0.7
0.6
HERO
ADRO
JKON
ULTJ
PTBA
AKRA
MIKA
PGAS
TLKM
UNVR
344
293
252
162
148
144
135
99
70
67
- 200 400
BBRI
BBCA
BMRI
TLKM
SRIL
BBNI
SSMS
ASII
SIAP
SMGR
371
366
327
113
102
93
85
75
69
61
0 200 400
SIAP
ENRG
SRIL
META
PWON
ADRO
SUGI
TARA
SSMS
BRMS
8,139
8,039
7,129
6,264
5,653
5,529
5,427
4,987
4,978
4,789
BBNI
BBRI
SRIL
SSMS
MNCN
PWON
ADRO
TLKM
KLBF
BBCA
JCI Winners (%) JCI Losers (%) JCI Value (Rpbn) JCI Volume (mn Lot) JCI Freq (x)
YTD (Rp) -9.80% 4,547
YTD (USD) 21.55% 4,617
Moving Avg 20day 4,884 4,843
Moving Avg 50day 5,016 12.0
Moving Avg 200day 5,180 2.4%
Indonesia & Sectors +/- (%)YTD (%)
MSCI Indonesia 5,441.5 -228.0 -4.0 -12.2
JII 628.6 -18.3 -2.8 -9.0
LQ45 796.4 -31.9 -3.9 -11.4
JAKFIN Index 663.8 -15.9 -2.3 -9.3
JAKINFR Index 993.5 -2.3 -0.2 -14.4
JAKMINE Index 997.4 1.3 0.1 -27.1
JAKCONS Index 2,162.7 -8.7 -0.4 -0.7
JAKTRAD Index 906.3 -4.9 -0.5 3.2
JAKMIND Index 1,121.6 -10.3 -0.9 -14.2
JAKBIND Index 398.4 -7.2 -1.8 -26.7
JAKPROP Index 499.2 -8.5 -1.7 -4.9
JAKAGRI Index 1,933.6 -51.2 -2.6 -17.8
Commodities +/- (%)YTD (%)
CRB Index 204.4 1.7 0.84 -11.1
Oil & Gas
Brent Crude Oil (USD/bbl) 53.3 -0.2 -0.32 -7.0
Nymex Oil (USD/bbl) 48.0 0.6 1.24 -10.0
Natural Gas 2.8 0.0 1.15 -2.7
COAL (AUS Daily) 58.9 -0.4 -0.59 -5.1
Industrial Metals
Aluminum (USD/tonne) 1,627.8 17.3 1.07 -11.2
Nickel (USD/tonne) 11,325 295 2.67 -25.2
Tin (USD/tonne) 16,150 455 2.90 -16.8
Precious Metal
Gold (USD/t oz.) 1,096.2 -0.2 -0.02 -7.4
Silver (USD/t oz.) 14.6 0.0 0.25 -6.1
Soft Commodities
CPO (Malaysia - Rm/tonne) 2,138 -7.0 -0.33 -6.7
Rubber (JPY/kg) 1,551 -25.8 -1.64 -5.6
Corn (USD/bu.) 375 2.0 0.54 -5.5
Wheat (USD/bu.) 511 8.3 1.64 -13.4
Soybeans (USD/bu.) 975 13.5 1.40 -4.3
Volume (m)
Value (Rpbn)
Mkt Cap (Rptr)
Market 2015 P/E (x)
Market Div. Yield (%)
CPO (Malaysia - Rm/tonne)
Indices Region +/- (%) YT D (%)
MXWO MSCI Word 1,747.1 13.48 0.78 2.19
SPX S&P 500 2,093.3 25.61 1.24 1.67
US
17,630.3 189.7 1.09 -1.08
Nasdaq US 5,089.2 49.43 0.98 7.46
Europe
EURO 50 Europe 390.0 4.11 1.07 13.87
FTSE London 6,555.3 50.15 0.77 -0.16
DAX Jerman 11,173.9 117.5 1.06 13.95
CAC France 4,977.3 49.72 1.01 16.49
SMI Swiss 9,275.7 81.24 0.88 3.25
BRIC
BOVESPA Brazil 49,601.6 866 1.78 -0.81
MICEX Russia 1,604.5 19.58 1.24 14.89
SENSEX India 27,459.2 -102.2 -0.37 -0.15
NIFTY India 8,337.0 -24.0 -0.29 0.66
SHCOMP China 3,663.0 -62.56 -1.68 13.24
SZCOMP China 2,111.7 -48.39 -2.24 49.22
Nikkei Japan 20,328.9 -21.2 -0.10 16.49
TPX Japan 1,629.5 -8.44 -0.52 15.77
HSI Hong kong 24,503.9 152 0.62 3.81
KOSPI S.Korea 2,039.1 0.29 0.01 6.45
TAIEX Taiwan 8,582.5 25.8 0.30 -7.79
FSSTI Singapore 3,281.1 -32.33 -0.98 -2.50
ASEAN
SET Thailand 1,408.1 -4.48 -0.32 -5.98
PCOMP Philipines 7,479.0 -68.4 -0.91 3.44
KLCI Malaysia 1,699.7 -10.06 -0.59 -3.50
VNINDEX Vietnam 631.5 -3.99 -0.63 15.74
Developed ASIA
Dow Jones Industrial
Kurs Region +/- (%) YT D (%)
USDEUR Euro 0.904 0.002 0.3 13.0
USDGBP UK 0.641 -0.002 -0.3 6.7
USDCHF Switzerland 0.963 -0.000 -0.0 -3.8
USDCAD Canada 1.292 -0.012 -0.9 7.7
USDAUD Australia 1.363 -0.013 -0.9 13.6
USDNZD New Zealand 1.494 -0.020 -1.3 14.9
USDJPY Japan 123.56 0.310 0.3 3.1
USDCNY China 6.21 (0.00) -0.0 0.2
USDHKD Hongkong 7.751 -0.000 -0.0 -0.6
USDSGD Singapore 1.364 -0.005 -0.4 4.9
Rupiah Indonesia 13,465 2.0 0.0 8.7
JCI 4,714.8 (56.5) -1.2%

PT Trimegah Securities Tbk - www.trimegah.com TRIM DAILY 11
Historical Technical Trading Ideas (1)
Ticker Last Technical Call 27-Jul-15 Chg (%) Recommendation
JCI 4,857 Weakening
4,771 -1.76% Correct
MNCN 1,945 Buy
2,050 5.40% Correct
BMTR 1,155 Buy
1,160 0.43% Correct
GGRM 51,000 Buy
50,000 -1.96% Incorrect
JSMR 5,900 Buy
5,650 -4.24% Incorrect
ICBP 12,425 Sell
12,200 -1.81% Correct
BBCA 13,725 Sell
13,450 -2.00% Correct
Ticker Last Technical Call 24-Jul-15 Chg (%) Recommendation
JCI 4,903 Profit taking
4,857 -0.94% Correct
PTPP 4,175 Buy
4,060 -2.75% Incorrect
GGRM 53,650 Buy
51,000 -4.94% Incorrect
ASRI 535 Buy
515 -3.74% Incorrect
ADRO 595 Buy
560 -5.88% Incorrect
ICBP 12,475 Sell
12,425 -0.40% Correct
MPPA 2,990 Sell
2,955 -1.17% Correct
Ticker Last Technical Call 23-Jul-15 Chg (%) Recommendation
JCI 4,907 Strenghtening
4,903 -0.08% Incorrect
GGRM 52,000 Buy
53,650 3.17% Correct
UNTR 18,375 Buy
18,650 1.50% Correct
TLKM 2,865 Buy
2,845 -0.70% Incorrect
PWON 440 Buy
436 -0.91% Incorrect
ASRI 530 Buy
535 0.94% Correct
ADHI 2,760 Buy
2,665 -3.44% Incorrect
Ticker Last Technical Call 22-Jul-15 Chg (%) Recommendation
JCI 4,870 Reebound
4,907 0.76% Correct
GGRM 49,550 Buy
52,000 4.94% Correct
TLKM 2,825 Buy
2,865 1.42% Correct
INCO 2,525 Buy
2,380 -5.74% Incorrect
AALI 24,975 Buy
24,350 -2.50% Incorrect
ADHI 2,730 Buy
2,760 1.10% Correct
PTPP 4,010 Sell
4,040 0.75% Incorrect
Ticker Last Technical Call 15-Jul-15 Chg (%) Recommendation
JCI 4,902 Strenghtening
4,870 -0.65% Incorrect
PGAS 4,240 Buy
4,215 -0.59% Incorrect
GGRM 49,000 Buy
49,550 1.12% Incorrect
BBNI 5,300 Buy
5,075 -4.25% Incorrect
BBRI 10,500 Buy
10,125 -3.57% Incorrect
KLBF 1,695 Buy
1,695 0.00% Correct
ADHI 2,635 Sell
2,730 3.61% Incorrect

PT Trimegah Securities Tbk - www.trimegah.com TRIM DAILY 12
Historical Technical Trading Ideas (2)
Ticker Last Technical Call 14-Jul-15 Chg (%) Recommendation
JCI 4,894 Strenghtening
4,902 0.16% Correct
PGAS 4,085 Buy
4,240 3.79% Correct
BBCA 13,500 Buy
13,600 0.74% Correct
UNTR 19,200 Buy
19,300 0.52% Correct
ADHI 2,500 Buy
2,635 5.40% Correct
GGRM 47,600 Buy
49,000 2.94% Correct
INCO 2,490 Sell
2,530 1.61% Incorrect
Ticker Last Technical Call 13-Jul-15 Chg (%) Recommendation
JCI 4,859 Reebound
4,894 0.72% Correct
BWPT 407 Buy
398 -2.21% Incorrect
ADRO 635 Buy
620 -2.36% Incorrect
BBCA 13,300 Buy
13,500 1.50% Correct
BSDE 1,785 Buy
1,865 4.48% Correct
MPPA 3,050 Buy
3,085 1.15% Correct
SRIL 411 Sell
398 -3.16% Correct
Ticker Last Technical Call 10-Jul-15 Chg (%) Recommendation
JCI 4,838 Reebound
4,859 0.43% Correct
BBRI 10,300 Buy
10,475 1.70% Correct
BWPT 411 Buy
407 -0.97% Incorrect
MPPA 2,860 Buy
3,050 6.64% Correct
LSIP 1,565 Buy
1,590 1.60% Correct
WIKA 2,985 Buy
3,095 3.69% Correct
ADHI 2,285 Buy
2,380 4.16% Correct
Ticker Last Technical Call 9-Jul-15 Chg (%) Recommendation
JCI 4,872 Weakening
4,838 -0.68% Correct
BSDE 1,720 Buy
1,720 0.00% Correct
TELE 950 Buy
950 0.00% Correct
TAXI 1,030 Buy
1,005 -2.43% Incorrect
KLBF 1,655 Buy
1,635 -1.21% Incorrect
BMRI 9,950 Sell
9,900 -0.50% Correct
JSMR 5,875 Sell
5,700 -2.98% Correct
Ticker Last Technical Call 8-Jul-15 Chg (%) Recommendation
JCI 4,906 Rebound
4,872 -0.70% Incorrect
BBRI 10,475 Buy
10,225 -2.39% Incorrect
BBNI 5,550 Buy
5,400 -2.70% Incorrect
SMRA 1,775 Buy
1,740 -1.97% Incorrect
WSKT 1,720 Buy
1,775 3.20% Correct
PTPP 3,880 Buy
3,955 1.93% Correct
ASRI 565 Buy
560 -0.88% Incorrect

PT Trimegah Securities Tbk - www.trimegah.com TRIM DAILY 13
Historical Technical Trading Ideas (3)
JCI 4,917 Weakening
4,906 -0.22% Correct
AALI 25,825 Buy
25,950 0.48% Correct
LSIP 1,655 Buy
1,620 -2.11% Incorrect
TLKM 2,930 Buy
2,870 -2.05% Incorrect
ASRI 550 Buy
565 2.73% Correct
GJTL 860 Buy
855 -0.58% Incorrect
ASII 7,000 Buy
6,900 -1.43% Incorrect
Ticker Last Technical Call 6-Jul-15 Chg (%) Recommendation
JCI 4,983 Weakening
4,917 -1.33% Correct
AALI 25,500 Buy
25,825 1.27% Correct
LSIP 1,660 Buy
1,655 -0.30% Incorrect
TLKM 2,930 Buy
2,930 0.00% Incorrect
ASRI 575 Buy
550 -4.35% Incorrect
GJTL 850 Buy
860 1.18% Correct
ASII 7,050 Buy
7,000 -0.71% Incorrect
Ticker Last Technical Call 3-Jul-15 Chg (%) Recommendation
JCI 4,945 Strenghtening
4,983 0.77% Correct
LSIP 1,585 Buy
1,660 4.73% Incorrect
AALI 25,000 Buy
25,500 2.00% Correct
BBNI 5,575 Buy
5,625 0.90% Incorrect
BBRI 10,875 Buy
10,825 -0.46% Incorrect
PTPP 3,690 Buy
3,725 0.95% Incorrect
ANTM 675 Sell
675 0.00% Correct
Ticker Last Technical Call 2-Jun-15 Chg (%) Recommendation
JCI 5,214 Strenghtening
5,214 0.00% Correct
LSIP 1,710 Buy
1,710 0.00% Correct
TLKM 2,845 Buy
2,845 0.00% Correct
KLBF 1,790 Buy
1,790 0.00% Incorrect
UNVR 43,200 Buy
43,200 0.00% Incorrect
GGRM 47,000 Sell
47,000 0.00% Incorrect
GIAA 485 Sell
485 0.00% Correct
Ticker Last Technical Call 1-Jul-15 Chg (%) Recommendation
JCI 4,911 Strenghtening
4,904 -0.13% Correct
ASII 7,075 Buy
7,025 -0.71% Correct
TLKM 2,930 Buy
2,920 -0.34% Correct
GGRM 45,100 Buy
45,025 -0.17% Correct
BBNI 5,300 Buy
5,300 0.00% Correct
BBRI 10,350 Buy
10,550 1.93% Incorrect
PGAS 4,315 Sell
4,280 -0.81% Incorrect

PT Trimegah Securities Tbk - www.trimegah.com TRIM DAILY 14
Historical Technical Trading Ideas (4)
Ticker Last Technical Call 30-Jun-15 Chg (%) Recommendation
JCI 4,883 Reebond
4,911 0.58% Correct
ASII 6,875 Buy
7,075 2.91% Correct
AALI 22,650 Buy
22,950 1.32% Correct
BMRI 10,025 Buy
10,050 0.25% Correct
BBNI 5,250 Buy
5,300 0.95% Correct
ADHI 2,015 Spec Buy
2,020 0.25% Correct
PTPP 3,525 Spec Buy
3,470 -1.56% Incorrect
Ticker Last Technical Call 29-Jun-15 Chg (%) Recommendation
JCI 4,883 Weakining
4,883 0.58% Incorrect
GGRM 43,800 Buy
43,800 2.91% Correct
UNTR 20,200 Buy
20,200 1.32% Correct
TLKM 2,905 Buy
2,905 0.25% Correct
ASRI 580 Buy
580 0.95% Correct
SSMS 1,850 Buy
1,850 0.25% Correct
AALI 22,650 Buy
22,650 -1.56% Incorrect
Ticker Last Technical Call 25-Jun-15 Chg (%) Recommendation
JCI 4,954 Strenghtening
4,920 -0.68% Incorrect
JSMR 5,650 Sell
5,550 -1.77% Correct
ERAA 600 Sell
595 -0.83% Correct
BWPT 418 Sell
418 0.00% Correct
BKSL 100 Buy
99 -1.00% Incorrect
BBNI 5,500 Buy
5,350 -2.73% Incorrect
BBRI 10,300 Sell
10,200 -0.97% Correct
Ticker Last Technical Call 24-Jun-15 Chg (%) Recommendation
JCI 4,938 Correction
4,954 0.32% Correct
JSMR 5,650 Buy
5,650 0.00% Correct
ERAA 600 Buy
600 0.00% Correct
UNTR 20,325 Buy
20,225 -0.49% Incorrect
BWPT 419 Buy
418 -0.24% Incorrect
BKSL 96 Buy
100 4.17% Correct
GGRM 45,950 Sell
45,300 -1.41% Correct
Ticker Last Technical Call 23-Jun-15 Chg (%) Recommendation
JCI 4,959 Strenghtening
4,938 -0.44% Correct
ICBP 12,975 Buy
12,900 -0.58% Correct
BWPT 378 Buy
419 10.85% Correct
RALS 710 Buy
705 -0.70% Correct
AISA 1,805 Buy
1,815 0.55% Correct
MPPA 3,260 Buy
3,285 0.77% Correct
BBNI 5,600 Sell
5,575 -0.45% Correct
PT Trimegah Securities Tbk - www.trimegah.com TRIM DAILY 15
Research Team
Sebastian Tobing, CFA
Head of Research & Institutional Business
Gina Novrina Nasution, CSA
Technical Analyst
Paula Ruth
Equity Analyst
Angga Aditya Assaf
Equity Analyst
Willinoy Sitorus
Equity Analyst
M. Dian Octiana
Equity Analyst
Wisnu Budhiargo
Equity Analyst
Tim Alamsyah
Equity Analyst
Dini Agmivia Anggraeni
Fixed Income/Macro Analyst
Yeni Simanjuntak
On-the-ground Analyst
Rovandi
Research Associate
Institutional Sales Team
Daniel Dwi Seputro
Head of Institutional Equity Sales
Dewi Yusnita
Equity Institutional Sales
Meitawati
Equity Institutional Sales
Fachruly Fiater
Equity Institutional Sales
Henry Sidarta
Equity Institutional Sales
Raditya Andyono
Equity Institutional Sales
Nancy Pardede
Equity Institutional Sales
Retail Sales Team
JAKARTA AREA
Nathanael Benny Prasetyo
Head of Retail ECM
Ariawan Anwar
Artha Graha, Jakarta
Windra Djulnaily
Pluit, Jakarta
Ferry Zabur
Kelapa Gading, Jakarta
Eddy Sumarli
Puri Kencana, Jakarta
Very Wijaya
BSD, Tangerang
SUMATERA
Juliana Effendy
Medan, Sumatera Utara
Tantie Rivi Watie
Pekanbaru, Riau
Nathanael Benny Prasetyo
Palembang, Sumatera Selatan
EAST INDONESIA
Sonny Muljadi
Surabaya, Jawa Timur
Ni Made Dwi Hapsari Wijayanti
Denpasar, Bali
Ivan Jaka Perdana
Malang, Jawa Timur
Arifin Pribadi
Makasar, Sulawesi Selatan
CENTRAL JAVA, AREA
Agus Bambang Suseno
Solo, Jawa Tengah
Mariana Kusuma Wati
Semarang, Jawa Tengah
WEST JAVA
Asep Saepudin
Bandung, Jawa Barat
Ariffianto
Cirebon, Jawa Barat

PT Trimegah Securities Tbk
Gedung Artha Graha 18th Floor
Jl. Jend. Sudirman Kav. 52-53
Jakarta 12190, Indonesia
t. +62-21 2924 9088
f. +62-21 2924 9150
www.trimegah.com
DISCLAIMER
This report has been prepared by PT Trimegah Securities Tbk on behalf of itself and its affiliated companies and is provided for information
purposes only. Under no circumstances is it to be used or considered as an offer to sell, or a solicitation of any offer to buy. This report has
been produced independently and the forecasts, opinions and expectations contained herein are entirely those of Trimegah Securities.
While all reasonable care has been taken to ensure that information contained herein is not untrue or misleading at the time of publication,
Trimegah Securities makes no representation as to its accuracy or completeness and it should not be relied upon as such. This report is
provided solely for the information of clients of Trimegah Securities who are expected to make their own investment decisions without reliance
on this report. Neither Trimegah Securities nor any officer or employee of Trimegah Securities accept any liability whatsoever for any direct or
consequential loss arising from any use of this report or its contents. Trimegah Securities and/or persons connected with it may have acted
upon or used the information herein contained, or the research or analysis on which it is based, before publication. Trimegah Securities may in
future participate in an offering of the company’s equity securities.