nucleation and growth of sub-3nm particles in the polluted ... · nucleation and growth of sub-3nm...
TRANSCRIPT
Atmos. Chem. Phys., 16, 2641–2657, 2016
www.atmos-chem-phys.net/16/2641/2016/
doi:10.5194/acp-16-2641-2016
© Author(s) 2016. CC Attribution 3.0 License.
Nucleation and growth of sub-3 nm particles in the polluted urban
atmosphere of a megacity in China
Huan Yu1,2,3, Luyu Zhou1, Liang Dai1, Wenchao Shen1, Wei Dai1, Jun Zheng1,2,3, Yan Ma1,2,3, and Mindong Chen1,2,3
1School of Environmental Science and Engineering, Nanjing University of Information Science
and Technology, Nanjing, China2Collaborative Innovation Center of Atmospheric Environment and Equipment Technology,
Nanjing University of Information Science and Technology, Nanjing, China3Jiangsu Key Laboratory of Atmospheric Environment Monitoring and Pollution Control, Nanjing, China
Correspondence to: Huan Yu ([email protected])
Received: 22 June 2015 – Published in Atmos. Chem. Phys. Discuss.: 9 July 2015
Revised: 15 February 2016 – Accepted: 22 February 2016 – Published: 3 March 2016
Abstract. Particle size distribution down to 1.4 nm was mea-
sured in the urban atmosphere of Nanjing, China, in spring,
summer, and winter during 2014–2015. Sub-3 nm particle
event, which is equivalent to nucleation event, occurred on
42 out of total 90 observation days, but new particles could
grow to cloud condensation nuclei (CCN)-active sizes on
only 9 days. In summer, infrequent nucleation was limited
by both unfavorable meteorological conditions (high tem-
perature and relative humidity – RH) and reduced anthro-
pogenic precursor availability due to strict emission control
measures during the 2014 Youth Olympic Games in Nan-
jing. The limiting factors for nucleation in winter and spring
were meteorological conditions (radiation, temperature, and
RH) and condensation sink, but for the further growth of sub-
3 nm particles to CCN-active sizes, anthropogenic precursors
again became limiting factors. Nucleation events were strong
in the polluted urban atmosphere. Initial J1.4 at the onset
and peak J1.4 at the noontime could be up to 2.1× 10² and
2.5×103 cm−3 s−1, respectively, during the eight nucleation
events selected from different seasons. Time-dependent J1.4
usually showed good linear correlations with a sulfuric acid
proxy for every single event (R2= 0.56–0.86, excluding a
day with significant nocturnal nucleation), but the correla-
tion among all eight events deteriorated (R2= 0.17) due to
temperature or season change. We observed that new par-
ticle growth rate (GR) did not increase monotonically with
particle size, but had a local maximum up to 25 nm h−1 be-
tween 1 and 3 nm. The existence of local maxima GR in sub-
3 nm size range, though sensitive to measurement uncertain-
ties, gives new insight into cluster dynamics in polluted en-
vironments. In this study such growth rate behavior was in-
terpreted as the solvation effect of organic activating vapor in
newly formed inorganic nuclei.
1 Introduction
New particle formation (NPF) is an important source of sec-
ondary aerosols in the atmosphere (Kulmala et al., 2004a).
Field studies and model simulations have consistently shown
that NPF can enhance cloud condensation nuclei (CCN) con-
centrations and contribute significantly to the global CCN
production (Wiedensohler et al., 2009; Yue et al., 2011;
Spracklen et al., 2008; Pierce and Adams, 2009; Merikanto
et al., 2009; Yu and Luo, 2009; Matsui et al., 2013). NPF
is a two-stage process consisting of the formation of clus-
ters and subsequent growth to detectable sizes (Kulmala et
al., 2000). Recently, chamber experiments have made sub-
stantial progress in revealing the fundamental processes in-
volved in particle nucleation and growth (Kirkby et al., 2011;
Almeida et al., 2013; Schobesberger et al., 2013; Riccobono
et al., 2014; Ehn et al., 2014; Kürten et al., 2014). How-
ever, consistent theories are still under investigation to quan-
tify the processes physically, chemically, and dynamically
(Kulmala et al., 2013, 2014). For example, the identity and
physico-chemical properties of assisting vapors other than
sulfuric acid (H2SO4) are uncertain so far. It is also uncer-
tain what mechanisms allow for the assisting vapors to over-
Published by Copernicus Publications on behalf of the European Geosciences Union.
2642 H. Yu et al.: Nucleation and growth of sub-3 nm particles
come strong Kelvin effect over sub-3 nm particles. Existing
mechanisms include condensation of extremely low volatil-
ity organic compounds (Ehn et al., 2014), nano-Köhler acti-
vation (Kulmala et al., 2004b), heterogeneous chemical re-
actions (Zhang and Wexler, 2002), heterogeneous nucleation
(Wang et al., 2013), and adsorption of organics on cluster
surface (Wang and Wexler, 2013). However, the relative im-
portance of various mechanisms is unknown.
Direct measurements of size- and time-dependent nucle-
ation rate and growth rate in sub-3 nm size range are im-
portant to constrain the relative contributions from differ-
ent mechanisms and precursors. Such measurements are also
important to evaluate the survival probability of new parti-
cle to CCN-active sizes (∼ 100 nm for soluble particles at
0.2 % super saturation; Pierce and Adams, 2009) and to re-
veal the limiting factors in the process. Recently, a series
of new instruments have been developed to measure sub-
3 nm aerosol number concentration and chemical compo-
sition, such as condensation particle counters (e.g., PSM,
DEG-SMPS, Jiang et al., 2011a; Sipila et al., 2009; Van-
hanen et al., 2011), ion spectrometers (e.g., NAIS, Asmi et
al., 2009), and mass spectrometers (e.g., Cluster-CIMS, APi-
TOF, CI-APi-TOF (chemical ionization atmospheric pres-
sure interface time-of-flight) mass spectrometer, Jokinen et
al., 2012; Junninen et al., 2010; Zhao et al., 2010). Kuang et
al. (2012) developed a de-coupling method to measure size-
and time-dependent growth rates of sub-5 nm particles. Their
results at two urban sites in USA showed that size-resolved
growth rates increased approximately linearly with particle
size from 1 to 5 nm. Similar results were also observed in the
boreal forest (Kulmala et al., 2013; Lehtipalo et al., 2014).
Based on growth rates measured below 2 nm, Kulmala et
al. (2013) identified three separate size regimes, which were
dominated by different key gas to particle conversion pro-
cesses.
The relative contribution of different precursors and mech-
anisms to the nucleation and growth of 1–3 nm particles may
vary greatly with atmospheric conditions (Riipinen et al.,
2012). Therefore, sub-3 nm particle measurements in a va-
riety of atmospheric conditions, e.g., remote or urban atmo-
sphere, biogenic, or anthropogenic emission-dominated ar-
eas, are immensely valuable. Unfortunately, such data are
very sparse until now (Jiang et al., 2011b; Kuang et al., 2012;
Kulmala et al., 2013; Lehtipalo et al., 2009, 2010, 2011; Yu
et al., 2014a, b). China has suffered from severe atmospheric
particulate matter pollution in recent years (Chan and Yao,
2008; Yue et al., 2011). To the best of our knowledge, only
two studies were conducted in China to measure the occur-
rence of new particles down to ∼ 1 nm. In these two studies,
air ions (Herrmann et al., 2014) or neutral particles (Xiao
et al., 2015) were measured by air ion spectrometer (AIS)
or particle size magnifier (PSM) in two urban locations of
Yangtze River Delta (YRD) region. Both studies were con-
ducted in the winter season.
Here we reported the nucleation and growth of sub-3 nm
particles in the urban atmosphere of Nanjing, China on arbi-
trarily selected observation days in the spring, summer, and
winter of 2014–2015. Our aim was to (1) provide new in-
formation about the initial steps of NPF based on size- and
time-resolved nucleation rate and growth rate measurements,
and (2) find possible limiting factors behind the seasonal and
diurnal variations of nucleation events in the polluted urban
atmosphere.
2 Methodology
2.1 Field measurements
Nanjing is the second largest megacity after Shanghai in the
YRD region of China (Chan and Yao, 2008). The YRD city
cluster, covering 2.1× 10⁵ km2 land with 170 million resi-
dents, is one of the most populated and industrialized regions
in China. Field measurement was conducted from the third
floor (15 m above the ground level) of an academic building
beside a Chinese national meteorology observatory facility
on the Nanjing University of Information Science and Tech-
nology (NUIST) campus (32.20◦ N, 118.71◦ E; symbol (1) in
Fig. 1). The sampling was carried out during the months of
May (10–30 20 May14), June (1–15 June 2014), December
(24–31 December 2014), February (16–22 February 2015),
and March (1–7 March 2015). A total of 58 measurement
days were arbitrarily selected to represent spring, early sum-
mer, and winter seasons, but to avoid any rain event.
As part of an intensive summer campaign (12 August–
12 September 2014), the summer measurement was con-
ducted at a local governmental meteorology observatory plat-
form (32.06◦ N, 118.70◦ E) that is 14 km south of the NUIST
site ((2) in Fig. 1). The instruments were housed in an air-
conditioned trailer, using exactly the same sampling inlets as
the NUIST site. The main aim of the summer campaign was
to understand the effects of regional emission control mea-
sures during the 2014 Young Olympic Games (1 August–
15 September) on air quality. Since the two sites were located
within the same urban air shed, the measurement provided an
opportunity to study seasonal variation of nucleation and its
relationship with meteorological variables and gaseous pre-
cursors.
Sub-3 nm clusters/particles (hereafter referred as particles)
were measured with a nano-condensation nucleus counter
system (nCNC) consisting of a particle size magnifier (PSM;
model A10, Airmodus Oy, Finland) and a butanol conden-
sation particle counter (model A20, Airmodus Oy, Finland).
During the measurement, an ambient airflow of 14 standard
liters per minute (standard L min−1) was drawn into build-
ing room or trailer via a 72 cm long and 1.0 cm I.D. diame-
ter stainless steel (SS) tube, which was extended outside the
room/trailer horizontally. PSM then sampled a split flow of
2.5 standard L min−1 via a SS T-union. The design of the in-
Atmos. Chem. Phys., 16, 2641–2657, 2016 www.atmos-chem-phys.net/16/2641/2016/
H. Yu et al.: Nucleation and growth of sub-3 nm particles 2643
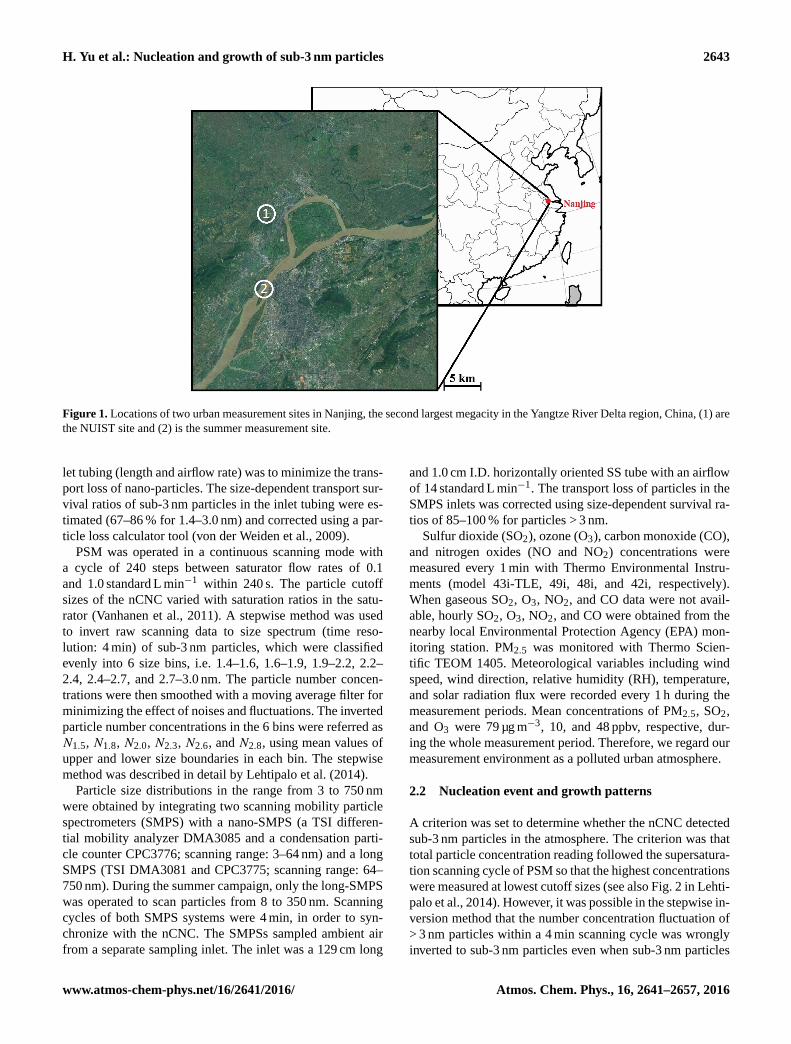
Figure 1. Locations of two urban measurement sites in Nanjing, the second largest megacity in the Yangtze River Delta region, China, (1) are
the NUIST site and (2) is the summer measurement site.
let tubing (length and airflow rate) was to minimize the trans-
port loss of nano-particles. The size-dependent transport sur-
vival ratios of sub-3 nm particles in the inlet tubing were es-
timated (67–86 % for 1.4–3.0 nm) and corrected using a par-
ticle loss calculator tool (von der Weiden et al., 2009).
PSM was operated in a continuous scanning mode with
a cycle of 240 steps between saturator flow rates of 0.1
and 1.0 standard L min−1 within 240 s. The particle cutoff
sizes of the nCNC varied with saturation ratios in the satu-
rator (Vanhanen et al., 2011). A stepwise method was used
to invert raw scanning data to size spectrum (time reso-
lution: 4 min) of sub-3 nm particles, which were classified
evenly into 6 size bins, i.e. 1.4–1.6, 1.6–1.9, 1.9–2.2, 2.2–
2.4, 2.4–2.7, and 2.7–3.0 nm. The particle number concen-
trations were then smoothed with a moving average filter for
minimizing the effect of noises and fluctuations. The inverted
particle number concentrations in the 6 bins were referred as
N1.5, N1.8, N2.0, N2.3, N2.6, and N2.8, using mean values of
upper and lower size boundaries in each bin. The stepwise
method was described in detail by Lehtipalo et al. (2014).
Particle size distributions in the range from 3 to 750 nm
were obtained by integrating two scanning mobility particle
spectrometers (SMPS) with a nano-SMPS (a TSI differen-
tial mobility analyzer DMA3085 and a condensation parti-
cle counter CPC3776; scanning range: 3–64 nm) and a long
SMPS (TSI DMA3081 and CPC3775; scanning range: 64–
750 nm). During the summer campaign, only the long-SMPS
was operated to scan particles from 8 to 350 nm. Scanning
cycles of both SMPS systems were 4 min, in order to syn-
chronize with the nCNC. The SMPSs sampled ambient air
from a separate sampling inlet. The inlet was a 129 cm long
and 1.0 cm I.D. horizontally oriented SS tube with an airflow
of 14 standard L min−1. The transport loss of particles in the
SMPS inlets was corrected using size-dependent survival ra-
tios of 85–100 % for particles > 3 nm.
Sulfur dioxide (SO2), ozone (O3), carbon monoxide (CO),
and nitrogen oxides (NO and NO2) concentrations were
measured every 1 min with Thermo Environmental Instru-
ments (model 43i-TLE, 49i, 48i, and 42i, respectively).
When gaseous SO2, O3, NO2, and CO data were not avail-
able, hourly SO2, O3, NO2, and CO were obtained from the
nearby local Environmental Protection Agency (EPA) mon-
itoring station. PM2.5 was monitored with Thermo Scien-
tific TEOM 1405. Meteorological variables including wind
speed, wind direction, relative humidity (RH), temperature,
and solar radiation flux were recorded every 1 h during the
measurement periods. Mean concentrations of PM2.5, SO2,
and O3 were 79 µg m−3, 10, and 48 ppbv, respective, dur-
ing the whole measurement period. Therefore, we regard our
measurement environment as a polluted urban atmosphere.
2.2 Nucleation event and growth patterns
A criterion was set to determine whether the nCNC detected
sub-3 nm particles in the atmosphere. The criterion was that
total particle concentration reading followed the supersatura-
tion scanning cycle of PSM so that the highest concentrations
were measured at lowest cutoff sizes (see also Fig. 2 in Lehti-
palo et al., 2014). However, it was possible in the stepwise in-
version method that the number concentration fluctuation of
> 3 nm particles within a 4 min scanning cycle was wrongly
inverted to sub-3 nm particles even when sub-3 nm particles
www.atmos-chem-phys.net/16/2641/2016/ Atmos. Chem. Phys., 16, 2641–2657, 2016
2644 H. Yu et al.: Nucleation and growth of sub-3 nm particles
actually did not exist according to the above criterion. As
a result, the stepwise inversion method always reported a
background sub-3 nm particle concentration (Nsub-3; i.e. the
sum of N1.5, N1.8, N2.0, N2.3, N2.6, and N2.8) of 0.5× 10³–
2× 103 cm−3 in the nighttime and 3× 10³–8× 103 cm−3 in
the daytime. Similar background levels of sub-3 nm particles
during non-NPF periods were also reported by other studies
that used the nCNC (Kulmala et al., 2013; Lehtipalo et al.,
2014; Xiao et al., 2015). Following their procedures, we did
not attempt to subtract this background from Nsub-3 reported
in this study.
We defined the sub-3 nm particle event as a sub-3 nm parti-
cle occurrence with aNsub-3 higher than the background level
persisting for longer than 1 h in the atmosphere. In this study,
we used sub-3 nm particle event as an approximate measure
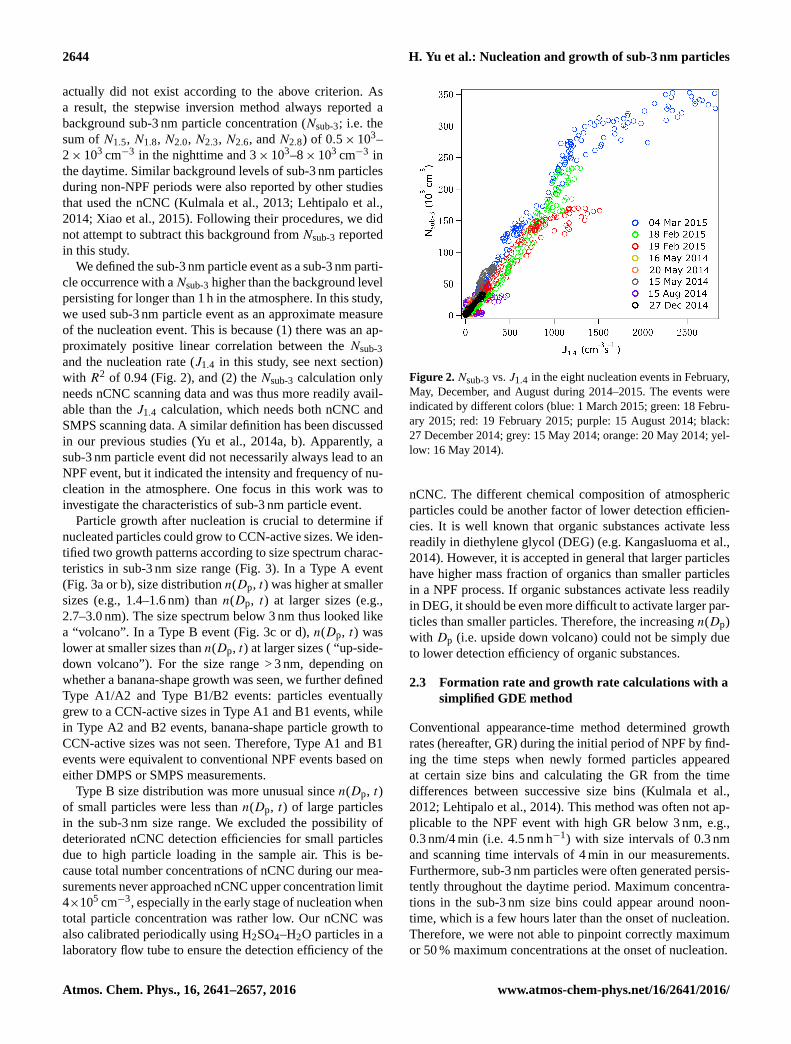
of the nucleation event. This is because (1) there was an ap-
proximately positive linear correlation between the Nsub-3
and the nucleation rate (J1.4 in this study, see next section)
with R2 of 0.94 (Fig. 2), and (2) the Nsub-3 calculation only
needs nCNC scanning data and was thus more readily avail-
able than the J1.4 calculation, which needs both nCNC and
SMPS scanning data. A similar definition has been discussed
in our previous studies (Yu et al., 2014a, b). Apparently, a
sub-3 nm particle event did not necessarily always lead to an
NPF event, but it indicated the intensity and frequency of nu-
cleation in the atmosphere. One focus in this work was to
investigate the characteristics of sub-3 nm particle event.
Particle growth after nucleation is crucial to determine if
nucleated particles could grow to CCN-active sizes. We iden-
tified two growth patterns according to size spectrum charac-
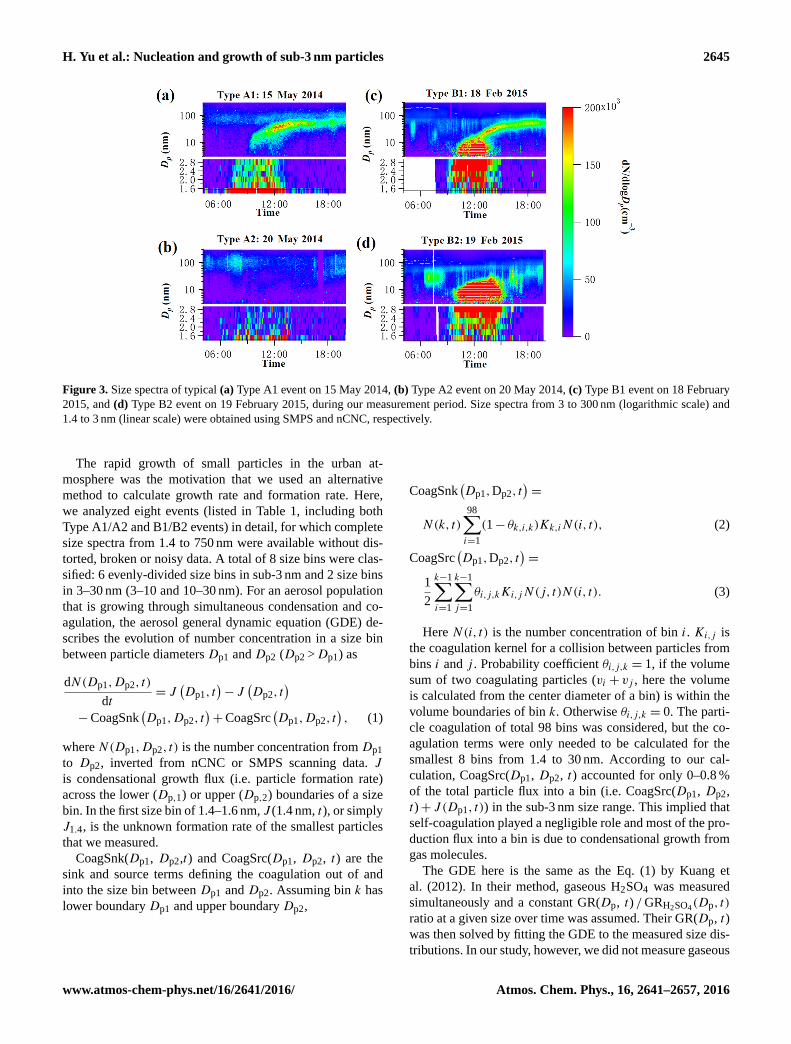
teristics in sub-3 nm size range (Fig. 3). In a Type A event
(Fig. 3a or b), size distribution n(Dp, t) was higher at smaller
sizes (e.g., 1.4–1.6 nm) than n(Dp, t) at larger sizes (e.g.,
2.7–3.0 nm). The size spectrum below 3 nm thus looked like
a “volcano”. In a Type B event (Fig. 3c or d), n(Dp, t) was
lower at smaller sizes than n(Dp, t) at larger sizes ( “up-side-
down volcano”). For the size range > 3 nm, depending on
whether a banana-shape growth was seen, we further defined
Type A1/A2 and Type B1/B2 events: particles eventually
grew to a CCN-active sizes in Type A1 and B1 events, while
in Type A2 and B2 events, banana-shape particle growth to
CCN-active sizes was not seen. Therefore, Type A1 and B1
events were equivalent to conventional NPF events based on
either DMPS or SMPS measurements.
Type B size distribution was more unusual since n(Dp, t)
of small particles were less than n(Dp, t) of large particles
in the sub-3 nm size range. We excluded the possibility of
deteriorated nCNC detection efficiencies for small particles
due to high particle loading in the sample air. This is be-
cause total number concentrations of nCNC during our mea-
surements never approached nCNC upper concentration limit
4×105 cm−3, especially in the early stage of nucleation when
total particle concentration was rather low. Our nCNC was
also calibrated periodically using H2SO4–H2O particles in a
laboratory flow tube to ensure the detection efficiency of the
Figure 2. Nsub-3 vs. J1.4 in the eight nucleation events in February,
May, December, and August during 2014–2015. The events were
indicated by different colors (blue: 1 March 2015; green: 18 Febru-
ary 2015; red: 19 February 2015; purple: 15 August 2014; black:
27 December 2014; grey: 15 May 2014; orange: 20 May 2014; yel-
low: 16 May 2014).
nCNC. The different chemical composition of atmospheric
particles could be another factor of lower detection efficien-
cies. It is well known that organic substances activate less
readily in diethylene glycol (DEG) (e.g. Kangasluoma et al.,
2014). However, it is accepted in general that larger particles
have higher mass fraction of organics than smaller particles
in a NPF process. If organic substances activate less readily
in DEG, it should be even more difficult to activate larger par-
ticles than smaller particles. Therefore, the increasing n(Dp)
with Dp (i.e. upside down volcano) could not be simply due
to lower detection efficiency of organic substances.
2.3 Formation rate and growth rate calculations with a
simplified GDE method
Conventional appearance-time method determined growth
rates (hereafter, GR) during the initial period of NPF by find-
ing the time steps when newly formed particles appeared
at certain size bins and calculating the GR from the time
differences between successive size bins (Kulmala et al.,
2012; Lehtipalo et al., 2014). This method was often not ap-
plicable to the NPF event with high GR below 3 nm, e.g.,
0.3 nm/4 min (i.e. 4.5 nm h−1) with size intervals of 0.3 nm
and scanning time intervals of 4 min in our measurements.
Furthermore, sub-3 nm particles were often generated persis-
tently throughout the daytime period. Maximum concentra-
tions in the sub-3 nm size bins could appear around noon-
time, which is a few hours later than the onset of nucleation.
Therefore, we were not able to pinpoint correctly maximum
or 50 % maximum concentrations at the onset of nucleation.
Atmos. Chem. Phys., 16, 2641–2657, 2016 www.atmos-chem-phys.net/16/2641/2016/
H. Yu et al.: Nucleation and growth of sub-3 nm particles 2645
Figure 3. Size spectra of typical (a) Type A1 event on 15 May 2014, (b) Type A2 event on 20 May 2014, (c) Type B1 event on 18 February
2015, and (d) Type B2 event on 19 February 2015, during our measurement period. Size spectra from 3 to 300 nm (logarithmic scale) and
1.4 to 3 nm (linear scale) were obtained using SMPS and nCNC, respectively.
The rapid growth of small particles in the urban at-
mosphere was the motivation that we used an alternative
method to calculate growth rate and formation rate. Here,
we analyzed eight events (listed in Table 1, including both
Type A1/A2 and B1/B2 events) in detail, for which complete
size spectra from 1.4 to 750 nm were available without dis-
torted, broken or noisy data. A total of 8 size bins were clas-
sified: 6 evenly-divided size bins in sub-3 nm and 2 size bins
in 3–30 nm (3–10 and 10–30 nm). For an aerosol population
that is growing through simultaneous condensation and co-
agulation, the aerosol general dynamic equation (GDE) de-
scribes the evolution of number concentration in a size bin
between particle diameters Dp1 and Dp2 (Dp2 >Dp1) as
dN(Dp1,Dp2, t)
dt= J
(Dp1, t
)− J
(Dp2, t
)−CoagSnk
(Dp1,Dp2, t
)+CoagSrc
(Dp1,Dp2, t
), (1)
where N(Dp1,Dp2, t) is the number concentration from Dp1
to Dp2, inverted from nCNC or SMPS scanning data. J
is condensational growth flux (i.e. particle formation rate)
across the lower (Dp,1) or upper (Dp,2) boundaries of a size
bin. In the first size bin of 1.4–1.6 nm, J (1.4 nm, t), or simply
J1.4, is the unknown formation rate of the smallest particles
that we measured.
CoagSnk(Dp1, Dp2,t) and CoagSrc(Dp1, Dp2, t) are the
sink and source terms defining the coagulation out of and
into the size bin between Dp1 and Dp2. Assuming bin k has
lower boundary Dp1 and upper boundary Dp2,
CoagSnk(Dp1,Dp2, t
)=
N(k, t)
98∑i=1
(1− θk,i,k)Kk,iN(i, t), (2)
CoagSrc(Dp1,Dp2, t
)=
1
2
k−1∑i=1
k−1∑j=1
θi,j,kKi,jN(j, t)N(i, t). (3)
Here N(i, t) is the number concentration of bin i. Ki,j is
the coagulation kernel for a collision between particles from
bins i and j . Probability coefficient θi,j,k = 1, if the volume
sum of two coagulating particles (vi + vj , here the volume
is calculated from the center diameter of a bin) is within the
volume boundaries of bin k. Otherwise θi,j,k = 0. The parti-
cle coagulation of total 98 bins was considered, but the co-
agulation terms were only needed to be calculated for the
smallest 8 bins from 1.4 to 30 nm. According to our cal-
culation, CoagSrc(Dp1, Dp2, t) accounted for only 0–0.8 %
of the total particle flux into a bin (i.e. CoagSrc(Dp1, Dp2,
t)+ J (Dp1, t)) in the sub-3 nm size range. This implied that
self-coagulation played a negligible role and most of the pro-
duction flux into a bin is due to condensational growth from
gas molecules.
The GDE here is the same as the Eq. (1) by Kuang et
al. (2012). In their method, gaseous H2SO4 was measured
simultaneously and a constant GR(Dp, t) /GRH2SO4(Dp, t)
ratio at a given size over time was assumed. Their GR(Dp, t)
was then solved by fitting the GDE to the measured size dis-
tributions. In our study, however, we did not measure gaseous
www.atmos-chem-phys.net/16/2641/2016/ Atmos. Chem. Phys., 16, 2641–2657, 2016
2646 H. Yu et al.: Nucleation and growth of sub-3 nm particles
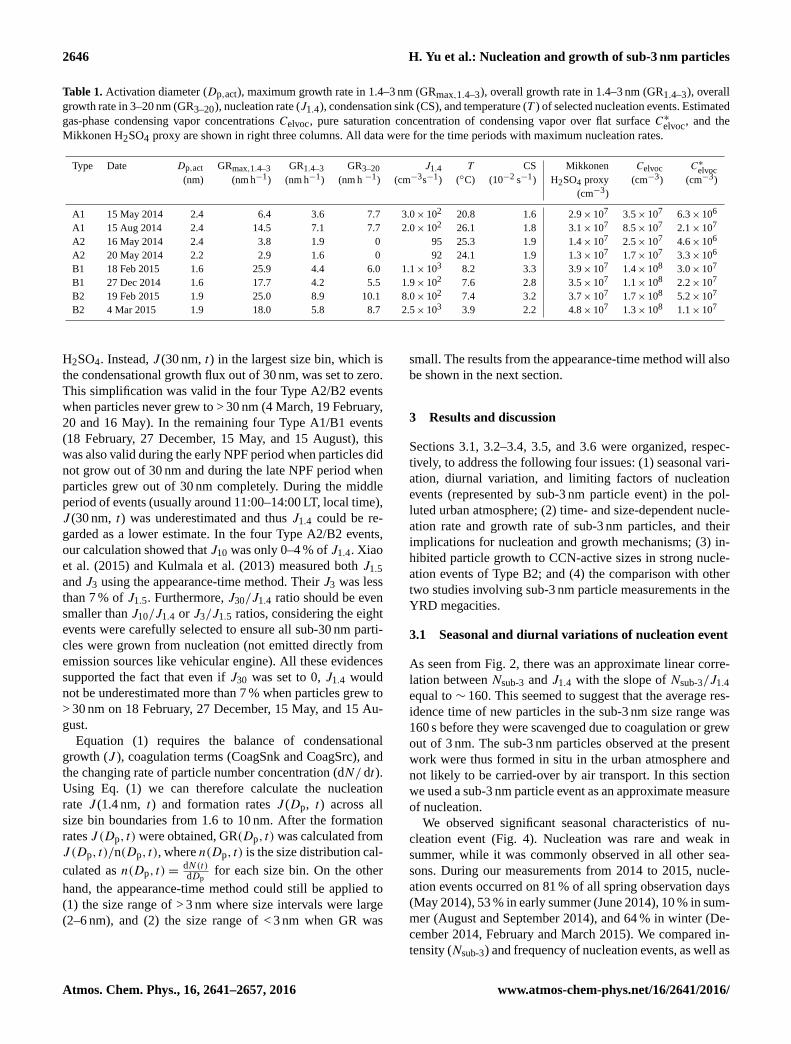
Table 1. Activation diameter (Dp,act), maximum growth rate in 1.4–3 nm (GRmax,1.4–3), overall growth rate in 1.4–3 nm (GR1.4–3), overall
growth rate in 3–20 nm (GR3–20), nucleation rate (J1.4), condensation sink (CS), and temperature (T ) of selected nucleation events. Estimated
gas-phase condensing vapor concentrations Celvoc, pure saturation concentration of condensing vapor over flat surface C∗elvoc
, and the
Mikkonen H2SO4 proxy are shown in right three columns. All data were for the time periods with maximum nucleation rates.
Type Date Dp,act GRmax,1.4–3 GR1.4–3 GR3–20 J1.4 T CS Mikkonen Celvoc C∗elvoc
(nm) (nm h−1) (nm h−1) (nm h −1) (cm−3s−1) (◦C) (10−2 s−1) H2SO4 proxy (cm−3) (cm−3)
(cm−3)
A1 15 May 2014 2.4 6.4 3.6 7.7 3.0× 10² 20.8 1.6 2.9× 10⁷ 3.5× 10⁷ 6.3× 10⁶
A1 15 Aug 2014 2.4 14.5 7.1 7.7 2.0× 10² 26.1 1.8 3.1× 10⁷ 8.5× 10⁷ 2.1× 10⁷
A2 16 May 2014 2.4 3.8 1.9 0 95 25.3 1.9 1.4× 10⁷ 2.5× 10⁷ 4.6× 10⁶
A2 20 May 2014 2.2 2.9 1.6 0 92 24.1 1.9 1.3× 10⁷ 1.7× 10⁷ 3.3× 10⁶
B1 18 Feb 2015 1.6 25.9 4.4 6.0 1.1× 10³ 8.2 3.3 3.9× 10⁷ 1.4× 10⁸ 3.0× 10⁷
B1 27 Dec 2014 1.6 17.7 4.2 5.5 1.9× 10² 7.6 2.8 3.5× 10⁷ 1.1× 10⁸ 2.2× 10⁷
B2 19 Feb 2015 1.9 25.0 8.9 10.1 8.0× 10² 7.4 3.2 3.7× 10⁷ 1.7× 10⁸ 5.2× 10⁷
B2 4 Mar 2015 1.9 18.0 5.8 8.7 2.5× 10³ 3.9 2.2 4.8× 10⁷ 1.3× 10⁸ 1.1× 10⁷
H2SO4. Instead, J (30 nm, t) in the largest size bin, which is
the condensational growth flux out of 30 nm, was set to zero.
This simplification was valid in the four Type A2/B2 events
when particles never grew to > 30 nm (4 March, 19 February,
20 and 16 May). In the remaining four Type A1/B1 events
(18 February, 27 December, 15 May, and 15 August), this
was also valid during the early NPF period when particles did
not grow out of 30 nm and during the late NPF period when
particles grew out of 30 nm completely. During the middle
period of events (usually around 11:00–14:00 LT, local time),
J (30 nm, t) was underestimated and thus J1.4 could be re-
garded as a lower estimate. In the four Type A2/B2 events,
our calculation showed that J10 was only 0–4 % of J1.4. Xiao
et al. (2015) and Kulmala et al. (2013) measured both J1.5
and J3 using the appearance-time method. Their J3 was less
than 7 % of J1.5. Furthermore, J30/J1.4 ratio should be even
smaller than J10/J1.4 or J3/J1.5 ratios, considering the eight
events were carefully selected to ensure all sub-30 nm parti-
cles were grown from nucleation (not emitted directly from
emission sources like vehicular engine). All these evidences
supported the fact that even if J30 was set to 0, J1.4 would
not be underestimated more than 7 % when particles grew to
> 30 nm on 18 February, 27 December, 15 May, and 15 Au-
gust.
Equation (1) requires the balance of condensational
growth (J ), coagulation terms (CoagSnk and CoagSrc), and
the changing rate of particle number concentration (dN/ dt).
Using Eq. (1) we can therefore calculate the nucleation
rate J (1.4 nm, t) and formation rates J (Dp, t) across all
size bin boundaries from 1.6 to 10 nm. After the formation
rates J (Dp, t)were obtained, GR(Dp, t)was calculated from
J (Dp, t)/n(Dp, t), where n(Dp, t) is the size distribution cal-
culated as n(Dp, t)=dN(t)dDp
for each size bin. On the other
hand, the appearance-time method could still be applied to
(1) the size range of > 3 nm where size intervals were large
(2–6 nm), and (2) the size range of < 3 nm when GR was
small. The results from the appearance-time method will also
be shown in the next section.
3 Results and discussion
Sections 3.1, 3.2–3.4, 3.5, and 3.6 were organized, respec-
tively, to address the following four issues: (1) seasonal vari-
ation, diurnal variation, and limiting factors of nucleation
events (represented by sub-3 nm particle event) in the pol-
luted urban atmosphere; (2) time- and size-dependent nucle-
ation rate and growth rate of sub-3 nm particles, and their
implications for nucleation and growth mechanisms; (3) in-
hibited particle growth to CCN-active sizes in strong nucle-
ation events of Type B2; and (4) the comparison with other
two studies involving sub-3 nm particle measurements in the
YRD megacities.
3.1 Seasonal and diurnal variations of nucleation event
As seen from Fig. 2, there was an approximate linear corre-
lation between Nsub-3 and J1.4 with the slope of Nsub-3/J1.4
equal to ∼ 160. This seemed to suggest that the average res-
idence time of new particles in the sub-3 nm size range was
160 s before they were scavenged due to coagulation or grew
out of 3 nm. The sub-3 nm particles observed at the present
work were thus formed in situ in the urban atmosphere and
not likely to be carried-over by air transport. In this section
we used a sub-3 nm particle event as an approximate measure
of nucleation.
We observed significant seasonal characteristics of nu-
cleation event (Fig. 4). Nucleation was rare and weak in
summer, while it was commonly observed in all other sea-
sons. During our measurements from 2014 to 2015, nucle-
ation events occurred on 81 % of all spring observation days
(May 2014), 53 % in early summer (June 2014), 10 % in sum-
mer (August and September 2014), and 64 % in winter (De-
cember 2014, February and March 2015). We compared in-
tensity (Nsub-3) and frequency of nucleation events, as well as
Atmos. Chem. Phys., 16, 2641–2657, 2016 www.atmos-chem-phys.net/16/2641/2016/
H. Yu et al.: Nucleation and growth of sub-3 nm particles 2647
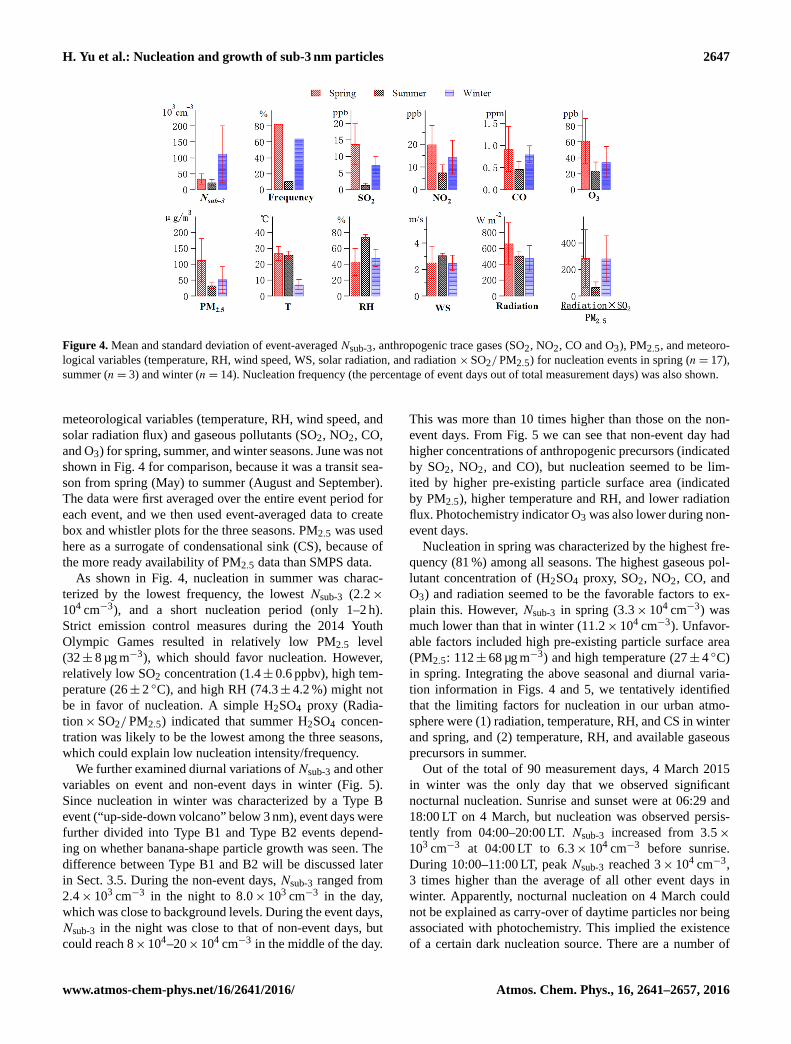
Figure 4. Mean and standard deviation of event-averaged Nsub-3, anthropogenic trace gases (SO2, NO2, CO and O3), PM2.5, and meteoro-
logical variables (temperature, RH, wind speed, WS, solar radiation, and radiation ×SO2/PM2.5) for nucleation events in spring (n= 17),
summer (n= 3) and winter (n= 14). Nucleation frequency (the percentage of event days out of total measurement days) was also shown.
meteorological variables (temperature, RH, wind speed, and
solar radiation flux) and gaseous pollutants (SO2, NO2, CO,
and O3) for spring, summer, and winter seasons. June was not
shown in Fig. 4 for comparison, because it was a transit sea-
son from spring (May) to summer (August and September).
The data were first averaged over the entire event period for
each event, and we then used event-averaged data to create
box and whistler plots for the three seasons. PM2.5 was used
here as a surrogate of condensational sink (CS), because of
the more ready availability of PM2.5 data than SMPS data.
As shown in Fig. 4, nucleation in summer was charac-
terized by the lowest frequency, the lowest Nsub-3 (2.2×
104 cm−3), and a short nucleation period (only 1–2 h).
Strict emission control measures during the 2014 Youth
Olympic Games resulted in relatively low PM2.5 level
(32± 8 µg m−3), which should favor nucleation. However,
relatively low SO2 concentration (1.4± 0.6 ppbv), high tem-
perature (26± 2 ◦C), and high RH (74.3± 4.2 %) might not
be in favor of nucleation. A simple H2SO4 proxy (Radia-
tion×SO2/PM2.5) indicated that summer H2SO4 concen-
tration was likely to be the lowest among the three seasons,
which could explain low nucleation intensity/frequency.
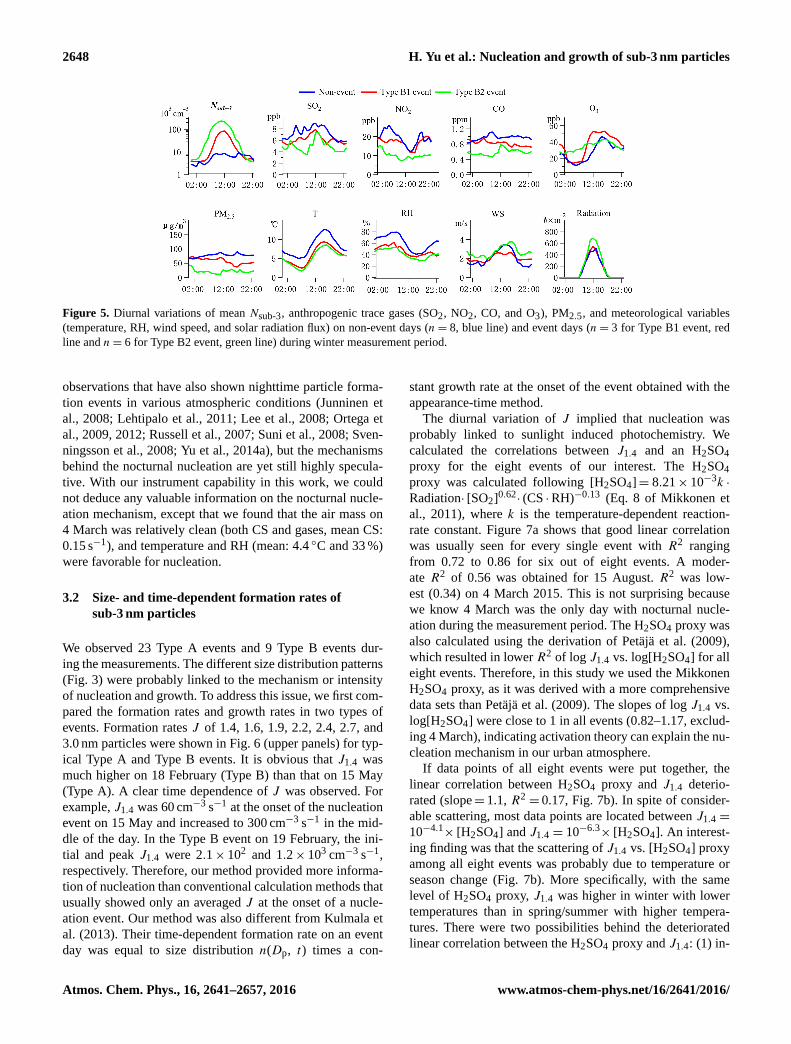
We further examined diurnal variations ofNsub-3 and other
variables on event and non-event days in winter (Fig. 5).
Since nucleation in winter was characterized by a Type B
event (“up-side-down volcano” below 3 nm), event days were
further divided into Type B1 and Type B2 events depend-
ing on whether banana-shape particle growth was seen. The
difference between Type B1 and B2 will be discussed later
in Sect. 3.5. During the non-event days, Nsub-3 ranged from
2.4× 103 cm−3 in the night to 8.0× 103 cm−3 in the day,
which was close to background levels. During the event days,
Nsub-3 in the night was close to that of non-event days, but
could reach 8×10⁴–20×104 cm−3 in the middle of the day.
This was more than 10 times higher than those on the non-
event days. From Fig. 5 we can see that non-event day had
higher concentrations of anthropogenic precursors (indicated
by SO2, NO2, and CO), but nucleation seemed to be lim-
ited by higher pre-existing particle surface area (indicated
by PM2.5), higher temperature and RH, and lower radiation
flux. Photochemistry indicator O3 was also lower during non-
event days.
Nucleation in spring was characterized by the highest fre-
quency (81 %) among all seasons. The highest gaseous pol-
lutant concentration of (H2SO4 proxy, SO2, NO2, CO, and
O3) and radiation seemed to be the favorable factors to ex-
plain this. However, Nsub-3 in spring (3.3× 104 cm−3) was
much lower than that in winter (11.2× 104 cm−3). Unfavor-
able factors included high pre-existing particle surface area
(PM2.5: 112± 68 µg m−3) and high temperature (27± 4 ◦C)
in spring. Integrating the above seasonal and diurnal varia-
tion information in Figs. 4 and 5, we tentatively identified
that the limiting factors for nucleation in our urban atmo-
sphere were (1) radiation, temperature, RH, and CS in winter
and spring, and (2) temperature, RH, and available gaseous
precursors in summer.
Out of the total of 90 measurement days, 4 March 2015
in winter was the only day that we observed significant
nocturnal nucleation. Sunrise and sunset were at 06:29 and
18:00 LT on 4 March, but nucleation was observed persis-
tently from 04:00–20:00 LT. Nsub-3 increased from 3.5×
103 cm−3 at 04:00 LT to 6.3× 104 cm−3 before sunrise.
During 10:00–11:00 LT, peak Nsub-3 reached 3× 104 cm−3,
3 times higher than the average of all other event days in
winter. Apparently, nocturnal nucleation on 4 March could
not be explained as carry-over of daytime particles nor being
associated with photochemistry. This implied the existence
of a certain dark nucleation source. There are a number of
www.atmos-chem-phys.net/16/2641/2016/ Atmos. Chem. Phys., 16, 2641–2657, 2016
2648 H. Yu et al.: Nucleation and growth of sub-3 nm particles
Figure 5. Diurnal variations of mean Nsub-3, anthropogenic trace gases (SO2, NO2, CO, and O3), PM2.5, and meteorological variables
(temperature, RH, wind speed, and solar radiation flux) on non-event days (n= 8, blue line) and event days (n= 3 for Type B1 event, red
line and n= 6 for Type B2 event, green line) during winter measurement period.
observations that have also shown nighttime particle forma-
tion events in various atmospheric conditions (Junninen et
al., 2008; Lehtipalo et al., 2011; Lee et al., 2008; Ortega et
al., 2009, 2012; Russell et al., 2007; Suni et al., 2008; Sven-
ningsson et al., 2008; Yu et al., 2014a), but the mechanisms
behind the nocturnal nucleation are yet still highly specula-
tive. With our instrument capability in this work, we could
not deduce any valuable information on the nocturnal nucle-
ation mechanism, except that we found that the air mass on
4 March was relatively clean (both CS and gases, mean CS:
0.15 s−1), and temperature and RH (mean: 4.4 ◦C and 33 %)
were favorable for nucleation.
3.2 Size- and time-dependent formation rates of
sub-3 nm particles
We observed 23 Type A events and 9 Type B events dur-
ing the measurements. The different size distribution patterns
(Fig. 3) were probably linked to the mechanism or intensity
of nucleation and growth. To address this issue, we first com-
pared the formation rates and growth rates in two types of
events. Formation rates J of 1.4, 1.6, 1.9, 2.2, 2.4, 2.7, and
3.0 nm particles were shown in Fig. 6 (upper panels) for typ-
ical Type A and Type B events. It is obvious that J1.4 was
much higher on 18 February (Type B) than that on 15 May
(Type A). A clear time dependence of J was observed. For
example, J1.4 was 60 cm−3 s−1 at the onset of the nucleation
event on 15 May and increased to 300 cm−3 s−1 in the mid-
dle of the day. In the Type B event on 19 February, the ini-
tial and peak J1.4 were 2.1× 10² and 1.2× 103 cm−3 s−1,
respectively. Therefore, our method provided more informa-
tion of nucleation than conventional calculation methods that
usually showed only an averaged J at the onset of a nucle-
ation event. Our method was also different from Kulmala et
al. (2013). Their time-dependent formation rate on an event
day was equal to size distribution n(Dp, t) times a con-
stant growth rate at the onset of the event obtained with the
appearance-time method.
The diurnal variation of J implied that nucleation was
probably linked to sunlight induced photochemistry. We
calculated the correlations between J1.4 and an H2SO4
proxy for the eight events of our interest. The H2SO4
proxy was calculated following [H2SO4]= 8.21× 10⁻³k ·
Radiation· [SO2]0.62· (CS ·RH)−0.13 (Eq. 8 of Mikkonen et
al., 2011), where k is the temperature-dependent reaction-
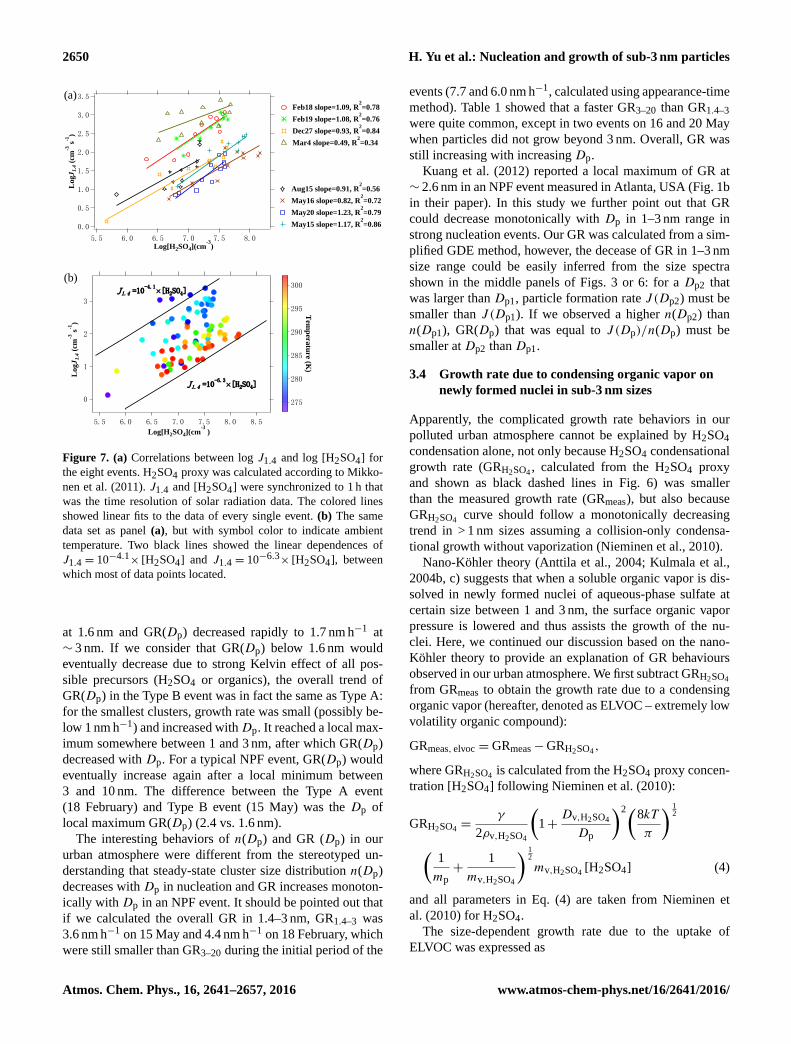
rate constant. Figure 7a shows that good linear correlation
was usually seen for every single event with R2 ranging
from 0.72 to 0.86 for six out of eight events. A moder-
ate R2 of 0.56 was obtained for 15 August. R2 was low-
est (0.34) on 4 March 2015. This is not surprising because
we know 4 March was the only day with nocturnal nucle-
ation during the measurement period. The H2SO4 proxy was
also calculated using the derivation of Petäjä et al. (2009),
which resulted in lower R2 of log J1.4 vs. log[H2SO4] for all
eight events. Therefore, in this study we used the Mikkonen
H2SO4 proxy, as it was derived with a more comprehensive
data sets than Petäjä et al. (2009). The slopes of log J1.4 vs.
log[H2SO4] were close to 1 in all events (0.82–1.17, exclud-
ing 4 March), indicating activation theory can explain the nu-
cleation mechanism in our urban atmosphere.
If data points of all eight events were put together, the
linear correlation between H2SO4 proxy and J1.4 deterio-
rated (slope= 1.1, R2= 0.17, Fig. 7b). In spite of consider-
able scattering, most data points are located between J1.4 =
10−4.1× [H2SO4] and J1.4 = 10−6.3
× [H2SO4]. An interest-
ing finding was that the scattering of J1.4 vs. [H2SO4] proxy
among all eight events was probably due to temperature or
season change (Fig. 7b). More specifically, with the same
level of H2SO4 proxy, J1.4 was higher in winter with lower
temperatures than in spring/summer with higher tempera-
tures. There were two possibilities behind the deteriorated
linear correlation between the H2SO4 proxy and J1.4: (1) in-
Atmos. Chem. Phys., 16, 2641–2657, 2016 www.atmos-chem-phys.net/16/2641/2016/
H. Yu et al.: Nucleation and growth of sub-3 nm particles 2649
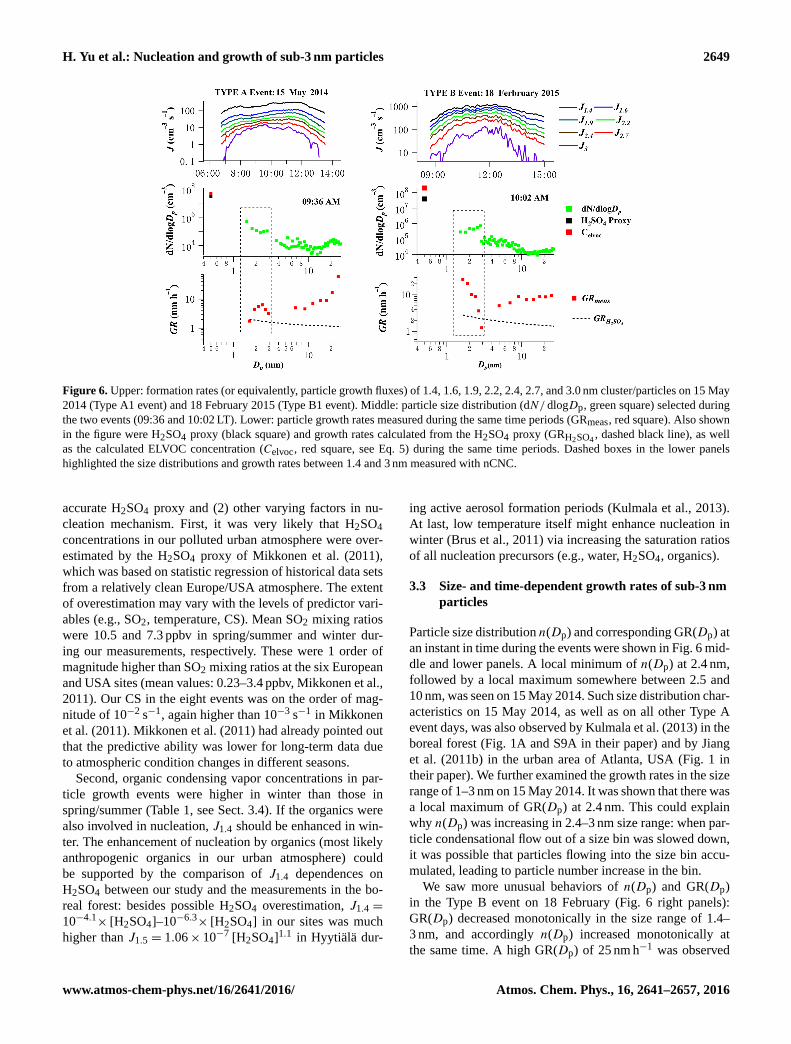
Figure 6. Upper: formation rates (or equivalently, particle growth fluxes) of 1.4, 1.6, 1.9, 2.2, 2.4, 2.7, and 3.0 nm cluster/particles on 15 May
2014 (Type A1 event) and 18 February 2015 (Type B1 event). Middle: particle size distribution (dN/ dlogDp, green square) selected during
the two events (09:36 and 10:02 LT). Lower: particle growth rates measured during the same time periods (GRmeas, red square). Also shown
in the figure were H2SO4 proxy (black square) and growth rates calculated from the H2SO4 proxy (GRH2SO4, dashed black line), as well
as the calculated ELVOC concentration (Celvoc, red square, see Eq. 5) during the same time periods. Dashed boxes in the lower panels
highlighted the size distributions and growth rates between 1.4 and 3 nm measured with nCNC.
accurate H2SO4 proxy and (2) other varying factors in nu-
cleation mechanism. First, it was very likely that H2SO4
concentrations in our polluted urban atmosphere were over-
estimated by the H2SO4 proxy of Mikkonen et al. (2011),
which was based on statistic regression of historical data sets
from a relatively clean Europe/USA atmosphere. The extent
of overestimation may vary with the levels of predictor vari-
ables (e.g., SO2, temperature, CS). Mean SO2 mixing ratios
were 10.5 and 7.3 ppbv in spring/summer and winter dur-
ing our measurements, respectively. These were 1 order of
magnitude higher than SO2 mixing ratios at the six European
and USA sites (mean values: 0.23–3.4 ppbv, Mikkonen et al.,
2011). Our CS in the eight events was on the order of mag-
nitude of 10−2 s−1, again higher than 10−3 s−1 in Mikkonen
et al. (2011). Mikkonen et al. (2011) had already pointed out
that the predictive ability was lower for long-term data due
to atmospheric condition changes in different seasons.
Second, organic condensing vapor concentrations in par-
ticle growth events were higher in winter than those in
spring/summer (Table 1, see Sect. 3.4). If the organics were
also involved in nucleation, J1.4 should be enhanced in win-
ter. The enhancement of nucleation by organics (most likely
anthropogenic organics in our urban atmosphere) could
be supported by the comparison of J1.4 dependences on
H2SO4 between our study and the measurements in the bo-
real forest: besides possible H2SO4 overestimation, J1.4 =
10−4.1× [H2SO4]–10−6.3
× [H2SO4] in our sites was much
higher than J1.5 = 1.06× 10⁻⁷ [H2SO4]1.1 in Hyytiälä dur-
ing active aerosol formation periods (Kulmala et al., 2013).
At last, low temperature itself might enhance nucleation in
winter (Brus et al., 2011) via increasing the saturation ratios
of all nucleation precursors (e.g., water, H2SO4, organics).
3.3 Size- and time-dependent growth rates of sub-3 nm
particles
Particle size distribution n(Dp) and corresponding GR(Dp) at
an instant in time during the events were shown in Fig. 6 mid-
dle and lower panels. A local minimum of n(Dp) at 2.4 nm,
followed by a local maximum somewhere between 2.5 and
10 nm, was seen on 15 May 2014. Such size distribution char-
acteristics on 15 May 2014, as well as on all other Type A
event days, was also observed by Kulmala et al. (2013) in the
boreal forest (Fig. 1A and S9A in their paper) and by Jiang
et al. (2011b) in the urban area of Atlanta, USA (Fig. 1 in
their paper). We further examined the growth rates in the size
range of 1–3 nm on 15 May 2014. It was shown that there was
a local maximum of GR(Dp) at 2.4 nm. This could explain
why n(Dp) was increasing in 2.4–3 nm size range: when par-
ticle condensational flow out of a size bin was slowed down,
it was possible that particles flowing into the size bin accu-
mulated, leading to particle number increase in the bin.
We saw more unusual behaviors of n(Dp) and GR(Dp)
in the Type B event on 18 February (Fig. 6 right panels):
GR(Dp) decreased monotonically in the size range of 1.4–
3 nm, and accordingly n(Dp) increased monotonically at
the same time. A high GR(Dp) of 25 nm h−1 was observed
www.atmos-chem-phys.net/16/2641/2016/ Atmos. Chem. Phys., 16, 2641–2657, 2016
2650 H. Yu et al.: Nucleation and growth of sub-3 nm particles
3.5
3.0
2.5
2.0
1.5
1.0
0.5
0.0
Lo
gJ
1.4
(cm
-3 s
-1)
8.07.57.06.56.05.5Log[H2SO4](cm
-3)
Feb18 slope=1.09, R2=0.78
Feb19 slope=1.08, R2=0.76
Dec27 slope=0.93, R2=0.84
Mar4 slope=0.49, R2=0.34
Aug15 slope=0.91, R2=0.56
May16 slope=0.82, R2=0.72
May20 slope=1.23, R2=0.79
May15 slope=1.17, R2=0.86
(a)
3
2
1
0
LogJ
1.4
(cm
-3 s
-1)
8.58.07.57.06.56.05.5
Log[H2SO4](cm-3
)
300
295
290
285
280
275
Tem
pera
ture (K
)
J1.4 =10-4.1
×[H2SO4]
J1.4 =10-6.3
×[H2SO4]
(b)
Figure 7. (a) Correlations between log J1.4 and log [H2SO4] for
the eight events. H2SO4 proxy was calculated according to Mikko-
nen et al. (2011). J1.4 and [H2SO4] were synchronized to 1 h that
was the time resolution of solar radiation data. The colored lines
showed linear fits to the data of every single event. (b) The same
data set as panel (a), but with symbol color to indicate ambient
temperature. Two black lines showed the linear dependences of
J1.4 = 10−4.1× [H2SO4] and J1.4 = 10−6.3
× [H2SO4], between
which most of data points located.
at 1.6 nm and GR(Dp) decreased rapidly to 1.7 nm h−1 at
∼ 3 nm. If we consider that GR(Dp) below 1.6 nm would
eventually decrease due to strong Kelvin effect of all pos-
sible precursors (H2SO4 or organics), the overall trend of
GR(Dp) in the Type B event was in fact the same as Type A:
for the smallest clusters, growth rate was small (possibly be-
low 1 nm h−1) and increased withDp. It reached a local max-
imum somewhere between 1 and 3 nm, after which GR(Dp)
decreased with Dp. For a typical NPF event, GR(Dp) would
eventually increase again after a local minimum between
3 and 10 nm. The difference between the Type A event
(18 February) and Type B event (15 May) was the Dp of
local maximum GR(Dp) (2.4 vs. 1.6 nm).
The interesting behaviors of n(Dp) and GR (Dp) in our
urban atmosphere were different from the stereotyped un-
derstanding that steady-state cluster size distribution n(Dp)
decreases with Dp in nucleation and GR increases monoton-
ically with Dp in an NPF event. It should be pointed out that
if we calculated the overall GR in 1.4–3 nm, GR1.4–3 was
3.6 nm h−1 on 15 May and 4.4 nm h−1 on 18 February, which
were still smaller than GR3–20 during the initial period of the
events (7.7 and 6.0 nm h−1, calculated using appearance-time
method). Table 1 showed that a faster GR3–20 than GR1.4–3
were quite common, except in two events on 16 and 20 May
when particles did not grow beyond 3 nm. Overall, GR was
still increasing with increasing Dp.
Kuang et al. (2012) reported a local maximum of GR at
∼ 2.6 nm in an NPF event measured in Atlanta, USA (Fig. 1b
in their paper). In this study we further point out that GR
could decrease monotonically with Dp in 1–3 nm range in
strong nucleation events. Our GR was calculated from a sim-
plified GDE method, however, the decease of GR in 1–3 nm
size range could be easily inferred from the size spectra
shown in the middle panels of Figs. 3 or 6: for a Dp2 that
was larger than Dp1, particle formation rate J (Dp2) must be
smaller than J (Dp1). If we observed a higher n(Dp2) than
n(Dp1), GR(Dp) that was equal to J (Dp)/n(Dp) must be
smaller at Dp2 than Dp1.
3.4 Growth rate due to condensing organic vapor on
newly formed nuclei in sub-3 nm sizes
Apparently, the complicated growth rate behaviors in our
polluted urban atmosphere cannot be explained by H2SO4
condensation alone, not only because H2SO4 condensational
growth rate (GRH2SO4, calculated from the H2SO4 proxy
and shown as black dashed lines in Fig. 6) was smaller
than the measured growth rate (GRmeas), but also because
GRH2SO4curve should follow a monotonically decreasing
trend in > 1 nm sizes assuming a collision-only condensa-
tional growth without vaporization (Nieminen et al., 2010).
Nano-Köhler theory (Anttila et al., 2004; Kulmala et al.,
2004b, c) suggests that when a soluble organic vapor is dis-
solved in newly formed nuclei of aqueous-phase sulfate at
certain size between 1 and 3 nm, the surface organic vapor
pressure is lowered and thus assists the growth of the nu-
clei. Here, we continued our discussion based on the nano-
Köhler theory to provide an explanation of GR behaviours
observed in our urban atmosphere. We first subtract GRH2SO4
from GRmeas to obtain the growth rate due to a condensing
organic vapor (hereafter, denoted as ELVOC – extremely low
volatility organic compound):
GRmeas, elvoc = GRmeas−GRH2SO4,
where GRH2SO4is calculated from the H2SO4 proxy concen-
tration [H2SO4] following Nieminen et al. (2010):
GRH2SO4=
γ
2ρv,H2SO4
(1+
Dv,H2SO4
Dp
)2(8kT
π
) 12
(1
mp
+1
mv,H2SO4
) 12
mv,H2SO4[H2SO4] (4)
and all parameters in Eq. (4) are taken from Nieminen et
al. (2010) for H2SO4.
The size-dependent growth rate due to the uptake of
ELVOC was expressed as
Atmos. Chem. Phys., 16, 2641–2657, 2016 www.atmos-chem-phys.net/16/2641/2016/

H. Yu et al.: Nucleation and growth of sub-3 nm particles 2651
GRelvoc =γ
2ρv,elvoc
(1+
Dv,elvoc
Dp
)2(8kT
π
) 12
(1
mp
+1
mv,elvoc
) 12
mv,elvoc (Celvoc−Csurface) , (5)
where Celvoc is gas-phase ELVOC concentration far from the
particle. The net uptake of ELVOC is driven by the differ-
ence of Celvoc and equilibrium surface concentration over
the particle Csurface. Csurface is determined by the pure com-
ponent saturation vapor pressure C∗elvoc, particle curvature
exp(
4σvkTDp
)and particle composition:
Csurface = C∗
elvoc exp
(4σv
kTDp
)xDp .
xDp is the mole fraction of water-soluble ELVOC in the
pseudobinary solution consisting of ELVOC and the aque-
ous sulfate nuclei. The pseudobinary solution was treated
ideal here. An example of xDp as a function of Dp was
shown in Fig. 8a. Nuclei activation diameter Dp,act is the
size that ELVOC fraction begins to increase significantly.
For Dp <Dp,act, xDp is approximated with a fixed value (x0).
For Dp >Dp,act, xDp increases significantly with the organ-
ics being added to the sulfate core of Dp,act size. The size-
dependent xDp is approximated as
xDp =
x0, Dp <Dp,act
x0+(D3
p −D3p,act)/velvoc
(D3p −D
3p,act)/velvoc+D
3p,act/vsulfate
, Dp ≥Dp,act,
Considering strong Kelvin effect, Csurface decreases with
increasing Dp for Dp <Dp,act (Fig. 8b dashed black line).
ForDp >Dp,act, the rapidly increasing organic fraction in the
small size regime of 2–3 nm raises the equilibrium Csurface of
ELVOC first. Then for 3–6 nm particles that are dominated
by organics, Csurface decreases to merge with the Kelvin
curve of a pure organic droplet (red line, Fig. 8b). The com-
plete equilibrium curve of Csurface in 1–6 nm (dashed+ solid
black lines) was shown in Fig. 8c. The blue line represented
the calculated Celvoc−Csurface. The trend of Celvoc−Csurface
coincided with the size dependence of the measured GR cor-
rected by H2SO4 (GRmeas,elvoc, Fig. 8d blue circle). Dp,act
corresponded to the size with local maximum GRmeas,elvoc.
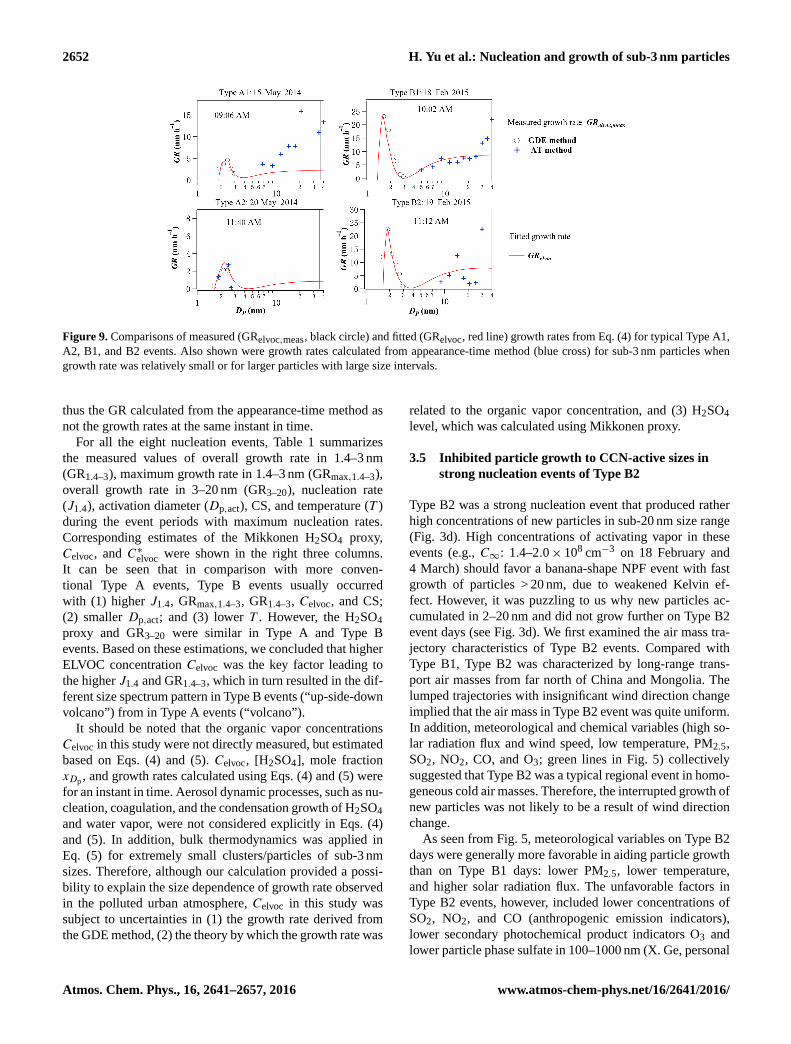
We fitted GRelvoc with GRmeas,elvoc in sub-3 nm sizes
at an instant in time by adjusting three free parame-
ters in Eq. (5): x0, Celvoc, and C∗elvoc. Other parame-
ters like surface tension (0.02 Nm−1) and molar volume
(135.5 cm3 mol−1) of ELVOC were taken from Kulmala et
al. (2004b). Molecule diameter dv (0.8 nm) and condensed-
phase density ρv (1.5 g cm−3) of ELVOC were taken from
Ehn et al. (2014). Uptake coefficient γ was calculated fol-
lowing Nieminen et al. (2010). The fitting results in Fig. 9
showed that the dependence of GRmeas,elvoc on Dp below
�����������
���������
������
�� �
������Diameter (nm)
�����������
���������
������
�� �
���
��
���
���
���
���������������
����
��
�
�����
����
Dp,act
(a)
Kelvin curve -pure organic droplet Kelvin curve -binary solution
with a fixed organic fraction Csurface for Dp > Dp,act (nano-Köhler curve) Csurface for Dp < Dp,act
�� ��
�� ����������
(b)
(c)
xDp of ELVOC in a binary solution
of sulfate nuclei and condensing ELVOC
GRH2SO4
GRmeas -GRH2SO4
(d)
Figure 8. (a) Mole fraction of organics (xDp) in a binary solution
of sulfate nuclei and activating organics (ELVOC) in a new par-
ticle. Nuclei activation diameter Dp,act is the size where ELVOC
begins to dilute the nuclei. (b) Kelvin equilibrium curves over a
pure organic droplet (red line) and a binary solution with a fixed
organic fraction (green line), nano-Köhler curve for Dp >Dp,act
(black solid line) and surface concentration Csurface forDp <Dp,act
(black dashed line). (c) Gas phase concentration of the organic
vapor (Celvoc, cyan line), surface concentration C∞ (black line),
and Celvoc−Csurface (blue line). (d) Growth rate GRH2SO4due
to H2SO4 (Mikkonen proxy) and growth rate due to organic vapor
GRelvoc,meas, calculated as GRmeas−GRH2SO4.
3 nm could be well reproduced by Eq. (5) for both Type A
and Type B events. Free parameter x0 determined the mag-
nitude of the dashed black line in Fig. 8b. x0 was fitted
to be 0.07–0.42 for the eight events. C∞ was sensitive to
the local maximum GRmeas,elvoc at the Dp,act. Celvoc, and
C∗elvoc determined the local minimum GRmeas,elvoc at the right
side of Dp,act. Therefore, C∗ and C∞ were basically deter-
mined by the measured GR (local maximum and local mini-
mum) and not sensitive to x0. As shown in Table 1, the con-
densing organic vapor concentrations Celvoc were 1.7×10⁷–
1.7× 108 cm−3. The saturation vapor concentrations C∗elvoc
were 3.3× 10⁶–5.2× 107 cm−3; they were within the orders
of magnitude of 107–108 cm−3 and 106–107 cm−3 suggested
by Kulmala et al. (2004b), respectively.
For comparison, the GR calculated from the appearance-
time method was also shown in Fig. 9 (blue cross) for > 3 nm
particles on 15 May, 18 and 19 February, as well as for sub-
3 nm particles on 20 May when particle growth was relatively
slow. It can be seen that the GR on 20 May calculated from
the two methods agreed well with each other, lending credit
to our GDE method. The GR in > 10 nm sizes was usually
underestimated by GRelvoc. This could be interpreted as other
condensing vapors with higher volatility may contribute to
particle growth in the larger particles. It should be noted that
the appearance-time method followed the time steps when
newly formed particles appeared in successive size bins and
www.atmos-chem-phys.net/16/2641/2016/ Atmos. Chem. Phys., 16, 2641–2657, 2016
2652 H. Yu et al.: Nucleation and growth of sub-3 nm particles
Figure 9. Comparisons of measured (GRelvoc,meas, black circle) and fitted (GRelvoc, red line) growth rates from Eq. (4) for typical Type A1,
A2, B1, and B2 events. Also shown were growth rates calculated from appearance-time method (blue cross) for sub-3 nm particles when
growth rate was relatively small or for larger particles with large size intervals.
thus the GR calculated from the appearance-time method as
not the growth rates at the same instant in time.
For all the eight nucleation events, Table 1 summarizes
the measured values of overall growth rate in 1.4–3 nm
(GR1.4–3), maximum growth rate in 1.4–3 nm (GRmax,1.4–3),
overall growth rate in 3–20 nm (GR3–20), nucleation rate
(J1.4), activation diameter (Dp,act), CS, and temperature (T )
during the event periods with maximum nucleation rates.
Corresponding estimates of the Mikkonen H2SO4 proxy,
Celvoc, and C∗elvoc were shown in the right three columns.
It can be seen that in comparison with more conven-
tional Type A events, Type B events usually occurred
with (1) higher J1.4, GRmax,1.4–3, GR1.4–3, Celvoc, and CS;
(2) smaller Dp,act; and (3) lower T . However, the H2SO4
proxy and GR3–20 were similar in Type A and Type B
events. Based on these estimations, we concluded that higher
ELVOC concentration Celvoc was the key factor leading to
the higher J1.4 and GR1.4–3, which in turn resulted in the dif-
ferent size spectrum pattern in Type B events (“up-side-down
volcano”) from in Type A events (“volcano”).
It should be noted that the organic vapor concentrations
Celvoc in this study were not directly measured, but estimated
based on Eqs. (4) and (5). Celvoc, [H2SO4], mole fraction
xDp , and growth rates calculated using Eqs. (4) and (5) were
for an instant in time. Aerosol dynamic processes, such as nu-
cleation, coagulation, and the condensation growth of H2SO4
and water vapor, were not considered explicitly in Eqs. (4)
and (5). In addition, bulk thermodynamics was applied in
Eq. (5) for extremely small clusters/particles of sub-3 nm
sizes. Therefore, although our calculation provided a possi-
bility to explain the size dependence of growth rate observed
in the polluted urban atmosphere, Celvoc in this study was
subject to uncertainties in (1) the growth rate derived from
the GDE method, (2) the theory by which the growth rate was
related to the organic vapor concentration, and (3) H2SO4
level, which was calculated using Mikkonen proxy.
3.5 Inhibited particle growth to CCN-active sizes in
strong nucleation events of Type B2
Type B2 was a strong nucleation event that produced rather
high concentrations of new particles in sub-20 nm size range
(Fig. 3d). High concentrations of activating vapor in these
events (e.g., C∞: 1.4–2.0× 108 cm−3 on 18 February and
4 March) should favor a banana-shape NPF event with fast
growth of particles > 20 nm, due to weakened Kelvin ef-
fect. However, it was puzzling to us why new particles ac-
cumulated in 2–20 nm and did not grow further on Type B2
event days (see Fig. 3d). We first examined the air mass tra-
jectory characteristics of Type B2 events. Compared with
Type B1, Type B2 was characterized by long-range trans-
port air masses from far north of China and Mongolia. The
lumped trajectories with insignificant wind direction change
implied that the air mass in Type B2 event was quite uniform.
In addition, meteorological and chemical variables (high so-
lar radiation flux and wind speed, low temperature, PM2.5,
SO2, NO2, CO, and O3; green lines in Fig. 5) collectively
suggested that Type B2 was a typical regional event in homo-
geneous cold air masses. Therefore, the interrupted growth of
new particles was not likely to be a result of wind direction
change.
As seen from Fig. 5, meteorological variables on Type B2
days were generally more favorable in aiding particle growth
than on Type B1 days: lower PM2.5, lower temperature,
and higher solar radiation flux. The unfavorable factors in
Type B2 events, however, included lower concentrations of
SO2, NO2, and CO (anthropogenic emission indicators),
lower secondary photochemical product indicators O3 and
lower particle phase sulfate in 100–1000 nm (X. Ge, personal
Atmos. Chem. Phys., 16, 2641–2657, 2016 www.atmos-chem-phys.net/16/2641/2016/

H. Yu et al.: Nucleation and growth of sub-3 nm particles 2653
communication, 2015; X. Ge conducted simultaneous AMS
measurement during our measurement periods). All of these
evidences suggested that further particle growth in Type B2
events was limited by certain condensing vapor other than
ELVOC. Consequently, although there was a pool of sub-
20 nm particles, they were not further “activated” due to the
low availability of this condensing vapor. Following the ter-
minology of Donahue et al. (2011, 2012), we called this con-
densing vapor LVOC (low volatility organic compounds).
The above hypothesis was sound if we considered that the
identity of LVOC for the growth of particles > 20 nm could
be different from ELVOC for sub-3 nm particle growth. Hir-
sikko et al. (2005) observed that GR3–20 demonstrated an op-
posite seasonal cycle to GR1.3–3: GR3–20 was higher in sum-
mer, whereas GR1.3–3 was higher in winter. This suggested
that the condensing vapors were different in identity for par-
ticles of different sizes. Hirsikko et al. (2005) attributed the
condensing vapors for GR3–20 to biogenetic VOCs. In our ur-
ban atmosphere, according to Fig. 5, LVOC was more likely
to be from anthropogenic sources associated with SO2, NOx ,
and CO emissions. A picture of the growth process was thus
like this: ELVOC of lower volatility, lower concentration, and
higher water solubility activated inorganic nuclei and accel-
erated particle growth in smaller sizes. This in turn assisted in
the condensation of LVOC of high volatility, low solubility,
but with larger amount of mass. The further growth of parti-
cles > 20 nm, which means significant increment of particle
mass, needed continuous supply of LVOC from the anthro-
pogenic sources. On the Type B2 days, LVOC supply was
not adequate (low SO2, CO and NOx). As a result, continu-
ous banana-shape particle growth did not take place.
3.6 Comparison with two other sub-3 nm particle
studies in the YRD megacities
Herrmann et al. (2014), Xiao et al. (2015), and this study
investigated sub-3 nm particle occurrences in the polluted
megacities (Nanjing and Shanghai) of the YRD region. Our
study had three advantages over previous studies: (1) we de-
rived time- and size-resolved nucleation rate and growth rate,
and thus provide more information about NPF, (2) we decou-
pled the nucleation and growth processes by differentiating
sub-3 nm particle events from conventional NPF events. This
allowed us to investigate the controlling factors in the two
processes respectively, (3) our measurement period covered
spring, summer, and winter seasons, and thus wider ranges
of environmental condition variables. Here we compared the
results from the three studies. The objective was to investi-
gate how these independent studies contribute collectively to
the understanding of NPF in the YRD megacities.
First, we compared the NPF frequency, nucleation rate,
and growth rate. All three studies detected NPF events on
about 20 % of winter observation days. Including summer
and spring with fewer events, we observed the overall NPF
frequency was 10 % in Nanjing. Using sub-3 nm particle
event as an approximate measure of nucleation, we found nu-
cleation frequency actually much higher (47 % of all obser-
vation days). Xiao et al. (2015) observed that average J1.34
at the onset of winter nucleation events was 188 cm−3 s−1 in
Shanghai. Using a different GDE method, we found that the
event-averaged J1.4 ranged from 20 to 500 cm−3 s−1 in the
eight events. Clear diurnal variations of J1.4 was observed
with peak values up to 2500 cm−3 s−1. In the size range of 3–
30 nm, GR was quite close in all three studies, ranging from
4.5–11 nm h−1. In the sub-3 nm size range, however, our me-
dian GR1.4–3 was 4.3 nm h−1, which was higher than median
GR1.35–2.39 of 0.94 nm h−1 observed in Shanghai.
From these comparisons we concluded that (1) nucleation
rate in the polluted YRD urban area was clearly higher than
those typically observed in most remote or moderately pol-
luted environments (Jiang et al., 2011b; Kuang et al., 2012;
Kulmala et al., 2013; Lehtipalo et al., 2009, 2010, 2011; Yu
et al., 2014a, b); (2) our results showed a wider range of
nucleation rate (a few to 2.5× 103 cm−3 s−1) than Xiao et
al. (2015) and Herrmann et al. (2014), not only because our
data covered 3 seasons, but also because our time-resolved J
included the entire nucleation period. (3) GR in the sub-3 nm
size range was higher in our study than in Shanghai, partly
because the GDE method allowed one to determine higher
GR than the appearance-time method.
Second, we compared the NPF mechanisms in this pol-
luted area reported by the three studies. Based on winter data
only, Herrmann et al. (2014) did not find any correlation be-
tween temperature and nucleation in Nanjing. But if combin-
ing data from different seasons, we found significant negative
correlation between J1.4 and temperature (Fig. 7b), implying
atmospheric nucleation was not favored under high temper-
ature conditions. Herrmann et al. (2014) suggested SO2 was
excessive for the winter NPF in Nanjing. We further pointed
out that SO2 may not be excessive in summer and is an unfa-
vorable factor of rare summer nucleation event. Based only
on winter observations, Herrmann et al. (2014) and Xiao et
al. (2015) identified radiation or H2SO4 as the main driving
force of NPF and CS as the main obstacle. While we recog-
nized this, we concluded that other environmental variables
like temperature and RH can also control the occurrence
of atmospheric nucleation under various atmospheric condi-
tions. Furthermore, for the subsequent growth of sub-3 nm
particles to CCN-active sizes, the supply of anthropogenic
gaseous precursors other that H2SO4 can also become a lim-
iting factor.
Last, all the three studies tried to correlate Mikkonen’s
H2SO4 proxy to nucleation rate or growth rate. Only our
study produced a significant correlation between J and
[H2SO4]n (R2= 0.56–0.86) with n= 0.82–1.2 (Fig. 7a). The
better correlation was mainly because we used hourly J and
[H2SO4] data, whereas the other two studies had fewer data
points, i.e., one J value for each event. Xiao et al. (2015)
proposed that the H2SO4 proxy was sufficient to explain their
observed GR1.34–3. In contrast, our study suggested that other
www.atmos-chem-phys.net/16/2641/2016/ Atmos. Chem. Phys., 16, 2641–2657, 2016
2654 H. Yu et al.: Nucleation and growth of sub-3 nm particles
condensing vapors were needed to explain GR in both sub-
3 nm and > 3 nm size ranges.
4 Conclusion
NPF can contribute to CCN only after going through nucle-
ation, initial growth steps, and subsequent growth to CCN-
active sizes. This study provided the evidences of limiting
factors in these processes in a polluted urban atmosphere
in China. We observed atmospheric nucleation events on 42
out of total 90 observation days, but particles could grow
to CCN-active sizes on only 9 days, which was equivalent
to nine conventional NPF events. In summer, strict emission
control measures during the 2014 Youth Olympic Games re-
sulted in relatively low PM2.5 and anthropogenic trace gases
(SO2, NO2, CO, and O3) levels. Infrequent nucleation was
thus limited by both low concentrations of gaseous precur-
sors and high temperature and RH in summer. In more pol-
luted winter and spring atmosphere, precursor supply was
not limiting anymore; nucleation occurred once meteoro-
logical conditions were favorable (i.e. low CS and temper-
ature/RH, higher solar radiation). However, for the further
growth of sub-3 nm particles to CCN-active sizes, anthro-
pogenic gaseous precursors again became limiting factors.
A simplified GDE method was used in this study to calcu-
late particle formation rates first and then growth rates. Nu-
cleation events were strong in the polluted urban atmosphere
of Nanjing. Initial J1.4 at the onset and peak J1.4 at the noon-
time could be up to 2.1×10² and 2.5×103 cm−3 s−1, respec-
tively, during the eight nucleation events selected from dif-
ferent seasons. The diurnal variation of J1.4 implied that nu-
cleation was usually linked to sunlight induced photochem-
istry. Time-dependent J1.4 showed good linear correlations
with the H2SO4 proxy for every single event, except a day
with significant nocturnal nucleation. However, the correla-
tion between J1.4 and the H2SO4 proxy for all eight events
deteriorated, which might reflect the effect of temperature or
assisting vapor concentration in the nucleation. The deteri-
orated correlation could also be due to the lower predictive
ability of the H2SO4 proxy in the polluted urban atmosphere
for different seasons.
In all nucleation events, a local maximum growth rate was
observed between 1 and 3 nm with GR up to 25 nm h−1.
This means GR was not monotonically increasing with par-
ticle size. The overall GR1.4–3, however, was still smaller
than GR3–20, if particles could grow beyond 3 nm. How-
ever, it should be noted that the existence of local max-
ima GR in sub-3 nm is highly sensitive to the uncertainty
of size distribution derivation, i.e. the moving average filter
was used to smooth original noisy raw data of N1.5, N1.8,
N2.0, N2.3, N2.6, and N2.8. The noise is due to the nature
of sub-3 nm cluster dynamics, environmental conditions, and
instrumental uncertainties. On the other hand, the GR obser-
vation is potentially real and might give new insight into clus-
ter dynamics in polluted environments. The local maximum
growth rate was interpreted as the solvation effect of organic
activating vapor in newly formed inorganic nuclei. Based
on our estimation, high ELVOC concentration of 2.3× 10⁷–
2.0× 108 cm−3 was expected to be the key factor leading to
high GR1.4–3. The varying GR of new particles in turn re-
sulted in the different particle growth patterns that we ob-
served in Nanjing.
Our results call for a more robust proxy of gaseous H2SO4
to be developed for polluted urban conditions. The study
also highlighted the importance of estimating or measuring
activating organic vapor levels (using CI-APi-TOF, for ex-
ample) in the initial growth steps of atmospheric NPF. Our
year-round measurement data provided valuable size evolu-
tion data of sub-3 nm clusters/particles to evaluate previous
aerosol dynamic models of new particle formation. A robust
dynamic model was needed to appropriately treat all aerosol
and gas-phase processes in the initial growth steps.
Acknowledgements. This work was supported by National Sci-
ence Foundation of China (grant nos. 41405116, 21577065 and
91543115), Natural Science Foundation of Jiangsu Province
(grant no. BK20140989), and Jiangsu Specially Appointed Pro-
fessor grant and International ST Cooperation Program of China
(2014DFA90780). The measurement campaigns were partially
funded by the Priority Academic Program Development of Jiangsu
Higher Education Institutions (PAPD). J. Zheng acknowledges
funding support from NSFC 41275142 and 41575122. We thank
Vijay P. Kanawade and Xinlei Ge for valuable discussions. The
comments from the editor helped us to improve the manuscript and
are highly appreciated by the authors.
Edited by: M. Kulmala
References
Almeida, J., Schobesberger, S., Kurten, A., Ortega, I. K.,
Kupiainen-Maatta, O., Praplan, A. P., Adamov, A., Amorim, A.,
Bianchi, F., Breitenlechner, M., David, A., Dommen, J., Don-
ahue, N. M., Downard, A., Dunne, E., Duplissy, J., Ehrhart, S.,
Flagan, R. C., Franchin, A., Guida, R., Hakala, J., Hansel, A.,
Heinritzi, M., Henschel, H., Jokinen, T., Junninen, H., Kajos, M.,
Kangasluoma, J., Keskinen, H., Kupc, A., Kurten, T., Kvashin,
A. N., Laaksonen, A., Lehtipalo, K., Leiminger, M., Leppa,
J., Loukonen, V., Makhmutov, V., Mathot, S., McGrath, M. J.,
Nieminen, T., Olenius, T., Onnela, A., Petaja, T., Riccobono, F.,
Riipinen, I., Rissanen, M., Rondo, L., Ruuskanen, T., Santos, F.
D., Sarnela, N., Schallhart, S., Schnitzhofer, R., Seinfeld, J. H.,
Simon, M., Sipila, M., Stozhkov, Y., Stratmann, F., Tome, A.,
Trostl, J., Tsagkogeorgas, G., Vaattovaara, P., Viisanen, Y., Vir-
tanen, A., Vrtala, A., Wagner, P. E., Weingartner, E., Wex, H.,
Williamson, C., Wimmer, D., Ye, P., Yli-Juuti, T., Carslaw, K.
S., Kulmala, M., Curtius, J., Baltensperger, U., Worsnop, D. R.,
Vehkamaki, H., and Kirkby, J.: Molecular understanding of sul-
phuric acid-amine particle nucleation in the atmosphere, Nature,
502, 359–363, doi:10.1038/nature12663, 2013.
Atmos. Chem. Phys., 16, 2641–2657, 2016 www.atmos-chem-phys.net/16/2641/2016/
H. Yu et al.: Nucleation and growth of sub-3 nm particles 2655
Anttila, T., Kerminen, V.-M., Kulmala, M., Laaksonen, A., and
O’Dowd, C. D.: Modelling the formation of organic parti-
cles in the atmosphere, Atmos. Chem. Phys., 4, 1071–1083,
doi:10.5194/acp-4-1071-2004, 2004.
Asmi, E., Sipilä, M., Manninen, H. E., Vanhanen, J., Lehtipalo, K.,
Gagné, S., Neitola, K., Mirme, A., Mirme, S., Tamm, E., Uin, J.,
Komsaare, K., Attoui, M., and Kulmala, M.: Results of the first
air ion spectrometer calibration and intercomparison workshop,
Atmos. Chem. Phys., 9, 141–154, doi:10.5194/acp-9-141-2009,
2009.
Brus, D., Neitola, K., Hyvärinen, A.-P., Petäjä, T., Vanhanen, J.,
Sipilä, M., Paasonen, P., Kulmala, M., and Lihavainen, H.: Ho-
mogenous nucleation of sulfuric acid and water at close to atmo-
spherically relevant conditions, Atmos. Chem. Phys., 11, 5277–
5287, doi:10.5194/acp-11-5277-2011, 2011.
Chan, C. K. and Yao, X.: Air pollution in mega cities in China,
Atmos. Environ., 42, 1–42, doi:10.1016/j.atmosenv.2007.09.003,
2008.
Donahue, N. M., Trump, E. R., Pierce, J. R., and Riipinen, I.: Theo-
retical constraints on pure vapor-pressure driven condensation of
organics to ultrafine particles, Geophys. Res. Lett., 38, L16801,
doi:10.1029/2011gl048115, 2011.
Donahue, N. M., Kroll, J. H., Pandis, S. N., and Robinson, A. L.:
A two-dimensional volatility basis set – Part 2: Diagnostics of
organic-aerosol evolution, Atmos. Chem. Phys., 12, 615–634,
doi:10.5194/acp-12-615-2012, 2012.
Ehn, M., Thornton, J. A., Kleist, E., Sipila, M., Junninen, H., Pulli-
nen, I., Springer, M., Rubach, F., Tillmann, R., Lee, B., Lopez-
Hilfiker, F., Andres, S., Acir, I.-H., Rissanen, M., Jokinen, T.,
Schobesberger, S., Kangasluoma, J., Kontkanen, J., Nieminen,
T., Kurten, T., Nielsen, L. B., Jorgensen, S., Kjaergaard, H. G.,
Canagaratna, M., Maso, M. D., Berndt, T., Petaja, T., Wahner,
A., Kerminen, V. M., Kulmala, M., Worsnop, D. R., Wildt, J.,
and Mentel, T. F.: A large source of low-volatility secondary or-
ganic aerosol, Nature, 506, 476–479, doi:10.1038/nature13032,
2014.
Herrmann, E., Ding, A. J., Kerminen, V.-M., Petäjä, T., Yang, X.
Q., Sun, J. N., Qi, X. M., Manninen, H., Hakala, J., Nieminen,
T., Aalto, P. P., Kulmala, M., and Fu, C. B.: Aerosols and nucle-
ation in eastern China: first insights from the new SORPES-NJU
station, Atmos. Chem. Phys., 14, 2169–2183, doi:10.5194/acp-
14-2169-2014, 2014.
Hirsikko, A., Laakso, L., Horrak, U., Aalto, P. P., Kerminen, V.
M., and Kulmala, M.: Annual and size dependent variation of
growth rates and ion concentrations in boreal forest, Boreal Env-
iron. Res., 10, 357–469, 2005.
Jiang, J., Chen, M., Kuang, C., Attoui, M., and McMurry, P. H.:
Electrical Mobility Spectrometer Using a Diethylene Glycol
Condensation Particle Counter for Measurement of Aerosol Size
Distributions Down to 1 nm, Aerosol Sci. Tech., 45, 510–521,
doi:10.1080/02786826.2010.547538, 2011a.
Jiang, J., Zhao, J., Chen, M., Eisele, F. L., Scheckman, J., Williams,
B. J., Kuang, C., and McMurry, P. H.: First Measurements of
Neutral Atmospheric Cluster and 1–2 nm Particle Number Size
Distributions During Nucleation Events, Aerosol Sci. Tech., 45,
II–V, doi:10.1080/02786826.2010.546817, 2011b.
Jokinen, T., Sipilä, M., Junninen, H., Ehn, M., Lönn, G., Hakala,
J., Petäjä, T., Mauldin III, R. L., Kulmala, M., and Worsnop,
D. R.: Atmospheric sulphuric acid and neutral cluster measure-
ments using CI-APi-TOF, Atmos. Chem. Phys., 12, 4117–4125,
doi:10.5194/acp-12-4117-2012, 2012.
Junninen, H., Hulkkonen, M., Riipinen, I., Nieminen, T., Hir-
sikko, A., Suni, T., Boy, M., Lee, S.-H., Vana, M., Tammet,
T., Kerminen, V. M., and Kulmala, M.: Observations on noc-
turnal growth of atmospheric clusters, Tellus B, 60, 365–371,
doi:10.1111/j.1600-0889.2008.00356.x, 2008.
Junninen, H., Ehn, M., Petäjä, T., Luosujärvi, L., Kotiaho, T., Kos-
tiainen, R., Rohner, U., Gonin, M., Fuhrer, K., Kulmala, M., and
Worsnop, D. R.: A high-resolution mass spectrometer to mea-
sure atmospheric ion composition, Atmos. Meas. Tech., 3, 1039–
1053, doi:10.5194/amt-3-1039-2010, 2010.
Kangasluoma, J., Kuang, C., Wimmer, D., Rissanen, M. P., Lehti-
palo, K., Ehn, M., Worsnop, D. R., Wang, J., Kulmala, M., and
Petäjä, T.: Sub-3 nm particle size and composition dependent re-
sponse of a nano-CPC battery, Atmos. Meas. Tech., 7, 689–700,
doi:10.5194/amt-7-689-2014, 2014.
Kirkby, J., Curtius, J., Almeida, J., Dunne, E., Duplissy, J., Ehrhart,
S., Franchin, A., Gagne, S., Ickes, L., Kurten, A., Kupc, A., Met-
zger, A., Riccobono, F., Rondo, L., Schobesberger, S., Tsagko-
georgas, G., Wimmer, D., Amorim, A., Bianchi, F., Breitenlech-
ner, M., David, A., Dommen, J., Downard, A., Ehn, M., Fla-
gan, R. C., Haider, S., Hansel, A., Hauser, D., Jud, W., Junni-
nen, H., Kreissl, F., Kvashin, A., Laaksonen, A., Lehtipalo, K.,
Lima, J., Lovejoy, E. R., Makhmutov, V., Mathot, S., Mikkila, J.,
Minginette, P., Mogo, S., Nieminen, T., Onnela, A., Pereira, P.,
Petaja, T., Schnitzhofer, R., Seinfeld, J. H., Sipila, M., Stozhkov,
Y., Stratmann, F., Tome, A., Vanhanen, J., Viisanen, Y., Vrtala,
A., Wagner, P. E., Walther, H., Weingartner, E., Wex, H., Win-
kler, P. M., Carslaw, K. S., Worsnop, D. R., Baltensperger, U.,
and Kulmala, M.: Role of sulphuric acid, ammonia and galac-
tic cosmic rays in atmospheric aerosol nucleation, Nature, 476,
429–433, doi:10.1038/nature10343, 2011.
Kuang, C., Chen, M., Zhao, J., Smith, J., McMurry, P. H., and
Wang, J.: Size and time-resolved growth rate measurements of 1
to 5 nm freshly formed atmospheric nuclei, Atmos. Chem. Phys.,
12, 3573–3589, doi:10.5194/acp-12-3573-2012, 2012.
Kulmala, M., Pirjola, L., and Makela, J. M.: Stable sulfate clusters
as a source of new atmospheric particles, Nature, 404, 60–66,
doi:10.1038/35003550, 2000.
Kulmala, M., Laakso, L., Lehtinen, K. E. J., Riipinen, I., Dal Maso,
M., Lauria, A., Kerminen, V. M., Birmili, W., and McMurry, P.
H.: Formation and growth rates of ultrafine atmosphere particles:
A review of observations, J. Aerosol. Sci., 35, 143–176, 2004a.
Kulmala, M., Kerminen, V. M., Anntila, T., Laaksonen, A.,
and O’Dowd, C. D.: Organic aerosol formation via sul-
fate cluster activation, J. Geophys. Res., 109, D04205,
doi:10.1029/2003JD003961, 2004b.
Kulmala, M., Laakso, L., Lehtinen, K. E. J., Riipinen, I., Dal Maso,
M., Anttila, T., Kerminen, V.-M., Hõrrak, U., Vana, M., and Tam-
met, H.: Initial steps of aerosol growth, Atmos. Chem. Phys., 4,
2553–2560, doi:10.5194/acp-4-2553-2004, 2004c.
Kulmala, M., Petäjä, T., Nieminen, T., Sipilä, M., Manninen,
H. E., Lehtipalo, K., Dal Maso, M., Aalto, P. P., Junninen,
H., Paasonen, P., Riipinen, I., Lehtinen, K. E. J., Laakso-
nen, A., and Kerminen, V. M.: Measurement of the nucleation
of atmospheric aerosol particles, Nat. Protoc., 7, 1651–1667,
doi:10.1038/nprot.2012.091, 2012.
www.atmos-chem-phys.net/16/2641/2016/ Atmos. Chem. Phys., 16, 2641–2657, 2016
2656 H. Yu et al.: Nucleation and growth of sub-3 nm particles
Kulmala, M., Kontkanen, J., Junninen, H., Lehtipalo, K., Manni-
nen, H. E., Nieminen, T., Petäjä, T., Sipilä, M., Schobesberger,
S., Rantala, P., Franchin, A., Jokinen, T., Järvinen, E., Äijälä, M.,
Kangasluoma, J., Hakala, J., Aalto, P. P., Paasonen, P., Mikkilä,
J., Vanhanen, J., Aalto, J., Hakola, H., Makkonen, U., Ruuska-
nen, T., Mauldin, R. L., Duplissy, J., Vehkamäki, H., Bäck,
J., Kortelainen, A., Riipinen, I., Kurtén, T., Johnston, M. V.,
Smith, J. N., Ehn, M., Mentel, T. F., Lehtinen, K. E. J., Laak-
sonen, A., Kerminen, V. M., and Worsnop, D. R.: Direct Obser-
vations of Atmospheric Aerosol Nucleation, Science, 339, 943–
946, doi:10.1126/science.1227385, 2013.
Kulmala, M., Petäjä, T., Ehn, M., Thornton, J., Sipilä, M., Worsnop,
D. R., and Kerminen, V. M.: Chemistry of Atmospheric Nucle-
ation: On the Recent Advances on Precursor Characterization
and Atmospheric Cluster Composition in Connection with At-
mospheric New Particle Formation, Annu. Rev. Phys. Chem., 65,
21–37, doi:10.1146/annurev-physchem-040412-110014, 2014.
Kürten, A., Jokinen, T., Simon, M., Sipilä, M., Sarnela, N., Jun-
ninen, H., Adamov, A., Almeida, J., Amorim, A., Bianchi, F.,
Breitenlechner, M., Dommen, J., Donahue, N. M., Duplissy, J.,
Ehrhart, S., Flagan, R. C., Franchin, A., Hakala, J., Hansel, A.,
Heinritzi, M., Hutterli, M., Kangasluoma, J., Kirkby, J., Laakso-
nen, A., Lehtipalo, K., Leiminger, M., Makhmutov, V., Mathot,
S., Onnela, A., Petäjä, T., Praplan, A. P., Riccobono, F., Rissa-
nen, M. P., Rondo, L., Schobesberger, S., Seinfeld, J. H., Steiner,
G., Tomé, A., Tröstl, J., Winkler, P. M., Williamson, C., Wim-
mer, D., Ye, P., Baltensperger, U., Carslaw, K. S., Kulmala, M.,
Worsnop, D. R., and Curtius, J.: Neutral molecular cluster forma-
tion of sulfuric acid–dimethylamine observed in real time under
atmospheric conditions, P. Natl. Acad. Sci. USA, 111, 15019–
15024, doi:10.1073/pnas.1404853111, 2014.
Lee, S. H., Young, L. H., Benson, D. R., Kulmala, M., Junninen,
H., Suni, T., Campos, T., Rogers, D. C., and Jensen, J.: Obser-
vations of nighttime new particle formation in the troposphere, J.
Geophys. Res., 113, D10210, doi:10.1029/2007JD009351, 2008.
Lehtipalo, K., Sipilä, M., Riipinen, I., Nieminen, T., and Kulmala,
M.: Analysis of atmospheric neutral and charged molecular clus-
ters in boreal forest using pulse-height CPC, Atmos. Chem.
Phys., 9, 4177–4184, doi:10.5194/acp-9-4177-2009, 2009.
Lehtipalo, K., Kulmala, M., Sipilä, M., Petäjä, T., Vana, M., Ce-
burnis, D., Dupuy, R., and O’Dowd, C.: Nanoparticles in boreal
forest and coastal environment: a comparison of observations and
implications of the nucleation mechanism, Atmos. Chem. Phys.,
10, 7009–7016, doi:10.5194/acp-10-7009-2010, 2010.
Lehtipalo, K., Sipila, M., Junninen, H., Ehn, M., Berndt, T., Kajos,
M. K., Worsnop, D. R., Petaja, T., and Kulmala, M.: Observations
of Nano-CN in the Nocturnal Boreal Forest, Aerosol Sci. Tech.,
45, 499–509, doi:10.1080/02786826.2010.547537, 2011.
Lehtipalo, K., Leppä, J., Kontkanen, J., Kangasluoma, J., Franchin,
A., Wimmer, D., Schobesberger, S., Junninen, H., Petäjä, T.,
Sipilä, M., Mikkilä, J., Vanhanen, J., Worsnop, D. R., and Kul-
mala, M.: Methods for determining particle size distribution and
growth rates between 1 and 3 nm using the Particle Size Magni-
fier, Boreal Environ. Res., 19, 215–236, 2014.
Matsui, H., Koike, M., Takegawa, N., Kondo, Y., Takami, A., Taka-
mura, T., Yoon, S., Kim, S. W., Lim, H. C., and Fast, J. D.: Spa-
tial and temporal variations of new particle formation in East
Asia using an NPF-explicit WRF-chem model: North-south con-
trast in new particle formation frequency, J. Geophys. Res., 118,
11647–11663, doi:10.1002/jgrd.50821, 2013.
Merikanto, J., Spracklen, D. V., Mann, G. W., Pickering, S. J.,
and Carslaw, K. S.: Impact of nucleation on global CCN, At-
mos. Chem. Phys., 9, 8601–8616, doi:10.5194/acp-9-8601-2009,
2009.
Mikkonen, S., Romakkaniemi, S., Smith, J. N., Korhonen, H.,
Petäjä, T., Plass-Duelmer, C., Boy, M., McMurry, P. H., Lehtinen,
K. E. J., Joutsensaari, J., Hamed, A., Mauldin III, R. L., Birmili,
W., Spindler, G., Arnold, F., Kulmala, M., and Laaksonen, A.: A
statistical proxy for sulphuric acid concentration, Atmos. Chem.
Phys., 11, 11319–11334, doi:10.5194/acp-11-11319-2011, 2011.
Nieminen, T., Lehtinen, K. E. J., and Kulmala, M.: Sub-10 nm par-
ticle growth by vapor condensation – effects of vapor molecule
size and particle thermal speed, Atmos. Chem. Phys., 10, 9773–
9779, doi:10.5194/acp-10-9773-2010, 2010.
Ortega, I. K., Suni, T., Gronholm, T., Boy, M., Hakola, H., Hellen,
H., Valmari, T., Arvela, H., Vehkamaki, H., and Kulmala, M.: Is
eucalyptol the cause of nocturnal events observed in Australia?,
Boreal Environ. Res., 14, 606–615, 2009.
Ortega, I. K., Suni, T., Boy, M., Grönholm, T., Manninen, H. E.,
Nieminen, T., Ehn, M., Junninen, H., Hakola, H., Hellén, H.,
Valmari, T., Arvela, H., Zegelin, S., Hughes, D., Kitchen, M.,
Cleugh, H., Worsnop, D. R., Kulmala, M., and Kerminen, V.-M.:
New insights into nocturnal nucleation, Atmos. Chem. Phys., 12,
4297–4312, doi:10.5194/acp-12-4297-2012, 2012.
Petäjä, T., Mauldin, III, R. L., Kosciuch, E., McGrath, J., Niem-
inen, T., Paasonen, P., Boy, M., Adamov, A., Kotiaho, T., and
Kulmala, M.: Sulfuric acid and OH concentrations in a boreal
forest site, Atmos. Chem. Phys., 9, 7435–7448, doi:10.5194/acp-
9-7435-2009, 2009.
Pierce, J. R. and Adams, P. J.: Uncertainty in global CCN concen-
trations from uncertain aerosol nucleation and primary emission
rates, Atmos. Chem. Phys., 9, 1339–1356, doi:10.5194/acp-9-
1339-2009, 2009.
Riccobono, F., Schobesberger, S., Scott, C. E., Dommen, J., Ortega,
I. K., Rondo, L., Almeida, J., Amorim, A., Bianchi, F., Breiten-
lechner, M., David, A., Downard, A., Dunne, E. M., Duplissy,
J., Ehrhart, S., Flagan, R. C., Franchin, A., Hansel, A., Junni-
nen, H., Kajos, M., Keskinen, H., Kupc, A., Kürten, A., Kvashin,
A. N., Laaksonen, A., Lehtipalo, K., Makhmutov, V., Mathot,
S., Nieminen, T., Onnela, A., Petäjä, T., Praplan, A. P., Santos,
F. D., Schallhart, S., Seinfeld, J. H., Sipilä, M., Spracklen, D.
V., Stozhkov, Y., Stratmann, F., Tomé, A., Tsagkogeorgas, G.,
Vaattovaara, P., Viisanen, Y., Vrtala, A., Wagner, P. E., Wein-
gartner, E., Wex, H., Wimmer, D., Carslaw, K. S., Curtius, J.,
Donahue, N. M., Kirkby, J., Kulmala, M., Worsnop, D. R., and
Baltensperger, U.: Oxidation Products of Biogenic Emissions
Contribute to Nucleation of Atmospheric Particles, Science, 344,
717–721, doi:10.1126/science.1243527, 2014.
Riipinen, I., Yli-Juuti, T., Pierce, J. R., Petaja, T., Worsnop, D. R.,
Kulmala, M., and Donahue, N. M.: The contribution of organics
to atmospheric nanoparticle growth, Nat. Geosci., 5, 453–458,
doi:10.1038/NGEO1499, 2012.
Russell, L. M., Mensah, A. A., Fischer, E. V., Sive, B. C., Varner,
R. K., Keene, W. C., Stutz, J., and Pszenny, A. A. P.: Nanopar-
ticle growth following photochemical α- and β-pinene oxida-
tion at Appledore Island during International Consortium for
Research on Transport and Transformation/Chemistry of Halo-
Atmos. Chem. Phys., 16, 2641–2657, 2016 www.atmos-chem-phys.net/16/2641/2016/
H. Yu et al.: Nucleation and growth of sub-3 nm particles 2657
gens at the Isles of Shoals 2004, J. Geophys. Res., 112, D10S21,
doi:10.1029/2006jd007736, 2007.
Schobesberger, S., Junninen, H., Bianchi, F., Lönn, G., Ehn, M.,
Lehtipalo, K., Dommen, J., Ehrhart, S., Ortega, I. K., Franchin,
A., Nieminen, T., Riccobono, F., Hutterli, M., Duplissy, J.,
Almeida, J., Amorim, A., Breitenlechner, M., Downard, A. J.,
Dunne, E. M., Flagan, R. C., Kajos, M., Keskinen, H., Kirkby,
J., Kupc, A., Kürten, A., Kurtén, T., Laaksonen, A., Mathot,
S., Onnela, A., Praplan, A. P., Rondo, L., Santos, F. D., Schall-
hart, S., Schnitzhofer, R., Sipilä, M., Tomé, A., Tsagkogeorgas,
G., Vehkamäki, H., Wimmer, D., Baltensperger, U., Carslaw, K.
S., Curtius, J., Hansel, A., Petäjä, T., Kulmala, M., Donahue,
N. M., and Worsnop, D. R.: Molecular understanding of atmo-
spheric particle formation from sulfuric acid and large oxidized
organic molecules, P. Natl. Acad. Sci. USA, 110, 17223–17228,
doi:10.1073/pnas.1306973110, 2013.
Sipila, M., Lehtipalo, K., Attoui, M., Neitola, K., Petäjä, T.,
Aalto, P. P., O’Dowd, C. D., and Kulmala, M.: Labora-
tory Verification of PH-CPC’s Ability to Monitor Atmo-
spheric Sub-3 nm Clusters, Aerosol Sci. Tech., 43, 126–135,
doi:10.1080/02786820802506227, 2009.
Spracklen, D. V., Carslaw, K. S., Kulmala, M., Kerminen, V.-M.,
Sihto, S.-L., Riipinen, I., Merikanto, J., Mann, G. W., Chip-
perfield, M. P., Wiedensohler, A., Birmili, W., and Lihavainen,
H.: Contribution of particle formation to global cloud conden-
sation nuclei concentrations, Geophys. Res. Lett., 35, L06808,
doi:10.1029/2007GL033038, 2008.
Suni, T., Kulmala, M., Hirsikko, A., Bergman, T., Laakso, L.,
Aalto, P. P., Leuning, R., Cleugh, H., Zegelin, S., Hughes, D.,
van Gorsel, E., Kitchen, M., Vana, M., Hõrrak, U., Mirme, S.,
Mirme, A., Sevanto, S., Twining, J., and Tadros, C.: Formation
and characteristics of ions and charged aerosol particles in a na-
tive Australian Eucalypt forest, Atmos. Chem. Phys., 8, 129–139,
doi:10.5194/acp-8-129-2008, 2008.
Svenningsson, B., Arneth, A., Hayward, S., Holst, T., Massling, A.,
Swietlicko, E., Hirsikko, A., Junninen, H., Riipinen, I., Vana,
M., Dal Maso, M., Hussein, T., and Kulmala, M.: Aerosol par-
ticle formation events and analysis of high growth rates observed
above a subarctic wetland-forest mosaic, Tellus, 60, 353–365,
doi:10.1111/j.1600-0889.2008.00351.x, 2008.
Vanhanen, J., Mikkila, J., Lehtipalo, K., Sipila, M., Manninen, H.
E., Siivola, E., Petaja, T., and Kulmala, M.: Particle Size Mag-
nifier for Nano-CN Detection, Aerosol Sci. Tech., 45, 533–542,
doi:10.1080/02786826.2010.547889, 2011.
von der Weiden, S.-L., Drewnick, F., and Borrmann, S.: Particle
Loss Calculator – a new software tool for the assessment of the
performance of aerosol inlet systems, Atmos. Meas. Tech., 2,
479–494, doi:10.5194/amt-2-479-2009, 2009.
Wang, J. and Wexler, A. S.: Adsorption of organic molecules
may explain growth of newly nucleated clusters and new
particle formation, Geophys. Res. Lett., 11, 2834–2838,
doi:10.1002/grl.50455, 2013.
Wang, J., McGraw, R. L., and Kuang, C.: Growth of atmospheric
nano-particles by heterogeneous nucleation of organic vapor, At-
mos. Chem. Phys., 13, 6523–6531, doi:10.5194/acp-13-6523-
2013, 2013.
Wiedensohler, A., Cheng, Y. F., Nowak, A., Wehner, B., Achtert,
P., Berghof, M., Birmili, W., Wu, Z. J., Hu, M., Zhu, T.,
Takegawa, N., Kita, K., Kondo, Y., Lou, S. R., Hofzumahaus,
A., Holland, F., Wahner, A., Gunthe, S. S., Rose, D., Su, H.,
and Pöschl, U.: Rapid aerosol particle growth and increase of
cloud condensation nucleus activity by secondary aerosol for-
mation and condensation: A case study for regional air pol-
lution in northeastern China, J. Geophys. Res., 114, D00G08,
doi:10.1029/2008jd010884, 2009.
Xiao, S., Wang, M. Y., Yao, L., Kulmala, M., Zhou, B., Yang,
X., Chen, J. M., Wang, D. F., Fu, Q. Y., Worsnop, D. R., and
Wang, L.: Strong atmospheric new particle formation in winter
in urban Shanghai, China, Atmos. Chem. Phys., 15, 1769–1781,
doi:10.5194/acp-15-1769-2015, 2015.
Yu, F. and Luo, G.: Simulation of particle size distribution with
a global aerosol model: contribution of nucleation to aerosol
and CCN number concentrations, Atmos. Chem. Phys., 9, 7691–
7710, doi:10.5194/acp-9-7691-2009, 2009.
Yu, H., Gannet Hallar, A., You, Y., Sedlacek, A., Springston, S.,
Kanawade, V. P., Lee, Y. N., Wang, J., Kuang, C., McGraw, R.
L., McCubbin, I., Mikkila, J., and Lee, S. H.: Sub-3 nm particles
observed at the coastal and continental sites in the United States,
J. Geophys. Res., 119, 860–879, doi:10.1002/2013jd020841,
2014a.
Yu, H., Ortega, J., Smith, J. N., Guenther, A. B., Kanawade, V. P.,
You, Y., Liu, Y., Hosman, K., Karl, T., Seco, R., Geron, C., Pal-
lardy, S. G., Gu, L., Mikkilä, J., and Lee, S. H.: New Particle
Formation and Growth in an Isoprene-Dominated Ozark Forest:
From Sub-5 nm to CCN-Active Sizes, Aerosol Sci. Tech., 48,
1285–1298, doi:10.1080/02786826.2014.984801, 2014b.
Yue, D. L., Hu, M., Zhang, R. Y., Wu, Z. J., Su, H., Wang, Z.
B., Peng, J. F., He, L. Y., Huang, X. F., Gong, Y. G., and
Wiedensohler, A.: Potential contribution of new particle forma-
tion to cloud condensation nuclei in Beijing, Atmos. Environ.,
45, 6070–6077, doi:10.1016/j.atmosenv.2011.07.037, 2011.
Zhang, K. M. and Wexler, A. S.: A hypothesis for growth
of fresh atmospheric nuclei, J. Geophys. Res., 107, 4577,
doi:10.1029/2002JD002180, 2002.
Zhao, J., Eisele, F. L., Titcombe, M., Kuang, C., and McMurry, P.
H.: Chemical ionization mass spectrometric measurements of at-
mospheric neutral clusters using the cluster-CIMS, J. Geophys.
Res., 115, D08205, doi:10.1029/2009JD012606, 2010.
www.atmos-chem-phys.net/16/2641/2016/ Atmos. Chem. Phys., 16, 2641–2657, 2016