of the agricultural water systems -...
TRANSCRIPT

Meso-level eco-efficiency indicators to assess
technologies and their uptake in water use sectors Collaborative project, Grant Agreement No: 282882
Deliverable 2.1
Value Chain Mapping
of the Agricultural Water Systems
December 2012

Deliverable 2.1 – Value chain mapping Page 2 of 77
DOCUMENT INFORMATION
Project
Project acronym: EcoWater
Project full title: Meso-level eco-efficiency indicators to assess technologies and their uptake in water use sectors
Grant agreement no.: 282882
Funding scheme: Collaborative Project
Project start date: 01/11/2011
Project duration: 36 months
Call topic: ENV.2011.3.1.9-2: Development of eco-efficiency meso-level indicators for technology assessment
Project web-site: http://environ.chemeng.ntua.gr/ecowater
Document
Deliverable number: Deliverable 2.1
Deliverable title: Value chain mapping
Due date of deliverable: 31 October 2012
Actual submission date: 6 December 2012
Editor(s): CIHEAM
Author(s): CIHEAM, UPORTO
Reviewer(s): Vassilis Kourentzis, Thanos Angelis-Dimakis, Ino Katsiardi
Work Package no.: 2
Work Package title: Eco-efficiency assessments in agricultural water systems and use
Work Package Leader: CIHEAM – Mediterranean Agronomic Institute of Bari
Dissemination level: PU
Version: 2
Draft/Final: Final
No of pages (including cover): 77
Keywords: Value Chain, Agricultural Water Use

Deliverable 2.1 – Value chain mapping Page 3 of 77
Abstract
The document delivers the results of Task 2.1 of EcoWater, which represents the 1st phase of the Case Study (CS) development. Two agricultural water systems (Case Study #1 – Sinistra Ofanto, Italy, and Case Study #2 – Monte Novo, Portugal) are described by means of main (i) geo-physical characteristics, (ii) technical (engineering and agronomic) features, (iii) socio-economic aspects, and (iv) relevant environmental issues. The value chain mapping of both systems has been completed through the definition of system boundaries, its main components (water source, hydraulic infrastructures and cropped lands) and stages (e.g. water abstraction, accumulation, conveyance, storage, distribution and use). The processes (e.g. pumping and energy consumption, water losses in conveyance and distribution network, on-farm water losses, distribution uniformity, evapo-transpiration, deep percolation and drainage, cropping pattern setup, nutrient supply, etc.) included in specific stages of the system are described considering the actual uptake of technologies and depicting eventual problems. The resource inputs and environmental impacts relevant to each stage (or process) of the system are explained considering the costs and benefits for the system.
Accordingly, a preliminary list of selected environmental impact indicators is presented. Actors directly and indirectly involved in the different system stages are identified and described, explaining the interaction among them. Finally, a preliminary list of potential technologies/innovations/practices that could be evaluated for each Case Study area are pointed out. Subsequently, this list will be reviewed and finalized through the baseline eco-efficiency assessment and after the discussions with local actors/stakeholders.

Deliverable 2.1 – Value chain mapping Page 4 of 77
Table of Contents
1 Introduction 8 2 Value Chain mapping for Case Study # 1: The Sinistra Ofanto Irrigation Scheme, Italy ........................................................................................................................... 10
2.1 Objectives of the Case Study ..................................................................... 10
2.2 Overview of the Case Study area / sector .................................................. 10
2.2.1 Location and geo-physical features ..................................................... 10
2.2.2 Climate ................................................................................................ 11
2.2.3 Soils ..................................................................................................... 12
2.2.4 Technical aspects of the Sinistra Ofanto water system ....................... 12
2.2.5 The costs of water supply and water pricing ....................................... 15
2.2.6 The socio-economic context ................................................................ 16
2.3 Methodology ............................................................................................... 17
2.4 Mapping of the water service system ......................................................... 18
2.4.1 System boundaries .............................................................................. 18
2.4.2 Mapping of the water service system and description of stages ......... 19
2.4.3 Process map description ..................................................................... 24
2.4.4 Description of existing technologies .................................................... 25
2.4.5 Environmental and eco-efficiency concerns ........................................ 27
2.5 Selection of eco-efficiency indicators .......................................................... 30
2.5.1 Eco-efficiency indicators ...................................................................... 30
2.5.2 Economic costs and benefits ............................................................... 31
2.6 Mapping of actors ....................................................................................... 32
2.7 Preliminary identification of technologies to be assessed .......................... 36
3 Value Chain mapping for Case Study # 2: Monte Novo Irrigation Area, Portugal 40
3.1 Objectives of the Case Study ..................................................................... 40
3.2 Overview of the Case Study area / sector .................................................. 40
3.2.1 Location ............................................................................................... 40
3.2.2 Climate ................................................................................................ 42
3.2.3 Geology ............................................................................................... 42
3.2.4 Soil ....................................................................................................... 43
3.2.5 Alqueva System ................................................................................... 43
3.2.6 Water Resources ................................................................................. 46
3.2.7 Fauna and Flora .................................................................................. 47
3.2.8 Socio-economic context ...................................................................... 48
3.3 Methodology ............................................................................................... 48
3.4 Mapping of the water service system ......................................................... 49
Deliverable 2.1 – Value chain mapping Page 5 of 77
3.4.1 System boundaries .............................................................................. 49
3.4.2 Mapping of the water service system and description of stages ......... 50
3.4.3 Process map description ..................................................................... 56
3.4.4 Description of existing technologies .................................................... 57
3.5 Selection of eco-efficiency indicators .......................................................... 63
3.5.1 Environmental impacts ........................................................................ 63
3.5.2 Economic costs and benefits ............................................................... 65
3.6 Mapping of actors ....................................................................................... 68
3.6.1 Empresa para o Desenvolvimento das Infraestruturas de Alqueva (EDIA) 69
3.6.2 Associação de Beneficiários de Monte Novo ...................................... 69
3.6.3 Representative farmers ....................................................................... 69
3.6.4 Administração de Região Hidrográfica do Alentejo (ARH – Alentejo) . 70
3.6.5 Direção Regional de Agricultura do Alentejo (DRA Alentejo) .............. 71
3.6.6 Centro Operativo de Tecnologia do Regadio (COTR) ......................... 71
3.7 Preliminary identification of technologies to be assessed .......................... 71
4 Concluding remarks ........................................................................................... 75 5 References ......................................................................................................... 76
5.1 Value Chain mapping for Case Study # 1: Sinistra Ofanto Irrigation Scheme, Italy 76
5.2 Value Chain mapping for Case Study # 2: Monte Novo Irrigation Area, Portugal ................................................................................................................. 77

Deliverable 2.1 – Value chain mapping Page 6 of 77
List of Figures
Figure 1: Location of the Sinistra Ofanto irrigation scheme within the Ofanto River Basin ......................................................................................................................... 11 Figure 2: Sources and conveyance system supplying the Sinistra Ofanto irrigation scheme...................................................................................................................... 13 Figure 3: Hydraulic scheme of the Sinistra Ofanto system upstream of Capacciotti reservoir .................................................................................................................... 14 Figure 4: Conveyance conduits supplying the different zones of the Sinistra Ofanto system ....................................................................................................................... 15 Figure 5: The three water supply chains of the Sinistra Ofanto irrigation scheme .... 18 Figure 6: Mapping of agricultural water supply chains in the Sinistra Ofanto irrigation scheme...................................................................................................................... 20 Figure 7: Hydraulic scheme of the Lower zone (Supply chain 1) .............................. 21 Figure 8: (a) Manually operated and (b) electronically fed hydrant ........................... 26 Figure 9: Cognitive Map, representing the stakeholders’ knowledge and perceptions in the Sinistra Ofanto area ........................................................................................ 30 Figure 10: Relevant parameters and inter-linkages for assessing Eco-efficiency ..... 30 Figure 11: Flow chart of the technical organization of the WUO Co.Bo.Ca .............. 34 Figure 12: Interactions among actors in the Sinistra Ofanto irrigation scheme ......... 35 Figure 13: Case Study #2 location - Monte Novo Irrigation Area .............................. 41 Figure 14: Location of the Monte Novo Irrigation Area in thre Alqueva's multipurpose project (EDIA, 2011) .................................................................................................. 41 Figure 15: Average monthly distribution of precipitation in the Guadiana's river basin .................................................................................................................................. 42 Figure 16: Main storage reservoirs, channels/ ducts and Irrigation areas of Alqueva project (EDIA, 2011) .................................................................................................. 44 Figure 17: Details of the Alqueva subsystem: Main storage reservoirs, channels/ ducts and associated irrigation areas (EDIA, 2011) .................................................. 45 Figure 18: Main water courses in the Monte Novo irrigation area (EDIA, 2011) ....... 47 Figure 19: Overall map of the water system and definition of the spatial system boundaries (EDIA, 2011) ........................................................................................... 49 Figure 20: Details of the Monte Irrigation Area: location of the main irrigation blocks, reservoirs and channels/ ducts (EDIA, 2011) ............................................................ 51 Figure 21: Division of Monte Novo irrigation perimeter in irrigation blocks ............... 52 Figure 22: Identification of low pressure and high pressure areas .................... 53 Figure 23: Evolution of the irrigated areas compared to the total area beneficed in the Monte Novo irrigation perimeter (EDIA, 2012) .......................................................... 54 Figure 24: The water supply chain of the Monte Novo irrigation perimeter ............... 56 Figure 25: The water supply chain to be considered in Case Study # 2 for irrigation water use................................................................................................................... 57 Figure 26: Location of the FEA farms within the Monte Novo irrigation perimeter (EDIA, 2011) ............................................................................................................. 59 Figure 27: Location of the ODS farm within the Monte Novo irrigation perimeter (EDIA, 2011) ............................................................................................................. 62 Figure 28: Interaction among the directly invovled actors in the Monte Novo Irrigation Area........................................................................................................................... 68

Deliverable 2.1 – Value chain mapping Page 7 of 77
List of Tables
Table 1: Monthly averages of climatic variables from 1981 to 2010 ......................... 12
Table 2: Crop distribution in the sub-schemes and cthe ommand area of the study area ........................................................................................................................... 16
Table 3: Cropping pattern in the irrigation District No. 10 ......................................... 21
Table 4: Stages, processes and system components of the whole water system .... 22
Table 5: Cropping pattern in the District No. 1 of Sinistra Ofanto Scheme ............... 23
Table 6: Stages, processes and system components of the Supply Chain 2 ........... 23
Table 7: Cropping pattern in the District No. 11 of the Sinistra Ofanto Scheme ....... 24
Table 8. Stages, processes and system components of the Supply Chain 3. .......... 24
Table 9. Environmental impacts related to stages and processes in the Sinistra Ofanto system ........................................................................................................... 28
Table 10. Preliminary list of indicators of environmental impacts in the Sinistra Ofanto system ....................................................................................................................... 28
Table 11: Eco-efficiency indicators and related units ................................................ 31
Table 12: Economic performance of the main crops in the Sinistra Ofanto area ...... 32
Table 13: The relevant stakeholders / actors and the corresponding stages thet are involved ..................................................................................................................... 33
Table 14: Preliminary list of technologies and practices considered for the Sinistra Ofanto area ............................................................................................................... 37
Table 15: Primary and secondary effects of technologies on the agricultural water use chain and stakeholders’ acceptability ................................................................. 37
Table 16: Division of the Monte Novo irrigation perimeter in irrigation blocks .......... 51
Table 17: Evolution of the registered area, per year, per block (EDIA, 2012) ........... 54
Table 18: Crop pattern evolution in Monte Novo irrigation area (EDIA, 2012) .......... 55
Table 19: Evolution of water consumption, per block, per year (EDIA, 2012) ........... 55
Table 20: Relation between the different parts of the water system, the corresponding stages and the nodes of the water supply chain ....................................................... 57
Table 21: Characteristics of the Alqueva pumping station (EDIA, 2012) .................. 57
Table 22: Capacity of the regulating reservoirs of the secondary distribution network (EDIA, 2012) ............................................................................................................. 58
Table 23: Characteristics of the main pumping stations within the Monte Novo irrigation area (EDIA, 2012) ...................................................................................... 58
Table 24: Cropping patterns of different farms belonging to FEA (FEA, 2012) ......... 60
Table 25: FEA water consumption (m3/y) per farm (FEA, 2012) ............................... 61
Table 26: Resource inputs and potential environmental impacts for each stage of the water supply chain .................................................................................................... 64
Table 27: Preliminary list of Environmental impact indicator parameters ................. 65
Table 28: Summary of the economic benefits and costs for the water system ......... 67
Table 29: Other farmers, whose involvement in EcoWater will be investigated ........ 70
Table 30: Preliminary identification of the technologies/ innovations to be assessed 72

Deliverable 2.1 – Value chain mapping Page 8 of 77
1 Introduction
The EcoWater Project focuses on the eco-efficiency of meso-level water systems for different uses (i.e. agriculture, domestic and industrial) following the common methodological steps: a) elaboration of an analytical framework for quantitative eco-efficiency assessment, that includes review and selection of existing methods and indicators for assessing eco-efficiency at the whole system level; b) validation of the analytical framework through its application to different Case Studies, taking into consideration their own sector-specific focuses; and c) integration and summary of the Project results into step-wise guidelines and toolbox for meso-level eco-efficiency assessment, which will mainly concern technology uptake in different contexts and at different system levels.
In full compliance with the above Project framework, the methodology adopted for the development of two agricultural water systems (Case Study #1 – Sinistra Ofanto, Italy, and Case Study #2 – Monte Novo, Portugal) is based on the steps described below.
Mapping, identifying and characterizing the different stages of irrigation water systems and use, from water abstraction from the sources to diversion, conveyance, storage and distribution to end-users (farmers), as well as the water use in cropped fields, and the subsequent downstream stages, such as drainage, collection, treatment, and disposal of run-off and drained water to final receptors. Within this phase, the main categories of environmental impacts and concerns generated by irrigated agriculture are identified, and the main actors involved at different stages, together with their roles and interactions, are investigated, so as to assess eco-efficiency under the conditions of Business-As-Usual and to generate future evolution scenarios.
Assessing the eco-efficiency in the baseline scenario, which will represent the basis for benchmarking enhancements resulting from the uptake of innovative practices and technologies at different stages of the irrigation conveyance and distribution systems and at farm level. This assessment will consider both an economic component and an environmental component. The economic component refers to the financial costs related to water abstraction, storage, conveyance, distribution and use, as well as to the economic value generated by the irrigated agriculture. The environmental component accounts for the impacts resulting from the sectoral water use on the main natural resources and receptors.
Assessing technologies and management practices that would result in enhancing eco-efficiency of water use in agricultural systems in the future, with respect to the baseline scenario. The eco-efficiency improvements related to technological innovations of agricultural systems supply chain may result from: a) the higher economic value being generated by irrigated agriculture in the area, b) the lower financial costs at different stages of the irrigation system to sustain the agricultural production levels, and c) the reduced environmental impacts being generated as a result of intensive farming under irrigation.

Deliverable 2.1 – Value chain mapping Page 9 of 77
The different analyses aimed at assessing the eco-efficiency at the meso-level will mainly focus (i) on economic outputs of the irrigated farming activities and (ii) on the quantitative aspects of water resources abstracted from the natural and man-made bodies and conveyed through the main stages of the entire system chain. At the same time, they will provide the necessary datasets to identify stages and processes where room for improvement, in terms of cost reduction, maximization of a real economic net benefit, or minimization of environmental externalities, exists.
The results of value chain mapping for two specific agricultural water systems are presented in separate chapters, following a commonly adopted structure. Initially, the agricultural water systems are described by means of main geo-physical characteristics, technical (engineering and agronomic) features, socio-economic aspects and relevant environmental issues. Then, the value chain mapping of both systems has been completed through the definition of the system boundaries (spatial, temporary and economic), the main system components (hydraulic infrastructure and agricultural land) and the stages (e.g. water abstraction, accumulation, conveyance, retention, distribution and use).
The processes involved in specific stages of the system are described considering the actual uptake of technologies and depicting eventual problems. Among others, they included the pumping and energy consumption, water losses in conveyance and distribution network, on-farm water losses related to the efficiency of different irrigation methods, pressure variability, on-farm distribution uniformity, evapo-transpiration, deep percolation and drainage, cropping pattern and nutrient supply.
The resource inputs and environmental impacts relevant to each stage (or process) of the system are explained considering the costs and benefits for the system. Accordingly, a preliminary list of selected environmental impact indicators is discussed and delivered.
Directly and indirectly involved actors in the different system stages are identified and described, explaining the interactions among them, the pertinence to specific system components and stages, and the links to eco-efficiency indicators. Finally, a preliminary list of potential technologies/innovations/practices that could be evaluated for each Case Study is pointed out. In the next phases of Case Study development, the list will be reviewed and finalized through the baseline eco-efficiency assessment and after the discussions with local actors/stakeholders. Accordingly, the assessment of the selected technologies will be completed for each Case Study.

Deliverable 2.1 – Value chain mapping Page 10 of 77
2 Value Chain mapping for Case Study # 1: The Sinistra Ofanto Irrigation Scheme, Italy
2.1 Objectives of the Case Study
The “Sinistra Ofanto” irrigation scheme was selected as a Case Study, as it is among the largest multi-cropped irrigated areas in the Apulia region and represents a relevant application example of the EcoWater rationale; the practice of irrigation is a crucial factor for the regional agricultural production and income. As a matter of fact, 18.5 % of the agricultural area in the Apulia region is currently under irrigation and the value of the irrigated crops results to 69% of the total value of regional agricultural production, which was quantified in 3.8 billion Euros (INEA, 2010). As it can be inferred from the above figures, irrigation is crucial for crop production in the Apulia region, but at the same time it generates environmental externalities and concerns that need to be further investigated and evaluated through the use of some specific eco-efficiency indicators (EcoWater Project – Deliverable 1.1 “Review and selection of indicators to be used in the Eco-Water Case Studies”, April 2012; EcoWater Project – Deliverable 1.4 “Review of existing frameworks and tools for developing eco-efficiency indicators”, August 2012). The economic and environmental aspects of agricultural water use represent the main methodological challenges to be addressed within the Sinistra Ofanto Case Study, both under the baseline conditions (Business-As-Usual) and under scenarios resulting from the uptake of technological innovations both at the farm scale and at the sector, district, network and whole system levels.
Within the Sinistra Ofanto irrigation system, three (3) sub-schemes are considered for the eco-efficiency assessment. The first is represented by the cropped areas of the Districts 1, 2, and 3, where water is conveyed by gravity and directly pumped into the district distribution networks. In the second, referred as the “Lower zone”, water is supplied from the source to the farms entirely by gravity (gravity-fed conveyance and distribution); in the third, referred as “Upper zone”, water is delivered to users by a combination of conveyance through water lifting to reservoirs at higher elevations and distribution by gravity-fed pipe networks. Thus, these sub-schemes represent three (3) different supply chains of agricultural water use, all characterized by water distribution through pressurized delivery systems, but one being supplied with water by means of pumping, the other being entirely gravity-fed, and the third by a combination of lifting plus gravity. Therefore, considering these different water use chains, the objective is to assess the eco-efficiency of the Sinistra Ofanto irrigation system both under the current baseline conditions and under the scenarios of uptake of eco-efficient technologies.
2.2 Overview of the Case Study area / sector
2.2.1 Location and geo-physical features
The “Sinistra Ofanto” irrigation scheme is located in the south-eastern part of the province of Foggia, Apulia region, Southern Italy, (Figure 1). The command area

Deliverable 2.1 – Value chain mapping Page 11 of 77
stretches along the left side of the Ofanto River for 40,500 ha in total; 38,815 ha are irrigable lands and 28,165 ha are actually under irrigation. The whole scheme is supplied by the waters of the Ofanto River, which appertains to three (3) Italian regions (Apulia, Basilicata and Campania). The “Sinistra Ofanto” irrigation scheme is managed and operated by a local water users’ organization (WUO), namely the “Consorzio per la bonifica della Capitanata”, hereafter referred to as Co.Bo.Ca. This large-scale system was designed and constructed during the 1980’s, in order to operate by demand delivery schedule, under pressure originated either by gravity or pumping. However, during peak-demand periods in dry years, such delivery schedule had to be modified into arranged demand (Lamaddalena et al., 1995; Lamaddalena, 1996).
5
6
4
98
11 7
14
31
12
10
13
2
16
Ofanto river basin.shp
Sinistra ofanto - ok.shpSinistra Ofanto lower zoneSinistra Ofanto higher zone
Regioni.shpOfanto river.shp
Invasi.shpaccumulation lake
N
EW
APULIA
BASILICATA
APULIA
CAMPANIA
ADRIATIC SEA
Capacciotti Dam
Administrative boundariesSINISTRA OFANTO CASE STUDY
Ofanto River and its tributaries
Accumulation lakes/dams
Figure 1: Location of the Sinistra Ofanto irrigation scheme within the Ofanto River
Basin
With regard to the geo-physical features, the command area is a flat plain, characterized by two slope directions, one towards the Adriatic sea (West-East) and one towards the Ofanto River (North-South). The hydrography is mainly composed of streams with seasonal regimes (fall-winter-spring), whose flows result from the rainfall intensities.
2.2.2 Climate
Climate can be classified as “Maritime-Mediterranean”, and hence it is characterized by short and mild winters with average temperature of around 8 - 10°C and minimum values sometimes below 0°C. In contrast, summers are quite long and last from June to September, with maximum temperatures occurring across July and August, often

Deliverable 2.1 – Value chain mapping Page 12 of 77
exceeding 40°C. The average yearly rainfall is around 520 mm, unevenly distributed along the year; the area can be classified as sub-arid. The prevailing winds during winter and spring are those blowing from the north, whereas those blowing from west and south-west are frequent during summer months. The average wind speed is about 2.0-2.5 m s-1 with higher intensity after the midday. Average annual reference evapotranspiration is about 1,150-1,200 mm, with a daily average of about 3.2 mm.
The reference meteorological station for the Case Study area is “Agro di Cerignola”, located at Azienda Agricolla Torricelli (LAT 41.26°N, LONG 15.91°E, altitude 134 m a.s.l.). The monthly averages of the main climatic variables (i.e. precipitation, maximum and minimum air temperature, relative humidity, wind-speed, eliophany, incoming solar radiation and reference evapotranspiration estimated by the Penman-Monteith equation) are given in Table 1 for a period of 30 years (1981-2010).
Table 1: Monthly averages of climatic variables from 1981 to 2010
Month Precipitation T Max T Min RH WS Eliophany Radiation ETo
mm °C °C % Km/d hours MJ/m2/d mm/d
Jan 48 12.6 3.3 81 205 2.6 5.5 0.98
Feb 38 13.8 3.0 75 227 4.0 8.7 1.49
Mar 48 17.0 5.3 72 243 4.9 12.3 2.24
Apr 49 20.4 8.0 70 229 5.8 16.2 3.06
May 35 26.3 12.4 64 208 8.1 21.1 4.48
Jun 29 31.0 15.9 59 195 8.7 22.7 5.47
Jul 25 33.7 18.5 53 208 9.9 23.9 6.34
Aug 24 34.0 18.8 56 199 9.3 21.5 5.84
Sep 41 28.0 15.1 68 193 7.0 15.8 3.8
Oct 52 23.4 11.3 75 179 5.2 10.7 2.32
Nov 65 17.4 7.5 80 193 3.1 6.4 1.35
Dec 62 13.3 4.5 81 199 2.0 4.6 0.97
2.2.3 Soils
Soils in the Case Study area are of two types, i.e. sandy-calcareous and alluvial. The former is light in texture and rich in carbonates, organic matter and nitrogen, and is characterized by medium-to-high fertility, good permeability and soil water retention. On the contrary, the latter is mainly of loamy-clay type, and hence characterized by very good fertility, high soil water retention and high content of organic matter, and of the N, P and K components. In both soil types, the permeability ranges between 15 to 35 mm h-1, which makes them very suitable for irrigated agriculture.
2.2.4 Technical aspects of the Sinistra Ofanto water system
Although the Sinistra Ofanto irrigation system was conceived for utilizing an overall amount of 78.5 Mm3 of water for irrigating the entire command area, the topographic features of the Ofanto river basin did not allow to build infrastructures of that total storage capacity. Therefore, the designers articulated the hydraulic scheme around 3 dams and on a number of infrastructures that are described in the following paragraphs and whose layout is reported in the Figure 2.

Deliverable 2.1 – Value chain mapping Page 13 of 77
Figure 2: Sources and conveyance system supplying the Sinistra Ofanto irrigation
scheme
Two storage reservoirs and related dams that release water into the corresponding water courses during the irrigation season (April to September) are located in an upstream reach of the Ofanto River, at Conza in the Region of Campania, and on its affluent Osento river, at San Pietro in the area of Monteverde (province of Avellino). Along the Ofanto River, downstream of the Conza and San Pietro dams, a small concrete barrage is located at Santa Venere, functioning as water diversion work to intercept both the winter-spring flows in the Ofanto River and the water volumes released from the abovementioned reservoirs and dams. The Santa Venere-Ofanto canal, which originates from the Santa Venere diversion, conveys water, for a maximum discharge of 12 m3 s-1, both to the Sinistra Ofanto and the Destra Ofanto irrigation schemes (Altieri, 1995).
In details, at the location of Pantanelle, the downstream end of the Santa Venere-Ofanto canal, a water division work, referred to as the Destra Ofanto divider, partitions the water conveyed from the Santa Venere diversion into two conveyance conduits, one on the right side that supplies the Destra Ofanto scheme, managed by another WUO, namely the “Consorzio di Bonifica Apulo-Lucano”, and the other on the left side supplying the Sinistra Ofanto scheme, managed by the WUO Co.Bo.Ca (Figure 3).

Deliverable 2.1 – Value chain mapping Page 14 of 77
Figure 3: Hydraulic scheme of the Sinistra Ofanto system upstream of Capacciotti
reservoir
The conveyance conduit supplying the Sinistra Ofanto scheme, sized and constructed to convey a maximum discharge of 8 m3 s-1, crosses the Ofanto River by means of the “Ofanto” siphon, and subsequently reaches a small concrete basin located at Canestrello, from which water is supplied to the District 1 by means of the Canestrello pumping plant. The Ofanto-Capacciotti conduit, which originates from this basin at Canestrello, along its way supplies water to Districts 2 and 3 by means of two different pumping stations, and subsequently gets partitioned into two pipelines. The first is named “Upper Zone conduit”, conveying water towards the Upper zone composed of Districts 11 to 14, and the second is named “Capacciotti-San Ferdinando conduit”, serving the Lower zone, and hence conveying water to a large storage reservoir, i.e. the Capacciotti lake. This reservoir is fed by its small watershed, but also receives the spring-winter flows from the Santa Venere diversion, when this water is not demanded by the command areas of the irrigation Districts 1, 2 and 3. A conveyance pipeline, referred to as the “Capacciotti-San Ferdinando” conduit, originates from the Capacciotti reservoir to supply water to the entire Lower zone. The two conveyance systems serving the Upper and Lower zones consist of conduits that supply some storage and daily regulation reservoirs from which the district distribution networks take origin. The hydraulic scheme and conveyance pipelines of the Sinistra Ofanto irrigation system are illustrated in Figure 4.
The entire command area of the Sinistra Ofanto system is subdivided into 3 main sub-schemes. The first comprehends the Districts 1-2-3, covering a total area of 2,715 ha, is located in the Ofanto valley along the left bank of the Ofanto River. This sub-scheme and is directly supplied by the Ofanto-Capacciotti conduit through three pumping plants, the first of which is located at Canestrello. The other two sub-schemes are located along the Ofanto-Capacciotti conduit, all enabling the water delivery to farmers under adequate pressure for proper operation of the on-farm irrigation systems. The second sub-scheme is of the “Lower zone”, about 23,400 ha, subdivided into seven districts (from 4 to 10); each district is subsequently sub-divided into smaller operational units, called irrigation “sectors”, which, in turn, are composed of several grouped farms (Zaccaria et al., 2011).
To Upper Zone

Deliverable 2.1 – Value chain mapping Page 15 of 77
Figure 4: Conveyance conduits supplying the different zones of the Sinistra Ofanto
system
Throughout the entire Lower zone, water is supplied to farms by the Capacciotti-San Ferdinando gravity-fed pipe conduit, through five storage and daily regulation reservoirs, referred to as R4, R5, R6-7, R8, R9-10, respectively; they are located upstream of the aforementioned districts (4 – 10). These regulation reservoirs allow buffering inflow and outflow discharges, so as to satisfy the peak demand flow rates during the day time. The third sub-scheme is of the “Upper zone”, covering an area of about 12,700 ha, and is subdivided into four districts (from 11 to 14), where cropped fields are at a higher elevation than that of the water source. These districts are commanded by three storage and daily regulation reservoirs, hereafter referred to as R11, R12, and R13-14, which are located upstream of the district 11, 12, 13 and 14, respectively. These reservoirs are supplied by means of three water lifting plants, located along a pipeline branching out from the Ofanto-Capacciotti conduit, referred to as the “Upper Zone” (“Zona Alta”) conduit. From these reservoirs, water is subsequently delivered to farms by means of gravity-fed piped distribution networks.
The water distribution networks are operated by demand delivery schedule; all farmers can be supplied with water at their convenience, within a maximum allowed flow rate of 10 l s-1, without exceeding the maximum seasonal shares allocated by the WUO to each irrigated cropped hectare of the command area (out of the total available water supply from the source). The systems’ features and operational procedures ensure the delivery of water by a nominal discharge of 10 l s-1, with a minimum pressure head of at least 2 bars (20 m) at each hydrant, which are suitable for trickle and micro-irrigation methods commonly used by farmers in the area. All hydrants are equipped with flow meters, flow recorders and rubber-ringed flow limiters, which restrict the withdrawal to a maximum of 10 l s-1.
2.2.5 The costs of water supply and water pricing
Within the Sinistra Ofanto irrigation system, the WUO Co.Bo.Ca. is the main management body responsible for abstraction, conveyance, storage and distribution of water to farmers for irrigation purposes. Being an organization of water users, the Co.Bo.Ca. is by statute a no-profit organization, which means that it bears all the costs for performing its functions and that all these costs are included in the water tariffs paid by farmers. In other words, farmers pay for the water delivery services

Deliverable 2.1 – Value chain mapping Page 16 of 77
being provided by the Co.Bo.Ca. and participate to all the costs related to water delivery on the basis of a full cost-sharing mechanism.
On average, the overall cumulated volume stored, conveyed and distributed to the entire command area of the scheme amounts to 34 Mm3 resulting in a total cumulated conveyance and distribution cost of 3,172 M€, with a unit irrigation cost of 82.6 €/ha and of 0.10 €/m3 (D’Arcangelo, 2005). In reality, the WUO Co.Bo.Ca. bears the cost of 0.03 €/m3 for conveyance and storage; the cost for water distribution is 0.075 €/m3, in the case of gravity-fed distribution, and 0.13 €/m3, in the case of pumping or lifting requirements.
Although the costs for supplying irrigation water are significantly different between the areas supplied by gravity and those served by pumping and/or lifting, the WUO applies the same irrigation tariffs, regardless of the farms being located within the Districts 1, 2 and 3, the Lower or Upper zones; thus, it enforces the principle of solidarity among the different serviced areas. In fact, the WUO enforces homogeneous water fees that are based upon incremental volumetric water tariffs, thus increasing along with the seasonal cumulated volumes withdrawn by farmers, as specified below:
0.09 €/m3 for seasonal water withdrawal between 0 – 2,050 m3/ha; 0.18 €/m3 for seasonal water withdrawal between 2,050 – 4,000 m3/ha; and 0.24 €/m3 for seasonal water withdrawals higher than 4,000 m3/ha.
2.2.6 The socio-economic context
The entire study area is characterized by a very high number of small land-holdings and by highly market-oriented farming activities. Profitable farming strongly depends on irrigation, due to the type of climate and the limited amount of rainfall during the most water-demanding periods of the crop cycle (late spring and summer).
In the command area of the Sinistra Ofanto system, vineyards and olive are the main crops grown, with a share of 39% and 24% of the total irrigated land, respectively, followed by vegetables and orchards. Table 2 presents the crop distribution in 2010.
Table 2: Crop distribution in the sub-schemes and cthe ommand area of the study area
Crops District 1,2 & 3
(ha)
Lower Zone (ha)
Upper Zone (ha)
Command Area (ha)
Command Area (%)
Sugarbeet 0 33 0 33 0.1
Tomato 171 180 113.3 293.3 0.9
Artichoke 34 391 170.5 561.5 1.7
Vegetables 344 2,159 135.2 2,294.2 7.1
Wheat 2,218 2,159 2,604.6 4,763.6 14.8
Asparagus 63 0 23.1 23.1 0.1
Table grapes 0 3,098 43 3,141 9.7
Wine grapes 79 7,570 1,923 9,493 29.4
Olive 35 5,114 2,588.5 7,702.5 23.9
Orchards 52 1,850 78.7 1,928.7 6.0
TOTAL 2,996 21,601 7,680.4 32,253.3 100.0

Deliverable 2.1 – Value chain mapping Page 17 of 77
The farming system of the study area consists of about 18,500 farms, with an average size of about 2.0 ha. Land-holding is very fragmented, given that about 91% of the farms cover a cropped area less than 3 ha (INEA, 1999). According to information retrieved from the 6th Italian General Agricultural Census, dated in 2010, the structural framework has deeply changed with respect to the data resulting from surveys of the year 2000, due to a concentration of farmland and livestock areas into a significantly reduced number of farms (ISTAT, 2010; ISTAT, 2000). During the period 2000-2010, the number of agricultural farms in the Apulia region has reduced by 18%, whereas the agricultural area utilized has increased by 2,7%. Notwithstanding the increase in the average size of farms, smaller and medium farms (less than 2 ha) still represent the majority of agricultural farms in the study area, as they account for 45 % of the total number of farms, but only for 7.5% of the area.
Three common typologies of farms, which mainly differ in terms of crop land occupation and intensity of input factors, can be identified:
a) Small and part-time family farms; b) Medium size farms with cereals and intensive horticultural crops; and c) Large size farms with cereals and extensive horticultural crops.
Small and part-time family farms are mainly oriented towards the maximization of net income, while preserving the traditional role of land owners. On the other hand, medium and large size farms are highly market-oriented and aim at maximizing profits from farming activities, as a result of the favorable agro-climatic conditions and the well-established agro-food industrial sector. A large part of the crop production is locally processed and prepared for local, national and international fresh markets, and hence generating income that gets distributed among the main actors of the fresh produce value chain. Besides fresh vegetables and fruits, wine and olive oil are among the main agricultural products of the area. These are locally processed and marketed at a local and a national level, through farmers’ cooperatives and private agri-business companies.
Profitable farming in both districts strongly depends on irrigation, due to the climatic conditions and the uneven distribution of limited rainfall. As mentioned in the general introduction, agricultural productivity of irrigated farms in the study area is 3 times higher than that of non irrigated farms, and the added value per hectare in irrigated farms is 4-fold that of non irrigated farms.
2.3 Methodology
The methodology applied for the development of the “Sinistra Ofanto” Case Study represents a combination of the results of previous investigations and direct stakeholders involvement within this Project, which permits the characterization of the study area regarding the technical specificities (engineering and agronomic) of the water system and the socio-economic and environmental issues. The main actors involved in water management and use are identified and contacted to provide the available data for a detailed characterization of the system, including the main functional components, stages and processes of water supply for agricultural purposes. After several visits to the study area and meetings with Co.Bo.Ca. managers, the system boundaries have been identified and a first mapping of the

Deliverable 2.1 – Value chain mapping Page 18 of 77
system components has been completed. The collection of data focused on historical data on water availability and use (resource flows and water demand), weather conditions, cropping patterns, agronomic inputs and economic and environmental matters.
In the framework of the EcoWater Project, a first Workshop with local stakeholders has been organized, in order to present the Project activities and to collect feedback on the main problems affecting the study area, focusing on the use of water in agriculture and socio-economic and environmental connotations. Special attention was given to the selection of indicators for eco-efficiency assessment and the identification of technologies and management practices that could improve the system performance. The activities included the development of environmental impact indicators for the cause-effect environmental chains and a preliminary economic analysis, to quantify value in use in relation to current cropping and land use patterns.
2.4 Mapping of the water service system
2.4.1 System boundaries
Case Study # 1 refers to the entire command area of the Sinistra Ofanto irrigation system. Three different chains of agricultural water supply are identified within the scheme, as illustrated in Figure 5. The Supply Chain 1 is represented by the sub-scheme of Lower Zone and characterized by gravity-fed conveyance and distribution of water from the source to the final users. The Supply Chain 2 corresponds to the sub-scheme of Districts 1, 2 and 3, where conveyance occurs by gravity and distribution through water pumping/lifting. In the Supply Chain 3, water is conveyed by lifting water to the reservoirs at higher elevations and distribution occurs by gravity, similarly to that of the Lower Zone. In other terms, the Supply Chain 3 is represented by the Upper Zone and is a combination of lifting and gravity, and differs from the Supply Chain 1 only for the water conveyance that occurs through lifting instead of being gravity-fed; the distribution is gravity-fed in both cases.
Figure 5: The three water supply chains of the Sinistra Ofanto irrigation scheme

Deliverable 2.1 – Value chain mapping Page 19 of 77
Within the Supply Chains 1, 2 and 3, the agricultural water use does not vary significantly among the seven districts of the Lower Zone, the Districts 1, 2 and 3, and the four districts of the Upper Zone, respectively, as their cropped areas are quite homogeneous, in terms of (i) soil features, (ii) climatic conditions, (iii) cropping pattern, (iv) agricultural practices, and (v) farmer habits. For this reason, the detailed analyses aiming at assessing the eco-efficiency of water use that results along the Lower Zone will focus only on one district per each sub-scheme, but will subsequently refer to the entire area of each pertaining supply chain. Specifically, the analyses will focus on District 10 for the Supply Chain 1, District 1 for the Supply Chain 2 and District 11 for what pertains to the Supply Chain 3.
With regard to the temporal boundaries, a seasonal time step will be considered in the eco-efficiency assessment, and the different analyses will account for time-averaged values from two (2) subsequent recent irrigation seasons, i.e. 2009 and 2010.
Focusing on the economic outputs of the agricultural production, the total turnover and net benefit generated only by the farming activities in the entire Sinistra Ofanto command area are estimated to be 256 M€ and 128 M€, respectively, without considering further processing and marketing activities.
2.4.2 Mapping of the water service system and description of stages
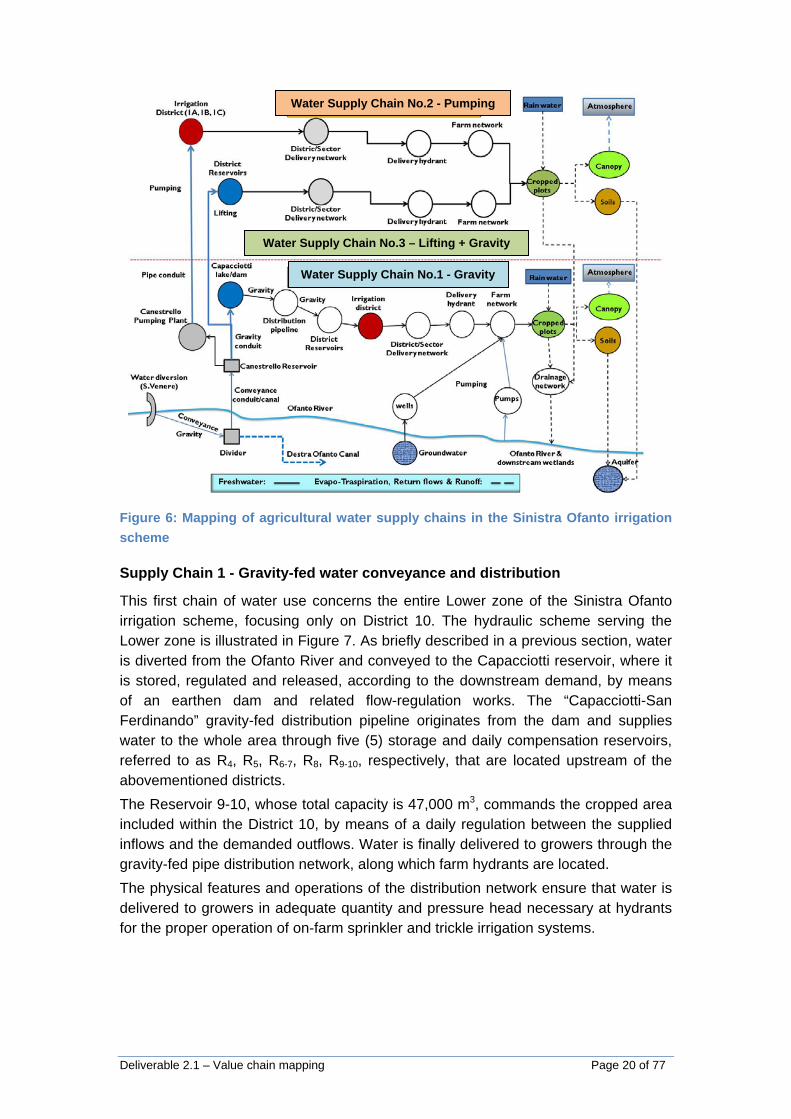
The main stages and system components of the three (3) chains of water use in the Sinistra Ofanto Case Study are schematically represented in Figure 6 and briefly described hereafter.
Deliverable 2.1 – Value chain mapping Page 20 of 77
Figure 6: Mapping of agricultural water supply chains in the Sinistra Ofanto irrigation
scheme
Supply Chain 1 - Gravity-fed water conveyance and distribution
This first chain of water use concerns the entire Lower zone of the Sinistra Ofanto irrigation scheme, focusing only on District 10. The hydraulic scheme serving the Lower zone is illustrated in Figure 7. As briefly described in a previous section, water is diverted from the Ofanto River and conveyed to the Capacciotti reservoir, where it is stored, regulated and released, according to the downstream demand, by means of an earthen dam and related flow-regulation works. The “Capacciotti-San Ferdinando” gravity-fed distribution pipeline originates from the dam and supplies water to the whole area through five (5) storage and daily compensation reservoirs, referred to as R4, R5, R6-7, R8, R9-10, respectively, that are located upstream of the abovementioned districts.
The Reservoir 9-10, whose total capacity is 47,000 m3, commands the cropped area included within the District 10, by means of a daily regulation between the supplied inflows and the demanded outflows. Water is finally delivered to growers through the gravity-fed pipe distribution network, along which farm hydrants are located.
The physical features and operations of the distribution network ensure that water is delivered to growers in adequate quantity and pressure head necessary at hydrants for the proper operation of on-farm sprinkler and trickle irrigation systems.
Water Supply Chain No.2 - Pumping
Water Supply Chain No.3 – Lifting + Gravity
Water Supply Chain No.1 - Gravity

Deliverable 2.1 – Value chain mapping Page 21 of 77
Figure 7: Hydraulic scheme of the Lower zone (Supply chain 1)
District 10 covers an overall topographic area of about 2,000 ha, out of which the total irrigable area is 1,679 ha and the area currently under irrigation is 1,423 ha. The cropping pattern of the district was obtained from WUA records and is reported in the Table 3.
Table 3: Cropping pattern in the irrigation District No. 10
Crops Irrigated area (ha)
Vineyards 1073.6
Olive 106.5
Orchards 131.4
Vegetables 111.3
Wheat --
TOTAL 1422.8
The distribution network of District 10 is open-branched and composed of gravity-fed buried pipelines equipped with 413 delivery hydrants, having nominal discharge of 10 l s-1, each of them supplying water to several cropped fields.
In terms of functions and processes, the sequence of stages and related components for the Supply Chain 1 is reported in Table 4. Table 4 also presents the parts of the system that are common for the whole study area and for other supply chains, as three (3) water supply chains of the “Sinistra Ofanto” irrigation scheme are interlinked.

Deliverable 2.1 – Value chain mapping Page 22 of 77
Table 4: Stages, processes and system components of the whole water system
System/Supply chains
System components Stages/processes
Whole system (chains 1, 2 & 3)
Ofanto River Water source
Whole system (chains 1, 2 & 3)
Surface diversion at S. Venere (small concrete barrage)
Water diversion
Whole system (chains 1, 2 & 3)
Conveyance canal S. Venere-Ofanto (to the Destra Ofanto Divider)
Conveyance to the Destra Ofanto divider
Whole system (chains 1, 2 & 3)
Destra Ofanto Divider Water partitioning
Whole system (chains 1, 2 & 3)
Ofanto siphon Conveyance to the
Canestrello reservoir Whole system
(chains 1, 2 & 3) Canestrello concrete reservoir
Hydraulic disconnection, storage and regulation
Supply chain 2 Canestrello pumping station Water delivery by
pumping to district 1
Chains 1, 2 & 3 Conveyance conduit Canestrello –
Partitioning Lower/Upper zone
Conveyance to chains 1 and 3 and chain 2 (districts 2 and 3)
Supply chain 2 Partitioning and pumping station Water delivery by
pumping to district 2
Supply chain 2 Partitioning and pumping station Water delivery by
pumping to district 3
Chains 1 & 3 Partitioning Upper/Lower zone Conveyance to lower
and upper zone
Supply chain 1 Partitioning - Capacciotti conveyance
conduit Conveyance (gravity)
Supply chain 1 Capacciotti reservoir/dam Storage/regulation
Supply chain 1 Capacciotti-San Ferdinando
Conveyance/Distribution conduit Main distribution (gravity)
Supply chain 1 District reservoir R9-10 Storage & compensation
Supply chain 1 District/sector delivery network Distribution (gravity)
Supply chain 1 Farm hydrants Final delivery
Supply chain 1 Cropped plots Water use
Supply chain 1 Natural drainage network Return flows
Supply chain 1 Ofanto River/Wetlands/Aquifer Final water receptors
Supply Chain 2 - Gravity-fed conveyance and distribution by pumping
The second supply chain of agricultural water use concerns the Districts 1, 2 and 3, which are supplied by pumping water directly into the district pipe distribution networks. Given the homogeneity of the cropped areas, in terms of soils, crops and water use conditions, the analyses for assessing the eco-efficiency under pumping conditions will focus only on District 1; the findings will refer to the entire sub-scheme of District 1, 2 and 3. The supply chain entails the conveyance of irrigation water by gravity from the Santa Venere diversion to the Destra/Sinistra Ofanto divider, to the Canestrello reservoir, and subsequently water is delivered to farmers through a pressurized pipe delivery network, directly fed by the Canestrello pumping plant.
Deliverable 2.1 – Value chain mapping Page 23 of 77
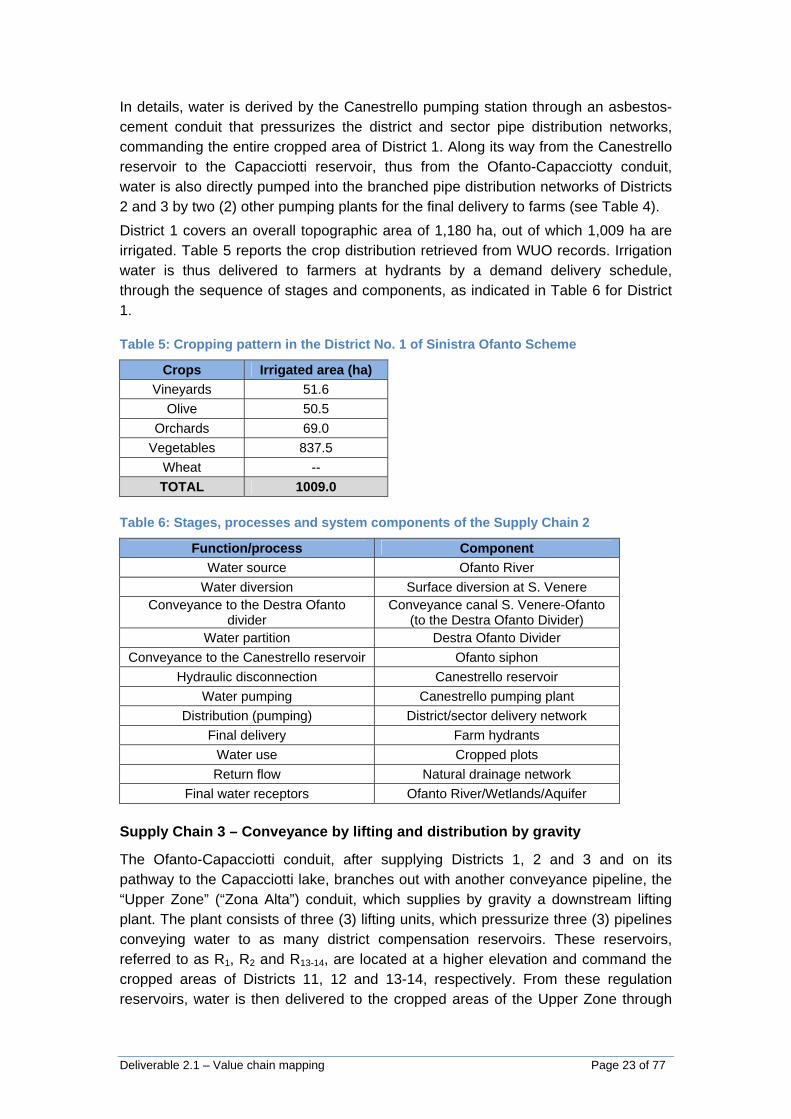
In details, water is derived by the Canestrello pumping station through an asbestos-cement conduit that pressurizes the district and sector pipe distribution networks, commanding the entire cropped area of District 1. Along its way from the Canestrello reservoir to the Capacciotti reservoir, thus from the Ofanto-Capacciotty conduit, water is also directly pumped into the branched pipe distribution networks of Districts 2 and 3 by two (2) other pumping plants for the final delivery to farms (see Table 4).
District 1 covers an overall topographic area of 1,180 ha, out of which 1,009 ha are irrigated. Table 5 reports the crop distribution retrieved from WUO records. Irrigation water is thus delivered to farmers at hydrants by a demand delivery schedule, through the sequence of stages and components, as indicated in Table 6 for District 1.
Table 5: Cropping pattern in the District No. 1 of Sinistra Ofanto Scheme
Crops Irrigated area (ha)
Vineyards 51.6
Olive 50.5
Orchards 69.0
Vegetables 837.5
Wheat --
TOTAL 1009.0
Table 6: Stages, processes and system components of the Supply Chain 2
Function/process Component
Water source Ofanto River
Water diversion Surface diversion at S. Venere Conveyance to the Destra Ofanto
divider Conveyance canal S. Venere-Ofanto
(to the Destra Ofanto Divider) Water partition Destra Ofanto Divider
Conveyance to the Canestrello reservoir Ofanto siphon
Hydraulic disconnection Canestrello reservoir
Water pumping Canestrello pumping plant
Distribution (pumping) District/sector delivery network
Final delivery Farm hydrants
Water use Cropped plots
Return flow Natural drainage network
Final water receptors Ofanto River/Wetlands/Aquifer
Supply Chain 3 – Conveyance by lifting and distribution by gravity
The Ofanto-Capacciotti conduit, after supplying Districts 1, 2 and 3 and on its pathway to the Capacciotti lake, branches out with another conveyance pipeline, the “Upper Zone” (“Zona Alta”) conduit, which supplies by gravity a downstream lifting plant. The plant consists of three (3) lifting units, which pressurize three (3) pipelines conveying water to as many district compensation reservoirs. These reservoirs, referred to as R1, R2 and R13-14, are located at a higher elevation and command the cropped areas of Districts 11, 12 and 13-14, respectively. From these regulation reservoirs, water is then delivered to the cropped areas of the Upper Zone through

Deliverable 2.1 – Value chain mapping Page 24 of 77
gravity-fed branched pipe distribution networks. The analyses pertaining the Supply Chain 3 will only focus on District 11, but findings will refer to the whole Upper Zone.
The cropping distribution of the District 11, retrieved from records provided by the WUO Co.Bo.Ca., is presented in Table 7, whereas Table 8 reports the sequence of stages and components for the Supply Chain 3.
Table 7: Cropping pattern in the District No. 11 of the Sinistra Ofanto Scheme
Crops Irrigated area (ha)
Vineyards 977.0
Olive 1035.0
Orchards 49.5
Vegetables 333.8
Wheat 732.0
TOTAL 3127.3
Table 8. Stages, processes and system components of the Supply Chain 3.
Function/process Component
Water source Ofanto River Water diversion Surface diversion at S. Venere
Conveyance to the Destra Ofanto divider
Conveyance canal S. Venere-Ofanto (to the Destra Ofanto Divider)
Water partition Destra Ofanto Divider
Conveyance to the Canestrello reservoir
Ofanto siphon
Hydraulic disconnection Canestrello reservoirConveyance to lifting plants “Upper zone” conveyance conduit
Water lifting Lifting plants L11, L12 and L13-14
Conveyance to R11, R12 and R13-14 “Upper zone” conduit and branches to
R11, R12 and R13-14 Storage and compensation Reservoirs R11, R12 and R13-14
Distribution (pumping) Gravity-fed district/sector delivery
networkFinal delivery Farm hydrants
Water use Cropped plotsReturn flow Natural drainage network
Final water receptors Ofanto River/Wetlands/Aquifer
2.4.3 Process map description
In some cropped areas of the three sub-schemes, groundwater pumping is conducted by farmers, in order to avoid (i) the limitations of the demand or arranged-demand delivery schedule, or (ii) the constraints related to the increasing water fees enforced by the Co.Bo.Ca. Groundwater pumping is carried out by growers, in the aim of maximizing the net benefit of farming activities. In several cases, farmers conduct a conjunctive use of surface water and groundwater to maximize crop yields and farm net benefit, or avoid yield reduction, which may occur due to relatively high salinity levels in the groundwater. Likewise, several growers whose fields are located close to the river banks, often withdraw irrigation water directly from the Ofanto River by means of booster pumps.
For all the aforementioned situations, some return flows may occur, after water use for fulfilling crop water demands, due to run-off and deep percolation through the

Deliverable 2.1 – Value chain mapping Page 25 of 77
natural and man-made drainage networks, as well as through the soil profile. The final receptors are either the downstream reaches of the Ofanto watercourse and downstream wetlands, or the aquifer.
With regard to the economic aspects, the main issues driving irrigation water use in the study area are the climatic conditions (affecting water supply and irrigation demand), and the economic value of crop yields and production factors. Assessing the eco-efficiency in the baseline scenario, as well as estimating the relative improvement that may result from technology uptake in the water supply chain, entail the availability of data on the economic returns of the farming activities and on the inputs of the main natural resources (water, land, fertilizers and energy) in the crop production process. In addition, the actual cost of water provision to farmers represents a relevant piece of information along with the enforced water pricing, which are described in Section 2.2.5.
2.4.4 Description of existing technologies
This section presents a brief description of the main technologies involved in each stage of the Sinistra Ofanto water system.
From the Santa Venere diversion on the Ofanto River water is conveyed through concrete-lined canals, as well as through steel, concrete and asbestos-cement pipe conduits. Along the conveyance, the main flow regulation devices are controlled either from upstream or downstream, and are either regularly adjusted or automatically adjusted based on some calibrated measuring stations and equipment (SCADA). These conveyance materials and flow regulation technologies allow keeping the conveyance losses very limited and within 5-10 % of the abstracted water volumes.
The main water storage and accumulation infrastructure is represented by the Capacciotti reservoir, which is earthen and has a total capacity of around 50 Mm3, whereas the storage and compensation reservoirs commanding the districts 4 to 14, are concrete-lined. All the storage infrastructures are equipped with automatically-adjusted downstream-control flow regulation devices, which enable to adjust the water inflows and outflows on the basis of the downstream flow demand.
As for the water distribution of Districts 1, 2 and 3, water is pumped into the open-branched pipe delivery networks by means of 3 similar pumping stations, each equipped with units composed of a small electrical pumping unit (base pump), some horizontal axis parallel pumps and one safety pump. Each horizontal parallel pump unit is usually equipped with one inverter that allow varying the pump speed according to the downstream discharge and head requirements. In the District 1, the command area is subdivided in the sub-districts 1A and 1B, covering an irrigated area of 564 ha and 445 ha, respectively, each of them supplied by a pumping assembly composed of a base pump, three horizontal axis pumps connected in parallel and one safety pump. The pumping assembly for the sub-district 1A was designed for a peak-discharge of 300 l s-1, whereas the one for sub-district 1B was designed for 230 l s-1. An ultrasound flow meter and a pressure transducer are installed at the inlet of the distribution networks of sub-districts 1A and 1B, downstream of each pumping assembly. The flow meter is connected with a

Deliverable 2.1 – Value chain mapping Page 26 of 77
computer that regulates the inverters at the horizontal axis parallel pumps. The flow meter communicates the discharge measurements to the computer and to the inverter that, in turn, regulates the pumping speed of each horizontal axis parallel pump to satisfy a pre-set fixed pressure head in the distribution network.
The pumping stations lifting water from the “Upper zone” conduit to the reservoirs R11, R12 and R13-14 are composed by traditional pumping assemblies composed by horizontal axis parallel pumps designed and sized to supply a fixed discharge with a fixed total dynamic head, for an overall power of 1520 Kw.
The distribution networks are composed of a total of 2000 km of asbestos-cement and PVC pipes, with pipe size ranging between 350 and 90 mm. A control unit is installed at the inlet of each sector that is composed of a main gate valve, a Venturi-meter, a flow limiter and a pressure regulator.
From the distribution network water is delivered to farms through irrigation hydrants, which are composite valves usually consisting of an isolation valve, a pressure reducing valve, a flow limiter and a water meter. All these components are installed as farm turnout assembly at the farm gates and can be manually-operated or equipped with micro-processors that allow regulating water withdrawals (Figure 8a and 8b). On average, along the sector distribution networks there is one delivery point each 5-7 ha, for a total number of 5500 hydrants.
Figure 8: (a) Manually operated and (b) electronically fed hydrant
Downstream of delivery hydrants, farmers take over in managing water for irrigating their cropped fields. At this level, the majority of field irrigation is carried out by means of micro-irrigation methods, either through micro-sprinkler and trickle systems. In some limited areas of the scheme, field crops are still irrigated by sprinkler systems. Surface irrigation no longer conducted in any cropped area, due to the high cost of labor and to the limited available water supply.

Deliverable 2.1 – Value chain mapping Page 27 of 77
2.4.5 Environmental and eco-efficiency concerns
Some aspects of water management at different levels of the Sinistra Ofanto systems represent environmental concerns to the upstream and downstream water bodies. Among the main environmental issues to be investigated, in the aim of assessing the eco-efficiency of water use at the system level in the study area are (i) the water volumes abstracted from the Ofanto River, with respect to the minimum vital streamflow in the river downstream of the diversion at Santa Venere, (ii) the aquifer exploitation by farmers for irrigation purposes, (iii) the crop irrigation management and the amount of fertilizers applied by growers at farm level, and (iv) the amount and quality of return flows to the river, to the downstream wetlands and to the aquifer.
Different types of anthropogenic pressures on land and water resources are attributed to the farming activities, with specific reference to the quantitative depletion and qualitative degradation of these resources. Some externalities of crop production under irrigated agriculture can also be represented by the loss of bio-diversity of land and in the natural environment, as a result of (i) intensive farming practices, (ii) fertilizers application to cropped fields, (iii) water abstraction from the Ofanto River for irrigation purposes, (iv) return flows of water of degraded quality to downstream wetlands and aquifers, (v) salinity build-up in the cropped soils, (vi) energy consumption for water pumping, and (vii) CO2 released in the atmosphere. Specifically, the environmental impacts likely occurring in the Sinistra Ofanto case study are presented in Table 9 and are referred to the different stages and resources inputs of the water use chain. Table 10 includes a preliminary list of thematic indicators that would be of interest to the Sinistra Ofanto case study, with the indication of relevance to the different stages and processes of the supply chain. This list will be further elaborated and defined during the follow-up stages of case study development.

Deliverable 2.1 – Value chain mapping Page 28 of 77
Table 9. Environmental impacts related to stages and processes in the Sinistra Ofanto
system
Stage/process Resource Inputs Environmental Impacts
Water diversion Water diversion (m3) Water abstraction
Conveyance to main hydraulic nodes/reservoirs (gravity;
lifting)
Water losses (m3) Energy (kWh)
Conveyance losses GHG emissions
Storage/regulation Water losses (m3) Evaporation/infiltration losses
Main distribution (gravity; pumping)
Water losses (m3) Energy (kWh)
Distribution losses GHG emissions
Final delivery Water losses (m3) Distribution losses
Farmers Water use (m3) Fertilizers (kg)
Application losses; Soil degradation;
Soil contamination (N,P)
Return flows Water drainage/runoff Water quality degradation; Loss of biodiversity; Soil
degradation
Final water receptors Water
percolation/disposal
Water quality degradation; Water pollution; Loss of
biodiversity
Table 10. Preliminary list of indicators of environmental impacts in the Sinistra Ofanto
system
Stage/ Thematic indicator
Water diversion
Conveyance (gravity; lifting)
Storage & regulation
Distribution (gravity;
pumping)
Final delivery
Field water use
Return flows
Water disposal
Climate change & Global warming
0 2 1 2 0 1 0 0
Incoming Water quality
2 2 2 2 2 2 2 2
Water Availability 2 2 2 2 2 2 1 2
Acidification (emissions to air)
0 1 0 1 0 2 0 1
Ozone depletion 0 0 0 1 0 2 0 1
Ecosystem health
2 0 1 0 0 1 2 2
Biodiversity 1 0 1 0 0 2 2 2
Health/air quality 0 1 1 1 0 1 0 1
Resource availability
2 2 2 2 2 2 1 1
Waste disposal 0 1 2 1 0 2 2 2
Legend: 0 = not relevant; 1 = possibly relevant; 2 = relevant
Both the quantitative and the qualitative depletion of the aquifer are among the main environmental concerns in the study area, also expressed by the stakeholders during a meeting held on October 4th 2012 at the premises of MAI Bari. The quantitative depletion is mainly due to the groundwater pumping by many farmers to replenish the gap of crop water demand that is not refilled through water delivered by the Co.Bo.Ca. The qualitative degradation mainly concerns (i) the aquifer salinization, as a result of seawater intrusion due to the over-exploitation of the coastal aquifer, as well as (ii) the emission of pollutants, such as fertilizers and pesticides, as a consequence of intensive farming activities.

Deliverable 2.1 – Value chain mapping Page 29 of 77
Stakeholders also identified several aspects related to the use of groundwater. The most important are listed below:
Surface water availability for agricultural use has been reduced in the last 30 years, due to the expansion of the command areas and to the larger and continuously increasing demands of the municipal, industrial and environmental sectors. Therefore, contradicting interests, and hence conflicts for water allocation and use, are observed in the study area.
The re-use of treated wastewater is proposed to be examined, as a valid alternative to aquifer exploitation for irrigation purposes.
The protection of natural resources is related to (i) the possibility of using alternative sources of water for irrigation purposes rather than exploiting or over-using the groundwater, as well as (ii) the improved water management of the farming activities, so as to achieve higher efficiency of water use.
Vigilance and control is a recommended strategy to be strengthen throughout the territory of the Apulia region, especially in the study area, in order to avoid the over-exploitation of the aquifer and the uncontrolled water withdrawals from water courses.
Restrictions for wastewater re-use concern the quality parameters and the high cost of wastewater treatment, which have hamper its application and wide use in irrigated agriculture. It is recommended that policy-makers reduce both the quality restrictions for using treated wastewater in agriculture and the management costs of treatment plants. The latter can be accomplished by installing the latest technologies available on the market for wastewater treatment.
The lack of research dissemination, the disinformation and the diffidence by farmers are among the main causes preventing the wide use of treated wastewater for irrigation purposes. Many growers are reluctant to use treated wastewater, as they either are not convinced about its suitability for irrigation or perceive it as being of low quality, thus leaving pollutants onto the cropped fields. To that end, the broad dissemination of the research findings to growers, through farmers’ advisers and extension service agents, could be critical for fostering the use of treated wastewater in irrigated agriculture in the study area, as an alternative to the groundwater pumping.
The information collected during the stakeholders’ meeting is structured into a cognitive map (CM), representing the stakeholders’ perceptions and knowledge about the possible existing causal links among the different issues related to agricultural water use and water sources in the area. The CM, illustrated in Figure 9, shows that the primary concern of the stakeholders is the use of groundwater for irrigation purposes, being perceived as having the most negative impact on land and water resources, in terms of quantitative depletion and of qualitative degradation.

Deliverable 2.1 – Value chain mapping Page 30 of 77
Figure 9: Cognitive Map, representing the stakeholders’ knowledge and perceptions in
the Sinistra Ofanto area
2.5 Selection of eco-efficiency indicators
2.5.1 Eco-efficiency indicators
Resource-efficiency indicators relate resource inputs to monetary outputs. Assessing eco-efficiency entails quantifying three types of parameters and exploring their relevant inter-linkages, as illustrated in the conceptual model reported in Figure 10. With regard to the irrigated agriculture, the eco-efficiency of water use can be defined as:
&WATER
Agricultural Economic Output Value of productionEco efficiency
Demand on the Environment Extracting resources Emitting pollution
Figure 10: Relevant parameters and inter-linkages for assessing Eco-efficiency
Focusing on the above equation and on Figure 10, it can be inferred that assessing eco-efficiency in the water use chains of the Sinistra Ofanto area requires indicators

Deliverable 2.1 – Value chain mapping Page 31 of 77
both of economic and environmental nature, as well as composite parameters representing the relationship between the economic outputs and the impacts of water use on natural resources. Selecting appropriate indicators entails the consideration of specific criteria, such as:
Data availability, at the appropriate scale and in consistent (standard) units;
Sensitivity to changes over time and to alternative future scenarios;
Relevance to the entire system of interest;
Showcase whether eco-efficiency improves or declines and in which respect; and
Relevance of the indicators to the different stakeholders. this criterion includes the capability to support management decisions and actions, and the required communication to be used.
The indicators (and the related units) that will be used in the analyses, aiming at assessing the eco-efficiency of water use in the study area, are:
Indicator of economic outputs:
a) Total Value Added from Water Use, VA (€/m3 water used)
Indicators of environmental impacts:
a) Global Warming Potential, GWP (kg CO2/m3 water used) b) Groundwater Abstraction, GWA (m3 groundwater abstracted/m3 water
used) c) Energy Use, EU (kWh/m3 water used) d) Network Losses, NL (m3 water losses/m3 water used)
Four different indicators for assessing eco-efficiency in the Sinistra Ofanto area will be obtained by relating the indicator of economic outputs, i.e. the Total Value Added from Water Use, to the different indicators of environmental impacts, as presented in Table 11.
Table 11: Eco-efficiency indicators and related units
Eco-efficiency Indicators Units
Global Warming Potential (€/kg CO2)
Groundwater abstraction (€/m³ groundwater abstracted)
Energy use (€/kWh)
Network losses (€/m³ water losses)
2.5.2 Economic costs and benefits
The average costs of water abstraction, diversion, conveyance, storage and final delivery to end-users (growers), as well as the volumetric water tariffs paid by farmers are detailed in the Section 2.2.5. With regard to the economic performance of farming activities, data retrieved from the Farm Accountancy Data Network for 2007 show an average turnover of nearly 149,250 € and a net income of about 74,806 € per farm, corresponding to about 6,600 € and 3,300 € per cropped hectare, respectively (FADN, 2007). The average economic performance of the main crops grown in the study area is presented in Table 12.

Deliverable 2.1 – Value chain mapping Page 32 of 77
Table 12: Economic performance of the main crops in the Sinistra Ofanto area
CROPS Turnover
(€/ha) Costs (€/ha)
Gross income (€/ha)
Sugarbeet 2154.9 965.4 1189.6
Potato 10976.4 2184.5 8791.9
Artichoke 7947.5 1332.2 6615.3
Tomato 8507.8 2254.3 6253.4
Table grapes 15059,5 1448.7 13610.8
Wine grapes 6491.4 829.6 5661.7
Olive 1979.4 261.4 1718.0
Orchards 11817.0 1929.9 9887.1
2.6 Mapping of actors
The main operational stages and processes being regularly conducted along the supply chains within the Sinistra Ofanto irrigation system can be summarized as follows:
Water abstraction from the Ofanto River;
Water conveyance to the main division works, i.e. the Sinistra/Destra Ofanto divider;
Water pumping into the distribution networks of Districts 1, 2 and 3;
Water conveyance to storage infrastructures located in the Upper and Lower zones;
Water distribution to farm hydrants;
Water withdrawals by farmers from the distribution networks, from the Ofanto river and from the aquifer; and
Water application to cropped fields by farmers.
Several stakeholders can be identified in the study area, some of them being main actors involved at different stages of the water supply chains, as presented in Table 13.

Deliverable 2.1 – Value chain mapping Page 33 of 77
Table 13: The relevant stakeholders / actors and the corresponding stages thet are
involved
Stakeholder / actor Stage of involvement
River Basin Authority Entire water supply chain
Protezione civile Natural and man-made watercourses
Ente Irrigazione Water abstraction from the Ofanto River
WUO Terre D’Apulia Water partition at Sinistra/Destra Ofanto divider
WUO Co.Bo.Ca Conveyance, storage and distribution to growers
ARPA Puglia Whole water supply chain and final disposal
Farmers Water use at field level; groundwater & river pumping
Agro-business companies Water use at field level; groundwater & river pumping
Farmers’ Unions and cooperatives Water use at field level
Environmental groups Entire water supply chain
The main actor involved in all these stages is the WUO Co.Bo.Ca. that represents the main water management body in the Sinistra Ofanto area. The Co.Bo.Ca. is a private organization established by Public Decree in May 10th 1965 and has its own by-laws, approved by the Apulia Regional Government in 1981, that regulate the administrative procedures.
The Co.Bo.Ca. is administered by farmers, i.e. all land-owners whose holdings are included within the boundaries of the WUO. All these farmers are generally members of trade-union associations, representing and claiming their common economic and social interests. The three unions, which include almost all farmers, are the:
Unione Agricoltori (Farmers’ Union), mainly composed of the producers who manage medium-large size farms;
Federazione Coltivatori Diretti (Owner-occupiers’ Federation), mainly involving producers who manage medium-small size farms; and
Confederazione Agricoltori (Farmers’ Confederation), mainly formed by farmers managing small farms.
From the technical and operational points of view, the Co.Bo.Ca. is managed by a General Director and is organized into 3 main divisions or directorates, i.e. the Engineering division, the Agronomic division and the Administrative division, each having its specific duties and being managed by a service director, as illustrated in Figure 11. With respect to the water supply chains and the main stages and processes already mentioned, the Engineering division is responsible for operating and maintaining the major storage and conveyance infrastructures, whereas the Agronomic division the distribution networks, organizing and managing the irrigation delivery services to farmers.
As for the delivery service, the Co.Bo.Ca. is a service provider composed of service receivers, being a water management body governed by farmers, and thus implementing both the principles of participatory irrigation management (PIM) and of service-oriented management (SOM).

Deliverable 2.1 – Value chain mapping Page 34 of 77
GENERAL DIRECTORGENERAL DIRECTOR
WATERSHEDMANAGEMENT
WATERSHEDMANAGEMENT
DIRECTOR OFADMINISTRATION
DIRECTOR OFADMINISTRATION
DIRECTOR OFAGRICULTURE SERVICE
DIRECTOR OFAGRICULTURE SERVICE
DIRECTOR OFENGINEERING SERVICE
DIRECTOR OFENGINEERING SERVICE
LEGAL SESSIONLEGAL SESSION
EXTENSIONSERVICE
EXTENSIONSERVICE
IRRIGATIONIRRIGATION
LARGE WORKS- Design- Supervision- Maintenance
..................
LARGE WORKS- Design- Supervision- Maintenance
..................
PERSONNELPERSONNEL
ESPROPRIATIONSESPROPRIATIONS
CONTRACTSCONTRACTS
..............................................
Figure 11: Flow chart of the technical organization of the WUO Co.Bo.Ca
To perform its water distribution and management functions, the Co.Bo.Ca. deals with other upstream and downstream actors and stakeholders. Concerning the upstream actors, the volume of water allocated to the corresponding command area is negotiated, on a year-by-year basis, between the Co.Bo.Ca. and other water management bodies, either of the same of higher hierarchy level. Among them, the Co.Bo.Ca. holds a long-term concession of water-abstraction and use released by the Ente Irrigazione, a higher-hierarchy governmental water authority that is responsible for the major hydraulic infrastructures and their operation (e.g. water bodies, dams, reservoirs and large conveyance structures) for the exploitation of surface water resources in southern Italy. The concession of water abstraction and use is renewed every year against the payment by the Co.Bo.Ca. of a lump sum of 150,000 €/year to the Ente Irrigazione.
With regard to the Santa Venere diversion, the Co.Bo.Ca. negotiates with the “Consorzio di bonifica Terre D’Apulia”, a WUO of the same hierarchical level, about the amount of water that is abstracted from the Ofanto River, as well as the relative water volume to be diverted from the Sinistra/Destra Ofanto divider to the Destra and Sinistra Ofanto schemes, also allowing a minimum vital base streamflow in the river, in compliance with the current environmental regulations. These water allocations are agreed among the Ente Irrigazione, the WUO CO.Bo.Ca. and the WUO “Terre D’Apulia”, under the overall supervision and approval by the River Basin Authority of the Apulia Region. The latter is the water planning and management authority of the highest hierarchy level in the Apulia Region and is responsible for planning, supervising and monitoring the water allocation and uses among the public and private sectors and among all the water users. The River Basin Authority is also the public legal and administrative body responsible for implementing and enforcing European and national law regulations and directives related to water management in the entire territory of the Apulia Region.
Downstream of the farm delivery points of the distribution networks operated by the Co.Bo.Ca., farmers have full control of the management and use of irrigation water on their fields. As irrigation service receivers, farmers pay the irrigation water to the service provider, i.e. the Co.Bo.Ca., in compliance with the water tariff and the type of service agreed upon. Water fees include the cost of water paid by the Co.Bo.Ca. to the Ente Irrigazione under the existing concession of water abstraction, and all the

Deliverable 2.1 – Value chain mapping Page 35 of 77
additional costs that the WUO incurs during the irrigation season for performing the different functions and processes, such as water abstraction, conveyance, diversion, storage, distribution and final delivery to farmers. In fact, water fees include all the costs of personnel, maintenance of structures, and consumables, but do not include any profit mark-up, provided that the Co.Bo.Ca. is a non-profit organization and operates under the regime of full cost-sharing among the water users.
In performing its functions of water distribution for irrigation purposes, the Co.Bo.Ca. deals with growers, commercial farms, agro-business companies, farmers’ cooperatives and farmers’ unions. These represent the main actors and stakeholders involved in the stages of water use downstream of the farm delivery hydrants.
With regard to the return flows, surface run-off, deep percolation and drainage only occur under inadequate irrigation scheduling and applications, provided that the majority of farmers utilize localized and micro-irrigation methods. Among the natural receptors of the return flows are (i) natural streams, (ii) the Ofanto River and its tributaries, (iii) the natural and man-made drainage networks and sumps, (iv) the downstream wetlands, and (v) the aquifer. All these water bodies are under the responsibility of the River Basin Authority for the aspects related to water use in quantitative terms, and of the Regional Agency for Environmental Protection (ARPA) for the aspects related to water quality and its monitoring. The network of interactions between actors at the different stages of the water supply chain is schematized in Figure 12.
Figure 12: Interactions among actors in the Sinistra Ofanto irrigation scheme

Deliverable 2.1 – Value chain mapping Page 36 of 77
2.7 Preliminary identification of technologies to be assessed
Several innovative technologies are considered to be assessed, in the aim of enhancing the eco-efficiency in the Sinistra Ofanto area with respect to its baseline performance. The objectives of their application at different stages of the water supply chains are to:
a) Reduce resource use; b) Minimize environmental impacts; and c) Maintain or enhance the value added from water use in irrigated agriculture.
In addition, cost-effective solutions and practices need to be considered for improving the following aspects at the system level:
1. Energy efficiency; 2. Irrigation system efficiency, in terms of water distribution to users; 3. Water use efficiency at field level; 4. Efficiency in the application of fertilizers at the field level; and 5. The capability of monitoring the different processes being conducted and
occurring at system level.
Accordingly, the technologies and practices envisaged for eco-efficiency improvement are those belonging to the following categories:
Technologies affecting water management;
Technologies affecting the performance of irrigation delivery; and
Technologies affecting energy consumption.
A list of the innovations, technologies and practices tentatively considered for enhancing eco-efficiency in the Sinistra Ofanto irrigation system is presented in Table 14 along with the level of their application in the system, their actions and main effects.

Deliverable 2.1 – Value chain mapping Page 37 of 77
Table 14: Preliminary list of technologies and practices considered for the Sinistra
Ofanto area
Table 15: Primary and secondary effects of technologies on the agricultural water use
chain and stakeholders’ acceptability
Technology Level of
application Action
Primary effect
Secondary effect
Accepta-bility
Multi-users hydrants
equipped with electronic cards
Farm
Recording water
withdrawn by users
Water saving
Reduction of network
operational cost
To be assessed
Variable speed pumps
District/system
Modulating pumps
frequency and speed to
actual requirements
Energy saving
Reduction of network
operational cost
Medium to High
Shifting irrigation
methods (from sprinkle to mini-
sprinkle and trickle irrigation)
Field/farm
Reduction of consumptive use and of operating pressure
Water and energy saving
Reduction of operational
cost for farm irrigation
To be assessed
Sub-surface drip irrigation,
SDI Field/farm
Increase of WUE and WP
Water and energy saving
Reduction of irrigation
cost
To be assessed
Regulated deficit irrigation,
RDI Field/farm
Increase of WUE and WP
Water and energy saving
Reduction of irrigation
cost
To be assessed
A brief description of these technologies is presented hereafter, along with the indication of their potential effects on eco-efficiency and of the general acceptability by stakeholders and water users. The primary and secondary effects of these technologies on the agricultural water supply chain and the stakeholders’ acceptability is reported in Table 15. However, the list will be finalized after the baseline eco-efficiency assessment and discussions with the local actors / stakeholders.

Deliverable 2.1 – Value chain mapping Page 38 of 77
Multi-users hydrants equipped with electronic cards
These delivery hydrants are provided with an electro-mechanical device enabling the supply of water only to authorized users. The device is powered by a long-lasting lithium battery and consists of both a mechanical and an electronic flow meter, a flow recorder and a fixed electronic memory. The authorized water users are assigned a coded electronic card to access the hydrant, be recognized by the device and withdraw water at their convenience. The device keeps track of all water withdrawals by users and stores the information about irrigation events in the fixed electronic memory. This operational dataset encompasses the timing and duration of irrigations, the hydrants’ opening and shut-off times, and the delivered volumes to all the authorized users, thus enabling the retrieval of operational data by the WUA’s operators at any time by means of portable computers connected with the fix electronic device. The use of this technology allows farmers being billed according to the water volumes actually withdrawn from the network, the implementation of increasing volumetric water fees and an overall considerable water saving, as farmers are encouraged to use water more responsibly and efficiently, in order to keep their water fees as low as possible. In addition, the uptake of this technology avoids conflicts among users of the same hydrant for the attribution of water volumes, thus saving a lot of money and time for conflict resolution. Besides, this technology also enables the accurate monitoring of irrigation systems operation and, through the retrieval and analysis of historical data on water withdrawals, a good understanding of the irrigation management strategies followed by farmers, for the purpose of implementing a service oriented management (S.O.M.) of the irrigation system.
Variable-speed pumps and inverter at lifting plant
These are devices to be installed at the pumping plant to allow matching the pumping plant characteristic curve with the network characteristic curve, i.e. the pumping system providing the discharge and pressure head required by the network. In other words, through this technology, the characteristic curves of the pump can be adapted to the network characteristic curve by equipping the pumping plant with variable speed devices. These devices represent an innovation with respect to the common design criteria, where both the pumping station and the irrigation network are designed and sized to meet the peak irrigation demand. In pipe irrigation systems with demand-type operation, the discharge flowing through the network is highly variable during the season and the peak flow is limited only to a few days. Thus, sizing the pumping plant for a fixed operating set-point to meet the peak demand flow will result in a pumping plant oversized with respect to irrigation demand during most of the irrigation season. In fact, during the off-peak periods, the pressure head required at the network’s inlet is much lower than that provided by the fixed set-point pumping plant.
The use of variable speed devices enables the control of the pump speed and the adjustment of the total dynamic head (TDH) provided by the pump, according to the discharge actually demanded by the users, and thus flowing through the network. The speed regulation device consists of (i) a frequency modulator, named inverter, to

Deliverable 2.1 – Value chain mapping Page 39 of 77
be installed between the electric network and the pump engine, (ii) a flow meter for reading the discharge flowing through the pipe network, and (iii) a small electronic processor (c.p.u.) programmed to adjust the pump frequency according to such discharge. Depending on the layout and configuration of the pipe network, considerable energy savings (20 – 50 %) can be achieved along the irrigation season.
Shifting from sprinkle to mini-sprinkle and from mini-sprinkle to trickle irrigation
Changes in irrigation methods from sprinkle to mini-sprinkle, and from mini-sprinkle to drip irrigation could be implemented at field/farm levels and lead to relevant water and energy savings. Both changes will consistently reduce the consumptive use of water (by 15% and 25%, respectively), as soil wetting, and thus soil evaporation losses, will significantly decrease. In terms of energy, mini-sprinkle and trickle irrigation systems require much lower operating pressures than sprinkle systems (15-20 vs. 25-30 bars).
Sub-surface drip irrigation, SDI
This irrigation method concerns the supply of irrigation water directly to the crop roots by a system of buried plastic driplines with a set of emission points that deliver water underground at a depth where most of the rooting system reside. In this way, the top soil and the canopy are kept dry, thus reducing weed growth, as well as water losses by soil evaporation, surface runoff and deep percolation. The use of this innovative irrigation technique allows significant reductions in the consumptive use, as irrigation water is more efficiently distributed to roots and up-taken by the crop. Consequently, the main effect of this irrigation technique is an increase of water use efficiency (WUE) and of water productivity (WP) with respect to the traditional trickle irrigation.
Regulated deficit irrigation
This innovative irrigation practice focuses on mild to moderate plant water deficits during some specific phenological stages by withholding irrigation or by applying less water than plants would use under normal conditions. This is usually carried out to pursue reduced vegetative growth and to improve qualitative aspects of crop production. Knowledge of crop response to water deficits is necessary under this irrigation practice to identify the most sensitive growth stages to water deficiencies, so as to compile a set of decision-making rules concerning optimal irrigation scheduling and management under limited water supply. As a matter of fact, crop tolerance to water deficits varies considerably by species, cultivars and stage of growth. Several experiences on orchards worldwide have shown that this practice may enable water saving ranging between 15-30%, and thus leading to significant increase both of the WUE of a crop and the WP by reducing or eliminating irrigations that have little impact on yield.

Deliverable 2.1 – Value chain mapping Page 40 of 77
3 Value Chain mapping for Case Study # 2: Monte Novo Irrigation Area, Portugal
3.1 Objectives of the Case Study
Case Study #2 addresses a public irrigation perimeter, the Monte Novo irrigation perimeter, which provides water for irrigation to an area of more than 7,800ha. This perimeter is integrated in the Alqueva Multipurpose Project, an important source of water for several uses, irrigation being the most important, for a total benefited area of more than 115,000ha.
This perimeter only recently began operating (2009) and its current water prices are still subsidized, in order to foment the transition from rainfed agricultural practices to irrigation. Nonetheless, this initial reduction will gradually disappear till 2017, when water will be charged at total water price. Therefore, one of the main objectives of the present Case Study is to characterize eco-efficiency, by means of an indicator approach, regarding farmers already connected to the irrigation system and the evolution of water prices till 2017.
Another main objective of the Case Study is to assess the eco-efficiency improvement of new technologies / innovations with potential application in water and agricultural processes, with regard to specific environmental impacts, relevant costs, and the correspondent added value of implementation. At the end, a comparison between Case Study # 2 and Case Study #1, which also corresponds to a public irrigation perimeter, will be made.
3.2 Overview of the Case Study area / sector
3.2.1 Location
The Monte Novo Irrigation area is located in the Southern region of mainland Portugal, in Alentejo district, near Évora municipality (
Figure 13) and is part of the Alqueva’s multipurpose project (hereafter called Alqueva project), a very important source of water for several uses, irrigation being the most important one. Thus, the Alqueva project, constituted by Alqueva, Pedrógão and a set of other smaller storage reservoirs, with several irrigation perimeters associated, will be capable of supplying water to a total of 115,000ha of arable land (full operation is expected to 2015).

Deliverable 2.1 – Value chain mapping Page 41 of 77
Figure 13: Case Study #2 location - Monte Novo Irrigation Area
The location of the Monte Novo Irrigation Area within the Alqueva project is presented in Figure 14.
Figure 14: Location of the Monte Novo Irrigation Area in thre Alqueva's multipurpose
project (EDIA, 2011)

Deliverable 2.1 – Value chain mapping Page 42 of 77
3.2.2 Climate
The regional climate is typically Mediterranean with two main distinct seasons, a warm dry season (summer) and a cold wet season (winter). During summers, the climate is characterized by weak to moderate wind, high temperatures, high evaporation and low clouds. On the other hand, the precipitation is essentially concentrated in the winter season (EDIA, 2005).
In fact, the average monthly temperature, at annual scale, in the Guadiana river basin area, where Monte Novo is located, ranges from 9.1ºC in January to 24.4ºC in July. On the other hand, the relative air humidity varies from 59.2% to 88.5%, being lower during July and August and higher in December and January; the annual average value is 74.6%. In addition, the temporal distribution of precipitation during the year is very heterogeneous, ranging from almost zero in July and August and about 30% in December and January. In fact, 75% of the annual precipitation occurs in the wet semester (October to March), being the annual average of about 436 mm in dry years, 566 mm in normal years and 729.5 mm in wet years (Figure 15).
Figure 15: Average monthly distribution of precipitation in the Guadiana's river basin
Finally, the average value of the annual potential evapotranspiration is 853.3 mm; the highest monthly values (about 147.2 mm) are observed in July (ARH-Alentejo, 2011).
3.2.3 Geology
On a global perspective, the Monte Novo irrigation area is intersected by a geological linear fault. The southern area of the Monte Novo perimeter (blocks 1.1 and 1.2, see also Figure 20), is crossed by the Tomar-Évora fault (WNW-ESE). Recently, this fault has shown some activity although of low intensity.
The Monte Novo Irrigation area is of great lithological diversity, dominated by outcrop metamorphic rocks, such as schist and mica schist (which are included in the unit's geological formation "Xistos de Moura" and migmatitic gneisses), igneous rocks, such as granites, gabrodiorites, quartzodiorites, eruptive veins and also alluvium and gravel. This area has also an important topographic elevation, named Serra da Espinheira, and is essentially constituted by quartzite rocks, which are more resistant than other surrounding rocks (EDIA, 2005).

Deliverable 2.1 – Value chain mapping Page 43 of 77
3.2.4 Soil
The majority of Monte Novo Irrigation area has a very good aptitude for agriculture. A further significant part of the study area is moderately suited to this purpose, having some limitations, especially at the level of root development, due to (i) poor aeration of the soil, (ii) poor drainage, and (iii) difficult agricultural practices on the preparation of crops. However, the risk of erosion is medium to low.
The predominant soils at the Monte Novo Area are Luvisols and non-Humic Lithic Soil (EDIA, 2005); luvisols constitute of drifts. These soils are also characterized by high clay content, especially in the lower layers of the subsoil, as a result of pedogenetic processes (particularly the translocation of clay) (FAO, 2006). The lithic soils have an affinity with underlying parent rock, which is subjected to intense physical weathering and weak chemical alteration. Thus, the non-Humic Lithic Soils have a mineralogical composition between the granite and quartzodiorite, typical to that of volcanic rocks(ISA, 2008).
3.2.5 Alqueva System
The Alqueva system is expected to foster significant regional development in Alentejo, both in social and economic terms, due to the strategic water reserve created by the Alqueva and Pedrógão reservoirs and the associated hydraulic infrastructures. Thus, the main objective for the management of this important project is to guarantee the necessary and adequate volume and quality of water to the existent water uses, especially irrigation water use. Further objectives include the energy hydropower production, urban water supply, ecological conservation and recreational uses (EDIA, 2011).
According to Figure 14 and Figure 16, the Alqueva dam is the principal hydraulic structure located in the Guadiana River, and generates the largest reservoir in Europe, with a total area of 250 km2 and a capacity of 4.150 hm3 at a maximum water level. This system also depends on the Pedrógão reservoir, located downstream in Guadiana River, which enables pumping water upstream during periods of low energy tariffs, and hence it increases the capacity of energy production and optimizes the management of stored water volumes.

Deliverable 2.1 – Value chain mapping Page 44 of 77
Figure 16: Main storage reservoirs, channels/ ducts and Irrigation areas of Alqueva
project (EDIA, 2011)
In Figure 16, the main agricultural areas served by the Alqueva’s project are identified through their location within the river basin areas of Guadiana and Sado. Figure 16 also enables the distinction among the three (3) main distribution subsystems that constitute the global irrigation network of the Alqueva project; the Alqueva, Ardila and Pedrógão subsystems, and their corresponding irrigation areas.
Focusing on the Alqueva subsystem (Figure 17), where the Monte Novo irrigation area is located, the water volumes are abstracted directly from Alqueva’s reservoir and transported by a network of channels and ducts, passing through different reservoirs (namely Álamos I, II, III and Loureiro). Each subsystem has one specific
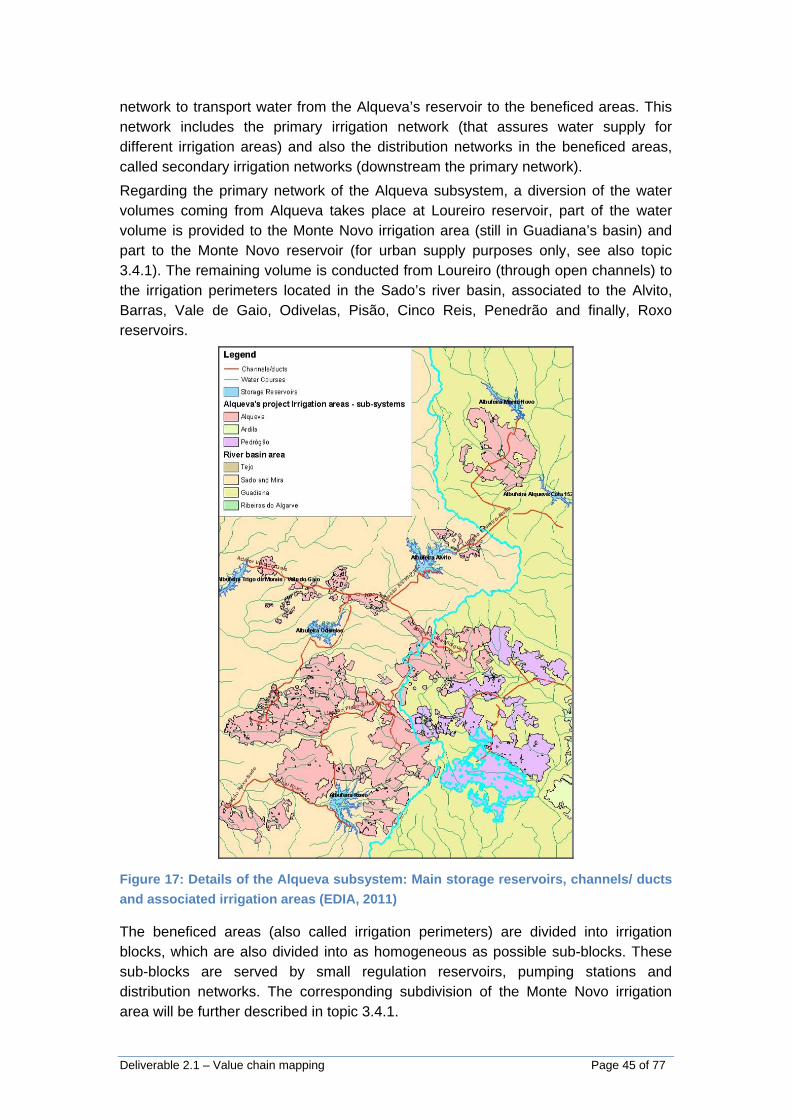
Deliverable 2.1 – Value chain mapping Page 45 of 77
network to transport water from the Alqueva’s reservoir to the beneficed areas. This network includes the primary irrigation network (that assures water supply for different irrigation areas) and also the distribution networks in the beneficed areas, called secondary irrigation networks (downstream the primary network).
Regarding the primary network of the Alqueva subsystem, a diversion of the water volumes coming from Alqueva takes place at Loureiro reservoir, part of the water volume is provided to the Monte Novo irrigation area (still in Guadiana’s basin) and part to the Monte Novo reservoir (for urban supply purposes only, see also topic 3.4.1). The remaining volume is conducted from Loureiro (through open channels) to the irrigation perimeters located in the Sado’s river basin, associated to the Alvito, Barras, Vale de Gaio, Odivelas, Pisão, Cinco Reis, Penedrão and finally, Roxo reservoirs.
Figure 17: Details of the Alqueva subsystem: Main storage reservoirs, channels/ ducts
and associated irrigation areas (EDIA, 2011)
The beneficed areas (also called irrigation perimeters) are divided into irrigation blocks, which are also divided into as homogeneous as possible sub-blocks. These sub-blocks are served by small regulation reservoirs, pumping stations and distribution networks. The corresponding subdivision of the Monte Novo irrigation area will be further described in topic 3.4.1.

Deliverable 2.1 – Value chain mapping Page 46 of 77
Water demand in these areas primarily depends on the decision of the farmers within the beneficed areas, to use or not, water provided by the Alqueva’s project. In addition, water uses for irrigation will depend on future cropping patterns and on irrigation methods, as this project is very recent (as already stated, water supply to the Monte Novo irrigation area started only in 2009, and the infrastructure of some other perimeters are still in progress, for example). Nonetheless, according to the EDIA projections, the global estimation for irrigation water demand in the entire Alqueva project is about 600 hm3/yr; a part of the specific volume is abstracted from the Alqueva reservoir (345.7 hm3/yr) and the remaining volume (244.3 hm3/yr) from the Pedrógão reservoir, downstream.
With regard to urban water supply, the Alqueva project will reinforce availabilities of the existing surface water sources for that water use, namely the Monte Novo, Roxo and Enxoé reservoirs. According to information provided by EDIA, the maximum estimated value is 30 hm3/yr (24.3 hm3/yr from the Alqueva and 5.7 hm3/yr from the Pedrógão reservoir).
In terms of energy production, Alqueva is the most important hydropower plant in the southern region of Portugal and is currently equipped with two reversible groups of vertical axis, with an unitary power of 129.6 MW (EDIA, 2005). Nonetheless, this capacity will be doubled with the reinforcement with two additional reversible groups, each of 130 MW as well. As long as the four (4) production groups are reversible, it is possible to pump upstream, to Alqueva’s reservoir, a significant part of the water stored in the Pedrógão reservoir.
3.2.6 Water Resources
3.2.6.1 Surface Water
The Monte Novo Irrigation Area is located in the Portuguese area of the Guadiana river basin, and specifically in the sub-basin of the Degebe river. The main water course in the study area is the Azambuja stream, which crosses the area in the NW-SE direction (Figure 18).The main tributaries of the Azambuja stream are the Pecena, Peceninha, S. Manços and Quartos streams. In the northern part of the study area, there is an important stream, the Albardão, which is a direct tributary of the Degebe river. Currently, water quality in these water courses is not good enough, due to the Total Suspended Solids parameter. Nonetheless, the water quality requirements for irrigation can be considered as of reasonable quality (EDIA, 2005).

Deliverable 2.1 – Value chain mapping Page 47 of 77
Figure 18: Main water courses in the Monte Novo irrigation area (EDIA, 2011)
3.2.6.2 Groundwater
With regard to groundwater, the Monte Novo Irrigation Area covers virtually one of the sectors of the Évora aquifer. Thus, the North and southeast of the study area (the irrigation blocks 1.1, 3, 4.2 and 4A, see also Figure 20) include the low productive sector of the igneous and metamorphic rocks of the Ossa Morena Zone. This zone is characterized by reduced productivity and an equally low number of abstractions. Nevertheless, the Évora aquifer has a significant importance at the region and the main groundwater abstractions (e.g. wells, boreholes, etc.) in this region are used for agriculture (mainly in the areas outside the Monte Novo perimeter), livestock, domestic supply and public supply of S. Manços (although only two are located in the study area). The water in the Évora aquifer has a satisfactory quality for human consumption, in spite of the high concentrations of nitrate and magnesium.
Moreover, the vulnerability to pollution in the study area can be classified as low to intermediate regarding fertilizers and intermediate regarding pesticides. In the case of fertilizers, the irrigation blocks 1.2 and 2 are of greater vulnerability to pollution (see also Figure 20) (EDIA, 2005).
3.2.7 Fauna and Flora
With regard to ecology, the Monte Novo Irrigation Area represents a habitat for many flora and fauna species. Specifically, 186 species of plants were identified and several species of animals inventoried in this areas; the latter include 18 fishes, 13 amphibians, 20 reptiles, 174 birds and 42 mammals, which correspond to a set of relatively rich and diverse species. Several of these plants and animals are rare and protected by European directives and national laws (EDIA, 2005).

Deliverable 2.1 – Value chain mapping Page 48 of 77
3.2.8 Socio-economic context
In the Case Study area, as well as in the entire Guadiana River Basin, the population density is very low (about 18 inhab/km2); the country average is 111 inhab/km2. In fact, the population of the region is being been decreasing since 1991, at least, at an average annual rate of 0.64 %, for the period 2001-2008. The population is typically ageing (172 people of 65 or more per 100 people of less than 16), the level of education is very low and the majority of the population is inactive (57%), the retired people being the more relevant (corresponding to 53%) (ARH-Alentejo, 2011).
With regard to the socioeconomic dynamics and structure, the Guadiana river basin is a region with traditionally low income. In 2008, the average income per capita was only 5,700 €, which is less than the country average (7,200 €). Nonetheless, the Gross Value Added (GVA) of the region is much higher, as reflected by the higher values of the Gross Domestic Product (GDP) per capita of the region. This also indicates that the distribution of income for regions outside Guadiana’s river basin is very important (ARH-Alentejo, 2011).
The tertiary sector is dominant in the Guadiana region, as it concentrates 67% of employment and 76% of GVA; the most important sources of local employment are the (i) touristic accommodation, (ii) catering, and (iii) public services. Nonetheless, the agricultural sector assumes a significant importance as well, representing 10% of the GVA of the region and about 15% of the number of jobs. The area of the farms is quite large (55,5 ha in average) and the number of livestock effectives is higher than that of the national average. These characteristics, associated with the high proportion of farmers with company structure, indicate the high potential of the area to develop agricultural activities, especially with the full operation of the Alqueva project. Currently, however, the agricultural activities in the region have a very low competitiveness, with reduced productivity by unit of area, and incomes are greatly supported by public support, like subsidies (about 65% of the total gross margin) (ARH-Alentejo, 2011).
The Monte Novo Irrigation area includes five parishes, i.e. the (i) Nossa Senhora de Machede, (ii) S. Manços, (iii) S. Vicente do Pigeiro, (iv) Torre de Coelheiros, and (v) Monte do Trigo. The construction of the Monte Novo Irrigation area worried the resident population, due to all the construction activity, the process for land expropriation and the criteria followed for compensation. Nevertheless, the investment performed on this area is expected to result in significant advantages, especially with regard to the expected increase of land prices, the population increase and the improvement of the employment structure (EDIA, 2005).
3.3 Methodology
The methodology followed for the development of Case Study # 2, till now, was based on the following steps: (i) characterization of the Case Study regarding the specificities of the water system and of the irrigation area, (ii) identification and contact with the main actors involved in the water distribution and use for irrigation, (iii) preliminary collection of data, (iv) selection of potential eco-efficiency indicators, and (v) preliminary identification of the technologies to be assessed.

Deliverable 2.1 – Value chain mapping Page 49 of 77
3.4 Mapping of the water service system
3.4.1 System boundaries
For the definition of system boundaries, it is necessary to analyze the characteristics of the system that supplies water for irrigation in Case Study # 2.
As previously metioned, the water used in the Monte Novo irrigation perimeter is provided by EDIA (the entity responsible for the Alqueva project development and exploitation, see also section 3.6). Water is abstracted from the Alqueva reservoir and transported through a network of canals and ducts, that can be divided into primary network and secondary network, to farmers, through hydrants (Figure 19).
Therefore, for the definition of the spatial and temporal system boundaries, with regard to the overall characteristics of the Monte Novo irrigation perimeter, is presented below:
Spatially, the evaluation will focus on the entire water supply chain for crop irrigation, from the main water source (Alqueva reservoir) to disposal (groundwater recharge and surface runoff), after use in the area of the Monte Novo perimeter. It will include the water abstraction from the Alqueva Reservoir and transport to the Monte Novo irrigation area (primary network), the network for distribution of water inside the benefited area, attending to the different characteristics of the sub-blocks (secondary network), and also the use of water inside farms for crops irrigation.
Temporally, the evaluation will be focused on the annual scale, since the time period necessary for crop production. With regard to data availability, it must be highlighted that the Monte Novo perimeter started operation in 2009.
Figure 19: Overall map of the water system and definition of the spatial system
boundaries (EDIA, 2011)
Primary network
Secondary network (Irrigation area)
Alqueva reservoir

Deliverable 2.1 – Value chain mapping Page 50 of 77
3.4.2 Mapping of the water service system and description of stages
The primary network starts in the pumping station located in the Alqueva reservoir, that elevates water to the Álamos III small reservoir. The network continues through the canals that transport water, by gravity, to the Loureiro reservoir, passing also by the regulatory Álamos II and I reservoirs, in between. The network ends after the diversion in the Loureiro reservoir, with the canals that transport water from Loureiro to the regulating reservoirs R1 to R4, within the Monte Novo irrigation area (see also Figure 14, p. 41, Figure 17, p. 45 and Figure 19, p. 49).
The secondary pipe network allows water distribution (under pressure) inside the Monte Novo irrigation perimeter (Figure 20). The secondary irrigation distribution network, inside Monte Novo irrigation area, includes:
Five (5) regulation reservoirs (R1, R2, R3, R4 and R4.1);
Five (5) pumping stations (EE1, EE2, EE4, EE4.1 and EE4.A); and
A distribution irrigation network, roads and a drainage network.
This area is subdivided into four (4) irrigation blocks (Table 16); blocks 1 and 4 are subsequently subdivided into 2 and 3 irrigation sub-blocks, respectively (Figure 21).

Deliverable 2.1 – Value chain mapping Page 51 of 77
Figure 20: Details of the Monte Irrigation Area: location of the main irrigation blocks,
reservoirs and channels/ ducts (EDIA, 2011)
Table 16: Division of the Monte Novo irrigation perimeter in irrigation blocks
Irrigation Blocks Area (ha) Block 1.1 2.311 Block 1.2 630 Block 2 1.020 Block 3 1.288
Block 4.1 517 Block 4.2 781 Block 4.A 1.275
Total 7.822
R1
R2
R3
R4 R4.1
EE1
EE2
EE4.A
EE4.1 EE4
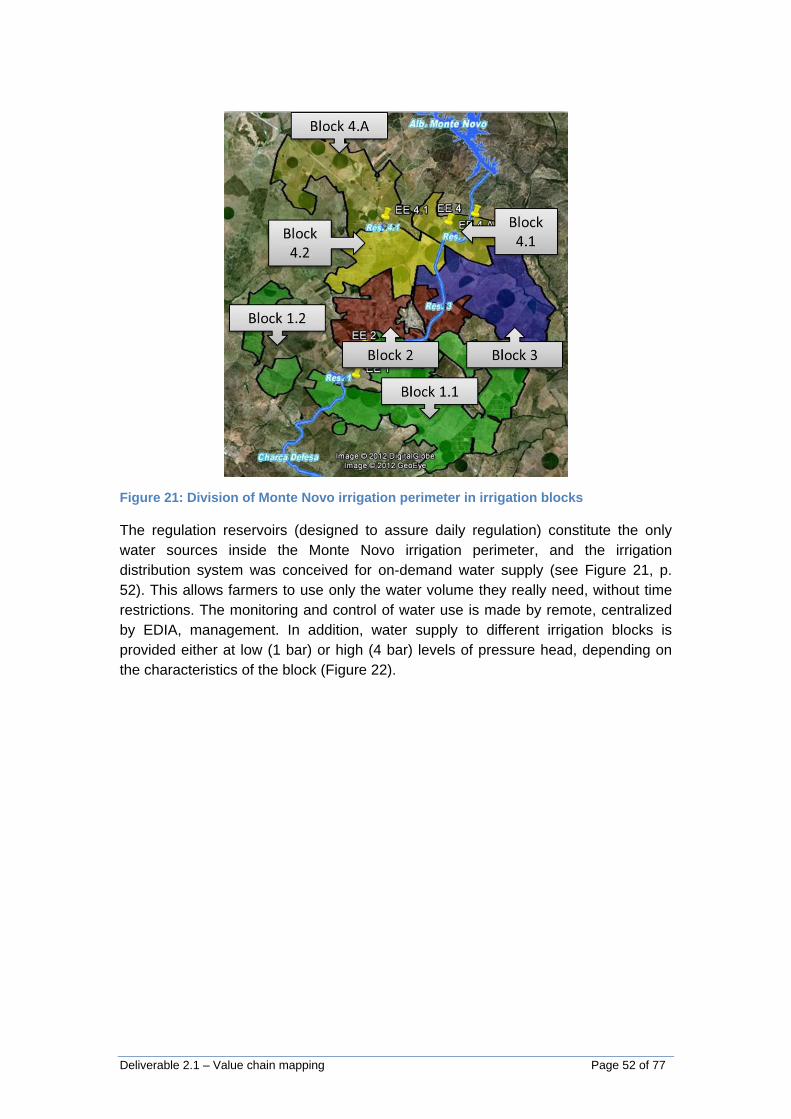
Deliverable 2.1 – Value chain mapping Page 52 of 77
Figure 21: Division of Monte Novo irrigation perimeter in irrigation blocks
The regulation reservoirs (designed to assure daily regulation) constitute the only water sources inside the Monte Novo irrigation perimeter, and the irrigation distribution system was conceived for on-demand water supply (see Figure 21, p. 52). This allows farmers to use only the water volume they really need, without time restrictions. The monitoring and control of water use is made by remote, centralized by EDIA, management. In addition, water supply to different irrigation blocks is provided either at low (1 bar) or high (4 bar) levels of pressure head, depending on the characteristics of the block (Figure 22).

Deliverable 2.1 – Value chain mapping Page 53 of 77
Figure 22: Identification of low pressure and high pressure areas
Blocks 1.1, 3 and 4.2 are considered as low pressure areas (approximately 1 bar of pressure head at the hydrants), as the areas of the existing farms in the corresponding sub-blocks are larger and it is assumed that the necessary head to guarantee irrigation inside farms is farmers’ responsibility (water tariffs for low pressure areas are lower, see also section 3.5.2). The water supply for these low pressure sub-blocks (1.1, 3 and 4.2) is provided by gravity, without need of any elevation.
On the other hand, the high pressure sub-blocks (1.2, 2, 4.1 and 4.a) are served by the pumping stations EE1, EE2, EE4 and EE4.1, respectively, as these areas include small to medium sized properties. In these areas, pressure head is higher (about 4 bar), reducing the needs for farmers to invest in their own pumping stations. Nonetheless, the corresponding water tariffs are higher (see also section 3.5.2).
At the end of the Monte Novo irrigation area, there is also one pipeline that links the reservoir R4 to the Monte Novo reservoir, water is elevated by the pumping station EE 4, which is used only for urban water supply purposes. Therefore, the specific link to Monte Novo is outside the system boundaries of Case Study #2.
The evolution of the irrigated areas is shown in Figure 23. It must be noted that 50% of the benefited area had already been irrigated by 2011, although operations started only in 2009; this value is expected to raise to 58% in 2012.

Deliverable 2.1 – Value chain mapping Page 54 of 77
Figure 23: Evolution of the irrigated areas compared to the total area beneficed in the
Monte Novo irrigation perimeter (EDIA, 2012)
According to Table 17, which illustrates the registered area, per year, in each block. it can be verified that blocks 1.1, 3 and 4.A are those with the largest irrigated area. Among them, block 1.1 has the largest area from all the low pressure blocks, whereas 4.A from all the high pressure blocks. On the other hand, blocks 1.2, 2 and 4.1 are the blocks with the smallest irrigated area.
Table 17: Evolution of the registered area, per year, per block (EDIA, 2012)
Monte Novo
Blocks (pressure head)
2009 2010 2011
ha % of block area
ha % of block area
ha % of block area
Registered area/ year
(ha)
Block 1.1 Low 786 34% 924 40% 1132 49%
Block 1.2 High 69 11% 50 8% 57 9%
Block 2 High 296 29% 224 22% 306 30%
Block 3 Low 386 30% 773 60% 786 61%
Block 4.1 High 222 43% 310 60% 290 56%
Block 4.2 Low 336 43% 336 43% 562 72%
Block 4.a High 561 44% 548 43% 778 61%
TOTAL 2,656 34% 3,165 40% 3,911 50%
Moreover, the evolution of the overall cropping pattern in the 3 years that the Monte Novo perimeter operates (from 2009 to 2011) is illustrated in Table 18. Focusing on 2011, it is possible to conclude that the most significant crops in the Monte Novo area are Olive and Maize, representing about 67% of the irrigated area in the Monte Novo perimeter.

Deliverable 2.1 – Value chain mapping Page 55 of 77
Table 18: Crop pattern evolution in Monte Novo irrigation area (EDIA, 2012)
Crop patterns (ha) 2009 2010 2011
ha % ha % ha %
Arable Crops 506 19.5 545 17.7 617 16.2
Horticultures 178 6.9 200 6.5 368 9.7
Maize 643 24.9 507 16.4 877 23.0
Olive 1,125 43.5 1,680 54.4 1,681 44.1
Others 18 0.7 7 0.2 6,5 0.2
Vineyards 117 4.5 148 4.8 259 6.8
Total 2,587 100 3,087 100 3,808.5 100
In terms of water volumes, it is also possible to verify that the larger the irrigated area, the higher the water consumption. Specifically, block 1.1 is that with the highest water consumption (corresponding to the largest irrigated area, whereas blocks 1.2 and 2 are those with the least water consumption (corresponding to the smallest irrigated area). Blocks 3, 4.1, 4.2 and 4.A have similar water consumption along the year (Table 19).
Table 19: Evolution of water consumption, per block, per year (EDIA, 2012)
Monte Novo
Blocks (pressure
head)
2009 2010 2011
m3/y % m3/y % m3/y %
Water cons
(m3/year)
Block 1.1
Low 3,744,831 32.3 3,236,367 39.4 3,668,936 30.5
Block 1.2
High 201,200 1.7 71,300 0.9 265,027 2.2
Block 2
High 1,388,165 12.0 505,213 6.2 911,993 7.6
Block 3
Low 2,247,097 19.4 1,553,464 18.9 1,643,176 13.6
Block 4.1
High 1,394,034 12.0 1,299,324 15.8 2,002,943 16.6
Block 4.2
Low 1,162,790 10.0 637,402 7.8 1,535,841 12.7
Block 4.a
High 1,440,882 12.4 909,754 11.1 2,017,981 16.8
TOTAL 11,578,999 100 8,212,824 100 12,045,897 100
Based on the above characteristics, it can be concluded that the assessment of the Monte Novo irrigation area should focus on, at least, two sub-blocks i.e. one of low pressure head and one of high pressure head, in order for the results to be representative of the whole area. In addition, the main crops to be assessed should be, at least, Olive and Maize, which represented about 67% of the total irrigated area in 2011.
Consequently, the eco-efficiency performance of the sub-blocks 1.1 and 4.A, within Monte Novo perimeter, will be analysed as representative of the low pressure (gravity) and the high pressure (elevation), respectively. These two sub-blocks represented almost 50% of the irrigated area in 2011 and consumed 50% of the total water volume used. With regard to the representativeness of the irrigated farms within the referred sub-blocks, two main farmers of the region will be considered, i.e.

Deliverable 2.1 – Value chain mapping Page 56 of 77
Fundação Eugénio de Almeida and Olivais do Sul (see also topics 3.4.4, p. 57 and 3.6, p. 68), with irrigated areas in blocks 1.1 and 4.A, respectively.
Nonetheless, it shall be noticed that the possibility to increase the representativeness of the irrigated areas (i) through the inclusion of arable crops’ evaluation (16% of total irrigated area), represented by permanent pastures (for livestock production), and (ii) in terms of irrigated areas, through the extension of the assessment to sub-block 3 (accounting for more than 20% of the irrigated area and about 14% of the total water consumption in 2011) was also considered. A third alternative concerns the extension of the number of farmers to be accounted for, in order to assess and validate input values for the calculation of the overall added value of the Monte Novo irrigation areas (production costs, productivity, water consumption, energy consumption, etc.) and of the corresponding environmental impacts. Each of these three (3) possibilities will be assessed after the detailed data collection.
3.4.3 Process map description
Figure 24 presents the main stages of the water system, using a water supply chain as an auxiliary for mapping the water system serving the area of Monte Novo irrigation perimeter.
Figure 24: The water supply chain of the Monte Novo irrigation perimeter
Despite the complexity of the water supply chain, the main stages of the system are described in Table 20, following the description of the previous topics. Table 20 provides further information on the correspondence with the different parts of the water system and with the nodes of the water supply chain.

Deliverable 2.1 – Value chain mapping Page 57 of 77
Table 20: Relation between the different parts of the water system, the corresponding
stages and the nodes of the water supply chain
Part of the Water System
Stages Nodes
Primary network
Water abstraction (in Alqueva) and elevation
Alqueva dam, Alqueva pumping system
Water transport Conveyance canal/ duct I,
Loureiro reservoir and Conveyance canal/ duct II
Secondary network
Regulating storage Reservoirs R1, R2, R3, R4, R4.1
Elevation EE1, EE2, EE3, EE4, EE4.1
pumping stations
Water distribution Block 1, 2, 3, 4.1, 4.2 and 4.A,
Distribution networks
Users Water use Irrigated Farms
Disposal Residual water after
irrigation use Soil, Groundwater (infiltration),
Water courses (drainage)
Nonetheless, focusing on the system boundaries defined in section 3.4.1 (p. 49), i.e. blocks 1.1 and 4.A, which are considered as representative of the system, the water supply chain can be simplified as presented in Figure 25, maintaining the main stages described in Table 20.
Figure 25: The water supply chain to be considered in Case Study # 2 for irrigation
water use
3.4.4 Description of existing technologies
This section focuses on the main technologies involved in each stage of the water system.
Primary network
The main characteristics of the Alqueva pumping station, which ensures water abstraction and lifting from the Alqueva reservoir to the Álamos III small reservoir, not individually represented in the water supply chain, are presented in Table 21.
Table 21: Characteristics of the Alqueva pumping station (EDIA, 2012)
Number of groups 2 groups with parallel ducts (6,244 kW each)
Operating point Q = 6.88 m3/s; H = 85.85m (each)
Energy consumption 0.28 kWh/m3
From this pumping station, a set of conveyance canals and ducts (passing through Álamos II and Álamos I small reservoirs, also not individually represented in the

Deliverable 2.1 – Value chain mapping Page 58 of 77
water supply chain), transport water by gravity to the regulating reservoirs R1, R2, R3 and R4.The corresponding water losses (by evaporation and infiltration) in this open channel transport are estimated to about 11.5 % of the total water volume (13,723,168 m3 in 2011) transported to the Monte Novo perimeter (92% from January to September and 8% from October to December).
Secondary network
The secondary network starts from the regulating reservoirs R1, R2, R3, R4 and R4.1; the corresponding capacity of each reservoir is described in Table 22.
Table 22: Capacity of the regulating reservoirs of the secondary distribution network
(EDIA, 2012)
Regulating reservoirs Capacity (m3)
R1 103,000
R2 32,000
R3 63,000
R4 100,000
R4.1 60,000
As already described, water elevation by pumping stations exists mainly to assure high pressure (4 bar) for block 1.2 (EE1 pumping station), block 2 (EE2 pumping station), block 4.1 (EE4 pumping station) and 4.A (EE4.1 pumping station). Nonetheless, it must be also highlighted that the EE4.A pumping station, which elevates water from the reservoir R4 to the Monte Novo reservoir, is used only for domestic water supply purposes (not to be taken into account in the present study). The characteristics of each of the referred pumping stations are presented in Table 23.
Table 23: Characteristics of the main pumping stations within the Monte Novo
irrigation area (EDIA, 2012)
Pumping stations EE 1 EE 2 EE 4 EE 4.1
Block 1.2 Block 2 Block 4.1 Block 4.A
Number of auxiliary groups 2 3 2 ---
Number of main groups (with VFD) 5 5 5 6
Elevation head (m) 75 52 70 82
Unitary power (Kw) 200 250 210 250
Unitary flow rate (m3/h) 828 1,500 760 950
Total flow rate (m3/h) 3,000 6,200 2,300 5,900
Unitary energy rate (kWh/m3) 0.24 0.17 0.28 0.26
According to information provided by EDIA, water losses in the secondary distribution network are between 0.5% and 1% of the total water volume provided to farmers (12,045,897 m3 in 2011, see also Table 19).
In addition, the study will only focus on the reservoirs R1 (block 1.1), R4 and R4.1 (block 4.A) and the pumping station EE4.1 (block 4.A), as these correspond to the representative blocks to be analysed, i.e. block 1.1 (low pressure) and block 4.A (high pressure).
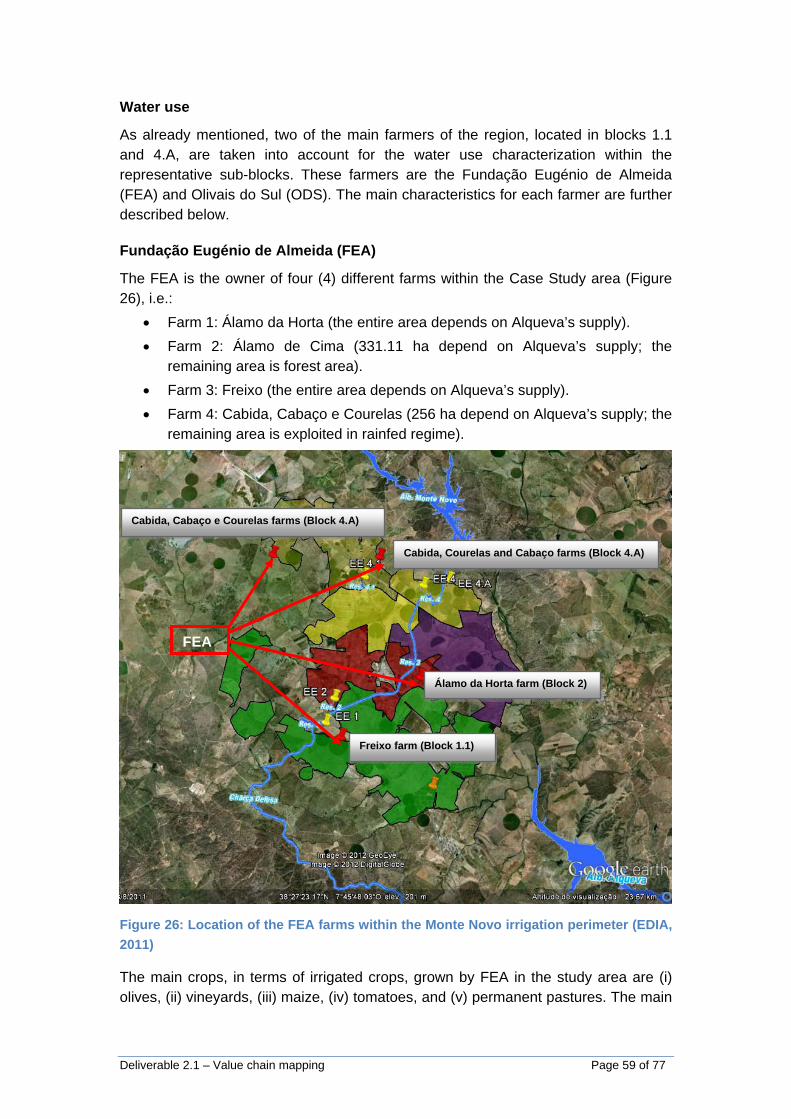
Deliverable 2.1 – Value chain mapping Page 59 of 77
Water use
As already mentioned, two of the main farmers of the region, located in blocks 1.1 and 4.A, are taken into account for the water use characterization within the representative sub-blocks. These farmers are the Fundação Eugénio de Almeida (FEA) and Olivais do Sul (ODS). The main characteristics for each farmer are further described below.
Fundação Eugénio de Almeida (FEA)
The FEA is the owner of four (4) different farms within the Case Study area (Figure 26), i.e.:
Farm 1: Álamo da Horta (the entire area depends on Alqueva’s supply).
Farm 2: Álamo de Cima (331.11 ha depend on Alqueva’s supply; the remaining area is forest area).
Farm 3: Freixo (the entire area depends on Alqueva’s supply).
Farm 4: Cabida, Cabaço e Courelas (256 ha depend on Alqueva’s supply; the remaining area is exploited in rainfed regime).
Figure 26: Location of the FEA farms within the Monte Novo irrigation perimeter (EDIA,
2011)
The main crops, in terms of irrigated crops, grown by FEA in the study area are (i) olives, (ii) vineyards, (iii) maize, (iv) tomatoes, and (v) permanent pastures. The main
Cabida, Cabaço e Courelas farms (Block 4.A)
Cabida, Courelas and Cabaço farms (Block 4.A)
Álamo da Horta farm (Block 2)
Freixo farm (Block 1.1)
FEA

Deliverable 2.1 – Value chain mapping Page 60 of 77
rainfed crops are (i) oat, (ii) triticale, and (iii) natural pastures. The cropping patterns of the four (4) FEA farms are presented in Table 24.
Table 24: Cropping patterns of different farms belonging to FEA (FEA, 2012)
Crops – Areas (ha)
Farm 1 – Álamo da
Horta
Farm 2 – Álamo de
Cima
Farm 3 - Freixo
Farm 4 – Cabida, Cabaços e Courelas
Total
Olive 64.87 252.65 - - 317.52
Vineyard 35.89 78.46 - - 114.35
Tomato - - 212.192 - 212.192
Permanent pastures
- - 112.59 - 112.59
Maize - - 110.1 152.36 262.46
Poppy - - 14 14
Triticale - - 49.774 - 49.774
Oat - - - 81.24 81.24
Natural pastures - - 67.924 439.6 507.524
Eucalipts - 208.07 - - 208.07
Total 100.76 539.18 552.58 687.2 1,879.72
In terms of livestock, the FEA raises a specific type of bovine cattle, named Raça Alentejana, with an effective of about 677 livestock equivalents. The livestock production takes place in Farms 3 and 4 (Freixo and Cabida, Cabaços e Courelas, respectively).
The fertilizers used in the FEA farms are:
Maize - Liquid fertilizer: “Tecniferti Humifosfato 10”; “Tecniferti Nitromagnésio”; “Tradecopr Mn”; “Topman” fertilizer; and
Olive - Liquid fertilizer: 12.4.6; “TovGat 8.4.10”; Urea 46%, monoammonium phosphate; Potassium nitrate granules.
In addition, some plant protection products are used. These are:
Maize: Karate + Nicoter; “Primextra Gold Tz”; “Callisto”; “Ubyfol Zn”; and
Olive: “Fuego Product”; “Roundup Supra”; “Dimetex”; “Folicur”; “Perfekthion”; Cobre 50 Selectis; Decis; Cuprital; Tamahawk; Dafenil Progress.
In terms of water consumption, the main available data, which correspond to annual water needs for each type of crop, are:
Farm 1
o Vineyards (35.89 ha): 500 m3/ha;
o Olive (64.87 ha): 300 m3/ha.
Farm 2
o Olive (132.49 ha): 2.000 m3/ha;
o Vineyard (67.7 ha): 500 m3/ha;
o Olive (120.16 ha): 600 m3/ha.

Deliverable 2.1 – Value chain mapping Page 61 of 77
Farm 3
• Maize (30.68 ha), Tomato (212.19 ha): 6,500 m3/ha;
• Maize (79.42 ha), Permanent pastures (43.25 ha): 5,500 m3/ha;
• Permanent pastures (69.34 ha): 10,000 m3/ha.
Farm 4
• Maize (106.19 ha), Poppy (14.0 ha): 6,500 m3/ha.
Table 25 presents the sum per farm of the abovementioned water needs for 2011. It should be noted that the FEA total water consumption in different farms corresponds to about 1/3 of the total water supply in the Monte Novo irrigation area. Water prices are described in section 3.5.2, as the water source is the Alqueva system.
Table 25: FEA water consumption (m3/y) per farm (FEA, 2012)
Irrigation Block Farm Water volume (m3/y)
Block 1.1 (low pressure) Freixo 2,946,740
Block 2 (high pressure) Álamo da Horta 37,406
Block 4.A (high pressure) Álamo de Cima 370,926
Cabida, Cabaço e Courelas 781,235
Total 4,136,307
With regard to the quality of the water volume supplied by EDIA (from the Alqueva project), FEA provided information for 2009 (Farm 1) and 2010 (Farm 2). The corresponding analyses show that water quality is in accordance with the limits defined and recommended by the Portuguese legislation (Decree-Law 236/98 of 1st of August).
In terms of soil quality, analyses for 2008 (Farm 2) and 2010 (Farm 1) were available. The results showed that soil quality is generally acceptable; some parameters, however, exceeded the recommended values (the pH or the carbon/nitrogen relation).
In terms of costs for energy consumption, the available data are:
Maize: 150 €/ha
Olive: 45.6 €/ha
The total area of the FEA farms that can be supplied with water from the Alqueva project is about 1,500 ha; currently, about 973 ha (65%) are being supplied.
Olivais do Sul (ODS)
The ODS stakeholder owns a total of 600 ha of irrigated areas; only 260 ha are within the area of analysis (Azambuja farm, Figure 27). The main crop explored in the ODS farms is Olive, both for table olives and olive oil production.

Deliverable 2.1 – Value chain mapping Page 62 of 77
Figure 27: Location of the ODS farm within the Monte Novo irrigation perimeter (EDIA,
2011)
In terms of productive methods, ODS uses both intensive and super-intensive regime for Olives production. ODS also produces different types of Olives (Arbequina in the super-intensive regime and Cobrançosa/Picual in the intensive regime), as the mixture of these varieties contributes to a more stable duration and quality of the resulting olive oil. In both cases, the layout of the olive trees was defined according to operational aspects, namely the optimization of the mechanical harvesting and the reduction of costs.
Moreover, ODS uses advanced monitoring methods to optimize the use of resources, i.e. GPS and automatic drip irrigation, to adjust the water supplied to the olive trees, according to the corresponding needs.
ODS uses fertilizers like:
Solid Fertilizer: NITROLUSAL 27%;
Soluble solid fertilizer: 15.5.30; and
Liquid fertilizer: 12.5.6; 4.8.12.
However, ODS fosters the minimized use of fertilizers, keeping natural vegetation cover and the residuals of pruning activities, in order to increase the organic matter at surface.
Azambuja farm (Block 1.1) ODS

Deliverable 2.1 – Value chain mapping Page 63 of 77
As ODS is operating only since 2010, they do not have a detailed dataset on water consumption yet. Nevertheless, there are some data that can be provided by EDIA, as the origin of the water used in the ODS areas is the Alqueva’s project as well. According to this, the water price for ODS is also given by the water prices described in section 3.5.2 (p. 65). According to an overall estimation, the total costs of water in 2011 were about 14,000 € (which, according to EDIA water prices in 2011 and the irrigated area of 260 ha, corresponds to about 2,650 m3/ha), and are expected to increase to 15,000 € in 2012.
Information regarding water and soil quality for the area within the Monte Novo irrigation perimeter was provided by ODS for 2010. In terms of water quality (referring to the water supplied by EDIA – Alqueva project), all parameters are in accordance with the legal limits imposed. In terms of soil quality, three (3) different types of soil exist. Recommendations made concern both the reduction of the high values (e.g. pH or magnesium) and the increase of some parameters (e.g. potassium, calcium, zinc, etc.), in order to enhance the production values and the quality of the olives produced.
With regard to the energy costs, the information currently available regards only 2011 and corresponds to 32,000 € for the entire year and for the area of 260 ha.
The ODS areas within the Monte Novo irrigation perimeter are already fully supplied by the Alqueva project.
3.5 Selection of eco-efficiency indicators
3.5.1 Environmental impacts
Table 26 presents a preliminary list of the resource inputs and the corresponding potential environmental impacts for each stage/ node of the system.

Deliverable 2.1 – Value chain mapping Page 64 of 77
Table 26: Resource inputs and potential environmental impacts for each stage of the
water supply chain
Part of Water System Nodes Resource Inputs Environmental
impacts
Primary network
Alqueva dam, Alqueva pumping system
Energy (kWh) GHG emissions
Conveyance canal/ duct I, Loureiro reservoir and Conveyance canal/ duct
II
Water losses (m3) -
Secondary network
Reservoirs R1, R2, R3, R4, R4.1
Water losses (m3) -
EE1, EE2, EE3, EE4, EE4.1 pumping stations
Energy (kWh) GHG emissions
Block 1, 2, 3, 4.1, 4.2 and 4.A, Distribution
networks Water losses (m3) -
Users Irrigated Farms Water use (m3)
GHG emissions, soil erosion, loss of natural vegetation,
loss of wildlife corridor
Disposal Soil, Groundwater (infiltration), Water courses (drainage)
- Soils and/or Water pollution, Loss of
biodiversity
With regard to the environmental impacts identified, a preliminary list of indicator parameters to be considered in Case Study #2, and their corresponding classification in terms of indicator importance is presented in Table 27. Nonetheless, the list is preliminary and will be further detailed and adapted in the following stages of Case Study #2 development.
With regard to the quality of the resources used, water quality depends on the operation of the entire system, as the Monte Novo irrigation area is included in the drainage basin of the Alqueva reservoir (the water source of the system). Focusing on soil quality, the degradation in the irrigated areas depends on the use of fertilizers and pesticides. Therefore, these impacts will be accounted for in the assessment of the environmental impacts and the definition of the indicator parameters. Nonetheless, several other sources of pollution exist, especially in what regards the water coming from the Alqueva reservoir. Consequently, this topic will be further examined and analyzed in the future steps of the Case Study development.

Deliverable 2.1 – Value chain mapping Page 65 of 77
Table 27: Preliminary list of Environmental impact indicator parameters
Indicator Theme
Importance Water supply chain stage
Possible indicator parameters
Climate change &
global warming
Possibly important
Primary / secondary network,
water use
CO2 emissions to air, CH4, CFC, N2O, Chloride
Water quality Important
Primary / secondary network,
Water use, Disposal
NO3, NH4, N total, PO4, P total, BOD, COD, Total Pesticides, TSS,
Microorganisms
Water quantity Important
Primary / secondary network,
Water use, Disposal
Total volume per year, abstracted water, used water per ha,
leakages, evaporation/ evapotranspiration, infiltration
Biodiversity Possibly important
Water use, disposal Habitat variety, inventory flora variety, inventory fauna variety
Resource use Important
Primary / secondary network,
water use
Surface water, energy/ electricity, fertilizers, pesticides, land use, soil
Waste Possibly Important
Water use, disposal Sludge (olive oil production), used sludge – fertilizers, used sludge-
other
3.5.2 Economic costs and benefits
With regard to the economic costs and benefits for the system, the main topics to be considered are described below, and the corresponding values are summarized in Table 28 for the different stages of the value chain.
Primary and secondary networks
In the primary network, the main benefits result from the water supply tariffs, whereas the main economic costs are the energy costs for the elevation of the water volumes from the Alqueva reservoir to the Álamos reservoirs (Alqueva pumping station). Nonetheless, other costs, such as maintenance and operating costs, financial costs of investment, costs of human resources and management costs, shall also be included, in spite of not being currently available.
Similarly, in the secondary network, the main benefits are attained through the respective water tariffs. Except of the costs already stated for the primary network, the costs of buying water from the primary network must also be taken into account, as the secondary network distributes water provided by the primary network. Further significant costs, although not currently available, are those related to the energy consumption in the high pressure sub-blocks.
The water tariffs of the water system are already established (by law, Order 9000/2010 of 26th May) for the primary and secondary networks, according to the pressure head of water delivery (low or high). However, the tariffs are being reduced

Deliverable 2.1 – Value chain mapping Page 66 of 77
during the 2010-2017 transitional period, in order to foster the development of irrigation schemes within the benefited area.
Water use
Focusing on the water use stage, the main benefits are obtained from the transaction of the agricultural products, whereas for quantification of the economic costs, several factors involved in that production must be assessed. As previously mentioned, the eco-efficiency assessment of the Monte Novo irrigation area will focus only on the production of Olive and Maize crops, as they are considered as representative of the existing agricultural economic activities. These crops have different characteristics, and hence the benefits and economic costs of the water use stage must be calculated according to each type of crop. Subsequently, the results will correspond to the sum of the incomes and costs associated with the production of each type of crop in the irrigation area.
The benefits can be quantified through the selling prices of the final products, accounting for the 2011 average values of the different crops. To quantify the values related to the production costs of the two aforementioned crop types (olive and maize), the required information was retrieved from the representative farmers collaborating with EcoWater, i.e. the FEA and ODS farmers. In addition, the distinction between low pressure and high pressure head of water delivery according to the location of farms was also taken into consideration for the quantification of the water costs.
The main costs to be taken into consideration for both types of crops are related to labor and equipment, fertilizers and pesticides, energy use, water consumption and other costs, such as external services and insurances. Focusing on each crop type, further costs to be taken into account include the pruning and olive picking for olive production, and the seed and mowing for maize production. The respective economic costs and benefits are further specified in Table 28.
However, ODS produces only olives, whereas FEA both olives and maize. Thus, the possibility to include another Maize producer is being investigated, so as to obtain complementary data. In addition, FEA produces olives in an intensive production method, whereas ODS in a mixture of intensive and super-intensive production method. Thus, the requirements per ha, in terms of labor, fertilizers and pesticides, and water consumption, are different. Water costs and energy usage per ha are also quite different for the two farmers, as the olive productive area of FEA is located in a high pressure sub-block area (Sub-block 4.A), whereas the corresponding ODS farm in a low pressure sub-block area (Sub-block 1.1). With regard to these differences, the possibility to include other olive producers in the analysis is also being considered, in order to validate the values of production costs. Finally, the importance of the irrigated pastures, for cattle breeding, is considerable, and hence the possibility to account for this crop type in the analysis is being investigated as well.

Deliverable 2.1 – Value chain mapping Page 67 of 77
Table 28: Summary of the economic benefits and costs for the water system
Description of the economic costs and
benefits of the system
Costs Benefits Unit
Primary network Water tariffs (defined by law)
- 2010: 0.0126 2017: 0.0420
€/m3
Energy costs 0.0371 - €/kWh Other (financial costs of investment, Human resources, Management costs, Maintenance costs)
(To be assessed) - €/m3
Secondary network
Water tariffs (defined by law)
-
2010 0.0149 (low pressure) 0.0232 (high pressure) 2017 0.0530 (low pressure) 0.0890 (high pressure)
€/m3
Water costs (primary network)
2010: 0.0126 2017: 0.0420
- €/m3
Energy costs 0.0371 - €/kWh Other (financial costs of investment, Human resources, Management costs, Maintenance costs)
(To be assessed) - €/m3
Water use
Income - Olive: 234 Maize (grain): 220
€/ton
Water costs (secondary network)
2010 0.0149 (low pressure) 0.0232 (high pressure) 2017 0.0530 (low pressure) 0.0890 (high pressure)
- €/m3
Energy costs
Olive 47 (FEA: high pressure) 123 (ODS: low pressure) Maize 150 (FEA: low pressure)
- €/ha
Fertilizer and pesticides costs
Olive 69 (FEA) 172 (ODS) Maize 585 (FEA)
- €/ha
Labor and equipment costs
Olive 271 (FEA) Maize 150 (FEA)
- €/ha
Seeds Maize: 220 (FEA)
- €/ha

Deliverable 2.1 – Value chain mapping Page 68 of 77
Description of the economic costs and
benefits of the system
Costs Benefits Unit
Other
Olive 1357 (FEA) 1452 (ODS) Maize 776 (FEA)
- €/ha
Disposal There are no economic costs and benefits at disposal
3.6 Mapping of actors
The main stakeholders involved in the Monte Novo irrigation area are distinhuished in directly and indirectly involved actors. The directly involved actors are:
Empresa para o Desenvolvimento das Infraestruturas de Alqueva (EDIA) (Associação de Beneficiários de Monte Novo) Representative farmers:
o Fundação Eugénio de Almeida (FEA)
o Olivais do Sul (ODS)
o Others (to be investigated).
The main indirectly involved actors are:
Administração de Região Hidrográfica do Alentejo (ARH – Alentejo) Direção Regional de Agricultura do Alentejo (DRA – Alentejo) Centro Operativo e Tecnológico do Regadio (COTR)
Figure 28 illustrates the main interactions of the directly involved actors in the Monte Novo irrigation area. A short description of the respective roles both of the directly involved and the indirectly involved actors is provided in the following paragraphs.
Figure 28: Interaction among the directly invovled actors in the Monte Novo Irrigation
Area

Deliverable 2.1 – Value chain mapping Page 69 of 77
3.6.1 Empresa para o Desenvolvimento das Infraestruturas de Alqueva (EDIA)
EDIA is the company responsible (by concession) for the management and development of the Alqueva multipurpose project and the associated infrastructures (see also the topic 3.2.5).
The main responsibilities of this entity, associated to the Alqueva project, are the management of the hydraulic infrastructures and other public water domain goods, as well as the management and regulation of the principal and secondary allocated water uses, the grant of water resources use licenses within the project area and the supervision of the granted water use licenses. EDIA can also use water for irrigation and energy production (hydropower plants, and the small plants spread over the entire water distribution network). Finally, the entity is currently responsible for the operation of the primary and secondary irrigation network where the Monte Novo irrigation perimeter is included.
3.6.2 Associação de Beneficiários de Monte Novo
The Associação de Beneficiários de Monte Novo was established on 14 May 2009 (order number 676/2009), representing all farmers connected to the Alqueva water distribution system from EDIA. According to the regulatory Decree Law 84/82, the association, as a legal person of public law, is subjected to formal recognition by the Ministry of Agriculture, Trade and Fisheries. It is basically function of this association to promote the administration of the great works of hydro-agricultural development, such as:
a) Ensure the operation and maintenance of hydro-agricultural development works or parts;
b) Set the watering schedule; and c) Ensure the collection of taxes for operation and maintenance, and manage
the revenues.
Currently, EDIA is responsible, for a transitional period, for these responsibilities, undertaking the role allocated, by law, to the Associação de Beneficiários de Monte Novo.
3.6.3 Representative farmers
As already mentioned, the representative farmers considered so far are the Fundação Eugénio de Almeida (FEA) and the Olivais do Sul (ODS).
Fundação Eugénio de Almeida (FEA)
The Fundação Eugénio de Almeida (FEA) foundation is the most important agricultural producer in the Monte Novo irrigation perimeter. The foundation detains almost 20% of the Monte Novo perimeter area (about 1,200 ha); the irrigated area corresponds only to about 50% of the corresponding area. The main crops produced are vineyards and olives, but they also grow tomatoes for industry production and have livestock production.

Deliverable 2.1 – Value chain mapping Page 70 of 77
It is important to highlight that, besides the commercial activity, the foundation has a statutory responsibility in cultural, educational, social, and spiritual domains, especially in the Évora region, where FEA promotes a wide range of public initiatives and programs. Finally, the FEA executive director is also the formal president of the beneficiaries association of the Monte Novo irrigation perimeter (though without a particularly active role at the present moment).
Olivais do Sul (ODS)
Olivais do Sul is a commercial enterprise specialized in olive growing and olive oil production, using innovative methods. The enterprise is also a very important agricultural producer in the Monte Novo irrigation perimeter and owns about 10% of the corresponding agricultural areas with an irrigated area of about 260 ha. The olives production is made under both the intensive and super intensive methods. Some of the already implemented measures for improving eco-efficiency are:
Water reuse systems;
leafs’ composting and use of the final product as fertilizer; and
Use of olive stone for heating.
Others
Other farmers that can potentially collaborate with EcoWater and provide input and data for the development of Case Study #2 are presented in Table 29.
Table 29: Other farmers, whose involvement in EcoWater will be investigated
Farmer Pressure head Crop type(s)
Gonçalo Macedo High and low Permanent pastures Maize
Casa Barreira / João Guedes Low Olive Henrique Granadeiro Low Vineyards Luís Gancho Tomatoes for industry
Luís Morais High (Block 4.A) Vineyards Maize
Francisco Murteira Low Maize Permanent pastures
Pinto Barreiros Low Olive
3.6.4 Administração de Região Hidrográfica do Alentejo (ARH – Alentejo)
The Law 58/2005 transformed the 2000/60/EC European Directive into a national law. In that context, it defines the institutional framework and presents the public administration institutions that play a role in water management. At the basins level, the River Basin Districts Administrations (ARH) are responsible for water management, especially in what concerns the planning, licensing and supervision, being the entities and representatives of each ARH, nominated by central administration.
Consequently, the ARH of Alentejo is responsible for the water management in the Portuguese part of the Guadiana basin, where the Monte Novo irrigation area is

Deliverable 2.1 – Value chain mapping Page 71 of 77
located. This main responsibility of the entity is to protect and improve the environmental components of water resources, and specifically to:
Elaborate and execute the river basin management plans and specific plans for water management;
Undertake the analysis of the river basin district characteristics and the implications of the human activities on the water resources state; and
Undertake the economic analysis of water uses in each river basin district.
3.6.5 Direção Regional de Agricultura do Alentejo (DRA Alentejo)
The mission of the Regional Directorate of Agriculture of Alentejo (DRA Alentejo) is to participate and foster the development and implementation of policies in the areas of agriculture, agro-food and rural development and to contribute to the respective assessment and follow-up, following the normative and guidelines defined by the Ministry of Agricultural central services.
Specifically, the main DRA responsibilities in their corresponding jurisdictional area are to:
Execute the measures of agricultural, agro-food and rural development policies;
Execute the necessary actions for reception, evaluation, approval, follow-up and validation of investment projects supported by public funds;
Foster the execution of rural intervention actions and projects and also of integrated plans and programs for rural development;
Support farmers, their representative associations and rural population, within its main responsibilities; and
Foment the creation and development of strategic public-private partnerships, envisaging both economic growth and social and environmental sustainability.
3.6.6 Centro Operativo de Tecnologia do Regadio (COTR)
COTR is an advisory entity for the coordination and the promotion of scientific research regarding agricultural development. Its social responsibility is to harness the rural development, i.e. the conversion of rainfed into irrigated agriculture, and particularly to:
Promote and undertake the necessary projects leading to the creation and broadcasting of knowledge and to the technical-scientific interchange;
Promote and undertake training actions and pursue professional qualification;
Stimulate the scientific and technical information in the domain of the irrigated crops; and
Promote and carry out national and international scientific meetings to the accomplishment of its ends.
3.7 Preliminary identification of technologies to be assessed
The list of the existing technologies, presented in topic 3.4.4 (p. 57), is followed by a preliminary list of technologies / innovations to be assessed during the development

Deliverable 2.1 – Value chain mapping Page 72 of 77
of Case Study # 2. At the irrigation perimeter level (distribution network), these technologies include:
a) Variable tariffs of water supply (function of demand); b) Variable tariffs of water supply (function of energy costs); and c) Pressure head delivery.
At the farm level (crops water use), new technologies include:
a) Drip irrigation; b) Sub-surface irrigation; c) High and super-high density orchards; and d) Variable rate irrigation system, i.e.:
Biological production Regulated deficit irrigation
The corresponding stages, description, impacts, and possible eco-efficiency indicators are described in Table 30. Nonetheless, It must be highlighted that the specific list is preliminary, as it corresponds to an early stage of the Case Study development; it will be completed and finalized after the baseline eco-efficiency assessment and discussions with local actors/ stakeholders.
Table 30: Preliminary identification of the technologies/ innovations to be assessed
Technology Action Impacts Eco-
efficiency Indicator(s)
Primary / Secondary network
Variable tariffs of water supply (function of demand)
Define variable price ranges for water supplied according to crop water needs (previously processed and made available)
Reduction of water use at farmers level
m3/ha
Reduction of operational costs of EDIA / AB Monte Novo
Reduction of emissions
kWh/m3 €/m3 CO2/
m3
Variable tariffs of water supply (function of energy costs)
Define variable price ranges for water supplied, according to the correspondent schedule/ energy price of the time period of supply (promotion of irrigation during night)
Reduction of water use at farmers level
m3/ha
Reduction of operational costs of EDIA / AB Monte Novo
Reduction of emissions
kWh/m3 €/m3 CO2/m
3
Secondary network
Pressure head delivery
Supplying more areas at high pressure levels, regarding both water users and EDIA’s/ AB Monte Novo costs and benefits
Reduction of water use at farmers level
m3/ha
Reduction of operational costs of EDIA / AB Monte Novo
Reduction of emissions
kWh/m3 €/m3 CO2/m
3

Deliverable 2.1 – Value chain mapping Page 73 of 77
Technology Action Impacts Eco-
efficiency Indicator(s)
Water use
Drip irrigation
Changes from sprinkler irrigation (in this case study pivot irrigation system in Maize) to drip irrigation system will potentially reduce the consumptive use of water (10-20%)
Reduce the consumptive use of water (10-20%)
m3/ha
Reduce the consumptive use of fertilizers (fertirrigation)
kg/ha
Reduce energy consumption since it requires lower operating pressures (less 10-15 bars)
Reduction of emissions
kWh/m3 €/m3 CO2/m
3
Sub-surface irrigation
Changes from drip irrigation system to sub-surface drip irrigation will potentially reduce the consumptive use of water (5-10%)
Reduce the consumptive use of water (10-20%)
m3/ha
Reduce the consumptive use of fertilizers (fertirrigation)
kg/ha
High and super-high density orchards
Shift between high density orchards to super-high density orchards might guarantee a production increase
Increase of the relation production/ water use
ton/m3
Possible degradation of soil and water quality due to the increase of input resources needs (need to foster regular evaluations of Salinization level, Alkalinization level, Infiltration rate, Drainage, Nutrient concentration, Organic matter)
dS/m % mm/h % or
cm/day mg/kg %
Variable rate irrigation system
Adapting the system water application rate to the soil infiltration rate
Reduce the consumptive use of water
m3/ha
Reduce the consumptive use of fertilizers (fertirrigation)
kg/ha
Increase of the relation production/ water use
ton/ m3

Deliverable 2.1 – Value chain mapping Page 74 of 77
Technology Action Impacts Eco-
efficiency Indicator(s)
Biological production
Change from traditional production methods (namely in olive orchards) to biological production methods
Reduce the consumptive use of water
m3/ha
Reduce the consumptive use of fertilizers (fertirrigation)
kg/ha
Possible amelioration of soil and water quality due to the increase of input resources needs (need to foster regular evaluations of Salinization level, Alkalinization level, Infiltration rate, Drainage, Nutrient concentration, Organic matter)
dS/m % mm/h % or
cm/day mg/kg %
Regulated deficit irrigation
Inducing mild to moderate plant water deficits during some specific phenological stages
Small differences in productivity can be attained with less water use
ton/m3
Reduce the consumptive use of water
m3/ha
Reduce the consumptive use of fertilizers (fertirrigation)
kg/ha

Deliverable 2.1 – Value chain mapping Page 75 of 77
4 Concluding remarks
The document presented the value chain mapping of two Mediterranean irrigation schemes, as a first step for the evaluation of the uptake of modern technologies that could improve the systems’ eco-efficiency performance. The resource inputs and environmental impacts relevant to each stage (or process) of the system are described. Accordingly, a preliminary list of selected environmental impact indicators is presented, followed by a preliminary list of potential technologies / innovations / practices that can be evaluated for each Case Study. The latter will be reviewed and finalized after the completion of the baseline eco-efficiency assessment and through the discussions with local actors / stakeholders. The final results to be derived should permit the comparison of technologies and practices for eco-efficiency improvement under two different technical and socio-economic contexts of agricultural water use.
Case Study #1 refers to a scheme constructed 30 years ago, which, for many years, has been affected by the water shortage. Management measures (including water pricing) have already been adopted, in order to reduce the negative impacts on agricultural production and on the environment. The main policy-relevant aspects are related to the quantitative and qualitative depletion of the aquifer. The former is mainly attributed to groundwater pumping by many farmers, to replenish the gap of crop water demand that is not refilled through water delivered by the Irrigation Consortium. The qualitative degradation mainly concerns the salinization of the aquifer, as a result of seawater intrusion, due to the over-exploitation of coastal aquifer, and the emission of pollutants, such as fertilizers and pesticides, as a result of intensive farming activities. The main policy-relevant aspects include:
A better monitoring and protection of the quantity and the quality of water resources (both surface water and groundwater);
The evaluation of the introduction of innovative and more-efficient irrigation technologies, such as subsurface drip irrigation, multi-user electronic delivery hydrants, regulated deficit irrigation, variable speed pumps, etc.;
The re-use of treated wastewater, as a valid option to reduce the water shortage problems.
With regard to Case Study #2, the main policy-relevant aspects are related to the:
Eco-efficiency assessment of a new irrigation perimeter, in which water prices are currently subsidized, but will significantly increase till 2017 (already defined by law). This will imply the re-assessment of crops production with high levels of water consumption (as for example Maize);
Evaluation of possible changes in water tariffs, in order to foster a reduction of water use consumption;
Evaluation of new technologies on irrigation methods (such as subsurface drip irrigation, variable rate irrigation systems and regulated deficit irrigation), in order to foster the reduction of water use consumption;
Assessment and possible mitigation of significant environmental impacts in the agricultural sector (such as the Nitrates and Phosphates quantities in soil and water).

Deliverable 2.1 – Value chain mapping Page 76 of 77
5 References
5.1 Value Chain mapping for Case Study # 1: Sinistra Ofanto Irrigation Scheme, Italy
Altieri S. (1995). Sinistra Ofanto irrigation scheme : management and maintenance problems. In: L.S. Pereira (ed.). Bonifica, n. 1-2: 40-47.
Consorzio per la Bonifica della Capitanata (1984). Cinquant’anni di bonifica nel Tavoliere. CBC, Foggia.
D’Arcangelo G. (2005). Operation, maintenance and management of irrigation schemes in Italy : operational costs. In: Lamaddalena N., Lebdi F., Todorovic M. and Bogliotti C. (eds.). Irrigation systems performance. IAMB, Valenzano, pp. 113-125. Options Méditerranéennes, B 52.
Eco-Water (2012). Deliverable 1.1 Review and selection of indicators to be used in the Eco-Water case studies. In: Meso-level eco-efficiency indicators to assess technologies and their uptake in water use sectors.
Eco-Water (2012). Deliverable 1.4 Review of existing frameworks and tools for developing eco-efficiency indicators. In: Meso-level eco-efficiency indicators to assess technologies and their uptake in water use sectors.
Fabiani S. (2010). Aspetti economici dell’agricoltura irrigua in Puglia. Inea, Roma.
FADN (2007). Regional Database.
INEA (1999). Quadro di riferimento per lo studio e il monitoraggio dello stato dell’irrigazione in Puglia. Consorzio per la bonifica della Capitanata. Studio sull’uso irriguo della risorsa idrica sulle produzioni agricole e sulla loro redditività. Inea, Roma.
ISTAT (2000). 5° Censimento Generale dell’Agricoltura 2000. http://www.istat.it/it/censimento-agricoltura/agricoltura-2000
ISTAT (2010). 6° Censimento Generale dell’Agricoltura 2010. http://www.istat.it/it/censimento-agricoltura/agricoltura-2010
Lamaddalena N. (1996). Problematiche connesse alla gestione ed all’esercizio di un sistema irriguo collettivo in periodi di disponibilità idrica limitata : cinque anni di osservazioni. In: Scritti dedicati a Giovanni Tournon, pp. 237-246.
Lamaddalena N., Ciollaro G. and Pereira L.S. (1995). Effect of changing irrigation delivery schedules during periods of limited availability of water. Journal of Agricultural Engineering Research, 61:261-266.
Zaccaria D., Lamaddalena N., Neale C.M.U. and Merkley G. (2011). Simulation of peak-demand hydrographs in pressurized irrigation delivery systems using a deterministic-stochastic combined model. Part II: model applications. Irrigation Science ; doi: 10.1007/s00271-011-0308-y.

Deliverable 2.1 – Value chain mapping Page 77 of 77
5.2 Value Chain mapping for Case Study # 2: Monte Novo Irrigation Area, Portugal
ARH-Alentejo (2011), “River basin management plan – Guadiana, Technical report for public participation - Planos de Gestão das Bacias Hidrográficas - Região Hidrográfica 7 – Relatório técnico para efeitos de Participação Pública”, Nemus – Ecossistema – Agro.ges, ARH Alentejo, December 2011.
EDIA (2005), “Environmental Impact Assessment of Monte Novo irrigation area - Estudo de Impacto Ambiental do Bloco de Rega de Monte Novo”, Non Technical Report, Volume III, EDIA.
EDIA (2011), “Map portal - Portal de mapas”, website of EDIA, available online: http:\\www.edia.pt (last visit in December 2011).
EDIA (2012), Data files provided by EDIA
FAO (2006) World Reference Base for Soil Resources, World Soil Resources Report, 103, 98 pp.
ISA (2008) Non-Humic Lithic Soil - database of agriculture section, Instituto Superior de Agronomia, available online: (http://agricultura.isa.utl.pt/agribase_temp/solos/solitnh.htm) last visit in January 2012.