of the state of california filed application of southern
TRANSCRIPT
BEFORE THE PUBLIC UTILITIES COMMISSION OF THE STATE OF CALIFORNIA
Application of Southern California Edison Company (U 338E) for Approval of its Energy Savings Assistance and California Alternate Rates for Energy Programs and Budgets for Program Years 2015-2017.
Application 14-11-007 (Filed November 18, 2014)
And Related Matters. Application 14-11-009 Application 14-11-010 Application 14-11-011
MONTHLY REPORT OF SAN DIEGO GAS & ELECTRIC COMPANY (U 902 M) ON LOW-INCOME ASSISTANCE PROGRAMS FOR MAY 2021
Rebecca D. Hansson Attorney for: SAN DIEGO GAS & ELECTRIC COMPANY 8330 Century Park Court, CP32D San Diego, CA 92123-1530 Telephone: (858) 654-8278 Facsimile: (619) 699-5027 E-Mail: [email protected]
June 21, 2021
FILED06/21/2102:24 PM
1 / 36

1
BEFORE THE PUBLIC UTILITIES COMMISSION OF THE STATE OF CALIFORNIA
Application of Southern California Edison Company (U 338E) for Approval of its Energy Savings Assistance and California Alternate Rates for Energy Programs and Budgets for Program Years 2015-2017.
Application 14-11-007 (Filed November 18, 2014)
And Related Matters. Application 14-11-009 Application 14-11-010 Application 14-11-011
MONTHLY REPORT OF SAN DIEGO GAS & ELECTRIC COMPANY (U 902 M) ON
LOW-INCOME ASSISTANCE PROGRAMS FOR MAY 2021
This is the fifth monthly report for program year (PY) 2021. The purpose of this report is
to consolidate activity for the California Alternate Rates for Energy (CARE) Program and
Energy Savings Assistance (ESA) Program and provide the California Public Utilities
Commission’s Energy Division with information to assist in analyzing the low-income programs.
This report presents year-to-date ESA Program and CARE Program results1 and
expenditures through May 31, 2021 for San Diego Gas & Electric Company.
Respectfully Submitted,
/s/ Rebecca D. Hansson Rebecca D. Hansson Attorney for: SAN DIEGO GAS & ELECTRIC COMPANY 8330 Century Park Court, CP32D San Diego, CA 92123-1530 Telephone: (858) 654-8278 E-Mail: [email protected]
June 21, 2021
1 Pursuant to Rule 16.6 of the Commission’s Rules of Practice and Procedure, on May 12, 2021, SDG&E submitted a request to Rachel Peterson, Executive Director for the California Public Utilities Commission, for an extension of time until July 21, 2021, to provide CARE Program data due to unforeseen issues in relation to the cut over to SDG&E’s recently implemented Customer Information System (CIS), also known as Envision. The extension was granted on May 21, 2021. Accordingly, CARE Program data for the months of April and May will be filed on July 21, 2021.
2 / 36

San Diego Gas & Electric Company
Energy Savings Assistance (ESA) Program
And
California Alternate Rates for Energy (CARE)
Program
3 / 36

i
TABLE OF CONTENTS
ESA PROGRAM EXECUTIVE SUMMARY ................................................................... 1
ESA Program Overview ......................................................................................... 1
Provide a summary of the ESA Program elements as approved in Decision (D.) 16-11-022. ........................................................................................... 3
ESA Program Customer Outreach and Enrollment Update .................................... 3
Provide a summary of the ESA Program outreach and enrollment strategies deployed this month. ................................................................... 3
Customer Assistance Marketing, Education and Outreach for the CARE and ESA Programs. ..................................................................................... 5
Leveraging Success Evaluation, Including CSD .................................................. 12
Please provide a status of the leveraging effort with CSD. What new steps or programs have been implemented? What were the results in terms of new enrollments? ...................................................................................... 13
Workforce Education & Training (WE&T) .......................................................... 14
Please summarize efforts to improve and expand ESA Program workforce education and training. Describe steps taken to hire and train low-income workers and how such efforts differ from prior program years. ............... 14
Miscellaneous ....................................................................................................... 14
ESA Program Studies ............................................................................... 14
ESA Program Pilot .................................................................................... 14
CARE EXECUTIVE SUMMARY ................................................................................... 15
CARE Program Summary..................................................................................... 15
CHANGES REPORTING ................................................................................................ 15
APPENDIX A – ESA AND CARE PROGRAM TABLES ............................................. 16
4 / 36

1
ENERGY SAVINGS ASSISTANCE PROGRAM MONTHLY REPORT
1. ESA PROGRAM EXECUTIVE SUMMARY
1.1. ESA Program Overview
In Guidance Decision (D.) 19-06-022, the California Public Utilities Commission (CPUC
or Commission) authorized CARE and ESA Program bridge funding up to 2020 program year
(PY) levels for the first six months of 2021 and up to a year if the Commission had not approved
applications for PY 2021 by November 16, 2020.1 Subsequently, the Commission issued D.20-
08-033 to modify certain bridge funding requirements. In compliance with D.20-08-033,
SDG&E filed Advice Letter 3612-E/2905-G (ESA Bridge Funding AL) with a proposed ESA
Program bridge funding budget and retreatment goal for the January 1, 2021 through June 30,
2021 bridge period.2 In addition, D.19-06-022 automatically authorizes CARE Program activity
for January through June 2021 without the need for prior advice letter approval. On April 15,
2021, San Diego Gas & Electric Company (SDG&E) filed the ESA Bridge Funding Advice
Letter to demonstrate completion of the interim progress milestones and request funding for
second half of 2021.3 In addition, the Commission issued the Proposed Decision on Large
Investor-Owned Utiltiies’ and Marin Clean Energy’s California Alternate Rates for Energy
(CARE), Energy Savings Assistance (ESA), and Family Electric Rates for Energy (FERA)
Program Applications for Program Years 2021-2026 on April 26, 2021.4 Accordingly, the
authorized program budgets and homes treated goals in this monthly report reflect the six-month
1 D.19-06-022 at 12. 2 SDG&E Advice Letter 3612-E/2905-G was approved by the Commission’s Energy Division effective September 23, 2020. 3 SDG&E Advice Letter 3740-E/2970-G was suspended for up to 120 days by the Commission’s Energy Division beginning May 16, 2021 for additional staff review. 4 Updates regarding the Commission’s June 3, 2021 approval of the final decision (D.21-06-015) will be
provided in next month’s report for June activity.
5 / 36
2
bridge period and will be revised once the Commission approves the utility applications for 2021
and beyond or authorized bridge funding for the second half of 2021,5 whichever occurs first.
COVID-19 Program Impacts
On October 30, 2020, SDG&E notified its ESA contractors and Energy Division that the
Pandemic Return to Service (PPRS) credit earning period would begin on December 1, 2020 and
end on May 31, 2021.6 SDG&E had five contractors who accepted advance payments and are
eligible to earn PPRS credits. As of May, SDG&E is pleased to report that all five ESA
contractors have earned the full PPRS eligible amounts. Additionally, all but one contractor has
repaid the excess amount of the advance payment used for items not eligible for PPRS credits.
The contractor continues to make payments and is expected to repay the ineligible amount prior
to December 31, 2021.
SDG&E Outreach and Assessment (O&A) contractors continued to provide in-home
enrollments and treatments plus offered virtual enrollments to customers preferring to delay in-
home treatment. Contractors are primarily enrolling in person, with less than 2% of enrollments
occurring via telephone enrollment efforts. All ESA Program contractors are fully operational.
In May, SDG&E’s largest O&A contractor reported a decline in enrollments due to an increase
in field representatives being out sick due to COVID-19 vaccination reactions.
5 “If the Commission hasn’t voted on the applications by May 16, 2021, and the large IOU has met the interim progress milestone, an extension of ESA bridge funding for six-months through the end of 2021, at the same budget level and retreatment goal as for the first six-month bridge, is authorized” pending Energy Division approval of a tier 1 AL submitted by each IOU demonstrating achievement of the budget and retreatment goals for the January through June 2021 bridge period. D.19-06-022 at 13. 6 See Resolution E-5074 at 10 which states “[T]he IOUs should provide a 30 day advance notice to contractors of when the six-month PPRS credit-earning period begins.” The IOUs consist of Pacific Gas and Electric Company, SDG&E, Southern California Gas Company, and Southern California Edison Company.
6 / 36

3
1.1.1. Provide a summary of the ESA Program elements as approved in Decision (D.) 16-11-022.
ESA Program Summary through May 2021
2021 Authorized / Planning
Assumptions7
Actual to Date
%
Budget8 $ 16,460,022 $6,572,193 40% Homes Treated9 5,973 4,466 75%
kWh Saved N/A 495,387 N/A kW Demand Reduced N/A 66 N/A
Therms Saved N/A 7,158 N/A GHG Emissions Reduced (Tons) N/A 314 N/A
1.2. ESA Program Customer Outreach and Enrollment Update
1.2.1. Provide a summary of the ESA Program outreach and enrollment strategies deployed this month.
Below is a summary of ESA Program specific efforts conducted this month. Joint CARE
and ESA Programs marketing, education and outreach efforts are provided in section 1.2.2
below.
ESA Program Contractor Outreach
As previously discussed, SDG&E’s largest O&A contractor reported a significant decline
in ESA Program enrollments for the month of May due to employee absences related to reactions
to the COVID-19 vaccine. During this month, 610 ESA enrollments were received through
canvassing efforts, which is a 33% decrease over the prior month activity. Contractors are also
7 ESA budget and homes treated reflect those authorized in SDG&E ESA Bridge Funding Advice Letter 3612-E/2905-G, effective September 23, 2020. The energy savings and demand reduction goals are not applicable and therefore are reflected as “N/A.” 8 The Budget category reflects the authorized budget and actual expenditures for both the ESA Program and ESA CAM. 9 Total homes treated reflects homes that have been invoiced and paid. There was no CSD leveraging.
7 / 36
4
continuing to leverage SDG&E marketing efforts to make initial telephone contacts with
customers to enroll and schedule in-home appointments. Overall, ESA Program marketing,
education, and outreach efforts were successful in creating 3,545 leads and 1,029 enrollments.
ESA Program Multifamily Common Area Measure (MF CAM) Initiative
In May 2021, SDG&E’s ESA Program MF CAM implementer continued targeted
marketing to potential ESA MF CAM properties, including re-syndication projects in SDG&E’s
service territory. Two properties were treated this month for a total of 14 properties in 2021. In
addition, six properties are currently receiving measure installations and there are a total of six
properties pending energy assessments/audits.
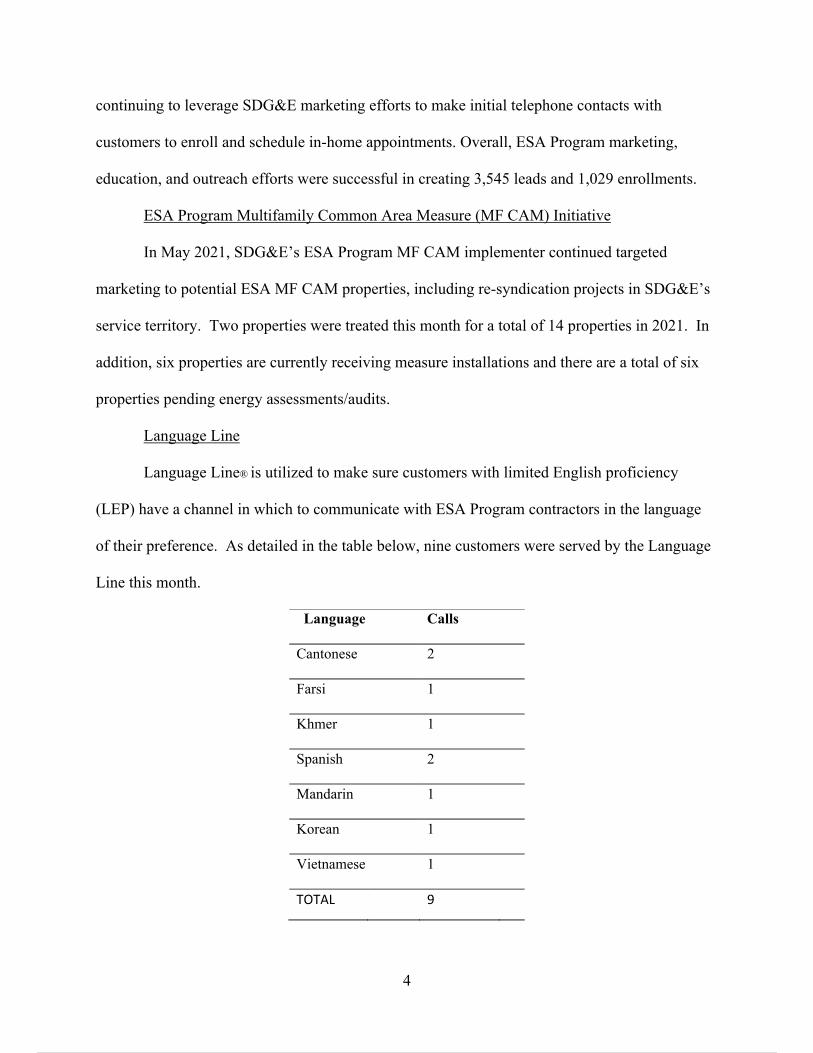
Language Line
Language Line® is utilized to make sure customers with limited English proficiency
(LEP) have a channel in which to communicate with ESA Program contractors in the language
of their preference. As detailed in the table below, nine customers were served by the Language
Line this month.
Language Calls
Cantonese 2
Farsi 1
Khmer 1
Spanish 2
Mandarin 1
Korean 1
Vietnamese 1
TOTAL 9
8 / 36

5
1.2.2. Customer Assistance Marketing, Education and Outreach for the CARE and ESA Programs.
Marketing, Education and Outreach (ME&O) activities summarized below represent joint
efforts on behalf of the CARE and ESA Programs. SDG&E utilizes an integrated ME&O
strategy by connecting with customers using general awareness marketing, direct marketing, and
community outreach and engagement. The intent of the 2021 campaign is to make a connection
with customers in order to drive conservation and provide monthly savings on their energy bill.
The campaign will run in English, Spanish, and Asian languages and may include television,
streaming radio, outdoor, print, digital (including paid search), email, direct mail and bill inserts,
as well as a robust outreach program. As the COVID-19 pandemic progresses, SDG&E will
continue to monitor any changes that may affect ME&O efforts.
General Awareness Marketing
General awareness marketing allows SDG&E to connect with its customers through mass
media efforts reaching both mass audiences and hard-to-reach populations, including customers
in rural areas, seniors, customers with special needs, and multilingual/multicultural customers.
The tactics leveraged this month are summarized in the following sections:
Online Advertising
SDG&E started a planned digital advertising campaign. Paid Search continued to run
and garnered 146,111 impressions with a click-through-rate (CTR) of 19.5%. Banner display
ads for May received 6,993,525 impressions with a CTR of 1%. Native online advertising had
306,020 impressions with a CTR of 0.4%.
9 / 36

6
Social Media
Using e-newsletters, website posts, and social media channels, the Energy Solutions
Partner Network shared over 145 customer assistance messages to an audience of more than
400,000 followers. SDG&E’s social media profile also posts messaging to an audience of more
than 40,000 followers. These messages are then able to be redistributed to other networks on
social media.
10 / 36

7
Direct Marketing
In May 2021, direct marketing efforts included the following tactics:
SDG&E sent an e-mail to promote the ESA Program to potential customers, which was
sent to 888,296 customers with a 29% Open Rate and 2% CTR.
Live CARE Call Campaign
SDG&E’s third-party contractor, The Harris Group (THG), called targeted customers to
enroll in the CARE Program.10 The campaign provides SDG&E with a way to directly connect
with customers in low-income and hard-to-reach areas. THG provides education about the
CARE and ESA Programs and assists customers in completing program application forms.
Outbound call activities generated the following numbers this month:
The Harris Group11 ESA Leads 0 CARE Enrollments N/A
CARE Recertifications12 N/A
10 THG is a Diverse Business Enterprise (DBE) vendor and a woman-owned business. 11 Pursuant to Rule 16.6, on May 12, 2021, SDG&E submitted a request for extension of time to comply for certain CARE data in the April 2021 and May 2021 Low Income Monthly Reports (A.14-11-007 et al) due to SDG&E’s recent Customer Information System (Envision) upgrade on April 5, 2021. The request for extension was approved on May 21, 2021. 12 Since March 4, 2020, no customers are required to recertify due to customer protections established in Resolutions M-4842 and M-4849. Accordingly, SDG&E has not removed any customers from the CARE program resulting from recertification/failure to recertify. Customers can manually request to recertify but are automatically placed in the COVID protection category.
11 / 36
8
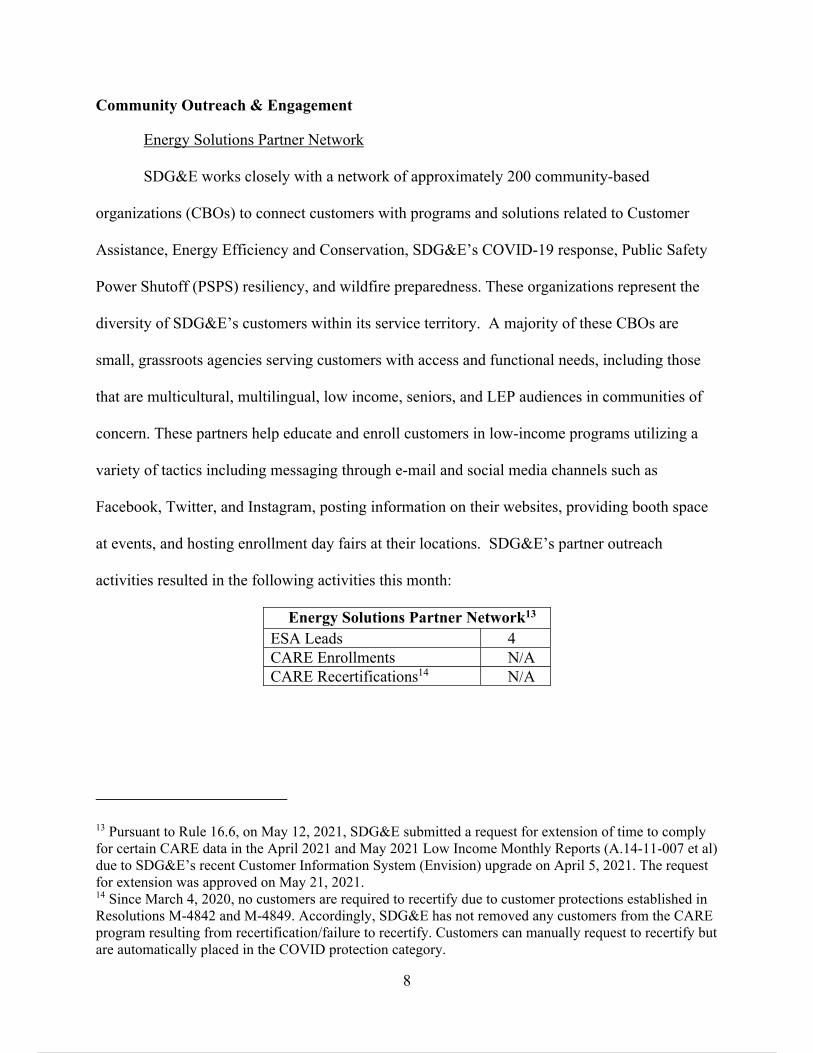
Community Outreach & Engagement
Energy Solutions Partner Network
SDG&E works closely with a network of approximately 200 community-based
organizations (CBOs) to connect customers with programs and solutions related to Customer
Assistance, Energy Efficiency and Conservation, SDG&E’s COVID-19 response, Public Safety
Power Shutoff (PSPS) resiliency, and wildfire preparedness. These organizations represent the
diversity of SDG&E’s customers within its service territory. A majority of these CBOs are
small, grassroots agencies serving customers with access and functional needs, including those
that are multicultural, multilingual, low income, seniors, and LEP audiences in communities of
concern. These partners help educate and enroll customers in low-income programs utilizing a
variety of tactics including messaging through e-mail and social media channels such as
Facebook, Twitter, and Instagram, posting information on their websites, providing booth space
at events, and hosting enrollment day fairs at their locations. SDG&E’s partner outreach
activities resulted in the following activities this month:
Energy Solutions Partner Network13 ESA Leads 4 CARE Enrollments N/A CARE Recertifications14 N/A
13 Pursuant to Rule 16.6, on May 12, 2021, SDG&E submitted a request for extension of time to comply for certain CARE data in the April 2021 and May 2021 Low Income Monthly Reports (A.14-11-007 et al) due to SDG&E’s recent Customer Information System (Envision) upgrade on April 5, 2021. The request for extension was approved on May 21, 2021. 14 Since March 4, 2020, no customers are required to recertify due to customer protections established in Resolutions M-4842 and M-4849. Accordingly, SDG&E has not removed any customers from the CARE program resulting from recertification/failure to recertify. Customers can manually request to recertify but are automatically placed in the COVID protection category.
12 / 36
9
Partner Spotlight
SDG&E's Customer Outreach and Engagement team participated in 18 virtual events,
presentations, trainings and workshops that featured information and enrollment in energy
solutions programs, services, and tools. Many of these activities were hosted by SDG&E’s
partner network and included drive through events, such as food drives, where information was
shared in a safe manner while following COVID-19 social distancing guidelines. Outreach
activities were focused on engaging customers with programs and solutions such as CARE and
ESA and reached over 3,600 people.
San Diego Chapter of the Black American Political Association of California
In May, SDG&E Outreach presented to the San Diego Chapter of the Black American
Political Association of California (BAPAC SD), which is an organization that works to ensure
the economic, social, and political force of the Black community in San Diego County remains
relevant. The presentation included information on SDG&E’s COVID-19 response and programs
that can assist customers with their bills. Other topics covered included the Emergency Rental
Assistance Program (ERAP), CARE, ESA, Medical Baseline (MBL), and the Arrearage
Management Payment (AMP) Plan.15
15 See Resolution E-5114, establishing the AMP.
13 / 36

10
City of San Diego
This month, the SDG&E Outreach team continued its monthly presentation to seniors for
the Senior Wellness Center of the City of San Diego. Topics presented included various
customer assistance programs such as CARE, ESA, and Medical Baseline.
Multicultural Outreach
To continue efforts to reduce potential barriers and increase education and program
enrollments for customers in the rural, multicultural/multilingual, and access and functional
needs segments, SDG&E pairs multicultural contractors with employees that are fluent in
various languages to help staff events and presentations. These contractors are fluent in the
following languages: Spanish, Chinese, Aramaic/Arabic, and other languages as requested.
During this reporting month, SDG&E participated in the following four multicultural community
outreach events:
Date Event Name Partner/Host Location
5/8/2021 Labor Council Food Distribution San Diego
Labor Council Palomar College 5/8/2021 Wildfire Safety Fair SDG&E Mountain Empire High School
5/22/2021 Labor Council Food Distribution San Diego
Labor Council Southwest High School
5/28/2021 ERAP Sign Up San Diego
Labor Council San Diego Labor Council
Rent and Utility Assistance Event
On May 28, in partnership with the San Diego Housing Commission and San Diego and
Imperial Counties Labor Council, SDG&E hosted a walk-up ERAP enrollment event with over
350 attendees where iPads and dedicated staff were available to provide support to customers
enrolling in assistance programs. Information on ERAP and other utility bill assistance
14 / 36

11
programs, such as CARE and AMP, was also shared with and provided to attendees. SDG&E
also invited a CARE capitation partner, Horn of Africa, to help with direct CARE enrollments.
In total, SDG&E was able to assist with enrolling nearly 60 customers in ERAP and 40 in
CARE.
Other Customer Engagement Efforts
Subject to SDG&E’s COVID-19 pandemic response addressed above in section 1.2.2,
SDG&E has several other customer engagement efforts to educate, enroll, and provide direct
service to its low-income customers. These efforts include direct service from SDG&E’s
Customer Contact Center (CCC) and Payment Offices, as well as, the distribution of materials
through other SDG&E customer-facing groups/programs and field services teams. Updated
information, as it relates to ongoing customer engagement and the impacts of the COVID-19
pandemic, will continue to be provided in subsequent monthly reports.
SDG&E Customer Contact Center (CCC), Branch Offices, and Payment Offices
SDG&E’s CCC, Branch Offices, and Payment Offices promote and offer the CARE and
ESA Programs to potentially eligible customers. SDG&E also promotes these customer
assistance solutions at its Authorized Payment Locations (APLs). Additionally, the Outreach
team assists at Branch Office locations on a seasonal basis to help enroll customers. On March
20, 2020, SDG&E closed the branch offices to the public due to the COVID-19 pandemic.
Branch offices are still accepting CARE applications at the building drop box but have yet to
reopen in 2021. Customers were urged to contact SDG&E’s CCC or go online to resolve utility
issues.
15 / 36

12
In D.16-06-054, SDG&E received Commission authorization for its CCC’s Energy
Service Specialists to enroll customers directly into the CARE Program over the telephone.
During this reporting month, SDG&E’s CCC and Branch Office generated the following
applications and leads over the telephone:16
1.3. Leveraging Success Evaluation, Including CSD
Single-Family Affordable Solar Housing (SASH) Program
SDG&E works with GRID Alternatives (GRID) to enroll customers in the ESA Program
based on participation in the SASH Program. Once approved, contractors install all feasible
ESA Program measures in the home prior to the SASH Program’s installation of a solar system.
This leveraging effort generated seven ESA Program leads and no enrollments this month.
Additionally, SDG&E and GRID have finalized a Non-Disclosure Agreement (NDA) for
annual data sharing efforts to be conducted for the DAC-SASH program in compliance with
D.20-12-003. In February, SDG&E completed and submitted the initial data request to GRID in
compliance with the decision directive. The next data sharing effort will be conducted in 2022.
Furthermore, D.16-11-022 required the utilities to provide GRID with information on
CARE High Energy Usage (HEU) customers who have participated in the ESA Program.17 The
16 Pursuant to Rule 16.6, on May 12, 2021, SDG&E submitted a request for extension of time to comply for certain CARE data in the April 2021 and May 2021 Low Income Monthly Reports (A.14-11-007 et al) due to SDG&E’s recent Customer Information System (Envision) upgrade on April 5, 2021. The request for extension was approved on May 21, 2021. 17 D.16-11-022 at 471.
CCC Branch Office
ESA Leads 10 1 CARE Enrollments N/A N/A CARE N/A N/A
16 / 36
13
NDA for this effort expired on December 31, 2020. To continue compliance with this directive,
SDG&E has updated and finalized the NDA and has provided it to GRID for review. However,
GRID has indicated that due to the new annual data sharing directive establish for DAC-SASH
in D.20-12-003 and the sunsetting of the SASH programthe monthly SASH data share process
may not be necessary. SDG&E and GRID continue to evaluate the necessity for the data ordered
in D.16-11-022 and will determine if the monthly process can be replaced by the new annual
process.
As part of SDG&E’s leveraging agreement with San Diego County Water Authority
(SDCWA), SDCWA reimburses SDG&E for water measures installed as part of the ESA
Program in homes where customers have an active SDCWA account. During this reporting
month, SDG&E did not submit any invoices to SDCWA for water savings measures.
1.3.1. Please provide a status of the leveraging effort with CSD. What new steps or programs have been implemented? What were the results in terms of new enrollments?
SDG&E continues to partner closely with local Low-Income Home Energy Assistance
Program (LIHEAP) agencies to improve leveraging opportunities between CSD’s LIHEAP and
the ESA Program. Both San Diego LIHEAP contractors, MAAC and Campesinos Unidos,
continued enrollment efforts. LIHEAP agencies have also received additional payment
assistance funding, which is expected to increase the leveraging opportunities between the two
programs. During this reporting month, LIHEAP organizations generated 158 leads and enrolled
56 customers for the ESA Program.
17 / 36
14
1.4. Workforce Education & Training (WE&T)
1.4.1. Please summarize efforts to improve and expand ESA Program workforce education and training. Describe steps taken to hire and train low-income workers and how such efforts differ from prior program years.
SDG&E did not conduct any in-person training in conjunction with WE&T efforts this
month. WE&T online courses are available for contractors via SDG&E’s website and email
distributions, of which contractors are informed.
SDG&E continues to make progress in the development of an online training platform for
ESA Program contractor education which will provide consistent outreach and assessment
training. SDG&E anticipates having a module in place mid-2021 with initial contractor training
by third quarter 2021.
1.5. Miscellaneous
1.5.1. ESA Program Studies
2022 Low Income Needs Assessment (LINA) Study
Southern California Edison Company (SCE) is managing the contract for the next
statewide LINA study. The selected consultant for the 2022 LINA is Evergreen Economics.
The project commenced in January 2021 and will be completed by December 2022. In May, the
study team continued to discuss refinements to the sampling plan based on stakeholder
comments received during the March 5 webinar.
1.5.2. ESA Program Pilot
SDG&E is not currently conducting any pilots.
18 / 36
15
2. CARE EXECUTIVE SUMMARY
2.1. CARE Program Summary
Pursuant to Rule 16.6 of the Commission’s Rules of Practice and Procedure, on May 12,
2021, SDG&E submitted a request to Rachel Peterson, Executive Director for the California
Public Utilities Commission, for extension of time to provide CARE Program data due to
unforeseen issues in relation to the cut over to SDG&E’s recently implemented Customer
Information System (CIS), also known as Envision. SDG&E requested approval for an
extension on the CARE data portion of the April and May Monthly Activity Reports to be filed
July 21, 2021 (due May 21 and June 21, respectively). The extension was granted on May 21,
2021. Accordingly, CARE Program data for the month of May will be filed on July 21, 2021.
3. CHANGES REPORTING
In compliance with requirements outlined in D.12-12-011, SDG&E has updated CARE
Table 10 information for the month of April 2021. As of June 1, 2020, CARE Table 11 reports
have moved from monthly to quarterly for the 2020-2021 CHANGES Program contract year,
which does not align with a traditional calendar year and starts in June of each year and ends in
May. Accordingly, CARE Table 10 activity for May 2021 and CARE Table 11 activity for Q4
March-May 2021 will be sent by CHANGES and reported in a subsequent report.18
18 SDG&E provides data from the previous month due to reporting delays from CHANGES which prevents SDG&E from reporting current month activity.
19 / 36

16
4. APPENDIX A – ESA AND CARE PROGRAM TABLES
ESA Program - Table 1 - Program Expenses
ESA Program - Table 1A – Program Expenses Funded from 2009-2016 “Unspent ESA
Program Funds”
ESA Program - Table 2 - Program Expenses & Energy Savings by Measures Installed
ESA Program - Table 2A - Program Expenses & Energy Savings by Measures Installed
(CSD Leveraging)
ESA Program - Table 2B - Program Expenses & Energy Savings by Measures Installed
(Multifamily Common Area Measures)
ESA Program – Table 2B-1 – Eligible Common Area Measures List
ESA Program - Table 3A & 3B - Average Bill Savings per Treated Home/Common
Area
ESA Program - Table 4A-1, 4B & 4C– Homes/Buildings Treated
ESA Program - Table 4A-2 - Homes Unwilling/Unable to Participate
ESA Program - Table 5A, 5B & 5C - Program Customer Summary
ESA Program - Table 6 - Expenditures for Pilots and Studies
ESA Program – Table 7 - Second Refrigerator, In-Home Education,
MyEnergy/MyAccount Platform
ESA Program – Table 8 – Contractor Advanced Funding and Repayment
CARE Program - Table 9 - Expenditures for the CHANGES Pilot
CARE Program - Table 10 - CHANGES One-On-One Customer Assistance Sessions
CARE Program - Table 11 - CHANGES Group Customer Assistance Sessions
20 / 36

ESA Program: Electric Gas Total Electric Gas Total Electric Gas Total Electric Gas TotalEnergy EfficiencyAppliances 591,000$ 143,000$ 734,000$ 30,014$ 3,871$ 33,884$ 186,256$ 26,054$ 212,311$ 32% 18% 29%Domestic Hot Water 21,750$ 703,250$ 725,000$ 3,065$ 99,116$ 102,182$ 14,468$ 467,805$ 482,273$ 67% 67% 67%Enclosure 879,780$ 1,166,220$ 2,046,000$ 87,283$ 115,701$ 202,984$ 422,775$ 560,422$ 983,197$ 48% 48% 48% HVAC 256,000$ 1,000,000$ 1,256,000$ 32,572$ 185,407$ 217,979$ 111,342$ 1,009,246$ 1,120,588$ 43% 101% 89% Maintenance 7,845$ 110,000$ 117,845$ -$ 38,650$ 38,650$ 4,911$ 46,538$ 51,449$ 63% 42% 44%Lighting 1,800,000$ -$ 1,800,000$ 223,654$ -$ 223,654$ 1,034,885$ -$ 1,034,885$ 57% 0% 57%Miscellaneous 259,000$ -$ 259,000$ 53,603$ -$ 53,603$ 212,910$ -$ 212,910$ 82% 0% 82%Customer Enrollment 785,000$ 785,000$ 1,570,000$ 127,639$ 127,639$ 255,278$ 437,576$ 437,576$ 875,151$ 56% 56% 56%In Home Education 145,000$ 145,000$ 290,000$ 27,527$ 27,527$ 55,053$ 104,288$ 104,288$ 208,576$ 72% 72% 72%Contractor Advanced Funds [3] -$ -$ -$ (500)$ (500)$ (1,000)$ (188,280)$ (188,280)$ (376,560)$ 0% 0% 0%Pilot -$ -$ -$ -$ -$ -$ -$ -$ -$ 0% 0% 0%
-$ -$ -$ -$ -$ -$ -$ -$
Energy Efficiency TOTAL [4] 4,745,375$ 4,052,470$ 8,797,845$ 584,856$ 597,411$ 1,182,267$ 2,341,130$ 2,463,650$ 4,804,780$ 49% 61% 55%
Training Center 42,500$ 42,500$ 85,000$ 2,094$ 2,094$ 4,189$ 9,329$ 9,329$ 18,658$ 22% 22% 22%Inspections 40,000$ 40,000$ 80,000$ 5,584$ 5,584$ 11,169$ 29,674$ 29,674$ 59,349$ 74% 74% 74%Marketing and Outreach 235,000$ 235,000$ 470,000$ 26,005$ 26,005$ 52,010$ 47,716$ 47,716$ 95,431$ 20% 20% 20%Statewide Marketing Education and Outreach -$ -$ -$ -$ -$ -$ -$ -$ -$ 0% 0% 0%Studies -$ -$ -$ -$ -$ -$ -$ -$ -$ 0% 0% 0%Regulatory Compliance 77,250$ 77,250$ 154,500$ 8,422$ 8,422$ 16,844$ 6,857$ 6,856$ 13,713$ 9% 9% 9%General Administration 558,367$ 558,367$ 1,116,734$ 56,702$ 56,702$ 113,404$ 491,687$ 491,687$ 983,374$ 88% 88% 88%CPUC Energy Division 12,500$ 12,500$ 25,000$ 1,267$ 1,267$ 2,535$ 7,685$ 7,685$ 15,369$ 61% 61% 61%Reallocation (ME&O budget reduced from $1.2M) -$ -$ -$ -$ -$ -$ -$ 0% 0% 0%
TOTAL PROGRAM COSTS 5,710,992$ 5,018,087$ 10,729,079$ 684,931$ 697,486$ 1,382,417$ 2,934,078$ 3,056,596$ 5,990,674$ 51% 61% 56%
Indirect Costs $ 35,076 $ 35,141 70,217$ $ 195,786 $ 193,804 389,590$ NGAT Costs 144,000$ 144,000$ $ 20,747 20,747$ $ 73,161 73,161$ 51% 51%
Energy Savings Assistance Program Table 1 - ExpensesSDG&E
May 2021Authorized Budget [1] [2] Current Month Expenses [4] Year to Date Expenses % of Budget Spent YTD
NOTE: Any required corrections/adjustments are reported herein and supersede results reported in prior months and may reflect YTD adjustments.
Funded Outside of ESA Program Budget
[1] Authorized budget does not include shifted funds from previous years and/or program cycles. Shifted funds, referred to as "2009-2016 Unspent ESA Program Funds", are reflected in ESA Table 1A.[2] Reflects authorized funding approved in the CPUC Energy Division Disposition Letter dated 12/27/2018 approving SDG&E Advice Letter 3250-E/2688-G, and updated for bridge funding under Advice Letter 3620-E/2323-G.[3] Negative amounts are a result of Advanced Funds credited back to SDG&E.[4] Current Month Expenses for Energy Efficiency Total includes May accruals and/or re-accruals of $664,434 in the following reporting categories: Appliances $0; Domestic Hot Water $33,232; Enclosure $226; HVAC $51,896; Maintenance $26,270; Lighting $165,513; Miscellaneous $57,533; Customer Enrollment $265,273; In Home Energy Education $64,401.
21 / 36

ESA Program [1]: Electric Gas Total Electric Gas Total Electric Gas Total Electric Gas TotalEnergy EfficiencyMulti-Family Common Area Measures 2,811,132$ 2,811,132$ 5,622,263$ 46,633$ 46,633$ 93,267$ 415,123$ 149,922$ 565,045$ 15% 5% 10%In-Home Education -$ -$ -$ -$ -$ -$ -$ -$ -$ 0% 0% 0%Leveraging - CSD [3] -$ -$ -$ -$ -$ -$ -$ -$ -$ 0% 0% 0%Pilot [4] -$ -$ -$ -$ -$ -$ -$ -$ -$ 0% 0% 0%Studies [5] 54,340$ 54,340$ 108,680$ 6,204$ 6,204$ 12,409$ 8,237$ 8,237$ 16,474$ 15% 15% 15%Regulatory Compliance -$ -$ -$ -$ -$ -$ -$ -$ -$ 0% 0% 0%General Administration -$ -$ -$ -$ -$ -$ -$ -$ -$ 0% 0% 0%
TOTAL PROGRAM BUDGET/EXPENSES 2,865,472$ 2,865,472$ 5,730,943$ 52,838$ 52,838$ 105,675$ 423,360$ 158,159$ 581,519$ 15% 6% 10%`
Energy Savings Assistance Program Table 1A - Expenses Funded From 2009-2016 "Unspent ESA Program Funds"SDG&E
May 2021Authorized Budget [2] Current Month Expenses Year to Date Expenses % of Budget Spent YTD
NOTE: Any required corrections/adjustments are reported herein and supersede results reported in prior months and may reflect YTD adjustments.
[1] Add additional categories if relevant to your utility[2] Reflects unspent funds remaning from 2017-2020 cycle.
[4] Funding authorized for Programmable Communicating Thermostat (PCT) Pilot.[3] Refers to budget supporting CSD's LIWP program.
[5] Funding authorized for Rapid Feedback Research and Analysis and Potential and Goals Study. Current Month negative amount due to reimbursements received from other IOU's related to Non-Energy Benefits Impact
22 / 36
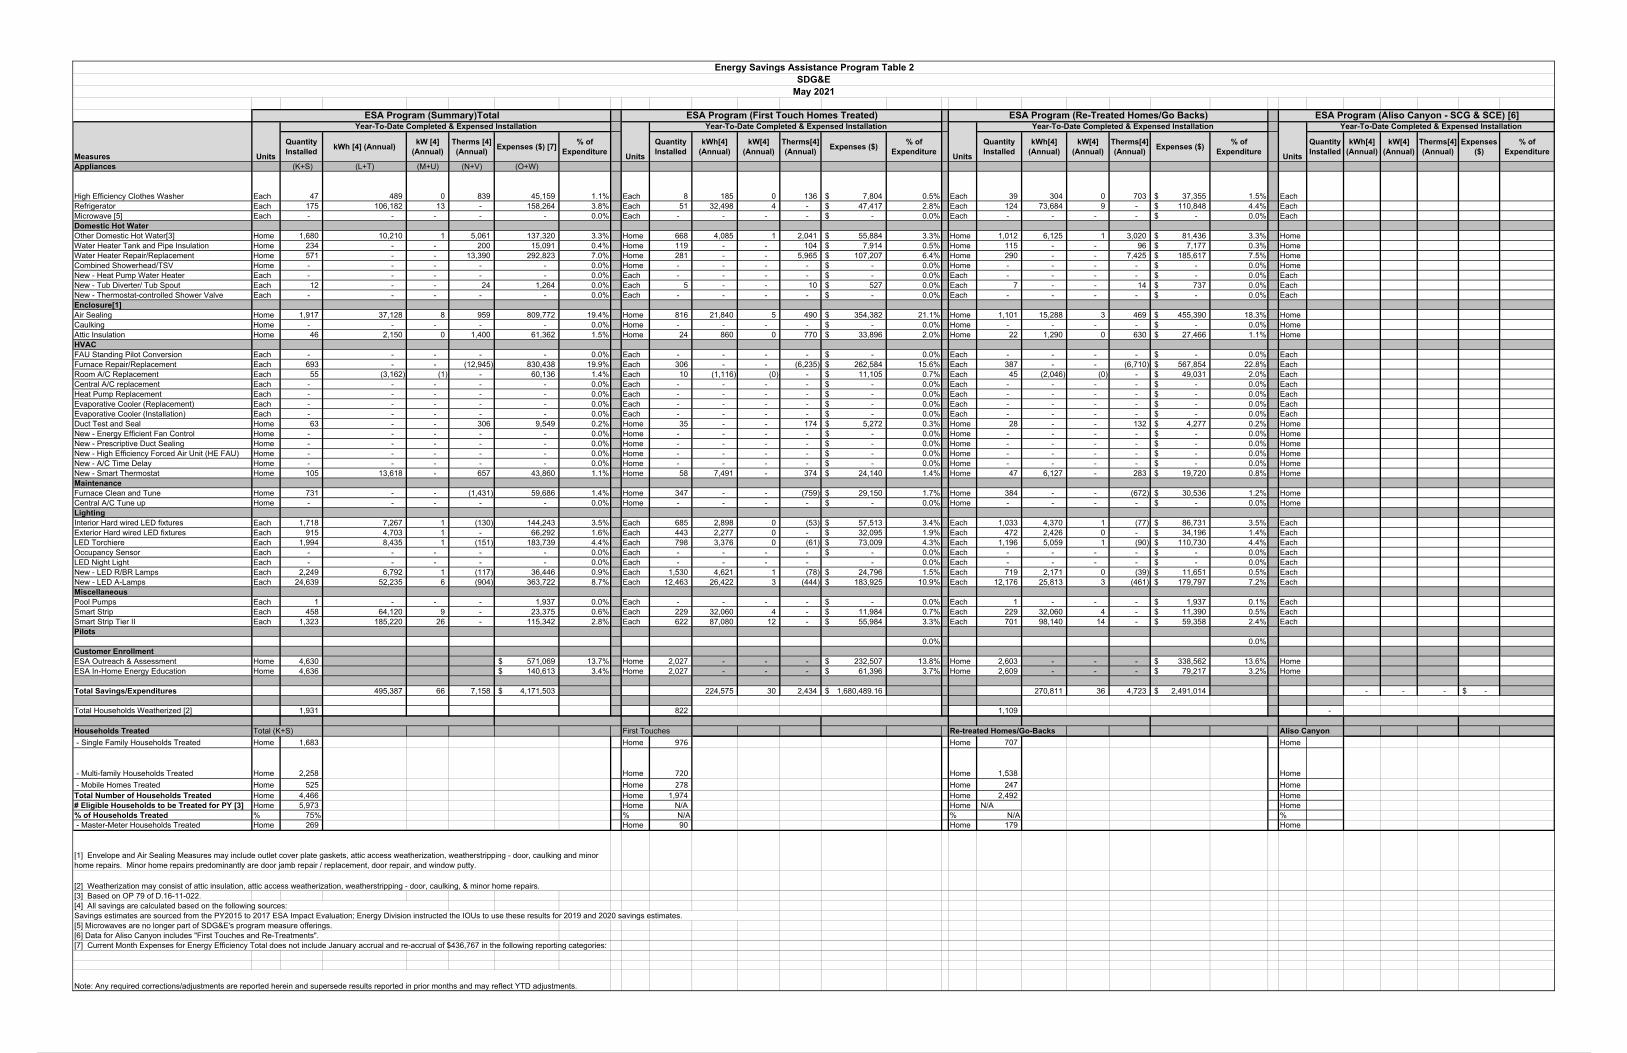
Measures Units
Quantity Installed
kWh [4] (Annual)kW [4]
(Annual)Therms [4] (Annual)
Expenses ($) [7]% of
ExpenditureUnits
Quantity Installed
kWh[4] (Annual)
kW[4] (Annual)
Therms[4] (Annual)
Expenses ($) % of
ExpenditureUnits
Quantity Installed
kWh[4] (Annual)
kW[4] (Annual)
Therms[4] (Annual)
Expenses ($) % of
ExpenditureUnits
Quantity Installed
kWh[4] (Annual)
kW[4] (Annual)
Therms[4] (Annual)
Expenses ($)
% of Expenditure
Appliances (K+S) (L+T) (M+U) (N+V) (O+W)
High Efficiency Clothes Washer Each 47 489 0 839 45,159 1.1% Each 8 185 0 136 7,804$ 0.5% Each 39 304 0 703 37,355$ 1.5% EachRefrigerator Each 175 106,182 13 - 158,264 3.8% Each 51 32,498 4 - 47,417$ 2.8% Each 124 73,684 9 - 110,848$ 4.4% EachMicrowave [5] Each - - - - - 0.0% Each - - - - -$ 0.0% Each - - - - -$ 0.0% EachDomestic Hot WaterOther Domestic Hot Water[3] Home 1,680 10,210 1 5,061 137,320 3.3% Home 668 4,085 1 2,041 55,884$ 3.3% Home 1,012 6,125 1 3,020 81,436$ 3.3% HomeWater Heater Tank and Pipe Insulation Home 234 - - 200 15,091 0.4% Home 119 - - 104 7,914$ 0.5% Home 115 - - 96 7,177$ 0.3% HomeWater Heater Repair/Replacement Home 571 - - 13,390 292,823 7.0% Home 281 - - 5,965 107,207$ 6.4% Home 290 - - 7,425 185,617$ 7.5% HomeCombined Showerhead/TSV Home - - - - - 0.0% Home - - - - -$ 0.0% Home - - - - -$ 0.0% HomeNew - Heat Pump Water Heater Each - - - - - 0.0% Each - - - - -$ 0.0% Each - - - - -$ 0.0% EachNew - Tub Diverter/ Tub Spout Each 12 - - 24 1,264 0.0% Each 5 - - 10 527$ 0.0% Each 7 - - 14 737$ 0.0% EachNew - Thermostat-controlled Shower Valve Each - - - - - 0.0% Each - - - - -$ 0.0% Each - - - - -$ 0.0% EachEnclosure[1]Air Sealing Home 1,917 37,128 8 959 809,772 19.4% Home 816 21,840 5 490 354,382$ 21.1% Home 1,101 15,288 3 469 455,390$ 18.3% HomeCaulking Home - - - - - 0.0% Home - - - - -$ 0.0% Home - - - - -$ 0.0% HomeAttic Insulation Home 46 2,150 0 1,400 61,362 1.5% Home 24 860 0 770 33,896$ 2.0% Home 22 1,290 0 630 27,466$ 1.1% HomeHVACFAU Standing Pilot Conversion Each - - - - - 0.0% Each - - - - -$ 0.0% Each - - - - -$ 0.0% EachFurnace Repair/Replacement Each 693 - - (12,945) 830,438 19.9% Each 306 - - (6,235) 262,584$ 15.6% Each 387 - - (6,710) 567,854$ 22.8% EachRoom A/C Replacement Each 55 (3,162) (1) - 60,136 1.4% Each 10 (1,116) (0) - 11,105$ 0.7% Each 45 (2,046) (0) - 49,031$ 2.0% EachCentral A/C replacement Each - - - - - 0.0% Each - - - - -$ 0.0% Each - - - - -$ 0.0% EachHeat Pump Replacement Each - - - - - 0.0% Each - - - - -$ 0.0% Each - - - - -$ 0.0% EachEvaporative Cooler (Replacement) Each - - - - - 0.0% Each - - - - -$ 0.0% Each - - - - -$ 0.0% EachEvaporative Cooler (Installation) Each - - - - - 0.0% Each - - - - -$ 0.0% Each - - - - -$ 0.0% EachDuct Test and Seal Home 63 - - 306 9,549 0.2% Home 35 - - 174 5,272$ 0.3% Home 28 - - 132 4,277$ 0.2% HomeNew - Energy Efficient Fan Control Home - - - - - 0.0% Home - - - - -$ 0.0% Home - - - - -$ 0.0% HomeNew - Prescriptive Duct Sealing Home - - - - - 0.0% Home - - - - -$ 0.0% Home - - - - -$ 0.0% HomeNew - High Efficiency Forced Air Unit (HE FAU) Home - - - - - 0.0% Home - - - - -$ 0.0% Home - - - - -$ 0.0% HomeNew - A/C Time Delay Home - - - - - 0.0% Home - - - - -$ 0.0% Home - - - - -$ 0.0% HomeNew - Smart Thermostat Home 105 13,618 - 657 43,860 1.1% Home 58 7,491 - 374 24,140$ 1.4% Home 47 6,127 - 283 19,720$ 0.8% HomeMaintenanceFurnace Clean and Tune Home 731 - - (1,431) 59,686 1.4% Home 347 - - (759) 29,150$ 1.7% Home 384 - - (672) 30,536$ 1.2% HomeCentral A/C Tune up Home - - - - - 0.0% Home - - - - -$ 0.0% Home - - - - -$ 0.0% HomeLighting Interior Hard wired LED fixtures Each 1,718 7,267 1 (130) 144,243 3.5% Each 685 2,898 0 (53) 57,513$ 3.4% Each 1,033 4,370 1 (77) 86,731$ 3.5% EachExterior Hard wired LED fixtures Each 915 4,703 1 - 66,292 1.6% Each 443 2,277 0 - 32,095$ 1.9% Each 472 2,426 0 - 34,196$ 1.4% EachLED Torchiere Each 1,994 8,435 1 (151) 183,739 4.4% Each 798 3,376 0 (61) 73,009$ 4.3% Each 1,196 5,059 1 (90) 110,730$ 4.4% EachOccupancy Sensor Each - - - - - 0.0% Each - - - - -$ 0.0% Each - - - - -$ 0.0% EachLED Night Light Each - - - - - 0.0% Each - - - - - 0.0% Each - - - - -$ 0.0% EachNew - LED R/BR Lamps Each 2,249 6,792 1 (117) 36,446 0.9% Each 1,530 4,621 1 (78) 24,796$ 1.5% Each 719 2,171 0 (39) 11,651$ 0.5% EachNew - LED A-Lamps Each 24,639 52,235 6 (904) 363,722 8.7% Each 12,463 26,422 3 (444) 183,925$ 10.9% Each 12,176 25,813 3 (461) 179,797$ 7.2% EachMiscellaneousPool Pumps Each 1 - - - 1,937 0.0% Each - - - - -$ 0.0% Each 1 - - - 1,937$ 0.1% EachSmart Strip Each 458 64,120 9 - 23,375 0.6% Each 229 32,060 4 - 11,984$ 0.7% Each 229 32,060 4 - 11,390$ 0.5% EachSmart Strip Tier II Each 1,323 185,220 26 - 115,342 2.8% Each 622 87,080 12 - 55,984$ 3.3% Each 701 98,140 14 - 59,358$ 2.4% EachPilots
0.0% 0.0%Customer EnrollmentESA Outreach & Assessment Home 4,630 571,069$ 13.7% Home 2,027 - - - 232,507$ 13.8% Home 2,603 - - - 338,562$ 13.6% HomeESA In-Home Energy Education Home 4,636 140,613$ 3.4% Home 2,027 - - - 61,396$ 3.7% Home 2,609 - - - 79,217$ 3.2% Home
Total Savings/Expenditures 495,387 66 7,158 4,171,503$ 224,575 30 2,434 1,680,489.16$ 270,811 36 4,723 2,491,014$ - - - -$
Total Households Weatherized [2] 1,931 822 1,109 -
Households Treated Total (K+S) First Touches Re-treated Homes/Go-Backs Aliso Canyon
- Single Family Households Treated Home 1,683 Home 976 Home 707 Home
- Multi-family Households Treated Home 2,258 Home 720 Home 1,538 Home
- Mobile Homes Treated Home 525 Home 278 Home 247 HomeTotal Number of Households Treated Home 4,466 Home 1,974 Home 2,492 Home# Eligible Households to be Treated for PY [3] Home 5,973 Home N/A Home N/A Home% of Households Treated % 75% % N/A % N/A % - Master-Meter Households Treated Home 269 Home 90 Home 179 Home
[3] Based on OP 79 of D.16-11-022.
[5] Microwaves are no longer part of SDG&E's program measure offerings.[6] Data for Aliso Canyon includes "First Touches and Re-Treatments". [7] Current Month Expenses for Energy Efficiency Total does not include January accrual and re-accrual of $436,767 in the following reporting categories:
Note: Any required corrections/adjustments are reported herein and supersede results reported in prior months and may reflect YTD adjustments.
[1] Envelope and Air Sealing Measures may include outlet cover plate gaskets, attic access weatherization, weatherstripping - door, caulking and minor home repairs. Minor home repairs predominantly are door jamb repair / replacement, door repair, and window putty.
[2] Weatherization may consist of attic insulation, attic access weatherization, weatherstripping - door, caulking, & minor home repairs.
[4] All savings are calculated based on the following sources:Savings estimates are sourced from the PY2015 to 2017 ESA Impact Evaluation; Energy Division instructed the IOUs to use these results for 2019 and 2020 savings estimates.
Year-To-Date Completed & Expensed Installation Year-To-Date Completed & Expensed InstallationESA Program (Aliso Canyon - SCG & SCE) [6]
Energy Savings Assistance Program Table 2SDG&E
May 2021
ESA Program (Summary)Total ESA Program (First Touch Homes Treated) ESA Program (Re-Treated Homes/Go Backs)Year-To-Date Completed & Expensed InstallationYear-To-Date Completed & Expensed Installation
23 / 36
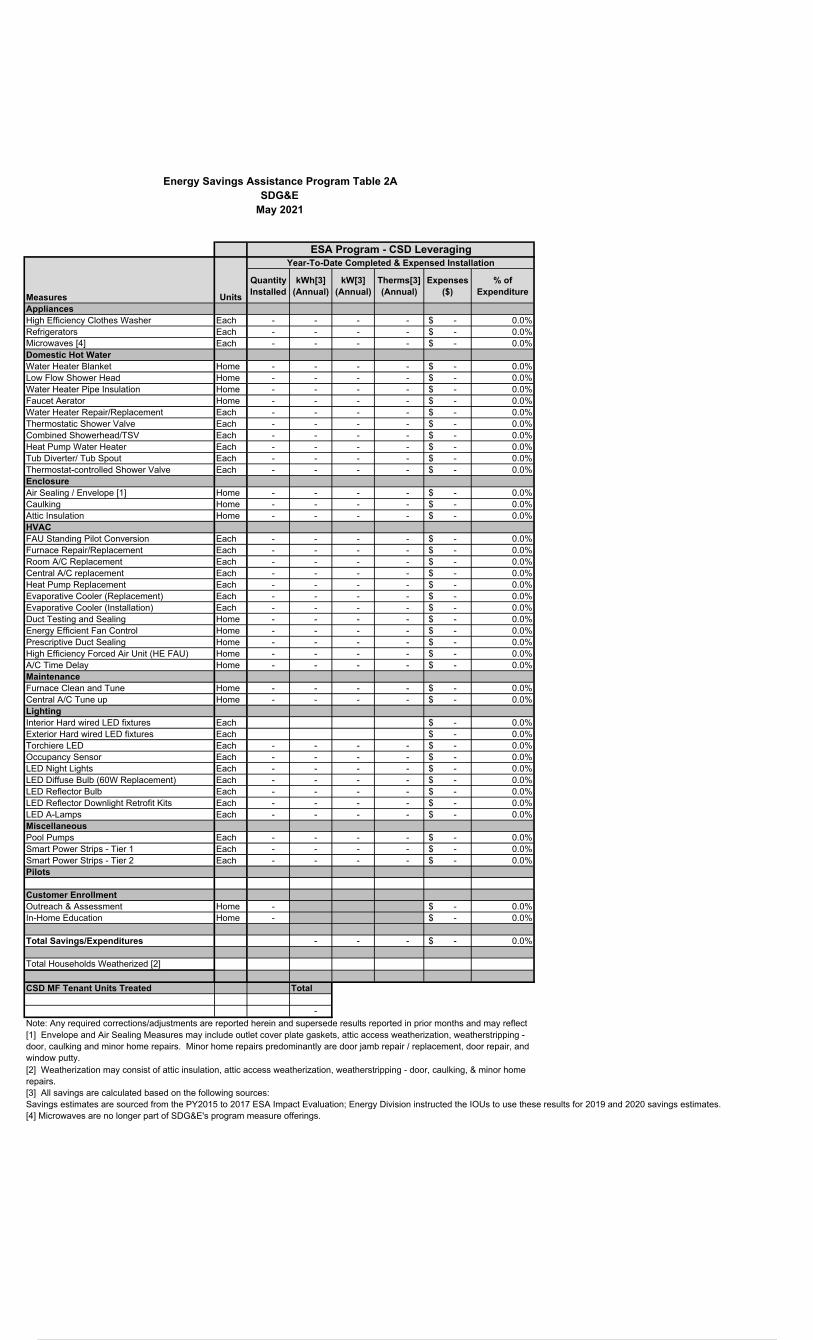
Measures Units
Quantity Installed
kWh[3] (Annual)
kW[3] (Annual)
Therms[3] (Annual)
Expenses ($)
% of Expenditure
AppliancesHigh Efficiency Clothes Washer Each - - - - -$ 0.0%Refrigerators Each - - - - -$ 0.0%Microwaves [4] Each - - - - -$ 0.0%Domestic Hot WaterWater Heater Blanket Home - - - - -$ 0.0%Low Flow Shower Head Home - - - - -$ 0.0%Water Heater Pipe Insulation Home - - - - -$ 0.0%Faucet Aerator Home - - - - -$ 0.0%Water Heater Repair/Replacement Each - - - - -$ 0.0%Thermostatic Shower Valve Each - - - - -$ 0.0%Combined Showerhead/TSV Each - - - - -$ 0.0%Heat Pump Water Heater Each - - - - -$ 0.0%Tub Diverter/ Tub Spout Each - - - - -$ 0.0%Thermostat-controlled Shower Valve Each - - - - -$ 0.0%EnclosureAir Sealing / Envelope [1] Home - - - - -$ 0.0%Caulking Home - - - - -$ 0.0%Attic Insulation Home - - - - -$ 0.0%HVACFAU Standing Pilot Conversion Each - - - - -$ 0.0%Furnace Repair/Replacement Each - - - - -$ 0.0%Room A/C Replacement Each - - - - -$ 0.0%Central A/C replacement Each - - - - -$ 0.0%Heat Pump Replacement Each - - - - -$ 0.0%Evaporative Cooler (Replacement) Each - - - - -$ 0.0%Evaporative Cooler (Installation) Each - - - - -$ 0.0%Duct Testing and Sealing Home - - - - -$ 0.0%Energy Efficient Fan Control Home - - - - -$ 0.0%Prescriptive Duct Sealing Home - - - - -$ 0.0%High Efficiency Forced Air Unit (HE FAU) Home - - - - -$ 0.0%A/C Time Delay Home - - - - -$ 0.0%MaintenanceFurnace Clean and Tune Home - - - - -$ 0.0%Central A/C Tune up Home - - - - -$ 0.0%Lighting Interior Hard wired LED fixtures Each -$ 0.0%Exterior Hard wired LED fixtures Each -$ 0.0%Torchiere LED Each - - - - -$ 0.0%Occupancy Sensor Each - - - - -$ 0.0%LED Night Lights Each - - - - -$ 0.0%LED Diffuse Bulb (60W Replacement) Each - - - - -$ 0.0%LED Reflector Bulb Each - - - - -$ 0.0%LED Reflector Downlight Retrofit Kits Each - - - - -$ 0.0%LED A-Lamps Each - - - - -$ 0.0%MiscellaneousPool Pumps Each - - - - -$ 0.0%Smart Power Strips - Tier 1 Each - - - - -$ 0.0%Smart Power Strips - Tier 2 Each - - - - -$ 0.0%Pilots
Customer EnrollmentOutreach & Assessment Home - -$ 0.0%In-Home Education Home - -$ 0.0%
Total Savings/Expenditures - - - -$ 0.0%
Total Households Weatherized [2]
CSD MF Tenant Units Treated Total
-
Energy Savings Assistance Program Table 2ASDG&E
ESA Program - CSD LeveragingYear-To-Date Completed & Expensed Installation
[1] Envelope and Air Sealing Measures may include outlet cover plate gaskets, attic access weatherization, weatherstripping - door, caulking and minor home repairs. Minor home repairs predominantly are door jamb repair / replacement, door repair, and window putty.[2] Weatherization may consist of attic insulation, attic access weatherization, weatherstripping - door, caulking, & minor home repairs.[3] All savings are calculated based on the following sources:
Note: Any required corrections/adjustments are reported herein and supersede results reported in prior months and may reflect
May 2021
[4] Microwaves are no longer part of SDG&E's program measure offerings.Savings estimates are sourced from the PY2015 to 2017 ESA Impact Evaluation; Energy Division instructed the IOUs to use these results for 2019 and 2020 savings estimates.
24 / 36

ESA CAM Measures[1]
Units (of Measure such as
"each")Quantity Installed
Number of Units for Cap-kBTUh and Cap-Tons
kWh (Annual) kW (Annual) Therms (Annual) Expenses ($) % of Expenditure
Appliances
Domestic Hot WaterCentral Boiler** Cap-kBTUh 1,100 2 ‐ ‐ 3,408 54,581$ Faucet Aerator Each 14 325 0 19 110$ Pipe Insulation Home 1 ‐ ‐ 8 286$ Envelope
HVAC
AC Tune-up** Cap‐Tons 5 72 0 ‐ 619$ Furnace Replacement** Cap‐kBTUh ‐ ‐ ‐ ‐ ‐ ‐$ HEAT Pump Split System** Cap‐Tons ‐ ‐ ‐ ‐ ‐ ‐$ HEAT Pump Split System Each 4 162 0 (0) 14,105$ Programmable Thermostat Each ‐ ‐ ‐ ‐ ‐ ‐$ Lighting
Exterior LED Lighting Fixture 770 51,500 ‐ ‐ 140,076$ Exterior LED Lighting - Pool Lamp ‐ ‐ ‐ ‐ ‐ ‐$ Interior LED Exit Sign Fixture ‐ ‐ ‐ ‐ ‐ ‐$ Interior LED Fixture Fixture 905 170,209 41 (323) 106,487$ Interior LED Lighting KiloLumen 329 7,667 2 (1) 32,986$ Interior LED Screw-in Lamp 211 3,953 1 (14) 2,393$ Interior TLED Type A Lamps Lamp 330 12,406 3 (60) 4,290$ Interior TLED Type C Lamps Lamp 557 20,940 5 (149) 15,512$ Miscellaneous
Tier-2 Smart Power Strip EachVariable Speed Pool Pump EachAncillary ServicesAudit4 11 14,850$
Total - 4,237 267,233 52 2,888 386,294$
Multifamily Properties Treated Number
Total Number of Multifamily Properties Treated2 14Subtotal of Master-metered Multifamily Properties Treated 4
Total Number of Multifamily Tenant Units w/in
Properties Treated3 1160
[3] All savings are calculated based on the following sources:
** Note: This represents the unit of measure such as Cap Tons and Cap kBTUh. It is not a count of each measure installed or each home the measure was intalled in.
* Note: Applicable to Deed-Restricted, government and non-profit owned multi-family buildings described in D.16-11-022 where 65% of tenants are income eligible based on CPUC income Note: Any required corrections/adjustments are reported herein and supersede results reported in prior months and may reflect YTD adjustments.Note: Implementation of the MF CAM Initiative AL 3196-E-A_2654-G-A was approved effective 5/30/2018.
[1] Envelope and Air Sealing Measures may include outlet cover plate gaskets, attic access weatherization, weatherstripping - door, caulking and minor home repairs. Minor home repairs predominantly are door jamb repair / replacement, door repair, and window putty.[2] Weatherization may consist of attic insulation, attic access weatherization, weatherstripping - door, caulking, & minor home repairs.
[4] Per D.16-11-022 at p.210, the CPUC imposes a cap of 10% on ESA CAM Initiative funds for administrative activities and a ceiling of 20% for direct implementation non-incentive costs.[5] Refers to optimizing the installation of the measure installed such as retrofitting pipes, etc.
Savings estimates are sourced from the PY2015 to 2017 ESA Impact Evaluation; Energy Division instructed the IOUs to use these results for 2019 and 2020 savings estimates.
Energy Savings Assistance Common Area Measures Program Table 2B
SDG&E
Table 2B ESA Program - Multifamily Common Area Measures5
Year-To-Date Completed & Expensed Installation
May 2021
25 / 36

Common Area Measures Category and Eligible Measures Title [1]
Effective Date End Date[2] Eligible Climate Zones [3]
Appliances
Domestic Hot WaterPipe Insulation 18-May 6, 7, 8, 10, 14, 15Faucet Aerator 18-May 6, 7, 8, 10, 14, 15Central Boiler 18-May 6, 7, 8, 10, 14, 16
Envelope
HVACAC Tune-up 18-May 6, 7, 8, 10, 14, 15Furnace Replacement 18-May 6, 7, 8, 10, 14, 15HEAT Pump Split System 18-May 6, 7, 8, 10, 14, 15HEAT Pump Split System 18-May 6, 7, 8, 10, 14, 15Programmable Thermostat 18-May 6, 7, 8, 10, 14, 15
LightingExterior LED Lighting 18-May 6, 7, 8, 10, 14, 15Interior LED Lighting 18-May 6, 7, 8, 10, 14, 15Interior TLED Type A Lamps 18-May 6, 7, 8, 10, 14, 15Interior TLED Type C Lamps 18-May 6, 7, 8, 10, 14, 15Interior LED Exit Sign 18-May 6, 7, 8, 10, 14, 15Interior LED Fixture 18-May 6, 7, 8, 10, 14, 15Interior LED Screw-in 18-May 6, 7, 8, 10, 14, 15Exterior LED Lighting - Pool 18-May 6, 7, 8, 10, 14, 15
MiscellaneousTier-2 Smart Power Strip 18-May 6, 7, 8, 10, 14, 15Variable Speed Pool Pump 18-May 6, 7, 8, 10, 14, 15
Standard Notes (do not delete)
Energy Savings Assistance CAM Program Table 2B-1, Eligible Common Area Measures List
2. Only complete if measure is canceled or discontinued 3. Defined as CEC California Building Climate Zones https://www.energy.ca.gov/maps/renewable/building_climate_zones.html
SDG&EMay 2021
1. Measures list may change based on available information on both costs and benefits (including energy benefits as well as non-energy benefits) and may vary across climate zones. This is not a list of installed measures, it is a list of eligible measures. Table 2B-1 Column A should match Table 2B Column A for eligible (not canceled) measures.
26 / 36
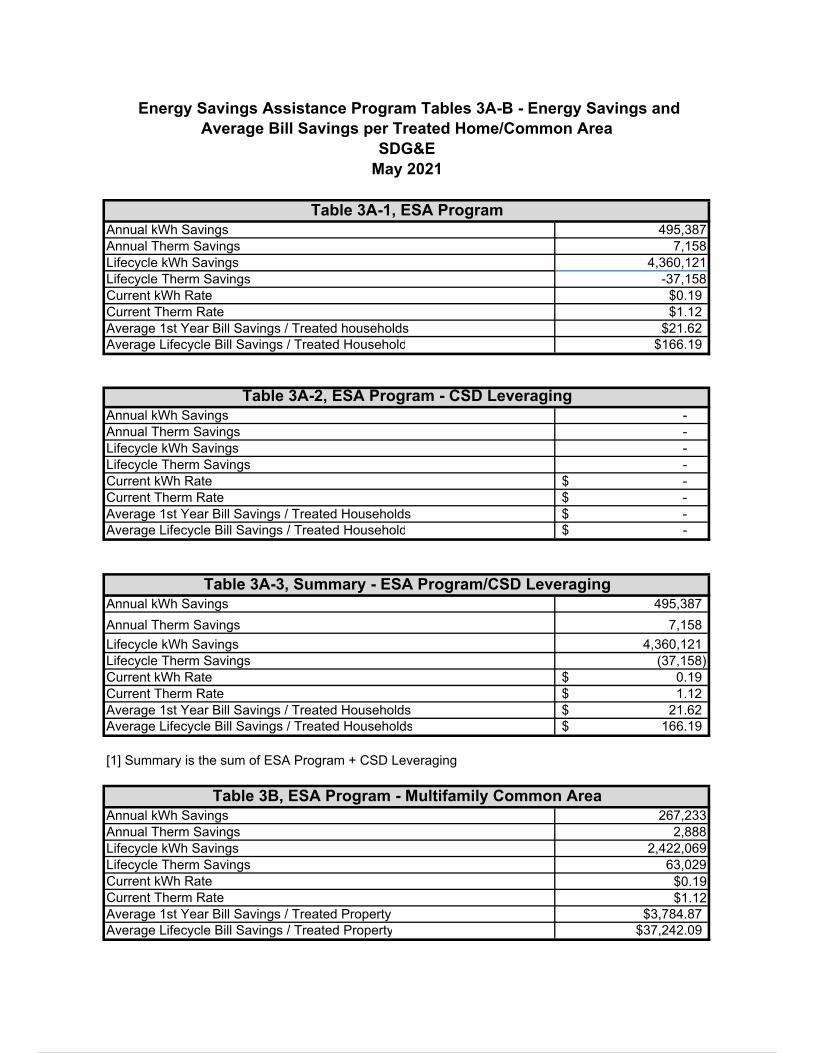
Annual kWh Savings 495,387Annual Therm Savings 7,158Lifecycle kWh Savings 4,360,121Lifecycle Therm Savings -37,158Current kWh Rate $0.19Current Therm Rate $1.12Average 1st Year Bill Savings / Treated households $21.62Average Lifecycle Bill Savings / Treated Household $166.19
Annual kWh Savings - Annual Therm Savings - Lifecycle kWh Savings - Lifecycle Therm Savings - Current kWh Rate -$ Current Therm Rate -$ Average 1st Year Bill Savings / Treated Households -$ Average Lifecycle Bill Savings / Treated Household -$
Annual kWh Savings 495,387
Annual Therm Savings 7,158
Lifecycle kWh Savings 4,360,121 Lifecycle Therm Savings (37,158) Current kWh Rate 0.19$ Current Therm Rate 1.12$ Average 1st Year Bill Savings / Treated Households 21.62$ Average Lifecycle Bill Savings / Treated Households 166.19$
Annual kWh Savings 267,233Annual Therm Savings 2,888Lifecycle kWh Savings 2,422,069Lifecycle Therm Savings 63,029Current kWh Rate $0.19 Current Therm Rate $1.12 Average 1st Year Bill Savings / Treated Property $3,784.87Average Lifecycle Bill Savings / Treated Property $37,242.09
Table 3B, ESA Program - Multifamily Common Area
Table 3A-1, ESA Program
[1] Summary is the sum of ESA Program + CSD Leveraging
Table 3A-3, Summary - ESA Program/CSD Leveraging
Energy Savings Assistance Program Tables 3A-B - Energy Savings and Average Bill Savings per Treated Home/Common Area
May 2021SDG&E
Table 3A-2, ESA Program - CSD Leveraging
27 / 36

County Rural [1] Urban Total Rural Urban TotalOrange 0 19 19 0 0 0San Diego 226 4,221 4,447 0 0 0Total 226 4,240 4,466 0 0 0
County Rural Urban TotalOrange 0San Diego 0 0Total 0 0 0
- - - TotalOrange - - - - - -San Diego - - - - 14 14Total 14 14
*Do not currently have Eligible Properties for ESA CAM.
Table 4B, ESA Program - CSD Leveraging
[1] For IOU low income-related and Energy Efficiency reporting and analysis, the Goldsmith definition is applied.
Note: Any required corrections/adjustments are reported herein and supersede results reported in prior months and may reflect YTD adjustments.
Households Treated YTD
* Properties Treated YTDTable 4C, ESA Program - Multifamily Common Area
Energy Savings Assistance Program Table 4 - Homes/Buildings TreatedSDG&E
May 2021
Eligible Households Households Treated YTDTable 4A-1, ESA Program
28 / 36

County
Customer Unwilling/Declined Program Measures
Customer Unavailable -Scheduling Conflicts
Hazardous Environment
(unsafe/unclean)
Landlord Refused to Authorize
Participation
Household Exceeds
Allowable Limits
Unable to Provide Required
Documentation
Other Infeasible/ Ineligible
Orange 65 21 1 0 61 0 13San Diego 3,397 4,311 7 0 1,913 150 423Total 3,462 4,332 8 0 1,974 150 436
Note: Any required corrections/adjustments are reported herein and supersede results reported in prior months and may reflect YTD adjustments.
Reason Provided
Energy Savings Assistance Program Table 4A-2, Homes Unwilling / Unable to Participate
SDG&EMay 2021
ESA Program
29 / 36

Therm kWh kW Therm kWh kW Therm kWh kW# of First-
Touch# of Re-
treatment Therm kWh kWJanuary 57 244 21,476 3 - - - - 1 - 1,734 0 58 30 28 244 23,209 3 February 515 1,781 81,842 11 - - - - 28 - 8,279 1 543 242 301 1,781 90,121 12 March 1,617 1,796 153,039 20 - - - - 108 - 15,526 2 1,725 851 874 1,796 168,565 22 April 1,060 678 94,752 13 - - - - 77 - 8,028 1 1,137 475 662 678 102,780 14 May 918 2,659 99,773 13 - - - - 85 - 10,939 1 1,003 376 627 2,659 110,711 15 June - - - - - - - - July - - - - - - - - August - - - - - - - - September - - - - - - - - October - - - - - - - - November - - - - December - - - - YTD 4,167 7,158 450,881 60 - - - - 299 - 44,505 6 4,466 1,974 2,492 7,158 495,387 66
Therm kWh kW Therm kWh kW Therm kWh kW Therm kWh kWJanuaryFebruaryMarchAprilMayJuneJulyAugustSeptemberOctoberNovemberDecemberYTD - - - - - - - - - - - - - - - 0
Therm kWh kW Therm kWh kW Therm kWh kW Therm kWh kWJanuary 1 (130) 13,195 3 - - - - 3 - 55,395 9 4 (130) 68,590 12 February - - - - - - - - - - - - - - - - March 5 3,113.48 111,305.54 23.99 - - - - - - 0 0 5 3,113 111,306 24 April[1] - - 221.40 - - - - - 3 - 21,040.51 2.22 3 - 21,262 2 May 1 (95.65) 30,980.11 5.44 - - - - 1 - 35,095.08 8.55 2 (96) 66,075 14 June - - - - - - - - July - - - - - - - - August - - - - - - - - September - - - - October - - - - - - - - November - - - - - - - - December - - - - - - - - YTD 7 2,888 155,703 33 - - - - 7 - 111,530 19 14 2,888 267,233 52
[1] April expenses for Gas & Electric CAM participant(s) are for a March treated property
Electric Only Total
Note: Any required corrections/adjustments are reported herein and supersede results reported in prior months and may reflect YTD adjustments.
Note: SDG&E tracks the measure savings based on the month and year of install. Households treated can have a value of zero, meaning the treated date is from a previous year but the measure install and savings were tracked in a new Program Year.
Table 5B, ESA Program - CSD Leveraging
Note: Any required corrections/adjustments are reported herein and supersede results reported in prior months and may reflect YTD adjustments.YTD Total Energy Impacts for all fuel types should equal YTD energy impacts that are reported every month Table 2B.
(Annual) (Annual) (Annual) (Annual)
Month
YTD Total Energy Impacts for all fuel types should equal YTD energy impacts that are reported every month Table 2A.
Month
Gas & Electric Gas Only Electric Only Total# of
Properties Treated by
Month
(Annual) (Annual)
SDG&EMay 2021
Table 5C, ESA Program - Multifamily Common Area
# of Properties Treated by
Month
(Annual) # of Properties Treated by
Month
(Annual)
Total
# of Household Treated by
Month
# of Household Treated by
Month
# of Household Treated by
Month
# of Household Treated by
Month
# of Household Treated by
Month
YTD Total Energy Impacts for all fuel types should equal YTD energy impacts that are reported every month Table 2.
Gas & Electric Gas Only
Table 5A, ESA Program
(Household Count)
# of Properties Treated by
Month
Note: Any required corrections/adjustments are reported herein and supersede results reported in prior months and may reflect YTD adjustments.
Energy Savings Assistance Program Table 5 - Energy Savings Assistance Program Customer Summary
Month
# of Household Treated by
Month
# of Household Treated by
Month
(Annual) (Annual) (Annual)(Annual)# of
Household Treated by
Month
Gas & Electric Electric OnlyGas Only
30 / 36

Electric Gas Total Electric Gas Total Electric Gas Total Electric Gas TotalPilotsProgrammable Communicating Thermostat (PCT) -$ -$ -$ $ - $ - -$ -$ -$ -$ 0% 0% 0%
Total Pilots $ - $ - $ - $ - $ - 0% 0% 0%
StudiesLow Income Needs Assessment Study -$ -$ -$ -$ -$ -$ -$ $ - -$ 0% 0% 0%Load Impact Evaluation Study -$ -$ -$ -$ -$ -$ -$ $ - -$ 0% 0% 0%Equity Criteria and Non Energy Benefits Evaluation (NEB's) -$ -$ -$ -$ -$ -$ -$ $ - -$ 0% 0% 0%Unallocated Funds -$ -$ -$ -$ -$ -$ -$ $ - -$ 0% 0% 0%2017 Potential and Goals Study -$ -$ -$ -$ -$ -$ -$ $ - -$ 0% 0% 0%Rapid Feedback Research and Analysis 54,340$ 54,340$ 108,680$ 6,204$ 6,204$ 12,409$ 8,237$ $ 8,237 16,474$ 15% 15% 15%
Total Studies $ 54,340 $ 54,340 $ 108,680 $ 6,204 $ 6,204 $ 12,409 $ 8,237 $ 8,237 $ 16,474 15% 15% 15%
Note: Any required corrections/adjustments are reported herein and supersede results reported in prior months and may reflect YTD adjustments.
Energy Savings Assistance Program Table 6 - Expenditures for Pilots and Studies
May 2021SDG&E
Authorized 2021 Funding [1] Current Month Expenses Year to Date Expenses % of Budget Expensed
[1] Reflects unspent funds remaning from 2017-2020 cycle. [Table 1A].
31 / 36
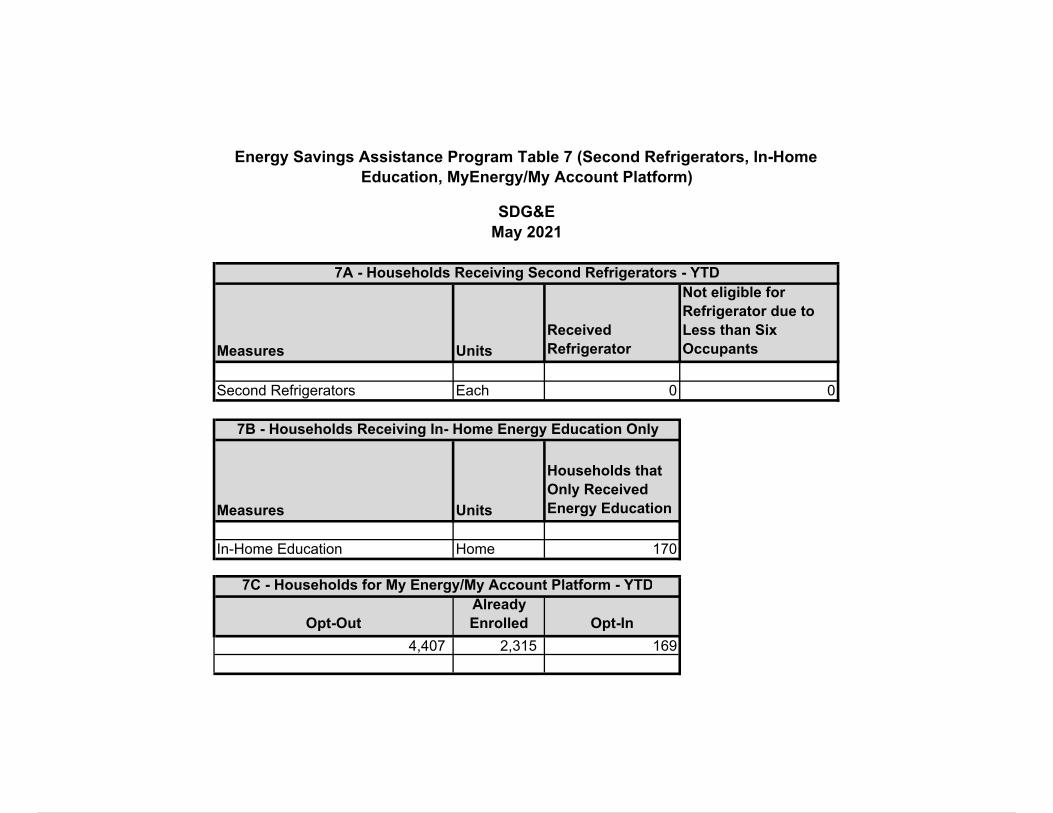
Measures Units
Received Refrigerator
Not eligible for Refrigerator due to Less than Six Occupants
Second Refrigerators Each 0 0
Measures Units
Households that Only Received Energy Education
In-Home Education Home 170
Opt-OutAlready Enrolled Opt-In
4,407 2,315 169
Energy Savings Assistance Program Table 7 (Second Refrigerators, In-Home Education, MyEnergy/My Account Platform)
SDG&EMay 2021
7A - Households Receiving Second Refrigerators - YTD
7B - Households Receiving In- Home Energy Education Only
7C - Households for My Energy/My Account Platform - YTD
32 / 36

Energy Savings Assistance Program Table 8 - Contractor Advanced Funding and RepaymentSDG&EMay 2021
B-C E x F (B)-(cumulative H + cumulative I)
Total Advanced Amount[7]
Total Advance Eligible for PPRS
Credit [1]
Total Advance Not Eligible for PPRS Credit
Percentage for PPRS Credit
Calculation [2]
Total Contractor
Invoices each month[3,8]
Total PPRS Credit Earned each month[4]
PPRS Credits
Applied each month [5]
Non PPRS Payments Applied each month[6]
Total Advances Outstanding
Jan-20 $0 $ - $ - $ - $ - $ - Feb-20 $0 $ - $ - $ - $ - $ - Mar-20 $0 $ - $ - $ - $ - $ - Apr-20 $ 552,731 $ - $ - $ - $ - $ 552,731
May-20 $ 411,190 $ - $ - $ - $ 87,672 $ 876,249 Jun-20 $ 205,120 $ - $ - $ - $ 53,278 $ 1,028,091 Jul-20 $ - $ - $ - $ - $ 33,550 $ 994,541
Aug-20 $ - $ - $ - $ - 86,720$ $ 907,821 Sep-20 $ - $ - $ - $ - $ - $ 907,821 Oct-20 $ - $ - $ - $ - $ - $ 907,821 Nov-20 $ - $ - $ - $ - $ - $ 907,821 Dec-20 $ - $ 116,756 $ 44,731 $ - $ - $ 907,821 Jan-21 $ - $ 268,150 $ 107,260 $ - 20,001$ $ 887,820 Feb-21 $ - $ 657,155 $ 204,811 $ - $ 345,244 $ 542,577 Mar-21 $ - $ 420,113 $ 110,655 $ - $ 7,647.01 $ 534,930 Apr-21 $ - $ 97,454 $ 38,982 $ - $ 2,668.48 $ 532,261
May-21 $ - $ 159,178 $ 38,339 $ - $ 1,000.00 $ 531,261 Jun-21 $ - $ - $ - $ - $ - -$ Jul-21 -$ $ - $ - $ - $ - -$
Aug-21 -$ $ - -$ -$ $ - -$ Sep-21 -$ $ - -$ -$ -$ -$ Oct-21 -$ $ - -$ -$ -$ -$ Nov-21 -$ $ - -$ -$ -$ -$ Dec-21 -$ $ - -$ -$ -$
Total $1,169,041 $528,535 $640,506 40% 1,718,806$ 544,778$ -$ 637,780$ 531,261$
IOUs ‐ Do not delete footnotes 1‐6 below.
[1] Contractor labor and labor‐related costs. Post‐Pandemic Return to Service (PPRS) credit eligible. [2] 40% for PPRS credit calculation from Joint Tier 2 Advice Letter 5654‐G filed on June 29, 2020.
[4] Based on total monthly contractor invoices, up to maximum allowable for each contractor. Results may be less than 40% of invoiced due to contractors reaching maximum credit earned. [5] Credits may be applied at a later date than earned depending on the contractor repayment schedule. This value should not exceed column G.
[7] Advance funding provided to contractors in month occurred.[8] Excludes invoices for contractors previously earning full PPRS Credit Eligible amount.
Note: This table created pursuant to section 1.2.3 in Commission Resolution E‐5074. This report covers the period from the issuance of advances until the last day of the month reported. Any required corrections/adjustments are reported herein and supersede results reported in prior months.
[3] For work performed during PPRS credit‐earning period for contractors receiving advances. SDG&E PPRS earning period began December 1, 2020.
[6] Includes repayments processed for which PPRS credits were not applied, including contractor payments returned unused due to agreement termination or duplicate payments received from other funding sources.
$528,535 $640,506 40%
33 / 36

Authorized 2021 Budget2 Current Month Expenses Expenses Since Jan. 1, 2021 % of 2021 Budget ExpensedTotal Total Total Total
CHANGES Program 133,866$ 16,345$ 99,943$ 75%
Total 133,866$ 16,345$ 99,943$ 75%
CARE Program Table 9 - Expenditures for Pilots/CHANGES Program1
SDG&EMay 2021
NOTE: Any required corrections/adjustments are reported herein and supersede results reported in prior months and may reflect YTD adjustments.
2021
2. Budget authorized by the Commission in Decision 19-06-022.1. Decision 15-12-047 transitioned CHANGES pilot to CHANGES program and funding for the effort is captured herein.
34 / 36

CARE Table 10 CHANGES One-On-One Customer Assistance Sessions
San Diego Gas & ElectricReporting Period April 2021[1]
No. of attendees at education sessions 280Disputes
Add Level Pay Plan 0Assisted with CARE Re-Certification/Audit 0Changed 3rd party Company/Gas Aggregation 0Changed 3rd Party Electricity Aggregation 0Enroll in Energy Assistance Programs 1High Energy CARE User 0Medical Baseline Application 0Payment Extension 0Payment Plan 0Request Bill Adjustment 0Request Customer Service Visit 0Request Meter Service or Testing 0Schedule Energy Audit 0Solar 0Stop Disconnection 0Time of Use 0Wildfire Related Issue 0Total disputes [3] 1
Needs AssistanceAdd/Remove Level Pay Plan 0Arrearage Management Plan (AMP) 4Assisted with CARE Re-Certification/Audit 0Assisted with Changes to Account 2Assisted High Energy User with CARE Doc Submission 0Assisted with Reconnection 0Billing Language Changed 0CARE Enrollment 0Consumer Education Only 0Electricity Aggregation 0Energy Allerts 0Energy Efficiency Tool 0Enrolled in Demand Response Programs 0ESAP 0HEAP/LiHEAP 1Medical Baseline 0Neighbor to Neighbor 5Payment Extension 1Payment Plan 1Rate Plan Selection Assistance 1REACH 0Reported Safety Problem 0Reported Scam 0Set Up 3rd Party Notification 0Set Up New Account 1Wildfire Related Issue 0Total Needs Assistance [2] 16
[3] Per CHANGES Vendor: The total number of services may exceed the total number ofcases because some cases will include more than one service provided.
[1] There is a one-month lag behind the current reporting month. The data for May 2021 will be reported once received.
* Any required corrections/adjustments are reported herein and supersede results reported in prior months and may reflect YTD adjustments.
Education: Education sessions were held in a mix of one on one, and group sessions. Education materials are available as fact sheets on the CPUC Website: http://consumers.cpuc.ca.gov/team_and_changes/
Disputes & Needs Assistance -Support was provided in the following languages: Albanian, English, Farsi, French, Spanish, Vietnamese
[2] Contractor is in the process of validating the total. If there is a discrepancy in the numbers reported, the numbers will be corrected in the July 2021 report.
35 / 36
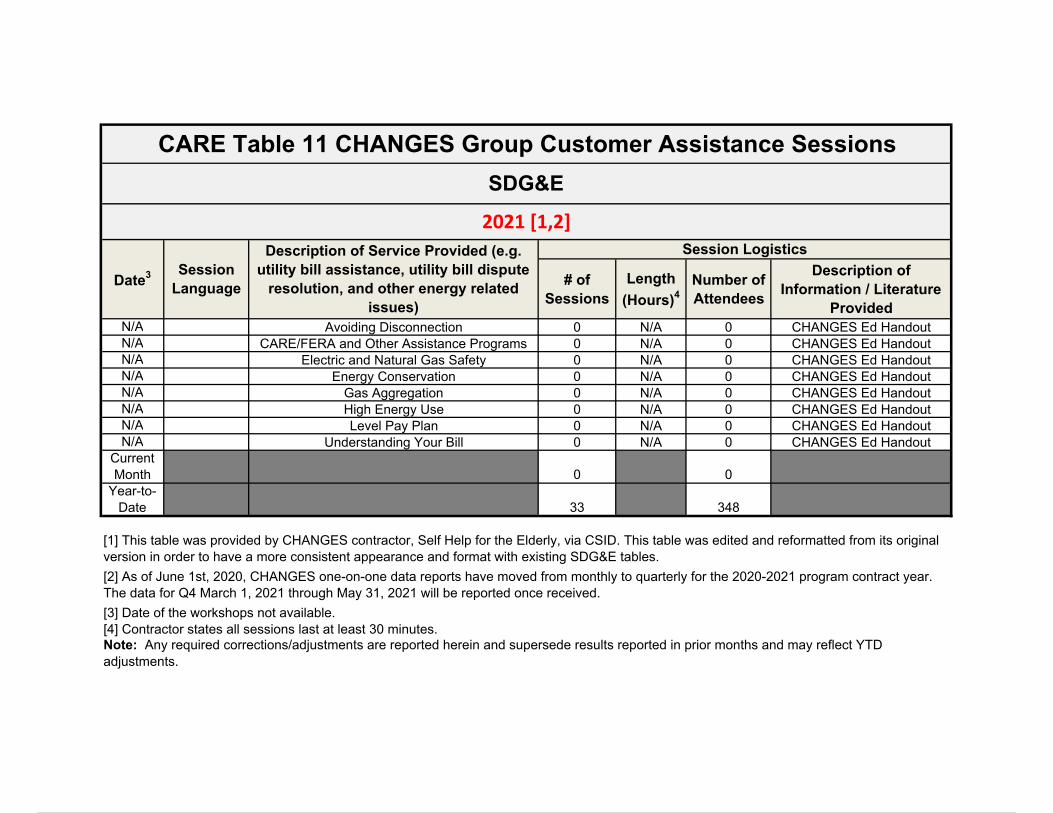
# of Sessions
Length
(Hours)4Number of Attendees
Description of Information / Literature
ProvidedN/A Avoiding Disconnection 0 N/A 0 CHANGES Ed HandoutN/A CARE/FERA and Other Assistance Programs 0 N/A 0 CHANGES Ed HandoutN/A Electric and Natural Gas Safety 0 N/A 0 CHANGES Ed HandoutN/A Energy Conservation 0 N/A 0 CHANGES Ed HandoutN/A Gas Aggregation 0 N/A 0 CHANGES Ed HandoutN/A High Energy Use 0 N/A 0 CHANGES Ed HandoutN/A Level Pay Plan 0 N/A 0 CHANGES Ed HandoutN/A Understanding Your Bill 0 N/A 0 CHANGES Ed Handout
Current Month 0 0
Year-to-Date 33 348
[1] This table was provided by CHANGES contractor, Self Help for the Elderly, via CSID. This table was edited and reformatted from its original version in order to have a more consistent appearance and format with existing SDG&E tables.
CARE Table 11 CHANGES Group Customer Assistance Sessions
SDG&E
2021 [1,2]
Date3 Session Language
Description of Service Provided (e.g. utility bill assistance, utility bill dispute
resolution, and other energy related issues)
Session Logistics
[2] As of June 1st, 2020, CHANGES one-on-one data reports have moved from monthly to quarterly for the 2020-2021 program contract year. The data for Q4 March 1, 2021 through May 31, 2021 will be reported once received.
[3] Date of the workshops not available.[4] Contractor states all sessions last at least 30 minutes.Note: Any required corrections/adjustments are reported herein and supersede results reported in prior months and may reflect YTD adjustments.
Powered by TCPDF (www.tcpdf.org)
36 / 36