old mutual limited isin: zae000255360 lei ...2018/08/31 · old mutual limited undertakes no...
TRANSCRIPT

Old Mutual Limited Incorporated in the Republic of South Africa Registration number: 2017/235138/06 ISIN: ZAE000255360 LEI: 213800MON84ZWWPQCN47 JSE Share Code: OMU NSX Share Code: OMM ("Old Mutual") NEWS RELEASE 31 August 2018 Ref: 38/18 Old Mutual Limited Unaudited Condensed Group Interim Results for the six months ended 30 June 2018 Peter Moyo, Old Mutual Limited Chief Executive, said: 'With our debut results as Old Mutual Limited, I am pleased to report that we are on track to deliver on the commitments we have made to investors. We delivered solid financial results in a tough environment and have made good progress against most of our 8 battlegrounds driven through deliberate management action. There is renewed momentum and excitement in the Group following our listing and this is captured in our new vibrant branding launched recently. Whilst we continue to see economic headwinds in the near term, our Group is resilient and we are on track with our financial targets.' Strong financial results(1): - Results from operations (RFO) of R4,848 million, up 7% (HY 2017: R4,530 million - Adjusted headline earnings (AHE) of R5,393 million, marginally up on prior year (HY 2017: R5,359 million - AHE per share of 112.3 cents per share, in line with prior year - IFRS profit after tax attributable to equity holders of the parent of R10,648 million up 42% (HY 2017: R7,503 million) mainly due to the accounting effects of the sale and distribution of Quilter shares - Declaring first interim dividend of 45 cents per share, representing 40% of AHE, in line with our dividend policy - Declaring special dividend of 100 cents per share - Funds under management (FUM) up 2% to R1.097 billion - Net client cash flow (NCCF) of R9.4 billion, an increase of R7.8 billion (HY 2017: R1.6 billion) - RoNAV of 17.5%, down from 19.4% reflecting lower investment returns. - Group solvency ratio of 164%, reflecting capital resilience of the Group Strategic delivery: - Good progress against the majority of our 8 battlegrounds with positive progress in the turnaround of Old Mutual Insure as well as strong sales in Corporate and Mass and Foundation Cluster - Successful listing of Old Mutual Limited on five stock exchanges on 26 June 2018, delivering the material completion of Managed Separation - Further steps have been taken to simplify the Group's balance sheet with the execution of a debt tender offer in July which reduced the nominal value of our international debt in Residual plc by R5 billion - We achieved approximately R270 million of recurring cost savings in the first half of 2018, incurring one off costs of R70 million. We remain on track to achieve our cost efficiency target of R1 billion of run rate savings by the end of 2019. - Due to complete the Nedbank unbundling as planned in Q4 2018. This will mark the completion of the Managed Separation announced in March 2016 - The distribution of Quilter delivered the majority of Quilter shares to Old Mutual plc shareholders and the successful sale of a portion of Quilter shares realised R4.2 billion of cash on the Residual plc balance sheet. Footnotes: (1) Comparatives or variances quoted against comparatives are consistent with or have been calculated based on the comparative data published by Old Mutual Limited on 7 August 2018 JSE Sponsor: Merrill Lynch South Africa (Pty) Limited Namibia Sponsor: PSG Wealth Management (Namibia) (Proprietary) Limited Enquiries Investor Relations: E: [email protected] Patrick Bowes T: +44 (0)7976 643377 E: [email protected] Mamosa Dlothi T: +27 (0)76 331 5240 E: [email protected] Communications: Tabby Tsengiwe T: +27 (11) 217 1953 M: +27 (0)60 547 4947 E: [email protected] Forward-looking statement This presentation may contain certain forward-looking statements with respect to certain of Old Mutual Limited plans and its current goals and expectations relating to its future financial condition, performance

and results and, in particular, estimates of future cash flows and costs. By their nature, all forward-looking statements involve risk and uncertainty because they relate to future events and circumstances which are beyond Old Mutual Limited control including amongst other things, South African domestic and global economic and business conditions, market related risks such as fluctuations in interest rates and exchange rates, the policies and actions of regulatory authorities, the impact of competition, inflation, deflation, the timing and impact of other uncertainties of future acquisitions or combinations within relevant industries, as well as the impact of tax and other legislation and other regulations in the jurisdictions in which Old Mutual Limited and its affiliates operate. As a result, Old Mutual Limited actual future financial condition, performance and results may differ materially from the plans, goals and expectations set forth in Old Mutual Limited forward looking statements. Old Mutual Limited undertakes no obligation to update the forward- looking statements contained in this presentation or any other forward-looking statements it may make. The financial figures and metrics included within this results booklet have not been audited or reported upon by the Group's auditors. Nothing in this presentation shall constitute an offer to sell or the solicitation of an offer to buy securities. Notes to Editors A webcast of the presentation on the Interim 2018 Results and Q&A will be broadcast live at 11am South African time today on the Company's website www.oldmutual.com. Analysts and investors who wish to participate in the call can do so using the numbers below: South Africa Neotel: +27 (0)11 535 3500 South Africa Telkom: +27 (0)10 201 6700 International: +27 (0)11 535 3500 UK: +44 (0)333 300 1418 USA and Canada: +1 508 924 4326 Pre-registration to participate in the call is available at the following link - https://bit.ly/2PKqncx About Old Mutual Limited Old Mutual is a premium African financial services group that offers a broad spectrum of financial solutions to retail and corporate customers across key market segments in 17 countries. Old Mutual's primary operations are in South Africa and the rest of Africa, and we have niche businesses in Latin America and Asia. With over 173 years of heritage across sub-Saharan Africa, we are a crucial part of the communities we serve and broader society on the continent. For further information on Old Mutual Limited, and its underlying businesses, please visit the corporate website at www.oldmutual.com. OVERVIEW On 26 June 2018, Old Mutual Limited listed on the Johannesburg Stock Exchange (JSE), with secondary listings also taking place on the same day in the United Kingdom, Namibia, Malawi and Zimbabwe. This momentous occasion marked the material completion of Managed Separation and the start of a new journey for Old Mutual Limited. We are making strides towards shaping our balance sheet through the acceleration of converting net asset value to cash in Residual plc and we are on track to complete the unbundling of 32% of Nedbank during the fourth quarter. Operating environment The first six months of 2018 were characterised by volatility in global equity, currency and bond markets due to escalating global trade tensions and the revived United States (US) economy. US Federal Reserve rate hikes and sporadic geopolitical issues adversely affected emerging markets. These global dynamics, in addition to weak local economic data, negatively affected the South African economic landscape, with GDP contracting by 2.2% in the first quarter. Persistently high unemployment rates, a Valued Added Tax (VAT) rate increase, and fuel hikes have contributed to lower real disposable incomes for local consumers. This adversely affected our customer acquisition and persistency, especially in the middle income market. The economic outlook has however improved relative to a year ago, when political uncertainty prevailed and credit downgrades led to an even weaker operating environment. The election of Cyril Ramaphosa as President of South Africa, a return to fiscal consolidation in the 2018 budget, and improvements in governance and accountability taking place at State Owned Entities (SOEs) have resulted in an increase in business and consumer confidence, although weighed-down by concerns around land expropriation without compensation. The South African equity market declined with the JSE SWIX down 6.3% since the start of the year, but 8.4% up on H1 2017 driven by improved investor sentiment in the second half of 2017. The rand weakened to R13.73 against the US dollar at the end of June 2018, a decline of 10.8% since the end of December 2017. This reflected US dollar strength and the emerging market sell-off. The average exchange rate however strengthened by 7% when compared to the prior year. This has had an adverse impact on the reported profits from the Rest of Africa, particularly Zimbabwe. Inflation continued to remain within the South African Reserve Bank (SARB) target range at a 12-month average of 4.5% in June 2018, lower than the average of 5.1% in the prior year. The inflation outlook is benign and expected to be closer to the upper end of the target range in the short to medium term due to upward pressures from effects such as rising utility, transport costs and oil prices. In Zimbabwe, the economy continues to recover from weak investor confidence, policy instability and a liquidity crisis. Political uncertainty remains a concern and contributed to the volatility experienced in the

Zimbabwean Stock Exchange which has affected our investment returns. Zimbabwe's National Election took place on 30 July 2018 with Emmerson Mnangagwa being elected as President by a narrow margin. It is too early to tell whether the new government can implement the structural and political reforms that are required to improve the economic and social conditions of the country. Kenya's economy reflects a more stable political landscape though our investment returns are still negatively affected by the volatility experienced towards the end of 2017. Nigeria and Ghana benefited from rising oil prices, which led to a moderate economic recovery in the West African region. Financial performance We delivered a solid set of overall financial results during this half year despite tough market conditions. Our top line growth was strong with excellent Net Client Cash Flow (NCCF) of R9.4 billion mainly reflecting good flows and significantly improved retention. Funds Under Management (FUM) of R1.1 trillion grew 2% from the end of December 2017, reflecting the impact of the strong NCCF, largely offset by lower asset values. Results from Operations (RFO) of R4,848 million increased by 7% over the period reflecting good operational performance. We delivered Adjusted Headline Earnings (AHE) of R5,393 million, a marginal increase of 1% above the prior period. On a per share basis AHE was 112.3 cents, flat relative to the prior period as a result of a small quantum of shares issued during the period that increased the weighted average number of shares. Return on Net Asset Value (RoNAV) of 17.5% was down from 19.4% reflecting an increase in average Adjusted IFRS equity. The Group SAM solvency ratio decreased marginally to 164% (FY 2017: 167%), largely as a result of the special dividend declared. Our battleground scorecard We remain committed to delivering value in the medium term through our strategic priorities which are defined through our eight battlegrounds. Defend South African Mass and Foundation Cluster market share in mass - Maintained strong sales in the mass market despite growing competition and corporate markets from existing and new entrants - Growth in branch footprint, number of ATMs and increased activity and volume of active Money Accounts Old Mutual Corporate - Umbrella life APE sales almost doubled compared to the prior period and we continue to build our pipeline of umbrella deals - Continued traction on actions taken to restore Group risk underwriting experience Defend and grow in - Improved pricing for certain product solutions to drive sales in the tough the South African economic environment personal finance market - Digital sales increased by more than 80% - Channels have contributed to strong sales in Wealth and Investments, Old Mutual Corporate and Old Mutual Insure * Sales below expectations , a number of initiatives have been launched to drive sales which include the launch of the Old Mutual Rewards programme * Worse mortality and morbidity experience in H1 2018 Improve the - Sustained investment performance - flagship retail Balanced Funds are now top quartile over one and five years competitiveness of - Higher NCCF and strong deal origination activity Wealth and Investments Continued turnaround - Improved underwriting margin - above the top end of the target range of Old Mutual Insure - Substantial completion of remediation and claims management processes - iWYZE delivered strong growth Turnaround East - Staff reorganisation completed in H1 2018 to optimise staffing levels and African business and eliminate duplication and is expected to drive savings going forward. improve returns across - Continued progress on turnaround in East Africa with property & the Rest of Africa casualty and life showing improvement, after allowing for the cost of the staff reorganisation - SADC continues to generate strong profit growth, particularly in Zimbabwe, Namibia and Malawi and this region is the main contributor to returns in rest of Africa Win the war for talent - We are attracting top talent into our business and continue to look at different ways of retaining talent - Progress has been made in improving the underwriting talent at Old

Mutual Insure, reinforcing our investment capability at Wealth and Investments and finalising the operating model in East Africa Refresh the technology - The primary focus of recent initiatives has been on building protection offering solutions in the Mass and Foundation Cluster and Personal Finance segments which are expected to be activated during 2019 - The digital transformation journey is progressing, focusing on driving digital engagements, sales and servicing for our customers and intermediaries Cost efficiency - To date we have saved approximately R270 million of recurring cost, leadership incurring one off costs of R70 million - On track to meet R1 billion cost target with many savings initiatives identified Nedbank unbundling We remain on track to complete the final step of Managed Separation through the distribution of 32% of Nedbank to our shareholders. We plan to do this in the fourth quarter of 2018. For every one hundred Old Mutual Limited shares at the point of distribution, shareholders will receive approximately three Nedbank shares. Further details will be communicated in due course. After the completion of the Nedbank unbunding we will own 19.9% of Nedbank in our shareholder funds. We view this as a long term investment and this ownership underpins significant commercial benefits we derive from the continuation of this relationship. Dividend We have declared an interim dividend of 45 cents per share. In accordance with our stated dividend policy, consideration has been given to the Group's underlying local cash generation, fungibility of earnings, targeted liquidity and solvency levels, business strategic requirements and market conditions. The interim dividend represents 40% of Adjusted Headline Earnings per share, in line with our dividend target. We are also pleased to declare a special dividend of 100 cents per share. Following a review of all capital available at 30 June 2018, and taking into account capital and liquidity projections to the end of the financial year we have identified excess capital available to pay a special dividend. In setting the quantum of the special dividend we have balanced the need to be efficient at the operating subsidiary level against remaining within the desired range for our Group Solvency ratio. These dividends will be paid on 16 October 2018. Further details of the timetable for the exchange rate conversion for dividends payable in currencies other than rand will be communicated in due course. Outlook In July, the SARB revised their 2018 GDP forecast for South Africa down to 1.2% from 1.7%, a reflection of a deteriorating outlook in SA. Recent announcements of foreign investments into SA as well as progress in improving the management of SOEs show potential for an economic turnaround, however this is likely to only take place in the medium to long term. The International Monetary Fund (IMF) forecast 3.4% growth for sub-Saharan Africa, with a revised forecast for Zimbabwe at 2.4% (up from less than 1%), and more than 2% growth in the East and West African countries we operate in. This presents the opportunity for our operations in those regions to grow their consumer base and product lines. Global growth is still expected to rise, assuming trade tensions and market risks do not result in a downturn that will affect global and local markets. In spite of the deteriorating SA growth outlook, the above macroeconomic risks and strong competitive pressures, we remain confident in delivering solid 2018 results mostly aligned with our previously communicated medium term targets. AHE will continue to be influenced by investment returns in South Africa and Zimbabwe. Peter Moyo CEO of Old Mutual Limited REVIEW OF FINANCIAL PERFORMANCE Group highlights % change H1 2018 H1 2017 (H1 18 vs. H1 FY 2017 Rm (unless otherwise indicated) 17) Key financial indicators Gross flows(1) 91,563 83,342 10% 173,317 Life APE sales(1) 5,810 5,139 13% 11,512 NCCF (Rbn)(1) 9.4 1.6 >100% 5.6 FUM (Rbn)(1,2) 1,097.0 1,033.6 2% 1,072.3 Results from Operations (RFO)(1) 4,848 4,530 7% 10,367 Adjusted Headline Earnings (AHE)(1) 5,393 5,359 1% 12,947 Return on net asset value (RoNAV)(1) (%) 17.5% 19.4% (190 bps) 22.9%

Free Surplus Generated from Operations(1) 3,471 3,306 5% 7,842 % of AHE converted to Free Surplus Generated 64% 62% 200 bps 61% Group Solvency ratio (%)(2),(3) 164% n/a (300 bps) 167% IFRS profit after tax attributable to equity holders of the parent 10,648 7,503 42% 14,372 Headline earnings (HE) 7,800 7,026 11% 13,144 Basic earnings per share (cents) 229.4 154.7 48% 304.7 Earnings per share (cents)(4) 112.3 112.3 0% 271.1 Interim Dividend per share (cents) 45 n/a n/a n/a Special Dividend per share (cents) 100 n/a n/a n/a (1) Comparatives have been restated to exclude Latin America and India (sold in October 2017) as these businesses have been classified as discontinued operations. (2) The % change has been calculated with reference to FY2017. (3) The Group solvency ratio includes Nedbank at 19.9% on a post unbundling basis. (4) WANS used in the calculation of Earnings per share is 4,801 million in H1 2018 (H1 2017: 4,771 million and FY 2017: 4,776 million) We delivered a solid set of financial results during this half year despite tough economic and consumer conditions. Our top line growth was strong with Life APE sales up by 13% and NCCF of R9.4 billion (HY 2017: R1.6 billion) mainly reflecting good gross flows from Wealth and Investments and Old Mutual Corporate and improved investment performance in Wealth and Investments resulting in significant improvement in the retention of client money. FUM of R1.1 trillion grew 2% from the end of December 2017, reflecting the impact of the strong NCCF, offset by lower investment returns. RFO of R4,848 million increased by 7% over the period reflecting good operational performance, particularly in Mass and Foundation Cluster, Old Mutual Insure and Rest of Africa. This was partially offset by worse mortality and morbidity experience in Personal Finance. We delivered AHE of R5,393 million, a marginal increase of 1% above the prior period. The growth in RFO and higher associate earnings in respect of the 19.9% stake in Nedbank were offset by lower investment returns in South Africa and Zimbabwe. On a per share basis AHE was 112.3 cents, flat compared to the prior period as a result of a small quantum of shares issued during the period impacting the weighted average number of shares (WANS). RoNAV of 17.5% was down from 19.4% reflecting an increase in Average adjusted IFRS Equity following the strong investment performance experience in H2 2017 and positive investment returns in H1 2018 on this higher equity base. We declared an interim dividend of 45 cents per share and a special dividend of 100 cents per share, resulting in a total of R7.1 billion being paid to our shareholders. The declaration of the special dividend has resulted in a deduction from our own funds, in line with SAM requirements to deduct the foreseeable dividend. This has resulted in a decrease in our Group solvency ratio to 164% from 167%. Accounting implications of Managed Separation Managed Separation resulted in the listings of Old Mutual Limited and Quilter. The majority of the shares in Quilter (86.6%) were distributed to existing Old Mutual plc shareholders alongside the sale of 9.6% to new shareholders. The listing of Old Mutual Limited was effected via a UK court scheme of arrangement which inserted Old Mutual Limited as the new holding company of the residual Old Mutual plc Group, after the Quilter distribution, by way of a share for share exchange. From an accounting perspective the transaction was treated as a reorganisation of an existing group. The insertion of a holding company between shareholders and an existing group does not result in any change in the economic substance of the reported group. As such, the financial statements of Old Mutual Limited have been prepared on a predecessor basis. Consequently, the current period results up to listing and the comparatives presented for Old Mutual Limited reflect the values from the consolidated financial statements of the previous Old Mutual plc Group with the exception of the equity structure that has been adjusted to reflect that of the new entity, being Old Mutual Limited. Refer to Note A1 in the interim financial statements for additional information. Other accounting impacts of Managed Separation include the recognition of a profit of R2,852 million in the consolidated results as a result of the distribution and sale of Quilter shares. Included within this profit is a loss on the recycling of foreign currency translation reserves of R394 million. The share for share exchange and the distribution of Quilter further led to an IFRS 2 accelerated vesting charge of R282 million recognised in the IFRS consolidated income statement. This is as a result of the modification of the underlying share awards subject to the existing share-based payment arrangements of Old Mutual plc Group. Supplementary Income Statement Rm H1 2018 H1 2017 % change Mass and Foundation Cluster 1,534 1,306 17% Personal Finance 918 1,394 (34%) Wealth and Investments 783 638 23% Old Mutual Corporate 854 800 7% Old Mutual Insure 370 200 85% Rest of Africa 478 368 30% Central expenses (89) (176) 49%

Results from Operations 4,848 4,530 7% Shareholder investment return 1,177 1,869 (37%) Finance costs (337) (286) (18%) Income from associates 1,379 1,036 33% Adjusted Headline Earnings before tax and non-controlling interests 7,067 7,149 (1%) Shareholder tax (1,566) (1,600) 2% Non-controlling interests (108) (190) 43% Adjusted Headline Earnings 5,393 5,359 1% RFO is the primary measure of the business performance of each of the operating segments. Activities related to the Group's capital structure and central costs form part of the Other Group Activities segment, to the extent that they are not managed as part of operating segments. Central Expenses Central expenses of R89 million (H1 2017: R176 million) decreased by 49%. As part of an increased effort to more accurately measure the economic contribution of each segment, project costs that were previously accounted for centrally have been allocated to segments in H1 2018. The allocation of project costs to segments to the extent that it did not relate to group activities is based on planned spend. Year to date project spend is lower than planned spend resulting in an over recovery in central expenses. This was offset by an increase in costs to establish reporting functions for Old Mutual Limited as a stand alone listed entity. Shareholder investment return % Rm H1 2018 H1 2017 FY 2017 change (H1 18 vs. H1 17) South Africa 568 604 1,849 (6%) Rest of Africa 609 1,265 3,071 (52%) Shareholder investment return 1,177 1,869 4,920 (37%) Shareholder investment return for H1 2018 was R1,177 million, a decline of R692 million, or 37%, from R1,869 million for H1 2017. The decrease is due to subdued equity returns in South Africa, impacting the protected equity holding and a normalisation of equity returns in Zimbabwe following strong equity performance in H1 2017. Finance costs Finance costs on long term debt that supports the capital structure of the Group increased to R337 million (H1 2017: R286 million) following the issuance of subordinated debt instruments to the nominal value of R500 million by Old Mutual Insure in November 2017. Overall higher interest rates experienced in South Africa over the last twelve months also contributed to the increase in finance cost, given OMLACSA has both fixed rate and floating rate bonds in issue. Income from associates Subsequent to the Nedbank unbundling, the Group will retain a minority shareholding of 19.9%, which will be managed as part of Other Group Activities and it has been included on this basis in AHE. Income from associates, as reflected in AHE, increased by 33% to R1,398 million (H1 2017: R1,049 million) as Ecobank Transnational Incorporated (ETI) returned to profitability which had a significant impact to Nedbank's headline earnings. Our investment in China is also managed as part of the Group's investment in associates. Reconciliation of AHE to IFRS profit after tax Rm H1 2018 H1 2017 % change Adjusted Headline Earnings 5,393 5,359 1% Investment return for Group equity and debt instruments in life funds(1) 620 106 >100% Impact of restructuring(2) (450) (81) >(100%) Discontinued operations(3) 4,536 4,198 8% Income from associates(4) (1,398) (1,049) (33%) Residual plc(3) (901) (1,507) 40% Headline earnings 7,800 7,026 11% Impairment of goodwill and other intangibles assets (21) (720) 97% Profit/(loss) on disposal of fixed assets 14 (12) >100% Profit on disposal of subsidiaries, associated undertakings and strategic investments 2,855 956 >100% Profit after tax for the financial period attributable to ordinary equity holders of the parent 10,648 7,250 47% Dividends on preferred securities - 253 (100%) Profit after tax for the financial period attributable to equity holders of the parent 10,648 7,503 42% (1) IFRS does not allow the recognition of investment returns on Group debt and equity instruments held by life policyholder funds, however, these returns are recognised in the valuation of the related policyholder liabilities. This creates a mismatch in IFRS, which is eliminated in

AHE. The movement is a function of the fair value movement for the period. (2) Represents the elimination of non-recurring expenses or income related to material acquisitions, disposals or a fundamental restructuring of the Group. These items are removed from AHE as they do not represent operating activities of the Group. Amounts in the current period largely reflect the accelerated vesting of the IFRS 2 charge as a result of the share for share exchange and the Quilter distribution. Current and comparative period include Managed Separation costs. (3) Comparatives as disclosed in the SENS announcement on 7 August 2018, have been represented to reclassify the results of Old Mutual Bermuda from Residual plc to discontinued operations. (4) AHE includes associate income in respect of 19.9% shareholding in Nedbank in order to reflect earnings from the continuing operations of the Group. This is removed as part of this reconciliation as the full earnings related to Nedbank are included in discontinued operations. Discontinued operations Nedbank Nedbank reported a strong performance in a domestic macroeconomic environment that remained challenging and volatile. HE increased 27.0% to R6,696 million, boosted by associate income from ETI returning to profitability, while the managed operations (excluding ETI earnings) produced headline earnings growth of 2.0% to R6,562 million, with slow revenue growth and slightly higher impairments offset by good cost management. Nedbank is classified as held for distribution and presented as part of the discontinued operations, notwithstanding the Group's stated plan to hold a minority shareholding of 19.9% in the issued share capital of Nedbank in its shareholder funds after the Nedbank unbundling. Post the Nedbank unbundling, we will cease the consolidation of Nedbank into our financial results and will commence equity accounting, which will result in the initial recognition of the minority shareholding in Nedbank at fair value, in accordance with IFRS. Latin America Profits of our businesses in Latin America remained flat period over period. We saw continued good profits from Colombia demonstrated by an improvement in the asset management result and various initiatives to enhance sales in the AIVA business, including the consolidation of broker commitments and special offers and incentive programmes. Future growth prospects for the AIVA business remain challenging due to future loss of income from the distribution of products to Quilter following a change in product specifications. The sale of our businesses in Latin America are subject to required regulatory approvals in the relevant jurisdictions. All required applications have been made and the approval process is underway. As at 30 June 2018 the sale of businesses in Latin America remains on track to be completed in the first half of 2019. Quilter As a result of applying predecessor accounting our results for H1 2018 includes profit generated by Quilter up to its listing on 25 June 2018. Quilter's contribution to the Group's profit from discontinued operations was R743 million (H1 2017: R443 million). Refer to Note G1 in the financial statements for additional information on discontinued operations. Old Mutual Bermuda By the end of H1 2018 approximately 98% of the Guaranteed Minimum Accumulations benefit (GMAB) reinsurance obligations matured. The remaining reinsurance obligations will mature during H2 2018 and the ultimate closure of the business is expected by 31 December 2018. Old Mutual Bermuda made no contribution to the Group's profit or loss in H1 2018 as the market risks on the reinsurance obligations were managed by the hedging programme and a liquidation provision was established at December 2017 to capitalise all anticipated future operational losses. Residual plc The loss attributable to Residual plc reduced by 40% to R901 million. Lower finance costs due to the repurchase of subordinated debt securities in 2017, and lower costs incurred to resolve pre-existing Old Mutual plc risks contributed to the decrease in losses from the prior period. This was partially offset by other income related to the release of a deferred tax provision and higher advisory costs due to heightened activity leading up to the listing of both Old Mutual Limited and Quilter in H1 2018. IFRS profit after tax Profit after tax increased by 42% largely due to the distribution and the sale of Quilter shares which resulted in the recognition of a profit of R2,852 million in the consolidated results. Included within this profit is a loss on the recycling of foreign currency translation reserves of R394 million. An impairment to UAP in H1 2017 was not repeated in H1 2018, which further contributed to the increase period over period. Rm H1 2018 H1 2017 % change Mass and Foundation Cluster 1,051 893 18% Personal Finance 618 1,032 (40%) Wealth and Investments 563 472 19% Old Mutual Corporate 603 574 5% Old Mutual Insure 219 171 28% Rest of Africa 790 208 >100% Other Group Activities(1) 2,397 (614) >100% Consolidation adjustments(2) (226) (378) 40% IFRS profit from continuing operations after tax 6,015 2,358 >100%

IFRS profit from discontinued operations after tax(3) 8,108 7,599 7% IFRS profit after tax for the financial year 14,123 9,957 42% Attributable to: Equity holders of the parent 10,648 7,503 42% Non-controlling interests 3,475 2,454 42% Profit after tax for the financial year 14,123 9,957 42% Basic earnings per share (cents)(4) 229.4 154.7 48% (1) Includes central areas, Residual plc, our investment in China and the profit on sale and distribution of Quilter shares. (2) These entries relate to the elimination of inter-company transactions between continuing and discontinued operations. (3) Discontinued operations includes the results of Nedbank, Latin America, Quilter, Old Mutual Bermuda and India in the comparative period. (4) WANS used in the calculation of basic earnings per share is 4,641 million in H1 2018 (H1 2017: 4,687 million and FY 2017: 4,633 million) Free surplus generation and utilisation H1 2018 H1 2017 Free Free AHE % AHE % Rm Surplus Surplus Operating segments before capital requirements 3,987 3,995 100% 4,445 4,310 >100% Capital requirements (815) - - (717) - - Operating segments before fungibility restrictions 3,172 3,995 79% 3,728 4,310 86% Nedbank (19.9%) 699 1,398 50% 524 1,049 50% Free surplus generated before fungibility 4,252 5,359 79% restrictions 3,871 5,393 72% Fungibility restriction(1) (400) - - (946) - - Free Surplus generated from Operations 3,471 5,393 64% 3,306 5,359 62% (1) Fungibility restriction represents the free surplus generated in Zimbabwe which cannot be remitted. Free Surplus Generated from Operations was R3.5 billion, an increase of R0.2 billion, from R3.3 billion in H1 2017 representing 64% of the Group's AHE, compared to 62% in H1 2017. AHE increased marginally period over period, as such the increase was mainly driven by the non-fungible free surplus being a lower proportion of total surplus. This was partially offset by a change in capital requirements following a methodology change following the implementation of SAM. The methodology change included a review of the approach used to allocate required capital to different products within and across segments. As we continue to refine our capital allocation methodology it may result in further impacts on free surplus generation. Zimbabwe delivered a positive, yet reduced, free surplus of R0.4 billion in H1 2018 (H1 2017: R0.9 billion). The free surplus generated in Zimbabwe does not contribute to the Group metric due to fungibility constraints. The abnormally high investment returns during the 2017 financial year have not been repeated to date, with equity market performance in Zimbabwe remaining volatile. In H1 2018 Zimbabwe's AHE made up a lower proportion of total Group AHE and the fungibility restriction has therefore had a less dilutive impact on total free surplus generation. Balance Sheet Metrics % change H1 2018 H1 2017 FY 2017 (H1 2018 Rbn (unless otherwise indicated) vs. FY 2017) Operating Segments(1) 47.6 n/a 43.3 10% Residual plc(2) 11.2 n/a 17.2 (35%) Assets Held for sale or distribution(3) 48.9 n/a 78.9 (38%) Consolidation adjustments(4) (3.1) n/a (2.7) (15%) Equity attributable to the ordinary shareholders of the parent 104.6 n/a 136.7 (23%) South Africa 34.7 31.3 31.8 9% Rest of Africa 12.9 10 11.5 12% Equity attributable to operating segments 47.6 41.3 43.3 10% Nedbank at 19.9% 16.3 15.8 16.4 (1%) Closing Adjusted IFRS Equity 63.9 57.1 59.7 7% South Africa 49.6 45.1 45.7 9% Rest of Africa 12.2 10.0 10.8 13% Average Adjusted IFRS Equity 61.8 55.1 56.5 9% South Africa 18.5% 18.1% 21.0% 40 bps Rest of Africa 13.2% 25.4% 31.1% (1,220 bps) RoNAV(5) 17.5% 19.4% 22.9% (190 bps) South Africa 25.1 22.0 22.8 10% Rest of Africa 15.2 12.1 13.3 14% Invested Shareholder Assets 40.3 34.1 36.1 12% Gearing ratio(6) 12.0% 12.6% 13.0% (100 bps) Interest cover(5) 22.0 26.0 28.3 (15%)

(1) Comprises of the net asset value of the operating segments of the Group. This net asset value forms the basis for key balance sheet metrics on which the Group is managed from a capital perspective, and is the same perimeter on which AHE is presented. (2) Comprises of the net asset value of Old Mutual plc of R10.2 billion at 30 June 2018 (R15.1 billion at 31 December 2017) and Old Mutual Bermuda of R1.0 billion at 30 June 2018 (R2.1 million at 31 December 2017). (3) Comprises of the net asset value of assets classified as held for sale which includes 54% of Nedbank and Latin America. Quilter's net asset value is included in the comparative period. (4) Consolidation adjustments reflect own shares held by consolidated investment funds, which are treated as treasury shares under IFRS. (5) The % change has been calculated with reference to H1 2017. (6) Gearing ratios are calculated based on the IFRS equity attributable to operating segments. As such this excludes equity related to non- core entities (Residual plc) and assets held for sale. Residual plc Old Mutual Bermuda Old Mutual Bermuda has now largely run off and 98% of the reinsurance obligations have matured as at 30 June 2018. The surplus capital in Old Mutual Bermuda of R1 billion at 30 June 2018 has reduced by R1.1 billion from December 2017 largely due to a capital repatriation of R1,078 million ($90 million) made in March 2018 following approval from the Bermuda Monetary Authority (BMA). A further capital repatriation of R660 million ($49 million) was approved by the BMA in July 2018. The remainder of the surplus capital is anticipated following the ultimate closure of the business and may be released to Old Mutual Group (UK) Limited and in turn Old Mutual plc over time, subject to regulatory approval. Old Mutual plc Following the listing of Old Mutual Limited, Old Mutual plc is now a wholly owned, non-operating subsidiary of Group. The decrease in net asset value of 31% to R10.2 billion at 30 June 2018 (R15.1 billion at 31 December 2017) is largely due to the net settlement of certain intercompany loans between Old Mutual plc and Quilter ahead of the listing of Quilter and costs incurred in the wind down of the head office. This decrease was offset by an increase in cash and near cash instruments reflecting the cash proceeds received by Old Mutual plc following the sale offer of Quilter shares. On 19 July 2018, Old Mutual plc further reduced international debt by R5.2 billion through a tender offer of Tier 2 debt instruments. The formal credit ratings on Old Mutual plc were also withdrawn shortly after the date of the Tender Offer Memorandum. Old Mutual plc will continue to incur corporate costs in 2018 until the head office wind down is completed. These costs remain in line with previous guidance and our current best estimate of the realisable economic value of Residual plc is in line with the approximately R7,170 million (GBP400 million) previously indicated when the Second UK court scheme of arrangement became effective on 26 June 2018. The repurchase of the Tier 2 debt instruments resulted in a benefit to the economic value of approximately R264 million (GBP15 million) but this is was largely offset by the transfer of Old Mutual (Netherlands) B.V. with a net asset value of R290 million (GBP16 million) to Old Mutual Limited on 29 June 2018. Old Mutual Limited will remain subject, inter alia, to the undertaking to the UK Court as described in the announcement dated 20 June 2018 in respect of Old Mutual plc. The UK court scheme allows for reviews of the surplus assets on a quarterly basis commencing 1 October 2018. Any potential transfer by Old Mutual plc will need to take into account the developments and future assessments by the Board of Old Mutual plc, at such a point in time, of liabilities and contingent liabilities and in line with its fiduciary duties. The final development of economic value and surplus assets is subject to changes in estimates and uncertainty. RoNAV RoNAV decreased by 1.9% to 17.5% (H1 2017: 19.4%). RoNAV in South Africa increased by 0.4% to 18.5% (H1 2017: 18.1%). The increase was primarily due to higher operating results and underlying profit growth in Nedbank as ETI returned to profitability. This contributed to an increase in AHE of 12% versus an increase in average Adjusted IFRS Equity of 9%. The increase in equity was mainly due to higher accumulation of profits than in comparative periods and the impact of the translation of foreign operations with the rand weakening against foreign currencies, partially offset by the impact of IFRS 9 - Financial Instruments effective 1 January 2018. RoNAV in Rest of Africa decreased by 12.2% to 13.2% (H1 2017: 25.4%). Strong operational performance that led to an increase in RFO of R110 million or 30%, was offset by a decrease in shareholder investment returns of R656 million or 52%, due to normalisation of equity returns in Zimbabwe following strong equity performance in 2017. This contributed to a decrease in AHE of 37% versus an increase in average Adjusted IFRS Equity of 13%. The significant increase in Average adjusted IFRS Equity is largely driven by strong investment returns in H2 2017 that contributed to a higher opening equity base in H1 2018 and was further enhanced by the weakening of the rand against the US dollar and Kenyan shilling in H1 2018. Invested Shareholder Assets Invested shareholder assets increased by 12% to R40.3 billion (FY 2017: R36.1 billion). The asset base in South Africa saw a R2.3 billion or 10% increase period over period, following the investment of profits generated during H1 2018. An increase of R1.9 billion or 14% in Rest of Africa is driven by positive investment returns, albeit lower than in H1 2017, off a high asset base created by strong investment returns in Zimbabwe in H2 2017. The weakening of the rand against the US dollar and Kenyan shilling in H1 2018 further contributed to the increase of our asset base in East Africa. For the listed equities backing our capital in South Africa we aim to limit capital losses through the use of hedges.

We aim to reduce the cost of our hedges by sacrificing a portion of our return upside. Downside protection is structured to limit capital losses to between 5% and 15% on an annual basis. The market did not reach the strike levels on any of our hedges during the period. Gearing Gearing ratios are marginally down following the issuance of subordinated debt instruments to the nominal value of R500 million by Old Mutual Insure in November 2017, offset by an increase in equity attributable to operating segments. The increase in equity was due to higher accumulation of profits, driven by strong operational results in South Africa. Positive investment returns, albeit lower than in H1 2017, and the weakening of the rand against the US dollar and Kenyan shilling resulted in an increase in equity in Rest of Africa. Interest cover decreased to 22 times (H1 2017: 26 times) reflecting an increase in finance costs of 18% due to higher interest rates and the fresh issuance in H2 2017, whilst growth in AHE remained relatively flat period over period. Embedded value % change (H1 2018 Rm H1 2018 H1 2017 FY 2017 vs. FY 2017) Adjusted net worth (ANW) 33,677 29,575 29,966 12% Value in force (VIF) 33,652 32,245 33,695 - Embedded value 67,329 61,820 63,661 6% Return on embedded value (%) 11.7% 12.8% 14.1% (2.4%) The Return on embedded value remained strong at 11.7%, despite a decrease of 2.4% from 14.1% for FY 2017. MCEV operating earnings (post-tax) increased by 4.2% to R3,874 million (H1 2017: R3,717 million), mainly due to the increase in new business and dividend withholding tax excluded from MCEV earnings in H1 2018. This is a function of externalised dividends no longer flowing through Old Mutual (Netherlands) B.V. following the Managed Separation. Experience variances decreased earnings by R216 million, driven by poor persistency, and materially lower positive claims variances in Mass and Foundation Cluster and Personal Finance compared to H1 2017. The macro environment continued to put strain on persistency experience. Overall claims experience remained satisfactory relative to long-term assumptions, despite unfavourable experience in Personal Finance and poor group disability experience in Old Mutual Corporate persisting despite management actions. Recurring expenses remained lower than assumed, supported by ongoing tight expense management across the business. Investment returns were significantly lower than in H1 2017, particularly equity returns and resulted in negative variances. Solvency % change Optimal Rbn H1 2018 FY 2017 (H1 2018 target vs. FY 2017) range OMLACSA Eligible own funds 76.4 77.8 (2%) Solvency capital requirement (SCR) 31.8 31.9 - Solvency ratio (%) 240% 243% (300 bps) >200% Group - Post Nedbank unbundling(1) Eligible own funds 102.3 98.3 4% Solvency capital requirement (SCR) 62.2 58.8 6% 155% to Solvency ratio (%)(1) 164% 167% (300 bps) 175% (1) The capital position in accordance with the SAM regime can change materially if the quantum of the Nedbank unbundling or fungibility restrictions change. To the extent that some of the surplus is deemed fungible, this will contribute positively to the overall Group ratio. Key components of the estimated Group solvency position at 30 June 2018: Residual Consolidation Rm OMLACSA(1) Nedbank(2) plc(3) Other(4) Adjustments(5) Group Own Funds(6) 76.4 17.9 3.8 33.4 (29.2) 102.3 SCR 31.8 12.4 3.8 23.4 (9.2) 62.2 Ratio (%) 240% 144% 100% 143% 164% (1) The standard formula under SAM is used for OMLACSA. (2) Nedbank is included on a Basel III basis in Group solvency. This is different to the treatment in the OMLACSA calculation where the holding is included in the Own Funds at the market value of the shares, with an equity stress applied to calculate the SCR. (3) To the extent that some of the surplus is deemed fungible it will contribute positively to the overall Group surplus. (4) This category includes the balance of the Group, including holding companies, Old Mutual Insure, asset managers and Rest of Africa, (5) Represents the elimination of intercompany assets between entities e.g. the investment of a holding company in a subsidiary and diversification of risks within entities subject to accounting consolidation, most importantly between OMLACSA and Old Mutual Insure. (6) Includes fungibility restrictions where the own funds for certain entities are restricted to the solvency capital requirement of that entity (calculated on a SAM basis). The most material non-fungible surplus relates to Zimbabwe and Residual plc.

The Insurance Act came into effect on 1 July 2018. The Group is in the process of applying for regulatory approval of methodologies applied in the calculation of solvency ratios presented. The OMLACSA solvency ratio decreased marginally when compared to FY 2017. Emerging profits were more than offset by a provision for dividends expected to be paid in H2 2018. A portion of the special dividend will be funded by OMLACSA and this results in lower own funds. The Group solvency ratio decreased marginally by 3% to 164% in H1 2018 (H1 2017: 167%) largely as a result of the inclusion of foreseeable dividends in own funds. The foreseeable dividend includes the special dividend and the ratio before allowing for the special dividend, would have increased to 169%. Outlook KPI Financial Target Performance Outlook for H1 2018 FY 2018 Returns RoNAV Average COE + 4% 17.5% On track (weighted average COE of 13.4%(1)) Growth Results from CAGR of Nominal GDP + 2% over Up by 7% On track Operations the three years to 2020 (average nominal GDP growth for H1 2018: c. 6%) Efficiency Cost efficiencies R1 billion by the end of 2019 Approximately R270 On track Pre-tax run-rate cost savings, net million of recurring of costs to achieve it. Based off cost savings, incurring 2017 IFRS administrative cost one off costs of R70 base. million Underwriting result OM Insure underwriting margin 6.4% Within of 4% - 6% in near term target range Capital Solvency ratio - Old Mutual Limited: 155% - 164% Within the target 175% (post Nedbank range Unbundling) 240% - OMLACSA: Greater than 200% Above target range Cash returns Dividend cover Target full year ordinary 45 cents On track dividends covered by AHE between 1.75 to 2.25 times. Target an interim dividend at 40% of the interim AHE. (1) Cost of equity calculated on 1 January 2018 and will be revised on an annual basis. Risk Management We continue to monitor and manage the risks our Group face. Our assessment of the key risks are set out below. Macro-Economic and Socio-Political Risk The South African Reserve Bank has recently revised the gross domestic product growth forecast for 2018, from 1.7% to 1.2%. South Africa's unemployment rate has increased to 27.2% in the second quarter. The first half of 2018 also saw a Value Added Tax (VAT) increase and fuel hikes. These all contribute to increased financial pressure on consumers, the result of which impacts our business risk in the form of reduced demand for our products and services and increases in lapses and credit default risk. In addition to the lower growth outlook, policy statements from Government on land expropriation without compensation may negatively affect investment sentiment. The Zimbabwe economy remains weak and uncertain, and although our business has proved to be resilient, our ability to remit earnings out of Zimbabwe is constrained due to the foreign currency shortage, which also creates currency translation uncertainty. Market, Liquidity and Credit risks are actively managed and monitored by both management and specialist line 2 assurance functions. Technology and Systems Risk The organisation has a high dependency on IT as a true enabler for innovation and therefore future growth

and sustainability. The stability and maintenance of the current IT infrastructure is largely being addressed through the SA Transformation program. Although positive progress has been made, the scale and complexity contributes to increased execution risk, and creates opportunity cost to other development. There are nevertheless promising signs of innovation in different areas of the business, complemented by the enterprise-wide digital transformation and focus. Cyber Risk There is evidence of increased frequency and sophistication of attacks on financial service organisations. Cyber-attacks could result in operational losses, business interruptions, loss of critical company or customer data and consequently reputational damage. The organisation has updated its Information Security Strategy, aimed at achieving a higher level of resilience, and actions to achieve this are being implemented. Conduct Risk Due to our large tied adviser forces in the SA Life Retail businesses, the organisation has a high degree of exposure to advice risk. Consistency and robustness of advice processes is a key focus area of the management within the businesses. Life Insurance Risk There is a risk that adverse mortality rates experienced in 2017 and in 2018 to date is resistant to management actions being taken. An extensive experience investigation has been undertaken to assess whether the negative experience is due to normal volatility or an underlying deterioration, and actions are in progress to improve the underwriting result. Governance and Control of Subsidiaries Governance and control in some of our subsidiary businesses in East and West Africa has fallen short of Group requirements. We have made management changes and taken actions to strengthen controls over core processes to reduce the risk of operational losses. Interim and special dividend declarations The Board of directors has approved and declared an interim dividend of 45 cents per ordinary share and a special dividend of 100 cents per ordinary share. The interim dividend targeting 40% of interim Adjusted Headline Earnings is in line with Old Mutual Limited's dividend policy. The interim dividend will be paid out of distributable reserves and is payable on 16 October 2018 to all ordinary shareholders recorded on the record date. The dividend of 45 cents per ordinary share will be subject to a local dividend tax rate of 20% which will result in a net interim dividend, to those shareholders who are not exempt from paying dividend tax, of 36 cents per ordinary share. International shareholders who are not exempt or are not subject to a reduced rate in terms of a double taxation agreement will be subject to dividend withholding tax at a rate of 20%. The special dividend of 100 cents per ordinary share is in line with our capital management policy of returning excess capital to shareholders and will be paid from distributable reserves on 16 October 2018 to all ordinary shareholders recorded on the record date, subject to the requisite South African Reserve Bank approval required for special dividends. The special dividend of 100 cents per ordinary share will be subject to a local dividend tax rate of 20% which will result in a net special dividend, to those shareholders who are not exempt from paying dividend tax, of 80 cents per ordinary share. International shareholders who are not exempt or are not subject to a reduced rate in terms of a double taxation agreement will be subject to dividend withholding tax at a rate of 20%. Shareholders on the London, Malawian, Namibian and Zimbabwean registers will be paid in the local currency equivalents of the interim and special dividends. In Malawi, Namibia and Zimbabwe these payments will be made through dividend access trust or similar arrangements established in each country. Old Mutual Limited's income tax number is 9267358233. The number of ordinary shares in issue in the company's share register at the date of declaration is 4,942,048,355. The timetable pertaining to the Interim & Special dividend is as follows: Transfers suspended between registers Close of business on Monday, 10 September 2018 Finalisation announcement and exchange rates announced Tuesday, 11 September 2018 Last day to trade cum dividend for shareholders on the Tuesday, 18 September 2018 South African Register and Malawi, Namibia and Zimbabwe branch registers Ex-dividend date for shareholders on the South African Wednesday, 19 September 2018 Register and Malawi, Namibia and Zimbabwe branch registers Last day to trade cum dividend for shareholders on the Wednesday, 19 September 2018 UK register Ex-dividend date for shareholders on the UK register Thursday, 20 September 2018 Record date (all registers) Close of business on Friday, 21 September 2018 Transfers between registers restart Opening of business on Tuesday, 25 September 2018 Interim and Special Dividend payment date Tuesday, 16 October 2018
Share certificates for shareholders on the South African register may not be dematerialised or rematerialised between Wednesday, 19 September and Friday, 21 September 2018, both dates inclusive. Transfers between the registers may not take place between Tuesday, 11 September and Friday, 21 September 2018, both dates inclusive. Trading in shares held on the Namibian section of the principal register through Old Mutual (Namibia) Nominees (Pty) Limited will not be permitted between Tuesday, 18 September and Thursday, 20 September 2018, both dates inclusive. Key Performance Indicators ("KPIs") KPIs are not defined by the relevant IFRS financial reporting framework, but we use them to provide greater insight to the financial performance, financial positions and cash flows of the Group and the way it is managed. The table below sets out the definitions of KPIs used by the Group. KPIs Definition Results from Operations The primary measure of the business performance of the operating segments. Calculated as Adjusted Headline Earnings before shareholder tax and non- controlling interest, excluding net investment return on shareholder assets and finance costs and income from associates. Adjusted Headline Earnings The Group profit measure that adjusts headline earnings, as defined by SAICA Circular 2/2015, for the impact of material transactions, non-core operations and any IFRS accounting treatments that don't fairly reflect the economic performance of the business. Return on Net Asset Value Adjusted Headline Earnings divided by average Adjusted IFRS Equity. Adjusted IFRS Equity is calculated as equity attributable to operating segments before adjustments related to consolidation of funds. It excludes equity related to Residual plc and discontinued operations and is further adjusted to recognise the equity attributable to the retained 19.9% interest in Nedbank. Free Surplus Generated from Free Surplus Generated from Operations represents the net cash generated Operations from the operations that contribute to AHE after allowing for normal course investment in the business and the impact of any fungibility constraints. Gross flows The gross cash flows received from customers during the period by Group businesses engaged in Life and Savings and Asset Management. Life APE sales A standardised measure of the volume of new life insurance business written. It is calculated as the sum of new business recurring premiums (annualised) and 10% of the new single premiums written in an annual reporting period. NCCF The difference between gross flows and cash returned to customers (e.g. claims, surrenders, maturities) during the period. FUM The total market value of funds managed by the Group, at the point at which funds flow into the Group. VNB The discounted value of expected future profits arising from new life insurance business sold in the reporting period. VNB margin VNB divided by PVNBP, where PVNBP is the discounted value of expected future life insurance premiums from new recurring premium business, plus 100% of new single premiums. The VNB margin reflects how much future profit is expected from each future life insurance premium and therefore measures the profitability of new business sold. GWP The value of premiums that a property and casualty insurer is entitled to receive from its insurance business in a period, before adjustments for reinsurance premiums. It is a measure of sales performance in Group businesses engaged in Property and Casualty. Underwriting margin Underwriting result as a percentage of net premiums earned. It is calculated for the Property and Casualty businesses across the Group. Loans and advances The balance of gross loans and advances for Group businesses engaged in Banking and Lending. The amounts are gross of impairments on all performing, arrears and default loans. Net lending margin Net interest income plus non-interest revenue minus credit losses, as a percentage of average loans and advances over the period. Mass and Foundation Cluster review Defend South African market share in mass and corporate markets Consumer confidence was high early in the year following political developments but has subsequently

pulled back. This has contributed to negative pressure on disposable income following high unemployment rates, VAT and fuel increases. We have maintained strong sales despite increased competitor activity. Enhanced sales force productivity has translated into strong life and loan sales growth. Life sales improved in H1 2018 compared to the prior year but are expected to moderate in H2 2018 should challenging market conditions persist. Money Account remains one of the most competitive transactional solutions in the South African market, with the number of active accounts increasing by 34% in H1 2018. Funeral claims process improvements resulted in better customer experience with circa 99% of funeral claims that are paid into Money Accounts within 4 hours and any other account within 8 hours. Performance highlights Rm (except where otherwise indicated) H1 2018 H1 2017 % change RFO 1,534 1,306 17% Gross flows 6,532 5,709 14% Life APE sales 2,142 1,766 21% NCCF (Rbn) 3.1 2.9 7% FUM (Rbn)(1) 13.1 12.4 6% VNB 655 585 12% VNB margin (%) 10.5% 10.2% 30 bps Loans and advances(1) 13,432 12,070 11% Net lending margin (%) 14.4% 15.3% (90 bps) (1) The % change has been calculated with reference to FY 2017. Life APE sales of R2,142 million showed strong growth of 21%. This was due to our continued drive to grow adviser headcount and productivity as well as positive customer experience related to the funeral claims process. The retail branch network contributed 30% of Life APE sales, consistent with H1 2017, and continues to deliver better persistency and productivity experience than other channels. Gross flows increased by 14% to R6,532 million off the back of growth in the life insurance book and customer take-up of annual premium increases, combined with good growth in Money Account take up and usage. This contributed to a R0.2 billion increase in NCCF to R3.1 billion. Loans and Advances increased by 11% to R13,432 million since 31 December 2017, due to improved productivity as a result of process enhancements around customer take-on. Customer risk assessment has been enhanced with improved offers to low risk customers and more stringent requirements for high risk customers. The increase is muted by the transitional adjustment required as a result of the adoption of IFRS 9 - Financial Instruments effective 1 January 2018. RFO of R1,534 million increased by 17% despite the increase in allocation of central expenses previously carried at a group level. Life profits increased by 15% due to growth in the life insurance book, higher life APE sales and customer take up of annual premium increases combined with good cost management. Non-life profits were up 26% due to a decrease in amortisation of acquired intangibles compared to H1 2017. It was further enhanced by an improved credit loss ratio of 5.4%, which was 90 bps better than H1 2017. The adoption of IFRS 9 - Financial Instruments, effective 1 January 2018, requires higher provisions on new loans and advances and is expected to create profit strain if the increase in disbursements persists. The higher new business volumes contributed to the VNB of R655 million which increased by 12% and also improved the VNB margin of 10.5% by 30 bps, partially offset by lower margin as a result of promotions run to improve sales. The net lending margin of 14.4% was 90 bps down due to the effect of a one off positive impact related to alignment of provisioning models to payment behaviour in the prior year. Excluding this one off item, the H1 2018 margin increased marginally on prior year primarily due to a continued positive collections experience. Personal Finance review Defend and grow in the South African personal finance market Intense competition continues to be a characteristic of this market. A tough economic environment continued to place strain on consumer disposable income due to persistently high unemployment rates, VAT and fuel increases which had an adverse effect on customer acquisition especially in the middle income market. A number of initiatives have been launched to drive sales in this tough economic environment including the re-pricing of guaranteed annuity products and tactical improvements to the pricing of disability and severe illness in the second quarter which supported income and protection sales in H1 2018. The launch of the Old Mutual Rewards loyalty programme in July 2018 is one of the strategic initiatives to strengthen our penetration in the middle income market. Also, 22seven launched "Goals" in H1 2018 to allow customers to personalise their savings objectives. We won the Financial Intermediaries Association Risk Provider of the year award. Despite headwinds in the macro-economic environment and higher than normal mortality and morbidity rates in H1 2018, we are taking actions to improve the profitability of the risk book although the effects of these actions are likely only to be seen in 2019.

Performance highlights Rm (except where otherwise indicated) H1 2018 H1 2017 % change RFO 918 1,394 (34%) Gross flows 12,970 12,440 4% Life APE sales 1,221 1,241 (2%) NCCF (Rbn) (1.8) (1.3) (38%) FUM (Rbn)(1) 188.5 193.7 (3%) VNB 100 87 15% VNB margin 1.3% 1.1% 20 bps (1) The % change has been calculated with reference to FY 2017. Gross flows increased by 4% to R12,970 million mainly due to higher single premium sales across life and non- life savings products. Higher death and disability claims and higher disinvestments led to negative NCCF of R1.8 billion, a decrease of R0.5 billion from H1 2017. Outflows in NCCF and the decline in the South African equity markets in H1 2018 contributed to a decrease of 3% resulting in FUM of R188.5 billion at 30 June 2018. Life APE sales reduced by 2% to R1,221 million largely due to lower recurring premium sales on savings and risk products reflecting pricing competitiveness in the market. Satisfactory growth in single premium sales for savings and income products and protection sales improved in the second quarter driven by tactical pricing initiatives. RFO of R918 million decreased by 34% when compared to H1 2017. The decrease was a function of higher than expected death and disability claims, with a number of large death claims which fell below the reinsurance threshold. A number of management actions are underway and we continue to monitor and assess underlying mortality trends. Lower investment variances due to lower market returns and a higher allocation of central expenses further contributed to the decrease. VNB increased by 15% to R100 million mainly due to lower distribution costs allocated to life products following a methodology change in H2 2017. Consequently, the VNB margin increased by 20bps to 1.3%, mainly due to the lower distribution cost allocation offset by the impact of lower sales volume and margin mix. Wealth and Investments review Improve the competitiveness of Wealth and Investments Markets were largely negative for the first quarter of the year. Strong momentum in NCCF with high quality flows was driven by an improved Wealth proposition and sustained investment performance. Strong NCCF demonstrates traction in gaining market share and ongoing improvement in our product offerings. Higher origination activity in Specialised Finance and our participation in South Africa's renewable energy sector via investment through Alternatives are encouraging indicators of building a diversified Wealth and Investment business. Investment performance momentum continued with retail funds performing well with 67% of core funds above median over three and five years. Multi-asset funds have continued to perform particularly well over 2018 with 7 out of 8 core retail and institutional offerings in the top quartile. Our flagship Retail Balanced and Flexible Fund is now top quartile over one and five years, while 3 out of 4 core retail Multi-asset funds have 4- star Morningstar ratings. Old Mutual Investment Group has been named the Best Managed Company in the Financial Services Sector and won the headline award for Best Managed Company of the year at the Top 500 Awards 2018. Performance highlights Rm (except where otherwise indicated) H1 2018 H1 2017 % change RFO 783 638 23% Gross flows 45,114 42,405 6% NCCF (Rbn) 10.9 1.8 >100% AUM (Rbn)(1,2) 741.9 736.6 1% FUM 516.6 498.1 4% Intergroup assets 345.8 340.4 2% AuMA(3) 862.4 838.5 3% Assets under administration (120.5) (101.9) (18%) Total revenue 2,374 2,284 4% Annuity 2,151 2,151 - Non-annuity 223 133 68% (1) The% change has been calculated with reference to FY 2017. (2) AUM comprises FUM as defined for the Group, as well as funds managed on behalf of other entities in the Group, which is reported as FUM in respect of segments. Assets under administration that are managed externally are not included in AUM. (3) AuMA is AUM including Assets under Administration. Gross flows of R45,114 million increased by 6% following proposition improvements which resulted in higher flows, as well as large flows secured in Old Mutual International. Growth in flows, good retention in the institutional asset management business resulting from improved investment performance and the non- occurrence of large client outflows in H1 2017 has resulted in a significant increase of R9.1 billion in NCCF.

AUM was marginally positive from FY 2017, with the positive impact of strong NCCF offset by weak market performance in H1 2018. Total revenue increased by 4% to R2,374 million primarily due to higher asset-based institutional fee income, offset by margin pressure in our Wealth and Specialised Finance businesses. The non-annuity revenue in our Alternatives and Specialised Finance businesses showed a strong result, with the renewable energy investment being one of the contributors, whilst reflecting the benefits of our responsible business efforts. The H1 2017 revenue has been restated to report revenue gross of external asset management fees to be on a comparable basis with H1 2018. RFO was R783 million, an increase of 23% from H1 2017. The increase is largely attributable to acquisition related intangibles being fully amortised in 2017. Growth in non-annuity revenue of 68% due to higher origination income in Specialised Finance and a one off fair value gain in an Alternatives fund contributed to profit delivery. Old Mutual Corporate review Defend South African market share in mass and corporate markets We made good strides in defending our market share, particularly in the competitive market for multi- employer retirement funds (umbrella funds). Umbrella life APE sales almost doubled compared to H1 2017 as a result of a large single premium deal. The management actions undertaken to restore the group risk underwriting experience continue to gain good traction. These management actions included income protection re-pricing and launch of the new Well4Work range, a range of four flexible group income protection benefits that will allow clients to tailor the desired balance between benefits and price. As expected, there were a number of group risk schemes that terminated following decisions to not match uneconomically low competitor rates. We remain focused on improving underwriting margins to expected long-term levels. Old Mutual Corporate won awards in three categories at the Imbasa Yegolide Awards earlier this year. The awards recognise service providers in the employee benefits industry who meet the needs and expectations of retirement fund members by delivering excellent service. Performance highlights Rm (except where otherwise indicated) H1 2018 H1 2017 % change RFO 854 800 7% Gross flows 21,723 16,760 30% Life APE sales 1,451 1,159 25% NCCF (Rbn) 0.8 (0.3) >100% FUM (Rbn)(1) 258.2 255.6 1% VNB 168 130 29% VNB margin 1.2% 1.2% - (1) The % change has been calculated with reference to FY 2017. Strong Life APE sales of R1,451 million, an increase of 25%, was mainly due to higher single premium pre- retirement savings sales into SuperFund and Old Mutual Multi-Managers. Recurring premium sales are lower than in H1 2017 largely due to lower group risk sales that were impacted by premium rate increases to improve profitability. Gross flows increased by 30% to R21,723 million mainly due to improved life sales. This, in addition to improved termination experience contributed to a strong NCCF uplift of R1.1 billion to R0.8 billion. FUM of R258.2 billion increased by 1% with the growth in NCCF mostly offset by downward pressure from equity markets. RFO of R854 million delivered good growth of 7% mainly due to better group life assurance underwriting experience underpinned by lower average claims sizes. This was partially offset by higher allocation of central expenses. At R168 million, VNB grew by 29% largely as a result of higher sales volumes and capital optimisation initiatives. The VNB margin was maintained at 1.2% due to margin pressure on the mix of business sold, despite an increase in sales volumes. Old Mutual Insure review Continued turnaround of Old Mutual Insure Our capability and skills have been strengthened over the last few years by bringing in experts in specific fields which facilitated disciplined and tightened underwriting criteria. The general environment improved with low market wide losses due to a benign claims environment. No catastrophe claims reported to date however from past experience, catastrophe losses have a higher probability of occurrence in the second half of the year due to weather patterns. Organic growth has been muted particularly in our commercial, personal and agriculture portfolios in part by ongoing remediation, tough market conditions and slower than anticipated new business volumes. Optimising the interplay between facultative reinsurance, deductible structures and treaty applicability continues to contribute to more consistent underwriting results in volatile and commoditized sectors. iWYZE
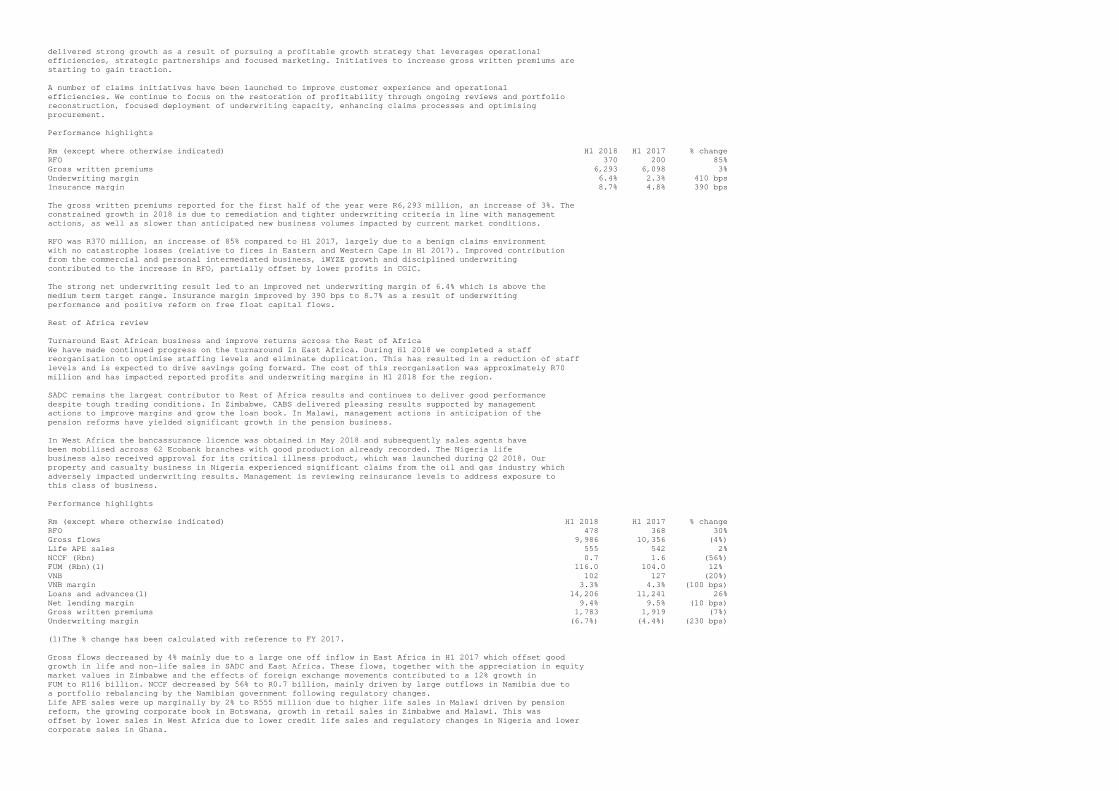
delivered strong growth as a result of pursuing a profitable growth strategy that leverages operational efficiencies, strategic partnerships and focused marketing. Initiatives to increase gross written premiums are starting to gain traction. A number of claims initiatives have been launched to improve customer experience and operational efficiencies. We continue to focus on the restoration of profitability through ongoing reviews and portfolio reconstruction, focused deployment of underwriting capacity, enhancing claims processes and optimising procurement. Performance highlights Rm (except where otherwise indicated) H1 2018 H1 2017 % change RFO 370 200 85% Gross written premiums 6,293 6,098 3% Underwriting margin 6.4% 2.3% 410 bps Insurance margin 8.7% 4.8% 390 bps The gross written premiums reported for the first half of the year were R6,293 million, an increase of 3%. The constrained growth in 2018 is due to remediation and tighter underwriting criteria in line with management actions, as well as slower than anticipated new business volumes impacted by current market conditions. RFO was R370 million, an increase of 85% compared to H1 2017, largely due to a benign claims environment with no catastrophe losses (relative to fires in Eastern and Western Cape in H1 2017). Improved contribution from the commercial and personal intermediated business, iWYZE growth and disciplined underwriting contributed to the increase in RFO, partially offset by lower profits in CGIC. The strong net underwriting result led to an improved net underwriting margin of 6.4% which is above the medium term target range. Insurance margin improved by 390 bps to 8.7% as a result of underwriting performance and positive reform on free float capital flows. Rest of Africa review Turnaround East African business and improve returns across the Rest of Africa We have made continued progress on the turnaround In East Africa. During H1 2018 we completed a staff reorganisation to optimise staffing levels and eliminate duplication. This has resulted in a reduction of staff levels and is expected to drive savings going forward. The cost of this reorganisation was approximately R70 million and has impacted reported profits and underwriting margins in H1 2018 for the region. SADC remains the largest contributor to Rest of Africa results and continues to deliver good performance despite tough trading conditions. In Zimbabwe, CABS delivered pleasing results supported by management actions to improve margins and grow the loan book. In Malawi, management actions in anticipation of the pension reforms have yielded significant growth in the pension business. In West Africa the bancassurance licence was obtained in May 2018 and subsequently sales agents have been mobilised across 62 Ecobank branches with good production already recorded. The Nigeria life business also received approval for its critical illness product, which was launched during Q2 2018. Our property and casualty business in Nigeria experienced significant claims from the oil and gas industry which adversely impacted underwriting results. Management is reviewing reinsurance levels to address exposure to this class of business. Performance highlights Rm (except where otherwise indicated) H1 2018 H1 2017 % change RFO 478 368 30% Gross flows 9,986 10,356 (4%) Life APE sales 555 542 2% NCCF (Rbn) 0.7 1.6 (56%) FUM (Rbn)(1) 116.0 104.0 12% VNB 102 127 (20%) VNB margin 3.3% 4.3% (100 bps) Loans and advances(1) 14,206 11,241 26% Net lending margin 9.4% 9.5% (10 bps) Gross written premiums 1,783 1,919 (7%) Underwriting margin (6.7%) (4.4%) (230 bps) (1)The % change has been calculated with reference to FY 2017. Gross flows decreased by 4% mainly due to a large one off inflow in East Africa in H1 2017 which offset good growth in life and non-life sales in SADC and East Africa. These flows, together with the appreciation in equity market values in Zimbabwe and the effects of foreign exchange movements contributed to a 12% growth in FUM to R116 billion. NCCF decreased by 56% to R0.7 billion, mainly driven by large outflows in Namibia due to a portfolio rebalancing by the Namibian government following regulatory changes. Life APE sales were up marginally by 2% to R555 million due to higher life sales in Malawi driven by pension reform, the growing corporate book in Botswana, growth in retail sales in Zimbabwe and Malawi. This was offset by lower sales in West Africa due to lower credit life sales and regulatory changes in Nigeria and lower corporate sales in Ghana.

Gross written premiums decreased by 7% to R1,783 million. In East Africa the decline is driven by increased competition and remediation of the book through the non-renewal of loss making accounts. Loans and advances rose to R14,206 million, up 26% mainly driven by growth in the CABS book. Net lending margin decreased marginally by 10bps mainly driven by lower margin business written in H1 2018. RFO increased by 30% to R478 million, supported by a 24% increase in RFO for SADC due to good growth in the loan book at CABS and positive investment returns in Namibia and Zimbabwe. Strong underwriting results in Malawi's group life business further contributed to profit growth. RFO for East Africa decreased largely as a result of the costs incurred to execute the staff reorganisation and the impact of civil strife in South Sudan. Excluding the impact of the staff reorganisation in East Africa, there is an improvement in the underlying underwriting margin as a result of management actions taken to improve claims and remediation of the book. This is partially offset by poor claims experience in the Nigeria business as the industry is facing significant claims in the oil and gas industry. VNB decreased by 20% to R102 million mainly due to a less profitable mix of business and methodology changes to align with the SAM capital framework. The VNB margin subsequently reduced by 100 bps. Unaudited condensed consolidated interim financial statements For the six months ended 30 June 2018 Background information In March 2016, Old Mutual plc announced that its board believed that the long term interests of Old Mutual plc shareholders and other stakeholders would be best served by separating the four businesses then owned by the Old Mutual plc Group from each other so that they could operate as fully independent businesses. These four businesses were Old Mutual Emerging Markets, OM Asset Management plc (OMAM, now Brightsphere Investment Group), Nedbank and Old Mutual Wealth (now Quilter plc). As at 31 December 2017, OMAM had already been separated from the Old Mutual plc Group following a phased sell-down. To effect the above strategy, referred to as Managed Separation, the following steps were executed during the six months ended 30 June 2018: - The listing of Quilter plc on the London Stock Exchange (LSE) and the Johannesburg Stock Exchange (JSE), the distribution of 86.6% of its total share capital to Old Mutual plc shareholders and the sale of up to 9.6% by way of a cash placing to institutional investors. - The formation and listing on the JSE (primary), LSE and the stock exchanges of Malawi, Namibia and Zimbabwe, of a new entity, being Old Mutual Limited. Immediately prior to the listing, Old Mutual Limited became the new holding company of Old Mutual plc and its subsidiaries, which mainly comprised the remaining operating businesses namely Old Mutual Emerging Markets and Nedbank. The results and position of this new Group have been presented within this set of unaudited condensed consolidated interim financial statements (interim financial statements). More details on the basis of preparation and the comparative information presented in these interim financial statements have been presented in note A1. The final step of Managed Separation will be achieved through the unbundling (in terms of South African law) of up to 32% of the issued share capital of Nedbank to shareholders of Old Mutual Limited, whilst retaining a minority interest of 19.9% in the shareholder funds. Further details on Managed Separation and the transactions that have occurred during the period are set out in note A2. More information on the businesses classified as held for sale and distribution and as discontinued operations is set out in note G1. Consolidated income statement For the six months ended 30 June 2018 Six months Year Six months ended ended ended 30 June 31 December 30 June 2017 2017 Rm Notes 2018 (Re-presented)(1) (Re-presented)(1) Continuing operations Revenue Gross insurance premium revenue 39,739 35,184 72,323 Outward reinsurance (3,333) (3,260) (6,693) Net earned premiums 36,406 31,924 65,630 Investment return (non-banking) 22,735 35,723 93,921 Banking interest and similar income 2,105 2,050 4,705 Banking trading, investment and similar income 60 117 97 Fee and commission income, and income from service activities 5,521 5,049 9,990 Other income 1,040 745 1,860 Total revenue 67,867 75,608 176,203 Expenses Claims and benefits (including change in insurance contract provisions) (37,354) (38,570) (92,787) Reinsurance recoveries 2,998 2,752 5,404 Net claims and benefits incurred (34,356) (35,818) (87,383) Change in investment contract liabilities (2,897) (10,487) (30,358) Credit impairment charges (480) (403) (715) Finance costs (538) (1,171) (4,024) Banking interest payable and similar expenses (252) (679) (1,278) Fee and commission expenses, and other acquisition costs (4,606) (3,757) (8,359)

Change in third-party interest in consolidated funds (7,503) (6,977) (11,405) Other operating and administrative expenses (12,157) (12,427) (25,566) Total expenses (62,789) (71,719) (169,088) Share of associated undertakings' and joint ventures' profit after tax (53) (354) (23) Profit on disposal of subsidiaries, associated undertakings and strategic investments 2,855 657 1,988 Profit before tax 7,880 4,192 9,080 Income tax expense (1,865) (1,834) (3,978) Profit from continuing operations after tax 6,015 2,358 5,102 Discontinued operations Profit from discontinued operations after tax G1.1(a) 8,108 7,599 15,262 Profit after tax for the financial period 14,123 9,957 20,364 Attributable to Equity holders of the parent 10,648 7,503 14,372 Non-controlling interests Ordinary shares 3,190 2,156 5,402 Preferred securities 285 298 590 Profit after tax for the financial period 14,123 9,957 20,364 Earnings per ordinary share Basic earnings per share - continuing operations (cents) 127.2 54.3 107.6 Basic earnings per share - discontinued operations (cents) 102.2 100.4 197.1 Basic earnings per ordinary share (cents) C1(a) 229.4 154.7 304.7 Diluted earnings per share - continuing operations (cents) 125.9 53.4 106.0 Diluted earnings per share - discontinued operations (cents) 99.6 98.0 191.5 Diluted basic earnings per ordinary share (cents) C1(b) 225.5 151.4 297.5 (1) The six months ended 30 June 2017 and the year ended 31 December 2017 have been re-presented to reflect the Latin American businesses, Kotak Mahindra Old Mutual Life Insurance Limited (Kotak) and Old Mutual Bermuda as discontinued operations. In addition, the six months ended 30 June 2017 has been re-presented to reflect Nedbank and Quilter plc (Quilter) as discontinued operations, consistent with the year ended 31 December 2017. Refer to notes A2 and G1 for more information. Consolidated statement of comprehensive income For the six months ended 30 June 2018 Six months Year Six months ended ended ended 30 June 31 December 30 June 2017 2017 Rm 2018 (Re-presented)(1) (Re-presented)(1) Profit after tax for the financial period 14,123 9,957 20,364 Other comprehensive income for the financial period Items that will not be reclassified to profit or loss Fair value movements Property revaluations (17) 15 109 Measurement gains/(losses) on defined benefit plans 28 (886) (966) Shadow accounting(2) 23 (30) (154) Income tax on items that will not be reclassified to profit or loss 1 (33) (95) 35 (934) (1,106) Items that may be reclassified to profit or loss Fair value movements Net investment hedge 33 3,121 446 Investments at fair value through other comprehensive income (98) 115 46 Currency translation differences on translating foreign operations 5,366 (2,029) (3,200) Exchange differences recycled to profit or loss on disposal of business 394 (826) (1,343) Realisation of net investment hedge on sale of a subsidiary - - 2,680 Fair value movement related to credit risk on borrowed funds 320 - - Other movements 101 (207) (321) Income tax on items that may be reclassified to profit or loss - - 43 6,116 174 (1,649) Total other comprehensive income for the financial period from continuing operations 6,151 (760) (2,755) Discontinued operations Total other comprehensive income for the financial period from discontinued operations after tax G1.1(b) (147) - 149 Total other comprehensive income for the financial period 6,004 (760) (2,606) Total comprehensive income for the financial period 20,127 9,197 17,758 Attributable to Equity holders of the parent 16,362 6,997 12,036 Non-controlling interests Ordinary shares 3,480 1,902 5,132 Preferred securities 285 298 590 Total comprehensive income for the financial period 20,127 9,197 17,758 (1) The six months ended 30 June 2017 and the year ended 31 December 2017 have been re-presented to reflect the Latin American businesses, Kotak and Old Mutual Bermuda as discontinued operations. In addition, the six months ended 30 June 2017 has been re-presented to reflect Nedbank and Quilter as discontinued operations, consistent with the year ended 31 December 2017. Refer to notes A2 and G1 for more information. (2) Shadow accounting is an adjustment, permitted by IFRS 4 'Insurance contracts', to allow for the impact of recognising unrealised gains or losses on insurance assets and liabilities in a consistent

manner to the recognition of the unrealised gain or loss on financial assets that have a direct effect on the measurement of the related insurance assets and liabilities. Supplementary income statement For the six months ended 30 June 2018 Supplementary income statement Six months Six months Year ended ended ended 30 June 30 June 31 December Rm Notes 2018 2017 2017 Mass and Foundation Cluster 1,534 1,306 3,052 Personal Finance 918 1,394 3,150 Wealth and Investments 783 638 1,490 Old Mutual Corporate 854 800 1,576 Old Mutual Insure 370 200 524 Rest of Africa 478 368 1,081 Central expenses (89) (176) (506) Results from Operations 4,848 4,530 10,367 Shareholder investment return 1,177 1,869 4,920 Finance costs (337) (286) (622) Income from associated undertakings 1,379 1,036 2,305 Adjusted Headline Earnings before tax and non-controlling interests 7,067 7,149 16,970 Shareholder tax (1,566) (1,600) (3,535) Non-controlling interests (108) (190) (488) Adjusted Headline Earnings 5,393 5,359 12,947 Adjusted weighted average number of ordinary shares (millions) C1(a) 4,801 4,771 4,776 Earnings per share (cents) 112.3 112.3 271.1 Rm Six months Six months Year ended ended ended 30 June 30 June 31 December Reconciliation of Adjusted Headline Earnings to IFRS profit after tax Notes 2018 2017 2017 Adjusted Headline Earnings 5,393 5,359 12,947 Investment return on group equity and debt instruments held in policyholder funds B3(a) 620 106 (1,355) Impact of restructuring B3(b) (450) (81) (54) Discontinued operations B3(c) 4,536 4,198 8,870 Income from associated undertakings B3(d) (1,398) (1,049) (2,346) Residual plc B3(e) (901) (1,507) (4,918) Headline earnings 7,800 7,026 13,144 Impairment of goodwill and other intangible assets (21) (720) (1,080) Profit/(loss) on disposal of fixed assets 14 (12) (26) Profit on disposal of subsidiaries, associated undertakings and strategic investments 2,855 956 2,081 Profit after tax for the period attributable to ordinary equity holders of the parent 10,648 7,250 14,119 Dividends on preferred securities - 253 253 Profit after tax for the financial period attributable to equity holders of the parent 10,648 7,503 14,372 Consolidated statement of financial position At 30 June 2018 At At 30 June 31 December Rm Notes 2018 2017 Assets Goodwill and other intangible assets 6,154 6,653 Mandatory reserve deposits with central banks 98 94 Investment property 36,878 31,903 Property, plant and equipment 8,496 8,081 Investments in associated undertakings and joint ventures 2,265 1,789 Deferred tax assets 800 1,084 Deferred acquisition costs 1,908 3,086 Reinsurers' share of policyholder liabilities F1 7,898 4,220 Loans and advances 24,618 21,483 Investments and securities 750,370 722,249 Current tax receivable 312 1,064 Trade, other receivables and other assets 21,119 21,875 Derivative financial instruments 3,347 4,101 Cash and cash equivalents 27,542 30,761 Assets held for sale and distribution G1.2 1,020,757 2,188,443 Total assets 1,912,562 3,046,886 Liabilities Life insurance contract liabilities F1 152,108 159,514 Investment contract liabilities with discretionary participating features F1 201,691 193,425

Investment contract liabilities F1 296,547 288,164 Property & casualty liabilities F1 8,890 8,285 Borrowed funds F2 21,132 18,866 Deferred tax liabilities 5,069 5,088 Deferred revenue 625 1,378 Provisions and accruals 2,206 2,385 Third-party interests in consolidated funds 86,665 81,573 Current tax payable 1,398 1,711 Trade, other payables and other liabilities 45,415 42,355 Amounts owed to bank depositors 16,254 12,440 Derivative financial instruments 4,892 4,498 Liabilities held for sale and distribution G1.2 917,713 2,043,759 Total liabilities 1,760,605 2,863,441 Net assets 151,957 183,445 Shareholders' equity Equity attributable to equity holders of the parent 104,604 136,678 Non-controlling interests Ordinary shares 41,497 40,910 Preferred securities 5,856 5,857 Total non-controlling interests 47,353 46,767 Total equity 151,957 183,445 Consolidated statement of cash flows For the six months ended 30 June 2018 Six months Year Six months ended ended ended 30 June 31 December 30 June 2017 2017 Rm Notes 2018 (Re-presented)(1) (Re-presented)(1) Cash flows from operating activities Profit before tax 7,880 4,192 9,080 Non-cash movements in profit before tax 4,730 1,600 16,091 Net changes in working capital 4,572 (7,529) (8,646) Taxation paid (1,762) (1,972) (3,869) Net cash inflow/(outflow) from operating activities - continuing operations 15,420 (3,709) 12,656 Cash flows from investing activities Net (acquisition)/disposal of financial investments (25,551) 5,643 (3,929) Acquisition of investment properties (915) (566) (6,139) Proceeds from disposal of investment properties 115 - 69 Dividends received from associated undertakings 5 50 67 Acquisition of property, plant and equipment (635) (255) (653) Proceeds from disposal of property, plant and equipment 158 16 240 Acquisition of intangible assets (461) (287) (728) Acquisition of interests in subsidiaries, associated undertakings, joint ventures and strategic investments (1,195) (40) (1,520) Proceeds from the disposal of interests in subsidiaries, associated undertakings joint ventures and strategic investments 4,206 8,052 12,622 Cash and cash equivalents divested on disposal of subsidiaries (54,042) (2,350) (2,350) Net cash (outflow)/inflow from investing activities - continuing operations (78,315) 10,263 (2,321) Cash flows from financing activities Dividends paid to Ordinary equity holders of the Company (3,113) (2,549) (5,667) Non-controlling interests and preferred security interests (203) (415) (394) Interest paid (excluding banking interest paid) (205) (516) (1,029) Proceeds from issue of ordinary shares 251 50 294 Net disposal of treasury shares - ordinary shares 524 399 223 Redemption of perpetual preferred callable securities - (4,923) (4,923) Proceeds from issue of subordinated and other debt 1,741 36 1,715 Subordinated and other debt repaid (130) (1,171) (11,164) Net cash outflow from financing activities - continuing operations (1,135) (9,089) (20,945) Net cash outflow - continuing operations (64,030) (2,535) (10,610) Net cash inflow - discontinued operations G1.1(c) 18,103 6,874 9,594 Effects of exchange rate changes on cash and cash equivalents 4,379 583 (1,290) Cash and cash equivalents at beginning of the year 100,334 102,640 102,640 Cash and cash equivalents at end of the year 58,786 107,562 100,334 Comprising Mandatory reserve deposits with central banks 98 19,677 94 Cash and cash equivalents 27,542 87,885 30,761 Included in assets held for sale and distribution Mandatory reserve deposits with central banks G1.2 21,596 - 19,222 Cash and cash equivalents G1.2 9,550 - 50,257 Total 58,786 107,562 100,334 (1) The six months ended 30 June 2017 and the year ended 31 December 2017 have been re-presented to reflect the Latin American businesses, Kotak and Old Mutual Bermuda as discontinued operations. In addition, the six months ended 30 June 2017 has been re-presented to reflect Nedbank and Quilter as discontinued operations, consistent with the year ended 31 December 2017.

Refer to notes A2 and G1 for more information. In line with market practice in South Africa, cash and cash equivalents in the cash flow statement above include mandatory reserve deposits with central banks. Except for mandatory reserve deposits with central banks of R21,694 million (June 2017: R19,677 million; December 2017: R19,316 million) and cash and cash equivalents consolidated as part of the consolidation of funds of R7,029 million (June 2017: R22,269 million; December 2017: R21,872 million), management do not consider that there are any material amounts of cash and cash equivalents which are not available for use in the Group's day to day operations. Consolidated statement of changes in equity For the six months ended 30 June 2018 Millions Number of shares issued and Share Share Merger Fair-value Rm Notes fully paid capital(1) premium(1) reserve reserve(2) Shareholders' equity at beginning of the period 4,933 10,150 19,324 20,639 190 Impact of adopting IFRS 9 and IFRS 15, net of taxation G5 - - - - 620 Restated opening balance 4,933 10,150 19,324 20,639 810 Total comprehensive income for the financial period Profit after tax for the financial period - - - - - Other comprehensive income - - - - (450) Total comprehensive income for the financial period - - - - (450) Transactions with the owners of the Company Contributions and distributions Dividends for the period C3 - - - - - Equity share-based payment transactions - - - - - Transfer between reserves(4) - - - - 297 Demerger of Quilter from Old Mutual plc - - - - - Merger reserve released from demerger of Quilter(5) - - - (19,506) - Other movements in share capital(6) 9 18 233 - - Total contributions and distributions 9 18 233 (19,506) 297 Changes in ownership and capital structure Capital reduction of Old Mutual plc(1) - (10,079) (19,557) - - Change in participation in subsidiaries - - - - - Total changes in ownership and capital structure - (10,079) (19,557) - - Total transactions with the owners of the Company 9 (10,061) (19,324) (19,506) 297 Shareholders' equity at end of the period 4,942 89 - 1,133 657 (1) On 22 June 2018, Old Mutual plc reduced the nominal value of its ordinary share capital and cancelled its share premium accounts through the creation of distributable reserves. As a result, R10,079 million and R19,557 million respectively were transferred to retained earnings. Refer to note A2 for more information. (2) The available-for-sale reserve is no longer applicable from 1 January 2018 due to the implementation of IFRS 9. Refer to note G5 for more information. (3) Included in the closing balance for other reserves is R394 million liability credit reserve on borrowed funds. The Group recognises fair value gains and losses on the borrowed funds designated at fair value through profit or loss. The cumulative fair value gains and losses as a result of changes in the credit risk of the issued bonds are recognised in other comprehensive income and not in profit or loss. The balance of the total fair value gains and losses on these instruments is recognised in profit or loss. (4) Transfers between reserves include R1,660 million transferred from the share-based payment reserve to retained earnings relating to Quilter (R1,136 million) and Old Mutual plc (R524 million) as a result of the accelerated vesting of employee share schemes. (5) As a result of the distribution and initial public offering of Old Mutual plc's entire shareholding in Quilter, merger reserves of R19,506 million were transferred to retained earnings. (6) Other movements in share capital and share premium are the issue of shares in Old Mutual plc to satisfy the exercise of share options (pre-exchange). Other movements in retained earnings represent movement in treasury shares. Foreign Total Property Share-based currency Attributable to non- revaluation payments Other translation Retained equity holders controlling Total reserve reserve reserves(3) reserve earnings of the parent interests equity 2,744 3,813 969 (3,932) 82,781 136,678 46,767 183,445 - - (914) - (2,398) (2,692) (1,628) (4,320) 2,744 3,813 55 (3,932) 80,383 133,986 45,139 179,125 - - - - 10,648 10,648 3,475 14,123 4 - 320 5,993 (153) 5,714 290 6,004 4 - 320 5,993 10,495 16,362 3,765 20,127 - - - - (3,113) (3,113) (1,931) (5,044) - (6) - - 107 101 (107) (6) (108) (1,901) (597) 216 2,093 - - - - - - - (42,935) (42,935) - (42,935) - - - - 19,506 - - - - - (348) - 1,834 1,737 - 1,737 (108) (1,907) (945) 216 (22,508) (44,210) (2,038) (46,248) - - - - 29,636 - - - - - - - (1,534) (1,534) 487 (1,047) - - - - 28,102 (1,534) 487 (1,047) (108) (1,907) (945) 216 5,594 (45,744) (1,551) (47,295) 2,640 1,906 (570) 2,277 96,472 104,604 47,353 151,957
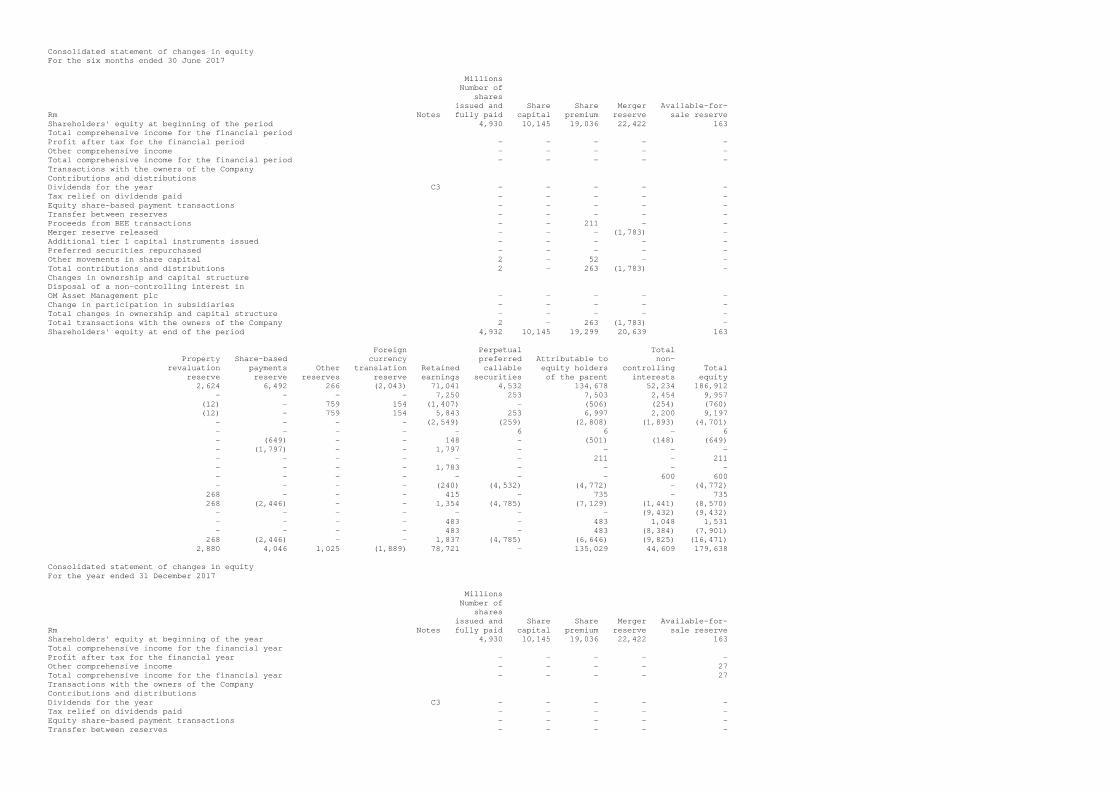
Consolidated statement of changes in equity For the six months ended 30 June 2017 Millions Number of shares issued and Share Share Merger Available-for- Rm Notes fully paid capital premium reserve sale reserve Shareholders' equity at beginning of the period 4,930 10,145 19,036 22,422 163 Total comprehensive income for the financial period Profit after tax for the financial period - - - - - Other comprehensive income - - - - - Total comprehensive income for the financial period - - - - - Transactions with the owners of the Company Contributions and distributions Dividends for the year C3 - - - - - Tax relief on dividends paid - - - - - Equity share-based payment transactions - - - - - Transfer between reserves - - - - - Proceeds from BEE transactions - - 211 - - Merger reserve released - - - (1,783) - Additional tier 1 capital instruments issued - - - - - Preferred securities repurchased - - - - - Other movements in share capital 2 - 52 - - Total contributions and distributions 2 - 263 (1,783) - Changes in ownership and capital structure Disposal of a non-controlling interest in OM Asset Management plc - - - - - Change in participation in subsidiaries - - - - - Total changes in ownership and capital structure - - - - - Total transactions with the owners of the Company 2 - 263 (1,783) - Shareholders' equity at end of the period 4,932 10,145 19,299 20,639 163 Foreign Perpetual Total Property Share-based currency preferred Attributable to non- revaluation payments Other translation Retained callable equity holders controlling Total reserve reserve reserves reserve earnings securities of the parent interests equity 2,624 6,492 266 (2,043) 71,041 4,532 134,678 52,234 186,912 - - - - 7,250 253 7,503 2,454 9,957 (12) - 759 154 (1,407) - (506) (254) (760) (12) - 759 154 5,843 253 6,997 2,200 9,197 - - - - (2,549) (259) (2,808) (1,893) (4,701) - - - - - 6 6 - 6 - (649) - - 148 - (501) (148) (649) - (1,797) - - 1,797 - - - - - - - - - - 211 - 211 - - - - 1,783 - - - - - - - - - - - 600 600 - - - - (240) (4,532) (4,772) - (4,772) 268 - - - 415 - 735 - 735 268 (2,446) - - 1,354 (4,785) (7,129) (1,441) (8,570) - - - - - - - (9,432) (9,432) - - - - 483 - 483 1,048 1,531 - - - - 483 - 483 (8,384) (7,901) 268 (2,446) - - 1,837 (4,785) (6,646) (9,825) (16,471) 2,880 4,046 1,025 (1,889) 78,721 - 135,029 44,609 179,638 Consolidated statement of changes in equity For the year ended 31 December 2017 Millions Number of shares issued and Share Share Merger Available-for- Rm Notes fully paid capital premium reserve sale reserve Shareholders' equity at beginning of the year 4,930 10,145 19,036 22,422 163 Total comprehensive income for the financial year Profit after tax for the financial year - - - - - Other comprehensive income - - - - 27 Total comprehensive income for the financial year - - - - 27 Transactions with the owners of the Company Contributions and distributions Dividends for the year C3 - - - - - Tax relief on dividends paid - - - - - Equity share-based payment transactions - - - - - Transfer between reserves - - - - -

Proceeds from BEE transactions - - 218 - - Merger reserve released - - - (1,783) - Additional tier 1 capital instruments issued - - - - - Preferred securities repurchased - - - - - Other movements in share capital 3 5 70 - - Total contributions and distributions 3 5 288 (1,783) - Changes in ownership and capital structure Disposal of a non-controlling interest in OM Asset Management plc - - - - - Change in participation in subsidiaries - - - - - Total changes in ownership and capital structure - - - - - Total transactions with owners of the Company 3 5 288 (1,783) - Shareholders' equity at end of the year 4,933 10,150 19,324 20,639 190 Foreign Perpetual Total Property Share-based currency preferred Attributable to non- revaluation payments Other translation Retained callable equity holders controlling Total reserve reserve reserves reserve earnings(1) securities of the parent interests equity 2,624 6,492 266 (2,043) 71,041 4,532 134,678 52,234 186,912 - - - - - - - - - - - - - 14,119 253 14,372 5,992 20,364 54 - 1,088 (1,889) (1,616) - (2,336) (270) (2,606) 54 - 1,088 (1,889) 12,503 253 12,036 5,722 17,758 - - - - (5,667) (259) (5,926) (3,617) (9,543) - - - - - 6 6 - 6 - (639) - - 532 - (107) - (107) - (2,040) - - 2,040 - - - - - - - - - - 218 - 218 - - - - 1,783 - - - - - - - - - - - 600 600 - - - - (240) (4,532) (4,772) - (4,772) 66 - (385) - 86 - (158) - (158) 66 (2,679) (385) - (1,466) (4,785) (10,739) (3,017) (13,756) - - - - - - - (9,432) (9,432) - - - - 703 - 703 1,260 1,963 - - - - 703 - 703 (8,172) (7,469) 66 (2,679) (385) - (763) (4,785) (10,036) (11,189) (21,225) 2,744 3,813 969 (3,932) 82,781 - 136,678 46,767 183,445 Notes to the unaudited condensed consolidated interim financial statements For the six months ended 30 June 2018 A: Significant accounting policies A1: Basis of preparation Statement of compliance Old Mutual Limited (the Company) is a company incorporated in South Africa. On 25 June 2018, the Company became the parent of Old Mutual plc through a share for share exchange, with the Company receiving the entire net asset value of Old Mutual plc, the original parent company of Old Mutual Limited and its subsidiaries, in exchange for the issue of ordinary shares of the Company to the original shareholders of Old Mutual plc. This was a reorganisation of the existing Group and, although there was a change in legal ownership, there was no change in the economic substance of the reporting entity. Therefore the transaction was not a business combination as defined by IFRS 3 'Business Combinations' and the unaudited condensed consolidated interim financial statements (interim financial statements) have consequently been prepared on a predecessor basis as a continuation of the existing Group. The interim financial statements for the six months ended 30 June 2018 consolidate the results of the Company and its subsidiaries (together the Group) and equity account the Group's interest in associates and joint ventures (other than those held by investment-linked insurance funds which are accounted for as investments at fair value through profit or loss). The interim financial statements comprise the consolidated statement of financial position at 30 June 2018, consolidated income statement, consolidated statement of comprehensive income, supplementary income statement, consolidated statement of changes in equity and consolidated statement of cash flows for the six months ended 30 June 2018 and selected explanatory notes. The interim financial statements have been prepared under the supervision of C.G. Troskie CA(SA) (Chief Financial Officer) on the going concern basis, which the Directors believe is appropriate. The Directors of the Group take full responsibility for the preparation of interim financial statements. The interim financial statements are prepared in accordance with IAS 34 'Interim Financial Reporting', as issued by the International Accounting Standards Board (IASB), the SAICA Financial Reporting Guides as issued by the Accounting Practices Committee, Financial Pronouncements as issued by the Financial Reporting Standards Council and the requirements of the Companies Act (Act No 71 of 2008) of South Africa. The accounting policies applied in the preparation of these interim financial statements are in terms of International Financial Reporting Standards (IFRS) as issued by the IASB and are consistent with those applied in the preparation of the Group's 2017 consolidated financial statements, except for changes arising from the adoption of IFRS 9 'Financial Instruments' and IFRS 15 'Revenue from Contracts with Customers', as set out in note G5 to the interim financial statements. These interim financial statements do not include all the notes typically included in the annual financial statements and should therefore be read in conjunction with the Group's audited consolidated financial statements at and for the year ended 31 December 2017. The interim financial statements are presented in South African rand, which is the Group's presentation currency.

Details for businesses classified as held for sale and distribution and as discontinued operations are set out in note G1. Comparative information Comparative information presented at and for the year ended 31 December 2017 within these interim financial statements, has been correctly extracted from the Group's audited consolidated financial statements for the year ended 31 December 2017 (financial statements) , re-presented for businesses classified as discontinued operations during the six months ended 30 June 2018, if appropriate, as described in note G1. Comparative information presented for the six months ended 30 June 2017 within these interim financial statements is that of Old Mutual plc converted to South African rand and re-presented for businesses classified as discontinued operations during the six months ended 30 June 2018. Comparative information for the six months ended 30 June 2017 is unaudited. The financial statements for the year ended 31 December 2017, were prepared for the purposes of Group reporting in accordance with IFRS and consolidate the financial information of Old Mutual plc and its subsidiaries and equity accounts the interest in associated undertakings and joint ventures (other than those held by investment-linked insurance funds and venture capital divisions which are accounted for as investments at fair value through profit or loss), after converting it to rand. This is consistent with the preparation of the Historical Financial Information of Old Mutual plc (HFI) as at and for the three years ended 31 December 2017 that was prepared solely for the inclusion in the Old Mutual Limited Prospectus and Pre Listing Statement published on 20 April 2018. The accounting policies adopted in the preparation of both the financial statements and the HFI, have been applied consistently to all periods presented. The information presented in the financial statements is equivalent to that presented in the HFI with the exception of the consolidated statement of changes in equity. In preparation of the Old Mutual Limited financial statements, in accordance with IFRS, certain components of equity have been re-presented as at 1 January 2015. The Group believes that it is more appropriate to reflect rand only components of equity at the historical rand rate as opposed to the exchange rate used at 1 January 2015, when converting Old Mutual plc balances from sterling to rand for the purposes of the HFI. The reserves and related amounts impacted are reductions to the available for sale reserve (R503 million), property revaluation reserve (R660 million) and share-based payment reserve (R1,001 million), with a corresponding increase of R2,164 million to retained earnings. Overall, this re-presentation is a transfer between reserves and has no impact on the shareholders equity or non-controlling interests of the Group. Translation of foreign operations The assets and liabilities of foreign operations are translated from their respective functional currencies into the Group's presentation currency, using the exchange rates at 30 June 2018, and their income and expenses using the average exchange rates for the period. Cumulative translation gains and losses up to 1 January 2015, being the effective date of the Group's conversion to IFRS, were reset to zero. Other than in respect of cumulative translation gains and losses up to 1 January 2015, cumulative unrealised gains or losses resulting from translation of functional currencies to the presentation currency are included as a separate component of shareholders' equity. To the extent that these gains and losses are effectively hedged, the cumulative effect of such gains and losses arising on the hedging instruments are also included in that component of shareholders' equity. Upon the disposal of subsidiaries the cumulative amount of exchange differences post 1 January 2015, deferred in shareholders' equity, net of attributable amounts in relation to hedged net investments, is recognised in profit or loss. The exchange rates used to translate the operating results, assets and liabilities of key foreign business segments to rand are: Six months ended Six months ended Year ended 30 June 2018 30 June 2017 31 December 2017 Statement of Statement of Statement of Income financial Income financial Income financial statement position statement position statement position (average rate) (closing rate) (average rate) (closing rate) (average rate) (closing rate) Sterling 16.9266 18.1266 16.6431 16.9831 17.1493 16.7565 US dollar 12.3056 13.7250 13.2183 13.0559 13.3107 12.3902 Kenyan shilling 0.1214 0.1361 0.1279 0.1258 0.1287 0.1201 Basis of preparation of Adjusted Headline Earnings Purpose of Adjusted Headline Earnings Adjusted Headline Earnings (AHE) is an alternative non IFRS profit measure used alongside IFRS profit to assess performance of the Group. It is calculated as headline earnings (note C1(c)) adjusted for items not reflective of the long term economic performance of the Group (note B3). AHE is one of the key performance indicators by which operational performance is monitored and managed, and it is one of a range of measures by which management performance and remuneration is assessed. In addition it is used in setting the dividend to be paid to shareholders. Due to the complexity introduced into IFRS profit by the transactions required to execute Managed Separation and the long term nature of the Group's operating businesses, management believes that AHE is an appropriate alternative basis by which to assess the operating results of the Group and that it enhances the comparability and understanding of the financial performance of the Group. AHE utilises headline earnings as defined by SAICA Circular 4/2018 as its base. Adjustments applied to headline earnings in order to calculate AHE remove the impact of certain IFRS accounting treatments where the asset treatment under IFRS is inconsistent with the measurement of the related policyholder liability, significant non-recurring expenses or income specifically related to material acquisitions, disposals or fundamental restructuring (such as Managed Separation), the results of businesses classified as discontinued operations and the results of residual plc, which is winding down and therefore its results will not form part of the long term performance of the Group. The Group Audit Committee regularly reviews the determination of AHE and the use of adjusting items to confirm that it remains an appropriate basis on which to analyse the operating performance of the Group. The Committee assesses refinements to the policy on a case by case basis, and seeks to minimise such changes in order to maintain consistency over time.

Scope of businesses included in AHE AHE includes the operating results of the Mass and Foundation Cluster, Personal Finance, Wealth and Investments, Old Mutual Corporate, Old Mutual Insure, Rest of Africa and Other Group Activities segments. These are considered to be the core continuing operations of the Group. Residual plc is considered to be non core as it is not part of the Group's principal operations due to the fact that it is in the process of winding down. Consequently it is removed from AHE Refer to note B1 for more information. The results of Nedbank, Quilter, the Latin American businesses, Old Mutual Bermuda and Kotak Mahindra Old Mutual Life Insurance Limited, are currently classified as discontinued operations in the IFRS consolidated income statement, and have therefore been excluded in the determination of AHE to aid comparability between financial years. Refer to note B1 and note G1 for more information. AHE per share Adjusted Headline Earnings per share (EPS) is calculated as AHE divided by adjusted weighted average number of shares (AHE WANS) (note C1(c)). The calculation of AHE WANS includes own shares held in policyholder and consolidated investment funds, and BEE trusts. The IFRS weighted average numbers of ordinary shares used to calculate basic earnings per share (WANS) is lower than the AHE WANS applied in the calculating AHE earnings per share (AHE WANS). This is because the AHE WANS is diluted to reflect the Group's BEE and policyholder fund shares as being in the hands of third parties, and is consistent with the treatment of the related revenue in AHE. Refer to note C1(a) for more information. A2: Significant corporate activity and business changes during the year Transactions during the period required to implement the managed separation strategy Reorganisation of the group structure The following transactions were effected during the period as part of the execution of Managed Separation: - On 6 March 2018, Old Mutual Limited was converted to a public company. - On 22 June 2018, Old Mutual plc reduced the nominal value of its ordinary share capital and cancelled its share premium account through the creation of distributable reserves in terms of a UK court sanctioned scheme. As a result, R10,079 million and R19,557 million respectively were transferred to retained earnings. On 25 June 2018, Old Mutual plc reclassified certain of its existing ordinary shares into 'A-ordinary shares'. These A-ordinary shares were then cancelled and an equivalent number of new ordinary shares were issued to Old Mutual Limited, the new parent company of Old Mutual plc. On 25 June 2018, the ordinary shares that were not classified as A- ordinary shares were transferred to Old Mutual Limited. Following these transactions, Old Mutual plc became a wholly owned subsidiary of Old Mutual Limited. Consequently, Old Mutual plc is no longer listed on the London Stock Exchange (LSE), Johannesburg Stock Exchange (JSE), Zimbabwe Stock Exchange (ZSE), Namibian Stock Exchange (NSX) or Malawi Stock Exchange (MSE). - On 25 June 2018, Old Mutual plc announced the closing of the initial public offering of 182.5 million shares, representing 9.6% of the total issued share capital of Quilter at a price of 2,588 cents (145 pence) per share by way of primary listing of Quilter shares on the LSE and secondary listing on the JSE. Total net proceeds arising from this transaction, after underwriting and other transaction costs, were R4,206 million. Further, on 25 June 2018, Old Mutual plc distributed R42,935 million, representing 86.6% of the total issued share capital of Quilter to the Old Mutual plc shareholders. The remaining 3.8% of the total issued share capital of Quilter is held by the Joint Share Ownership Plan (JSOP) Trustee on behalf of certain management and staff of Quilter. A profit on the demerger of Quilter of R2,852 million has been recognised in profit or loss. This includes foreign currency translation losses recycled to profit or loss of R394 million. In addition, merger reserves of R19,506 million have been transferred to retained earnings. Included in the initial public offering of 182.5 million shares, were 16.5 million shares that were subject to an over-allotment option. At 30 June 2018, the market value of these shares was R435 million (GBP24 million). On 26 July 2018, 2.7 million of these shares were partially exercised by underwriters, raising cash proceeds of R66 million (GBP3.8 million). On 21 August 2018, the remaining 13.8 million shares were sold, raising cash proceeds of R379 million (GBP20.5 million). - On 26 June 2018, Old Mutual Limited listed on the Main Board of the JSE with a standard listing on the LSE and secondary listings on the stock exchanges of Malawi, Namibia and Zimbabwe. Following the Group reorganisation, Old Mutual Limited consists of the Group's operating segments (Mass and Foundation Cluster, Personal Finance, Old Mutual Corporate, Wealth and Investments, Old Mutual Insure, Rest of Africa and Other Group Activities) , the Group's holding in Nedbank and Residual plc. Existing share based payment arrangements Following Managed Separation and the respective listings of Quilter and Old Mutual Limited, the ordinary shares held by various employee share schemes of the Old Mutual plc Group have been replaced by the ordinary shares of Quilter and Old Mutual Limited. The end result of the execution of the schemes was that for every three Old Mutual plc shares held, employee shareholders received one ordinary share in Quilter and three ordinary shares in Old Mutual Limited. This resulted in a modification of the underlying share award as Quilter shares became unrestricted in the hands of employees, subject to existing share-based payment arrangements of the Old Mutual plc Group. The distribution of Quilter shares to employee shareholders was a return of capital to shareholders and therefore employees were no longer subject to any vesting conditions of the existing share-based payment arrangements. As such it is viewed to be a partial settlement of the award which leads to an accelerated vesting of the IFRS 2 charge as it relates to the Quilter portion of the original award. The share for share exchange and the distribution of Quilter shares has led to an accelerated vesting charge of R282 million recognised in the IFRS consolidated income statement. This charge has been removed in the determination of AHE. Disposals announced during the period but not yet completed Disposal of the Latin American businesses

On 16 March 2018, the Group announced its agreement to sell the Latin American businesses, comprising OM Latin America Holdco UK Limited and AIVA Holding Group S.A, to Lilly Bermuda Capital Limited (SPV domiciled in Bermuda), owned by CMIG International Holding Private Limited. The transaction is currently subject to usual regulatory approvals and customary closing conditions. As at 30 June 2018, the sale of the Latin American businesses remains on track to be completed in the first half of 2019. The use of proceeds from the sale, expected to be R4,220 million ($307.5 million), will be assessed as part of the Group's Capital framework and in accordance with the dividend policy. As a consequence of the agreed sale, the Latin American businesses have been classified as held for sale and consequently as discontinued operations at 30 June 2018. Refer to note G1 for more information. Other activities during the year Lions Head Investments On 23 May 2018, Old Mutual Properties Investment Company (Pty) Ltd (OMP Investco), a subsidiary of Old Mutual Real Estate Holding Company (Pty) Ltd (OMREHC) purchased a controlling 60.81% stake in Lions Head Investments (LHI), a property management company based in Bulgaria. The transaction has been accounted for as a business combination in accordance with IFRS 3 'Business Combinations'. The purchase price paid for LHI amounted to R226 million (EUR15.5 million). The net asset value for the stake purchased was R229 million (EUR15.7 million). Consequently a gain on bargain purchase of R3 million (EUR0.2 million) has been recognised. On 14 June 2018, OMP Investco, through LHI, also purchased 100% of the equity of Portland Trust Developments s.r.l (Portland A&B / Oregon). The transaction has been accounted for as a business combination in accordance with IFRS 3 'Business Combinations'. The purchase price paid was R430 million (EUR27.6 million). The net asset value at the date of purchase was R422 million (EUR27.1 million), resulting in goodwill of R8 million (EUR0.5 million) being recognised. A3: Critical accounting estimates and judgements In the preparation of these interim financial statements, the Group is required to make estimates and judgements that affect items reported in the consolidated income statement, consolidated statement of financial position, other primary statements and related supporting notes. The critical accounting estimates and judgements made by management in applying the Group's accounting policies and the key sources of estimation uncertainty were the same as those that applied to the consolidated financial statements of Old Mutual Limited for the year ended 31 December 2017, with the exception of new critical accounting estimates detailed in note G5 arising from the changes in accounting policies. In the current and prior periods, the Group applied significant judgement in the classification of Nedbank, Quilter, the Latin American business and Old Mutual Bermuda as discontinued operations and Nedbank, Quilter and the Latin American businesses as assets and liabilities held for sale and distribution. These classifications did not have any valuation impact on the underlying assets and liabilities. Refer to note G1 for more information. B: Segment information B1: Basis of segmentation The execution of the Managed Separation strategy, as described in note A1 and note A2, constituted a reorganisation of the previous Old Mutual plc Group resulting in the formation of two new groups Old Mutual Limited and Quilter. The executive management team of Old Mutual Limited with the support of the Board, was responsible for assessment of performance and the allocation of resources of the continuing business operations during period under review. The reorganisation resulted in a change in the composition of the Group's operating segments that is reported to the Chief Operating Decision Maker (CODM), viewed to be the executive management team of Old Mutual Limited. As such the new segment structure has been reflected in the required disclosures in both the current year and comparative information. The Group manages its business through the following operational segments, which are supported by central shareholder activities and enabling functions. - Mass and Foundation Cluster: A retail segment that operates in Life and Savings, Banking and Lending. It provides simple financial services products to customers in the low income and lower middle income markets. These products are divided into four categories being (i) risk, including funeral cover, (ii) savings, (iii) lending and (iv) transactional products. - Personal Finance: A retail segment that operates primarily in Life and Savings. It provides holistic financial advice and long-term savings, investment, income and risk products and targets the middle income market. - Wealth and Investments: Operates across Life and Savings and Asset Management through 4 distinct businesses: (i) Wealth, a retail segment targeting high income and high net worth individuals, that provides vertically integrated advice, investment solutions and funds, and other financial solutions, (ii) Asset Management comprising 8 investment boutiques that provide asset management services to retirement and benefit funds and to the retail market in partnership with Wealth (iii) Alternatives, an unlisted alternatives investment business, and (iv) Specialised Finance, a proprietary risk and investment capability which manages and supports the origination of assets. - Old Mutual Corporate: Operates in Life and Savings and primarily provides group risk, investments, annuities and consulting services to employee-sponsored retirement and benefit funds. - Old Mutual Insure: Provides Property & casualty insurance products through three operational businesses: (i) personal, (ii) commercial, and (iii) corporate. - Rest of Africa: Operates in Life and Savings, Property & casualty (including health insurance), Banking and Lending (including micro-lending) and Asset Management. The segment operates in twelve countries across three regions: SADC, East Africa and West Africa. - Other Group Activities: Comprises the activities related to the management of the Group's capital structure. This includes the management

of shareholder investment assets including the associated shareholder investment return and third-party borrowings including the associated finance costs. Also included are net assets and operations of Residual plc and investments in associated undertakings. Subsequent to the Nedbank unbundling, the Group intends to retain a minority shareholding of 19.9%, and this will be managed as part of Other Group Activities. Presentation and Disclosure Results from Operations measures the operational performance of the Group and together with items such as investment return, finance costs and income from associated undertakings, the Group's profit measure, AHE is derived. AHE by definition excludes discontinued operations and Residual plc, which do not form part of core continuing businesses of Group, and certain of the discontinued operations are a function of the reorganisation and the application of predecessor accounting. Nedbank, Quilter, the Latin American businesses, Kotak and Old Mutual Bermuda have been classified as discontinued operations. In line with IFRS 8 par 28 (b), discontinued operations have been disclosed as a reconciling item between the segment profit measure and total IFRS profit after tax of the Group. Balance sheet measures provided to the CODM on a regular basis comprise of Return on Net Asset Value and Invested Shareholder Assets at a Group and regional level. Balance sheet measures at a segment level have not been provided to the CODM in the period under review. The Group is in the process of a fundamental multi-year transformation of its finance function, transitioning from a legal entity view to a segment approach to better reflect the balance sheet economics and levers to drive value. B2: Reconciliation of Results from operations to Profit after tax for the six months ended 30 June 2018 Elimination Mass and Old of intra- Total Discontinued Foundation Personal Wealth and Old Mutual Mutual Rest of Other Group segment continuing operations Rm Notes Cluster Finance Investments Corporate Insure Africa Activities transactions operations (note G1) Total Results from Operations 1,534 918 783 854 370 478 (89) - 4,848 - 4,848 Shareholder investment return - - - - 55 609 513 - 1,177 - 1,177 Finance costs - - - - (22) - (315) - (337) - (337) Income from associated undertakings - - - - - - 1,379 - 1,379 - 1,379 Adjusted Headline Earnings before tax and non-controlling interests 1,534 918 783 854 403 1,087 1,488 - 7,067 - 7,067 Shareholder tax (463) (270) (182) (238) (115) (251) (47) - (1,566) - (1,566) Non-controlling interests (63) 1 (1) - (4) (30) (11) - (108) - (108) Adjusted Headline Earnings 1,008 649 600 616 284 806 1,430 - 5,393 - 5,393 Adjustments Investment return adjustment for Group equity and debt instruments held in policy holder funds - - - - - - 620 - 620 - 620 Impact of restructuring (20) (30) (38) (13) (68) (47) (234) - (450) - (450) Profit from discontinued operations after tax - - - - - - (226) (226) 4,762 4,536 Income from associated undertakings - 19.9% of Nedbank - - - - - - (1,398) - (1,398) - (1,398) Residual plc - - - - - - (901) - (901) - (901) Headline earnings 988 619 562 603 216 759 (483) (226) 3,038 4,762 7,800 Adjustments Headline earnings adjustments C1(c) - - - - (1) 1 2,869 - 2,869 (21) 2,848 Profit for the financial period attributable to equity holders of the parent 988 619 562 603 215 760 2,386 (226) 5,907 4,741 1 10,648 Non-controlling interests Ordinary shares 63 (1) 1 - 4 30 11 - 108 3,082 3,190 Preferred securities - - - - - - - - - 285 285 Profit after tax for the financial period 1,051 618 563 603 219 790 2,397 (226) 6,015 8,108 1 14,123 B2: Reconciliation of Results from operations to Profit after tax for the six months ended 30 June 2017 Elimination Mass and Old Old Other of intra- Total Discontinued Foundation Personal Wealth and Mutual Mutual Rest of Group segment continuing operations Rm Notes Cluster Finance Investments Corporate Insure Africa Activities transactions operations (note G1) Total Results from Oerations 1,306 1,394 638 800 200 368 (176) - 4,530 - 4,530 Shareholder investment return - - - - 38 1,259 572 - 1,869 - 1,869 Finance costs - - - - - - (286) - (286) - (286) Income from associated undertakings - - - - - - 1,036 - 1,036 - 1,036 Adjusted Headline Earnings before tax and non-controlling interests 1,306 1,394 638 800 238 1,627 1,146 - 7,149 - 7,149 Shareholder tax (413) (362) (166) (226) (67) (235) (131) - (1,600) - (1,600) Non-controlling interests (64) 1 (1) - (1) (125) - - (190) - (190) Adjusted Headline Earnings 829 1,033 471 574 170 1,267 1,015 - 5,359 - 5,359 Adjustments: Investment return adjustment for Group equity and debt instruments held in policy holder funds - - - - - - 106 - 106 - 106 Impact of restructuring - - - - - - (81) - (81) - (81) Profit from discontinued operations after tax - - - - - - - (378) (378) 4,576 4,198 Income from associated undertakings - 19.9% of Nedbank - - - - - - (1,049) - (1,049) - (1,049) Residual plc - - - - - - (1,507) - (1,507) - (1,507) Headline earnings 829 1,033 471 574 170 1,267 (1,516) (378) 2,450 4,576 7,026

Adjustments: Headline earnings adjustments C1(c) - - - - - (720) 813 - 93 131 224 Dividends on preferred securities - - - - - - 253 - 253 - 253 Profit for the financial period attributable to equity holders of the parent 829 1,033 471 574 170 547 (450) (378) 2,796 4,707 7,503 Non-controlling interests Ordinary shares 64 (1) 1 - 1 (339) (164) - (438) 2,594 2,156 Preferred securities - - - - - - - - - 298 298 Profit after tax for the financial period 893 1,032 472 574 171 208 (614) (378) 2,358 7,599 9,957 B2: Reconciliation of Results from operations to Profit after tax for the year ended 31 December 2017 Elimination Mass and Old Old Other of intra- Total Discontinued Foundation Personal Wealth and Mutual Mutual Rest of Group segment continuing operations Rm Notes Cluster Finance Investments Corporate Insure Africa Activities transactions operations (note G1) Total Results from Operations 3,052 3,150 1,490 1,576 524 1,081 (506) - 10,367 - 10,367 Shareholder investment return - - - - 436 3,071 1,413 - 4,920 - 4,920 Finance costs - - - - - - (622) - (622) - (622) Income from associated undertakings - - - - - - 2,305 - 2,305 - 2,305 Adjusted Headline Earnings before tax and non-controlling interests 3,052 3,150 1,490 1,576 960 4,152 2,590 - 16,970 - 16,970 Shareholder tax (948) (880) (304) (442) (213) (453) (295) - (3,535) - (3,535) Non-controlling interests (135) 2 (2) - (17) (344) 8 - (488) - (488) Adjusted Headline Earnings 1,969 2,272 1,184 1,134 730 3,355 2,303 - 12,947 - 12,947 Adjustments Investment return adjustment for Group equity and debt instruments held in policy holder funds - - - - - - (1,355) - (1,355) - (1,355) Impact of restructuring - - 213 - - (267) - (54) - (54) Profit from discontinued operations after tax - - - - - - - (465) (465) 9,335 8,870 Income from associated undertakings - 19.9% of Nedbank - - - - - - (2,346) - (2,346) - (2,346) Residual plc - - - - - - (4,918) - (4,918) - (4,918) Headline earnings 1,969 2,272 1,397 1,134 730 3,355 (6,583) (465) 3,809 9,335 13,144 Adjustments Headline earnings adjustments C1(c) - - - - (11) (728) 1,918 - 1,179 (204) 975 Dividends from preferred securities - - - - - - 253 - 253 - 253 Profit for the financial period attributable to equity holders of the parent 1,969 2,272 1,397 1,134 719 2,627 (4,412) (465) 5,241 9,131 14,372 Non-controlling interests Ordinary shares 135 (2) 2 - 17 (122) (169) - (139) 5,541 5,402 Preferred securities - - - - - - - - - 590 590 Profit after tax for the financial period 2,104 2,270 1,399 1,134 736 2,505 (4,581) (465) 5,102 15,262 20,364 B3: Headline earnings adjusting items Adjusted Headline Earnings (AHE) is the Group's alternative profit measure used by management to assess the performance of the Group. It is calculated as headline earnings in accordance with JSE listing requirements adjusted for items not reflective of the long term economic performance of the Group. The adjustments from headline earnings to AHE are explained below. (a) Investment return adjustment for Group equity and debt instruments held in policyholder funds Represents the investment returns on policyholder investments in Group equity and debt instruments held by the Group's policyholder funds. This include investments in the Company's ordinary shares and the subordinated debt and ordinary shares issued by subsidiaries of the Group. These investment returns are eliminated within the consolidated income statement in arriving at profit before tax, but are added back in the calculation of AHE. This ensures consistency with the measurement of the related policyholder liability. During the six months ended 30 June 2018, the investment return adjustment decreased AHE by R620 million (six months ended 30 June 2017: R106 million decrease; year ended 31 December 2017: R1,355 million increase). (b) Impact of restructuring Represents the elimination of non-recurring expenses or income related to material acquisitions, disposals or a fundamental restructuring of the Group (such as Managed Separation). This adjustment would therefore include items such as the costs or income associated with completed acquisitions or disposals and the release of any acquisition date provisions. These items are removed from AHE as they are not representative of the operating activity of the Group and by their nature they are not expected to persist in the long term. (c) Discontinued operations Represents the removal of the net profit associated with discontinued operations. These business are not considered part of the Group's principal operations due to the fact they have been or are in the process of being sold or distributed and therefore will not form part of the Group going forward. The profit attributable to these business is therefore removed from AHE. For the six months ended 30 June 2018 this adjustment includes the profit attributable to Quilter, Nedbank, the Latin American businesses and Old Mutual Bermuda. For the six months ended 30 June 2017 and the year ended 31 December 2017, discontinued operations also includes the profit related to Kotak. (d) Income from associated undertakings Represents the reversal of the associate income in respect of the 19.9% shareholding in Nedbank, which is reported as part of AHE. In accordance with IFRS, the Nedbank shareholding of approximately 54% is classified as held for distribution and presented as part of the discontinued operations in the consolidated income statement and is therefore included in the adjustment labelled as discontinued operations. This adjustment ensures that these earnings are not double counted in the reconciliation.

(e) Residual plc Represents the elimination of the net losses associated with the operations of the Residual plc. Residual plc is not considered part of the Group's principal operations due to the fact that it is in the process of winding down and therefore the associated costs are removed from AHE. During the six months ended 30 June 2018, the loss attributable to the Residual plc of R901 million (June 2017: R1,507 million) mainly related to transaction costs associated with the finalisation of Managed Separation and costs incurred in winding down the former Old Mutual plc head office operations. C: Key performance information C1: Earnings and earnings per share Six months Six months Year ended ended ended 30 June 30 June 31 December Cents Source of guidance Notes 2018 2017 2017 Basic earnings per share IFRS C1(a) 229.4 154.7 304.7 Diluted earnings per share IFRS C1(b) 225.5 151.4 297.5 Headline earnings per share JSE Listing Requirements C1(c) 168.1 149.9 283.7 Diluted headline earnings per share JSE Listing Requirements C1(c) 164.8 146.7 276.8 (a) Basic earnings per share Basic earnings per share is calculated by dividing the profit for the financial period attributable to ordinary equity shareholders of the parent by the weighted average number of ordinary shares in issue during the year excluding own shares held in policyholder and consolidated investment funds, Employee Share Ownership Plan Trusts (ESOP), Black Economic Empowerment trusts and other related undertakings. These shares are regarded as treasury shares. The table below reconciles the profit attributable to equity holders of the parent to profit attributable to ordinary equity holders: Rm Six months Year Six months ended ended ended 30 June 31 December 30 June 2017 2017 Rm Notes 2018 (Re-presented)(1) (Re-presented)(1) Profit for the financial period attributable to equity holders of the parent from continuing operations 5,907 2,796 5,241 Profit for the financial period attributable to equity holders of the parent from discontinued operations G1.1(a) 4,741 4,707 9,131 Profit for the financial period attributable to equity holders of the parent 10,648 7,503 14,372 Dividends paid to holders of perpetual preferred callable securities, net of tax credits - (253) (253) Profit attributable to ordinary equity holders 10,648 7,250 14,119 (1) The six months ended 30 June 2017 and the year ended 31 December 2017 have been re-presented to reflect the Latin American businesses, Kotak and Old Mutual Bermuda as discontinued operations. In addition, the six months ended 30 June 2017 has been re-presented to reflect Nedbank and Quilter as discontinued operations, consistent with the year ended 31 December 2017. Refer to notes A2 and G1 for more information. Dividends paid to holders of perpetual preferred callable securities of R253 million for the six months ended 30 June 2017 and year ended 31 December 2017 are stated net of tax credits of R6 million. All of the outstanding perpetual preferred callable securities were redeemed on 3 February 2017. The table below summarises the calculation of the weighted average number of ordinary shares for the purposes of calculating basic earnings per share: Six months Six months Year ended ended ended 30 June 30 June 31 December Millions 2018 2017 2017 Weighted average number of ordinary shares in issue 4,934 4,930 4,931 Shares held in charitable foundations and trusts (19) (21) (21) Shares held in ESOP and similar trusts (114) (138) (134) Adjusted weighted average number of ordinary shares used to calculate Adjusted Headline Earnings per share 4,801 4,771 4,776 Shares held in policyholder and consolidated investment funds (159) (80) (141) Shares held in Black Economic Empowerment trusts (1) (4) (2) Weighted average number of ordinary shares used to calculate basic earnings per share 4,641 4,687 4,633 Basic earnings per ordinary share (cents) 229.4 154.7 304.7 (b) Diluted earnings per share Diluted earnings per share recognises the dilutive impact of shares and options held in ESOP and similar trusts and Black Economic Empowerment trusts, to the extent they have value, in the calculation of the weighted average number of shares, as if the relevant shares were in issue for the full period. The table below reconciles the profit attributable to ordinary equity holders to diluted profit attributable to ordinary equity holders and

summarises the calculation of weighted average number of shares for the purpose of calculating diluted basic earnings per share: Six months Six months Year ended ended ended 30 June 30 June 31 December Note 2018 2017 2017 Profit attributable to ordinary equity holders (Rm) 10,648 7,250 14,119 Dilution effect on profit relating to share options issued by subsidiaries (Rm) (68) (33) (120) Diluted profit attributable to ordinary equity holders (Rm) 10,580 7,217 13,999 Weighted average number of ordinary shares (millions) C1(a) 4,641 4,687 4,633 Adjustments for share options held by ESOP and similar trusts (millions) 49 78 70 Adjustments for shares held in Black Economic Empowerment trusts (millions) 1 3 2 Weighted average number of ordinary shares used to calculate diluted earnings per share (millions) 4,691 4,768 4,705 Diluted earnings per ordinary share (cents) 225.5 151.4 297.5 (c) Headline earnings per share The Group is required to calculate headline earnings per share (HEPS) in accordance with the Johannesburg Stock Exchange (JSE) Listing Requirements, determined by reference to the South African Institute of Chartered Accountants' circular 04/2018 'Headline Earnings'. The table below sets out a reconciliation of basic EPS and HEPS in accordance with that circular. Disclosure of HEPS is not a requirement of IFRS, but it is a commonly used measure of earnings in South Africa. The table below reconciles the profit for the financial year attributable to equity holders of the parent to headline earnings and summarises the calculation of basic HEPS: Six months Six months Year ended ended ended 30 June 30 June 31 December 2018 2017 2017 Net of tax Net of tax Net of tax and non- and non- and non- controlling controlling controlling Notes Gross interests Gross interests Gross interests Profit for the financial period attributable to equity holders of the parent 10,648 7,503 14,372 Dividends paid to holders of perpetual preferred callable securities - (253) (253) Profit attributable to ordinary equity holders 10,648 7,250 14,119 Adjustments: Impairments of intangible assets and property, plant and equipment (IAS36) 56 21 1,186 720 1,667 1,080 (Profit)/loss on disposal of property and equipment (IAS16) (15) (14) 22 12 42 26 Profit on disposal of subsidiaries, associated undertakings and strategic investments (including amounts recycled from the foreign currency translation reserve) (IFRS3) (2,855) (2,855) (815) (956) (2,151) (2,081) Total adjustments (2,814) (2,848) 393 (224) (442) (975) Headline earnings 7,800 7,026 13,144 Dilution effect on earnings relating to share options issued by subsidiaries (68) (33) (120) Diluted headline earnings (Rm) 7,732 6,993 13,024 Weighted average number of ordinary shares (millions) C1(a) 4,641 4,687 4,633 Diluted weighted average number of ordinary shares (millions) C1(b) 4,691 4,768 4,705 Headline earnings per share (cents) 168.1 149.9 283.7 Diluted headline earnings per share (cents) 164.8 146.7 276.8 C2: Net asset value per share and tangible net asset value per share Net asset value per share is calculated as total assets minus total liabilities divided by the weighted average number of ordinary shares in issue at 30 June 2018. Net tangible asset value per share is calculated as total assets minus goodwill and other intangible assets minus total liabilities divided by the total number of shares in issue at 30 June 2018. At At At 30 June 30 June 31 December Rand 2018 2017 2017 Net asset value per share 30.8 36.4 37.2 Net tangible asset value per share 29.5 28.1 35.8 C3: Dividends Six months Six months Year ended ended ended Ordinary dividend 30 June 30 June 31 December Rm payment date 2018 2017 2017 2016 Second interim dividend paid - 3.39p (53.55c) per 11 3/7p share 28 April 2017 - 2,549 2,549

2017 Interim dividend paid - 3.53p (65.35c) per 11 3/7p share 31 October 2017 - - 3,118 2017 Second interim dividend paid - 3.57p (66.50c) per 11 3/7p share 30 April 2018 3,113 - - Dividends to ordinary equity holders 3,113 2,549 5,667 Dividends paid to holders of perpetual preferred callable securities - 259 259 Dividend payments for the period 3,113 2,808 5,926 The total dividend paid to ordinary equity holders is calculated using the number of shares expected to be in issue at the record date less own shares held in ESOP trusts, life funds of Group entities, Black Economic Empowerment trusts and related undertakings. As a consequence of exchange control arrangements, dividends to shareholders holding shares issued through/from the company's secondary listings in Africa (being Namibia, Malawi and Zimbabwe) are settled through Dividend Access Trusts established for that purpose The Directors have declared an interim dividend of 45 cents per ordinary share and a special dividend of 100 cents per ordinary share. These dividends will be paid on 16 October 2018 to shareholders on the South African register and Malawi, Namibia and Zimbabwe branch registers at the close of business on Tuesday, 18 September 2018 and to shareholders on the UK register at the close of business on Wednesday, 19 September 2018. On 3 February 2017, all of the Group's outstanding perpetual preferred callable securities were redeemed. At this date a final dividend payment of R259 million was made to the holders of the securities. D: Other consolidated income statement notes D1 Analysis of the underlying other operating and administrative expense base The table below provides an analysis of the underlying operating and administrative expense base. Analysis of the underlying other operating and administrative Six months Year expense base Six months ended ended ended 30 June 31 December 30 June 2017 2017 Rm 2018 (Re-presented)(1) (Re-presented)(1) Total other operating and administrative expenses 12,157 12,427 25,566 Perimeter adjustments Residual plc and Old Mutual Bermuda (1,374) (647) (2,551) Consolidation of funds (263) (338) (515) Elimination of transactions with discontinued operations 159 185 350 Expenses excluded from cost base Amortisation of acquired intangible assets (35) (205) (252) Impairment of goodwill and other intangible assets - (1,192) (1,478) Operational finance costs (855) (588) (1,096) Investment management expenses excluded from operating and administrative expenses (791) (855) (2,173) Cell captive share of costs (243) (299) - Restructuring costs including one-off business standalone costs (358) (81) (237) Underlying operating and administrative expense base 8,397 8,407 17,614 (1) The six months ended 30 June 2017 and the year ended 31 December 2017 have been re-presented to reflect the Latin American businesses, Kotak and Old Mutual Bermuda as discontinued operations. In addition, the six months ended 30 June 2017 has been re-presented to reflect Nedbank and Quilter as discontinued operations, consistent with the year ended 31 December 2017. Refer to notes A2 and G1 for more information. E: Financial assets and liabilities E1: Categories of financial instruments The analysis of financial assets and liabilities of the Group's continuing businesses into their categories as defined in IFRS 9 'Financial Instruments' is set out in the tables below. Assets and liabilities of a non-financial nature, or financial assets and liabilities that are specifically excluded from the scope of IFRS 9, are reflected in the non-financial assets and liabilities category. The Group has taken advantage of the exemption in paragraph 7.2.15 of IFRS 9 from restating prior periods in respect of IFRS 9's classification and measurement (including impairment) requirements. All gains and losses on measuring the financial assets and liabilities at each reporting date are included in the determination of profit or loss for the period. Information about the methods and assumptions used in determining fair value is included in note E2. At 30 June 2018 Fair value(note E3)(1) Mandatorily Designated fair value fair value Non- through through financial profit or profit or Amortised assets and Rm Total loss loss cost liabilities Assets Mandatory reserve deposits with central banks 98 - - 98 - Investments in associated undertakings and joint ventures(2) 2,265 - - - 2,265 Reinsurers' share of policyholder liabilities 7,898 - - - 7,898

Loans and advances 24,618 - - 24,618 - Investments and securities 750,370 1,985 741,320 7,065 - Trade, other receivables and other assets 21,119 - - 19,205 1,914 Derivative financial instruments 3,347 3,347 - - - Cash and cash equivalents 27,542 - - 27,542 - Total assets that include financial instruments 837,257 5,332 741,320 78,528 12,077 Assets held for sale and distribution 1,020,757 - - - 1,020,757 Total other non-financial assets 54,548 - - - 54,548 Total assets 1,912,562 5,332 741,320 78,528 1,087,382 Liabilities Life insurance contract liabilities 152,108 - - - 152,108 Investment contract liabilities with discretionary participating features 201,691 201,691 Investment contract liabilities 296,547 - 296,547 - - Borrowed funds 21,132 - 14,636 6,496 - Third-party interest in consolidated funds 86,665 - 86,665 - - Trade, other payables and other liabilities 45,415 - 753 34,796 9,866 Amounts owed to bank depositors 16,254 - - 16,254 - Derivative financial instruments 4,892 4,892 - - - Total liabilities that include financial instruments 824,704 4,892 398,601 57,546 363,665 Liabilities held for sale and distribution 917,713 - - - 917,713 Total other non-financial liabilities 18,188 - - - 18,188 Total liabilities 1,760,605 4,892 398,601 57,546 1,299,566 (1) As explained in note G5 the Group adopted IFRS 9 'Financial Instruments' for the first time in 2018. Although IFRS 9 introduced new classification and measurement categories, the majority of the Group's financial assets and liabilities continue to be measured at FVTPL after the implementation of IFRS 9. (2) Investments in associated undertakings and joint ventures classified as non-financial assets and liabilities are equity accounted. At 31 December 2017 Fair value (note E3)(1) Amortised cost Available- Financial Non- for-sale liabilities financial Held-for- financial Loans and amortised assets and Rm Total trading Designated assets receivables cost liabilities Assets Mandatory reserve deposits with central banks 94 - - - 94 - - Investments in associated undertakings and joint ventures(2) 1,789 - - - - - 1,789 Reinsurers' share of policyholder liabilities 4,220 - - - 25 - 4,195 Loans and advances 21,483 - - - 21,483 - - Investments and securities 722,249 - 721,328 921 - - - Trade, other receivables and other assets 21,875 - - - 20,675 - 1,200 Derivative financial instruments 4,101 4,101 - - - - - Cash and cash equivalents 30,761 - - - 30,761 - - Total assets that include financial instruments 806,572 4,101 721,328 921 73,038 - 7,184 Assets held for sale and distribution 2,188,443 - - - - - 2,188,443 Total other non-financial assets 51,871 - - - - - 51,871 Total assets 3,046,886 4,101 721,328 921 73,038 - 2,247,498 Liabilities Life insurance contract liabilities 159,514 - - - - - 159,514 Investment contract liabilities with discretionary participating features 193,425 - - - - - 193,425 Investment contract liabilities 288,164 - 288,164 - - - - Third-party interest in consolidated funds 81,573 - 81,573 - - - - Borrowed funds 18,866 - 13,191 - - 5,675 - Trade, other payables and other liabilities 42,355 - 2,039 - - 30,437 9,879 Amounts owed to bank depositors 12,440 - - - - 12,440 - Derivative financial instruments 4,498 4,498 - - - - - Total liabilities that include financial instruments 800,835 4,498 384,967 - - 48,552 362,818 Liabilities held for sale and distribution 2,043,759 - - - - - 2,043,759 Total other non-financial liabilities 18,847 - - - - - 18,847 Total liabilities 2,863,441 4,498 384,967 - - 48,552 2,425,424 (1) As explained in note G5, the Group adopted IFRS 9 'Financial Instruments' for the first time in 2018 and has taken advantage of the exemption in paragraph 7.2.15 of IFRS 9 from restating prior periods in respect of IFRS 9's classification and measurement (including impairment) requirements (2) Investments in associated undertakings and joint ventures classified as non-financial assets and liabilities are equity accounted.

E2: Fair values of financial assets and liabilities The description of the determination of fair value and the fair value hierarchies of financial assets and liabilities described in this section applies to financial assets and liabilities for all the businesses. (a) Determination of fair value The best evidence of fair value is a quoted price in an active market. In the event that the market for a financial asset or liability is not active, or quoted prices cannot be obtained without undue effort, another valuation technique is used. In general, the following inputs are taken into account when evaluating the fair value of financial instruments: - Assessing whether instruments are trading with sufficient frequency and volume, that they can be considered liquid - The inclusion of a measure of the counterparties' non-performance risk in the fair-value measurement of loans and advances, which involves the modelling of dynamic credit spreads - The inclusion of credit valuation adjustment (CVA) and debit valuation adjustment (DVA) in the fair-value measurement of derivative instruments - The inclusion of own credit risk in the calculation of the fair value of financial liabilities. There have been no significant changes in the valuation techniques applied when valuing financial instruments. The general principles applied to those instruments measured at fair value are outlined below: Reinsurers' share of policyholder liabilities Reinsurers' share of policyholder liabilities are measured on a basis that is consistent with the measurement of the provisions held in respect of the related insurance contracts. Reinsurance contracts which cover financial risk are measured at fair value of the underlying assets. Loans and advances Loans and advances include mortgage loans, other asset-based loans, including collateralised debt obligations, and other secured and unsecured loans. In the absence of an observable market for these instruments, the fair value is determined by using internally developed models that are specific to the instrument and that incorporate all available observable inputs. These models involve discounting the contractual cash flows by using a credit-adjusted zero-coupon rate. Investments and securities Investments and securities include government and government-guaranteed securities, listed and unlisted debt securities, preference shares and debentures, listed and unlisted equity securities, listed and unlisted pooled investments (see below), short-term funds and securities treated as investments and certain other securities. Pooled investments represent the Group's holdings of shares/units in open-ended investment companies, unit trusts, mutual funds and similar investment vehicles. Pooled investments are recognised at fair value. The fair values of pooled investments are based on widely published prices that are regularly updated or models based on the market prices of investments held in the underlying pooled investment funds. Other investments and securities that are measured at fair value are measured at observable market prices where available. In the absence of observable market prices, these investments and securities are fair valued utilising one or more of the following techniques: discounted cash flows, the application of an EBITDA multiple or any other relevant technique. Investments in associated undertakings and joint ventures held by investment-linked insurance funds and venture capital divisions Investments in associated undertakings and joint ventures are valued using appropriate valuation techniques. These techniques may include price earnings multiples, discounted cash flows or the adjusted value of similar completed transactions. Derivative financial instruments The fair value of derivatives is determined with reference to the exchange traded prices of the specific instruments. In situations where the derivatives are traded over the counter the fair value of the instruments is determined by the utilisation of option pricing models. Investment contract liabilities The fair value of investment contract liabilities is determined with reference to the fair value of the underlying funds that are held by the Group. Third-party interests in consolidation of funds Third-party interests in consolidation of funds are measured at the attributable net asset value of each fund. Amounts owed to bank depositors The fair values of amounts owed to bank depositors correspond with the carrying amount shown in the consolidated statement of financial position, which generally reflects the amount payable on demand. Borrowed funds The fair values of amounts included in borrowed funds are based on quoted market prices at the reporting date where applicable, or by reference to quoted prices of similar instruments. Other financial assets and liabilities The fair values of other financial assets and liabilities (comprising cash and cash equivalents; cash with central banks; trade, other

receivables and other assets; and trade, other payables and other liabilities) reasonably approximate their carrying amounts as included in the consolidated statement of financial position as they are short-term in nature or re-price to current market rates frequently. (b) Fair value hierarchy Fair values are determined according to the following hierarchy. Description of hierarchy Types of instruments classified in the respective levels Level 1 - quoted market prices: financial assets and liabilities with Listed equity securities, listed government securities and other quoted prices for identical instruments in active markets. listed debt securities and similar instruments that are actively traded, actively traded pooled investments, certain quoted derivative assets and liabilities, listed borrowed funds, reinsurance share of policyholder liabilities and investment contract liabilities directly linked to other Level 1 financial assets. Level 2 - valuation techniques using observable inputs: financial Unlisted equity and debt securities where the valuation is based on assets and liabilities with quoted prices for similar instruments in models involving no significant unobservable data, with a majority active markets or quoted prices for identical or similar instruments determined with reference to observable prices. in inactive markets and financial assets and liabilities valued using models where all significant inputs are observable. Certain loans and advances, certain privately placed debt instruments, third-party interests in consolidated funds and amounts owed to bank depositors. Level 3 - valuation techniques using significant unobservable Unlisted equity and securities with significant unobservable inputs, inputs: financial assets and liabilities valued using valuation securities where the market is not considered sufficiently active, techniques where one or more significant inputs are including certain inactive pooled investments, and derivatives unobservable. embedded in certain portfolios of insurance contracts where the derivative is not closely related to the host contract and the valuation contains significant unobservable inputs. The judgement as to whether a market is active may include, for example, consideration of factors such as the magnitude and frequency of trading activity, the availability of prices and the size of bid/offer spreads. In inactive markets, obtaining assurance that the transaction price provides evidence of fair value or determining the adjustments to transaction prices that are necessary to measure the fair value of the asset or liability requires additional work during the valuation process. All businesses have significant processes in place to perform reviews of the appropriateness of the valuation of Level 3 instruments. The majority of valuation techniques employ only observable data and so the reliability of the fair value measurement is high. However, certain financial assets and liabilities are valued on the basis of valuation techniques that feature one or more significant inputs that are unobservable and, for them, the derivation of fair value is more judgemental. A financial asset or liability in its entirety is classified as valued using significant unobservable inputs if a significant proportion of that asset or liability's carrying amount is driven by unobservable inputs. In this context, 'unobservable' means that there is little or no current market data available for which to determine the price at which an arm's length transaction would be likely to occur. It generally does not mean that there is no market data available at all upon which to base a determination of fair value. Furthermore, in some cases the majority of the fair value derived from a valuation technique with significant unobservable data may be attributable to observable inputs. Consequently, the effect of uncertainty in determining unobservable inputs will generally be restricted to uncertainty about the overall fair value of the asset or liability being measured. (c) Transfer between fair value hierarchies The Group deems a transfer to have occurred between Level 1 and Level 2 when an active, traded primary market ceases to exist for that financial instrument. A transfer between Level 2 and Level 3 occurs when the majority of the significant inputs used to determine fair value of the instrument become unobservable. E3: Disclosure of financial assets and liabilities measured at fair value (a) Financial assets and liabilities measured at fair value, classified according to fair value hierarchy The table below presents a summary of the financial assets and liabilities of the Group's continuing businesses that are measured at fair value in the consolidated statement of financial position according to their IFRS 9 classification, as set out in note G5. At 30 June 2018 Rm Total Level 1 Level 2 Level 3 Financial assets measured at fair value Mandatorily fair value through profit or loss 5,332 1,527 3,805 - Investments and securities 1,985 1,527 458 - Derivative financial instruments - assets 3,347 - 3,347 - Designated fair value through profit or loss 741,320 418,554 306,992 15,774 Investments and securities 741,320 418,554 306,992 15,774 Total financial assets measured at fair value 746,652 420,081 310,797 15,774 Financial liabilities measured at fair value Mandatorily fair value through profit or loss 4,892 - 4,892 - Derivative financial instruments - liabilities 4,892 - 4,892 - Designated fair value through profit or loss 398,601 8,892 389,709 - Investment contract liabilities(1) 296,547 - 296,547 - Third-party interests in consolidated funds 86,665 - 86,665 - Borrowed funds 14,636 8,139 6,497 - Other liabilities 753 753 - - Total financial liabilities measured at fair value 403,493 8,892 394,601 -
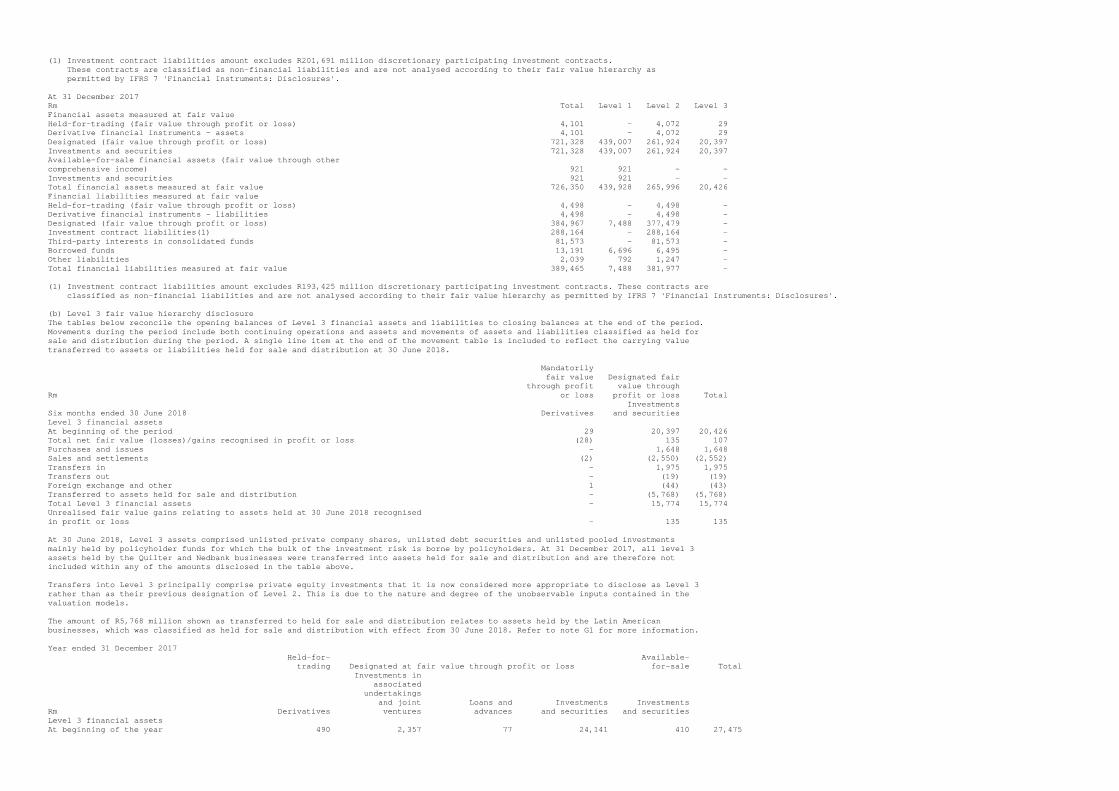
(1) Investment contract liabilities amount excludes R201,691 million discretionary participating investment contracts. These contracts are classified as non-financial liabilities and are not analysed according to their fair value hierarchy as permitted by IFRS 7 'Financial Instruments: Disclosures'. At 31 December 2017 Rm Total Level 1 Level 2 Level 3 Financial assets measured at fair value Held-for-trading (fair value through profit or loss) 4,101 - 4,072 29 Derivative financial instruments - assets 4,101 - 4,072 29 Designated (fair value through profit or loss) 721,328 439,007 261,924 20,397 Investments and securities 721,328 439,007 261,924 20,397 Available-for-sale financial assets (fair value through other comprehensive income) 921 921 - - Investments and securities 921 921 - - Total financial assets measured at fair value 726,350 439,928 265,996 20,426 Financial liabilities measured at fair value Held-for-trading (fair value through profit or loss) 4,498 - 4,498 - Derivative financial instruments - liabilities 4,498 - 4,498 - Designated (fair value through profit or loss) 384,967 7,488 377,479 - Investment contract liabilities(1) 288,164 - 288,164 - Third-party interests in consolidated funds 81,573 - 81,573 - Borrowed funds 13,191 6,696 6,495 - Other liabilities 2,039 792 1,247 - Total financial liabilities measured at fair value 389,465 7,488 381,977 - (1) Investment contract liabilities amount excludes R193,425 million discretionary participating investment contracts. These contracts are classified as non-financial liabilities and are not analysed according to their fair value hierarchy as permitted by IFRS 7 'Financial Instruments: Disclosures'. (b) Level 3 fair value hierarchy disclosure The tables below reconcile the opening balances of Level 3 financial assets and liabilities to closing balances at the end of the period. Movements during the period include both continuing operations and assets and movements of assets and liabilities classified as held for sale and distribution during the period. A single line item at the end of the movement table is included to reflect the carrying value transferred to assets or liabilities held for sale and distribution at 30 June 2018. Mandatorily fair value Designated fair through profit value through Rm or loss profit or loss Total Investments Six months ended 30 June 2018 Derivatives and securities Level 3 financial assets At beginning of the period 29 20,397 20,426 Total net fair value (losses)/gains recognised in profit or loss (28) 135 107 Purchases and issues - 1,648 1,648 Sales and settlements (2) (2,550) (2,552) Transfers in - 1,975 1,975 Transfers out - (19) (19) Foreign exchange and other 1 (44) (43) Transferred to assets held for sale and distribution - (5,768) (5,768) Total Level 3 financial assets - 15,774 15,774 Unrealised fair value gains relating to assets held at 30 June 2018 recognised in profit or loss - 135 135 At 30 June 2018, Level 3 assets comprised unlisted private company shares, unlisted debt securities and unlisted pooled investments mainly held by policyholder funds for which the bulk of the investment risk is borne by policyholders. At 31 December 2017, all level 3 assets held by the Quilter and Nedbank businesses were transferred into assets held for sale and distribution and are therefore not included within any of the amounts disclosed in the table above. Transfers into Level 3 principally comprise private equity investments that it is now considered more appropriate to disclose as Level 3 rather than as their previous designation of Level 2. This is due to the nature and degree of the unobservable inputs contained in the valuation models. The amount of R5,768 million shown as transferred to held for sale and distribution relates to assets held by the Latin American businesses, which was classified as held for sale and distribution with effect from 30 June 2018. Refer to note G1 for more information. Year ended 31 December 2017 Held-for- Available- trading Designated at fair value through profit or loss for-sale Total Investments in associated undertakings and joint Loans and Investments Investments Rm Derivatives ventures advances and securities and securities Level 3 financial assets At beginning of the year 490 2,357 77 24,141 410 27,475

Total net fair value (losses)/gains recognised in: - profit or loss (444) 10 45 915 - 526 - other comprehensive income 18 (8) - 6 - 16 Purchases and issues 70 1,513 - 13,814 - 15,397 Sales and settlements (58) (668) (89) (1,436) - (2,251) Transfers in - - - 7,632 - 7,632 Transfers out - - - (4,198) - (4,198) Foreign exchange and other (46) (1) - 77 - 30 Transferred to assets held for sale and distribution (1) (3,203) (33) (20,554) (410) (24,201) Total Level 3 financial assets 29 - - 20,397 - 20,426 Unrealised fair value (losses)/gains relating to assets held at 31 December 2017 recognised in profit or loss (444) - - 1,230 - 786 At 31 December 2017 all Level 3 liabilities held by the Quilter and Nedbank businesses were transferred into liabilities held for sale and distribution. No Level 3 liabilities were held by any of the other Group businesses at 30 June 2018, at 31 December 2017 or at any time during the current reporting period. Year ended 31 December 2017 Designated fair value through Held-for-trading profit or loss Total Investment Other contract Rm liabilities Derivatives liabilities Level 3 financial liabilities At beginning of the year 330 120 10,004 10,454 Total net losses/(gains) recognised in profit or loss 105 (122) (388) (405) Purchases and issues - - 10,557 10,557 Sales and settlements - - (403) (403) Transfers in - - 2,869 2,869 Transfers out - - (2,613) (2,613) Transferred to liabilities held for sale and distribution (435) - (19,550) (19,985) Foreign exchange and other - 2 (476) (474) Total Level 3 financial liabilities - - - - Unrealised fair value losses/(gains) relating to liabilities held at 31 December 2017 recognised in profit or loss - - - - (c)(i) Effect of changes in significant unobservable assumptions to reasonable possible alternatives Favourable and unfavourable changes are determined on the basis of changes in the value of the financial asset or liability as a result of varying the levels of the unobservable parameters using statistical techniques. When parameters are not amenable to statistical analysis, quantification of uncertainty is judgemental. When the fair value of a financial asset or liability is affected by more than one unobservable assumption, the figures shown reflect the most favourable or most unfavourable change from varying the assumptions individually. The valuations of the private equity investments are performed on an asset-by-asset basis using a valuation methodology appropriate to the specific investment and in line with industry guidelines. In determining the valuation of the investment the principal assumption used is the valuation multiple applied to the main financial indicators (such as adjusted earnings). The source of this multiple may include multiples for comparable listed companies which have been adjusted for discounts for non-tradability and valuation multiples earned on transactions in comparable sectors. The valuations of asset-backed securities are determined by discounted cash flow models that generate the expected value of the asset, incorporating benchmark information on factors such as prepayment patterns, default rates, loss severities and the historical performance of the underlying assets. The outputs from the models used are calibrated with reference to similar securities for which external market information is available. Structured notes and other derivatives are generally valued using option pricing models. For structured notes and other derivatives, principal assumptions concern the future volatility of asset values and the future correlation between asset values. These principal assumptions used in the valuation of structured credit notes include credit volatilities and correlations. For such unobservable assumptions, estimates are based on available market data, which may include the use of a proxy method to derive a volatility or correlation from comparable assets for which market data is more readily available, and examination of historical levels. The table below summarises the significant inputs to value instruments categorised as Level 3 hierarchy in the Group's continuing businesses and their sensitivity to changes in the inputs used. At At At At 30 June 31 December 30 June 31 December Rm 2018 2017 2018 2017 Fair value measurement sensitivity Types of financial Valuation techniques Significant to instruments Fair values used unobservable input unobservable inputs Assets

Investments and 15,774 20,397 Discounted cash Valuation multiples Favourable: Favourable: securities flows (DCF) Volatilities 2,973 1,838 EBITDA multiples Credit spreads Unfavourable: Unfavourable: Price earnings Dividend growth 2,633 1,503 ratios rates Adjusted net asset Internal rates of values return Cost of capital Risk premiums Derivatives - assets - 29 Option pricing model Interest rates Favourable: Favourable: Volatilities nil 16 Unfavourable: nil Unfavourable: 14 F: Analysis of financial assets and liabilities F1: Insurance and investment contracts The tables below provide a summary of the Group's long-term business insurance policyholder liabilities and investment contract liabilities: At 30 June 2018 At 31 December 2017 Rm Gross Reinsurance Net Gross Reinsurance Net Life assurance policyholder liabilities Total life insurance contracts liabilities 152,108 (691) 151,417 159,514 (563) 158,951 Life insurance contracts liabilities 149,723 (691) 149,032 157,151 (563) 156,588 Outstanding claims 2,385 - 2,385 2,363 - 2,363 Investment contract liabilities 498,238 (3,296) 494,942 481,589 - 481,589 Unit-linked investment contracts and similar contracts 295,377 (3,296) 292,081 286,957 - 286,957 Other investment contracts 1,170 - 1,170 1,207 - 1,207 Investment contracts with discretionary participating features 201,691 - 201,691 193,425 - 193,425 Total life assurance policyholder liabilities 650,346 (3,987) 646,359 641,103 (563) 640,540 Property & casualty liabilities Claims incurred but not reported 1,143 (294) 849 1,317 (320) 997 Unearned premiums 2,869 (1,210) 1,659 2,599 (1,185) 1,414 Outstanding claims 4,878 (2,407) 2,471 4,369 (2,152) 2,217 Total property & casualty liabilities 8,890 (3,911) 4,979 8,285 (3,657) 4,628 Total policyholder liabilities 659,236 (7,898) 651,338 649,388 (4,220) 645,168 F2: Borrowed funds At 30 June 2018 Old Mutual Life Assurance Company Old Mutual (South Africa) Old Mutual Finance Rest of Old Mutual Rm Limited Insure (Pty) Ltd Africa Plc(1) Total Term loans - - 3,700 1,621 - 5,321 Revolving credit facilities - - 975 200 - 1,175 Subordinated debt securities 5,995 500 - - 8,141 14,636 Total borrowed funds 5,995 500 4,675 1,821 8,141 21,132 (1) On 19 July 2018, Old Mutual plc repurchased R281 million (GBP16 million) of its outstanding R7,944 million (GBP450 million) 7.875% subordinated debt securities, of which R1,105 million (GBP61 million) was outstanding on 30 June 2018 (Tier 2 subordinated 2025 securities) and R4,745 million (GBP269 million) of its outstanding R8,827 million (GBP500 million) 8% subordinated debt securities, of which R6,181 million (GBP341 million) was outstanding on 30 June 2018 (Tier 2 subordinated 2021 securities) through tender offers. All repurchased securities were cancelled on 19 July 2018. Refer to note G4 for more information. Old Mutual Life Assurance Company Old Mutual (South Africa) Old Mutual Finance Rest of Old Mutual Rm Limited Insure (Pty) Ltd Africa plc Total Term loans - - 2,300 1,237 - 3,537 Revolving credit facilities - - 975 140 - 1,115 Subordinated debt securities 5,995 500 - - 7,719 14,214 Total borrowed funds 5,995 500 3,275 1,377 7,719 18,866 (f) Breaches of covenant During the six months ended 30 June 2018, the financial covenants on eight loans with aggregate funding of R656 million were breached. The funding was raised to support operations in the Rest of Africa segment. At 30 June 2018, two of the loans, totalling R169 million, were in compliance with the covenant requirements. The Group obtained official

waivers amounting to R266 million from three of the lenders. These waivers were obtained with requirements to get back to within covenant requirements by December 2018. The Group is following remediation plans to ensure that business will be in compliance with the respective covenants by December 2018. Furthermore, an agreement has been reached in July with one of the lenders to adjust the breached covenant on a R129 million loan to a level where the Group is in compliance. The Group is still in negotiation with the lenders of the remaining two loans of R92 million to similarly amend the breached covenant. The breaches of the covenants by the individual businesses has not had an impact on the ability of the Group to obtain additional funding. G: Other notes G1: Discontinued operations and disposal groups held for sale Nedbank and Quilter Nedbank and Quilter have continued to be presented as discontinued operations in the consolidated income statement, consolidated statement of comprehensive income and consolidated statement of cash flows for the six months ended 30 June 2018. This is consistent with the presentation for the year ended 31 December 2017. Following the listing and distribution of Quilter on 25 June 2018 (see note A2), it ceased to be a subsidiary of the Group. Consequently, its results are only consolidated from 1 January 2018 to 25 June 2018. In accordance with the requirements of IFRS 5 'Non-current Assets Held for Sale and Discontinued Operations', comparative information in the consolidated income statement, consolidated statement of comprehensive income and consolidated statement of cash flows for the six months ended 30 June 2017 have been re-presented to reflect Nedbank and Quilter as discontinued operations. The assets and liabilities of Nedbank continue to be classified as assets and liabilities held for sale and distribution in the consolidated statement of financial position at 30 June 2018. This judgement was made based on the facts and circumstances which existed at 31 December 2017 when the Directors made a formal assessment of whether the businesses should be classified as held for distribution. At that time it was determined that although a number of minor internal reorganisations remained to be implemented, the business in its current state could have been distributed within a period of twelve months based on interactions with South African regulators, positive interactions with the relevant tax authorities and interactions with the South African government. Once the Old Mutual Limited share register has had a period to settle, the Group will unbundle to its shareholders a significant portion of its shareholding in Nedbank, whilst retaining a strategic minority interest. This transaction is anticipated to be completed before 31 December 2018. Consequently, the Directors still consider it is highly probable that the Nedbank business will be distributed within a period of twelve months from initial classification, which was 31 December 2017. This is consistent with the published unbundling plan. Following the planned distribution, the Group will revalue its residual associate interest at the market value prevailing at the time and will commence equity accounting its interest as a continuing operation from that date. In the consolidated statement of financial position at December 2017, the assets and liabilities of both Nedbank and Quilter were classified and presented as assets and liabilities held for sale and distribution. Following the listing and distribution of Quilter on 25 June 2018 (see note A2), it ceased to be a subsidiary of the Group. Consequently, its assets and liabilities are no longer included in the consolidated statement of financial position at 30 June 2018. Latin American businesses As a consequence of the agreed sale of the Latin American businesses as set out in note A2, its size relative to the new Group structure and its separate geographical location, the Latin American businesses have been presented as discontinued operations in the consolidated income statement, consolidated statement of comprehensive income and consolidated statement of cash flows for the six months ended 30 June 2018. Consistent with the requirements of IFRS 5 'Non-current Assets Held for Sale and Discontinued Operations', the consolidated income statement, consolidated statement of comprehensive income and consolidated statement of cash flows for the six months ended 30 June 2018 and year to 31 December 2017 have been re-presented. The Group's interest in the assets and liabilities of the Latin American businesses have been classified as held for sale in the consolidated statement of financial position at 30 June 2018. This judgement was done based on the facts and circumstances which existed at 30 June 2018 when the Directors made a formal assessment of whether the businesses should be classified as held for sale. Consistent with the requirements of IFRS 5 'Non-current Assets Held for Sale and Discontinued Operations', comparative information in the consolidated statement of financial position at 31 December 2017 have not been re-presented. Old Mutual Bermuda Old Mutual Bermuda is expected to wind-down its operations, including shutting down the New York office and either terminating or giving notice to all employees by the end of 31 December 2018. During the six months ended 30 June 2018, the Bermuda operation has actively commenced the wind down process in line with the Wind-Down plan that was presented to the Old Mutual Bermuda and Old Mutual plc Boards as well as to the Bermuda Monetary Authority (BMA) in December 2017. Given its separate geographical location, Old Mutual Bermuda has therefore been classified and presented as a discontinued operation in the consolidated income statement, consolidated statement of comprehensive income and consolidated statement of cash flows for all reporting periods. Consistent with the requirements of IFRS 5 'Non-current Assets Held for Sale and Discontinued Operations', comparative information in the consolidated income statement, consolidated statement of comprehensive income and consolidated statement of cash flows for the six months ended 30 June 2017 and the year ended 31 December 2017 have been re-presented. In accordance with IFRS, Old Mutual Bermuda has not been classified as held for sale. Re-presentation of Kotak Mahindra Old Mutual Life Insurance Limited (Kotak) On 13 October 2017, the Old Mutual plc Group completed the sale of its 26% stake in Kotak to its joint venture partner Kotak Mahindra Bank Limited. The investment was presented as an asset held for sale in the Old Mutual plc Group interim accounts to 30 June 2017. However, given its size relative to the Old Mutual plc Group, it was assessed that the business did not meet the definition of a component and therefore was not presented as a discontinued operation. Following the change in Group structure in 2018, as described in notes A1 and A2, the treatment of Kotak has been re-assessed. Consequently, the consolidated income statement, consolidated statement of comprehensive income and consolidated statement of cash flows the six months ended 30 June 2017 and the year ended 31 December 2017 have been re-presented to reflect Kotak as a discontinued operation.

Further information on discontinued operations is provided in note G1.1. Further information on assets and liabilities classified as held for sale and distribution is provided in note G1.2. G1.1: Discontinued operations The tables below present the income statement from discontinued operations (note G1.1(a)), the statement of comprehensive income from discontinued operations (note G1.1(b)) and net cash flows from discontinued operations (note G1.1(c)) for the six months ended 30 June 2018, the six months ended 30 June 2017 and the year ended 31 December 2017. (a) Income statement from discontinued operations Six months ended 30 June 2018 Elimination Latin Old of intra- American Mutual segment Rm Nedbank Quilter businesses Bermuda transactions Total Revenue Gross earned premiums - 1,268 43 - - 1,311 Outward reinsurance - (749) (11) - - (760) Net earned premiums - 519 32 - - 551 Investment return (non-banking) - 5,050 40 (31) - 5,059 Banking interest and similar income 37,660 - - - - 37,660 Banking trading, investment and similar income 2,440 - - - - 2,440 Fee and commission income, and income from service activities 9,513 10,254 899 - (108) 20,558 Other income 343 188 8 - (157) 382 Total revenue 49,956 16,011 979 (31) (265) 66,650 Expenses Claims and benefits (including change in insurance contract provisions) - (1,150) (33) 36 - (1,147) Reinsurance recoveries - 833 3 - - 836 Net claims and benefits incurred - (317) (30) 36 - (311) Change in investment contract liabilities - (3,252) - - - (3,252) Credit impairment charges (1,815) (2) - - - (1,817) Banking interest payable and similar expenses (23,240) - - - - (23,240) Fee and commission expenses, and other acquisition costs (60) (3,417) (300) - 101 (3,676) Change in third-party interest in consolidated funds - (129) - - - (129) Other operating and administrative expenses (15,667) (8,325) (455) (2) 482 (23,967) Total expenses (40,782) (15,442) (785) 34 583 (56,392) Share of associated undertakings' and joint ventures' profits after tax 207 - 2 - - 209 Profit before tax from discontinued operations 9,381 569 196 3 318 10,467 Income tax expense (2,355) 174 (84) (2) (92) (2,359) Profit after tax from discontinued operations 7,026 743 112 1 226 8,108 Attributable to: Equity holders of the parent 3,659 743 112 1 226 4,741 Non-controlling interests Ordinary shares 3,082 - - - - 3,082 Preferred securities 285 - - - - 285 Profit after tax from discontinued operations 7,026 743 112 1 226 8,108 Six months ended 30 June 2017 (Re-presented)(1) Elimination of intra- OM Asset Latin Old segment Management American Mutual trans- Rm Nedbank Quilter plc businesses Kotak Bermuda actions Total Revenue Gross earned premiums - 1,222 - 10 - - - 1,232 Outward reinsurance - (723) - (9) - - - (732) Net earned premiums - 499 - 1 - - - 500 Investment return (non-banking) - 45,171 103 92 - (374) - 44,992 Banking interest and similar income 37,280 - - - - - - 37,280 Banking trading, investment and similar income 2,285 - - - - - - 2,285 Fee and commission income, and income from service activities 9,185 9,399 3,551 862 - - (160) 22,837 Other income 314 59 - 12 - - (130) 255 Total revenue 49,064 55,128 3,654 967 - (374) (290) 108,149 Expenses Claims and benefits (including change in insurance contract provisions) - (1,002) - (3) - 844 - (161) Reinsurance recoveries - 861 - 2 - - - 863 Net claims and benefits incurred - (141) - (1) - 844 - 702 Change in investment contract liabilities - (38,394) - - - - - (38,394)

Credit impairment charges (1,594) (1) - - - - - (1,595) Finance costs - - (103) - - - - (103) Banking interest payable and similar expenses (23,249) - - - - - - (23,249) Fee and commission expenses, and other acquisition costs (138) (2,851) (81) (299) - - 134 (3,235) Change in third-party interest in consolidated funds - (5,194) - - - - - (5,194) Other operating and administrative expenses (15,239) (7,748) (3,015) (456) - 47 655 (25,756) Total expenses (40,220) (54,329) (3,199) (756) - 891 789 (96,824) Share of associated undertakings' and joint ventures' (losses)/profits after tax (1,053) - 59 - 118 - - (876) Profit on disposal of subsidiaries, associated undertakings and strategic investments - 158 - - - - - 158 Profit before tax from discontinued operations 7,791 957 514 211 118 517 499 10,607 Income tax expense (2,188) (514) (101) (86) - 1 (120) (3,008) Profit after tax from discontinued operations 5,603 443 413 125 118 518 379 7,599 Attributable to: Equity holders of the parent 2,906 443 218 125 118 518 379 4,707 Non-controlling interests Ordinary shares 2,399 - 195 - - - - 2,594 Preferred securities 298 - - - - - - 298 Profit after tax from discontinued operations 5,603 443 413 125 118 518 379 7,599 (1) The six months ended 30 June 2017 has been re-presented to reflect the Nedbank, Quilter, the Latin American businesses, Kotak and Old Mutual Bermuda as discontinued operations. Refer to notes A2 and G1 for more information. Year ended 31 December 2017 (Re-presented)(1) Elimination of intra- OM Asset Latin Old segment Management American Mutual trans- Rm Nedbank Quilter plc businesses Kotak Bermuda actions Total Revenue Gross earned premiums - 2,534 - 133 - - - 2,667 Outward reinsurance - (1,498) - (20) - - - (1,518) Net earned premiums - 1,036 - 113 - - - 1,149 Investment return (non-banking) - 88,627 103 144 - (454) - 88,420 Banking interest and similar income 75,150 - - - - - - 75,150 Banking trading, investment and similar income 4,860 - - - - - - 4,860 Fee and commission income, and income from service activities 18,875 21,807 3,551 1,829 - - (311) 45,751 Other income 415 67 - 25 - - (282) 225 Total revenue 99,300 111,537 3,654 2,111 - (454) (593) 215,555 Expenses Claims and benefits (including change in insurance contract provisions) - (2,651) - (125) - 1,152 - (1,624) Reinsurance recoveries - 2,388 - 6 - - - 2,394 Net claims and benefits incurred - (263) - (119) - 1,152 - 770 Change in investment contract liabilities - (73,875) - - - - - (73,875) Credit impairment charges (3,304) (4) - - - - - (3,308) Finance costs - - (103) - - - - (103) Banking interest payable and similar expenses (46,838) - - - - - - (46,838) Fee and commission expenses, and other acquisition costs (155) (6,228) (81) (633) - - 272 (6,825) Change in third-party interest in consolidated funds - (11,044) - - - - - (11,044) Other operating and administrative expenses (31,591) (17,561) (3,015) (1,182) - (256) 932 (52,673) Total expenses (81,888) (108,975) (3,199) (1,934) - 896 1,204 (193,896) Share of associated undertakings' and joint ventures' (losses)/profits after tax (838) - 59 2 181 - - (596) Profit on disposal of subsidiaries, associated undertakings and strategic investments - 163 - - - - - 163 Profit before tax from discontinued operations 16,574 2,725 514 179 181 442 611 21,226 Income tax expense (4,227) (1,274) (101) (186) - (30) (146) (5,964) Profit after tax from discontinued operations 12,347 1,451 413 (7) 181 412 465 15,262 Attributable to: Equity holders of the parent 6,411 1,451 218 (7) 181 412 465 9,131 Non-controlling interests

Ordinary shares 5,346 - 195 - - - - 5,541 Preferred securities 590 - - - - - - 590 Profit after tax from discontinued operations 12,347 1,451 413 (7) 181 412 465 15,262 (1) The year ended 31 December 2017 has been re-presented to reflect the Latin American businesses, Kotak and Old Mutual Bermuda as discontinued operations. Refer to notes A2 and G1 for more information. (b) Statement of comprehensive income from discontinued operations Six months Year Six months ended ended ended 30 June 31 December 30 June 2017 2017 Rm 2018 (Re-presented)(1) (Re-presented)(1) Profit after tax from discontinued operations 8,108 7,599 15,262 Items that will not be reclassified subsequently to profit or loss Fair value movements - property revaluation (2) 3 215 Net measurement (losses)/gains on defined benefit plans (876) 194 538 Income tax on items that will not be reclassified to profit or loss 245 (22) (151) (633) 175 602 Items that may be reclassified subsequently to profit or loss Instruments at fair value through other comprehensive income - net change in fair value (138) 1 22 Currency translation differences/exchange differences on translating foreign operations 851 (459) (1,248) Share of other comprehensive income of investments (214) 283 728 Other movements (13) - 45 486 (175) (453) Total other comprehensive income for the financial period from discontinued operations (147) - 149 Total comprehensive income for the financial period from discontinued operations 7,961 7,599 15,411 Attributable to: Equity holders of the parent 4,655 4,742 9,264 Non-controlling interests Ordinary shares 3,021 2,559 5,557 Preferred securities 285 298 590 7,961 7,599 15,411 (1) The six months ended 30 June 2017 and the year ended 31 December 2017 have been re-presented to reflect the Latin American businesses, Kotak and Old Mutual Bermuda as discontinued operations. In addition, the six months ended 30 June 2017 has been re-presented to reflect Nedbank and Quilter as discontinued operations. Refer to notes A2 and G1 for more information. (c) Net cash flows from discontinued operations Six months Year Six months ended ended ended 30 June 31 December 30 June 2017 2017 Rm 2018 (Re-presented)(1) (Re-presented)(1) Operating activities 42,921 49,522 104,758 Investing activities (28,216) (45,248) (91,813) Financing activities 3,398 2,600 (3,351) Net cash flows from discontinued operations 18,103 6,874 9,594 (1) The six months ended 30 June 2017 and the year ended 31 December 2017 have been re-presented to reflect the Latin American businesses, Kotak and Old Mutual Bermuda as discontinued operations. In addition, the six months ended 30 June 2017 has been re-presented to reflect Nedbank and Quilter as discontinued operations. Refer to notes A2 and G1 for more information. G1.2: Assets and liabilities held for sale and distribution The tables below present details of the assets and liabilities that have been classified as held for sale and distribution at 30 June 2018 and 31 December 2017: At 30 June 2018 Elimination Latin Other of intra- American Emerging segment Rm Nedbank businesses Markets balances Total Assets Goodwill and other intangible assets 11,963 1,036 - - 12,999 Mandatory reserve deposits with central banks 21,596 - - - 21,596 Property, plant and equipment 9,013 276 - - 9,289 Investment property - 63 45 - 108 Deferred tax assets 341 126 - - 467 Investments in associated undertakings and joint ventures 3,103 25 - - 3,128 Deferred acquisition costs - 440 - - 440

Reinsurers' share of policyholder liabilities 102 - - - 102 Loans and advances 712,668 288 - (431) 712,525 Investments and securities 191,793 8,893 - - 200,686 Current tax receivable 922 134 - - 1,056 Trade, other receivables and other assets 22,352 221 - (1,156) 21,417 Derivative financial instruments 28,058 2 - (666) 27,394 Cash and cash equivalents 14,070 429 - (4,949) 9,550 Total assets 1,015,981 11,933 45 (7,202) 1,020,757 Liabilities Life insurance contract liabilities 2,044 1,972 - - 4,016 Investment contract liabilities 18,316 5,370 - - 23,686 Borrowed funds 53,680 - - (1,177) 52,503 Provisions and accruals 1 55 - - 56 Deferred revenue 474 - - - 474 Deferred tax liabilities 655 80 - - 735 Current tax payable 239 139 - - 378 Trade, other payables and other liabilities 25,163 600 - (11,254) 14,509 Amounts owed to bank depositors 801,165 - - (4,707) 796,458 Derivative financial instruments 25,394 9 - (505) 24,898 Total liabilities 927,131 8,225 - (17,643) 917,713 Net assets 88,850 3,708 45 10,441 103,044 At 31 December 2017 Elimination of intra- Emerging segment Rm Nedbank Quilter Markets balances Total Assets Goodwill and other intangible assets 11,130 23,439 - - 34,569 Mandatory reserve deposits with central banks 19,222 - - - 19,222 Property, plant and equipment 9,290 310 - - 9,600 Investment property - - 718 - 718 Deferred tax assets 189 519 - - 708 Investments in associated undertakings and joint ventures 6,722 45 - - 6,767 Deferred acquisition costs - 9,378 - - 9,378 Reinsurers' share of policyholder liabilities 93 48,724 - - 48,817 Loans and advances 710,329 3,342 - (384) 713,287 Investments and securities 158,651 1,078,276 - - 1,236,927 Current tax receivable 211 4 - - 215 Trade, other receivables and other assets 17,499 11,755 - (2,139) 27,115 Derivative financial instruments 29,904 1,464 - (505) 30,863 Cash and cash equivalents 16,900 35,475 - (2,118) 50,257 Total assets 980,140 1,212,731 718 (5,146) 2,188,443 Liabilities Life insurance contract liabilities 2,277 8,190 - - 10,467 Investment contract liabilities 18,134 990,961 - - 1,009,095 Third-party interests in consolidated funds - 127,427 - - 127,427 Borrowed funds 51,576 - - (784) 50,792 Provisions and accruals 2 1,739 - - 1,741 Deferred revenue 8 3,588 - - 3,596 Deferred tax liabilities 642 3,350 - - 3,992 Current tax payable 259 1,196 - - 1,455 Trade, other payables and other liabilities 23,887 25,467 - (11,098) 38,256 Amounts owed to bank depositors 771,584 - - (4,707) 766,877 Derivative financial instruments 23,367 7,252 - (558) 30,061 Inter-segment funding - liabilities - 13,102 - (13,102) - Total liabilities 891,736 1,182,272 - (30,249) 2,043,759 Net assets 88,404 30,459 718 25,103 144,684 G1.3: Impairment testing relating to the assets held for sale and distribution At 30 June 2018, no impairment losses have been recognised for Nedbank and the Latin American business, which have been classified and presented as discontinued operations in the consolidated income statement and as held for distribution in the consolidated statement of financial position in terms of the requirements of IFRS 5 'Non-current Assets Held for Sale and Discontinued Operations'. Impairment losses are determined as the deficit between fair value less cost to distribute and sell respectively of each business and the carrying value of each business at 31 December 2017. The fair value less cost to distribute of Nedbank was determined by reference to its quoted market price as at 30 June 2018. At 30 June 2018, the fair value less cost to distribute exceeded the carrying value of Nedbank. The Group therefore concluded that goodwill and other intangible assets related to the Nedbank are not impaired. The agreed selling price of the Latin American businesses is a reasonable approximation of the fair value. As such, the fair value less costs to sell exceeded the carrying value of the Latin American businesses at 30 June 2018 and therefore no impairment losses of goodwill and other intangible assets have been recognised. In addition, no other impairments for property, plant and equipment, investment properties or other intangible assets have been recognised

as a result of classifying these businesses as held for sale and distribution. G2: Related parties There were no transactions with related parties during the six months ended 30 June 2018 which had a material effect on the results or financial position of the Group. The nature of the related party transactions of the Group has not changed from those described in the audited general purpose consolidated financial statements for the year ended 31 December 2017. G3: Contingent liabilities and commitments The Group has provided certain guarantees for specific client obligations, in return for which the Group has received a fee. The Group has evaluated the extent of the possibility of the guarantees being called on and has provided appropriately. Contingent liabilities - tax The Revenue authorities in the principal jurisdictions in which the Group operates (South Africa and historically the United Kingdom) routinely review historic transactions undertaken and tax law interpretations made by the Group. The Group is committed to conducting its tax affairs in accordance with the tax legislation of the jurisdictions in which they operate. All interpretations made by management are made with reference to the specific facts and circumstances of the transaction and the relevant legislation. There are occasions where the Group's interpretation of tax law may be challenged by the Revenue authorities. The financial statements include provisions that reflect the Group's assessment of liabilities which might reasonably be expected to materialise as part of their review. The Board is satisfied that adequate provisions have been made to cater for the resolution of tax uncertainties and that the resources required to fund such potential settlements are sufficient. Due to the level of estimation required in determining tax provisions amounts eventually payable may differ from the provision recognised. Consumer protection The Group is committed to treating customers fairly and supporting its customers in meeting their lifetime goals and it is central to how our businesses operates. We routinely engage with customers and regulators to ensure that we meet this commitment, but there is the risk of regulatory intervention across various jurisdictions, giving rise to the potential for customer redress which can result in retrospective changes to policyholder benefits, penalties or fines. The Group monitors the exposure to these actions and makes provision for the related costs as appropriate. Implications of the Managed Separation strategy The Group routinely monitors and reassesses contingent liabilities arising from matters such as litigation, and warranties and indemnities relating to past acquisitions and disposals. The announcement of the Managed Separation strategy on 11 March 2016 does not affect the nature of such items, however it is possible that the Group may seek to resolve certain matters as part of the implementation of the managed separation strategy. Outcome of Zimbabwean Commission Enquiry On 31 December 2016, the Zimbabwean Government concluded its inquiry into the loss in value for certain policyholders and beneficiaries upon the conversion of pension and insurance benefits after the dollarisation of the economy in 2009. On 9 March 2018, the results of the Zimbabwean Government's inquiry were made public. The Group is committed to treating its customers fairly and is currently reviewing the report and preparing a preliminary evaluation of the potential impact on Group operations. We are not currently able to establish what impact the commission's findings will have on Old Mutual Zimbabwe. US legacy items On 13 March 2018, Old Mutual plc announced that The Travelers Companies, Inc. and St. Paul Fire and Marine Insurance Company (Travelers) had lodged a claim in the United States District Court for the Southern District of New York in relation to pre-existing plc Head Office legacy items relating to previously disposed of US assets. The Group believed at that time the claim was without merit. Old Mutual plc further announced on 9 April 2018 that Travelers had withdrawn all of the remedies they were claiming and that Old Mutual Limited, has agreed, inter alia, to provide an intragroup guarantee to Old Mutual plc in the circumstances where Old Mutual plc is unable to satisfy the highly remote obligations in respect of the legacy items which were the subject of the claim. Potential Future Commitments Old Mutual Emerging Markets Limited (OMEM) guarantee A sales agreement was signed between Old Mutual (South Africa) Holdings (Pty) Ltd (OMSAH) and Lily Bermuda Capital Limited (SPV domiciled in Bermuda), owned by CMIG International Holding Pte. Limited (CMI) on 15 March 2018, for the purchase of OM Latin America Holdco UK Limited and AIVA Holding Group S.A. (collectively known as 'the Latin American businesses'). The long stop date for the fulfilment of the conditions precedent in the sales agreements, is 15 March 2019, unless the parties agree otherwise. OMEM has provided a guarantee for credit worthiness of OMSAH to the buyer and has also received a reciprocal guarantee from CMI. At 30 June 2018, the timing and amount of any payments (if any) cannot be reasonably estimated. UAP put option At 31 December 2017, the Group owned 60.7% of UAP Holdings Limited (UAP). The two significant minority anchor shareholders in UAP have the right to collectively put up to an aggregate 6% shareholding in UAP to the Group at the occurrence of a 'Put Event'. The put option period commenced at 1 October 2015 and ends on the earlier of an Old Mutual Limited listing or 3 years from the date of completion of the initial purchase of UAP (being June 2018). The put option exercise price is equal to the initial price (paid by Old Mutual plc in acquiring its current holding), increased by the Government of Kenya Treasury one year bond rates and reduced by dividends declared by UAP. At 31 December 2017, the Group recognised the obligation to purchase the additional 6% at R359 million with a corresponding reduction in reserves. Following the listing of Old Mutual Limited on 26 June 2018, the minority anchor shareholders collectively put a 6% ownership interest in UAP to the Group. As at 30 June 2018, the settlement agreement had been drafted and presented to the anchor shareholders.

The settlement amount equates to R437 million, reflecting the contractual discount unwind and the movement in the Kenyan Shilling to the rand over the period. At 30 June 2018, the acquisition of the interest held by the minority anchor shareholders has been accounted for as a transaction between shareholders as there has been no change in control. On settlement, a pro-rata portion of the non-controlling interest will be derecognised and transferred to the equity holders of the Group. Old Mutual (Pty) Ltd Finance put option The Old Mutual plc Group and the Business Doctor Consortium Limited and its associates ('Business Doctor') established Old Mutual Finance (Pty) Ltd (Old Mutual Finance) as a 50/50 start-up strategic alliance in 2008. The Group increased its shareholding in Old Mutual from 50% to 75% in 2014 by acquiring an additional 25% shareholding from Business Doctor for R1.1 billion. The Group has a call option to acquire the remaining 25% shareholding in Old Mutual Finance held by Business Doctor at market value under certain circumstances, inter alia in the event of a change of control within Business Doctor and on the eighth and tenth anniversary of the effective date of the Old Mutual Finance shareholders' agreement (i.e. in 2022 and 2024 respectively). Business Doctor has a put option to sell its remaining 25% shareholding in Old Mutual Finance to the Group at market value under certain circumstances, inter alia in the event of a change of control within the Old Mutual plc Group and on the eighth and tenth anniversary of the effective date of the Old Mutual Finance shareholders' agreement (i.e. in 2022 and 2024 respectively). Following the listing of Old Mutual Limited on 26 June 2018, Business Doctor became entitled to exercise the option to put the remaining shares to Old Mutual Limited. The Group received written confirmation on 22 July 2018 from Business Doctor that the put option would not be exercised. G4: Events after the reporting date Tender offer for Old Mutual plc's outstanding subordinated notes On 19 July 2018, Old Mutual plc repurchased R281 million (GBP16 million) of its outstanding R7,944 million (GBP450 million) 7.875% subordinated debt securities, of which R1,105 million (GBP61 million) was outstanding on 30 June 2018 (Tier 2 subordinated 2025 securities) and R4,745 million (GBP269 million) of its outstanding R8,827 million (GBP500 million) 8% subordinated debt securities, of which R6,181 million (GBP341 million) was outstanding on 30 June 2018 (Tier 2 subordinated 2021 securities) through tender offers. All repurchased securities were cancelled on 19 July 2018. Following cancellation of these securities, the aggregate principal amounts outstanding of the R7,944 million (GBP450 million) securities was R793 million (GBP45 million) and the aggregate principal amount outstanding of R8,827 million (GBP500 million) securities was R1,273 million (GBP72 million). Repatriation of capital from Old Mutual Bermuda On 5 July 2018, the Bermuda Monetary Authority approved the repatriation of capital to the value of R668 million ($49 million) from Old Mutual Bermuda to Old Mutual plc. G5: Standards, amendments to standards, and interpretations adopted in the 2018 unaudited condensed interim consolidated financial statements 5.1 Introduction Except as described below, the accounting policies applied in these interim financial statements are the same as those applied in the Group's consolidated financial statements at and for the year ended 31 December 2017. The Group has adopted IFRS 15 'Revenue from Contracts with Customers' and IFRS 9 'Financial Instruments' from 1 January 2018. The following other new standards are effective from 1 January 2018 but they do not have a material effect on the Group's financial statements: - Amendment to IFRS 2 'Share based payments', regarding the classification and measurement of share-based payment transactions; - Amendment to IAS 40 'Investment Property', regarding the transfer of property to, or from, investment property; - Annual improvements 2014-2016 made to IAS 28 'Investments in associates and joint ventures' and IFRS 1 'First-time adoption of IFRS'; and - Interpretation 22 Foreign Currency Transactions and Advance Consideration. The impact of transitioning to IFRS 9 and IFRS 15 at 1 January 2018 has been presented separately for continuing and discontinued operations for the six months ended 30 June 2018. Refer to note A2 and note G1 for more information. As explained in 5.3.5 and 5.4.1 below for IFRS 9 and IFRS 15, prior year financial statements have not been restated. This is in compliance with the transitional provisions. The reclassifications, the adjustments arising from the new impairment rules of IFRS 9 and the adjustments relating to a change in revenue recognition from contracts with customers of IFRS 15, are therefore not reflected in the consolidated statement of financial position as at 31 December 2017, but are recognised in the opening consolidated statement of financial position at 1 January 2018. The table below shows the adjustments recognised for each individual line item on the consolidated statement of financial position. As prior year figures have not been restated, an opening consolidated statement of financial position at 1 January 2017 or a consolidated income statement and consolidated statement of comprehensive income for the six months ended 30 June 2017 have not been presented. Consequently, there has been no impact on the basic and diluted earnings per share of prior periods. 5.2 Impact on the consolidated statement of financial position The impact on the Group's consolidated statement of financial position is summarised below: At At 31 December 1 January 2017 IFRS IFRS 2018 Rm Notes (As reported) 9 15 (As adjusted) Assets Goodwill and other intangible assets 6,653 - - 6,653

Mandatory reserve deposits with central banks 94 - - 94 Investment property 31,903 - - 31,903 Property, plant and equipment 8,081 - - 8,081 Investments in associated undertakings and joint ventures 1,789 - - 1,789 Deferred tax assets 5.3.1 / 5.4.1 1,084 97 (245) 936 Deferred acquisition costs 5.4.1 3,086 - (848) 2,238 Reinsurers' share of policyholder liabilities 4,220 - - 4,220 Loans and advances 5.3.2 21,483 (915) - 20,568 Investments and securities 5.3.2 722,249 (10) - 722,239 Current tax receivables 1,064 - - 1,064 Trade, other receivables and other assets 5.3.2 21,875 (13) - 21,862 Derivative financial instruments 4,101 - - 4,101 Cash and cash equivalents 30,761 - - 30,761 Assets held for sale and distribution 5.5 2,188,443 (2,854) - 2,185,589 Total assets 3,046,886 (3,695) (1,093) 3,042,098 Liabilities Life insurance contract liabilities 159,514 - - 159,514 Investment contract liabilities with discretionary participating 193,425 - - 193,425 Investment contract liabilities without discretionary participating features 288,164 - - 288,164 Borrowed funds 5.3.2 18,866 266 - 19,132 Deferred tax liabilities 5.3.1 / 5.4.1 5,088 - (237) 4,851 Deferred revenue 5.4.1 1,378 - (875) 503 Property & casualty liabilities 8,285 - - 8,285 Provisions and accruals 2,385 - - 2,385 Third-party interests in consolidated funds 81,573 - - 81,573 Current tax payable 1,711 - - 1,711 Trade, other payables and other liabilities 42,355 - - 42,355 Amounts owed to bank depositors 12,440 - - 12,440 Derivative financial instruments 4,498 - - 4,498 Liabilities held for sale and distribution 5.5 2,043,759 124 254 2,044,137 Total liabilities 2,863,441 390 (858) 2,862,973 Net assets 183,445 (4,085) (235) 179,125 Shareholders' equity Equity attributable to equity holders of the parent 136,678 (2,573) (119) 133,986 Continuing operations 5.3.1 / 5.4.1 58,775 (946) 19 57,848 Businesses classified as held for sale and distribution 5.5.2 / 5.5.3 77,903 (1,627) (138) 76,138 Non-controlling interests Ordinary shares 40,910 (1,512) (116) 39,282 Continuing operations 5.3.1 3,720 (161) - 3,559 Businesses classified as held for sale and distribution 5.5.2/5.5.3 37,190 (1,351) (116) 35,723 Preferred securities 5,857 - - 5,857 Total non-controlling interests 46,767 (1,512) (116) 45,139 Total equity 183,445 (4,085) (235) 179,125 The impact of adopting IFRS 9 and IFRS 15 have been explained separately for: - continuing operations (5.3 and 5.4 for IFRS 9 and IFRS 15 respectively); and - businesses which have been classified as held for sale and distribution (5.5). The adjustments are explained in more detail by standard below. 5.3. IFRS 9 Financial Instruments - Continuing operations 5.3.1. Overview including impact on the Group's total equity The table below summarises the impact of transitioning to IFRS 9 on the Group's opening balance of total equity (comprising retained earnings, other reserves and non-controlling interests) for continuing operations at 31 December 2017. For a description of the transition method used, refer to 5.3.5 below). Impact of adopting IFRS 9 on opening balance at 1 January Rm Notes 2018 Retained earnings Recognition of expected credit loss allowance 5.3.2 (716) Designation of borrowed funds at fair value through profit or loss 5.3.2 (266) Transfer of cumulative fair value changes linked to changes in credit risk of liabilities to other reserves 5.3.2 683 Related deferred tax impact 5.3.1 97 Total impact - Retained earnings (202)

Other reserves Recognition of expected credit loss allowance 5.3.2 (222) Transfer of cumulative fair value changes linked to changes in credit risk of liabilities from retained earnings 5.3.2 (683) Related deferred tax impact 5.3.1 - Total impact - Other reserves (905) Total impact on shareholders' equity (1,107) Total impact on equity attributable to shareholders of the parent (946) Total impact on non-controlling interests (161) Total impact on shareholders' equity (1,107) The income tax consequences of recognising expected credit losses on financial assets at amortised cost and other instruments and writing off balances are different between the jurisdictions where the Group conducts its business. In some jurisdictions the income tax consequences are also different between different types of financial assets. As a result the Group applied judgment in determining the deferred tax consequences of the transition to IFRS 9: - Old Mutual Finance (Pty) Ltd currently obtains an income tax deduction of approximately 80% of the allowance for incurred credit losses as prepared under IAS 39. Recent developments indicate that SARS is reconsidering the income tax allowances allowed for financial services entities that are not banks regarding the allowance for expected credit losses in terms of IFRS 9. A significant change in this income tax deduction could result in significant deferred tax assets being recognised by Old Mutual Finance (Pty) Ltd, due to a delay in obtaining the income tax deduction and lead to an increase in the income tax payments made to SARS in respect of future years. Since a change in the existing income tax legislation and allowed practices has not yet been effected, the Group applied judgment by recognising a deferred tax asset of R82 million on the transition impact to the expected credit loss model, based on the current income tax treatment in retained earnings. The Group and industry participants are in discussions with National Treasury regarding the matter. - There is uncertainty with regards to the deductibility of the allowance for expected credit losses in Kenya for income tax purposes. The Group applied judgment and did not recognise any deferred tax on the transition impact to the expected credit loss model for loans and advances provided to customers by Faulu, the Group's micro-lender in Kenya. When more clarity has been obtained from revenue authorities an appropriate adjustment will be made. - The total transition movement in the allowance for expected credit losses (R938 million) was recorded in retained earnings (R716 million) and other reserves (R222 million). The transition movement was recognised in other reserves to utilise regulatory reserves previously created in the Rest of Africa business. 5.3.2. Classification and measurement of financial assets and financial liabilities IFRS 9 replaces the provisions of IAS 39 'Financial instruments: Recognition and measurement' that relate to the recognition, classification and measurement of financial instruments, impairment of financial assets and hedge accounting. The adoption of IFRS 9 from 1 January 2018 resulted in changes in accounting policies and adjustments to the amounts recognised in the financial statements. The new accounting policies are set out below. Initial recognition of financial assets Under IFRS 9, on initial recognition, a financial asset is classified as measured at: - Amortised cost; - Fair Value through Other Comprehensive Income (FVOCI) which may include debt or equity instruments; or - Fair Value through Profit and Loss (FVTPL). IFRS 9 eliminates the previous IAS 39 categories for financial assets of held to maturity, loans and receivables and available for sale. The classification of financial assets under IFRS 9 is based on whether the financial assets are equity instruments, debt instruments held or derivative assets. Equity instruments and derivative assets are mandatorily categorised as financial assets at FVTPL. The classification and measurement of debt instruments is dependent on the business model in which the financial asset is managed and its contractual cash flow characteristics. Derivatives embedded in contracts where the host is a financial asset in the scope of the standard are not accounted for separately. Instead, the hybrid financial instrument as a whole is assessed for classification. A debt instrument is classified as a financial asset at amortised cost if it meets both of the following conditions (and is not designated as at FVTPL): - it is held within a business model whose objective is to hold assets to collect contractual cash flows; and - its contractual terms give rise on specified dates to cash flows that are solely payments of principal and interest on the principal amount outstanding. A debt instrument is measured at FVOCI if it meets both of the following conditions (and is not designated as at FVTPL): - it is held within a business model whose objective is achieved by both collecting contractual cash flows and selling financial assets; and - its contractual terms give rise on specified dates to cash flows that are solely payments of principal and interest on the principal amount outstanding. On initial recognition of an equity instrument that is not held for trading, the instrument may be irrevocably designated at FVOCI. In such an instance changes in the equity instrument's fair value are recorded in other comprehensive income (OCI). This election is made on an investment-by-investment basis.

All debt instrument financial assets that were not classified as measured at amortised cost or FVOCI are measured at FVTPL. On initial recognition, the Group may irrevocably designate a debt instrument financial asset that otherwise meets the requirements to be measured at amortised cost or at FVOCI or at FVTPL if doing so eliminates or significantly reduces an accounting mismatch that would otherwise arise. Transaction costs that are directly attributable to the acquisition of financial assets are expensed in profit or loss for financial assets initially classified at FVTPL. For financial assets not classified at FVTPL, transaction costs are added to or deducted from the fair value at initial recognition. Initial recognition of financial liabilities IFRS 9 largely retains the requirements in IAS 39 for the classification and measurement of financial liabilities. On initial recognition financial liabilities are measured at fair value plus or minus, in the case of financial liabilities not classified at FVTPL, transaction costs that are incremental and directly attributable to the issue of the financial liability. Transaction costs of financial liabilities carried at FVTPL are expensed in profit or loss. Subsequent measurement of financial assets The following accounting policies apply to the subsequent measurement of financial assets. Financial assets at FVTPL These assets are subsequently measured at fair value. Net gains and losses, including any interest or dividend income, are recognised in profit or loss. Financial assets at amortised cost These assets are subsequently measured at amortised cost using the effective interest method. The amortised cost is reduced by impairment losses. Interest income, foreign exchange gains and losses and impairment are recognised in profit or loss. Any gain or loss on derecognition is recognised in profit or loss. Debt investments at FVOCI These assets are subsequently measured at fair value. Interest income calculated using the effective interest method, foreign exchange gains and losses and impairment are recognised in profit or loss. Other net gains and losses are recognised in OCI. On derecognition, gains and losses accumulated in OCI are reclassified to profit or loss. Equity investments at FVOCI These assets are subsequently measured at fair value. Dividends are recognised as income in profit or loss unless the dividend clearly represents a recovery of part of the cost of the investment. Other net gains and losses are recognised in OCI and are never reclassified to profit or loss. Subsequent measurement of financial liabilities IFRS 9 largely retains the requirements in IAS 39 for the measurement of financial liabilities with one exception. Fair value movements attributable to changes in the credit risk of a financial liability designated at FVTPL is recorded in other comprehensive income and not recycled to profit or loss. The balance of the fair value movement is recorded in profit or loss. IFRS 9 transition impact assessment On 1 January 2018 (the date of initial application of IFRS 9), the Group's management has assessed which business models apply to the financial assets held by the group and classified its financial instruments into the appropriate IFRS 9 categories. In addition management considered the impact of implementation of the expected credit loss model for financial assets measured at amortised cost as well as any 'fair value option' designation adjustments. The tables below and accompanying notes explain the original measurement categories under IAS 39 and the new measurement categories and carrying values under IFRS 9 for each class of the group's financial assets and financial liabilities as at 1 January 2018: Total IFRS 9 transition adjustment allocation Adjusted IFRS 9 Carrying Total IFRS 9 carrying reclassification IFRS 9 IAS 39 IFRS 9 value transition value into new ECL Rm Note Classification Classification IAS 39 adjustment IFRS 9 category impact Financial Assets Mandatory reserve deposits with Loans and central banks receivables Amortised cost 94 - 94 - - Reinsurers' share of policyholder Loans and liabilities receivables Amortised cost 25 - 25 - - Loans and Loans and advances receivables Amortised cost 21,483 (915) 20,568 - (915) Accounting Investments and Designated mismatch at securities (a) FVTPL FVTPL 721,328 (434,277) 287,051 - - Mandatorily at FVTPL - 430,768 430, 768 430,768 - (b) Amortised cost - 3,499 3,499 3,509 (10) Available for Mandatorily at (c) sale FVTPL 921 921 921 921 - Trade and other Loans and receivables receivables Amortised cost 21,875 (13) 21,862 - (13) Derivative Held for Mandatorily at instruments trading FVTPL 4,101 - 4,101 - -

Cash and cash Loans and equivalents receivables Amortised cost 30,761 - 30,761 - - Total 800,588 none 799,650 435,198 (938) The classification and measurement of the remaining balance of R 287,051 million is unchanged. Rm Total IFRS 9 transition adjustment allocation Adjusted IFRS 9 Carrying Total IFRS 9 carrying reclassification IFRS 9 IAS 39 IFRS 9 value transition value into new ECL Rm Note Classification Classification IAS 39 adjustment IFRS 9 category impact Financial Liabilities Investment contract Designated Mandatorily at liabilities FVTPL FVTPL 288,164 - 288,164 - - Third-party interest in consolidation of Designated Mandatorily at funds FVTPL FVTPL 81,573 - 81,573 - - Accounting Designated mismatch at Borrowed funds (d) FVTPL FVTPL 13,191 1,284 14,475 - - Amortised (d) Amortised cost Cost 5,675 (1,018) 4,657 - - Trade, other Accounting Accounting payables and mismatch mismatch at other liabilities (FVTPL) FVTPL 2,039 - 2,039 - - Amortised Amortised cost Cost 30,437 - 30,437 - - Amounts owed by Amortised depositors Amortised cost Cost 12,440 - 12,440 - - Derivative financial Held for Mandatorily at instruments trading FVTPL 4,498 - 4,498 - - Total 438,017 266 438,283 - - Apart from the implementation of the expected credit loss model, other significant changes in the classification and measurement of financial assets and liabilities as illustrated above have been described below. (a) Reclassification of equity instruments with a fair value of R430,570 million (at 31 December 2017) and debt instruments with a fair value of R198 million (at 31 December 2017) from financial assets designated at fair value through profit or loss in terms of IAS 39, to financial assets mandatorily at fair value through profit or loss in terms of IFRS 9. In accordance with the Group's accounting policies equity instruments are classified as financial assets at fair value through profit or loss. In terms of IAS 39 the debt instruments were designated as financial instruments at fair value through profit or loss. In terms of IFRS 9, the Group considers that these debt instruments are held within a business model where the financial performance of these instruments are measured and the instruments are managed on a fair value basis. As a result the debt instruments are classified as financial instruments at fair value through profit or loss. Since the instruments were measured at fair value in terms of IAS 39, no measurement adjustment was recognised when the instruments were reclassified. (b) Reclassification of government securities with a fair value of R3,509 million (at 31 December 2017) from financial assets designated at FVTPL under IAS 39, to financial assets at amortised cost under IFRS 9. The government securities were designated at fair value through profit or loss in terms of IAS 39. A review of the business model regarding these instruments indicated that the instruments are held with the objective to collect contractual cash flows over the term of the instrument. A review of the cash flows characteristics of the instruments indicated that the cash flows are solely payments of capital and interest on the capital outstanding. Consequently the Group classified these instruments as financial assets at amortised cost. At 1 January 2018 the Group recognised an allowance for expected credit losses of R10 million with regards to these instruments. The expected credit loss was recognised in equity at 1 January 2018. The fair value of these financial assets as at 30 June 2018 was R5,553 million. The various original effective interest rates of these instruments range from 5% to 26% per annum and R263 million of interest income has been recognised during the period. (c) Reclassification of investments and securities with a fair value of R921 million (at 31 December 2017) from available-for-sale to financial assets at fair value through profit or loss. The investment and securities comprise of government, government guaranteed securities and equity instruments. In terms of IAS 39 these instruments were designated as available for sale financial instruments. In terms of IFRS 9, the Group considers that the debt securities are held within a business model where the financial performance of these instruments are measured and the instruments are managed on a fair value basis. As a result the government and government guaranteed securities are classified as financial instruments at fair value through profit or loss. Since the instruments were measured at fair value in terms of IAS 39, no measurement adjustment was recognised when the instruments were reclassified in terms of IFRS 9. (d) Reclassification of borrowed funds (R1,018 million) at 31 December 2017) from financial liabilities at amortised under IAS 39, to financial liabilities designated at fair value through profit or loss under IFRS 9.

At 31 December 2017 the Group carried total borrowed funds with a carrying value of R18,866 million. Included in this balance were borrowed funds classified as financial liabilities at amortised cost of R5,675 million. On 1 January 2018 the Group reclassified R1,018 million of this balance to financial liabilities at fair value to avoid or significantly reduce an accounting mismatch with derivative instruments (held to mitigate interest rate risk) classified as financial instruments at fair value through profit or loss. To adjust the carrying value of the borrowed funds to fair value (R1,284 million at 31 December 2017) a fair value loss of R266 million was recognised in retained earnings. The portion of cumulative fair value losses related to changes in the credit risk of the total borrowed funds designated at fair value through profit or loss was transferred from retained earnings to other reserves at 1 January 2018. The amount of the transfer was R683 million. 5.3.3. Impairment of financial assets 5.3.3.1 Overview IFRS 9 replaces the 'incurred loss' model in IAS 39 with an 'expected credit loss' (ECL) model and results in credit losses being recognised earlier than under IAS 39. The new impairment model applies to financial assets measured at amortised cost (for example mandatory reserve deposits with central banks, reinsurers' share of policyholder liabilities, loans and advances, trade and other receivables, cash and cash equivalents, and corporate debt securities held by the Group) and corporate debt investments measured at FVOCI, but not to investments in equity instruments. As a consequence of the new standard, the Group has revised its impairment methodology under IFRS 9 for each of these classes of assets. The impact of the change in impairment methodology on the Group's total equity is disclosed in 5.3.1. The ECL impairment loss allowance is an unbiased, probability-weighted amount determined by evaluating a range of possible outcomes that reflects reasonable and supportable information that is available without undue cost or effort of past events, current conditions and forecasts of forward-looking economic conditions. The ECL model is dependent on the availability of relevant and accurate data to determine whether a significant increase in credit risk occurred since initial recognition, the probability of default (PD), the loss given default (LGD) and the possible exposure at default (EAD). Of equal importance is sound correlation between these parameters and forward- looking economic conditions. ECL reflects an entity's own expectations of credit losses. However, when considering all reasonable and supportable information that is available without undue cost or effort in estimating ECL, an entity should also consider observable market information about the credit risk of the particular financial instrument or similar financial instruments. In the absence of sufficient depth of data, management apply expert judgment within a governance framework to determine the required parameters. The expert judgement process is based on available internal and external information. Due to differences in availability of data and maturity of credit risk management across the Group, different approaches are used to determine the key parameters. Forward-looking information includes, but is not limited to macro-economic conditions expected in the future. Forward looking information used in the ECL calculation should reflect the nature and characteristics of the credit risk exposures. All reasonable and supportable information that is available should be used when incorporating forward-looking information into the ECL allowance. Forward looking assessments can be performed on an individual or collective basis. Forward-looking factors should be aligned with risk factors used in risk assessments, stress testing, budgeting as well as strategy and pricing decisions. Relevant factors include factors intrinsic to the entity and its business or derived from external conditions. Estimates regarding credit risk parameters and the impact of forward-looking information used in the calculation of the ECL loss amount should be reviewed at each reporting date and updated if necessary. The ECL loss amount depends on the specific stage where the financial instrument has been allocated to within the ECL model: - Stage 1: At initial recognition a financial instrument is allocated into stage 1, except for purchased or originated credit impaired financial instruments. - Stage 2: A financial instrument is allocated to stage 2 if there has been a significant increase in credit risk since initial recognition of the financial instrument. - Stage 3: A financial instrument is allocated to stage 3 if the financial instrument is in default or is considered to be credit impaired. Under IFRS 9, impairment loss allowances are measured on either of the following bases: - 12-month ECLs: these are ECLs that result from possible default events within the 12 months after the reporting date; and - Lifetime ECLs: these are ECLs that result from all possible default events over the expected life of a financial instrument. Group's assessment The Group measures loss allowances at an amount equal to lifetime ECLs, except for the following, which are measured as 12-month ECLs: - Financial assets that are determined to have low credit risk at the reporting date; and - Financial assets where credit risk (i.e. the risk of default occurring over the expected life of the financial instrument) has not increased significantly since initial recognition. The Group has elected to apply the IFRS 9 simplified approach in measuring expected credit losses. This uses a provision matrix when determining the lifetime expected loss allowance for all trade receivables, contract assets and lease receivables. When determining whether the credit risk of a financial asset has increased significantly since initial recognition and when estimating ECLs, the Group considers quantitative and qualitative information, based on the Group's historical experience, credit assessment and including forward-looking information. The Group's assessment of a significant increase in credit risk from initial recognition consists of a primary and
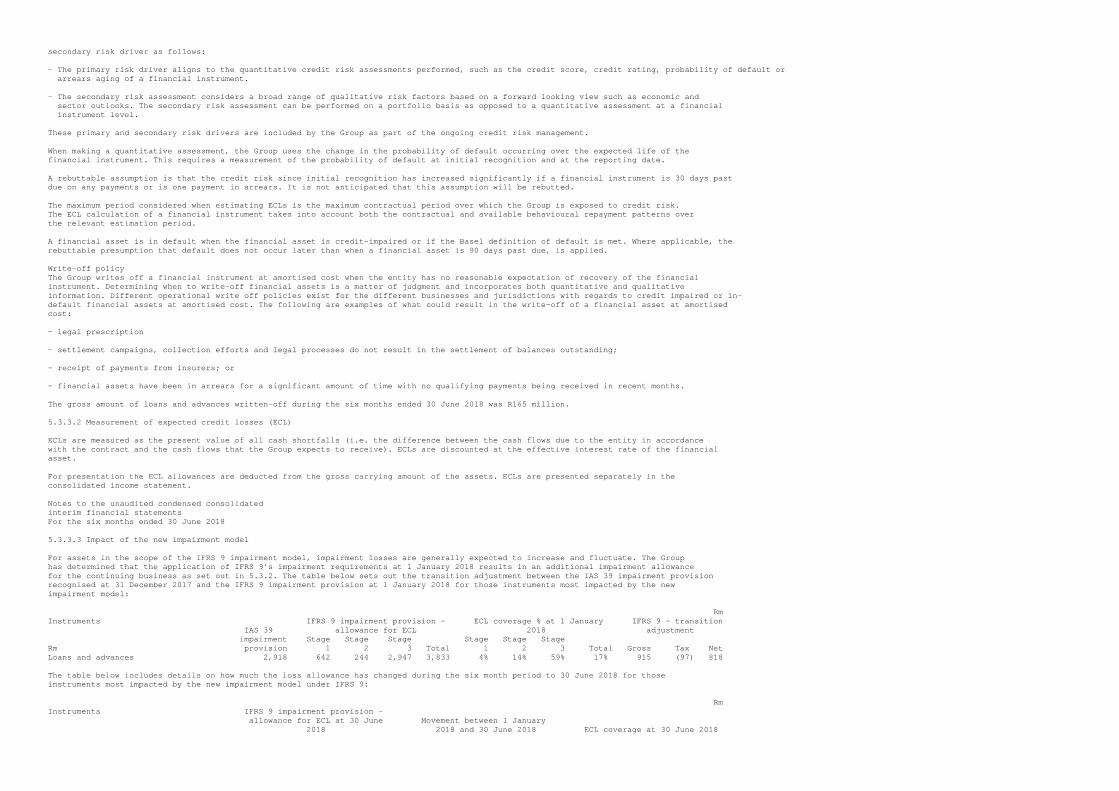
secondary risk driver as follows: - The primary risk driver aligns to the quantitative credit risk assessments performed, such as the credit score, credit rating, probability of default or arrears aging of a financial instrument. - The secondary risk assessment considers a broad range of qualitative risk factors based on a forward looking view such as economic and sector outlooks. The secondary risk assessment can be performed on a portfolio basis as opposed to a quantitative assessment at a financial instrument level. These primary and secondary risk drivers are included by the Group as part of the ongoing credit risk management. When making a quantitative assessment, the Group uses the change in the probability of default occurring over the expected life of the financial instrument. This requires a measurement of the probability of default at initial recognition and at the reporting date. A rebuttable assumption is that the credit risk since initial recognition has increased significantly if a financial instrument is 30 days past due on any payments or is one payment in arrears. It is not anticipated that this assumption will be rebutted. The maximum period considered when estimating ECLs is the maximum contractual period over which the Group is exposed to credit risk. The ECL calculation of a financial instrument takes into account both the contractual and available behavioural repayment patterns over the relevant estimation period. A financial asset is in default when the financial asset is credit-impaired or if the Basel definition of default is met. Where applicable, the rebuttable presumption that default does not occur later than when a financial asset is 90 days past due, is applied. Write-off policy The Group writes off a financial instrument at amortised cost when the entity has no reasonable expectation of recovery of the financial instrument. Determining when to write-off financial assets is a matter of judgment and incorporates both quantitative and qualitative information. Different operational write off policies exist for the different businesses and jurisdictions with regards to credit impaired or in- default financial assets at amortised cost. The following are examples of what could result in the write-off of a financial asset at amortised cost: - legal prescription - settlement campaigns, collection efforts and legal processes do not result in the settlement of balances outstanding; - receipt of payments from insurers; or - financial assets have been in arrears for a significant amount of time with no qualifying payments being received in recent months. The gross amount of loans and advances written-off during the six months ended 30 June 2018 was R165 million. 5.3.3.2 Measurement of expected credit losses (ECL) ECLs are measured as the present value of all cash shortfalls (i.e. the difference between the cash flows due to the entity in accordance with the contract and the cash flows that the Group expects to receive). ECLs are discounted at the effective interest rate of the financial asset. For presentation the ECL allowances are deducted from the gross carrying amount of the assets. ECLs are presented separately in the consolidated income statement. Notes to the unaudited condensed consolidated interim financial statements For the six months ended 30 June 2018 5.3.3.3 Impact of the new impairment model For assets in the scope of the IFRS 9 impairment model, impairment losses are generally expected to increase and fluctuate. The Group has determined that the application of IFRS 9's impairment requirements at 1 January 2018 results in an additional impairment allowance for the continuing business as set out in 5.3.2. The table below sets out the transition adjustment between the IAS 39 impairment provision recognised at 31 December 2017 and the IFRS 9 impairment provision at 1 January 2018 for those instruments most impacted by the new impairment model: Rm Instruments IFRS 9 impairment provision - ECL coverage % at 1 January IFRS 9 - transition IAS 39 allowance for ECL 2018 adjustment impairment Stage Stage Stage Stage Stage Stage Rm provision 1 2 3 Total 1 2 3 Total Gross Tax Net Loans and advances 2,918 642 244 2,947 3,833 4% 14% 59% 17% 915 (97) 818 The table below includes details on how much the loss allowance has changed during the six month period to 30 June 2018 for those instruments most impacted by the new impairment model under IFRS 9: Rm Instruments IFRS 9 impairment provision - allowance for ECL at 30 June Movement between 1 January 2018 2018 and 30 June 2018 ECL coverage at 30 June 2018

Stage Stage Stage Stage Stage Stage Stage Stage Stage Rm 1 2 3 Total 1 2 3 Total 1 2 3 Total Loans and advances 799 282 2,893 3,974 157 38 (54) 141 4% 15% 57% 14% The allowance for expected credit losses for loans and advances increased by R141 million from 1 January 2018 to 30 June 2018. 5.3.3.4 Significant judgments and estimates In determining the ECL allowances for loans and advances the following significant judgments and estimates were considered. The availability of information and the sophistication of credit risk management systems and protocols will influence the judgments made and estimates considered. - The Group applies judgment in determining whether a significant increase in credit risk took place since initial recognition of financial assets at amortised cost. Judgment was applied in identifying the qualitative and quantitative triggers and thresholds used to identify significant increases in credit risk since initial recognition of the financial assets. Depending on the availability of reasonable and supportable information without undue cost or effort, significant increases in credit risk is identified through increases in behaviour risk, arrears aging and portfolio assessments. The Group makes use of the rebuttable presumption that a significant increase in credit risk has taken place when a financial asset is 30 days past due or one payment in arrears. The assessments are carried out on regular basis as part of the credit risk management activities of the Group. - The Group applies judgment in identifying default and credit-impaired financial assets. The Group considers the arrears category where the balance have been allocated to or whether the balance is in legal review, debt review or under administration. In less sophisticated systems balances are considered to be in default when the balances have been past due for 90 days or more or have been identified to be in default after applying expert judgment. Financial asset are credit impaired when one or more events with a detrimental impact on the expected cash flows have taken place. - The calculation of the ECL balance is primarily influenced by the stage allocation of the balance and the risk parameters. The Group makes use of estimates of PDs, LGDs and EADs to calculate the ECL balance for financial assets at amortised cost. Depending on the relevant information available PDs are based on a behavioural scoring model and historic default rate curves or are determined through internally developed statistical models. LGDs are derived from a default recovery time series model that takes recency of payments into account or through internally developed statistical models. EADs are determined with reference to expected amortisation schedules and taking into account credit conversion factors as applicable for undrawn or revolving facilities. - The ability to include forward-looking information in the measurement of ECL balances is dependent on the existence of reliable and quantifiable correlation between forward-looking factors and changes in the ECL balance. When such correlations do not exist and where applicable, management applies expert judgment to determine an overlay provision to incorporate best estimates of the impact of forward-looking information. Any overlay provision is based on available information and qualitative risk factors within a governed process. The incorporation of forward-looking information into the ECL balances is an area where further development is expected as industry practice emerge. 5.3.4 Hedge accounting On the adoption of IFRS 9 the Group elected to not apply hedge accounting to any financial instruments in the continuing businesses. The Group elected to continue with hedge accounting principles as set out in IAS 39 and will adopt the hedge accounting principles set out in IFRS 9 when the IASB project on marco-hedge accounting has been completed. 5.3.5 Transitional impact Changes in accounting policies resulting from the adoption of IFRS 9 have been not been applied retrospectively and as such: - The Group has taken an exemption not to restate comparative information for prior periods with respect to classification and measurement (including impairment) requirements. As a result the comparative information disclosed for financial instruments is based on the accounting policies applied in preparing the financial statements for the financial year ended 31 December 2017. - Differences in the carrying amounts of financial assets and financial liabilities resulting from the adoption of IFRS 9 are recognised in retained earnings and reserves as at 1 January 2018. Accordingly, the information presented for 2017 does not reflect the requirements of IFRS 9 but rather that of IAS 39. The following assessments have been made on the basis of the facts and circumstances that existed at the date of initial application. - The determination of the business model within which a financial asset is held and whether or not the cash flows meet the characteristics of cash flows that are simply payments of principal and interest in the principal. - The designation and revocation of previous designations of certain financial assets and financial liabilities as measured at FVTPL. The designation of certain investments in equity instruments not held for trading as at FVOCI. - If an investment in a debt security had low credit risk at the date of initial application of IFRS 9, then the Group has assumed that the credit risk on the asset had not increased significantly since its initial recognition. 5.4. IFRS 15 'Revenue from Contracts with Customers' - Continuing businesses 5.4.1 Overview including impact on the Group's total equity IFRS 15 establishes a comprehensive framework for determining whether, how much and when revenue is recognised. It replaced IAS 18 'Revenue', IAS 11 'Construction Contracts' and related interpretations. The Group has adopted IFRS 15 'Revenue from Contracts with Customers' from 1 January 2018 which has resulted in changes to
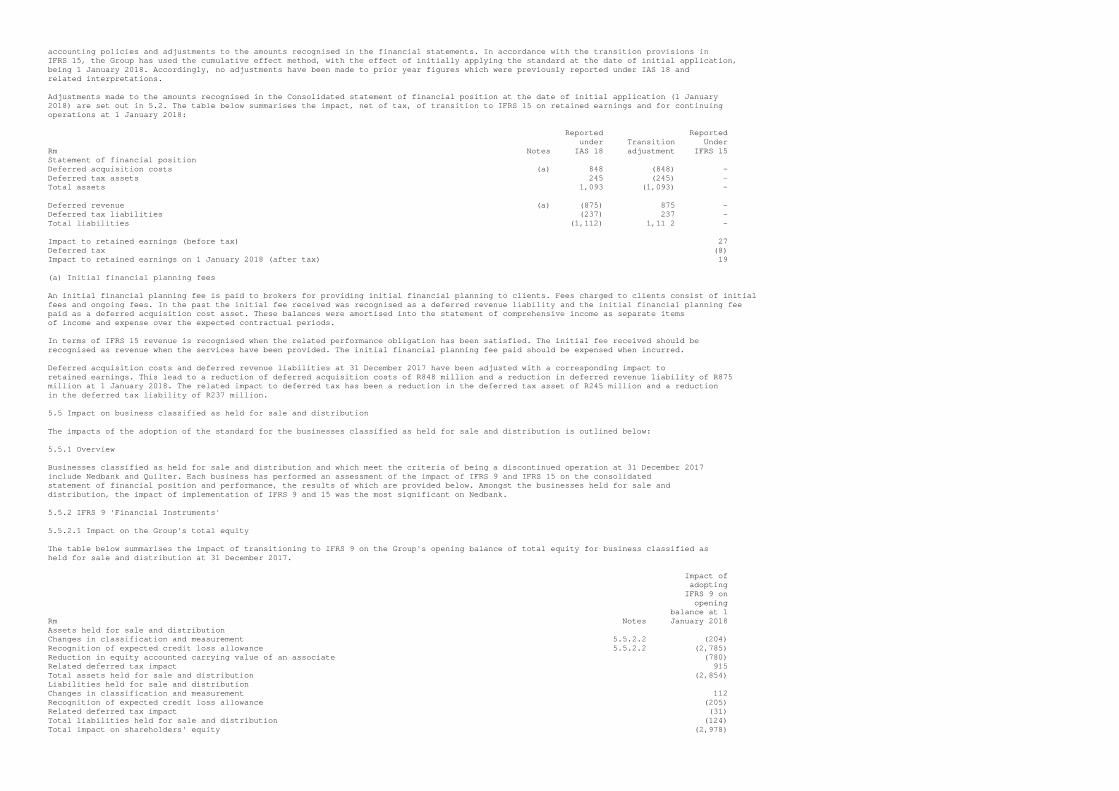
accounting policies and adjustments to the amounts recognised in the financial statements. In accordance with the transition provisions in IFRS 15, the Group has used the cumulative effect method, with the effect of initially applying the standard at the date of initial application, being 1 January 2018. Accordingly, no adjustments have been made to prior year figures which were previously reported under IAS 18 and related interpretations. Adjustments made to the amounts recognised in the Consolidated statement of financial position at the date of initial application (1 January 2018) are set out in 5.2. The table below summarises the impact, net of tax, of transition to IFRS 15 on retained earnings and for continuing operations at 1 January 2018: Reported Reported under Transition Under Rm Notes IAS 18 adjustment IFRS 15 Statement of financial position Deferred acquisition costs (a) 848 (848) - Deferred tax assets 245 (245) - Total assets 1,093 (1,093) - Deferred revenue (a) (875) 875 - Deferred tax liabilities (237) 237 - Total liabilities (1,112) 1,11 2 - Impact to retained earnings (before tax) 27 Deferred tax (8) Impact to retained earnings on 1 January 2018 (after tax) 19 (a) Initial financial planning fees An initial financial planning fee is paid to brokers for providing initial financial planning to clients. Fees charged to clients consist of initial fees and ongoing fees. In the past the initial fee received was recognised as a deferred revenue liability and the initial financial planning fee paid as a deferred acquisition cost asset. These balances were amortised into the statement of comprehensive income as separate items of income and expense over the expected contractual periods. In terms of IFRS 15 revenue is recognised when the related performance obligation has been satisfied. The initial fee received should be recognised as revenue when the services have been provided. The initial financial planning fee paid should be expensed when incurred. Deferred acquisition costs and deferred revenue liabilities at 31 December 2017 have been adjusted with a corresponding impact to retained earnings. This lead to a reduction of deferred acquisition costs of R848 million and a reduction in deferred revenue liability of R875 million at 1 January 2018. The related impact to deferred tax has been a reduction in the deferred tax asset of R245 million and a reduction in the deferred tax liability of R237 million. 5.5 Impact on business classified as held for sale and distribution The impacts of the adoption of the standard for the businesses classified as held for sale and distribution is outlined below: 5.5.1 Overview Businesses classified as held for sale and distribution and which meet the criteria of being a discontinued operation at 31 December 2017 include Nedbank and Quilter. Each business has performed an assessment of the impact of IFRS 9 and IFRS 15 on the consolidated statement of financial position and performance, the results of which are provided below. Amongst the businesses held for sale and distribution, the impact of implementation of IFRS 9 and 15 was the most significant on Nedbank. 5.5.2 IFRS 9 'Financial Instruments' 5.5.2.1 Impact on the Group's total equity The table below summarises the impact of transitioning to IFRS 9 on the Group's opening balance of total equity for business classified as held for sale and distribution at 31 December 2017. Impact of adopting IFRS 9 on opening balance at 1 Rm Notes January 2018 Assets held for sale and distribution Changes in classification and measurement 5.5.2.2 (204) Recognition of expected credit loss allowance 5.5.2.2 (2,785) Reduction in equity accounted carrying value of an associate (780) Related deferred tax impact 915 Total assets held for sale and distribution (2,854) Liabilities held for sale and distribution Changes in classification and measurement 112 Recognition of expected credit loss allowance (205) Related deferred tax impact (31) Total liabilities held for sale and distribution (124) Total impact on shareholders' equity (2,978)

Total impact on non-controlling interests (1,351) Total impact on equity attributable to shareholders of the parent (1,627) Total impact on shareholders' equity (2,978) The implementation of IFRS 9 at Ecobank Transnational Incorporated (ETI), an associate of Nedbank, resulted in reduction in equity of R780 million (after tax). The after tax impact of the implementation of IFRS 15 was a reduction of R254 million to equity and is further discussed in note 5.5.3. 5.5.2.2 Classification and measurement of financial assets and financial liabilities The table below and the accompanying notes below explain the original measurement categories under IAS 39 and the new measurement categories under IFRS 9 for each class of financial assets and financial liabilities as at 1 January 2018 for the businesses held for sale and distribution. The table only includes changes which have resulted in a significant impact in the measurement of the instrument as a consequence of either a change in classification or a change in the impairment provision recognised. The line items disclosed in the table are summarised into the assets held for distribution and sale and liabilities held for distribution on sale in note 5.2. The following are the main changes impacting the classification and measurement of financial instruments for Nedbank: 31 IAS 39 December 1 January 2018 Categories 2017 IAS 39 IFRS 9 Classification FVOCI: FVOCI: FVTPL: Carrying and Carrying Amortised Debt Equity FVTPL: value Impairment Measurement value cost instruments instruments Mandatorily Designated Rm Amortised cost 731,952 (2,785) 54 729,221 705,638 18,583 - 5,000 - Fair value through profit or loss 201,036 - (258) 200,778 61,580 - - 135,415 3,783 Available for sale 19,775 - - 19,775 3,454 14,263 923 1,135 - Total assets 952,763 (2,785) (204) 949,774 770,672 32,846 923 141,550 3,783 Financial liabilities at amortised cost 759,004 205 (112) 759,097 759,097 - - - - Fair value through profit or loss 127,369 - - 127,369 59,655 - - 67,406 308 Total liabilities 886,373 205 (112) 886,466 818,752 - - 67,406 308 Altogether R887 million of gross loans and advances and associated impairments of R474 million were reclassified from amortised cost in FVTPL, because these loans include features other than 'payments solely of principal and interest'. The loans with features other than 'payments solely of principal and interest' were reclassified in investment securities and remeasured to fair value on transition, which was R152 million lower than the amortised cost. A total of R2 billion of loans and advances at amortised cost was included in a portfolio that has a sales business objective (at 1 January 2018). These loans have been reclassified in FVTPL on adoption of IFRS 9, together with the associated impairments of R71 million. On reclassification the fair value was R44 million higher than the amortised cost. In summary, on- balance-sheet impairments decreased by R545 million on transition (R474 million due to features other than 'payments solely of principal and interest' and R71 million due to the business model). Consequently, net loans and advances decreased by R369 million and investment securities increased by R261 million, with the difference of R108 million being a fair-value remeasurement. On adoption of IFRS 9 the Group reviewed a number of accounting policies, including those on the effective-interest-rate and the derecognition of loans and advances on modification thereof. As a result of the review, the Group changed the recognition of certain initiation fees from upfront recognition in net interest revenue to amortisation, using the effective-interest-rate method. On adoption of IFRS 9 and IFRS 15 management estimated the cumulative impact of the change in effective interest rate to be R658 million (before tax) and R474 million (after tax). 5.5.2.3 Impact of the new impairment model The impact of the expected credit loss model on businesses held for sale and for distribution is largely attributable to Nedbank. Nedbank's IFRS 9 implementation accounts for supervisory guidance provided by the Basel Committee on Banking Supervision guidance document issued on credit risk and accounting for ECL, which outlines the basic principles of supervisory requirements for sound credit risk practices associated with the implementation and ongoing application of ECL accounting models, and the supervisory evaluation of credit risk, as well as by the corresponding SARB Guidance Note 3/2016. It is important to note that the methods, assumptions and accounting policies applied in applying the ECL model in Nedbank will differ from the methods, assumptions and accounting policies applied in the lending businesses reported under continuing businesses. The differences in methods, assumptions and accounting policies must be viewed against the backdrop of different products, systems and availability of information across the continuing businesses and the businesses held for sale and distribution.

The total transition adjustment for ECL was R 2,135 million (after tax) on 1 January 2018 and can be analysed as follows: Rm Loans and advances 2,752 Provision for items not recorded on the balance sheet 205 Other 33 Total impact before tax 2,990 Tax impact (855) Total impact after tax 2,135 The table below sets out the transition adjustment between the IAS 39 impairment provision recognised at 31 December 2017 and the IFRS 9 impairment provision at 1 January 2018 for loans and advances and related liabilities held by Nedbank: Instruments IAS 39 IFRS 9 impairment provision - IFRS 9 - transition impairment allowance for ECL ECL coverage % adjustment provision Stage Stage Stage Stage Stage Stage Rm (note 1) 1 2 3 Total 1 2 3 Total Gross Tax Net Loans and advances 11,527 2,695 3,889 7,695 14,279 0.38% 0.55% 1.09% 2.03% 2,752 (855) 1,897 Provision for items not recorded on the balance sheet - 82 63 60 205 205 - 205 Total 11,527 2,777 3,952 7,755 14,484 0.38% 0.55% 1.09% 2.03% 2,957 (855) 2,102 Note 1: At 1 January 2018 Nedbank reclassified loans and advances with accompanying IAS 39 impairment provision of R475 million to financial assets at fair value through profit or loss. The adjusted IAS 39 impairment provision at 1 January 2018 was R11,527 million (31 December 2017: R12,002 million). Loans and advances The largest contributor to the transition adjustment of R2,752 million was Retail and Business Banking with a transition adjustment of R2,370 million. The adjustment was due to measuring ECL for balances allocated to stage 1 of the ECL model at 12-month expected credit losses, revised behavioural lifetime estimates for products and refined modelling for performing loans. Forward-looking information The IFRS 9 macro-economic forecasts are reviewed quarterly, aligned with SARB's Monetary Policy Committee meetings. Additional ad hoc reviews will be performed in the event of significant change in the economic climate. The macroeconomic forecast includes four scenarios: a base case, a mild-stress case, a high-stress case, and a positive case. Each scenario is assigned an appropriate probability, based on its likelihood of occurring relative to the base scenario. The key macroeconomic variables included in the forecast are: GDP growth, the prime rate forecast, the household debt-to-income ratio and credit growth. The impact of macroeconomic factors is included on a probability-weighted basis by firstly determining whether the credit risk of the loan has increased significantly since origination and secondly, once it has been determined whether 12-month ECL (stage 1) or lifetime ECL (stage 2) applies, by adjusting the ECL for the macroeconomic forecast on a probability-weighted basis. Income and deferred tax Historically, Nedbank has deducted allowances on credit loss impairment provisions in accordance with the SARS ruling applicable to banks in order to determine cash tax payable. In terms of revised income tax legislation Nedbank will be able to claim a tax deduction equal to 25% of the stage 1 ECL allowance, 40% of the stage 2 ECL allowance and 85% of the stage 3 ECL allowance. It is important to note that there is no reduction for a present-value factor in the new legislation. This results in an overall reduction of current tax payable in 2018 of R450 million. The total current and deferred tax adjustment for ECL is R855 million, with R405 million recognised as a deferred tax asset. The deferred tax asset represents the difference between the accounting ECL allowance and the deduction allowed under the revised tax regime multiplied by the current corporate tax rate. Write-off IFRS 9 provides more detailed guidance on the point at which loans and advances should be written off. In terms of IFRS 9, loans and advances are written off when the Group has no reasonable expectations of recovering the asset partially or in its entirety. This assessment is judgemental and includes both qualitative and quantitative information, including trends based on historical recoveries. The implementation of IFRS 9 has resulted in an opening adjustment to balance sheet impairments to take into account the net impact of removing the benefit of post write-off recoveries and amending the point of write-off. Comparative information As permitted by the transitional provisions of IFRS 9, Nedbank has elected not to restate comparative figures. Information in this report for the year ended 31 December 2017 relating to Nedbank is presented on the basis calculated in terms of IAS 39. 5.5.3 IFRS 15 'Revenue from Contracts with Customers' Nedbank performed an assessment to determine the impact of the new standard on the Group's client loyalty programmes. Nedbank has concluded that the loyalty points awarded to clients are consideration payable in terms of IFRS 15 guidance. IFRS 15 requires revenue to be decreased by the amount expected to be payable to clients, which is recognised as a liability until payment is affected. The liability for the amount expected to be paid to clients under the loyalty programmes increased by R347 million and R254 million (on an after-tax basis) on transition. Under IFRS 15, as clients earn loyalty points, the fee and commission income earned from card transactions is reduced by the expected cost of the loyalty points against a loyalty points liability. On redemption of the loyalty points the actual costs incurred are offset against the liability. Under IFRS 15 costs of Nedbank's rewards programme were previously recognised as an expense whereas they are now recognised as a reduction in net interest revenue. G6: Future standards, amendments to standards, and interpretations not early-adopted in the 2018

unaudited condensed interim consolidated financial statements Certain new accounting standards and interpretations, have been published that are not mandatory for 2018 reporting periods and have not been early adopted by the Group. IFRS 16 'Leases' IFRS 16 'Leases' was issued in January 2016 and replaces IAS 17 Leases and its related interpretations for reporting periods beginning on or after 1 January 2019. All of the Group's businesses will be impacted by the adoption of IFRS 16. The Group as lessee: IFRS 16 introduces a 'right of use' model whereby the lessee recognises a right-of-use asset and an associated financial obligation to make lease payments for all leases with a term of more than 12 months. The asset will be amortised over the lease term and the financial liability measured at amortised cost with interest recognised in profit or loss using the effective interest rate method. The Group as lessor: IFRS 16 substantially carries forward the lessor accounting requirements in IAS 17. Accordingly, a lessor continues to classify and account for its leases as operating leases or finance leases. The Group is in the process of assessing the impact of IFRS 16 and which transitional approach it will follow. IFRS 17 'Insurance Contracts' The IASB issued IFRS 17 'Insurance Contracts' in May 2017 as a replacement for IFRS 4 Insurance Contracts. The new IFRS 17 standard is effective for reporting periods beginning on or after 1 January 2021. The new rules will affect the financial statements and key performance indicators of all entities in the Group that issue insurance contracts or investment contracts with discretionary participation features. The Group has commenced assessing the impact of IFRS 17. Administration For the six months ended 30 June 2018 Registered name: Old Mutual Limited Country of incorporation: South Africa Registration number: 2017/235138/06 Income tax reference number: 9267358233 Share code (JSE and LSE): OMU Share code (NSX): OMM Registered Office Mutualpark Jan Smuts Drive Pinelands Cape Town 7405 Internet address www.oldmutual.com Company Secretary Kirsten, Elsabé Margaretha Transfer secretaries Link Market Services South Africa (Pty) Ltd Directors Independent non-executive Directors Non-executive Directors Manuel, Trevor Andrew (Chairperson) De Beyer, Peter Gerard Baloyi, Paul Cambo Johnson, Ingrid Gail Du Toit, Matthys Michielse Naidoo, Vassi Essien, Albert Kobina Rapiya, Bahleli Marshall Kgaboesele, Itumeleng Lister, John Robert Executive Directors Magwentshu-Rensburg, Sizeka Monica Moyo, Mthandazo Peter (Chief Executive Officer) Moholi, Nombulelo Thokozile Troskie, Casparus Gerhardus (Chief Financial Officer) Mokgosi-Mwantembe, Thoko Martha Molope, Carol Winifred Nosipho Mwangi, James Irungu Sehoole, Ignatius Simon Van Graan, Stewart William

Sponsor Merrill Lynch South Africa (Pty) Limited