otes to consolidated financial statementsdownload.brother.com/pub/jp/investor/annual/pdf/... · in...
TRANSCRIPT

27
Notes to Consolidated Financial StatementsBrother Industries, Ltd. and Consolidated SubsidiariesYear ended March 31, 2013 1. Basis of Presentation of Consolidated Financial Statements
The accompanying consolidated financial statements have been prepared in accordance with the provisions set forth in the Japanese Financial Instruments and Exchange
Act and its related accounting regulations and in accordance with accounting principles generally accepted in Japan (“Japanese GAAP”), which are different in certain
respects as to application and disclosure requirements of International Financial Reporting Standards.
In preparing these consolidated financial statements, certain reclassifications and rearrangements have been made to the consolidated financial statements issued
domestically in order to present them in a form which is more familiar to readers outside Japan. In addition, certain reclassifications have been made in the 2012 consoli-
dated financial statements to conform to the classifications used in 2013.
The consolidated financial statements are stated in Japanese yen, the currency of the country in which BROTHER INDUSTRIES, LTD. (the “Company”) is incorporated and
operates. The translations of Japanese yen amounts into U.S. dollar amounts are included solely for the convenience of readers outside Japan and have been made at the
rate of ¥94 to $1, the approximate rate of exchange at March 31, 2013. Such translations should not be construed as representations that the Japanese yen amounts could
be converted into U.S. dollars at that or any other rate.
2. Summary of Significant Accounting Policies
(1) Consolidation
The Company has 89 (88 in 2012) subsidiaries at March 31, 2013. The accompanying consolidated financial statements as of March 31, 2013, include the accounts of the
Company and its significant 60 (55 in 2012) subsidiaries (together, the “Group”). The remaining 29 (33 in 2012) unconsolidated subsidiaries’ combined assets, net sales, net
income and retained earnings in the aggregate are not significant in relation to those of the consolidated financial statements of the Group.
28
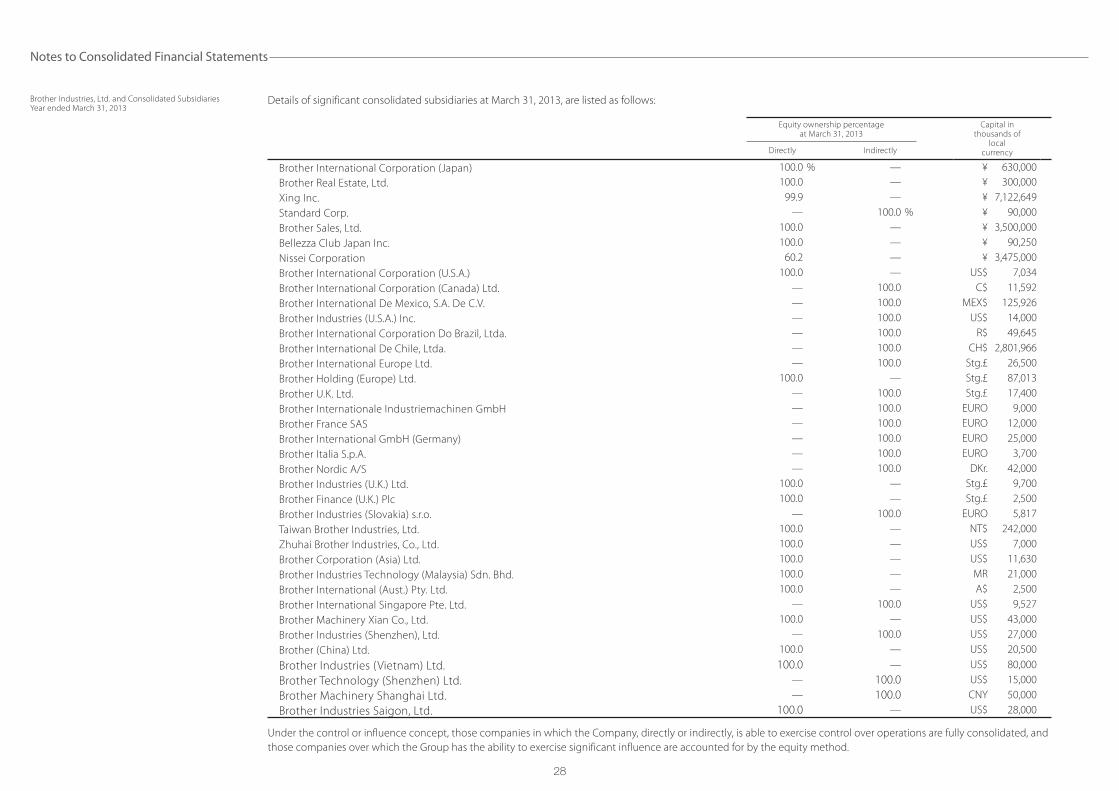
Details of significant consolidated subsidiaries at March 31, 2013, are listed as follows:
Equity ownership percentageat March 31, 2013
Capital in thousands of
localcurrencyDirectly Indirectly
Brother International Corporation (Japan) 100.0 % — ¥ 630,000
Brother Real Estate, Ltd. 100.0 — ¥ 300,000
Xing Inc. 99.9 — ¥ 7,122,649
Standard Corp. — 100.0 % ¥ 90,000
Brother Sales, Ltd. 100.0 — ¥ 3,500,000
Bellezza Club Japan Inc. 100.0 — ¥ 90,250
Nissei Corporation 60.2 — ¥ 3,475,000
Brother International Corporation (U.S.A.) 100.0 — US$ 7,034
Brother International Corporation (Canada) Ltd. — 100.0 C$ 11,592
Brother International De Mexico, S.A. De C.V. — 100.0 MEX$ 125,926
Brother Industries (U.S.A.) Inc. — 100.0 US$ 14,000
Brother International Corporation Do Brazil, Ltda. — 100.0 R$ 49,645
Brother International De Chile, Ltda. — 100.0 CH$ 2,801,966
Brother International Europe Ltd. — 100.0 Stg.£ 26,500
Brother Holding (Europe) Ltd. 100.0 — Stg.£ 87,013
Brother U.K. Ltd. — 100.0 Stg.£ 17,400
Brother Internationale Industriemachinen GmbH — 100.0 EURO 9,000
Brother France SAS — 100.0 EURO 12,000
Brother International GmbH (Germany) — 100.0 EURO 25,000
Brother Italia S.p.A. — 100.0 EURO 3,700
Brother Nordic A/S — 100.0 DKr. 42,000
Brother Industries (U.K.) Ltd. 100.0 — Stg.£ 9,700
Brother Finance (U.K.) Plc 100.0 — Stg.£ 2,500
Brother Industries (Slovakia) s.r.o. — 100.0 EURO 5,817
Taiwan Brother Industries, Ltd. 100.0 — NT$ 242,000
Zhuhai Brother Industries, Co., Ltd. 100.0 — US$ 7,000
Brother Corporation (Asia) Ltd. 100.0 — US$ 11,630
Brother Industries Technology (Malaysia) Sdn. Bhd. 100.0 — MR 21,000
Brother International (Aust.) Pty. Ltd. 100.0 — A$ 2,500
Brother International Singapore Pte. Ltd. — 100.0 US$ 9,527
Brother Machinery Xian Co., Ltd. 100.0 — US$ 43,000
Brother Industries (Shenzhen), Ltd. — 100.0 US$ 27,000
Brother (China) Ltd. 100.0 — US$ 20,500
Brother Industries (Vietnam) Ltd. 100.0 — US$ 80,000
Brother Technology (Shenzhen) Ltd. — 100.0 US$ 15,000
Brother Machinery Shanghai Ltd. — 100.0 CNY 50,000
Brother Industries Saigon, Ltd. 100.0 — US$ 28,000
Under the control or influence concept, those companies in which the Company, directly or indirectly, is able to exercise control over operations are fully consolidated, and
those companies over which the Group has the ability to exercise significant influence are accounted for by the equity method.
Notes to Consolidated Financial Statements
Brother Industries, Ltd. and Consolidated SubsidiariesYear ended March 31, 2013

29
Notes to Consolidated Financial Statements
Brother Industries, Ltd. and Consolidated SubsidiariesYear ended March 31, 2013
The excess of the cost of an acquisition over the fair value of the net assets of the acquired subsidiary at the date of acquisition is being amortized over the estimated
useful life reflecting the pattern of the future economic benefits, unless deemed immaterial and charged to income.
All significant intercompany balances and transactions have been eliminated in consolidation. All material unrealized profit included in assets resulting from transac-
tions within the Group is eliminated.
The fiscal year end of certain foreign consolidated subsidiaries is December 31. These subsidiaries are consolidated using their financial statements as of the parent
fiscal year end, which are prepared solely for consolidation purposes.
(2) Investments in Unconsolidated Subsidiaries and Associated Companies
Investments in five associated companies (six in 2012 and two unconsolidated subsidiaries in 2012) are accounted for by the equity method.
Brother Logitec, Ltd. and Mie Brother Precision Industries, Ltd., which were unconsolidated subsidiaries and accounted for by the equity method until the fiscal year
ended March 31, 2012, are included in consolidated subsidiaries due to an increase of materiality from the fiscal year ended March 31, 2013. Nissei Corporation, which was
an associated company and accounted for by the equity method, is also included in consolidated subsidiaries through the acquisition of additional shares in January 2013.
Investments in the remaining unconsolidated subsidiaries and associated companies are stated at cost. If these companies had been consolidated or accounted for by
the equity method, the effect on the consolidated financial statements would not have been material.
Accordingly, income from the unconsolidated subsidiaries and associated companies is recognized when the Group receives dividends. Unrealized intercompany
profits, if any, have not been eliminated in the consolidated financial statements.
(3) Unification of Accounting Policies Applied to Foreign Subsidiaries for the Consolidated Financial Statements
On May 17, 2006, the Accounting Standards Board of Japan (the “ASBJ”) issued ASBJ Practical Issues Task Force (PITF) No.18, “Practical Solution on Unification of Accounting
Policies Applied to Foreign Subsidiaries for the Consolidated Financial Statements.” PITF No. 18 prescribes that the accounting policies and procedures applied to a parent
company and its subsidiaries for similar transactions and events under similar circumstances should in principle be unified for the preparation of the consolidated financial
statements. However, financial statements prepared by foreign subsidiaries in accordance with either International Financial Reporting Standards or the generally accepted
accounting principles in the United States of America tentatively may be used for the consolidation process, except for the following items which should be adjusted in the
consolidation process so that net income is accounted for in accordance with Japanese GAAP, unless they are not material: (a) amortization of goodwill; (b) scheduled
amortization of actuarial gain or loss of pensions that has been directly recorded in the equity; (c) expensing capitalized development costs of R&D; (d) cancellation of the
fair value model accounting for property, plant, and equipment and investment properties and incorporation of the cost model accounting; and (e) exclusion of minority
interests from net income, if contained in net income.
(4) Unification of Accounting Policies Applied to Associated Companies for the Equity Method
In March 2008, the ASBJ issued ASBJ Statement No. 16, “Accounting Standard for Equity Method of Accounting for Investments.” The new standard requires adjustments to
be made to conform the associate’s accounting policies for similar transactions and events under similar circumstances to those of the parent company when the associ-
ate’s financial statements are used in applying the equity method unless it is impracticable to determine such adjustments. In addition, financial statements prepared by
foreign associated companies in accordance with either International Financial Reporting Standards or the generally accepted accounting principles in the United States of
America tentatively may be used in applying the equity method if the following items are adjusted so that net income is accounted for in accordance with Japanese GAAP,
unless they are not material: (a) amortization of goodwill; (b) scheduled amortization of actuarial gain or loss of pensions that has been directly recorded in the equity; (c)
expensing capitalized development costs of R&D; (d) cancellation of the fair value model accounting for property, plant, and equipment and investment properties and
incorporation of the cost model accounting; and (e) exclusion of minority interests from net income, if contained in net income.
30
(5) Business Combinations
In October 2003, the Business Accounting Council issued a Statement of Opinion, “Accounting for Business Combinations,” and in December 2005, the ASBJ issued ASBJ
Statement No. 7, “Accounting Standard for Business Divestitures” and ASBJ Guidance No. 10, “Guidance for Accounting Standard for Business Combinations and Business
Divestitures.” The accounting standard for business combinations allowed companies to apply the pooling of interests method of accounting only when certain specific
criteria are met such that the business combination is essentially regarded as a uniting-of-interests. For business combinations that do not meet the uniting-of-interests
criteria, the business combination is considered to be an acquisition and the purchase method of accounting is required. This standard also prescribes the accounting for
combinations of entities under common control and for joint ventures.
In December 2008, the ASBJ issued a revised accounting standard for business combinations, ASBJ Statement No. 21, “Accounting Standard for Business Combinations.”
Major accounting changes under the revised accounting standard are as follows: (1) The revised standard requires accounting for business combinations only by the pur-
chase method. As a result, the pooling of interests method of accounting is no longer allowed. (2) The previous accounting standard required R&D costs to be charged to
income as incurred. Under the revised standard, in-process R&D costs (IPR&D) acquired in the business combination are capitalized as an intangible asset. (3) The previous
accounting standard provided for a bargain purchase gain (negative goodwill) to be systematically amortized over a period not exceeding 20 years. Under the revised
standard, the acquirer recognizes the bargain purchase gain in profit or loss immediately on the acquisition date after reassessing and confirming that all of the assets
acquired and all of the liabilities assumed have been identified after a review of the procedures used in the purchase price allocation. This revised standard was applicable
to business combinations undertaken on or after April 1, 2010.
The Company acquired the shares of Nissei Corporation through a tender offer on January 30, 2013, and accounted for it by the purchase method of accounting. The
related negative goodwill was immediately recognized in the consolidated statement of income as gain on negative goodwill (see Note 4).
(6) Cash Equivalents
Cash equivalents are short-term investments that are readily convertible into cash and that are exposed to insignificant risk of changes in value.
Cash equivalents include time deposits and investment trust, all of which mature or become due within three months of the date of acquisition.
(7) Inventories
Inventories are stated at the lower of cost. The company and consolidated manufacturing subsidiaries determine cost by the average method. The consolidated sales
subsidiaries determine cost by using the average method or the first-in, first-out method.
(8) Marketable and Investment Securities
Marketable and investment securities are classified and accounted for, depending on management’s intent, as follows:
i ) held-to-maturity debt securities, which management has the positive intent and ability to hold to maturity, are reported at amortized cost; and ii) available-for-sale
securities with market values, which are not classified as either of the aforementioned securities, are reported at fair value, with unrealized gains and losses, net of applicable
taxes, reported in a separate component of equity.
Nonmarketable available-for-sale securities are stated at cost determined by the moving-average method.
For other-than-temporary declines in fair value, marketable and investment securities are reduced to net realizable value by a charge to income.
(9) Property, Plant and Equipment
Property, plant and equipment are stated at cost. Depreciation is mainly computed by the declining-balance method.
Effective April 1, 2012, as a result of the revision of Japanese corporate tax law, the Company and its domestic consolidated subsidiaries changed their depreciation
method for property, plant and equipment acquired on or after April 1, 2012, to the method stipulated under the revised corporate tax law.
Notes to Consolidated Financial Statements
Brother Industries, Ltd. and Consolidated SubsidiariesYear ended March 31, 2013

31
Notes to Consolidated Financial Statements
Brother Industries, Ltd. and Consolidated SubsidiariesYear ended March 31, 2013
As a result, for the fiscal year ended March 31, 2013, consolidated depreciation decreased by ¥233 million ($2,479 thousand), and both of operating income and
income before income taxes and minority interests increased by ¥231 million ($2,457 thousand).
The range of useful lives was principally from three to 50 years for buildings and structures, from four to 12 years for machinery and vehicles and from two to 20
years for furniture and fixtures.
Depreciation of leased assets under finance leases is computed by the straight-line method over the lease period.
(10) Long-lived Assets
The Group reviews its long-lived assets for impairment whenever events or changes in circumstance indicate the carrying amount of an asset or asset group may
not be recoverable. An impairment loss is recognized if the carrying amount of an asset or asset group exceeds the sum of the undiscounted future cash flows
expected to result from the continued use and eventual disposition of the asset or asset group. The impairment loss would be measured as the amount by which
the carrying amount of the asset exceeds its recoverable amount, which is the higher of the discounted cash flows from the continued use and eventual disposi-
tion of the asset or the net selling price at disposition.
(11) Other Investments and Assets
Intangible assets and goodwill are carried at cost less accumulated amortization, which is calculated by the straight-line method.
(12) Allowance for Doubtful Accounts
The allowance for doubtful accounts is stated in amounts considered to be appropriate based on the companies’ past credit loss experience and an evaluation of
potential losses in the receivables outstanding.
(13) Bonuses to Directors and Audit & Supervisory Board Members
Bonuses to directors and Audit & Supervisory Board Members are accrued at the end of the year to which such bonuses are attributable.
(14) Warranty Reserve
The Group provided a warranty reserve for repair service to cover all repair expenses based on the past warranty experience.
The warranty reserve was included in accrued expenses and amounted to ¥3,902 million ($41,511 thousand) and ¥4,277 million at March 31, 2013 and 2012,
respectively.
(15) Liability for Retirement Benefits
(i) Employees’ Retirement Benefits
The Company has a contributory funded defined benefit pension plan and a defined contribution pension plan covering substantially all of its employees.
Domestic consolidated subsidiaries have unfunded retirement benefit plans or defined contribution pension plans. Also, certain foreign subsidiaries have
defined benefit pension plans and defined contribution pension plans.
The Company and certain consolidated subsidiaries account for the liability for retirement benefits based on projected benefit obligations and plan assets at
the consolidated balance sheet date. Certain small subsidiaries apply the simplified method to state the liability at the amount which would be paid if employ-
ees retired, less plan assets at the consolidated balance sheet date.
The Company contributed certain available-for-sale securities to the employee retirement benefit trust for the Company’s contributory pension plans. The
securities held in this trust are qualified as plan assets. However, because it was expected that the fund status would remain in surplus, the Company cancelled a
certain portion of the asset and transferred it in February 2006.

32
(ii) Retirement Benefits for Directors and Audit & Supervisory Board members
Certain domestic consolidated subsidiaries provide retirement allowances for directors and Audit & Supervisory Board members. Retirement allowances for directors
and Audit & Supervisory Board members are recorded to state the liability which would be paid at the amount if they retired at each consolidated balance sheet date.
The retirement benefits for directors and Audit & Supervisory Board members are paid upon the approval of the shareholders.
(16) Asset Retirement Obligations
In March 2008, the ASBJ published ASBJ Statement No. 18, “Accounting Standard for Asset Retirement Obligations” and ASBJ Guidance No. 21, “Guidance on Accounting
Standard for Asset Retirement Obligations.” Under this accounting standard, an asset retirement obligation is defined as a legal obligation imposed either by law or contract
that results from the acquisition, construction, development and the normal operation of a tangible fixed asset and is associated with the retirement of such tangible fixed
asset. The asset retirement obligation is recognized as the sum of the discounted cash flows required for the future asset retirement and is recorded in the period in which
the obligation is incurred if a reasonable estimate can be made. If a reasonable estimate of the asset retirement obligation cannot be made in the period the asset retire-
ment obligation is incurred, the liability should be recognized when a reasonable estimate of the asset retirement obligation can be made. Upon initial recognition of a
liability for an asset retirement obligation, an asset retirement cost is capitalized by increasing the carrying amount of the related fixed asset by the amount of the liability.
The asset retirement cost is subsequently allocated to expense through depreciation over the remaining useful life of the asset. Over time, the liability is accreted to its
present value each period. Any subsequent revisions to the timing or the amount of the original estimate of undiscounted cash flows are reflected as an adjustment to the
carrying amount of the liability and the capitalized amount of the related asset retirement cost.
(17) Stock Options
The ASBJ Statement No. 8, “Accounting Standard for Stock Options” and related guidance are applicable to stock options granted on and after May 1, 2006. This standard
requires companies to measure the cost of employee stock options based on the fair value at the date of grant and recognize compensation expense over the vesting
period as consideration for receiving goods or services. The standard also requires companies to account for stock options granted to nonemployees based on the fair
value of either the stock option or the goods or services received. In the consolidated balance sheets, the stock options are presented as stock acquisition rights as a sepa-
rate component of equity until exercised. The standard covers equity-settled, share-based payment transactions, but does not cover cash-settled, share-based payment
transactions. In addition, the standard allows unlisted companies to measure options at their intrinsic value if they cannot reliably estimate fair value.
(18) R&D Costs
R&D costs are charged to income as incurred.
(19) Leases
In March 2007, the ASBJ issued ASBJ Statement No.13, “Accounting Standard for Lease Transactions,” which revised the previous accounting standard for lease transactions.
The revised accounting standard for lease transactions was effective for fiscal years beginning on or after April 1, 2008.
(Lessee)Under the previous accounting standard, finance leases that were deemed to transfer ownership of the leased property to the lessee were capitalized. However, other
finance leases were permitted to be accounted for as operating lease transactions if certain “as if capitalized” information was disclosed in the note to the lessee’s financial
statements. The revised accounting standard requires that all finance lease transactions should be capitalized by recognizing lease assets and lease obligations in the
balance sheet. In addition, the accounting standard permits leases which existed at the transition date and do not transfer ownership of the leased property to the lessee
to be accounted for as operating lease transactions.
(Lessor)Under the previous accounting standard, finance leases that were deemed to transfer ownership of the leased property to the lessee were treated as sales. However, other
finance leases were permitted to be accounted for as operating lease transactions if certain “as if sold” information is disclosed in the note to the lessor’s financial state-
ments. The revised accounting standard requires that all finance leases that are deemed to transfer ownership of the leased property to the lessee should be recognized as
lease receivables, and all finance leases that are not deemed not to transfer ownership of the leased property to the lessee should be recognized as investments in lease.
Notes to Consolidated Financial Statements
Brother Industries, Ltd. and Consolidated SubsidiariesYear ended March 31, 2013

33
The Group applied the revised accounting standard effective April 1, 2008. In addition, the Group accounted for leases which existed at the transition date and does
not transfer ownership of the leased property to the lessee as operating lease transactions.
All other leases are accounted for as operating leases.
(20) Income Taxes
The provision for current income taxes is computed based on the pretax income included in the consolidated statement of income. The asset and liability approach is used
to recognize deferred tax assets and liabilities for the expected future tax consequences of temporary differences between the carrying amounts and the tax bases of assets
and liabilities. Deferred taxes are measured by applying currently enacted tax laws to the temporary differences.
(21) Foreign Currency Transactions
All short-term and long-term monetary receivables and payables denominated in foreign currencies are translated into Japanese yen at the exchange rates at the consoli-
dated balance sheet date. The foreign exchange gains and losses from translation are recognized in the consolidated statement of income to the extent that they are not
hedged by forward exchange contracts.
(22) Foreign Currency Financial Statements
The balance sheet accounts of the consolidated foreign subsidiaries are translated into Japanese yen at the current exchange rate as of the balance sheet date except for
equity, which is translated at the historical rate. Differences arising from such translation are shown as “Foreign currency translation adjustments” under accumulated other
comprehensive income in a separate component of equity. Revenue and expense accounts of consolidated foreign subsidiaries are translated into Japanese yen at the
average exchange rate.
(23) Derivative and Hedging Activities
The Group uses derivative financial instruments to manage its exposures to fluctuations in foreign exchange and interest rate. Foreign exchange forward contracts, interest
rate swap and currency option contracts are utilized by the Group to reduce foreign currency exchange and interest rate risks. The Group does not enter into derivatives for
trading or speculative purposes.
Derivative financial instruments and foreign currency transactions are classified and accounted for as follows: a) all derivatives are recognized as either assets or liabili-
ties and measured at fair value, and gains or losses on derivative transactions are recognized in the consolidated statements of income and b) for derivatives used for hedg-
ing purposes, if such derivatives qualify for hedge accounting because of high correlation and effectiveness between the hedging instruments and the hedged items, gains
or losses on derivatives are deferred until maturity of the hedged transactions.
Foreign currency forward contracts and currency option contracts employed to hedge foreign exchange exposures are measured at fair value and unrealized gains/
losses are recognized in income. Foreign currency forward contracts and currency option contracts applied for forecasted (or committed) transactions are also measured at
fair value, but the unrealized gains/losses are deferred until the underlying transactions are completed.
(24) Per Share Information
Basic net income per share is computed by dividing net income available to common shareholders by the weighted-average number of common shares outstanding for
the period, retroactively adjusted for stock splits.
Diluted net income per share reflects the potential dilution that could occur if securities were exercised. Diluted net income per share of common stock assumes full
exercise of outstanding warrants at the beginning of the year (or at the time of issuance).
Cash dividends per share presented in the accompanying consolidated statement of income are dividends applicable to the respective years including dividends to be
paid after the end of the year.
Notes to Consolidated Financial Statements
Brother Industries, Ltd. and Consolidated SubsidiariesYear ended March 31, 2013

34
Notes to Consolidated Financial Statements
Brother Industries, Ltd. and Consolidated SubsidiariesYear ended March 31, 2013
(25) Accounting Changes and Error Corrections
In December 2009, the ASBJ issued ASBJ Statement No. 24, “Accounting Standard for Accounting Changes and Error Corrections” and ASBJ Guidance No. 24, “Guidance on
Accounting Standard for Accounting Changes and Error Corrections.” Accounting treatments under this standard and guidance are as follows: (1) Changes in Accounting
Policies—When a new accounting policy is applied following revision of an accounting standard, the new policy is applied retrospectively unless the revised accounting
standard includes specific transitional provisions, in which case the entity shall comply with the specific transitional provisions. (2) Changes in Presentation—When the
presentation of financial statements is changed, prior-period financial statements are reclassified in accordance with the new presentation. (3) Changes in Accounting
Estimates—A change in an accounting estimate is accounted for in the period of the change if the change affects that period only, and is accounted for prospectively if the
change affects both the period of the change and future periods. (4) Corrections of Prior-Period Errors—When an error in prior-period financial statements is discovered,
those statements are restated.
(26) Consolidated corporate tax system
The Company applied a consolidated corporate tax system from the year ended March 31, 2013.
(27) New Accounting Pronouncements
Accounting Standard for Retirement Benefits—On May 17, 2012, the ASBJ issued ASBJ Statement No. 26, “Accounting Standard for Retirement Benefits” and ASBJ
Guidance No. 25, “Guidance on Accounting Standard for Retirement Benefits,” which replaced the Accounting Standard for Retirement Benefits that had been
issued by the Business Accounting Council in 1998 with an effective date of April 1, 2000, and the other related practical guidance, and followed by partial
amendments from time to time through 2009.
Major changes are as follows:
(a) Treatment in the balance sheetUnder the current requirements, actuarial gains and losses and past service costs that are yet to be recognized in profit or loss are not recognized in the balance
sheet, and the difference between retirement benefit obligations and plan assets (hereinafter, “deficit or surplus”), adjusted by such unrecognized amounts, is recog-
nized as a liability or asset.
Under the revised accounting standard, actuarial gains and losses and past service costs that are yet to be recognized in profit or loss shall be recognized within
equity (accumulated other comprehensive income), after adjusting for tax effects, and any resulting deficit or surplus shall be recognized as a liability (liability for
retirement benefits) or asset (asset for retirement benefits).
(b) Amendments relating to the method of attributing expected benefit to periods and relating to the discount rate and expected future salary increasesThe revised accounting standard also made certain amendments relating to the method of attributing expected benefit to periods and relating to the discount rate
and expected future salary increases.
This accounting standard and the guidance for (a) above are effective for the end of annual periods beginning on or after April 1, 2013, and for (b) above are effective for
the beginning of annual periods beginning on or after April 1, 2014, or for the beginning of annual periods beginning on or after April 1, 2015, subject to certain disclosure
in March 2015, both with earlier application being permitted from the beginning of annual periods beginning on or after April 1, 2013. However, no retrospective applica-
tion of this accounting standard to consolidated financial statements in prior periods is required.
The Company and domestic subsidiaries expect to apply the revised accounting standard for (a) above from the end of the annual period beginning on April 1, 2013,
and for (b) above from the beginning of the annual period beginning on April 1, 2014, and is in the process of measuring the effects of applying the revised accounting
standard in future applicable periods.

35
Notes to Consolidated Financial Statements
Brother Industries, Ltd. and Consolidated SubsidiariesYear ended March 31, 2013 3. Changes in Presentation Method
(Consolidated statement of income) Prior to April 1, 2012, the “Gain on valuation of derivatives” and “Gain on sales of investment securities” were included in the “Other - net” among the “OTHER INCOME
(EXPENSES)” section of the consolidated statement of income. Since the amounts increased significantly during this fiscal year ended March 31, 2013, such amounts are
disclosed separately in the “OTHER INCOME (EXPENSES)” section of the consolidated statement of income for the year ended March 31, 2013. The amounts included in the
“OTHER INCOME (EXPENSES)” for the year ended March 31, 2012, were ¥137 million and ¥24 million, respectively.
(Consolidated statement of cash flows) Prior to April 1, 2012, the “Gain on valuation of derivatives” and “Gain on sales of investment securities” were included in the “Other - net” among the “OPERATING ACTIVITIES”
section of the consolidated statement of cash flows. Since the amounts increased significantly during this fiscal year ended March 31, 2013, such amounts are disclosed
separately in the “OPERATING ACTIVITIES” section of the consolidated statement of cash flows for the year ended March 31, 2013. The amounts included in the “Other - net”
for the year ended March 31, 2012, were ¥137 million (cash outflow) and ¥7 million (cash outflow), respectively.
4. Business Combination
On January 30, 2013, the Company acquired the additional shares of Nissei Corporation through a tender offer. Nissei Corporation is in the industrial part business mainly
focusing on production and sales of reducers and gears. This acquisition was made to advance the strategy of expanding the industrial part business outside Japan through
its global network and to strengthen the research and development of new business through the Company and Nissei Corporation’s technology and knowledge. The
results of operations for Nissei Corporation Business are included in the Company’s consolidated statement of income from the deemed acquisition date, January 1, 2013.
The Company accounted for this business combination by the purchase method of accounting.
The acquisition cost was ¥17,712 million ($188,426 thousand) in cash through a tender offer. The total cost of acquisition has been allocated to the assets acquired and
the liabilities assumed based on their respective fair values. Gain on negative goodwill recognized in connection with the acquisition totaled ¥7,194 million ($76,532
thousand).
The estimated fair values of the assets acquired and the liabilities assumed at the acquisition date are as follows:
Millions of YenThousands of
U.S. Dollars
Current assets ¥ 15,686 $ 166,872
Long-term assets 28,800 306,383
Total assets acquired 44,486 473,255
Current liabilities 1,760 18,724
Long-term liabilities 1,326 14,106
Total liabilities assumed 3,086 32,830
Net assets acquired ¥ 41,400 $ 440,425

36
Notes to Consolidated Financial Statements
Brother Industries, Ltd. and Consolidated SubsidiariesYear ended March 31, 2013
If this business combination had been completed as of April 1, 2012, the beginning of the current fiscal year, the unaudited effect on the consolidated statement of income
for the year ended March 31, 2013, would be as follows:
Millions of YenThousands of
U.S. Dollars
Sales ¥ 10,000 $ 106,383
Operating income 909 9,670
Income before income taxes and minority interests 857 9,117
Net income 259 2,755
5. Marketable and Investment Securities
Marketable and investment securities as of March 31, 2013 and 2012, consisted of the following:
Millions of YenThousands of
U.S. Dollars
2013 2012 2013
Current:
Government and corporate bonds ¥ 5,318 ¥ 475 $ 56,574
Total ¥ 5,318 ¥ 475 $ 56,574
Non-current:
Marketable equity securities ¥ 12,575 ¥ 12,207 $ 133,777
Government and corporate bonds 9,918 50 105,511
Other 1,239 153 13,180
Total ¥ 23,732 ¥ 12,410 $ 252,468
The costs and aggregate fair values of marketable and investment securities at March 31, 2013 and 2012, were as follows:
March 31, 2013
Millions of Yen
CostUnrealized
GainsUnrealized
LossesFair
Value
Securities classified as:
Available-for-sale:
Equity securities ¥ 9,361 ¥ 3,453 ¥ (1,161) ¥ 11,653
Government and corporate bonds 10,005 89 (17) 10,077
Other 760 166 — 926
Held-to-maturity 5,159 131 (5) 5,285
March 31, 2012
Millions of Yen
CostUnrealized
GainsUnrealized
LossesFair
Value
Securities classified as:
Available-for-sale:
Equity securities ¥ 8,356 ¥ 3,895 ¥ (774) ¥ 11,477
Other 14 — — 14
Held-to-maturity 525 2 — 527

37
Notes to Consolidated Financial Statements
Brother Industries, Ltd. and Consolidated SubsidiariesYear ended March 31, 2013
March 31, 2013
Thousands of U.S. Dollars
CostUnrealized
GainsUnrealized
LossesFair
Value
Securities classified as:
Available-for-sale:
Equity securities $ 99,585 $ 36,734 $ (12,351) $ 123,968
Government and corporate bonds 106,436 947 (181) 107,202
Other 8,085 1,766 — 9,851
Held-to-maturity 54,883 1,393 (53) 56,223
The information of the available-for-sale securities which were sold during the years ended March 31, 2013 and 2012, was as follows:
March 31, 2013
Millions of Yen
Proceeds Realized Gains Realized Losses
Available-for-sale:
Equity securities ¥ 2,660 ¥ 1,724 ¥ (0)
March 31, 2012
Millions of Yen
Proceeds Realized Gains Realized Losses
Available-for-sale:
Equity securities ¥ 130 ¥ 21 ¥ (17)
Other 127 3 —
March 31, 2013
Thousands of U.S. Dollars
Proceeds Realized Gains Realized Losses
Available-for-sale:
Equity securities $ 28,298 $ 18,340 $ (0)
6. Inventories
Inventories at March 31, 2013 and 2012, consisted of the following:
Millions of YenThousands of
U.S. Dollars
2013 2012 2013
Merchandise and finished products ¥ 57,482 ¥ 51,960 $ 611,510
Work in process 10,117 7,937 107,628
Raw materials and supplies 20,080 16,587 213,617
Total ¥ 87,679 ¥ 76,484 $ 932,755

38
7. Long-lived Assets
The Group reviewed its long-lived assets for impairment. For the years ended March 31, 2013 and 2012, the Company and consolidated subsidiaries recorded impairment
loss of ¥269 million ($2,862 thousand) and ¥609 million, respectively, as other expense, for business assets, idle assets and rental assets. The carrying amounts of these
assets were written down to the recoverable amount. The recoverable amount of business assets was measured at the value in use or the net selling price at disposition,
while idle assets and rental assets were measured at the net selling price at disposition. The discount rates used for computation of the present value of future cash flows
were 12.6% and 8.1% for the years ended March 31, 2013 and 2012, respectively.
8. Investment Property
In November 2008, the ASBJ issued ASBJ Statement No. 20, “Accounting Standard for Investment Property and Related Disclosures” and issued ASBJ Guidance No. 23,
“Guidance on Accounting Standard for Investment Property and Related Disclosures.”
The Group owns certain rental properties such as office buildings and land in Nagoya and other areas. The net of rental income and operating expenses for those rental
properties was ¥1,153 million ($12,266 thousand) and ¥1,053 million for the years ended March 31, 2013 and 2012, respectively.
In addition, the carrying amounts, changes in such balances and market prices of such properties are as follows:
Millions of Yen
Carrying amount Fair value
April 1, 2012 Increase March 31, 2013 March 31, 2013
¥ 7,862 ¥ 1,509 ¥ 9,371 ¥ 18,376
Millions of Yen
Carrying amount Fair value
April 1, 2011 Decrease March 31, 2012 March 31, 2012
¥ 8,797 ¥ (935) ¥ 7,862 ¥ 15,515
Thousands of U.S. Dollars
Carrying amount Fair value
April 1, 2012 Increase March 31, 2013 March 31, 2013
$ 83,638 $ 16,053 $ 99,691 $ 195,489
Notes: 1) The carrying amount recognized in the consolidated balance sheet is net of accumulated depreciation and accumulated impairment losses, if any.
2) The fair value of properties as of March 31, 2013 is mainly measured by the Group in accordance with its Real-Estate Appraisal Standard.
Notes to Consolidated Financial Statements
Brother Industries, Ltd. and Consolidated SubsidiariesYear ended March 31, 2013

39
Notes to Consolidated Financial Statements
Brother Industries, Ltd. and Consolidated SubsidiariesYear ended March 31, 2013 9. Short-term Borrowings and Long-term Debt
Short-term borrowings at March 31, 2013 and 2012, consisted of the following:
Millions of YenThousands of
U.S. Dollars
2013 2012 2013
Loans principally from banks with weighted-average interest rate of 0.74% (0.63% in 2012) ¥ 6,525 ¥ 4,467 $ 69,415
Long-term debt at March 31, 2013 and 2012, consisted of the following:
Millions of YenThousands of
U.S. Dollars
2013 2012 2013
Fourth unsecured 1.68% domestic bonds, due 2012 * — ¥ 15,000 —
Unsecured loans from a bank, due 2019 with interest rates ranging from 0.39 to 1.73% (1.73 and 1.61% in 2012) ¥ 12,700 500 $ 135,106
Lease obligations 3,450 3,174 36,702
Total 16,150 18,674 171,808
Less current portion (909) (16,363) (9,670)
Long-term debt, less current portion ¥ 15,241 ¥ 2,311 $ 162,138
*Issued by the Company
Annual maturities of long-term debt at March 31, 2013 were as follows:
Years ending March 31 Millions of YenThousands of
U.S. Dollars
2014 ¥ 909 $ 9,670
2015 1,323 14,074
2016 12,618 134,234
2017 413 4,394
2018 and thereafter 887 9,436
Total ¥ 16,150 $ 171,808
The carrying amounts of assets pledged as collateral for other long-term liabilities of ¥52 million ($553 thousand) at March 31, 2013, were as follows:
Millions of YenThousands of
U.S. Dollars
Buildings and structures, net of accumulated depreciation ¥ 202 $ 2,148
Land 123 1,309
Total ¥ 325 $ 3,457

40
10. Retirement and Pension Plans
The liability for retirement benefits in the accompanying consolidated balance sheet consisted of retirement allowances for directors and Audit & Supervisory Board
members of ¥407 million ($4,330 thousand) and ¥105 million at March 31, 2013 and 2012, respectively, and employees’ retirement benefits of ¥8,672 million ($92,255
thousand) and ¥6,981 million at March 31, 2013 and 2012, respectively.
Retirement Allowances for Directors and Audit & Supervisory Board members
Retirement allowances for directors and Audit & Supervisory Board members are paid subject to approval of the shareholders in accordance with the Companies
Act of Japan (the “Companies Act”).
Certain domestic consolidated subsidiaries recorded liabilities for their unfunded retirement allowance plan covering all of their directors and Audit & Supervisory
Board members.
Employees’ Retirement Benefits
Under the pension plan, employees terminating their employment are, in most circumstances, entitled to pension payments based on their average pay during their
employment, length of service and certain other factors.
The asset and liability for employees’ retirement benefits at March 31, 2013 and 2012, consisted of the following:
Millions of YenThousands of
U.S. Dollars
2013 2012 2013
Projected benefit obligation ¥ (61,717) ¥ (51,533) $ (656,564)
Fair value of plan assets 52,062 42,878 553,851
Unrecognized actuarial loss 11,871 11,875 126,288
Unrecognized prior service (cost) benefit (38) 1,570 (404)
Net assets 2,178 4,790 23,171
Prepaid pension cost 10,850 11,771 115,426
Liability for employees’ retirement benefits ¥ (8,672) ¥ (6,981) $ (92,255)
The components of net periodic benefit costs for the years ended March 31, 2013 and 2012, were as follows:
Millions of YenThousands of
U.S. Dollars
2013 2012 2013
Service cost ¥ 1,813 ¥ 1,733 $ 19,287
Interest cost 1,470 1,463 15,638
Expected return on plan assets (1,517) (1,531) (16,138)
Recognized actuarial loss 1,814 1,618 19,298
Amortization of prior service benefit (258) (404) (2,745)
Additional retirement payments and others 177 213 1,883
Contribution to defined contribution pension plans 1,725 1,569 18,351
Net periodic retirement benefits cost ¥ 5,224 ¥ 4,661 $ 55,574
Notes to Consolidated Financial Statements
Brother Industries, Ltd. and Consolidated SubsidiariesYear ended March 31, 2013

41
Notes to Consolidated Financial Statements
Brother Industries, Ltd. and Consolidated SubsidiariesYear ended March 31, 2013
Assumptions used for the years ended March 31, 2013 and 2012, were as follows:
2013 2012
Periodic recognition of projected benefit obligation Straight-line method Straight-line method
Discount rate Principally from 1.5% to 2.0% Principally from 1.5% to 2.0%
Expected rate of return on plan assets Principally 3.0% Principally 3.0%
Recognition period of actuarial gain / loss Principally from seven years to 17 years Principally from seven years to 17 years
Amortization period of prior service benefit / cost Principally from seven years to 16 years Principally from seven years to 16 years
11. Asset Retirement Obligations
(a) Outline of Asset Retirement Obligations
The Group’s asset retirement obligations are primarily the result of legal obligations for the removal of leasehold improvements, the restoration of premises to the
original condition, and the removal of liquid crystal in the karaoke machines upon the termination of the lease of the karaoke house.
(b) Method applied to computation of the asset retirement obligations
The estimated periods until the asset retirement obligations are settled are one to 33 years and one to 34 years for the years ended March 31, 2013 and 2012, respec-
tively, from the acquisition. The discounted rates used for computation of the asset retirement obligations are 0.10% to 3.48% and 0.13% to 3.48% for the years ended
March 31, 2013 and 2012, respectively.
The changes in asset retirement obligations for the years ended March 31, 2013 and 2012, were as follows:
Millions of YenThousands of
U.S. Dollars
2013 2012 2013
Balance at beginning of year ¥ 973 ¥ 1,022 $ 10,351
Additional provisions associated with purchases of property, plant and equipment 127 78 1,351
Reconciliation associated with passage of time 14 15 149
Reduction associated with settlement of asset retirement obligations (81) (121) (862)
Other 6 (21) 64
Balance at end of year ¥ 1,039 ¥ 973 $ 11,053
Asset retirement obligations above were included in both of the “Other current liabilities” among the “CURRENT LIABILITIES” section and the “Other long-term liabilities”
among the “LONG-TERM LIABILITIES” section in the accompanying consolidated balance sheet.
12. Equity
Japanese companies have been subject to the Companies Act. The significant provisions in the Companies Act that affect financial and accounting matters are summa-
rized below:

42
(a) Dividends
Under the Companies Act, companies can pay dividends at any time during the fiscal year in addition to the year-end dividend upon resolution at the shareholders’ meet-
ing. For companies that meet certain criteria such as (1) having a Board of Directors, (2) having independent auditors, (3) having an Audit & Supervisory Board, and (4) the
term of service of the directors is prescribed as one year rather than two years of normal term by its articles of incorporation, the Board of Directors may declare dividends
(except for dividends-in-kind) at any time during the fiscal year if the company has prescribed so in its articles of incorporation. The Company meets all the above criteria.
The Companies Act permits companies to distribute dividends-in-kind (noncash assets) to shareholders subject to a certain limitation and additional requirements.
Semiannual interim dividends may also be paid once a year upon resolution by the Board of Directors if the articles of incorporation of the company so stipulate. The
Companies Act provides certain limitations on the amounts available for dividends or the purchase of treasury stock. The limitation is defined as the amount available for
distribution to the shareholders, but the amount of net assets after dividends must be maintained at no less than ¥3 million.
(b) Increases/Decreases and Transfer of Common Stock, Reserve and Surplus
The Companies Act requires that an amount equal to 10% of dividends must be appropriated as a legal reserve (a component of retained earnings) or as additional
paid-in capital (a component of capital surplus) depending on the equity account charged upon the payment of such dividends until the aggregate amount of legal
reserve and additional paid-in capital equals 25% of the common stock. Under the Companies Act, the total amount of additional paid-in capital and legal reserve may
be reserved without limitation. The Companies Act also provides that common stock, legal reserve, additional paid-in capital, other capital surplus and retained earn-
ings can be transferred among the accounts under certain conditions upon resolution of the shareholders.
(c) Treasury Stock and Treasury Stock Acquisition Rights
The Companies Act also provides for companies to purchase treasury stock and dispose of such treasury stock by resolution of the Board of Directors. The amount
of treasury stock purchased cannot exceed the amount available for distribution to the shareholders which is determined by specific formula. Under the Compa-
nies Act, stock acquisition rights are presented as a separate component of equity. The Companies Act also provides that companies can purchase both treasury
stock acquisition rights and treasury stock. Such treasury stock acquisition rights are presented as a separate component of equity or deducted directly from stock
acquisition rights.
13. Stock Options
The stock options outstanding as of March 31, 2013, were as follows:
Stock Option Persons Granted Number of Options Granted Date of Grant Exercise Price Exercise Period
2007 Stock Option Six directors 46,000 shares March 19, 2007¥ 1
($0.01)30 years starting on the following day of stock option grant date
2008 Stock Option Six directors 65,100 shares March 24, 2008¥ 1
($0.01)Same as above
2009 Stock Option Five directors 114,500 shares March 23, 2009¥ 1
($0.01)Same as above
2010 Stock OptionFour directors
14 executive offi cers51,900 shares49,600 shares
March 23, 2010¥ 1
($0.01)Same as above
2011 Stock OptionFour directors
13 executive offi cers43,200 shares40,300 shares
March 23, 2011¥ 1
($0.01)Same as above
2012 Stock OptionThree directors
16 executive offi cers44,600 shares61,800 shares
March 23, 2012¥ 1
($0.01)Same as above
2013 Stock OptionTwo directors
16 executive offi cers36,600 shares69,500 shares
March 21, 2013¥ 1
($0.01)Same as above
Notes to Consolidated Financial Statements
Brother Industries, Ltd. and Consolidated SubsidiariesYear ended March 31, 2013

43
Notes to Consolidated Financial Statements
Brother Industries, Ltd. and Consolidated SubsidiariesYear ended March 31, 2013
The stock option activity was as follows:
2013 Stock Option
2012 Stock Option
2011Stock Option
2010 Stock Option
2009 Stock Option
2008 Stock Option
2007 Stock Option
(shares) (shares) (shares) (shares) (shares) (shares) (shares)
For the year ended March 31, 2012
Non-vested
April 1, 2011 – Outstanding — — — — — — —
Granted — — — — — — —
Canceled — — — — — — —
Vested — — — — — — —
March 31, 2012 – Outstanding — — — — — — —
Vested
April 1, 2011 - Outstanding — — 83,500 98,300 114,500 51,600 32,000
Vested — 106,400 — — — — —
Exercised — — — — 25,800 — 2,000
Canceled — — — — — — —
March 31, 2012 – Outstanding — 106,400 83,500 98,300 88,700 51,600 30,000
For the year ended March 31, 2013
Non-vested
April 1, 2012 – Outstanding — — — — — — —
Granted — — — — — — —
Canceled — — — — — — —
Vested — — — — — — —
March 31, 2013 – Outstanding — — — — — — —
Vested
April 1, 2012 - Outstanding — 106,400 83,500 98,300 88,700 51,600 30,000
Vested 106,100 — — — — — —
Exercised — — 4,000 4,800 2,400 17,600 18,000
Canceled — — — — — — —
March 31, 2013 – Outstanding 106,100 106,400 79,500 93,500 86,300 34,000 12,000
Exercise price ¥ 1 ¥ 1 ¥ 1 ¥ 1 ¥ 1 ¥ 1 ¥ 1
($ 0.01) ($ 0.01) ($ 0.01) ($ 0.01) ($ 0.01) ($ 0.01) ($ 0.01)
Average stock price at exercise — — ¥ 715 ¥ 715 ¥ 1,007 ¥ 907 ¥ 823
(—) (—) ($ 7.61) ($ 7.61) ($10.71) ($ 9.65) ($ 8.76)
Fair value price at grant date ¥ 850 ¥ 929 ¥ 1,018 ¥ 899 ¥ 642 ¥ 915 ¥ 1,350
(directors) ($9.04) ($ 9.88) ($ 10.83) ($ 9.56) ($ 6.83) ($ 9.73) ($ 14.36)
Fair value price at grant date ¥ 880 ¥ 957 ¥ 1,034 ¥ 912 — — —
(executive officers) ($ 9.36) ($ 10.18) ($ 11.00) ($ 9.70) (—) (—) (—)
44
Notes to Consolidated Financial Statements
Brother Industries, Ltd. and Consolidated SubsidiariesYear ended March 31, 2013
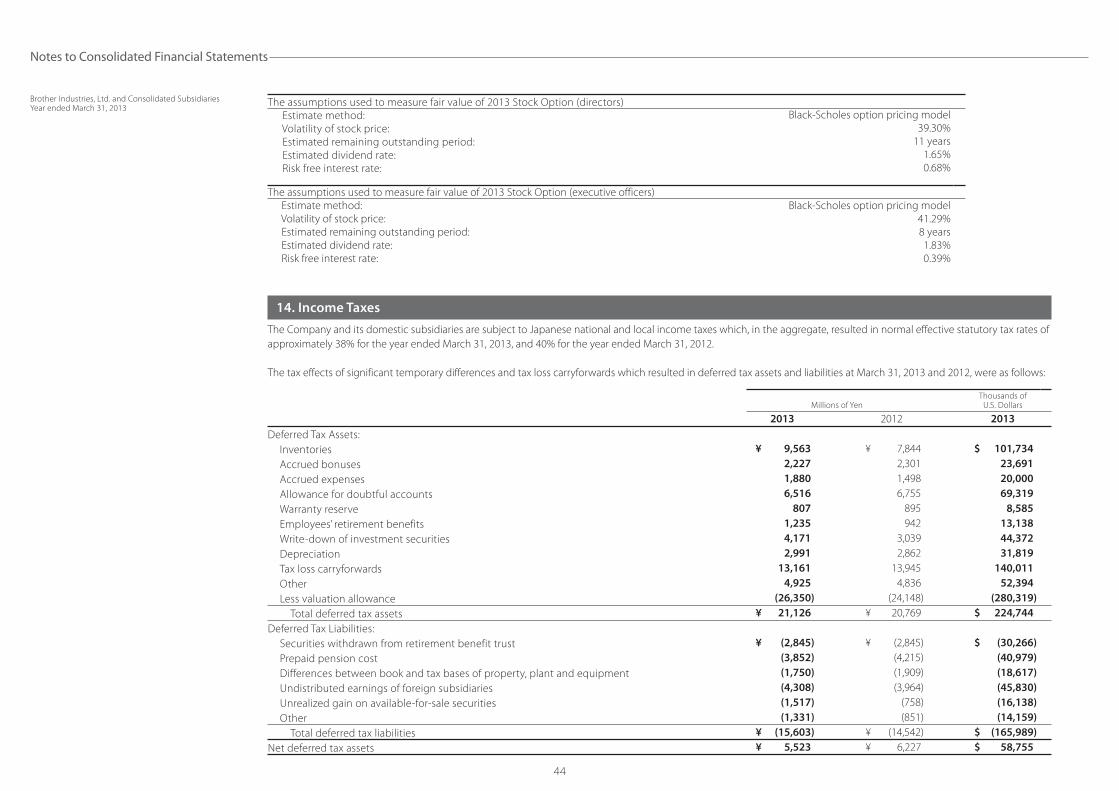
The assumptions used to measure fair value of 2013 Stock Option (directors)
Estimate method: Black-Scholes option pricing model
Volatility of stock price: 39.30%
Estimated remaining outstanding period: 11 years
Estimated dividend rate: 1.65%
Risk free interest rate: 0.68%
The assumptions used to measure fair value of 2013 Stock Option (executive officers)
Estimate method: Black-Scholes option pricing model
Volatility of stock price: 41.29%
Estimated remaining outstanding period: 8 years
Estimated dividend rate: 1.83%
Risk free interest rate: 0.39%
14. Income Taxes
The Company and its domestic subsidiaries are subject to Japanese national and local income taxes which, in the aggregate, resulted in normal effective statutory tax rates of
approximately 38% for the year ended March 31, 2013, and 40% for the year ended March 31, 2012.
The tax effects of significant temporary differences and tax loss carryforwards which resulted in deferred tax assets and liabilities at March 31, 2013 and 2012, were as follows:
Millions of YenThousands of
U.S. Dollars
2013 2012 2013
Deferred Tax Assets:
Inventories ¥ 9,563 ¥ 7,844 $ 101,734
Accrued bonuses 2,227 2,301 23,691
Accrued expenses 1,880 1,498 20,000
Allowance for doubtful accounts 6,516 6,755 69,319
Warranty reserve 807 895 8,585
Employees’ retirement benefits 1,235 942 13,138
Write-down of investment securities 4,171 3,039 44,372
Depreciation 2,991 2,862 31,819
Tax loss carryforwards 13,161 13,945 140,011
Other 4,925 4,836 52,394
Less valuation allowance (26,350) (24,148) (280,319)
Total deferred tax assets ¥ 21,126 ¥ 20,769 $ 224,744
Deferred Tax Liabilities:
Securities withdrawn from retirement benefit trust ¥ (2,845) ¥ (2,845) $ (30,266)
Prepaid pension cost (3,852) (4,215) (40,979)
Differences between book and tax bases of property, plant and equipment (1,750) (1,909) (18,617)
Undistributed earnings of foreign subsidiaries (4,308) (3,964) (45,830)
Unrealized gain on available-for-sale securities (1,517) (758) (16,138)
Other (1,331) (851) (14,159)
Total deferred tax liabilities ¥ (15,603) ¥ (14,542) $ (165,989)
Net deferred tax assets ¥ 5,523 ¥ 6,227 $ 58,755

45
A reconciliation between the normal effective statutory tax rate and the actual effective tax rate reflected in the accompanying consolidated statement of income for the
year ended March 31, 2012, was as follows:
2012
Normal effective statutory tax rate 40.50%
Expenses not deductible for income tax purposes 2.56
Revenues not recognized for income tax purposes (0.45)
Lower income tax rates applicable to income in certain foreign countries (8.80)
Tax credit for R&D expenses (1.26)
Tax sparing credit (0.49)
Net change in valuation allowance 8.10
Undistributed earnings of foreign subsidiaries 2.30
Other – net 0.29
Actual eff ective tax rate 42.75%
Since the difference between the normal effective statutory tax rate and the actual effective tax rate was not significant, a reconciliation was not presented for the year
ended March 31, 2013.
On December 2, 2011, new tax reform laws were enacted in Japan, which changed the normal effective statutory tax rate from approximately 40% to 38% effective for
the fiscal years beginning on or after April 1, 2012 through March 31, 2015, and to 35% afterwards.
15. R&D Costs
R&D costs charged to income were ¥37,514 million ($399,085 thousand) and ¥39,232 million for the years ended March 31, 2013 and 2012, respectively.
16. Leases
(As lessee)The minimum rental commitments under noncancellable operating leases were as follows:
Millions of YenThousands of
U.S. Dollars
2013 2012 2013
Operating leases:
Due within one year ¥ 1,597 ¥ 1,211 $ 16,989
Due after one year 8,453 2,510 89,926
Total ¥ 10,050 ¥ 3,721 $ 106,915
Notes to Consolidated Financial Statements
Brother Industries, Ltd. and Consolidated SubsidiariesYear ended March 31, 2013

46
(As lessor)Expected revenues under noncancellable operating leases were as follows:
Millions of YenThousands of
U.S. Dollars
2013 2012 2013
Operating leases:
Due within one year ¥ 8 ¥ 8 $ 85
Due after one year 42 30 447
Total ¥ 50 ¥ 38 $ 532
17. Financial Instruments and Related Disclosures
(1) Group policy for financial instruments
The Group uses financial instruments, mainly long-term debt including bank loans, based on its capital financing plan. Cash surpluses, if any, are invested in low risk
financial assets. Short-term bank loans are used to fund the Group’s ongoing operations. Derivatives are used, not for speculative purposes, but to manage exposure to
financial risks as described in (2) below.
(2) Nature and extent of risks arising from financial instruments
Receivables, such as trade notes and trade accounts, are exposed to customer credit risk. Although receivables in foreign currencies are exposed to the market risk of
fluctuation in foreign currency exchange rates, the position, net of payables in foreign currencies, is hedged by using forward foreign currency contracts and currency
option contracts.
Marketable and investment securities, mainly held-to-maturity securities and equity instruments of customers and suppliers of the Group, are exposed to the risk of
market price fluctuations.
Payment terms of payables, such as trade notes and trade accounts, are less than one year. Payables in foreign currencies are exposed to the market risk of fluctua-
tion in foreign currency exchange rates.
Bank loans are mainly used to fund ongoing operations. The long-term portion of bank loans is borrowed with fixed interest rates. Long-term bank loans were
mainly used to fund the acquisition of shares of Nissei Corporation.
Derivatives mainly include forward foreign currency contracts and currency option contracts, which are used to manage exposure to market risks from changes in
foreign currency exchange rates of receivables and payables, respectively. Please see Note 18 for more detail about derivatives.
(3) Risk management for financial instruments
Credit risk managementCredit risk is the risk of economic loss arising from counterparty’s failure to repay or service debt according to the contractual terms. The Group manages its credit risk
from receivables on the basis of internal guidelines, which include monitoring of payment terms and balances of major customers by each business administration
department to identify the default risk of customers at an early stage. With respect to held-to-maturity financial investments, the Group manages its exposure to credit
risk by limiting investment to high credit rated bonds in accordance with its internal guidelines.
The maximum credit risk exposure of financial assets is limited to their carrying amounts as of March 31, 2013.
Notes to Consolidated Financial Statements
Brother Industries, Ltd. and Consolidated SubsidiariesYear ended March 31, 2013

47
Market risk management (foreign exchange risk and interest rate risk)Foreign currency trade receivables and payables are exposed to market risk resulting from fluctuations in foreign currency exchange rates. Such foreign exchange risk
of trade receivables is hedged principally by forward foreign currency contracts and currency option contracts. In addition, when foreign currency trade receivables
and payables are expected to arise from forecasted transactions, forward foreign currency contracts and currency option contracts may be used to hedge foreign
exchange risk resulting from forecasted transactions expected to occur within one year.
The executions and administration of derivatives have been approved by those who are granted authority based on the internal guidelines which prescribe the
authority and the limit for each transaction.
Liquidity risk managementLiquidity risk comprises the risk that the Group cannot meet its contractual obligations in full on their maturity dates. The Group manages its liquidity risk with ade-
quate financial planning by each company.
(4) Fair values of financial instruments
Fair values of financial instruments are based on quoted prices in active markets. If a quoted price is not available, other rational valuation techniques are used instead.
Also, please see Note 18 for the detail of fair value for derivatives.
(a) Fair value of financial instruments
Millions of Yen
March 31, 2013Carrying Amount Fair Value
Unrealized Gain/(Loss)
Cash and cash equivalents ¥ 55,060 ¥ 55,060 —
Marketable securities 5,318 5,319 ¥ 1
Receivables 78,864 78,864 —
Investment securities 22,496 22,621 125
Total ¥ 161,738 ¥ 161,864 ¥ 126
Short-term borrowings ¥ 6,525 ¥ 6,525 —
Current portion of long-term debt 909 909 —
Payables 45,039 45,039 —
Income taxes payable 2,998 2,998 —
Long-term debt 15,241 15,253 ¥ (12)
Total ¥ 70,712 ¥ 70,724 ¥ (12)
Notes to Consolidated Financial Statements
Brother Industries, Ltd. and Consolidated SubsidiariesYear ended March 31, 2013

48
Millions of Yen
March 31, 2012Carrying Amount Fair Value
Unrealized Gain/(Loss)
Cash and cash equivalents ¥ 58,732 ¥ 58,732 —
Marketable securities 475 476 ¥ 1
Receivables 64,186 64,186 —
Investment securities 11,541 11,542 1
Total ¥ 134,934 ¥ 134,936 ¥ 2
Short-term borrowings ¥ 4,467 ¥ 4,467 —
Current portion of long-term debt 16,363 16,435 ¥ (72)
Payables 49,394 49,394 —
Income taxes payable 2,592 2,592 —
Long-term debt 2,311 2,315 (4)
Total ¥ 75,127 ¥ 75,203 ¥ (76)
Thousands of U.S. Dollars
March 31, 2013Carrying Amount Fair Value
Unrealized Gain/(Loss)
Cash and cash equivalents $ 585,745 $ 585,745 —
Marketable securities 56,574 56,585 $ 11
Receivables 838,979 838,979 —
Investment securities 239,319 240,648 1,329
Total $ 1,720,617 $ 1,721,957 $ 1,340
Short-term borrowings $ 69,415 $ 69,415 —
Current portion of long-term debt 9,670 9,670 —
Payables 479,138 479,138 —
Income taxes payable 31,894 31,894 —
Long-term debt 162,138 162,266 $ (128)
Total $ 752,255 $ 752,383 $ (128)
Cash and cash equivalentsThe carrying values of cash and cash equivalents approximate fair value because of their short maturities.
Marketable and investment securitiesThe fair values of marketable and investment securities are measured at the quoted market price of the stock exchange for the equity instruments, and at the quoted price
obtained from the financial institution for certain debt instruments.
The carrying values of investment trusts approximate fair value because of their short maturities.
The fair value information for the marketable and investment securities by classification is included in Note 5.
Notes to Consolidated Financial Statements
Brother Industries, Ltd. and Consolidated SubsidiariesYear ended March 31, 2013

49
Receivables and payablesThe carrying values of receivables and payables approximate fair value because of their short maturities.
Short-term borrowings and long- term debtThe carrying values of short-term borrowings approximate fair value because of their short maturities.
The fair values of long-term bank loans are determined by discounting the total balance of principal and interest at a rate which reflects the remaining term of the loan
and the Group’s credit risk.
Carrying amounts of lease obligations approximate fair value, because neither the risk free rate nor the Group’s credit profile has changed significantly since the date of
lease inception.
Income taxes payableThe carrying values of income taxes payable approximate fair value because of their short maturities.
DerivativesThe information of the fair value for derivatives is included in Note 18.
(b) Carrying amount of financial instruments whose fair value cannot be reliably determined
Millions of YenThousands of
U.S. Dollars
2013 2012 2013
Equity securities that do not have a quoted market price in an active market ¥ 922 ¥ 730 $ 9,809
Investments in limited liability partnerships that do not have a quoted market
price in an active market 313 139 3,329
Investments in and advances to unconsolidated subsidiaries and associated companies 17,767 20,148 189,011
Total ¥ 19,002 ¥ 21,017 $ 202,149
(5) Maturity analysis for financial assets and securities with contractual maturities
Millions of Yen
March 31, 2013Due in One Year
or LessDue after One Year through Five Years
Due after Five Years through 10 Years Due after 10 Years
Cash and cash equivalents ¥ 55,060 — — —
Marketable securities 5,318 — — —
Receivables 78,864 — — —
Investment securities:
Held-to-maturity securities — ¥ 5,114 ¥ 3,589 ¥ 1,215
Total ¥ 139,242 ¥ 5,114 ¥ 3,589 ¥ 1,215
Notes to Consolidated Financial Statements
Brother Industries, Ltd. and Consolidated SubsidiariesYear ended March 31, 2013

50
Thousands of U.S. Dollars
March 31, 2013Due in One Year
or LessDue after One Year through Five Years
Due after Five Years through 10 Years Due after 10 Years
Cash and cash equivalents $ 585,745 — — —
Marketable securities 56,574 — — —
Receivables 838,979 — — —
Investment securities:
Held-to-maturity securities — $ 54,404 $ 38,181 $ 12,926
Total $ 1,481,298 $ 54,404 $ 38,181 $ 12,926
Please see Note 9 for annual maturities of long-term debt.
18. Derivatives
The Group enters into foreign currency forward contracts and currency option contracts to hedge foreign exchange risk associated with certain assets and liabilities
denominated in foreign currencies. The Group also enters into interest rate swap contracts to manage its interest rate exposures on certain liabilities.
All derivative transactions are entered into to hedge foreign currency exposures incorporated within the Group’s business. Accordingly, market risk in these derivatives
is basically offset by opposite movements in the value of hedged assets or liabilities.
Because the counterparties to these derivatives are limited to major international financial institutions with high credit ratings, the Group does not anticipate any losses
arising from credit risk.
Derivative transactions entered into by the Group have been made in accordance with internal policies which regulate the authorization and credit limit amount.
The contract or notional amounts of derivatives which are shown in the following table do not represent the amounts exchanged by the parties and do not measure
the Group’s exposure to credit or market risk.
Notes to Consolidated Financial Statements
Brother Industries, Ltd. and Consolidated SubsidiariesYear ended March 31, 2013

51
Derivative transactions to which hedge accounting is not applied at March 31, 2013 and 2012
At March 31, 2013
Millions of Yen
Contract Amount
Contract Amount Due after One Year Fair Value
UnrealizedGain/(Loss)
Foreign currency forward contracts:
Selling:
U.S. Dollars ¥ 1,770 — ¥ (2) ¥ (2)
Euro 9,263 — (258) (258)
Pound Sterling 311 — (17) (17)
Thailand Baht 348 — (5) (5)
Yen 36,398 — (622) (622)
Mexican Peso 319 — (16) (16)
Korean Won 231 — (4) (4)
Indonesia Rupiah 205 — (0) (0)
Taiwan Dollars 146 — (1) (1)
India Rupee 282 — (1) (1)
Philippine Peso 407 — (1) (1)
Buying:
U.S. Dollars ¥ 1,912 — ¥ 2 ¥ 2
Euro 85 — (0) (0)
Currency option contracts:
Selling:
Call
Euro ¥ 53,616 — ¥ 4,883 ¥ (4,058)
(Option fee) (825) —
Pound Sterling 6,648 — 415 (290)
(Option fee) (124) —
Swiss Franc 628 — 4 1
(Option fee) (5) —
Buying:
Call
Euro ¥ 454 — ¥ 3 ¥ (2)
(Option fee) (5) —
Yen 40,045 — 335 (527)
(Option fee) (862) —
Interest rate swaps: ¥ 250 ¥ 250 ¥ (5) ¥ (5)
(fixed rate payment, floating rate receipt)
Notes to Consolidated Financial Statements
Brother Industries, Ltd. and Consolidated SubsidiariesYear ended March 31, 2013

52
At March 31, 2012
Millions of Yen
Contract Amount
Contract Amount Due after One Year Fair Value
UnrealizedGain/(Loss)
Foreign currency forward contracts:
Selling:
U.S. Dollars ¥ 1,761 — ¥ 4 ¥ 4
Euro 3,009 — (44) (44)
Pound Sterling 311 — (17) (17)
Thailand Baht 329 — 1 1
Yen 20,742 — (66) (66)
Mexican Peso 685 — (30) (30)
Korean Won 160 — (1) (1)
Indonesia Rupiah 250 — (5) (5)
Taiwan Dollars 71 — 0 0
India Rupee 132 — (1) (1)
Philippine Peso 275 — (1) (1)
Buying:
U.S. Dollars ¥ 1,856 — ¥ 24 ¥ 24
Pound Sterling 22 — (0) (0)
Currency option contracts:
Selling:
Call
Euro ¥ 55,587 ¥ 3,382 ¥ 1,334 ¥ (432)
(Option fee) (902) (70)
Pound Sterling 4,807 223 177 (122)
(Option fee) (55) (4)
Swiss Franc 316 — 2 2
(Option fee) (4) —
Buying:
Call
Euro ¥ 212 — ¥ 1 ¥ (3)
(Option fee) (4) —
Yen 38,921 ¥ 3,417 1,184 218
(Option fee) (966) (74)
Interest rate swaps: ¥ 1,250 ¥ 250 ¥ (16) ¥ (16)
(fixed rate payment, floating rate receipt)
Notes to Consolidated Financial Statements
Brother Industries, Ltd. and Consolidated SubsidiariesYear ended March 31, 2013

53
At March 31, 2013
Thousands of U.S. Dollars
Contract Amount
Contract Amount Due after One Year Fair Value
UnrealizedGain/(Loss)
Foreign currency forward contracts:
Selling:
U.S. Dollars $ 18,830 — $ (21) $ (21)
Euro 98,543 — (2,745) (2,745)
Pound Sterling 3,309 — (181) (181)
Thailand Baht 3,702 — (53) (53)
Yen 387,213 — (6,617) (6,617)
Mexican Peso 3,394 — (170) (170)
Korean Won 2,457 — (43) (43)
Indonesia Rupiah 2,181 — (0) (0)
Taiwan Dollars 1,553 — (11) (11)
India Rupee 3,000 — (11) (11)
Philippine Peso 4,330 — (11) (11)
Buying:
U.S. Dollars $ 20,340 — $ 21 $ 21
Euro 904 — (0) (0)
Currency option contracts:
Selling:
Call
Euro $ 570,383 — $ 51,947 $ (43,170)
(Option fee) (8,777) —
Pound Sterling 70,723 — 4,415 (3,085)
(Option fee) (1,319) —
Swiss Franc 6,681 — 43 11
(Option fee) (53) —
Buying:
Call
Euro $ 4,830 — $ 32 $ (21)
(Option fee) (53) —
Yen 426,011 — 3,564 (5,606)
(Option fee) (9,170) —
Interest rate swaps: $ 2,660 $ 2,660 $ (53) $ (53)
(fixed rate payment, floating rate receipt)
Notes to Consolidated Financial Statements
Brother Industries, Ltd. and Consolidated SubsidiariesYear ended March 31, 2013

54
Derivative transactions to which hedge accounting is applied at March 31, 2013 and 2012
At March 31, 2013
Millions of Yen
Hedged Item Contract AmountContract Amount
Due after One Year Fair Value
Foreign currency forward contracts:
Selling:
Euro Receivables ¥ 9,232 — ¥ (695)
Pound Sterling Receivables 1,037 — (23)
Yen Receivables 364 — (2)
Korean Won Receivables 78 — (2)
Indonesia Rupiah Receivables 126 — 5
Taiwan Dollars Receivables 49 — (1)
India Rupee Receivables 28 — 0
Philippine Peso Receivables 133 — 1
At March 31, 2012
Millions of Yen
Hedged Item Contract AmountContract Amount
Due after One Year Fair Value
Foreign currency forward contracts:
Selling:
Euro Receivables ¥ 5,470 — ¥ (287)
Pound Sterling Receivables 446 — (16)
Yen Receivables 236 — 12
Korean Won Receivables 57 — 1
Indonesia Rupiah Receivables 104 — 5
Taiwan Dollars Receivables 70 — 1
India Rupee Receivables 13 — 0
Philippine Peso Receivables 130 — 1
At March 31, 2013
Thousands of U.S. Dollars
Hedged Item Contract AmountContract Amount
Due after One Year Fair Value
Foreign currency forward contracts:
Selling:
Euro Receivables $ 98,213 — $ (7,394)
Pound Sterling Receivables 11,032 — (245)
Yen Receivables 3,872 — (21)
Korean Won Receivables 830 — (21)
Indonesia Rupiah Receivables 1,340 — 53
Taiwan Dollars Receivables 521 — (11)
India Rupee Receivables 298 — 0
Philippine Peso Receivables 1,415 — 11
The fair value of derivative transaction is measured at the quoted price obtained from the financial institution.
Notes to Consolidated Financial Statements
Brother Industries, Ltd. and Consolidated SubsidiariesYear ended March 31, 2013

55
19. Contingent Liabilities
At March 31, 2013, the Group had the following contingent liabilities:
Millions of YenThousands of
U.S. Dollars
Guarantees for debt of customers ¥ 53 $ 564
20. Comprehensive Income
The components of other comprehensive income for the years ended March 31, 2013 and 2012, were as follows:
Millions of Yen Millions of YenThousands of U.S.
Dollars
2013 2012 2013
Unrealized gain (loss) on available-for-sale securities:
Gains (losses) arising during the year ¥ 2,750 ¥ (740) $ 29,255
Reclassification adjustments to profit or loss (1,851) (1) (19,691)
Amount before income tax effect 899 (741) 9,564
Income tax effect (731) 433 (7,777)
Total ¥ 168 ¥ (308) $ 1,787
Deferred gain (loss) on derivatives under hedge accounting:
(Losses) gains arising during the year ¥ (2,903) ¥ 2,774 $ (30,883)
Reclassification adjustment to profit or loss 2,488 (2,917) 26,468
Amount before income tax effect (415) (143) (4,415)
Income tax effect 156 49 1,660
Total ¥ (259) ¥ (94) $ (2,755)
Foreign currency translation adjustments:
Adjustments arising during the year ¥ 21,090 ¥ (2,143) $ 224,362
Reclassification adjustments to profit or loss (228) — (2,426)
Total ¥ 20,862 ¥ (2,143) $ 221,936
Share of other comprehensive income in associates:
Gains arising during the year ¥ 40 ¥ 40 $ 426
Total ¥ 40 ¥ 40 $ 426
Total other comprehensive income (loss) ¥ 20,811 ¥ (2,505) $ 221,394
Notes to Consolidated Financial Statements
Brother Industries, Ltd. and Consolidated SubsidiariesYear ended March 31, 2013

56
Notes to Consolidated Financial Statements
Brother Industries, Ltd. and Consolidated SubsidiariesYear ended March 31, 2013 21. Net Income per Share
Reconciliation of the differences between basic and diluted net income per share (“EPS”) for the years ended March 31, 2013 and 2012, is as follows:
Millions of YenThousands of
Shares Yen U.S. Dollars
Net IncomeWeighted-Average
Shares EPS
For the year ended March 31, 2013:
Basic EPS
Net income available to common shareholders ¥ 17,826 267,473 ¥ 66.65 $ 0.71
Effect of dilutive securities
Stock acquisition rights 435
Diluted EPS
Net income for computation ¥ 17,826 267,908 ¥ 66.54 $ 0.71
For the year ended March 31, 2012:
Basic EPS
Net income available to common shareholders ¥ 19,525 267,659 ¥ 72.95
Effect of dilutive securities
Stock acquisition rights 364
Diluted EPS
Net income for computation ¥ 19,525 268,023 ¥ 72.85
22. Subsequent Events
Appropriation of Retained EarningsThe following appropriation of retained earnings at March 31, 2013, was approved at the Company’s board of directors’ meeting held on May 14, 2013:
Millions of YenThousands of
U.S. Dollars
Year-end cash dividends of ¥12 ($0.13) per share ¥ 3,226 $ 34,319
23. Segment Information
Under ASBJ Statement No. 17, “Accounting Standard for Segment Information Disclosures” and ASBJ Guidance No. 20, “Guidance on Accounting Standard for Segment
Information Disclosures,” an entity is required to report financial and descriptive information about its reportable segments. Reportable segments are operating segments
or aggregations of operating segments that meet specified criteria. Operating segments are components of an entity about which separate financial information is avail-
able and such information is evaluated regularly by the chief operating decision maker in deciding how to allocate resources and in assessing performance. Generally,
segment information is required to be reported on the same basis as is used internally for evaluating operating segment performance and deciding how to allocate
resources to operating segments.
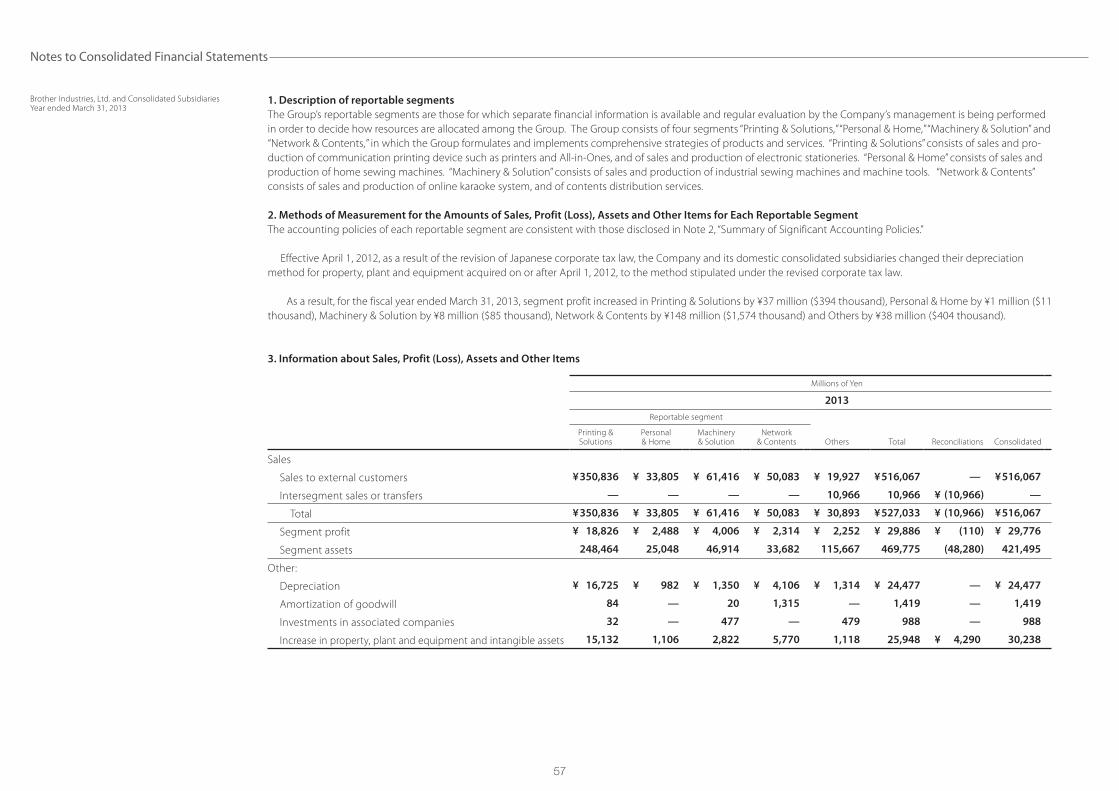
57
1. Description of reportable segments
The Group’s reportable segments are those for which separate financial information is available and regular evaluation by the Company’s management is being performed
in order to decide how resources are allocated among the Group. The Group consists of four segments “Printing & Solutions,” “Personal & Home,” “Machinery & Solution” and
“Network & Contents,” in which the Group formulates and implements comprehensive strategies of products and services. “Printing & Solutions” consists of sales and pro-
duction of communication printing device such as printers and All-in-Ones, and of sales and production of electronic stationeries. “Personal & Home” consists of sales and
production of home sewing machines. “Machinery & Solution” consists of sales and production of industrial sewing machines and machine tools. “Network & Contents”
consists of sales and production of online karaoke system, and of contents distribution services.
2. Methods of Measurement for the Amounts of Sales, Profit (Loss), Assets and Other Items for Each Reportable Segment
The accounting policies of each reportable segment are consistent with those disclosed in Note 2, “Summary of Significant Accounting Policies.”
Effective April 1, 2012, as a result of the revision of Japanese corporate tax law, the Company and its domestic consolidated subsidiaries changed their depreciation
method for property, plant and equipment acquired on or after April 1, 2012, to the method stipulated under the revised corporate tax law.
As a result, for the fiscal year ended March 31, 2013, segment profit increased in Printing & Solutions by ¥37 million ($394 thousand), Personal & Home by ¥1 million ($11
thousand), Machinery & Solution by ¥8 million ($85 thousand), Network & Contents by ¥148 million ($1,574 thousand) and Others by ¥38 million ($404 thousand).
3. Information about Sales, Profit (Loss), Assets and Other Items
Millions of Yen
2013
Reportable segment
Printing &Solutions
Personal & Home
Machinery& Solution
Network& Contents Others Total Reconciliations Consolidated
Sales
Sales to external customers ¥350,836 ¥ 33,805 ¥ 61,416 ¥ 50,083 ¥ 19,927 ¥516,067 — ¥516,067
Intersegment sales or transfers — — — — 10,966 10,966 ¥ (10,966) —
Total ¥350,836 ¥ 33,805 ¥ 61,416 ¥ 50,083 ¥ 30,893 ¥527,033 ¥ (10,966) ¥516,067
Segment profit ¥ 18,826 ¥ 2,488 ¥ 4,006 ¥ 2,314 ¥ 2,252 ¥ 29,886 ¥ (110) ¥ 29,776
Segment assets 248,464 25,048 46,914 33,682 115,667 469,775 (48,280) 421,495
Other:
Depreciation ¥ 16,725 ¥ 982 ¥ 1,350 ¥ 4,106 ¥ 1,314 ¥ 24,477 — ¥ 24,477
Amortization of goodwill 84 — 20 1,315 — 1,419 — 1,419
Investments in associated companies 32 — 477 — 479 988 — 988
Increase in property, plant and equipment and intangible assets 15,132 1,106 2,822 5,770 1,118 25,948 ¥ 4,290 30,238
Notes to Consolidated Financial Statements
Brother Industries, Ltd. and Consolidated SubsidiariesYear ended March 31, 2013
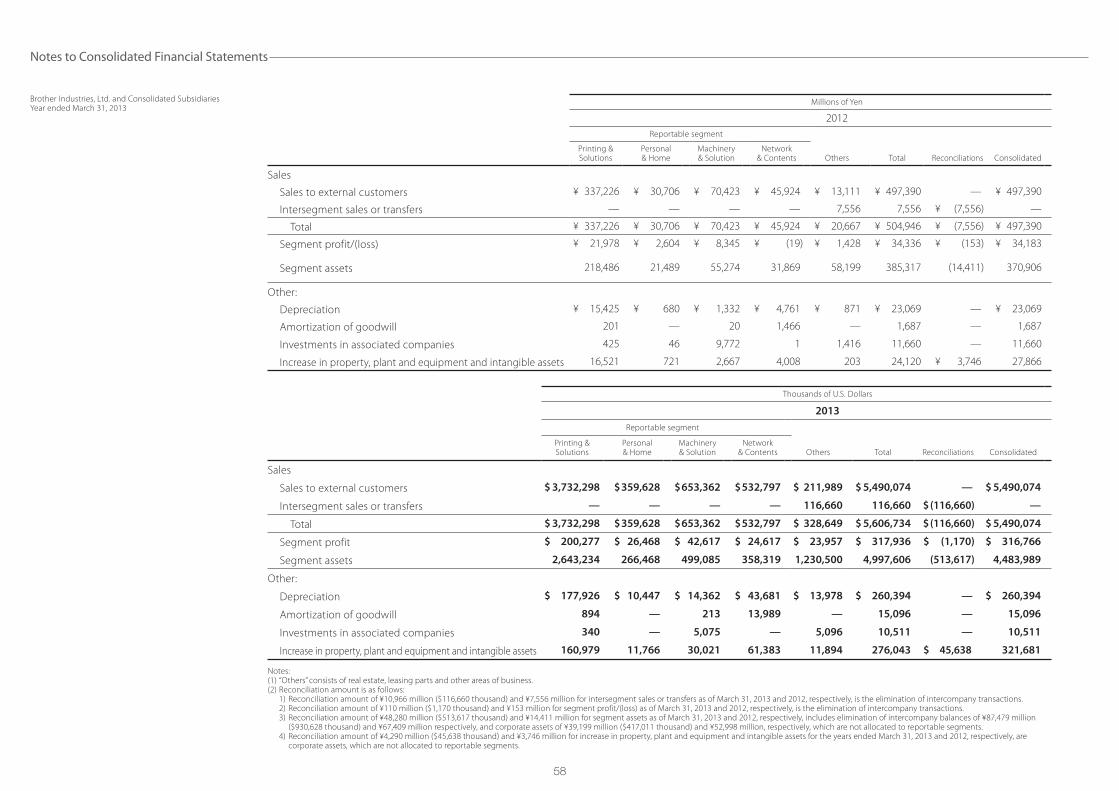
58
Notes to Consolidated Financial Statements
Brother Industries, Ltd. and Consolidated SubsidiariesYear ended March 31, 2013
Millions of Yen
2012
Reportable segment
Printing &Solutions
Personal & Home
Machinery& Solution
Network& Contents Others Total Reconciliations Consolidated
Sales
Sales to external customers ¥ 337,226 ¥ 30,706 ¥ 70,423 ¥ 45,924 ¥ 13,111 ¥ 497,390 — ¥ 497,390
Intersegment sales or transfers — — — — 7,556 7,556 ¥ (7,556) —
Total ¥ 337,226 ¥ 30,706 ¥ 70,423 ¥ 45,924 ¥ 20,667 ¥ 504,946 ¥ (7,556) ¥ 497,390
Segment profit/(loss) ¥ 21,978 ¥ 2,604 ¥ 8,345 ¥ (19) ¥ 1,428 ¥ 34,336 ¥ (153) ¥ 34,183
Segment assets 218,486 21,489 55,274 31,869 58,199 385,317 (14,411) 370,906
Other:
Depreciation ¥ 15,425 ¥ 680 ¥ 1,332 ¥ 4,761 ¥ 871 ¥ 23,069 — ¥ 23,069
Amortization of goodwill 201 — 20 1,466 — 1,687 — 1,687
Investments in associated companies 425 46 9,772 1 1,416 11,660 — 11,660
Increase in property, plant and equipment and intangible assets 16,521 721 2,667 4,008 203 24,120 ¥ 3,746 27,866
Thousands of U.S. Dollars
2013
Reportable segment
Printing & Solutions
Personal & Home
Machinery& Solution
Network& Contents Others Total Reconciliations Consolidated
Sales
Sales to external customers $ 3,732,298 $359,628 $653,362 $532,797 $ 211,989 $ 5,490,074 — $ 5,490,074
Intersegment sales or transfers — — — — 116,660 116,660 $(116,660) —
Total $ 3,732,298 $359,628 $653,362 $532,797 $ 328,649 $ 5,606,734 $(116,660) $ 5,490,074
Segment profit $ 200,277 $ 26,468 $ 42,617 $ 24,617 $ 23,957 $ 317,936 $ (1,170) $ 316,766
Segment assets 2,643,234 266,468 499,085 358,319 1,230,500 4,997,606 (513,617) 4,483,989
Other:
Depreciation $ 177,926 $ 10,447 $ 14,362 $ 43,681 $ 13,978 $ 260,394 — $ 260,394
Amortization of goodwill 894 — 213 13,989 — 15,096 — 15,096
Investments in associated companies 340 — 5,075 — 5,096 10,511 — 10,511
Increase in property, plant and equipment and intangible assets 160,979 11,766 30,021 61,383 11,894 276,043 $ 45,638 321,681
Notes: (1) “Others” consists of real estate, leasing parts and other areas of business. (2) Reconciliation amount is as follows: 1) Reconciliation amount of ¥10,966 million ($116,660 thousand) and ¥7,556 million for intersegment sales or transfers as of March 31, 2013 and 2012, respectively, is the elimination of intercompany transactions. 2) Reconciliation amount of ¥110 million ($1,170 thousand) and ¥153 million for segment profit/(loss) as of March 31, 2013 and 2012, respectively, is the elimination of intercompany transactions. 3) Reconciliation amount of ¥48,280 million ($513,617 thousand) and ¥14,411 million for segment assets as of March 31, 2013 and 2012, respectively, includes elimination of intercompany balances of ¥87,479 million
($930,628 thousand) and ¥67,409 million respectively, and corporate assets of ¥39,199 million ($417,011 thousand) and ¥52,998 million, respectively, which are not allocated to reportable segments. 4) Reconciliation amount of ¥4,290 million ($45,638 thousand) and ¥3,746 million for increase in property, plant and equipment and intangible assets for the years ended March 31, 2013 and 2012, respectively, are
corporate assets, which are not allocated to reportable segments.

59
Notes to Consolidated Financial Statements
Brother Industries, Ltd. and Consolidated SubsidiariesYear ended March 31, 2013
4. Information about Geographical Areas
(a) Sales
Millions of Yen
2013
Europe U.S.A. Japan China Asia and others Americas and others Total
¥ 133,296 ¥ 125,212 ¥ 118,926 ¥ 54,427 ¥ 48,292 ¥ 35,914 ¥ 516,067
Millions of Yen
2012
Europe Japan U.S.A. China Asia and others Americas and others Total
¥ 137,501 ¥ 114,374 ¥ 111,062 ¥ 55,837 ¥ 46,791 ¥ 31,825 ¥ 497,390
Thousands of U.S. Dollars
2013
Europe U.S.A. Japan China Asia and others Americas and others Total
$ 1,418,043 $ 1,332,043 $ 1,265,170 $ 579,011 $ 513,744 $ 382,063 $ 5,490,074
Note: Sales are classified in countries or regions based on locations of customers.
(b) Property, plant and equipment
Millions of Yen
2013
Japan China Vietnam Americas Europe Asia and others Total
¥ 55,368 ¥ 11,983 ¥ 9,243 ¥ 6,075 ¥ 3,901 ¥ 2,019 ¥ 88,589
Millions of Yen
2012
Japan China Asia and others Americas Europe Total
¥ 45,513 ¥ 9,817 ¥ 6,541 ¥ 4,705 ¥ 3,370 ¥ 69,946
Thousands of U.S. Dollars
2013
Japan China Vietnam Americas Europe Asia and others Total
$ 589,021 $ 127,479 $ 98,330 $ 64,628 $ 41,500 $ 21,478 $ 942,436

60
5. Information about Impairment Losses of Assets by Reportable Segment
Millions of Yen
2013
Printing& Solutions
Personal& Home
Machinery& Solution
Network& Contents Others Total
Impairment losses of assets ¥ 55 — — ¥ 214 — ¥ 269
Millions of Yen
2012
Printing & Solutions
Personal& Home
Machinery& Solution
Network& Contents Others Total
Impairment losses of assets ¥ 78 — — ¥ 531 — ¥ 609
Thousands of U.S. Dollars
2013
Printing& Solutions
Personal& Home
Machinery& Solution
Network& Contents Others Total
Impairment losses of assets $ 585 — — $ 2,277 — $ 2,862
6. Information about Amount of Goodwill by Reportable Segment
Millions of Yen
2013
Printing& Solutions
Personal& Home
Machinery& Solution
Network& Contents Others Total
Goodwill at March 31, 2013 — — ¥ 209 ¥ 5,044 — ¥ 5,253
Millions of Yen
2012
Printing & Solutions
Personal& Home
Machinery& Solution
Network& Contents Others Total
Goodwill at March 31, 2012 ¥ 84 — ¥ 228 ¥ 6,086 — ¥ 6,398
Thousands of U.S. Dollars
2013
Printing& Solutions
Personal& Home
Machinery& Solution
Network& Contents Others Total
Goodwill at March 31, 2013 — — $ 2,223 $ 53,660 — $ 55,883
Notes to Consolidated Financial Statements
Brother Industries, Ltd. and Consolidated SubsidiariesYear ended March 31, 2013

61
Notes to Consolidated Financial Statements
Brother Industries, Ltd. and Consolidated SubsidiariesYear ended March 31, 2013
7. Information about Gain on Negative Goodwill by Reportable Segment
Not applicable in the year ended March 31, 2012.
Gain on negative goodwill of ¥7,194 million ($76,532 thousand) was recognized in “Others” for the year ended March 31, 2013. This arose from the acquisition of the
shares of Nissei Corporation through a tender offer.
24. Related Party Disclosures
Transactions of the Company with an unconsolidated subsidiary, Brother Industries (Philippines), Inc. for the year ended March 31, 2013 was as follows:
Millions of YenThousands of
U.S. Dollars
Subscription for new shares of Brother Industries (Philippines), Inc. ¥ 6,441 $ 68,521