ott video services - the denver post – colorado breaking ... · 3 ott video servicesinnovation,...
TRANSCRIPT
By Tim Siglin, Contributing Editor, Streaming Media magazine, and Co-founder & Principal Analyst, Transitions, Inc.
Produced by Streaming Media magazine and Unisphere Research, a Division of Information Today, Inc. April 2017
Sponsored by
OTT VIDEO SERVICESINNOVATION, OPPORTUNITY, MATURATION & TECHNOLOGY TRENDS IN OTT DELIVERY
2
OTT VIDEO SERVICES—INNOVATION, OPPORTUNITY, MATURATION & TECHNOLOGY TRENDS IN OTT DELIVERY was produced by Unisphere Research and Streaming Media magazine, sponsored by Level 3 Communications, and crafted by Transitions, Inc. Unisphere Research is the market research unit of Unisphere Media, a division of Information Today, Inc. To review abstracts of our past reports, visit www.unisphereresearch.com. Unisphere Media, 121 Chanlon Road, New Providence, NJ 07974; 908-795-3702.
TABLE OF CONTENTS
INTRODUCTION �������������������������������������������������������������������������������������������������������������������������������3
WHEN WILL OTT REPLACE TV? �������������������������������������������������������������������������������������������������������4
IS OTT A VIABLE REVENUE OPPORTUNITY? �����������������������������������������������������������������������������������4
THE IMPORTANCE OF LIVE OTT OFFERINGS �����������������������������������������������������������������������������������5
WHY OFFER OTT SERVICES? �����������������������������������������������������������������������������������������������������������5
WHAT CHALLENGES DO OTT PROVIDERS FACE? ���������������������������������������������������������������������������6
PRESENT VALUE VERSUS FUTURE VALUE: THE MONETIZATION QUESTION ��������������������������������7
ONE OR MANY: CDNs, GEOGRAPHIES, AND SECURITY ����������������������������������������������������������������7
AM I SECURE?����������������������������������������������������������������������������������������������������������������������������������8
EMERGING OTT OFFERINGS �����������������������������������������������������������������������������������������������������������8
MARKET MATURATION �����������������������������������������������������������������������������������������������������������������10
SUMMARY �������������������������������������������������������������������������������������������������������������������������������������12
ABOUT LEVEL 3 ������������������������������������������������������������������������������������������������������������������������������12
3
OTT VIDEO SERVICES—INNOVATION, OPPORTUNITY, MATURATION & TECHNOLOGY TRENDS IN OTT DELIVERY was produced by Unisphere Research and Streaming Media magazine, sponsored by Level 3 Communications, and crafted by Transitions, Inc. Unisphere Research is the market research unit of Unisphere Media, a division of Information Today, Inc. To review abstracts of our past reports, visit www.unisphereresearch.com. Unisphere Media, 121 Chanlon Road, New Providence, NJ 07974; 908-795-3702.
INTRODUCTION
The world of over-the-top (OTT) video services seems to be entering a golden age, from content and acquisition to delivery and payment methods.
The year 2017 marks the third annual OTT Video Services survey and report that Unisphere Research, in conjunction with sponsor, Level 3 Communications, and survey author, Timothy Siglin, have delivered to the larger streaming media industry. This year, a clear trend emerged of companies maturing into the OTT marketplace, separating them from newer entrants, as well as drawing a contrast between two types of organizations: those thinking about OTT and those actually doing OTT.
In the 2015 report, we explored Challenges And Opportunities For Global OTT Service Providers and the initial concepts around live-linear OTT (e.g., broadcast channels being delivered across the internet).
In the 2016 report, we considered Today’s Trends And What Is Next For 4K, HDR, HFR & VR to assess a variety of technologies intersecting with OTT.
As part of the last report’s examination of 2016 trends, we noted impressive OTT subscriber growth. Hulu neared almost 12 million paid subscribers in 2016, Netflix had over 75 million subcribers in almost 200 countries worldwide, and Amazon approached 50 million Prime members.
Amazon Prime Video now has north of 66 million subscribers, while Netflix, for its part, is on a roll, having ended 2016 with 93.8 million subscribers worldwide. To put this in perspective, Netflix had 17.4 million subscribers in 2015, but has since added hundreds of countries and significant original programming, allowing Netflix to ride the OTT wave very well.
Hulu still hovers 12 million subscribers, but is pulling in record revenues and preparing to launch a 34% “skinny” bundle of live-linear OTT channels—rebroadcasting major networks and traditional premium cable channels via the internet, so that cord-cutters can enjoy live TV on their OTT devices.
To get an unbiased take on the way the market is growing, for this 2017 OTT Video Services report, Unisphere Research again teamed up with Level 3 Communications and Transitions, Inc., to analyze 486 survey responses.
A full 70% of respondents are from North America and 16% are from Europe, the two most mature OTT markets in terms of content offerings and overall subscribers. The remaining respondents are from other parts of the world, including 9% from Asia-Pacific and 5% from South America, two large growth markets for OTT services.
We asked respondents to examine OTT from a variety of angles, ranging from business and technology challenges to the competitive challenges and revenue viability of offering various types of OTT services—from 4K and virtual reality
video (VR-video) to high-frame-rate (HFR) and high- dynamic-range (HDR) content types.
Along the way, survey takers—both the key number of respondents working in OTT today, as well as the larger group who are exploring OTT opportunities—provided insights into trends and opportunities.
We were able to then further sort the respondents into two groups: those who currently offer OTT services, and those who do not. Almost 47% of respondents, or 229 of our 486 survey takers, indicated their companies offer OTT services today.
The percentage of respondents offering current OTT services is up from 45% in 2016 and 35% in 2015, so it appears there’s a growing trend toward OTT delivery in the larger streaming media industry.
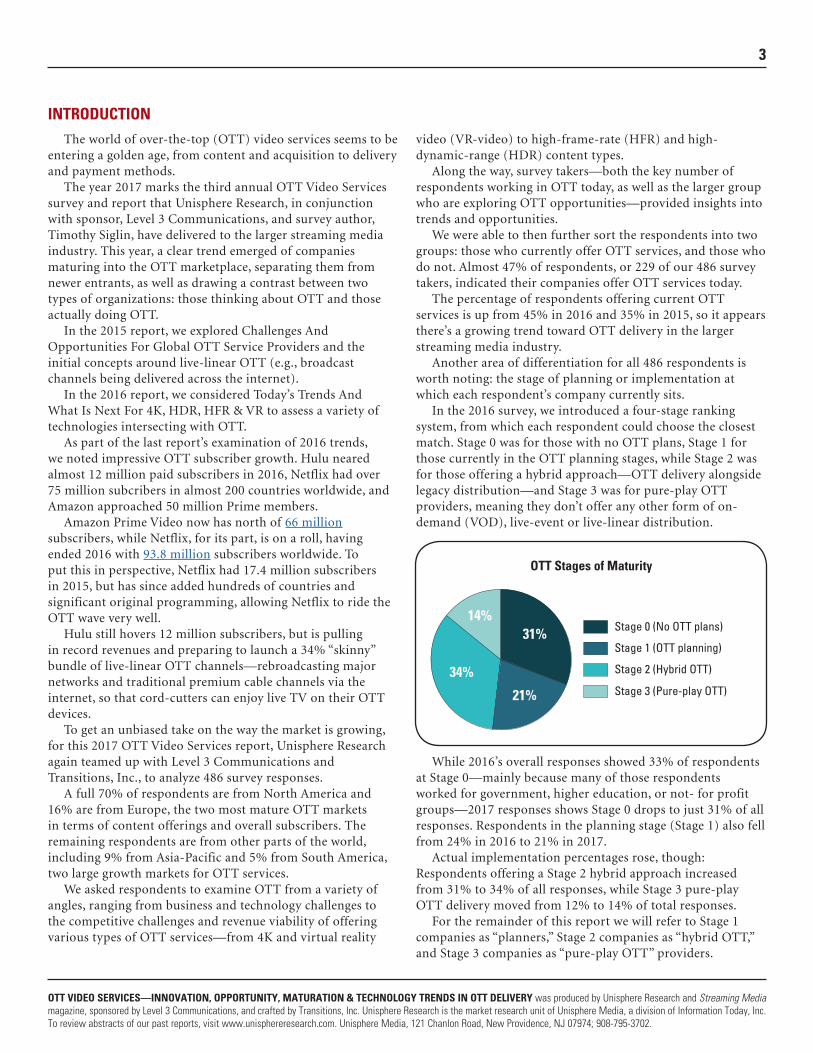
Another area of differentiation for all 486 respondents is worth noting: the stage of planning or implementation at which each respondent’s company currently sits.
In the 2016 survey, we introduced a four-stage ranking system, from which each respondent could choose the closest match. Stage 0 was for those with no OTT plans, Stage 1 for those currently in the OTT planning stages, while Stage 2 was for those offering a hybrid approach—OTT delivery alongside legacy distribution—and Stage 3 was for pure-play OTT providers, meaning they don’t offer any other form of on-demand (VOD), live-event or live-linear distribution.
While 2016’s overall responses showed 33% of respondents at Stage 0—mainly because many of those respondents worked for government, higher education, or not- for profit groups—2017 responses shows Stage 0 drops to just 31% of all responses. Respondents in the planning stage (Stage 1) also fell from 24% in 2016 to 21% in 2017.
Actual implementation percentages rose, though: Respondents offering a Stage 2 hybrid approach increased from 31% to 34% of all responses, while Stage 3 pure-play OTT delivery moved from 12% to 14% of total responses.
For the remainder of this report we will refer to Stage 1 companies as “planners,” Stage 2 companies as “hybrid OTT,” and Stage 3 companies as “pure-play OTT” providers.
31%
21%
14%Stage 0 (No OTT plans)
Stage 1 (OTT planning)
Stage 2 (Hybrid OTT)
Stage 3 (Pure-play OTT)
34%
OTT Stages of Maturity
4
OTT VIDEO SERVICES—INNOVATION, OPPORTUNITY, MATURATION & TECHNOLOGY TRENDS IN OTT DELIVERY was produced by Unisphere Research and Streaming Media magazine, sponsored by Level 3 Communications, and crafted by Transitions, Inc. Unisphere Research is the market research unit of Unisphere Media, a division of Information Today, Inc. To review abstracts of our past reports, visit www.unisphereresearch.com. Unisphere Media, 121 Chanlon Road, New Providence, NJ 07974; 908-795-3702.
The maturing of the overall OTT marketplace is detailed toward the end of this 2017 OTT Video Services survey report, as we analyze further the stages of implementation experience.
A final trend over the past three years has been the growing number of respondents that work for a company that is part of a larger media group. In 2015, only 13% of respondents said their companies were part of a larger media group. This rose to 15% in 2016 and accounted for almost 20% of all 2017 responses.
This trend was most pronounced for those respondents that work for companies currently offering OTT services. While 2016 showed less than 25% of these respondents working for organizations that are part of a larger media group, the same grouping rose to almost 34% of respondents in 2017. This data point may indicate an acceleration of large media companies entering the OTT video services and delivery game.
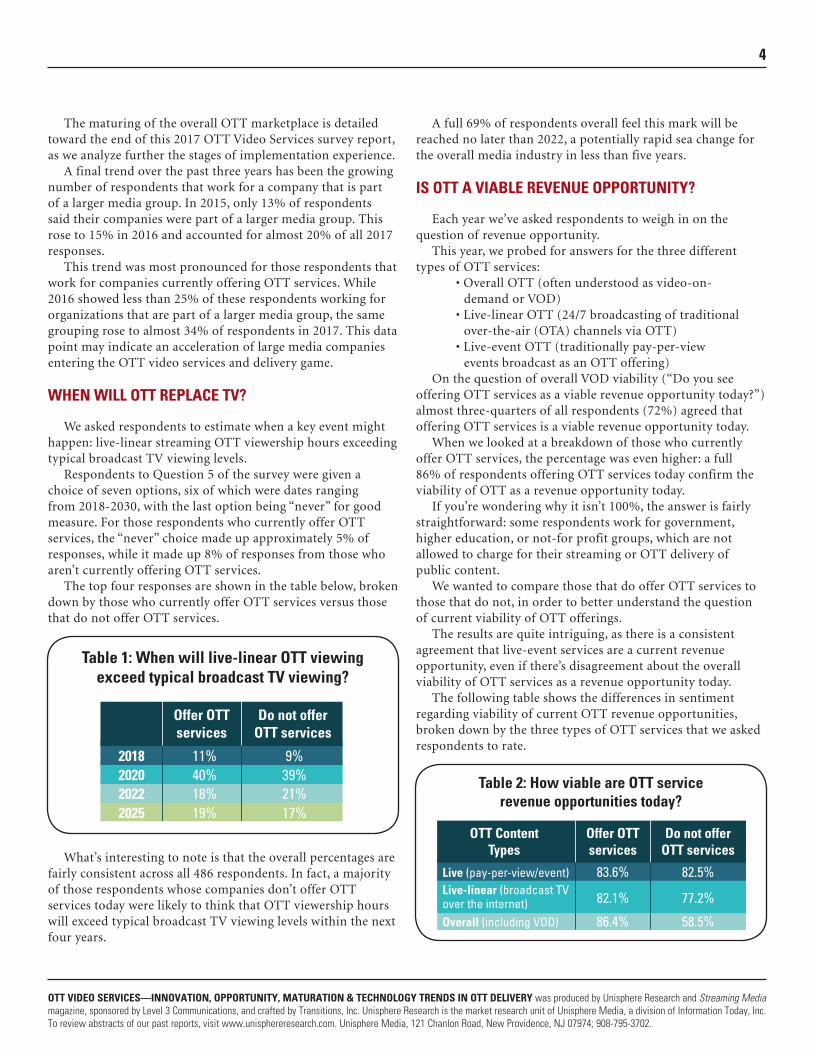
WHEN WILL OTT REPLACE TV?
We asked respondents to estimate when a key event might happen: live-linear streaming OTT viewership hours exceeding typical broadcast TV viewing levels.
Respondents to Question 5 of the survey were given a choice of seven options, six of which were dates ranging from 2018-2030, with the last option being “never” for good measure. For those respondents who currently offer OTT services, the “never” choice made up approximately 5% of responses, while it made up 8% of responses from those who aren’t currently offering OTT services.
The top four responses are shown in the table below, broken down by those who currently offer OTT services versus those that do not offer OTT services.
What’s interesting to note is that the overall percentages are fairly consistent across all 486 respondents. In fact, a majority of those respondents whose companies don’t offer OTT services today were likely to think that OTT viewership hours will exceed typical broadcast TV viewing levels within the next four years.
A full 69% of respondents overall feel this mark will be reached no later than 2022, a potentially rapid sea change for the overall media industry in less than five years.
IS OTT A VIABLE REVENUE OPPORTUNITY?
Each year we’ve asked respondents to weigh in on the question of revenue opportunity.
This year, we probed for answers for the three different types of OTT services:
• Overall OTT (often understood as video-on- demand or VOD)
• Live-linear OTT (24/7 broadcasting of traditional over-the-air (OTA) channels via OTT)
• Live-event OTT (traditionally pay-per-view events broadcast as an OTT offering)
On the question of overall VOD viability (“Do you see offering OTT services as a viable revenue opportunity today?”) almost three-quarters of all respondents (72%) agreed that offering OTT services is a viable revenue opportunity today.
When we looked at a breakdown of those who currently offer OTT services, the percentage was even higher: a full 86% of respondents offering OTT services today confirm the viability of OTT as a revenue opportunity today.
If you’re wondering why it isn’t 100%, the answer is fairly straightforward: some respondents work for government, higher education, or not-for profit groups, which are not allowed to charge for their streaming or OTT delivery of public content.
We wanted to compare those that do offer OTT services to those that do not, in order to better understand the question of current viability of OTT offerings.
The results are quite intriguing, as there is a consistent agreement that live-event services are a current revenue opportunity, even if there’s disagreement about the overall viability of OTT services as a revenue opportunity today.
The following table shows the differences in sentiment regarding viability of current OTT revenue opportunities, broken down by the three types of OTT services that we asked respondents to rate.
2018 11% 9%40% 39%18% 21%19% 17%
202020222025
Table 1: When will live-linear OTT viewing exceed typical broadcast TV viewing?
Offer OTTservices
Do not offerOTT services
Live (pay-per-view/event) 83.6% 82.5%
82.1% 77.2%
86.4% 58.5%
Live-linear (broadcast TVover the internet)Overall (including VOD)
Table 2: How viable are OTT servicerevenue opportunities today?
Offer OTTservices
OTT ContentTypes
Do not offerOTT services
5
OTT VIDEO SERVICES—INNOVATION, OPPORTUNITY, MATURATION & TECHNOLOGY TRENDS IN OTT DELIVERY was produced by Unisphere Research and Streaming Media magazine, sponsored by Level 3 Communications, and crafted by Transitions, Inc. Unisphere Research is the market research unit of Unisphere Media, a division of Information Today, Inc. To review abstracts of our past reports, visit www.unisphereresearch.com. Unisphere Media, 121 Chanlon Road, New Providence, NJ 07974; 908-795-3702.
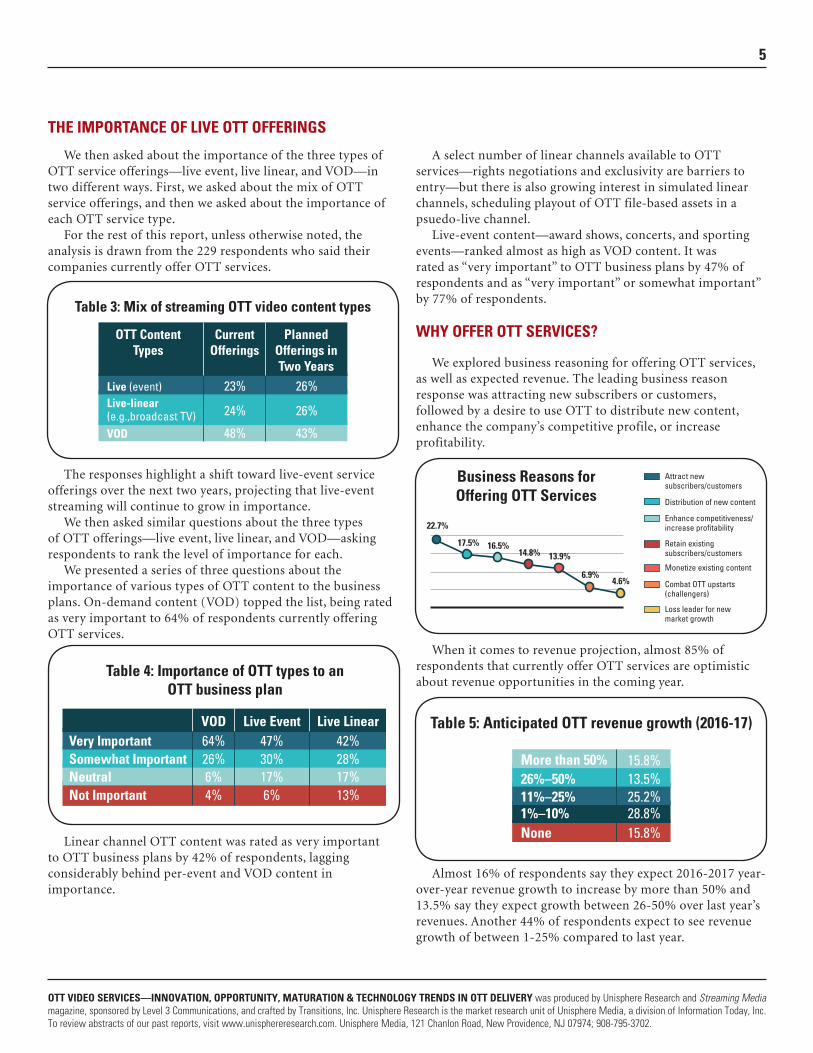
THE IMPORTANCE OF LIVE OTT OFFERINGS
We then asked about the importance of the three types of OTT service offerings—live event, live linear, and VOD—in two different ways. First, we asked about the mix of OTT service offerings, and then we asked about the importance of each OTT service type.
For the rest of this report, unless otherwise noted, the analysis is drawn from the 229 respondents who said their companies currently offer OTT services.
The responses highlight a shift toward live-event service offerings over the next two years, projecting that live-event streaming will continue to grow in importance.
We then asked similar questions about the three types of OTT offerings—live event, live linear, and VOD—asking respondents to rank the level of importance for each.
We presented a series of three questions about the importance of various types of OTT content to the business plans. On-demand content (VOD) topped the list, being rated as very important to 64% of respondents currently offering OTT services.
Linear channel OTT content was rated as very important to OTT business plans by 42% of respondents, lagging considerably behind per-event and VOD content in importance.
A select number of linear channels available to OTT services—rights negotiations and exclusivity are barriers to entry—but there is also growing interest in simulated linear channels, scheduling playout of OTT file-based assets in a psuedo-live channel.
Live-event content—award shows, concerts, and sporting events—ranked almost as high as VOD content. It was rated as “very important” to OTT business plans by 47% of respondents and as “very important” or somewhat important” by 77% of respondents.
WHY OFFER OTT SERVICES?
We explored business reasoning for offering OTT services, as well as expected revenue. The leading business reason response was attracting new subscribers or customers, followed by a desire to use OTT to distribute new content, enhance the company’s competitive profile, or increase profitability.
When it comes to revenue projection, almost 85% of respondents that currently offer OTT services are optimistic about revenue opportunities in the coming year.
Almost 16% of respondents say they expect 2016-2017 year-over-year revenue growth to increase by more than 50% and 13.5% say they expect growth between 26-50% over last year’s revenues. Another 44% of respondents expect to see revenue growth of between 1-25% compared to last year.
Table 3: Mix of streaming OTT video content types
Live (event) 23% 26%
24% 26%
48% 43%
Live-linear(e.g.,broadcast TV)VOD
CurrentOfferings
OTT ContentTypes
PlannedOfferings inTwo Years
Very Important 64% 47%26% 30%6% 17%4% 6%
42%28%17%13%
Somewhat ImportantNeutralNot Important
Table 4: Importance of OTT types to an OTT business plan
VOD Live Event Live Linear
Business Reasons forOffering OTT Services
Attract new subscribers/customers
Retain existing subscribers/customers
Monetize existing content
Combat OTT upstarts (challengers)
Loss leader for new market growth
Distribution of new content
Enhance competitiveness/increase profitability22.7%
17.5% 16.5%14.8% 13.9%
6.9%4.6%
Table 5: Anticipated OTT revenue growth (2016-17)
None 15.8%28.8%25.2%13.5%15.8%
1%–10%11%–25%26%–50%More than 50%
6
OTT VIDEO SERVICES—INNOVATION, OPPORTUNITY, MATURATION & TECHNOLOGY TRENDS IN OTT DELIVERY was produced by Unisphere Research and Streaming Media magazine, sponsored by Level 3 Communications, and crafted by Transitions, Inc. Unisphere Research is the market research unit of Unisphere Media, a division of Information Today, Inc. To review abstracts of our past reports, visit www.unisphereresearch.com. Unisphere Media, 121 Chanlon Road, New Providence, NJ 07974; 908-795-3702.
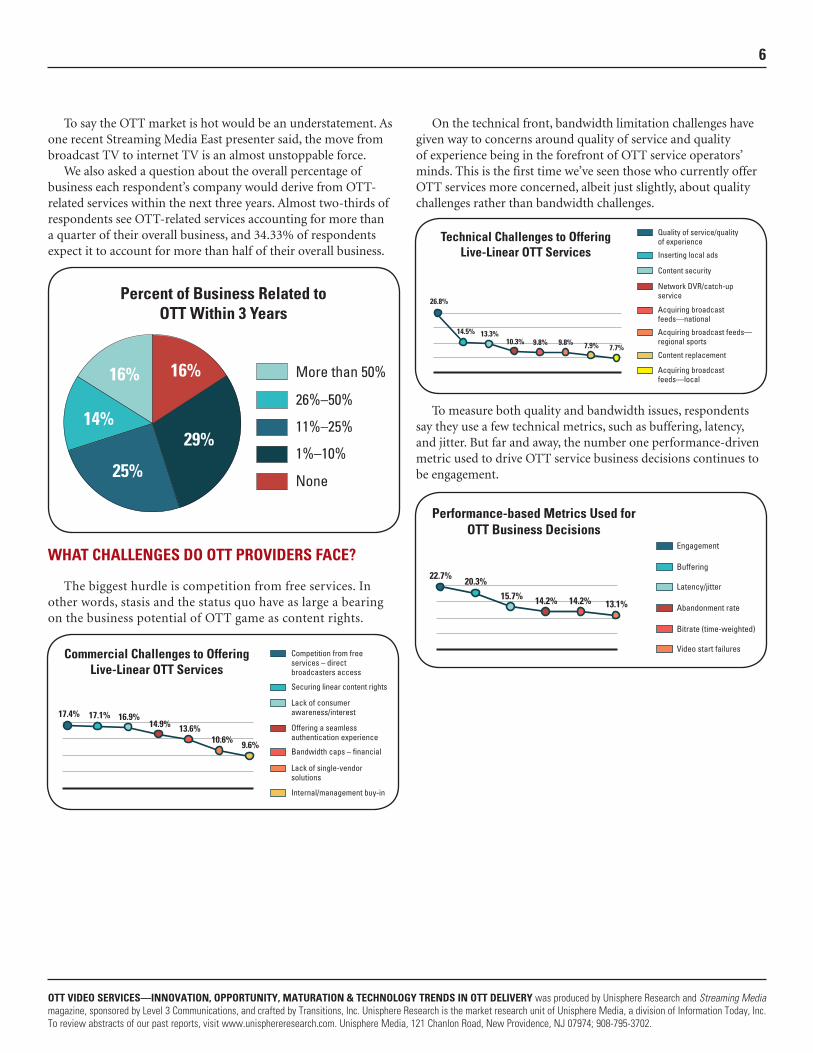
To say the OTT market is hot would be an understatement. As one recent Streaming Media East presenter said, the move from broadcast TV to internet TV is an almost unstoppable force.
We also asked a question about the overall percentage of business each respondent’s company would derive from OTT-related services within the next three years. Almost two-thirds of respondents see OTT-related services accounting for more than a quarter of their overall business, and 34.33% of respondents expect it to account for more than half of their overall business.
WHAT CHALLENGES DO OTT PROVIDERS FACE?
The biggest hurdle is competition from free services. In other words, stasis and the status quo have as large a bearing on the business potential of OTT game as content rights.
On the technical front, bandwidth limitation challenges have given way to concerns around quality of service and quality of experience being in the forefront of OTT service operators’ minds. This is the first time we’ve seen those who currently offer OTT services more concerned, albeit just slightly, about quality challenges rather than bandwidth challenges.
To measure both quality and bandwidth issues, respondents say they use a few technical metrics, such as buffering, latency, and jitter. But far and away, the number one performance-driven metric used to drive OTT service business decisions continues to be engagement.
29%
25%
16% 16%
14%
None
1%–10%
11%–25%
26%–50%
More than 50%
Percent of Business Related toOTT Within 3 Years
Commercial Challenges to Offering Live-Linear OTT Services
Competition from free services – direct broadcasters access
Offering a seamless authentication experience
Bandwidth caps – financial
Lack of single-vendor solutions
Internal/management buy-in
Securing linear content rights
Lack of consumer awareness/interest17.4% 17.1% 16.9%
14.9% 13.6%10.6% 9.6%
Technical Challenges to Offering Live-Linear OTT Services
Quality of service/qualityof experience
Network DVR/catch-up service
Acquiring broadcast feeds—national
Acquiring broadcast feeds—regional sports
Content replacement
Inserting local ads
Content security
Acquiring broadcast feeds—local
26.8%
14.5% 13.3%10.3% 9.8% 9.8% 7.9% 7.7%
Performance-based Metrics Used forOTT Business Decisions
Engagement
Abandonment rate
Bitrate (time-weighted)
Video start failures
Buffering
Latency/jitter22.7%
20.3%
15.7% 14.2% 14.2% 13.1%
7
OTT VIDEO SERVICES—INNOVATION, OPPORTUNITY, MATURATION & TECHNOLOGY TRENDS IN OTT DELIVERY was produced by Unisphere Research and Streaming Media magazine, sponsored by Level 3 Communications, and crafted by Transitions, Inc. Unisphere Research is the market research unit of Unisphere Media, a division of Information Today, Inc. To review abstracts of our past reports, visit www.unisphereresearch.com. Unisphere Media, 121 Chanlon Road, New Providence, NJ 07974; 908-795-3702.
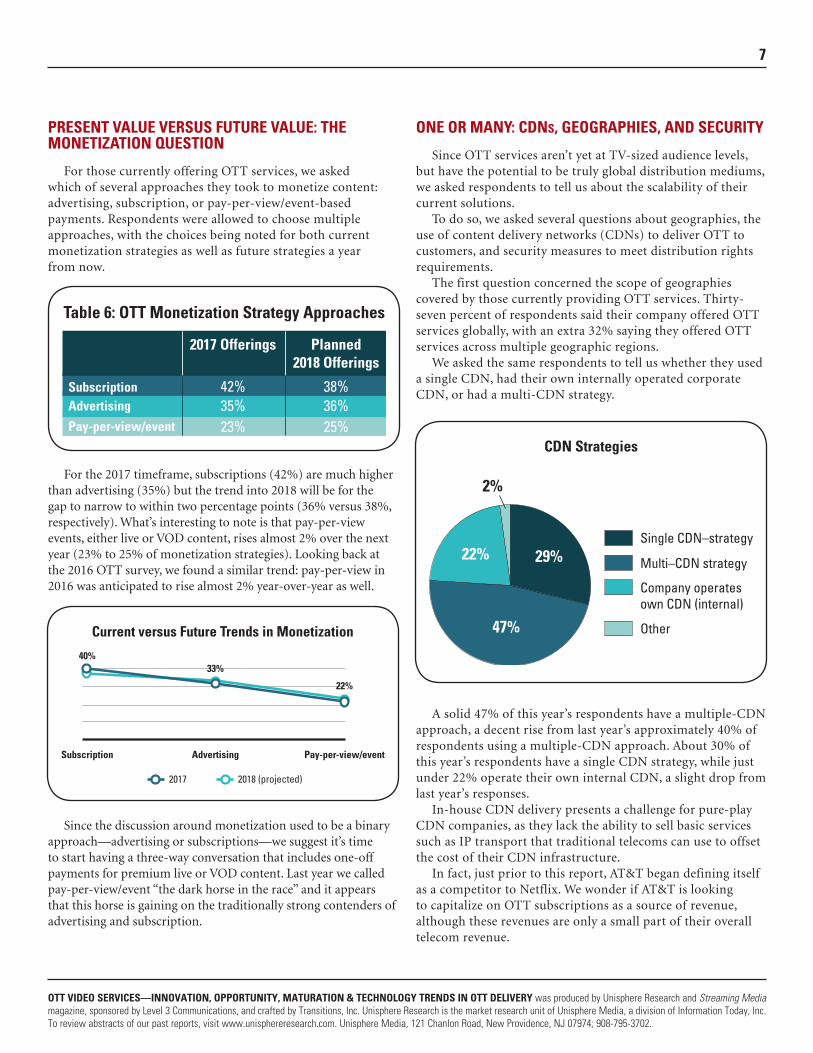
PRESENT VALUE VERSUS FUTURE VALUE: THE MONETIZATION QUESTION
For those currently offering OTT services, we asked which of several approaches they took to monetize content: advertising, subscription, or pay-per-view/event-based payments. Respondents were allowed to choose multiple approaches, with the choices being noted for both current monetization strategies as well as future strategies a year from now.
For the 2017 timeframe, subscriptions (42%) are much higher than advertising (35%) but the trend into 2018 will be for the gap to narrow to within two percentage points (36% versus 38%, respectively). What’s interesting to note is that pay-per-view events, either live or VOD content, rises almost 2% over the next year (23% to 25% of monetization strategies). Looking back at the 2016 OTT survey, we found a similar trend: pay-per-view in 2016 was anticipated to rise almost 2% year-over-year as well.
Since the discussion around monetization used to be a binary approach—advertising or subscriptions—we suggest it’s time to start having a three-way conversation that includes one-off payments for premium live or VOD content. Last year we called pay-per-view/event “the dark horse in the race” and it appears that this horse is gaining on the traditionally strong contenders of advertising and subscription.
ONE OR MANY: CDNs, GEOGRAPHIES, AND SECURITY
Since OTT services aren’t yet at TV-sized audience levels, but have the potential to be truly global distribution mediums, we asked respondents to tell us about the scalability of their current solutions.
To do so, we asked several questions about geographies, the use of content delivery networks (CDNs) to deliver OTT to customers, and security measures to meet distribution rights requirements.
The first question concerned the scope of geographies covered by those currently providing OTT services. Thirty-seven percent of respondents said their company offered OTT services globally, with an extra 32% saying they offered OTT services across multiple geographic regions.
We asked the same respondents to tell us whether they used a single CDN, had their own internally operated corporate CDN, or had a multi-CDN strategy.
A solid 47% of this year’s respondents have a multiple-CDN approach, a decent rise from last year’s approximately 40% of respondents using a multiple-CDN approach. About 30% of this year’s respondents have a single CDN strategy, while just under 22% operate their own internal CDN, a slight drop from last year’s responses.
In-house CDN delivery presents a challenge for pure-play CDN companies, as they lack the ability to sell basic services such as IP transport that traditional telecoms can use to offset the cost of their CDN infrastructure.
In fact, just prior to this report, AT&T began defining itself as a competitor to Netflix. We wonder if AT&T is looking to capitalize on OTT subscriptions as a source of revenue, although these revenues are only a small part of their overall telecom revenue.
Subscription 42% 38%35% 36%23% 25%
Advertising
Pay-per-view/event
Table 6: OTT Monetization Strategy Approaches
2017 Offerings Planned2018 Offerings
Current versus Future Trends in Monetization
40%
Subscription Advertising Pay-per-view/event
33%
22%
2018 (projected)2017
47%
22% 29%Single CDN–strategy
Multi–CDN strategy
Company operatesown CDN (internal)
Other
2%
CDN Strategies
8
OTT VIDEO SERVICES—INNOVATION, OPPORTUNITY, MATURATION & TECHNOLOGY TRENDS IN OTT DELIVERY was produced by Unisphere Research and Streaming Media magazine, sponsored by Level 3 Communications, and crafted by Transitions, Inc. Unisphere Research is the market research unit of Unisphere Media, a division of Information Today, Inc. To review abstracts of our past reports, visit www.unisphereresearch.com. Unisphere Media, 121 Chanlon Road, New Providence, NJ 07974; 908-795-3702.
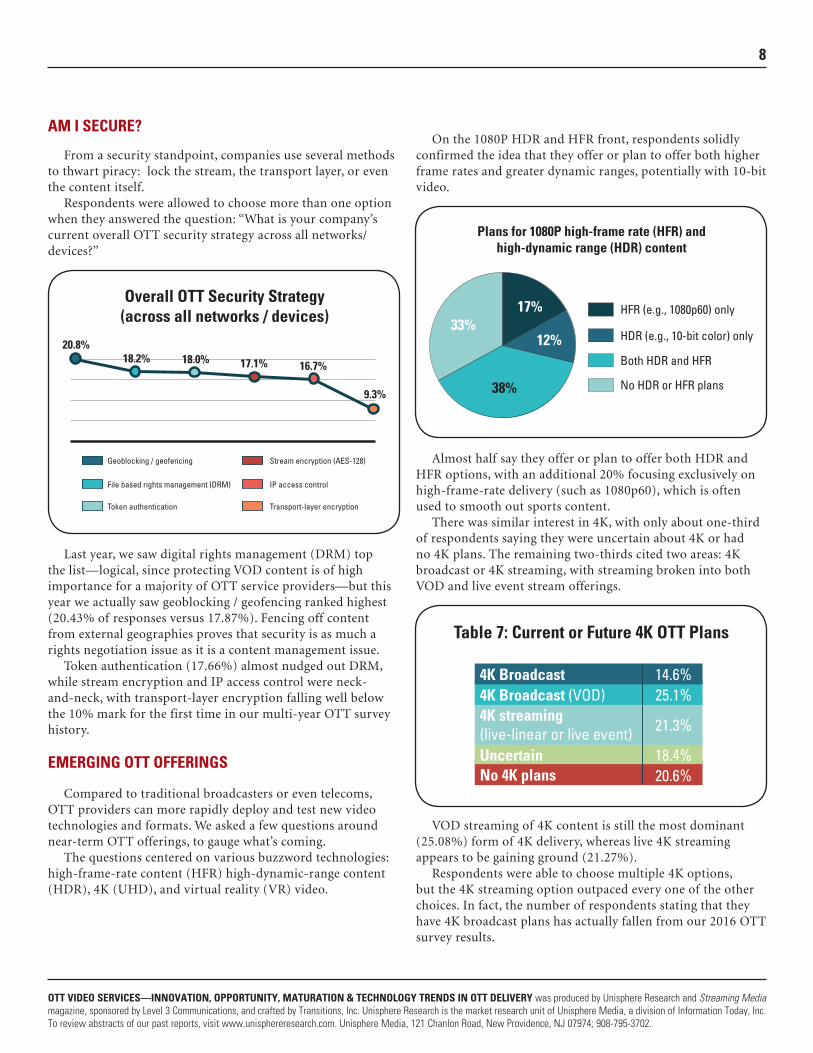
AM I SECURE?
From a security standpoint, companies use several methods to thwart piracy: lock the stream, the transport layer, or even the content itself.
Respondents were allowed to choose more than one option when they answered the question: “What is your company’s current overall OTT security strategy across all networks/devices?”
Last year, we saw digital rights management (DRM) top the list—logical, since protecting VOD content is of high importance for a majority of OTT service providers—but this year we actually saw geoblocking / geofencing ranked highest (20.43% of responses versus 17.87%). Fencing off content from external geographies proves that security is as much a rights negotiation issue as it is a content management issue.
Token authentication (17.66%) almost nudged out DRM, while stream encryption and IP access control were neck-and-neck, with transport-layer encryption falling well below the 10% mark for the first time in our multi-year OTT survey history.
EMERGING OTT OFFERINGS
Compared to traditional broadcasters or even telecoms, OTT providers can more rapidly deploy and test new video technologies and formats. We asked a few questions around near-term OTT offerings, to gauge what’s coming.
The questions centered on various buzzword technologies: high-frame-rate content (HFR) high-dynamic-range content (HDR), 4K (UHD), and virtual reality (VR) video.
On the 1080P HDR and HFR front, respondents solidly confirmed the idea that they offer or plan to offer both higher frame rates and greater dynamic ranges, potentially with 10-bit video.
Almost half say they offer or plan to offer both HDR and HFR options, with an additional 20% focusing exclusively on high-frame-rate delivery (such as 1080p60), which is often used to smooth out sports content.
There was similar interest in 4K, with only about one-third of respondents saying they were uncertain about 4K or had no 4K plans. The remaining two-thirds cited two areas: 4K broadcast or 4K streaming, with streaming broken into both VOD and live event stream offerings.
VOD streaming of 4K content is still the most dominant (25.08%) form of 4K delivery, whereas live 4K streaming appears to be gaining ground (21.27%).
Respondents were able to choose multiple 4K options, but the 4K streaming option outpaced every one of the other choices. In fact, the number of respondents stating that they have 4K broadcast plans has actually fallen from our 2016 OTT survey results.
Overall OTT Security Strategy (across all networks / devices)
Geoblocking / geofencing Stream encryption (AES-128)
IP access control
Transport-layer encryption
File based rights management (DRM)
Token authentication
20.8%18.2% 18.0% 17.1% 16.7%
9.3%
12%33%
17% HFR (e.g., 1080p60) only
HDR (e.g., 10-bit color) only
Both HDR and HFR
No HDR or HFR plans38%
Plans for 1080P high-frame rate (HFR) and high-dynamic range (HDR) content
4K Broadcast 14.6%25.1%
21.3%
18.4%20.6%
4K Broadcast (VOD)4K streaming(live-linear or live event)UncertainNo 4K plans
Table 7: Current or Future 4K OTT Plans
9
OTT VIDEO SERVICES—INNOVATION, OPPORTUNITY, MATURATION & TECHNOLOGY TRENDS IN OTT DELIVERY was produced by Unisphere Research and Streaming Media magazine, sponsored by Level 3 Communications, and crafted by Transitions, Inc. Unisphere Research is the market research unit of Unisphere Media, a division of Information Today, Inc. To review abstracts of our past reports, visit www.unisphereresearch.com. Unisphere Media, 121 Chanlon Road, New Providence, NJ 07974; 908-795-3702.
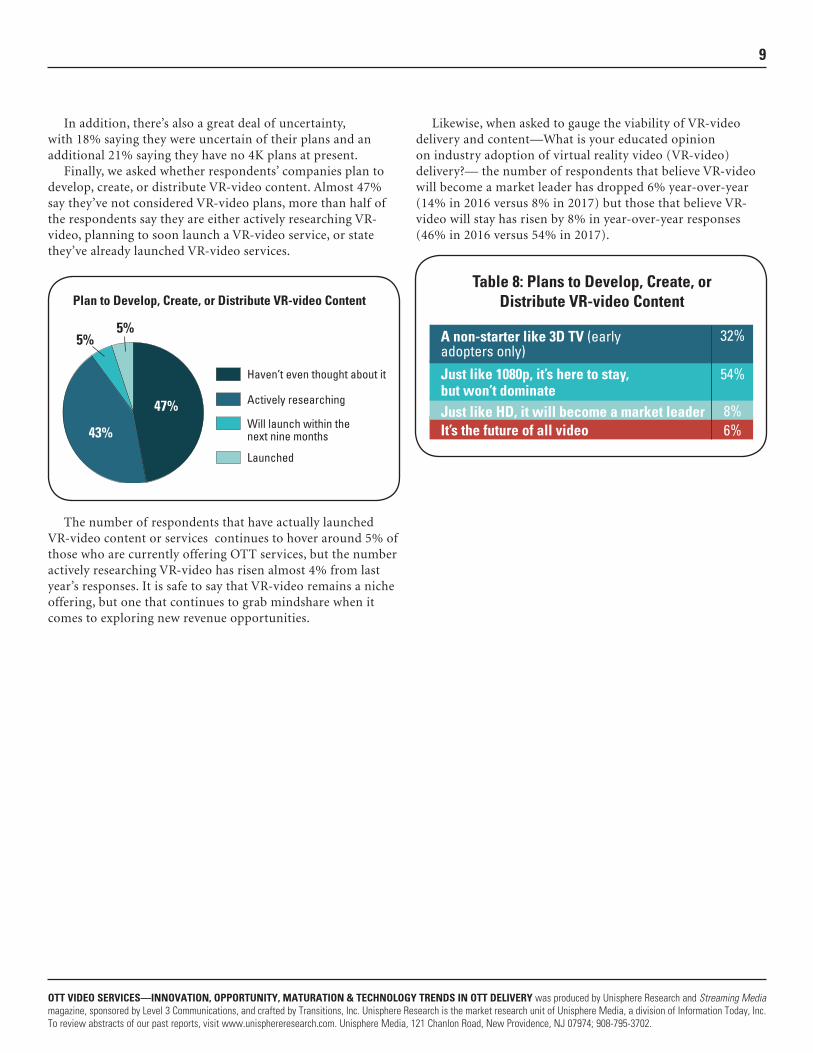
In addition, there’s also a great deal of uncertainty, with 18% saying they were uncertain of their plans and an additional 21% saying they have no 4K plans at present.
Finally, we asked whether respondents’ companies plan to develop, create, or distribute VR-video content. Almost 47% say they’ve not considered VR-video plans, more than half of the respondents say they are either actively researching VR-video, planning to soon launch a VR-video service, or state they’ve already launched VR-video services.
The number of respondents that have actually launched VR-video content or services continues to hover around 5% of those who are currently offering OTT services, but the number actively researching VR-video has risen almost 4% from last year’s responses. It is safe to say that VR-video remains a niche offering, but one that continues to grab mindshare when it comes to exploring new revenue opportunities.
Likewise, when asked to gauge the viability of VR-video delivery and content—What is your educated opinion on industry adoption of virtual reality video (VR-video) delivery?— the number of respondents that believe VR-video will become a market leader has dropped 6% year-over-year (14% in 2016 versus 8% in 2017) but those that believe VR-video will stay has risen by 8% in year-over-year responses (46% in 2016 versus 54% in 2017).
5%5%
47%
Haven’t even thought about it
Actively researching
Will launch within thenext nine months
Launched
43%
Plan to Develop, Create, or Distribute VR-video Content
A non-starter like 3D TV (earlyadopters only)
32%
54%
8%6%
Just like 1080p, it’s here to stay,but won’t dominateJust like HD, it will become a market leaderIt’s the future of all video
Table 8: Plans to Develop, Create, or Distribute VR-video Content
10
OTT VIDEO SERVICES—INNOVATION, OPPORTUNITY, MATURATION & TECHNOLOGY TRENDS IN OTT DELIVERY was produced by Unisphere Research and Streaming Media magazine, sponsored by Level 3 Communications, and crafted by Transitions, Inc. Unisphere Research is the market research unit of Unisphere Media, a division of Information Today, Inc. To review abstracts of our past reports, visit www.unisphereresearch.com. Unisphere Media, 121 Chanlon Road, New Providence, NJ 07974; 908-795-3702.
MARKET MATURATION
In the report’s introduction, we noted that market maturity is a trend that the overall OTT industry has entered over the past year.
Market maturation doesn’t mean that the market itself is mature, since there are still a number of opportunities for growth and innovation. But we can also now gauge a number of years of OTT growth and point to OTT companies that have been engaged in the consumer marketplace for an extended period of time, with subscriber numbers and market experience to bear out their leadership positions.
To properly assess market maturation for OTT video services, we analyzed several key response areas, from user measurements to live-event streaming. We found significant differences between those who are only planning OTT services and those that have already implemented OTT delivery.
To better assist in explaining just how the market is maturing, we will use the stages mentioned in the introduction. Companies in what we’ve labeled as Stage 1 (where they have OTT plans but have not yet implemented these plans) tend to have a very different outlook than those who are already offering services: Stage 2 (hybrid OTT, or OTT plus other distribution methods) or Stage 3 (pure-play OTT delivery).
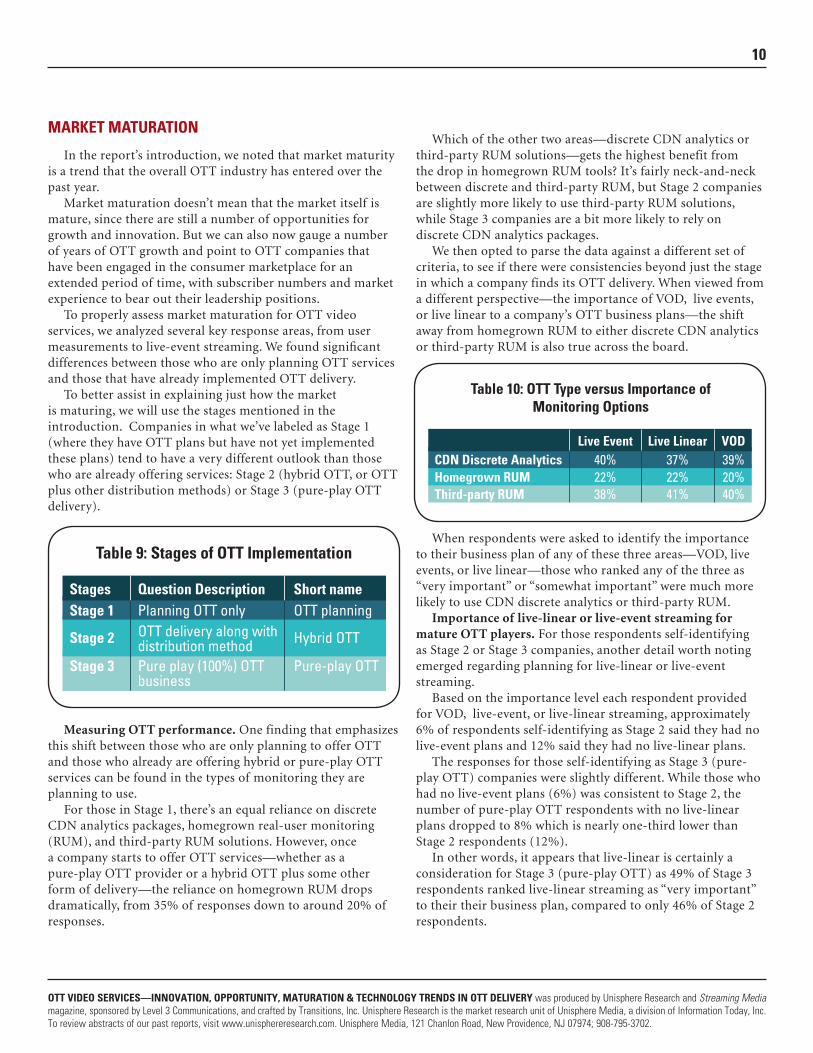
Measuring OTT performance. One finding that emphasizes this shift between those who are only planning to offer OTT and those who already are offering hybrid or pure-play OTT services can be found in the types of monitoring they are planning to use.
For those in Stage 1, there’s an equal reliance on discrete CDN analytics packages, homegrown real-user monitoring (RUM), and third-party RUM solutions. However, once a company starts to offer OTT services—whether as a pure-play OTT provider or a hybrid OTT plus some other form of delivery—the reliance on homegrown RUM drops dramatically, from 35% of responses down to around 20% of responses.
Which of the other two areas—discrete CDN analytics or third-party RUM solutions—gets the highest benefit from the drop in homegrown RUM tools? It’s fairly neck-and-neck between discrete and third-party RUM, but Stage 2 companies are slightly more likely to use third-party RUM solutions, while Stage 3 companies are a bit more likely to rely on discrete CDN analytics packages.
We then opted to parse the data against a different set of criteria, to see if there were consistencies beyond just the stage in which a company finds its OTT delivery. When viewed from a different perspective—the importance of VOD, live events, or live linear to a company’s OTT business plans—the shift away from homegrown RUM to either discrete CDN analytics or third-party RUM is also true across the board.
When respondents were asked to identify the importance to their business plan of any of these three areas—VOD, live events, or live linear—those who ranked any of the three as “very important” or “somewhat important” were much more likely to use CDN discrete analytics or third-party RUM.
Importance of live-linear or live-event streaming for mature OTT players. For those respondents self-identifying as Stage 2 or Stage 3 companies, another detail worth noting emerged regarding planning for live-linear or live-event streaming.
Based on the importance level each respondent provided for VOD, live-event, or live-linear streaming, approximately 6% of respondents self-identifying as Stage 2 said they had no live-event plans and 12% said they had no live-linear plans.
The responses for those self-identifying as Stage 3 (pure-play OTT) companies were slightly different. While those who had no live-event plans (6%) was consistent to Stage 2, the number of pure-play OTT respondents with no live-linear plans dropped to 8% which is nearly one-third lower than Stage 2 respondents (12%).
In other words, it appears that live-linear is certainly a consideration for Stage 3 (pure-play OTT) as 49% of Stage 3 respondents ranked live-linear streaming as “very important” to their their business plan, compared to only 46% of Stage 2 respondents.
CDN Discrete Analytics 39%40%20%22%40%38%
37%22%41%
Homegrown RUMThird-party RUM
Table 10: OTT Type versus Importance of Monitoring Options
VODLive Event Live Linear
OTT planning
Hybrid OTT
Planning OTT onlyOTT delivery along withdistribution method
Stage 1
Stage 2
Pure-play OTTPure play (100%) OTT business
Stage 3
Table 9: Stages of OTT Implementation
Short nameQuestion DescriptionStages
11
OTT VIDEO SERVICES—INNOVATION, OPPORTUNITY, MATURATION & TECHNOLOGY TRENDS IN OTT DELIVERY was produced by Unisphere Research and Streaming Media magazine, sponsored by Level 3 Communications, and crafted by Transitions, Inc. Unisphere Research is the market research unit of Unisphere Media, a division of Information Today, Inc. To review abstracts of our past reports, visit www.unisphereresearch.com. Unisphere Media, 121 Chanlon Road, New Providence, NJ 07974; 908-795-3702.
Both of these stand in marked contrast to the Stage 1 (OTT plans only) respondents, as only 10% of Stage 1 respondents consider live-linear streaming as “very important” to their business plans.
Emerging OTT offerings. We also broke down 4K plans against Stages 1, 2, and 3, as a way to gauge the impact of market maturity on planning for emerging OTT offerings.
Several anecdotal comments noted that 1080p with high-frame-rate (HFR) or high-dynamic range (HDR) was of more interest than 4K, and our analysis by company stage appears to confirm this.
In our 2016 survey, we noted the Stage 2 companies (OTT + another form of delivery) had a higher likelihood of 4K broadcast compared to Stage 1 (OTT plans only) and Stage 3 (pure play OTT providers).
It also appeared, in the 2016 report, that VOD had a much higher likelihood than live-event or live-linear broadcast.
In 2017, though, it appears that overall 4K broadcast has dropped (65% versus 58%) and 4K live-event / live-linear has stayed constant. This key bellwether should be explored further, because a potential drop-off in 4K broadcast plans could mean a potential win for 4K OTT streaming.
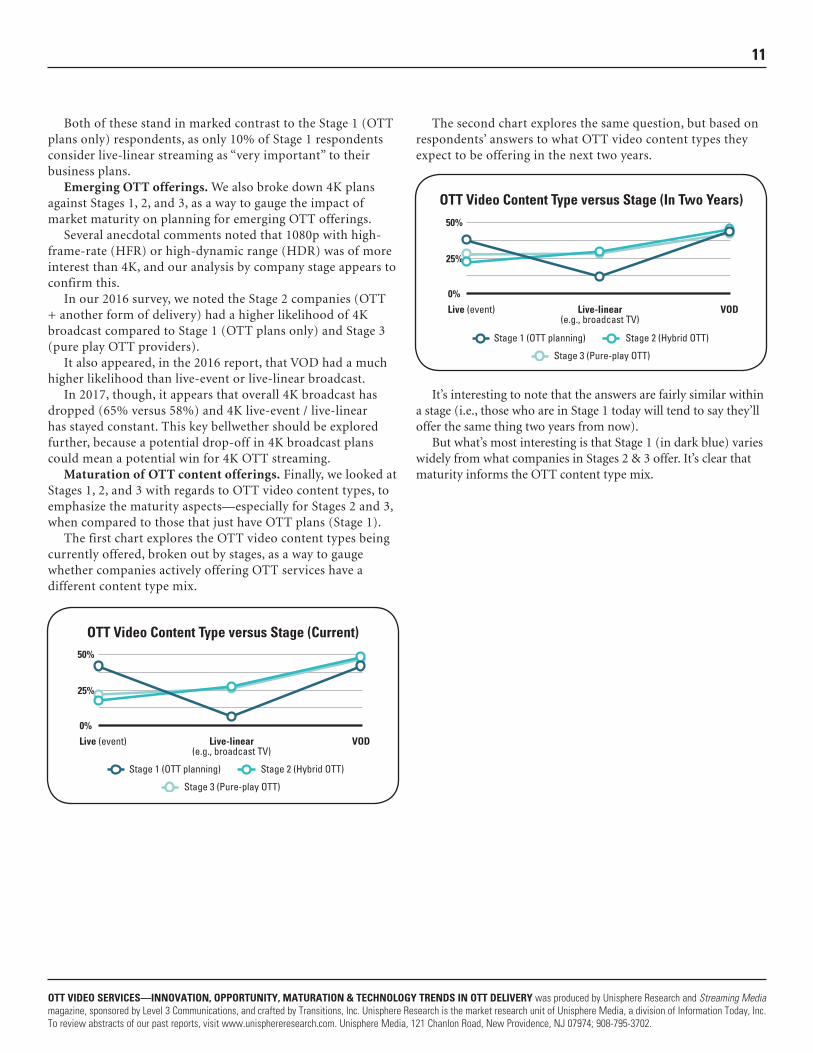
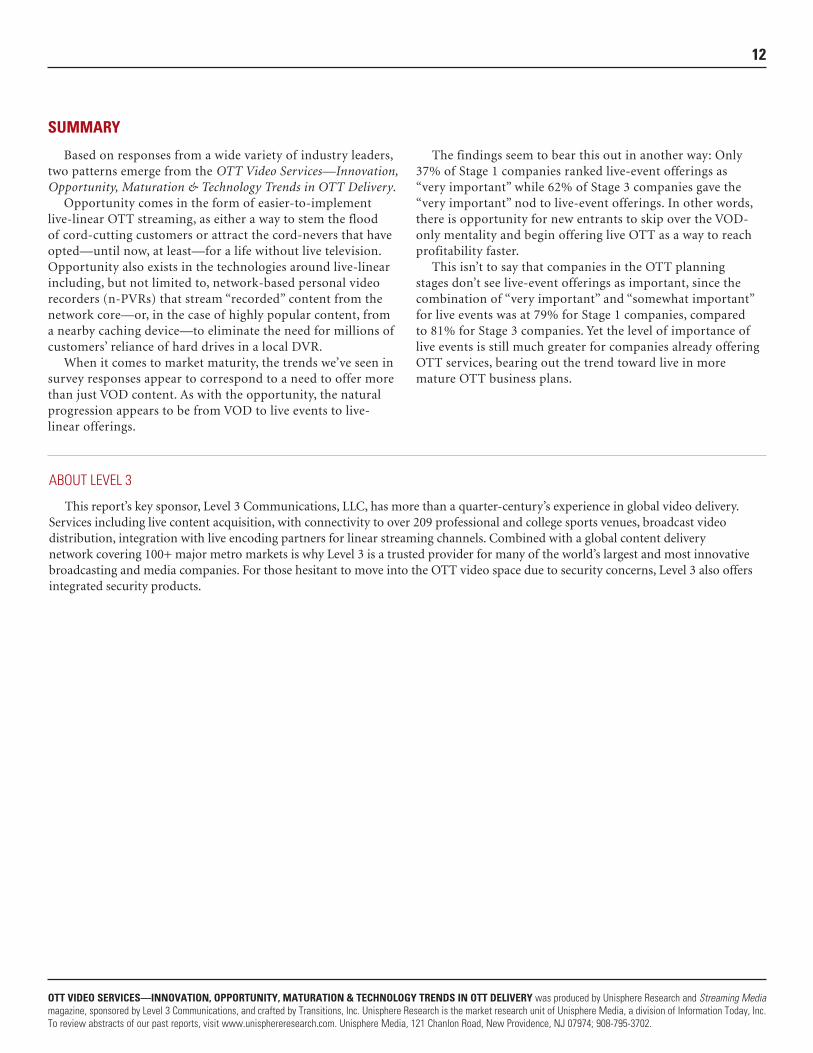
Maturation of OTT content offerings. Finally, we looked at Stages 1, 2, and 3 with regards to OTT video content types, to emphasize the maturity aspects—especially for Stages 2 and 3, when compared to those that just have OTT plans (Stage 1).
The first chart explores the OTT video content types being currently offered, broken out by stages, as a way to gauge whether companies actively offering OTT services have a different content type mix.
The second chart explores the same question, but based on respondents’ answers to what OTT video content types they expect to be offering in the next two years.
It’s interesting to note that the answers are fairly similar within a stage (i.e., those who are in Stage 1 today will tend to say they’ll offer the same thing two years from now).
But what’s most interesting is that Stage 1 (in dark blue) varies widely from what companies in Stages 2 & 3 offer. It’s clear that maturity informs the OTT content type mix.
50%
25%
0%
OTT Video Content Type versus Stage (Current)
Live (event) Live-linear(e.g., broadcast TV)
VOD
Stage 2 (Hybrid OTT)
Stage 3 (Pure-play OTT)
Stage 1 (OTT planning)
50%
25%
0%
OTT Video Content Type versus Stage (In Two Years)
Live (event) Live-linear(e.g., broadcast TV)
VOD
Stage 2 (Hybrid OTT)
Stage 3 (Pure-play OTT)
Stage 1 (OTT planning)
12
OTT VIDEO SERVICES—INNOVATION, OPPORTUNITY, MATURATION & TECHNOLOGY TRENDS IN OTT DELIVERY was produced by Unisphere Research and Streaming Media magazine, sponsored by Level 3 Communications, and crafted by Transitions, Inc. Unisphere Research is the market research unit of Unisphere Media, a division of Information Today, Inc. To review abstracts of our past reports, visit www.unisphereresearch.com. Unisphere Media, 121 Chanlon Road, New Providence, NJ 07974; 908-795-3702.
SUMMARY
Based on responses from a wide variety of industry leaders, two patterns emerge from the OTT Video Services—Innovation, Opportunity, Maturation & Technology Trends in OTT Delivery.
Opportunity comes in the form of easier-to-implement live-linear OTT streaming, as either a way to stem the flood of cord-cutting customers or attract the cord-nevers that have opted—until now, at least—for a life without live television. Opportunity also exists in the technologies around live-linear including, but not limited to, network-based personal video recorders (n-PVRs) that stream “recorded” content from the network core—or, in the case of highly popular content, from a nearby caching device—to eliminate the need for millions of customers’ reliance of hard drives in a local DVR.
When it comes to market maturity, the trends we’ve seen in survey responses appear to correspond to a need to offer more than just VOD content. As with the opportunity, the natural progression appears to be from VOD to live events to live-linear offerings.
The findings seem to bear this out in another way: Only 37% of Stage 1 companies ranked live-event offerings as “very important” while 62% of Stage 3 companies gave the “very important” nod to live-event offerings. In other words, there is opportunity for new entrants to skip over the VOD-only mentality and begin offering live OTT as a way to reach profitability faster.
This isn’t to say that companies in the OTT planning stages don’t see live-event offerings as important, since the combination of “very important” and “somewhat important” for live events was at 79% for Stage 1 companies, compared to 81% for Stage 3 companies. Yet the level of importance of live events is still much greater for companies already offering OTT services, bearing out the trend toward live in more mature OTT business plans.
ABOUT LEVEL 3
This report’s key sponsor, Level 3 Communications, LLC, has more than a quarter-century’s experience in global video delivery. Services including live content acquisition, with connectivity to over 209 professional and college sports venues, broadcast video distribution, integration with live encoding partners for linear streaming channels. Combined with a global content delivery network covering 100+ major metro markets is why Level 3 is a trusted provider for many of the world’s largest and most innovative broadcasting and media companies. For those hesitant to move into the OTT video space due to security concerns, Level 3 also offers integrated security products.