p 1»»»»««»« i mi iwiin^^waiia in - dtic.mil · for modeled non-linearity levels ranging...
TRANSCRIPT

w«"P""""ww»R""^p""~»»M»»^>p»»in»«pi"1»»»""»««»« i MI iwiin^^waiia i ■■■i in
AD-7f0 623
THEORETICAL DEVELOPMENT FOR LOW DISTORTION BROADBANDING OF SEISMIC DATA
Lewis J. Pinson, et al
ENSCO, Incorporated
Prepared for:
Air Force Office of Scientific Research
1 June 1973
DISTRIBUTED BY:
National Technical Information Service U. S. DEPARTMENT OF COMMERCE 5285 Port Royal Road, Springfield Va. 22151
ssszss ■ M If—II
wm^mi^*mtmmmm> >
AFOSR TR - ■? 3 - l o 7 T
00
CO CM <£)
Q
■m ^m
«III ^»ttWlr riiltV.,s
D D'QV
[i13
o
I
•db<
NATIONAL TECHNICAL INFORMATION SERVICE
EIMSCO.IIMC. 5408A Port Royal Road
Springfield, Virginia 22151
Phone: (703) 569-9000
ä i
Jgjjtt "'''^"'''^Wk^

"«^ i,^m^»«««"W""","™»wwi"" ' ii nil»!! ■ —nnnnwimnaMP^npiiimvnOT^OTiji ■» i i nil
THEORETICAL DEVELOPMENT
FOR LOW DISTORTION BROADBANDING
OF SEISMIC DATA-INTERIM
TECHNICAL REPORT
AFOSR CONTRACT NO: F44620-73-C-0Ü64
TR-1002-01
June 19 73
Sponsored by:
Advanced Research Projects Agency rfClUI ARPA Order No.: 2 50 6
Prepared by:
BNSCO, INC. 8001 Forbes Place
Springfield, Ya. 22151
A I h Technicp1 Pi ector
birector, iss Division
y:Q./::, ̂ c3 — Principal Investigator
i—I —• ..^~*—*mamti»*~

rmrmmufm'^fmmmir'^m mr*~m mmmmmtm***!
•
it ■! ( i... .,,1,
DOCUMENT CONTROL DATA H Ä. Ü '' "' ''"' '' '< ■■< fi'h' >.■ -iv i „i. ,,..., „..i „..u- j ,.,, ,,, ,.,„,,..(,.>.■■,>■ .,,.;i ,,,,..,, i. ,,,.. -ni-.t,
' ""'i1;;*'.':"■ •'"■"•"-i -■■■'■'■■■'> ~ nr,.,,^,.,,,,,,„.,,,l.,,,,,,.,,„14 l;N.S(,(), Inc. 8001 Forbes ri. Springfield, Va. 2215]
i Hi t'O** T T I T L »
UNCLASS] I'll:!) !h r. noi;i'
Theoretical Development for Low Distortion Broadbandiflg oi" Seismic Data - Interim Report
4 otscFoF-rivLNOTS (TypF ol rep.jri and j/ic lu»trm time-.)
Scien 1 Ific --- Interim fl April 1(J73 to 1 June 1973) kU fHOfftSI (i tr\t HMM, miJdlv 111111,1!, last numf)
Lewis J. Pins on Paul V.', Broome
ME*JܻT CATE
1 Juno 197. • a. C O'i 1 U AC : OH CHANT '.„
l:44620-73-C-0Ü64 fc. PHOJEC T NO
AO 2506
62701E
7«. TOTAL NO OF PA&tb 7b. NO Of" RCFI
4 Va. ORIGINATOH'S K E f-O H T NÜMßLHISI
TR-1002-Ü1
Öfc OTHtH HrPvir(T UOISi (Any utht r numbers that n.ay tc «& .S/^K / f/i^s rvport)
MfUSR- TR- 73» io77 10 CI5 1 r<l uu T ION ÜIATKMtNT
Approved for public release; distribution unlimited
11 iU t'F'L LM t f. T A R V NOTES
Tech, Other
13. AMSThACT
A "sof of exa scismi are de LP and
12. SPONbOHiNG MIUllAWY ACTIVITY
AF Office of Scientific ResearcV 1400 Wilson Blvd. NPG Arlington, Va. 12209
t" zero-memory non-linearity is modeled to demonstrate effects mple non-linearities on multiple event signals and micro- c noise. Non-linearities of the order of 1 percent and less monstrated to increase noise levels significantly in certain SP bands.
DD,Fr,.1473 UNCLASS1FIED // Si imlv l.'l.issi(i( .ilu'll
turn iimitii^iftMWli |MMH

m9m^^*^^^mmmmmmw'^^^'*r^m,m^*r^mm*m^mM * "m**"' """*'" i mumim III i i ^
Ul'ji ddV^ltlA. I IP !■>' iint v ' Li'.".!! i( ,.11-.11
K r v woNOI
Non-Li nes rity, Sesi mo met er, Mi crosoisnii( Noise, Short Period, Long Period, Broadband
l I N »- A I III
unit
1
UNCLASSIFIED m Serunly Classificiili.m
4M atLnäMmm*

ii" " -»"«•p^pmw^rwi»»" I IIWIJ I l.l'IP"! ■■ ■■ l.l-H.M ■ «*l ■ Ml «IHK»! | ■■
ARPA Order No:
Progran Code:
Cont ractor:
Effective Date ol Contract
Contract Expiration Date:
Amount of Contract :
Contract Number:
Principal Investigators:
Program Manager:
Title:
Sponsored by:
2506
5F10
ENSCO, INC.
1 April 19 73
31 December 19 73
$54,712
P44620-73-C-0064
Paul K. Broome 713-569-9000 Lewis J. Pinson 713-569-9000
William Best 202-694-5456
Theoretical Development for Low Distortion Proadbanding of Seismic Data
Advanced Research Projects Agency ARPA Order No. 2 506
11/
MMMtMM ■MM^UjMBfeM.'MHMaa» .^ - - ■ -■
«'■,11 "" ' ,, ■w»^^^»^w^»»>p»7™>J "■" " "HI""«
TABU; or CONTENTS
TECHNICAL REPORT SUMMARY
mmnwir^wmmmmm
Page
1.0 INTRODUCTION' 1-1
.0 TECHNICAL DISCUSSION
2.1 The Problem
2.2 Sine Kavc Input?
2-1
2-1
2-6
2.3 Non-Linear Lty Effccrs on Microseisr.n c Noise 2-8
3.0 CONCLUSION AND COMMENTS 3-1
4.0 REFERENCES 4-1
n
i'
•* - ll>t——inn i ■ÜTMMMh—m in «inlrfMiiMBM » -■ ——^ .

■— im» iipa i I>I -^
~
TECHNICAL REPORT SUMMARY
The goal of this research effort is to perform an
investigation of the effects of seismometer non-linearities
on received signals and to improve understanding of the
effects of distortion, caused by seismometers, on later
data processing.
Seismometers are designed to convert earth motion into
electrical signals. In an ideal seismometer, this conversion
would take place without distortion. In an actual seismo-
meter, one must contend with several types of distortion.
These distortions affect the type and potential success of
all later processing steps. Without proper consideration
for the errors committed by the transducer, one can, in fact,
come to false conclusions regarding the characteristics of
the original signals.
Non-linearities in present seismometers make it difficult
to utilize spectral discriminants to solve the "interfering
event" problem. The potential advantage of increased bandwidth
for improved spectral discrimination is eliminated for non-
linear instruments because the problem uith non-linearities
increases as the bandwidth of the instrument is increased.
A "soft" zero-memory non-linearity is described in
Section 2.1 and used to model the non linear effects of seismo-
meter:.. Results of application of this non-'incarity model to
the signal (see 2.2) and noise spectra (sec 2.3) demonstrate
iMkatMlBMi -■Mi' li W dh .mJHjAL^imMJa^/tm

"■ ' ■" »^^"•^n^^twmmt ~ ■■ ■ ' '"i ' ^'"
D II
that non-1incaritics of the order of It can significantly increase
noise levels in frequency bands of interest. Also, spurious
cross-product terms are generated which could easily be mistaken
for low-level events.
For modeled non-linearity levels ranging from 0.1°. to 31,
when applied to microseismic noise spectra, resulted in peak
spectral noise increases ranging from 1 to 33 db for displacement
noise and from 1 to 21 db for acceleration noise. Noise levels
in selected long-period and short-period bands increased by as
much as 30 db for the 30o distortion level. The example non-
linearities are demonstrated to cause significant increases in
noise levels for non-linearities of the order of l-o and less.
The severity of the problem depends of course on the exact
non-linearity levels to be expected in actual seismometers.
Efforts to date have indicated that an expected upper
bound on non-1inearilies is II; however, very little information
concerning the definition of this distortion level is available.
There is a noticeable lack of reliable test data to verify
expected le\ols of non-linearities.
Definition and implementation of non-linearity test pro-
cedures are required before reliable bounds can be placed on
seismometer non-linearity levels. A preliminary representation
is given of desirable features of su:h test procedures.
nil ^m I—MI ■-^—^-
J ■--■ ■ ■■ - ■ ■ ■

^■^»■IWifWP^mWPPTWIPP^ «■»■ ■ I<I 11 'i m iwtmmmmmm^m ^PPPWW^WP» i> ■ mm
1.0 INTRODUCTION
The goal of this research effort is to perform an
investigation of the effects of seismometer non-linearities
on received signals and to improve the understanding of
the effects of distortion, caused by seismometers, on later
data processing. This work will also lead to improved methods
of combining data from co-lojated seismometers so as to reduce
the effects of these distortions. The availability of modern
data processing equipment makes it possible to utilize new
approaches to seismometer design and utilization so that
distortion effects are minimized.
Non-linearities in present seismometers make it difficult
to utilize spectral discriminats to solve the "interfering
event" problem. The potential advantage of increased band-
width for improved spectral discrimination is eliminated for
non-linear instruments because the problem with non-linearities
increases as the bandwidth of the instrument is increased.
Although it has been generally accepted that analog
recording has been a limiting factor in both the broadband
and the interfering-event problems, this is most likely not
the case. The analog recorder can faithfully record and
play back, without need for switching, over a dynamic range
of nearly 100 db. The background noise level rises with the
signal level, however, so that only about a 30 to 40 db sub-
range can be Utilized in the broadband case. Even with this
1-1
.MMHMM^i ■ ■■- ■ i itritm «MM
i 'mi i ».ip i i i ^^^npnraiiiaiii.iiji mpi ' ■,""1 "■ ' l""
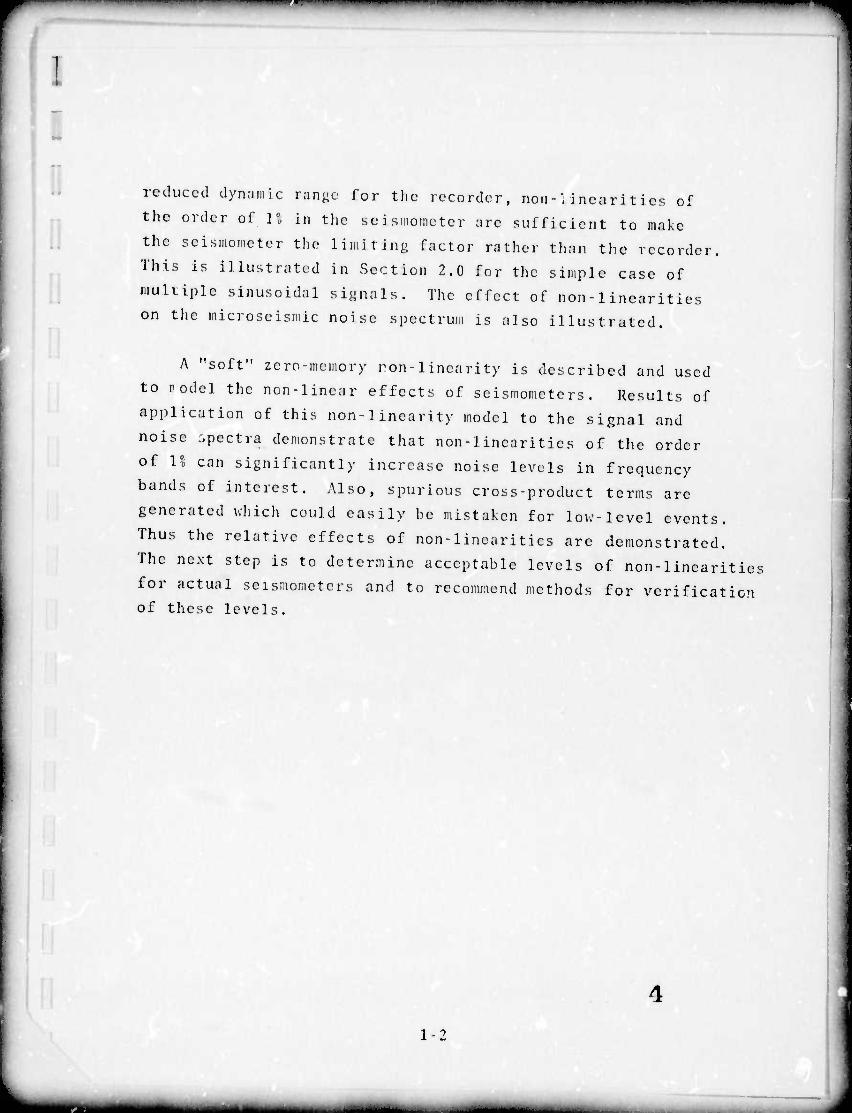
reduced dynamic range for the recorder, Ron-linearities of
the order of n in the seismometer are sufficient, to make
the seismometer the limiting factor rather than the recorder.
This is illustrated in Section 2.0 for the simple case of
multiple sinusoidal signals. The effect of non-linearities
on the microseismic noise spectrum is also illustrated.
A "soft" zero-memory ron-linearity is described and used
to rodel the non-linear effects of seismometers. Results of
application of this non-linearity model to the signal and
noise spectra demonstrate that non-linearities of the order
of It can significantly increase noise levels in frequency
bands of interest. Also, spurious cross-product terms are
generated which could easily be mistaken for low-level events.
Thus the relative effects of non-linearities are demonstrated.
The next step is to determine acceptable levels of non-linearities
for actual seismometers and to recommend methods for verification of these levels.
1-2
attta^uuMMüM^driai mammtmmm

HI IMI^MWWI ■ I .■•».HI "f" iiiiiijiwiii i**m^mmmmmmmm*'^^^*imm*TWi ■ •i ■ i i " n 2.0 TECHNICAL DISCUSSION
2. 1 The Prob lorn
Scismoncters arc designed to convert earth motion into
electrical signals. In an ideal seismometer, this conversion
would take place without distortion. In an actual seismometer,
one must contend with several types of distortion. These
distortions affect the type and potential success of all later
processing steps. Without proper consideration for the errors
COmnitted by the transducer, one can, in fact, come to false
conclusions regarding the characteristics of the original
signals.
The characteristics of most transducers are similar. The
primary design specifications which influence signal distortion
are :
• Banduidth - 'Ihe effect of instrument bandwidth
is to distort the signal by emphasizing certain
frequency components at the expense of others.
• Dynamic Range - The dynamic rang? is the difference
between the instrument's self-noise and the maximum
signal that can be accepted without exceeding a set
level of amplitude distortion. An instrument with
inadequate dynamic range will either distort strong
signals by clipping them, or mask weak ones with
additive noise.
2-1
■»■mi ^^uattK» .--. ^—..-.-i....-

^WIPHPI^P*" I I nil —-^^»WBIPff« 11 ■■ """^^aiw^ipk»^«" ■ i i i IIHII mmmm^^ " ■pmnni
• Linearity - The effect of non-linearities is to
distort the relative amplitude of signals. The
effect of these non-linearities on signals is not
uniquely revcrsable by later data processing.
Dynamic range can be improved by digitizing the output
data at the seismometer. This eliminates noise sources
extraneous to the seismometer itself. However, this does
not solve the non-linearity problem. In fact, it will be
shown that improved dynamic range can make the non-linearity
be the limiting source of distortion. Thus, it is desired
not only to improve dynamic range but to reduce the effects
of non-linearities also.
Non-linearities are a result of such factors as imperfect
springs which cause a non-linear compliance, hysteresis ei-
st iction effects which influence damping, and the accuracy of
the electromagnetic (u other) pickup. It is theoretically
possible to reduce these to almost any desired limit if cost
and size are not limiting factors. However, some non-linearity
will always exist in seismometers, and should be included in
a modeling approach to minimizing distortion in seismic signals.
The effects of non-linearities can be seen in either the
time domain or the frequency domain. If the input is a com-
plicated function of time, it can be considered to be equivalent
to a Fourier series with many terms. The effect of the non-
linearities on the output is to create energy at all sum-and-
difference frequencies which existed at the input.
s ?- ?
—^^sa-a-aa* mm—*

■■■^WlPB^PWrWP^R^B»»^»"^ ■ '-"■■ ■ in i ■n^wm^ar
by: Consider, for example, tlic non-lincur response represented
y = k(x-ax0) (1)
where
and
X
k
y
a
the input time function
1
the output time function
the distortion for an input of v ■ 1
The response curve represented by (1) is shown in Figure 1.
In order to relate the distortion to real signals, the response
curve is normalized to the input rms value. Thus, a specified
distortion level of "a" means that y = x-a when x is at its
rms value. The distortion level increases for x greater than
its rms value and decrease? to zero as x goes to zero.
Because of the nature of the non-linearity model, the
transfer function goes to zero slope, then negative, as the
cubic term predominates. As a safeguard against the negative
slope, a clipping level is defined where the slope goes to
zero. This level is a function of the value of "a" and is
given in Figure 1 for example values of "a" from 0.11 to l,co.
The expected non-linear response and its point of action
aie not well understood. Figure 2a illustrates two examples
of how the non-linearity might react with earth motion. In
the top port of the figure the non-linearity acts on earth
acceleration. In the bottom part of the figure the non-linearity
acts on earth displacement. Oilier questions concerning the
2-7,
tmm t^^mmtmm — ■ ■ - ■ - -■■

mmw*^m**F^*mmtmnmmiBr'**mwT*m IIMJ,IIIIII«IIII L ii MWf^t^^mmt i m^Hp<mipi|iiOTW«im*wOTi«mi«wMP ^P
xrms
0.001
0.00 3
0.01
0.0 3
X 18.25
10.54
5.78
3.33
Figure 1: Symmetric, Zero-Memory Non-Linenrity
8 2-4
wmmm mu^mmmt mm*tmii mi - -

."-»» «■»■pp^"^ "mi wm^mm^mmmrwmimfmw^'fmmmmnwwm'i
liARTII MOTION
ACCELERATION RESPONSE
-t*- NOX -
LINEARITY
DISPLACEMENT RLSPOXS]
POST-
FILTERING
a) NON-LINEARITY POINT OF ACTION
MICROSEISMIC
NOISE
b) ANALYSIS MODEL
Figure 2: Non-Linearity Analysis
2-S
MMMiaHH^M-IBMMM^MMBMH ^^^-.-J-»-W.-^MM^^—-.^—J-..

I""' •■'•■■- " """"• ■• " ■■* «■'" WHUHMMmiPWmtP
point of action Include whether the mv -linearity is mechanical
(springs, et.-.) transducer-related (moving coi] pick-off,
capacitor measurement, etc.) or electronics related.
For t!.'; analysis model shown in Figure 2b used in this
program, input and output spectra were compared for three cases
1) multiple simsoid, 2) displacement microseismic noise, and
3) acceleration microseismic noise. Result.-, of the application
of the non-1inearit/ model in Figure 1 to these three cases are
• iscusscd in the remainder of this section.
2 . 2 Sine Wave Inputs
Signals consisting of equally weighted sinusoids were
generated and processed through the non-linearity. The input
spectrum for a signal consisting of two sinusoids at frequencies
fj and f2 is shown in Figure 3. As illustrated in the output
spectrum (sec Figure 3) for this case, cross-jiroduct terms arc
generated by the non-linearity which have amplitudes about
40 tc 50 db below the true signal components. The value of
"a" in this case was II,
Several conclusions can be drawn from this example:
1. The distortion added by even a good seismometer
can l)e appreciable when viewed in the frequency
domain. Since this is the case, recorders which
have specified dynamic ranges of 30 to 40 db are
adequate to record the dan generated through these seismometers.
iO 2-6
mm ■

ppiin i"■ ■PPIIPWWI • ^•—mmimr^m^^mr ■^^mwrmmmm^w^m'^nmmmmmmiim^tmmmmmnmimmtB^mm wmmamimmeir
0 -
db
-50 --
100
INI'IJT SPECTRUM
a i\
fl f2
OUTPUT SPECTRUM
0--
db
50--
-100
h
y^ y
M / \
jr.
Figure S; Effect of Bxanple Onc-Percem Non-Linearity on Sine Wave Input Signals.
2-7 11
}imma. ■ati^MM —^^ .j

I 11 ■ "■'J' "" ■■ —-~ 1 !- H II11"" ll»«^W»ii^WIW^^^i
2. Th< generated spectrum is complex for this simple
case. It would be difficult to remove the non-
linear effects, especially if mixed in with other
effects such as linear filtering.
3. The added components occur over a much wider
frequency band than is occupied by the original
s ignal.
4. One ould suspect low-level signals in the presence
of strong peaks as being spurious.
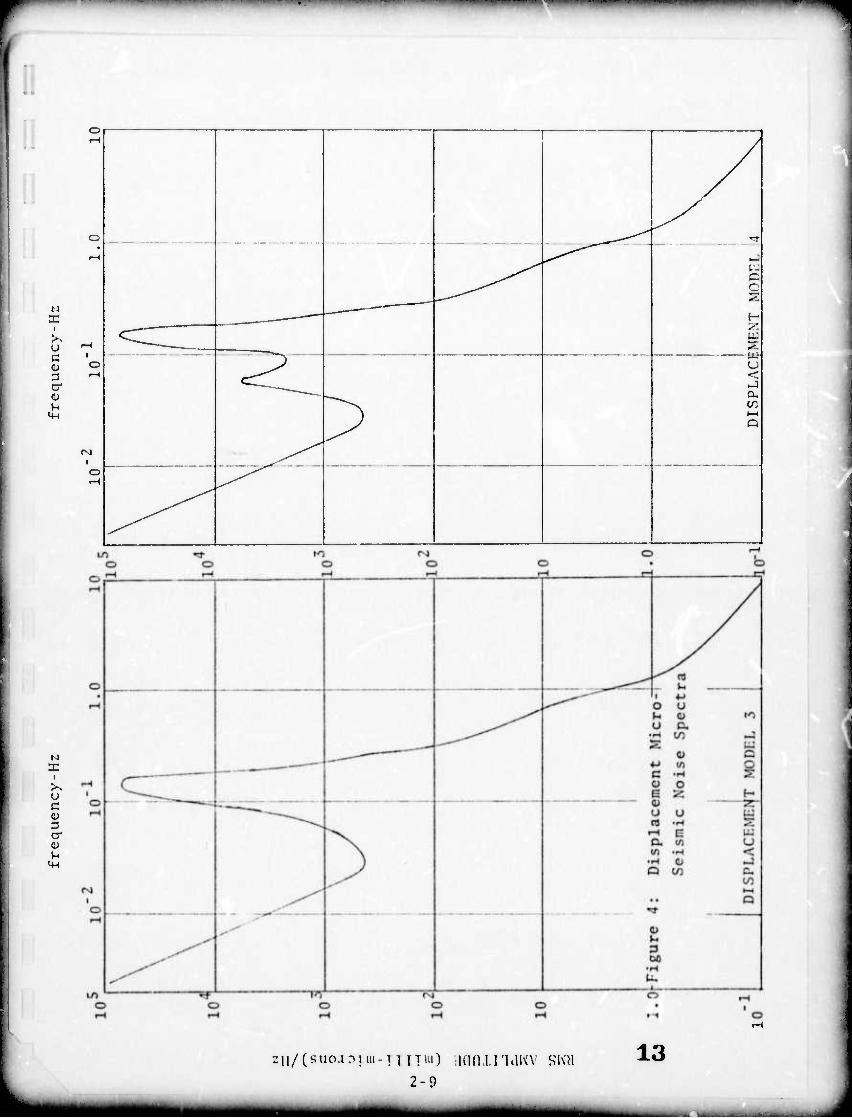
2.3 Non-Linoarity Effects on Microscismic Noisr
A model for microscismic noise (DISPLACEMENT MODEL 3)
covering the period range from 0.1 to greater than 100 se.onds
was synthesized using measurement data from various sources
[1] [2] [3]. An alternate model (DISPLACIiMHiNT MODEL 4) based
on more detailed measurement for long period noise including
the peak at 18 seconds was also developed [4]. These two dis-
placement noise spectra are shown in Figure 4. A program was
devised for generating a noise time signal which exhibits the
spectral properties shown in Figure 4 and covering the range
from .002 llz to 8 Hz (.125 to 500 seconds period). These noise
time signals were then processed through the non-linearity and
comparisons were made between input and output spectra.
Estimates for the corresponding acceleration spectra were
obtained by doubly differentiating with respect to time the
displacement curves. Results of this process are shown in
Figure 5 for noise models 3 and 4.
12 2-8
-MOHB—imi
^■■»■■"n^wwwwrww" i IM Min>■ nifii t n mnup 1 ■—"•"•■■i i i "i i. ■■ i wmmmmm 1
X i
o c o cr o
<4-l
X I X u 0 o 3 a* o
— -
i c::^_
c^
"^
— - ■- tu u 3 a M
^J^" -
^ a
I (
2-9
13
UMMM ■MM mam "- - - - - i- :

r ^""^IH^^^HP'"*'^ •»W». UB II IWIIM i in 11 wn ^^^na^^v
"1
tJ X
i
o C 3 r- u
, ^t
_y w P Q
o »-( c H ^
7_ —___^
W -) w u u
... Z <
/
o O O r4 o
N X
i
u c (U 3 cr
(Nl
^
/ to
c __
=
^.T
ION
M
OD
EL
^^^\
s W u u <
O O to o o
(zii-^nos)/(suo.ouii-in!"') aanxiidNV SI« 14
L ̂ ■-111 I -■ --
u o
CO
(U M
•H o 2
■ •H
to 1
o M o
o •H
rH o u o <
Ü
3 •H
■MM m
2-10
■pw mmmmmm *Mmmmm^i*nm^~mii •>>>' i n I"»^^BI^W™P^^P^»I mmmmimm**mmmmmmmmmmmimm*'^*ci
Results of application of the non-linearity model to
displacement noise are shown in Figure 0 for the two noise
models. Input spectra are shown as solid lines and output
ipectrt are shown for values of distortion (at rms) of
0.1ct, 0.3", 1,01 and St. As would be expected the high
ener-y microseismic peak at approximately 6-seconds when
passed thru the non-linearity model :auses significant
increases in noise energy at the third harmonic level
(approximately 0.4 Hz) and at the In* (difference) frequencies.
A si-nificant increase in a portion of the 20-40 second band
is observed. Peak differences as high as 33 clb at 0.4 Hz are
observed with peak differences in the LP b ad at 37-roximately 12 db.
The results cf Figure 6 indicate the expected output
spectra for a non-linearity acting on the earth displacement
if the Input spectra are truly representative of earth dis-
placement noise. It is emphasized that these input spectra
are based on measurement data and arc in fact seismometer
output spectra upon which non-linearities (if present) have
already acted.
Figure 7 shows results of the non-linearity model acting
on the acceleration microseismic noise. Results are similar
for both models 5 and 4, the major difference being the
notch at 18 seconds for model 4. The result of the non-linearity
is to fill in this notch and for both models is to increase
energy in the low frequencies and near the third harmonic.
The increase in low frequency energy for the acceleration model
is more pronounced because of the relative levels of low and
high frequeno energy at the input. That is, for the acceleration
noise model, significant energy in the range from 1 to 8 llz
is also pumped down into the LP band.
15 2-1 I
uat^i —m MM ■MMi ^^^■HMA^MH

^^■■»■••■"""•"wmrjiw»" 'Wfm^mmuim nwi "i"»-" ^wpMtwmpw^ JI imimimmmmm^ii^»K^^^i^^^''iiimmi^^m>mm^m^i^mmma^ßmimß''Wm
■\\/ C^P'U ! I dttlB 5U0J -^ I Hi- l ill in)
2 - ] ^
16
iMIMM ■MM ■■ IM tittm

ii i pi **^r~~~ mmmm'm 'w^mm^m^ ■I I mi I !■■ —^^^
4->
U 6) a
LO
<U (/)
•H o
0 O
•H +-> rt ^H
0) rH «) u
o
o
+J •H (H rt (U c
•H
I d o
IM O
*-> u (Ü
tu
0)
(^H- nos-)/(vip;')l [d«B SUO.I.->TI!I-TXI T111) 17 2-13
■MMauaaMLa ■ ■■*—>

r^ T" mnm— -"—w-i '•" ■"" «VflRB
Peak spectral noise increase occurs in the LP band and
ranges from about 1 db for a •« 0.11 to about 21 db for a = 3%.
Thus, for an instrument with non-linearities acting on the
acceleration input to the instrument, the non-linearity levels
examined would cause significant degradation of the system
performance.
Figures 6 and 7 demonstrated relative spectral noise
increases due to the described non-linearities. Of concern
also is the relative total noise increase in finite SP and
LP bands of interest. A spectral integration scheme was
employed to compute relative input and output power in
representative long-period and short-period bands. Results
of this computation for displacement and acceleration noise
models 3 and 4 are given in Figure 8.
Because of the sharp slopes of the noise curves and the
logarithmic frequency scale, energy in the selected SP and
LP bands is very sensitive to the exact bandpass limits, and
results of the bandpass integration in some cases may not
appear to agree with Figures 6 and 7. The point to be made
by Figure 8 is that gross differences in bandpass noise levels
are observed for non-linearities of the order of II and thus
reduce the effective signal-to-noise performance of the system.
This degradation of signal-to-noise ratio can seriously impair
the ability to detect low-lev.1 events in the given LP and SP
bands.
18 2-14
mt iMtmi mmmm —Mian *■■!■ n ■ i

MIIIIB ■■•■ PHPPHP nip*mmHH«DP ^■■BwvaaMH w«np>«i
1 ■ ^
■ j •
'"; ' ' n u
r "" C
: «
^
3
--;
C
_ _ C i- c
-J
....
: : : I i
iiji/ /—>
■ N
X w Mii i
in L - \ U3
i—(
Y • \ o
— i?: v 1 V --
-—- CO ■ - A - • ;£
«^ • • w u
—r-< : J
•CU
- •- 4_: _._ I t
DIS
M
OD
' * 1 ■ MM
I o
m — -
o
c;
eg 43
O o
o o
o
o
o o
o to
o J3
-- --O
o C
B 0 z: U-i
o Ü y,
18 o o
Xi
o •St
o
V) rt c c t9
B
o
■j c
oo
ü
o 73
O IO
o (Nl •0
o o
2-15 19
MM

itttmm i m\im*mwvn^9imr ^m'^^mmmrmm
3.0 CONCLUSIONS AND COMMENTS
It has been demonstrated that a wideband seismometer
exhibiting the example non-linearity would produce an output
spectrum which could seriously degrade overall performance.
For the interfering event case there would be confusion in
trying to separate low-level events from cross-product terms
of larger events.
For the case of low signal-to-noise it is demonstrated
that in certain spectral bands, the example non-linearities
increase noise levels sufficiently to completely mask low-level
events. The severity of the problem depends of course on tho
Txact non-linearity levels to be expected in actual seismo-
meters. Efforts to date have indicated that an expected upper
bound on non-linearities is It; however, very little information
concerning the definition of this distortion level is available.
There is a noticeable lack of reliable test data to verify
expected levels of non-linearities.
Definition and implementation of non-linearity test
procedures are required before reliable bounds can be placed
on seismometer non-linearity levels. Figure 9 is a preliminary
representation of desirable features of such tests. The idea
is to compare broadband instrument results with those from
"standard" SP and LP instruments.
A major task in implementing the ideas represented in
Figure 9 is the definition of "standard" seismometers. Ideally
they would be linear; however, it Blight be sufficient that they
respond only to specific passbands such that out-of-band energy
is in no way coupled into the passband.
20 3-1
Hi .MMMMMMMM

1 ■ ■ ■»" " mw^^^mim^wKv^mmm^m fw^m^mm^^mm
!
„
SHORT PERIOD
"STANDARD" SEISMOMETER
^ 'D
LONG PERIOD
"STANDARD" SEISMOMETER
BROADFAN?
SEISMOMETER
A D
A
COMPARATOR
LONG PERIOD
MATCHED EILTER
SHORT PERIOD
MATCHED FILTER
Figur« 9: Candidate Tost Method for Evaluating Relative
Non-Line lit ics.
3- 21
■ - ■■I n . - - ■

ißmm^mm i» ii •m^mmmmm^***^'* i nmmmm ■ HI ■ n ■«wvPP«wn«aa 1 " ■ '
1
4.0 REFERENCES
1. Brunc, J. and Oliver, J., "The Seismic Noise of the
Earth's Surface", Bull. Seis. Soc. Am.. Vol. 49, No. 4,
Oct. 1959, pp 349-353.
2. Sykcs, L., "High-Gain, Long-Period Seismograph Station
Instrumentation', Vol. 1. AFOSR-TR-71-2372. Lamont-
Dohcrty Geological Ohservatory, 31 Mar. 1971, pp 12-14.
3. Carder, D., "The Requirements of a High-Sensitivity
Seismograph Station", VESIAC Report, Institute of
Science and Technology, University of Michigan, Oct.
1963.
4. Savino, J., McCamy, K. and Hade, G. , "Structures lr
Earth Noise Beyond Twenty Seconds - A Window for Earth-
quakes", Bull. Seis. Soc. Am., Vol. 62, No. 1, February
1972, pp 141-176.
22
mmmm lilftlilKXlMWr»