p. c. le clercq and j. bellan- modeling of multicomponent-fuel dropladen mixing layers having a...
TRANSCRIPT
8/3/2019 P. C. Le Clercq and J. Bellan- Modeling of multicomponent-fuel dropladen mixing layers having a multitude of species
http://slidepdf.com/reader/full/p-c-le-clercq-and-j-bellan-modeling-of-multicomponent-fuel-dropladen-mixing 1/10
Modeling of multicomponent-fuel dropladen mixing layers
having a multitude of species
P. C. Le Clercq and J. Bellan
Jet Propulsion Laboratory, California Institute of Technology
November 20, 2003
Corresponding Author:
Josette BellanJet Propulsion Laboratory
California Institute of Technology
4800 Oak Grove Drive
Pasadena CA 91109-8099 USA
Tel: (818)354-6959, Fax: (818)393-5011
e-mail: [email protected] Submitted t o 30th International Symposium
Colloquium on Heterogeneous Combustion
M/S 125-109
on Combustion
(Sprays)-Short Title: Multicomponent-fuel drop-laden
mixing layers
Keywords: multicomponent fuel sprays
Abstract
A formulation representing multicomponent-
fuel (MC-fuel) composition as a Probability
Distribution Function (PDF) depending on the
molar weight is used to construct a model of
a large number of MC-fuel drops evaporating
in a gas flow, so as to assess the extent of
fuel specificity on the vapor composition. ThePD F is a combination of two Gamma PDF s,
which was previously shown to duplicate the
behavior of a fuel composed of many species
during single drop evaporation. The conser-
vation equations are Eulerian for the flow and
Lagrangian for the physical drops, all of which
are individually followed. The gas conservation
equations for mass, momentum, species and en-
ergy, are complemented by differential conser-
vation equat ions for the first four moments of
the gas-composition PDF; all coupled to the
perfect gas equation of state. Source terms inall conservation equations couple the gas phase
to the drops. The drop conservation equa-
tions for mass, position, momentum and energy
are complemented by differential equations for
four moments of the liquid-composition PDF.The simulations a re performed for a three-
dimensional mixing layer whose lower stream
is initially laden with drops. Initial pertur-
bations excite the layer to promote the dou-
ble pairing of it s four initial spanwise vortices
to an ultimate vortex. The drop temperature
is initially lower than t ha t of the surrounding
gas, initiating drop heating and evaporation.
The results focus on both evolution and the
state of the drops and gas when layers reach
a momentum-thickness maximum past the dou-
ble vortex pairing; particular emphasis is on the
gas composition. Comparisons between simula-
tions with n-decane, diesel and three kerosenes
show that a t same initial Reynolds number and
Stokes nimber distribution, a single-component
fuel cannot represent MC fuels. Substantia l dif-
ferences among the MC-fuel vapor composition
indicates that fuel specificity must be captured
for the prediction of combustion.
1

8/3/2019 P. C. Le Clercq and J. Bellan- Modeling of multicomponent-fuel dropladen mixing layers having a multitude of species
http://slidepdf.com/reader/full/p-c-le-clercq-and-j-bellan-modeling-of-multicomponent-fuel-dropladen-mixing 2/10
1 Introduction 2 Conservation equations
The equations follow in concept the single-
component (SC) study of Miller and Bellan [14]and emulate the SC investigation of Okong’o
and Bellan [15], in that the gas phase is de-
scribed in an Eulerian frame and t he drops arefollowed in a Lagrangian frame. T he drops are
assumed much smaller than the Kolmogorov
scale, meaning that they can be treated as
sources of mass, species, momentum and energy
for the gas [16] (171. The MC-fuel composition
is described by
The overwhelming majority of fuels used in
spray combustion devices are complex mix-
tures of a myriad of chemical species; exam-ples are diesel, gasoline and kerosene. The
traditional way of modeling these fuels hasbeen to consider the mixture as the sum of
all its individual species [l] 2] or as the sum
of a solvent and a solute (31; for obvious rea-
sons, we call thi s the ‘discrete’ species approach
(DSA). Complex fuels have so far not beensimulated using th e DSA, due to computa-
tional overhead associated with a large num-
ber of species. Ascertaining the role of dif-
ferent species is, however, important during
combustion because they have different impactsdepending on th e application. Recent devel-
opments in the modeling of multicomponent
(MC) fuel drops have opened intriguing pos-sibilities for modeling MC-fuel sprays (41 [5][6], [7]. These recent models are based on the
well-established theory of Continuous Thermo-
dynamics (CT) [8] [9] in which the chemicalpotential for a mixture containing numerous
components is appropriately represented, and
the Gibbs function is derived through molecular
thermodynamic methods in terms of the prob-
ability distribution function (PDF) describingthe mixture composition. The concepts are
fundamental and independent of the physico-
chemical model chosen for the chemical poten-
tial. Having specified an initi al PDF, t he evo-
lution of the mixture is governed by thermody-
namic relationships and or conservation equa-tions. Although the most general PD F will de-
pend on many variables, it has been shown,
with validation, that the single-Gamma PDF
depending on the molar weight, m, can repre-
sent a homologous species class [9]- [12].Single-Gamma PD F models applied to drop
evaporation [4] [5] [6] are, however, restricted
to negligible fuel vapor in the drop-surrounding
gas, as shown by Harstad et al. (71. A combina-
tion of two Gamma PDF s (DGPDF) as a func-
tion of m is necessary to capt ure th e evapora-
tion of drops in a gas containing substantial fuel
vapor [7], as in sprays. Moreover, Harstad and
Bellan [13] have enlarged the DG PDF concept
through appropriate thermodynamic modeling
and shown that a single DGPDF can represent
several homologous species classes.
This study addresses the problem of MC-
fuel drop evaporation in shear flows, such as
in sprays, and inquires into the species distri-
bution in a pre-transitional flow. The inter-est is here on simulating situations where the
drop evaporation, while still being relatively
slow compared to that during combustion, is
larger than in th e SGPDF study, with th e gasphase which may contain subs tantial vapor that
could condense on the drops. The focus is on
studying the influence of th e fuel type and th e
freestream gas t emperatu re in determining the
layer-fuel composition.
where f = fr(m;ak,Pk)ith IC E [ 1 ,2 ] ,t is a weighting parameter (0 < E < I),
JTm P(m)dm 1 and
where r (a ) s the Gamma function. Th e origin
of f is specified by y, and its shape is deter-
mine db ya a ndp . T hus, P(m;al,pl,a~,,B2,c)
is determined at each time t by the vector
sumed. Harstad et al. [7] have shown that Pcan be determined by an inverse mapping from
its first four moments, e,$ ,& and Fa, with a
fifth parameter empirically calculated. Thus, ateach t , PLdescribes the liquid-fuel composition
(subscript I denotes the liquid), being drop spe-
cific; P,, describes the vapor composition (sub-
script t~denotes the vapor), varying with loca-
tion. Comparisons between t he DGPD F and
(3 2 species) DSA results showed generally very
good and at most conditions excellent, agree-ment [7].
17 = (wrP1,a2,P2,4;1 = 72 = Y is as-
2.1 Gas phase equations
The equation of state
(3 )= (pRyT)/m= cR,T
is combined with Eulerian conservation equa-
tions for continuity, momentum, energy, species
and first four moments ( ~ , , , $ J , , , ~ 3 , , r ~ 4 u )f the
composition DGPDF, succinctly written as
a / a t+a [auj]ax j = s+a [$(a)]axj ( 4 )
where
= {c,cmu;,cmet,cX,,, (5 )
cxveu,~xv~,,
2

8/3/2019 P. C. Le Clercq and J. Bellan- Modeling of multicomponent-fuel dropladen mixing layers having a multitude of species
http://slidepdf.com/reader/full/p-c-le-clercq-and-j-bellan-modeling-of-multicomponent-fuel-dropladen-mixing 3/10
*(a) =
where c is the molar density, xi is the i th coor-
dinate, u s the velocity, X is the mole fraction,
m = 8,XV+m, (l-Xv) is the molar mass where
m, is the carrier gas molar weight (subscript adenotes the carrier gas), 2) is an effective dif-
fusion coefficient, p is the pressure, r i j is the
viscous stress tensor, 6ij is the Kronecker sym-
bol, et = e k + eint = 21,742 + h - p/p is the
total energy of the gas, p = mc is the massdensity, h is the enthalpy, X is the thermal con-
ductivity, T is the gas temperature and & is
the universal gas constant. The last term in
flux of the energy equation is the portion of the
heat flux due t o molar fluxes. The source terms,
S m o l e , S m u m , j , S e n , S m a s s , S ~ ,Sc, and Sc, arisefrom the coupled interaction of drops and gas,
and are given below.
2.2 Drop equations
All drops are individually simulated. Under th e
assumptions of quasi-steady gas phase with re-
spect to the liquid phase (as p / p l = 0 ( 1 0 - 3 )[19]) and of uniform internal drop properties
(relatively small evaporation rate [18];criterionchecked a pos te r io r i ) , the Lagrangian conserva-
tion equations for each drop osition x, elocity
notes the drop) where D is the drop diameter,
and composition are
v, nergy, mass Md = xp1DP6 (subscript d de-
(9 )
( 7 )
for n E [1 ,4] , where the gas phase at the
drop location, interpolated from the Eulerian
solution, acts as the drop far field. F, =
(Md/Td) f i (U i - V i ) where Td = plD 2 / (18p) iSthe particle time constant for Stokes flow, Td
is the drop temperature, A = rD2 is the dro p
surface area and p is the viscosity of the carrier
gas; Pr = pC,/(Xm), where C, is the heat ca-
pacity at constant pressure, and Sc =p / ( pV )
are the Prandtl and the Schmidt numbers re-
spectively. The Nusselt, N u , and the Sher-
wood, Sh, numbers are semi-empirically mod-ified using the Ranz-Marshall correlations, ac-
counting for convective heat and mass trans-
fer effects [14], with the similarity assump-
tion N u = 2 + 0.552 Re:{2 PI-)^/^, S h = 2 +0.552 Rei[2(Sc)'/3. f i , given in [14], is an
empirical correction to Stokes drag accounting
for both finite droplet Reynolds numbers (slip
Reynolds number Re.1 = 1u- v( D / p where
(u- v) is the slip velocity) and a Reynolds
number based on the evaporation-due blowing
velocity. B = (YJs)-Yu)/( l -YJa)) is the Spald-ing number, where Y, = Xv8,/m is the vapor
mass fraction and (1 +BT) (1+ B)'lL' with
Le being the Lewis number, L,,ff is the effec-
tive latent heat [ 7 ] and the superscript (s) de-
notes the drop surface. At this surface, the clas-
sical drop boundary conditions of t emperature
equality, and mass, species, momentum and en-
ergy flux conservation [19] apply and Raoult's
law relates (ideal-mixture assumed) the drop
and gas PDFs
where L,(m) and Tb(m) are the latent heat and
the normal boiling point correlated as functionsof m [ 7 ] , nd potm= la tm.
2.3 Source terms
The source-term-vector components of eq. 6 are
N
where Nd = Md/8l is the number of molesin the drop, N is the number of drops, and
the summation is over all drops residing within
a local numerical discretization volume, AV,.Following SC methodology [14], a geometricweighting factor wq distributes the individual
drop contributions to the nearest eight grid
points in proportion to their distance from the
3

8/3/2019 P. C. Le Clercq and J. Bellan- Modeling of multicomponent-fuel dropladen mixing layers having a multitude of species
http://slidepdf.com/reader/full/p-c-le-clercq-and-j-bellan-modeling-of-multicomponent-fuel-dropladen-mixing 4/10
drop location; because convective effects domi-
nate the species flux term, for MC flows, differ-
ential species diffusivity is negligible in trans-
port from the drop location to the grid nodes.
3Results
3.1 Configuration
Displayed in Fig. 1 is the mixing layer con-
figuration showing the streamwise, 21 , cross-
stream, 22, nd spanwise, 23 , coordinates with
lengths L1 = 4x1 = 29.166,,0, L2 = 1.1L1, and
L3 = 4x3 = 0.6L1,with L1 = 0.2m, where A1and A3 are forcing wavelengths in the 21 and 2 3
directions, and are used to excite the layer in or -
der to induce roll-up and pairing [20] [14], [21].6,,0 = Avo/ < au,/822 > is the initial vor-ticity thickness (subscript 0 denotes the initial
condition) where AUO = 2Uo is the velocity
difference across the layer, the brackets < >indicate averaging over homogeneous (21~23)
planes, and the initial condition for u1 is de-tailed in [14]; the ini tial mean streamwise veloc-
ity has an error-function profile [14]. The drops
are randomly distributed throughout 2 2 < 0
with uniform number density and uniform tem-
perature T d o < TO,where TO s the initial uni-form gas temperature; thus drop heating and
evaporation ensues. The mean drop number
density profile is smoothed near the center-line,
22 = 0, using an error function profile. Table
1 summarizes the initial conditions. The ini-
tial drop slip velocity with respect to the gas
is null, and the initial dropsize distribution is
polydisperse and specified by the Stokes num-
ber, St = T d A u o 6o Comparing MC and SCfuel parameters, it is obvious that one cannot
have the same pL ,< DO and Sto. Because of
the larger p1 at same initial St, the MC calcu-
lations are initialized with a larger number of
drops, N O , nd a smaller < DO than their SC
counterpart. Having the same Sto in all com-
puta tions means tha t if differences in the flow
evolution occur, they are entirely the result of
the SC versus MC aspect. The MC fuels con-
sidered are diesel (71 and three kerosenes (Jet
A, RP1 and JP7 ) whose composition [24] was
provided by Edwards [25]; all 90 re SGPDFs,
shown in Fig. 2 (mean and variance in Table 1).
The PDF of the SC fuel (not shown) used for
comparison, n-decane, is simply a delta function
at m = 142kg/kmol. All thermodynamic p ro p
erties were calculated as in Harstad et al. [7].
The mass loading, M L , is defined as the total
mass of the liquid relative to the to tal mass ofthe gas in the laden stream.
Initially, th e gas phase consists of carrier gas
with a trace of vapor. The free-stream veloc-
ity UO = M,,oac,o is calculated from a speci-fied value of th e convective Mach number M,,obased on the carrier gas initial speed of sound.
The specified value of the initial Reynolds num-
ber, Reo = pOAUo6,,o/p, where po is the initial
gas density, is used to calculate p . The thermal
conductivity and diffusivity are then computed
using this value of p and (constant) specified
values of Pr = Sc, computed as in [26]. For each
MC fuel, the initial vapor composition is found
from a single-drop simulation is air a t t he spec-
ified To by choosing it to be the first-time-step
surface-vapor composition. To isolate the effect
of the MC DGP DF representation, all thermo-
physical properties are those employed in the
simulations of [21] [15] using air as the carrier
gas and n-decane as the d rop liquid.
The boundary conditions in the 21 and 2 3
directions are periodic and adiabatic slip-wall
conditions in the 2 2 direction previously derived
[22] [23] were here adapted t o the DG PDF CT
model for MC mixtures. Drops reaching the
slip walls are assumed to stick to them.
The equations were solved using the numer-
ics detailed in [14] with the grid lis ted in Table
1. A fourth-order Lagrange interpolation prc-
cedure was used to obtain gas-phase variable
values at drop locations. The drops whose mass
decreased below 3% were removed from the cal-
culation. The perturbations used to excite thelayer are described elsewhere [14] [20].
3.2 Global layer evolution
The layer growth, measured by th e momentum
thickness [14], peaking a t t' = tAUo/6w,o= 95,
is independent of th e drop composition (not
shown). T he product thickness, defined in [14]
measuring the global mixing, and plotted in
Fig. 3, demonstrates substantial variability
with the fuel. For To = 375K, n-decane displays
the best global mixing, generally followed by Je t
A , RP1 , JP7 an d diesel. Differences between
the simulations occur early in the layer evolu-
tion, and this high 6 p sensitivity may therefore
constitute a good experimental diagnostic forcomparing fuels. The early higher 6 p or Jet Acompared to n-decane results from the initially
higher evaporation rate of th e former, as species
more volatile than n-decane egress the drops.
The final ordering of 6 p values is entirely corre-
lated with the fuel saturation curve; this satu-
ration curve is fixed for n-decane but is continu-
ously evolving with t ime for MC fuels due to th e
change in composition. N-decane simulat ions at
TO= 400K led to a substantial number of dropsbeing evaporated before the second pairing, ow-
ing to the single value of Tb = 447.7K close to
To, and thus the results were not conducive to
studying drop-flow interactions. The MC-fuel
formulation allows studies of the dropflow in-
teraction in the new regime of higher TO.Asexpected, 6 p ncreases with TO,s can be seen
for diesel for TO= 375K, 400K and 425K.
3.3 Drop composition
Shown in Fig. 4a and 4b for MC fuels is the liq-
uid composition evolution in terms of { O l } / O [ o
and { O } / C ~ ~ O ,here {} is th e drop ensemble av-
erage. The initial { O [ } / O a surge is accompa-
4
8/3/2019 P. C. Le Clercq and J. Bellan- Modeling of multicomponent-fuel dropladen mixing layers having a multitude of species
http://slidepdf.com/reader/full/p-c-le-clercq-and-j-bellan-modeling-of-multicomponent-fuel-dropladen-mixing 5/10
nied by a drastic reduction in {ui}/uio as the
volatiles evaporate , and {u1}/uioreaches a min-
imum. This minimum, beyond which {ui} /um
continuously increases, coincides with a taper-
ing off in the io io increase. Therefore, bothevaporation and condensation occur: condensa-
tion increases {u1} /qO whereas evaporation of
the lightest species increases {6i}/61o. Conden-
sation is confirmed by plots of {B} versus t*
(not shown) displaying some negative values.
Presented in Fig. 5 is {Td/T.,t} versus t',
where Teat is the fuel saturation temperature
which for MC fuels is a function of composition.
In all cases, a very mild {Td/T',t} undula-
tory behavior is observed, traced to {Td} (not
shown) manifesting evaporative cooling and
heating cycles; ensemble averages conditioned
on drop location (mixing layer for x2 / 6 , , 0 2
-7; complement is the lower stream) show this
behavior to be biased by the larger number ofdrops in x2 /6 , , 0 < -7, as the mixing layer
{Td} continuously increases after the first pair-
ing. The variation of {Td/T,,t} for n-decane
duplicates the behavior {Td} as Teat is con-sta nt . For the MC fuels, the behavior is due to
either the counteracting or concerting effect of
Td and T,,t. As th e volatiles preferentially leave
the drops, {Teat}ncreases concomitantly with
{&}/@io (not shown). At TO=375K, he initial
reduction of (Td/T,,t} combines the decrease
in Td with the increase in Tsat.At TO> 375K,two initial behaviors are seen: a reduction in
{Td/T,,t} (diesel and Jet A) meaning that the
increase in Taatdue to the evaporat ion of lower-
m species is larger than the increase in Td due to
drop heating, or an augmentation in (Td/T.,t}
(PR1 and JP7) meaning the opposite. The
peaks and troughs in {Td/T,,t} emulate those
of {Td} indicating that away from the initial
condition, the global Td variation is larger than
that of Teat.
3.4 Vapor composition
For a SC fuel the fuel vapor distribution is
given by Xu. For MC fuels both the composi-
tion and Xu etermine the species distribution.
Displayed in Fig. 6a to 6b are the between-
the-braid plane @ and uv shown as an exam-
ple for MCdie375 at t* = 95; the wide distri-
bution of species is evident. The 0, distribu-
tion shows that the lower stream is composed
of mostly small-m species because they egress
the drops first, before the drops are entrained
into the mixing layer. Medium-m species are
found in the mixing layer, as they evaporateafter the light species and when the drops are
already entrained. As the liquid composition
changes to contain increasingly large-m species,the struct ure of th e flow changes, with the es-
tablishment of regions of high drop number den-
sity profiling regions of high vorticity [27] [14].
The heaviest molar weight species reside at the
location of the largest drop number density (not
shown) because they are the last to evaporate,
after the flow structure has been established.
The upper stream still contains the initial va-
por composition, as species have not been trans-
ported outside the ultimate vortex. Thus, a
composition stratification is established, much
as had been observed for laminar flow combus-
tion with two species, where the simulations
were performed with computational instead of
physical drops [28]. Information not available
in such binary-fuel computations is presented
by u,, hich exhibits strong local variations, the
smaller ones being in the lower stream, and the
largest in t he regions of highest 8,. With in-
creasing TO,he upper range of both @ and u,
increase (not shown), indicating that increas-
ingly higher-m species are evaporated due to
the increased Td/T,,t ,and also that the hetero-
geneity of the mixture increases. Homogeneous-
plane averages of @,,/OUo and U,, /U,O displayed
in Fig. 7a and 7b show the fuel-specific vari-
ations, although for all fuels the vapor is con-
tained within the mixing layer and the lower
stream; the lower stream uniform < 0, > /&,o
and < u, > /uUo is consistent with the satu-ration discussed above. Diesel evaporation pro-
duces the largest change in < @ > /&,, mainly
due to its very wide distribution (Fig. 2) . The
< 0, > /@,o peak coincides with the contour-plot-identified regions of high @ this coinci-
dence is even more pronounced for < u,,> /uVo
showing first increased heterogeneity with the
cross-stream distance, then the reaching of the
above-discussed peak, and finally the decay to
unity in th e upper stream. Similar effects are
exhibited by all kerosenes, with the difference
that they a re much less sensitive to TO nd that
the variations in the cross-stream direction are
greatly reduced, both of which are attributed
to their narrower initial PDF. At same TO ,he
highest < 0, > /Owe is for diesel, and then
in decreasing order for Jet A, JP7 and RP1,decreasing with the reduction in their initial
PDF width. Of all kerosenes, Je t A producesthe largest < 0, > /@,,o in the mixing layer,
consistent with the wider PDF on the high-m
side, but relatively smaller values in the lower
stream, consistent with the wider PDF on the
low-m side. Similarly, the Jet A < uu > /U,O
displays more variation across the layer than
the other kerosenes, which is again representa-
tive of its wider PDF. Thus, the composition of
the gas phase mixture, which is responsible for
ignition, combustion and pollutant production
is highly variable with the MC fuel and must
be captured if accurate predictions from com-
bustion models are desired.
4 Conclusions
A formulation for describing the composition
of MC fuels using a statistical representation
has been used to derive a model of many drops
evaporating in a flow. This model has been
applied to study the evaporation of drops in a
5
8/3/2019 P. C. Le Clercq and J. Bellan- Modeling of multicomponent-fuel dropladen mixing layers having a multitude of species
http://slidepdf.com/reader/full/p-c-le-clercq-and-j-bellan-modeling-of-multicomponent-fuel-dropladen-mixing 6/10
three-dimensional temporal mixing layer whose
lower stream is initiallv laden with a collection
[5] W. L. H. Hallett, Combust. Flame 121(20001 334-344.
of randomly distributed polydiperse drops. The
layer initially contains four spanwise vortices
whose double pairing, promoted by a pertur-
bation, results in the formation of an ultimatevortex. The results are analyzed to study the
layer and drop evolution as well as the state at
the highest momentum thickness of the layer.
Comparisons are made among simulations per-
formed with a SC fuel (n-decane), diesel and
three kerosenes: Jet A, RP1 and JP7. The re-
sults show substantial differences between the
global and local mixing features of the layers,all of which are traced to the relative initial
composition of the fuels. Strong composition
nonuniformities in the layer, found for all MC
fuels, means that SC fuels cannot capture the
necessary species distribution to model com-
bustion. Moreover, the species distribution is
fuel-specific, offering the possibility to discrimi-
nate between fuel-composition-related combus-
tion efficiency, pollutant formation, corrosion
aspects, etc. The simulations show tha t theidentified composition effects are amplified with
increasing temperature. Likewise, for Reynolds
numbers larger than that of the simulations,
evaporation will be enhanced resulting again
in amplified composition heterogeneity. Thus,
turbulent combustion models must realistically
include fuel composition effects.
Acknowledgements
This study was conducted at the Jet Propul-
sion Laboratory (JPL ), California Institute of
Technology (Caltech), under the partial spon-sorship of the Donors of The Petroleum Re-
search Fund administered by the American
Chemical Society through a grant (to JB) for
Caltech Post Doctoral Fellow support, the U.S.Department of Energy with Ms. R. Danz and
Mr. D. Hooker as contract monitors, under an
agreement with the National Aeronautics and
Space Administration, and the Air Force Re-
search Laboratory, Wright Patterson Air Force
Base with Dr. J . T. Edwards as Technical Mon-
itor. Additional sponsprship was provided by
the Office National d’Etudes et de Recherches
Abrospatiales for Post Doctoral support. We
wish to thank Dr. K. G . Harstad for helpful
discussions. Computational resources were pro-
vided by the supercomputing facility at JPL .
References
\ ,
[6] A. M . Lippert and R. D. Reitz, SAE paper
[7] K. G . Harstad, P. C. Le Clercq and J. Bel-
lan, AZAA J. , 41(10) (2003) 1858-1874.
[8] B. Gal-Or, H. T. Cullinan, Jr . and R. Galli,
Chem. Eng. Sci.30 (1975) 1085-1092.
[9] R. L. Cotterman, R. Bender and J. M.Prausnitz, Znd. Eng. Chem. Process Des .D e n 24 (1985) 194-203.
[lo] C. H. Whitson, SOC.Pet. Eng. J. 23 (1983)
[ l l ] M . T. Rltzsch, and H. Kehlen, Fluid Phase
Equilibria 14 (1983) 225-234.
[12] G . F. Chou and J. M. Prausnitz, FluidPhase Equilibria 30 (19 86) 75-82.
[13] K . G. Harstad and J . Bellan, paper F 9,Western Sta tes Meeting of the Combustion
Institute, October 2003, Los Angeles, CA;
submitted 2003.
[14] R. S. Miller and J. Bellan, J . Fluid Mech.384 (1999) 293-338.
[15] N. Okong’o and J. Bellan, Consistent
Large Eddy Simulation of a temporal mix-
ing layer laden with evaporating drops.
Part I: Direct Numerical Simulation, for-
mulation and a priori analysis, accepted
in J . Fluid Mech., 2003
[16] M. Boivin, S . Simonin and K. D . Squires,
J. Fluid Mech. 375 (1988) 235-263.
[17] F. Mashayek, J. Fluid Mech. 367 (1998)
[18] A. Makino and C. K. Law, Combust.
(191 F. A. Williams, Combustion Theory,
[20] R. D. Moser and M. M. Rogers, Phys. Flu-
[21] R. S . Miller and J . Bellan, Phys. Fluids
(221 T. J. Poinsot and S. K . Lele, J . Comp.
[23] M. Baum, T. J . Poinsot and S. K. Lele, J .
[24] T. Edwards, L. Q . Maurice, J . Propul.
[25] T. Edwards, private comm. (2002) .
97FL-468, 1997.
683-694.
163-203.
Flame 73 (1988) 331-336.
Addison-Wesley, 1965
ids A , 3 (1991) 1128-1134.
12(3) (2000 ) 650-671.
PhyS. 101 (1992) 104-129.
Comp. Phys. 116 (1994) 247-261.
Power 17(2) (2001 ) 461-466.
[l] C. K. Law and H. K. Law, AZAA J. 20(1982) 522-527.
[2] C. M. Megaridis and W. A. Sirignano,
Proc. Comb. Inst. 23 (1990) 1413-1421.
(31 K . Harstad and J . Bellan, Atomization and
Sprays 1 (1991) 367-388.
[4] J. Tamim and W. L. H. Hallett, Chem.
Eng. Sci. 50 (1995) 2933-2942.
(261 R. S.Miller, K. Harstad and J . Bellan, Int.
(271 K. D. Squires and J . K . Eaton, Phys. Flu-
[28] G . Continillo and W. A. Sirignano, Proc.
J . Multiphase Flow 24 (1998) 1025-1055.
i d s A 3 (1991) 1169-1178.
Comb. Inst. 22 (1988) 1941-1949.
6
8/3/2019 P. C. Le Clercq and J. Bellan- Modeling of multicomponent-fuel dropladen mixing layers having a multitude of species
http://slidepdf.com/reader/full/p-c-le-clercq-and-j-bellan-modeling-of-multicomponent-fuel-dropladen-mixing 7/10
Figure captions
Figure 1. Mixing layer configuration.
Figure 2. Liquid initial PDF for each fuel.
Figure 3. Timewise evolution of the
product thickness. (- -) SCdec375, (-)MCdie375, (-El-) MCdie400, (-v-) Cdie425,
(- - -) MCjetA375, (-El-) MCjetA400, (--)MCrp1375, (-El-) MCrp1400, (---) MCjp7375,
(-El-)MCjp7400.
Timewise evolution of the nor-
malized ensemble average liquid a) mean molar
weight and b) standard deviation. Legend in
Fig. 3.Figure 5. Timewise evolution of the ensemble
average liquid drop temperature normalized by
the saturation temperature. Legend in Fig. 3.
Figure 6. Contour plots of the a ) mean mo-lar weight and the b) standard deviation in
the between-the-braid plane x3 /SW,o = 8.75 at
t' = 95 for MCdie375.
Figure 7. Homogeneous-plane average of the
normalized vapor a) mean molar weight and b)
stan dard deviation. Legend in Fig. 3.
Figure 4.
7
8/3/2019 P. C. Le Clercq and J. Bellan- Modeling of multicomponent-fuel dropladen mixing layers having a multitude of species
http://slidepdf.com/reader/full/p-c-le-clercq-and-j-bellan-modeling-of-multicomponent-fuel-dropladen-mixing 8/10
Case fuel To PLO {{D ~ ) } ( X ~ O - ~ ) L o / a L o B,o / uu o No ( x 10%)
SCdec375 n-decane 375 642 1.365 142 I NA 142 1 NA 580
MCdie375
MCdie4OO
MCdie425
MCjetA375
MCjetA400
MCrp1375
MCrp1400
MCjp7375MCjp7400
diesel 375 828
diesel 400 828
diesel 425 828
Je t A 375 800
Je t A 400 800
RP1 375 800RP1 400 800
JP7 375 800
JP 7 400 800
1.202
1.164
1.129
1.223
1.184
1.223
1.184
1.2231.184
185.0'1 43.0 140.0 '/ 28.0
185.0 / 43.0 140.0 f 28.0
185.0 / 43.0 140.0 / 28.0
161.0129.7 140.0 1 23.5
161.0 / 29.7 140.0 f23.5
165.2 1 17.7 153.5 / 14.8
165.2 / 17.7 153.5 / 14.8
167.1 / 19.2 153.7 / 15.7
167.1 / 19.2 153.7 / 15.7
670
690720
675
695
675
695675
695
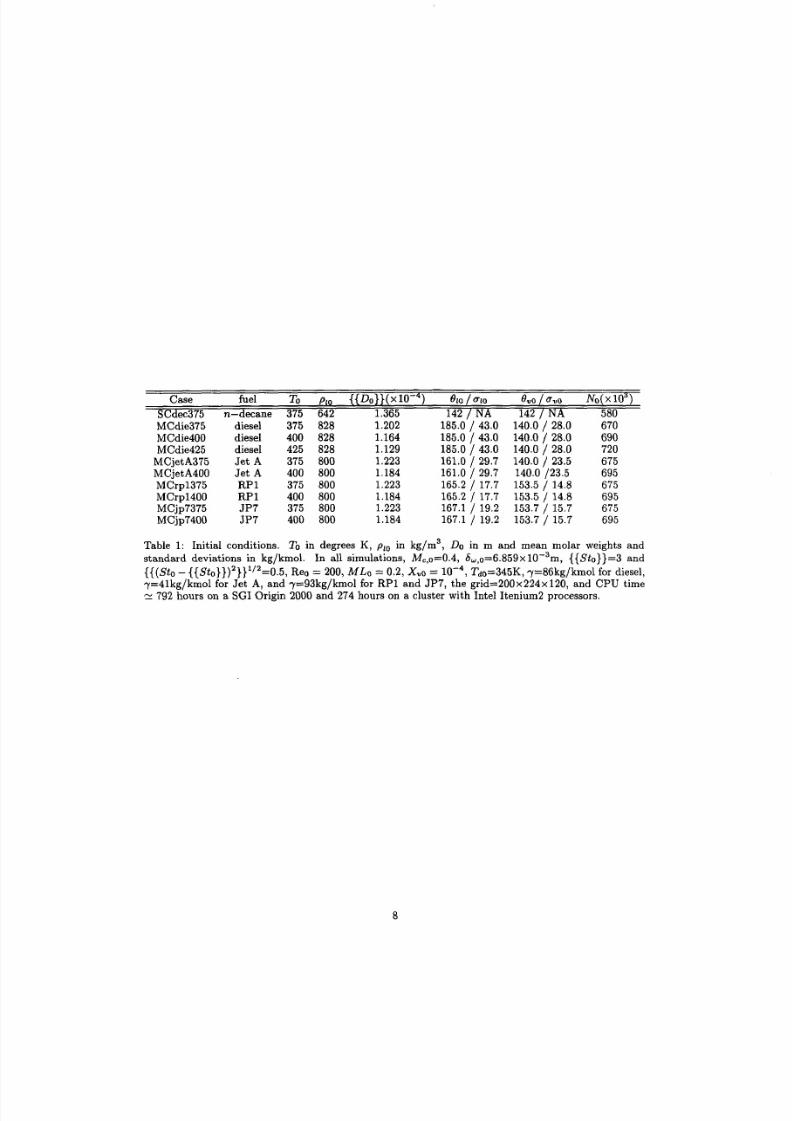
Table 1: Initial conditions. TO n degrees K, plo in kg/m3, DO n m and mean molar weights and
standard deviations in kgfkmol. In all simulations, M,,0=0.4, 6,,0=6.859x 10⁻³m, {{Sto}}=3 and
{{(St ,- { ~ t ~ } } ) ~ } } ' ~ ~ = ~ . ~ ,eo = 200, MLo = 0.2, X,o = Tdo=345K, 7=86kg/kmol for diesel,
7=4lkg/kmol for Jet A, and y=93kg/kmol for RP1 and JP7, the grid=200x224x120, and CPU timeN- 792 hours on a SGI Origin 2000 and 274 hours on a cluster with Intel Itenium2 processors.
8

8/3/2019 P. C. Le Clercq and J. Bellan- Modeling of multicomponent-fuel dropladen mixing layers having a multitude of species
http://slidepdf.com/reader/full/p-c-le-clercq-and-j-bellan-modeling-of-multicomponent-fuel-dropladen-mixing 9/10
-16
Figure 1: Mixing layer configuration.
Figure 2: Liquid initial PDF for each fuel.
I . , , , ,
la,
hds,,
Figure 3: Timewise evolution of the prod-
1.06,
I . , , , (
la,t'
9)
b)
Figure 4: Timewise evolution of the normalized
ensemble average liquid a) mean molar weight
and b) standard deviation. Legend in Fig. 3.
Figure 5: Timewise evolut ion of th e ensemble
average liquid drop temperature normalized by
the saturation temperature. Legend in Fig. 3.
uct thickness. (- -) SCdec375, (-)
MCdie375, (-0-) Cdie400, (-v-) MCdie425,(- - -) MCjetA375, (-El-) MCjetA400, (--)MCrp1375, (-El-) MCrp1400, (--) MCjp7375,(-.El-) MCjp7400.
9

8/3/2019 P. C. Le Clercq and J. Bellan- Modeling of multicomponent-fuel dropladen mixing layers having a multitude of species
http://slidepdf.com/reader/full/p-c-le-clercq-and-j-bellan-modeling-of-multicomponent-fuel-dropladen-mixing 10/10
Level 0, (kg/lonol)
:: :13 in11 in
IO im
I I U
I1 I6 8
9 I 6 3
1 I%
6 lSSs 1 9
4 1%3 141
I 14s
I 142
Level a, (kgkmol)
1 IS 31.9I4 31.4
13 31.1
I1 31.3
11 30.7
IO 30.1
9 19.6
I 19.1
7 11,s6 21.0
=4 4 169
x 3 1631 118
I 153
10
5
0
3-- 0 s 17.4
-5
Figure 6: Contour plots of the a) mean mo-lar weight and the b) standard deviation in
the between-the-braid plane ~ 3 / 6 ~ , 08.75 at
t' = 95 for MCdie375.
1.159
$* 1.1
sY 1
h
? 1.06h>
Va95
Figure 7: Homogeneous-plane average of the
normalized vapor a) mean molar weight and b)
standard deviation. Legend in Fig. 3.
10