particularities of osteoporosis in thyrotoxic patients ... doctorat/rezumat... · particularities...
TRANSCRIPT

THE UNIVERSITY OF MEDICINE AND PHARMACY“Gr. T. POPA” IAŞI
PhD SPECIALTY: ENDOCRINOLOGY
Particularities of osteoporosis inthyrotoxic patients
ABSTRACT
SUPERVISORS:Prof. CARMEN VULPOI, MD, PhD
Doctorand:MONICA ANDREIA HARAS, MD
IAŞI
2012
Prof. EUSEBIE ZBRANCA, MD, PhD

Key words:osteoporosis, osteopenia, bone mineral density, thyrotoxicosis,hyperthyroidism, thyrotropin

1
CONTENTS
CONTENTS 1
INTRODUCTION 3
ABBREVIATION INDEX 4
CURRENT DATA ON THE SUBJECT MATTER 6
CHAPTER 1. OSTEOPOROSIS 61.1. Definition, medical importance 61.2. Classification 71.3. Pathophysiological considerations 91.4. Diagnosis 13
1.4.1. Assessment of the bone mineral density 141.4.2. Biochemical markers of bone turn-over 20
1.5. Management 241.5.1. General measures 241.5.2. Pharmacological therapy 26
CHAPTER 2. THYROTOXICOSIS 342.1. Definition and aetiological classification 342.2. Clinical aspects 35
2.2.1. Clinical presentation 352.2.2. Differential diagnosis 40
2.3. Paraclinical diagnosis 402.3.1. Positive diagnosis 402.3.2. Aetiological diagnosis 45
2.4. Therapeutic options 532.4.1. General measures 532.4.2. Antithyroid drugs 542.4.3. Radioactive iodine therapy 582.4.4. Surgical thyroidectomy 612.4.5. Corticosteroids 632.4.7. Iodinated contrast agents and lithium compounds 642.4.6. Percutaneous interventions 652.4.7. Symptomatic management 66

2
CHAPTER 3. THYROTOXIC OSTEOPOROSIS 68Mechanisms of thyrotoxic osteoporosis 68Bone metabolism in thyrotoxicosis 70Evolution and prognosis of thyrotoxic osteoporosis 72
PERSONAL RESEARCH 73
CHAPTER 4. STUDY MOTIVATION.HYPOTHESES AND OBJECTIVES 73
CHAPTER 5. PATIENTS AND METHODS 745.1. Study design 745.2. Patients 74
The retrospective study 74The prospective study 77
5.3. Assessed parameters 775.4. Statistical analysis 80
CHAPTER 6. RETROSPECTIVE STUDY ON THE EVOLUTIONOF BONE MINERAL DENSITY IN THYROTOXIC PATIENTS,AFTER ATTAINMENT OF EUTHYROIDISM 826.1. Stratification of the studied groups 826.2. Results 83
6.2.1. Analysis of the premenopausal groups (C-n and TX-n) 836.2.2. Analysis of the postmenopausal groups(C-m and TX-m) 1076.2.3. Analysis of the postmenopausal groups receiving strontiumranelate (C-s and TX-s) 162
6.3. Discussion and conclusions 1926.3.1. The premenopausal groups (C-n and TX-n) 1936.3.2. The postmenopausal groups (C-m and TX-m) 1996.3.3. The postmenopausal groups receiving strontium ranelate(C-s and TX-s) 205Conclusions 209
CHAPTER 7. PROSPECTIVE STUDY ON THE EVOLUTION OFBONE MINERAL DENSITY IN THYROTOXIC PATIENTS 2117.1. Stratification of the studied groups 211

3
7.2. Results 211Baseline 212Follow-up 217
7.3. Discussion and conclusions 228Conclusions 233
CHAPTER 8. FINAL CONCLUSIONS 234
References 236
4
The thesis comprises 256 pages and it features 8 chapters, 136tables, 225 figures and 465 reference entries.
INTRODUCTION
Osteoporosis constitutes the most frequent metabolic disorder ofthe skeleton; though it used to be regarded as a normal part of thephysiological aging proces, at present it is largely acknowledged as amajor source of morbidity and mortality, due to the pathologicalfractures it causes. Because of the increased disability and mortalitythey involve, as well as high costs of medical care, the prophylaxis ofpathological fractures and implicitly the prophylaxis and therapy ofosteoporosis have become an important public health issue. Fromthis perspective, it is essential to further develop practical strategiesto promptly identify and treat the risk and aetiological factors ofosteoporosis.
Thyrotoxicosis is currently recognised as a relatively importantcause of secondary osteoporosis. This relationship was firstsuggested by Von Recklinghausen, more than 130 years ago; hedescribed in 1891 a case of severe hyperthyroidism, with multiplefragility fractures.
Nowadays, the broad accesibility to modern means of diagnosisand therapy leads to the prompt and efficient treatment ofhyperthyroidism, so that the prolonged, severe forms, associated withconsistent bone mass loss have become rare. Nevertheless, thisassociation continues to be debated and a considerable number ofclinical studies have reported significant reductions of bone mineraldensity and increases in fracture risk in thyrotoxicosis, even whenthis state was transient or subclinical. The available data regardingtherapy results in hyperthyroid osteoporosis are not yet consistentenough: various rates of bone mass recovery were described, andsome authors even described complete normalization after attainmentof euthyroidism, even if no specific antiosteoporotic therapy wasassociated.
The present paper aims to assess the severity and reversibility ofbone mass loss in thyrotoxic female patients, in relation to theseverity of the dysthyroidism.

5
CURRENT DATA ON THE SUBJECTMATTER
CHAPTER 1. OSTEOPOROSIS
Osteoporosis is a chronic, metabolic disorder of the skeleton,which leads to progressive bone loss and microarchitecturaldeterioration and subsequently, to increased fragility and fracturesusceptibility.
According to the current reccomandations of the World HealthOrganization (WHO), its positive diagnosis is based on quantitativeassessments of the bone mineral density (BMD).
CHAPTER 2. THYROTOXICOSIS
The term thyrotoxicosis defines the complex of clinical andparaclinical features consequent to the exposure of the organism toan excessive amount of thyroid hormones, regardless of the cause.
The aetiological classification of thyrotoxicosis has the mostrelevance from the clinical and therapeutic points of view. It shouldbe mentioned that Graves-Basedow disease is considered the mostcommon form of thyrotoxicosis.
The distinction between thyroid hyperfunction (hyperthyroidism)and other causes of thyrotoxicosis (thyroid tissue destruction,exogenous thyrotoxicosis, etc.) has crucial therapeutic implications.The thyroid function often changes during the course of the disease.From a clinical point of view, the most significant disorders are theones causing a continuous, sustained, overproduction of thyroidhormones. The most frequent forms of thyrotoxicosis fall into thiscategory: Basedow-Graves disease, toxic nodular goiter and toxicadenoma. In thyroiditis (autoimmune, drug-induced, or radiationthyroiditis), the thyrotoxicosis is transitory, with a variable severityand duration, depending on the aetiology, and is frequently followedby hypothyroidism.
Understanding the natural history of various aetiological forms ofthyrotoxicosis is important for adequate monitoring and

6
management. For example, the course of Graves’ disease ischaracterized by exacerbation and remission phases; around 10-18%of cases spontaneously progress to hypothyroidism. Graves’ diseasemay progress to Hashimoto’s thyroiditis with hypothyroidism andconversly, Hashimoto’s thyroiditis may evolve to Graves’ withhyperthyroidims; these changes are most probably in relation to thebalance between the inhibiting and stimulating thyroid receptorantibodies (TRAb).
Comparison between the main therapeutic directions inhyperthyroidism
Antithyroiddrugs
Radioactiveiodine Thyroidectomy
Reccurence 60-70% 5-20% 2-10%Compliance Relatively low Good Good
Risk of severeadverse effects ≤1% ≤1%
Low, if performed byan experienced
surgeonHypothyroidismincidence Low Almost
inevitable 30-50%
Pregnancy Low-dose PTUimply no risk
Absolutelycontraindicated
After the middle of the2nd trimester
Duration tocomplete effect 6-8 weeks 2-6 months A few days
CHAPTER 3. THYROTOXICOSIC OSTEOPOROSIS
Thyrotoxicosis increases bone turnover-ul osos, by reducing theduration of the remodelating cycle, especially the formation phase.This results in an overall decrease of bone mineral density, with a netloss of around 10% of mineralized bone mass per cycle.
Mechanisms of thyrotoxic osteoporosisThe hyperthyroid bone loss is characterized by increased
resorbtion, predominantly in the cortical bone, while the trabecularbone seems to be less affected; this pattern suggests theaugmemtation of osteoclast activity as a main mechanism. Someauthors suggested that osteoblastic inhibition may also constitute amechanism of thyrotoxic osteoporosis.
While classically, the thyrotoxic bone loss was attributed to high

7
circulating levels of thyroid hormones, more recent experimentalstudies suggested that TSH, which has receptors expressed inosteoblast precursors and osteoclasts, may act as a direct inhibitor ofbonne turnover. Therefore, in thyrotoxicosis, the low TSH levelsmay contribute to the acceleration of bone turnover, with subsequentbone loss. The relative contribution of the thyroid hormones versusthyrotropin in scheletal homeostasis reains a controversial subject.
A more recent hypothesis ascribes to TSH a role in the fineregulation of bone metabolism, more evident during the highturnover states, like estrogen deprivation.
Some authors also considered the role of IL-6 high levels as apathophysiological mechanism in thyrotoxic osteoporosis. Since themononuclear cells express thyroid hormone receptors, the excessiveproduction of IL-6 could be the consequence of their overstimulationby T3.
Bone metabolism in thyrotoxicosisThe initiation rate of bone remodelling cycles is increased in
thyrotoxicosis; while the resorbtion phase seems to maintain itsduration and efficiency, the formation phase is shortened and lesseffective, so that the total length of a cycle is decreased and the endresult is an unbalance, favoring bone loss.
Studies of calcium and phosphate kinetics in thyrotoxic patientsshowed an increase in their excretion rate, leading to a negativebalance, which in turn probably contributes to the bonedemineralization. The markers of bone formation (AP, osteocalcin,P1NP), as well as those of resorbtion (hydroxyproline, pyridinolineand deoxipyridoline, CTX) are raised and their leves seem tocorrelate with the levels of circulating thyroid hormones. Acceleratedcollagen degradation, including in soft tissues, amplifies theincreases of pyridolines observed in hyperthyroidism.
Most studies have described a fall of bone markers levels afterinitiating the therapy for thyrotoxicosis; this decrease is faster duringthe first weeks or months and subsequently slows, with the possibleexception of bone formation markers, such as AP, wich tend toremain raised. The persistence of formation markers was attributed tothe discontinuation of osteoblastic inhibition. Bone turnovernormalizes relatively early after initiation of therapy, calcium-

8
phosphorus balance becomes positive, and serum as well as urinary,calcium decreases. Some authors described a hypocalcemic phase,sometimes even with tetany, immediately after thyroid statusnormalization, ascribing it to the temporary increased skeletalretention - „the hungry bone syndrome”.
Evolution and prognosis of thyrotoxic osteoporosisMost studies have shown that effective treatment of the
thyrotoxicosis leads to BMD increases, though recovery to normalvalues has been reported only exceptionally. A significant number ofstudies have associated hyperthyroidism with incresead fracture riskand even increased mortality, subsequent to femoral fractures.
Subclinical hyperthyroidism also seems to have an impact on theskeleton. Most clinical investigations have analysed the mineraldensity in postmenopausal women. The results showed that in thisgroup, BMD was significantly lowered, regardless of the region ofinterest, and normalization of thyroid function led BMDimprovements.
PERSONAL RESEARCH
CHAPTER 4. STUDY MOTIVATION.
HYPOTHESES AND OBJECTIVES
The present work aimed to test the following hypotheses: The BMD decrease correlates with the severity of thyrotoxicosis The BMD decrease correlates with the duration of untreated
thyrotoxicosis BMD increase with therapy is faster in thyrotoxic patients than in
those with primary osteopenia/ osteoporosis BMD increase with therapy is faster in thyrotoxic patients which
attain euthyroidism, than in those who maintain hyperthyroidismdespite treatment
The major objectives of the study were: The assessment of the relationship between the severity of bone

9
loss and thyroid status The assessment of the relationship between the severity of bone
loss and hyperthyroidism duration The assessment of the relationship between bone density
response to treatment and the evolution of the thyroid function The characterization of the response to therapy of thyrotoxic
osteopenia/osteoporosis, in comparison to primary osteopenia/osteoporosis
The estimation of fragility fracture prevalence in thyrotoxicfemale patients and identification of their risk factors
CHAPTER 5. PATIENTS AND METHODS
5.1. Study design
We carried out a cohort retrospective study, comparingthyrotoxic female patients, with a baseline BMD below -1 SD, wichattained and maintained euthyroidism with therapy, with euthyroidpatients with low bone mass (initial BMD below - 1SD). We alsocarried out a prospective study, to compare, after initiation ofappropriate therapy for hyperthyroidism, the female patients whowere euthyroid after 6 months with those who remained thyrotoxic.
5.2. Patients
We only included female, caucasian subjects, becausecurrently, there isn’t a clear consensus on the accuracy and relevanceof the T score calculated using the available data bases, formen underthe age of 50. On the other hand, the number of male patientspresenting to the Endocrinology Clinic for thyrotoxicosis symptoms,who are assessed and followed for both, thyroid function and bonemineral density, is very low, since the prevalence and incidence ofthyrotoxicosis are much lower in men, compared to women.
The retrospective studyThe study group (TX) comprised 153 patients with newly
diagnosed thyrotoxicosis and osteopenia/ osteoporosis, with attainedand maintained euthyroidism at the subsequent reassessements It

10
shoul be mentioned that each case underwent multiple reassessmentsfor thyroid status and treatment adjustments, but we only consideredtwo follow-ups, that included BMD measurements.
Inslusion criteria: TSH < 0.27 mU/l at baseline T score, measured at the lumbar spine, ≤ -1 SD at baseline TSH in reference range (0.27 – 4.2 mUI/l) at both follow-ups
Inclusion criteria: Personal history of thyroid disease Other endocrine disorders associated with abnormal bone
metabolism Skeletal disorders (bone dysplasias, rheumatismal diseases,
primary and secondary bone neoplasms) Personal history of disordes and treatments with a significantimpact on bone metabolism Severe diformities of lumbar spine, altering the results of BMDmeasurements BMD; vertebral fractures, identified radiologically; adifference > 1DS between the T scores of two adjacent vertebrae,even in the absence of a previouos fracture diagnosis; the presence ofcement or metallic osteosynthesis material in lumbar spine Lack of compliance to therapy, noted by a doctor in the patient’srecord
All patients were efficiently treated for thyrotoxicosis (withantithyroid drugs, percutaneous injection, or thyroidectomy,depending on the aetiology and the patient’s option). All patientsreceived calcium (1000 mg/day) and vitamin D (800 IU/day), and thecases presenting with hypomagnesemia also received Mgsupplements. In cases with a T score belor -3 DS, or with a historyof fragility fractures, bisphophonates (alendronate, 35 mg/week) orstrontium ranelate (2 g/day) were administered.
The control group (C) comprised 189 euthyroid patients, withnewly diagnosed osteopenia/osteoporosis, in whom thyroid statuswas also assessed at two subsequent visits.
Inclusion criteria: T score, measured at the lumbar spine, ≤ -1 SD at baseline TSH in reference range (0.27-4.2 mU/l) at all visits

11
fT4 in reference range (12-22 ng/dl) la all visitsExclusion criteria were the same with those applied for group
TX, plus thyroid disorders of any type, at presentation.All patients received calcium and vitamin D, and the ones with
hypomagnesemia also received magnesium. In cases with a T scoreless -2.5 DS, or a history of fragility fractures, bisphophonates(alendronate, 35 mg/week) or strontium ranelate (2 g/day) wereadministered.
The prospective studyWe examined the BMD changes (regardless of its values at
baseline) in female patients with newly diagnosed thyrotoxicosis,from January to March 2011, after 6months of treatment. The studysubgroups were defined at the 6 months follow-up: we compared thepatients in whom euthyroidism was obtained and maintained (A),with those who remained hyperthyroid under treatment (B). Initially,72 patients were enrolled, but 9 of them did not show up for the 6months reassessment, and 12 were hypothyroid at folloe-up. Finally,we analysed 52 de cases.
Subgroup A (33 subiects) had as inclusion criteria: TSH < 0.27 mU/l at baseline TSH in reference range (0.27 – 0.42 mUI/l) after 6 months
The exclusion criteria were the same with the ones used in theretrospective study.
Subgroup B (21 subiects) had as sole including criterion TSH <0.27 mU/l at both, baseline and 6 months follow-up. The exclusioncriteria were the same as in the retrospective study, plus conditionsthat could have altered the accuracy of whole body BMDassessments: Osteosynthesis materials at any skeletal site Recent fractures at any skeletal site Severe osteoarthrosis, with large, numerous osteophytes
5.3. Assessed parameters
1. Age at presentation, in years

12
2. Provenance community (urban – U or rural – R)3. History of fragility fractures (to minimumal impact, eg. same-
level falls)4. Body mass index (BMI, in kg/m2)It was calculated using the formula:
where G is body weight, expressed in kilograms and T is height,expressed in metres.
5. Menopause onset in years (if the case)6. Years since menopause (the difference, in years, between the
age at presentation and the age at menopause onset)The study groups were each stratified according to the
menopausal status.7. Smoking (more then 10 cigarrettes a day, for more then 6
months)8. Alchool consumption (defined as consumption of more then
500 ml/day of bere, 250 ml/day of wine, or 50 ml vodka/brandy)9. Duration of hyperthyroidism symptoms, in months (if the case).
This is a subjective parameter with orientative value. We recordedthe time (estimated by the patient) elapsed since the the onset of themost significant symptoms (weight loss with hyperfagia,thermophobia, anxiety, agitation, sleep disturbances, tremor,palpitations),untill the presentation.
10. TSH (thyrotropin)An immonochemical method was used, with electrochemi-
luminescence immunoassay – ECLIA. Measurements were donewith an Elecsys System 2010 dispositive (Roche Diagnostics GmbH,Mannheim, Germania).
The reference range for adults are 0.27 – 4.2 mIU/l. The detectionlimit of this test is 0.005 mIU/l.
11. fT4 (free thyroxine)It was determined by ECLIA, using Elecsys System 2010 (Roche
Diagnostics GmbH, Mannheim, Germania). The reference range foradults are 12 – 22 pmol/l, detection limit is 0.3 pmol/l.
12.Bone mineral density was expressed as absolute density(BMD, in g/cm2) and as T score (Ts).

13
It was assessed using a DXA Hologic dispositive, model DelphiW (S/N 70490), the same for all patients. Measurements were madeby the same person, for all visits.
13. Serum total calcium (Ca)It was assessed by spectrophotometry, using an Abbot Aeroset
analyzer. Reference range for adults is 8.4 – 10.2 mg/dl (2.10 – 2.55mmol/l, conversion factor 0.25), detection limit is 0.2 mg/dl (0.05mmol/l).
14. Calculated ionized serum calcium (Ca++)We used the Zeisler formula:
where: Ca++ – ionized serum calcium (mg/dl), Ca – total calcium(mg/dl), PT – total plasma protein (g/dl).
The reference range for adults is 3.82 – 4.82 mg/dl. This methodis less accurate then direct measurement, because the actual valuevaloarea reală of free calcium significantly depends on the bindingfraction.
16. Serum phosphorus (P)It was assessed by spectrophotometry, using an Abbot Aeroset
analyzer. Reference range for adults is 2.5 – 4.7 mg/dl (0.80 – 1.52mmol/l, conversion factor 0.323), detection limit is 0.3 mg/dl (0.1mmol/l) for this test.
17. Serum magnesium (Mg)It was measured by spectrophotometry, using an Abbot Aeroset
analyzer. Reference range for adults is 1.6 – 2.6 mg/dl (1.3 – 2.1mEq/l, conversion factor 1.215), detection limit is 0.152 mg/dl(0.125 mEq/l).
18. Total alkaline phosphatase (AP)It was measured by spectrophotometry, using an Abbot Aeroset
analyzer. Reference range for adults is 35 – 130 U/l.19. CalciuriaIt was assessed by spectrophotometry, using an Abbot Aeroset
analyzer. Reference range for adults is 100-320 mg/24 hours.20. OsteocalcinIt was determined by ECLIA. The reference ranges for women

14
are: premenopause: 11-43 ng/dl postmenopause: 15-46 ng/dl
the detection limit is 0.5 ng/ml.21. 25-OH vitamin D
It was measured by High Performance Liquid Chromatography –HPLC, utilising a Roche analyzer.
Reference range for adults is: 20-70 ng/ml.From a clinical point of view, serum values of 25-OH vitamin D
can reflect:Deficiency: <10 ng/dlInsuficiency: 10-30 ng/dlSuficiency: 30-100 ng/dlToxicity: >100 ng/dl
5.4. Statistical analysis
Statistical analysis was done under the guidance of Assis. Prof.Cristina Dascălu, UMF „Gr. T. Popa”. We used SPSS (StatisticalPackage for the Social Sciences) 16.0, for Windows.
The normality of distribution for the obtained data was analyzedusing the Kolmogorov-Smirnov test (if p>0.05, then the distributionof the values was considered normal). To assess the differencesbetween parametric data, we used the t-test, if the values werenormally distributed; otherwise, the Mann-Whitney test was applied.
To determine whether the differences observed at succesiveasseessments of a parameter, in the same gruop, had statisticalsignificance, we applied the paired samples t-test. In order todetermine if the differences observed between the study and controlgroups were significant, we used the independent samples t-test.
We assessed the linear relanship between parameter pairs throughthe Pearson bivariate corelation coeffcient (r) and we developedmultiple linear regression models. The correlation between twoparameters was considered significant if r2>0.090.
We used the chi-square test to compare non-parametric data. Theunivariate dispersional analysis (comparison between samplesgrouped a discrete variable) was done using the one-way ANOVA

15
test (ANalysis Of VAriance).The obtained values were considered statistically significant if p <
0.05.
CHAPTER 6. RETROSPECTIVE STUDY ON THEEVOLUTION OF BONE MINERAL DENSITY IN
THYROTOXIC PATIENTS, AFTER ATTAINMENTOF EUTHYROIDISM
6.1. Stratification of the studied groups
Stratification of the groups in the retrospective studyControl
(C)Thyrotoxicosis
(TX)Total 189 153
Non-menopause (n) 20 22
PostmenopauseDid not receive strontium (m) 153 118
Strontium treatment (s) 16 13
The control group (C) was divided in 3 subgroups: Premenopause (C-n) – 20 patients (10.58%), treated with vitaminD and calcium Postmenopause (C-m) – 153 patients (80.95%), treated withvitamin D, calcium +/- bisphosphonates Postmenopausal patients, treated with vitamin D, calcium andstrontium ranelate (C-s) – 16 (8.47%)
The study group (TX) was divided as follows: Premenopause (TX-n) – 22 patients (14.38%), treated with
vitamin D and calcium Postmenopause (TX-m) – 118 pateients (77.12%), treated with
vitamin D, calcium +/- bisphosphonates Postmenopausal patients, treated with vitamin D, calcium and
strontium ranelate (TX-s) – 13 (8.5%)
16
6.2. Results
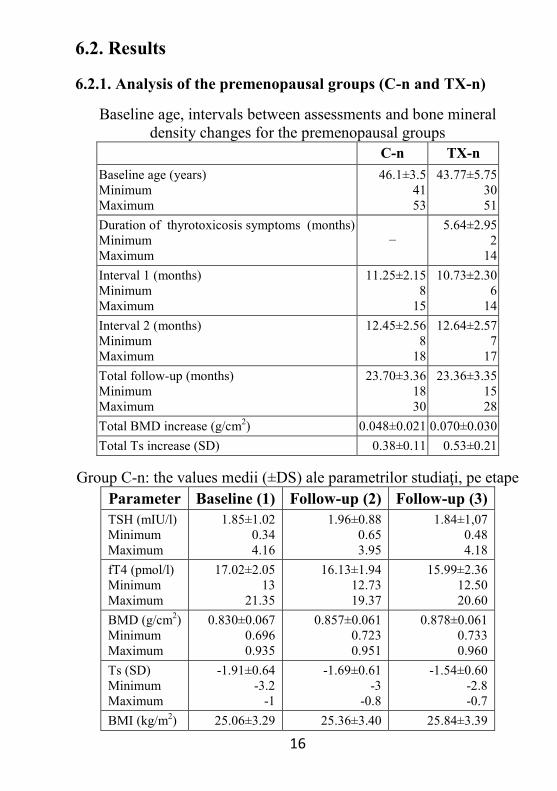
6.2.1. Analysis of the premenopausal groups (C-n and TX-n)
Baseline age, intervals between assessments and bone mineraldensity changes for the premenopausal groups
C-n TX-nBaseline age (years)MinimumMaximum
46.1±3.54153
43.77±5.753051
Duration of thyrotoxicosis symptoms (months)MinimumMaximum
−5.64±2.95
214
Interval 1 (months)MinimumMaximum
11.25±2.158
15
10.73±2.306
14Interval 2 (months)MinimumMaximum
12.45±2.568
18
12.64±2.577
17Total follow-up (months)MinimumMaximum
23.70±3.361830
23.36±3.351528
Total BMD increase (g/cm2) 0.048±0.021 0.070±0.030Total Ts increase (SD) 0.38±0.11 0.53±0.21
Group C-n: the values medii (±DS) ale parametrilor studiaţi, pe etapeParameter Baseline (1) Follow-up (2) Follow-up (3)TSH (mIU/l)MinimumMaximum
1.85±1.020.344.16
1.96±0.880.653.95
1.84±1,070.484.18
fT4 (pmol/l)MinimumMaximum
17.02±2.0513
21.35
16.13±1.9412.7319.37
15.99±2.3612.5020.60
BMD (g/cm2)MinimumMaximum
0.830±0.0670.6960.935
0.857±0.0610.7230.951
0.878±0.0610.7330.960
Ts (SD)MinimumMaximum
-1.91±0.64-3.2
-1
-1.69±0.61-3
-0.8
-1.54±0.60-2.8-0.7
BMI (kg/m2) 25.06±3.29 25.36±3.40 25.84±3.39
17
Parameter Baseline (1) Follow-up (2) Follow-up (3)MinimumMaximum
18.4730.02
19.6731
19.1530.02
Ca (mg/dl)MinimumMaximum
8.99±0.448.15
10
9.13±0.708.33
10.48
9.27±0.598.15
10.55Ca++ (mg/dl)MinimumMaximum
4.08±0.363.624.76
4.32±0.363.704.92
4.29±0.273.804.73
P (mg/dl)MinimumMaximum
3.40±0.782.324.70
3.16±0.672.304.55
3.24±0.712.474.85
Mg (mg/dl)MinimumMaximum
2.36±0.371.753.00
2.41±0.391.703.00
2.34±0.271.852.96
AP (U/l)MinimumMaximum
88.80±34.3335
144
70.75±26.4039
131
68.90±28.8034
123
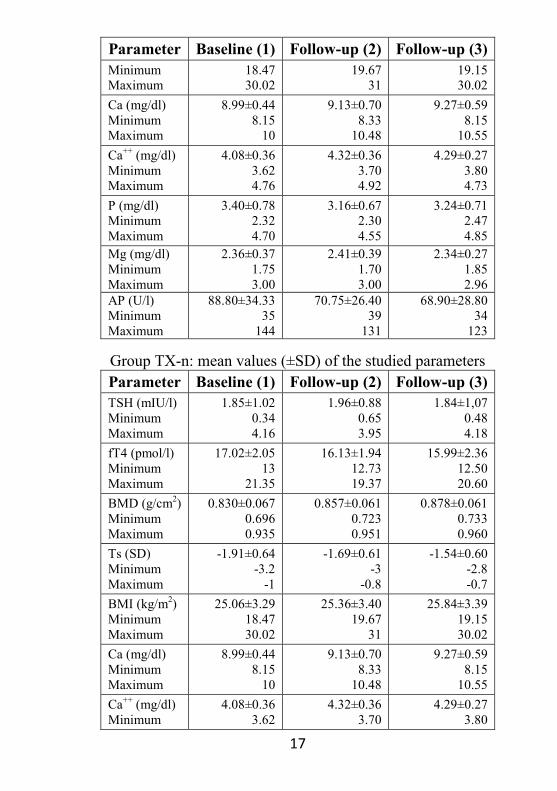
Group TX-n: mean values (±SD) of the studied parametersParameter Baseline (1) Follow-up (2) Follow-up (3)TSH (mIU/l)MinimumMaximum
1.85±1.020.344.16
1.96±0.880.653.95
1.84±1,070.484.18
fT4 (pmol/l)MinimumMaximum
17.02±2.0513
21.35
16.13±1.9412.7319.37
15.99±2.3612.5020.60
BMD (g/cm2)MinimumMaximum
0.830±0.0670.6960.935
0.857±0.0610.7230.951
0.878±0.0610.7330.960
Ts (SD)MinimumMaximum
-1.91±0.64-3.2
-1
-1.69±0.61-3
-0.8
-1.54±0.60-2.8-0.7
BMI (kg/m2)MinimumMaximum
25.06±3.2918.4730.02
25.36±3.4019.67
31
25.84±3.3919.1530.02
Ca (mg/dl)MinimumMaximum
8.99±0.448.15
10
9.13±0.708.33
10.48
9.27±0.598.15
10.55Ca++ (mg/dl)Minimum
4.08±0.363.62
4.32±0.363.70
4.29±0.273.80

18
Parameter Baseline (1) Follow-up (2) Follow-up (3)Maximum 4.76 4.92 4.73P (mg/dl)MinimumMaximum
3.40±0.782.324.70
3.16±0.672.304.55
3.24±0.712.474.85
Mg (mg/dl)MinimumMaximum
2.36±0.371.753.00
2.41±0.391.703.00
2.34±0.271.852.96
AP (U/l)MinimumMaximum
88.80±34.3335
144
70.75±26.4039
131
68.90±28.8034
123
Comparing the mean increases of the bone mass achieved in thetwo groups, we found that the gain was significantly higher for groupTX-n, the changes of BMD and Ts being significantly moreimportant at both, the first reassessment (p=0.011, respectivp=0.039), and the second (p=0.014, respectiv p=0.007).
Comparison between the total BMD increases in the two groupsof premenopausal patients
6.2.2. Analysis of the postmenopausal groups (C-m and TX-m)For these groups, we introduced the parameter „years since
menopause”, to assess the correlations between bone mineral densityand the duration of estrogen deprivation.

19
Baseline age, intervals between assessments and bone mineraldensity changes for the postmenopausal groups
C-m TX-mBaseline age (years)MinimumMaximum
61.75±8.204781
61.23±7.654779
Menopause onset (years)MinimumMaximum
48.01±2.824555
49.07±3.134556
Years since menopause (years)MinimumMaximum
13.73±8.750
36
12.16±7.990
34Duration of thyrotoxicosis symptoms (months)MinimumMaximum
−6.26±4.64
018
Interval 1 (months)MinimumMaximum
11.05±2.566
19
10.82±2.916
18Interval 2 (months)MinimumMaximum
12.06±2.686
18
11.50±3.107
19Total follow-up period (months)MinimumMaximum
23.10±3.611432
23.32±4.001634
Total BMD increase(g/cm2) 0.039±0.021 0.051±0.029Total Ts increase (SD) 0.37±0.19 0.44±0.22
Group C-m: mean values (±SD) of the studied parametersParameter Baseline (1) Follow-up (2) Follow-up (3)TSH (mIU/l)MinimumMaximum
1.85±1.020.344.16
1.96±0.880.653.95
1.84±1,070.484.18
fT4 (pmol/l)MinimumMaximum
17.02±2.0513
21.35
16.13±1.9412.7319.37
15.99±2.3612.5020.60
BMD (g/cm2)MinimumMaximum
0.830±0.0670.6960.935
0.857±0.0610.7230.951
0.878±0.0610.7330.960
20
Parameter Baseline (1) Follow-up (2) Follow-up (3)Ts (SD)MinimumMaximum
-1.91±0.64-3.2
-1
-1.69±0.61-3
-0.8
-1.54±0.60-2.8-0.7
BMI (kg/m2)MinimumMaximum
25.06±3.2918.4730.02
25.36±3.4019.67
31
25.84±3.3919.1530.02
Ca (mg/dl)MinimumMaximum
8.99±0.448.15
10
9.13±0.708.33
10.48
9.27±0.598.15
10.55Ca++ (mg/dl)MinimumMaximum
4.08±0.363.624.76
4.32±0.363.704.92
4.29±0.273.804.73
P (mg/dl)MinimumMaximum
3.40±0.782.324.70
3.16±0.672.304.55
3.24±0.712.474.85
Mg (mg/dl)MinimumMaximum
2.36±0.371.753.00
2.41±0.391.703.00
2.34±0.271.852.96
AP (U/l)MinimumMaximum
88.80±34.3335
144
70.75±26.4039
131
68.90±28.8034
123
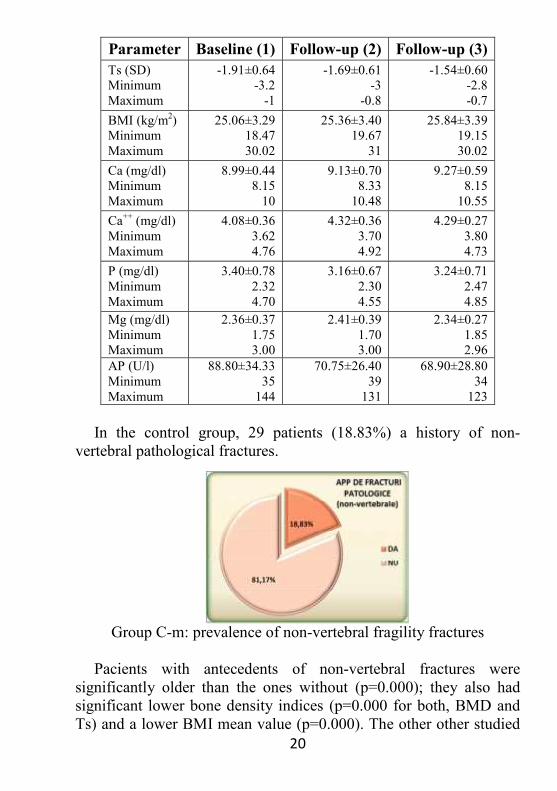
In the control group, 29 patients (18.83%) a history of non-vertebral pathological fractures.
Group C-m: prevalence of non-vertebral fragility fractures
Pacients with antecedents of non-vertebral fractures weresignificantly older than the ones without (p=0.000); they also hadsignificant lower bone density indices (p=0.000 for both, BMD andTs) and a lower BMI mean value (p=0.000). The other other studied

21
parameters were not significantly different in the fracture group.Although the mean values of TSH were lower in patients with
fractures, and the mean values of fT4were higher, the ANOVA testdid not find statistically significant differences between the twosubgroups (p=0.062 for TSH, p=0.067 for fT4).
To further explore the relationship between previuos fragilityfractures fractures and the thyroid function, we stratified the valuesof TSH and fT4 in quartiles and compared the prevalence of non-vertebral pathological fractures within these quartiles (chi-squaretest).
Group C-m: prevalence of non-vertebral fractures by TSH quartilesTSH quartiles Fracture history No fractures1 (0.300-0.800 mUI/l) 13 (29.55%) 31 (70.45%)2 (0.800-1.370 mUI/l) 8 (24.24%) 25 (75.76%)3 (1.370-2.550 mUI/l) 5 (13.16%) 33 (86.84%)4 (2.550-4.200 mUI/l) 3 (7.89%) 35 (92.11%)
Group C-m: prevalence of non-vertebral fractures by TSH quartiles
The chi-square test showed a significantly higher prevalence offragility fractures in the lowest TSH quartile (29.55%), incomparison to the highest quartile (7.89%, p=0.034). The fractureprevalence was similar in the other TSH quartiles.
Group C-m: prevalence of non-vertebral fractures by fT4 quartilesfT4 quartiles Fracture history No fractures1 (12.04-15.42 pmol/l) 3 (7.69%) 36 (92.31%)

22
fT4 quartiles Fracture history No fractures2 (15.42-16.99 pmol/l) 8 (21.05%) 30 (78.95%)3 (16.99-18.59 pmol/l) 6 (15.38%) 33 (84.62%)4 (18.59-22.00 pmol/l) 12 (32.43%) 25 (67.57%)
Group C-m: prevalence of non-vertebral fractures by fT4 quartiles
Statistical anlaysis demonstrated a significanly higher prevalenceof non-vertebral fragility fractures in the superior fT4 quartile(32.43%), in comparison to the lowest one (7.69%, p=0.007). Thefracture prevalence was similar in the other fT4 quartiles.
Group TX-m: the mean values (±SD) of the studied parametersParameter Baseline (1) Follow-up (2) Follow-up (3)TSH (mIU/l)MinimumMaximum
0.12±0.090.0010.270
1.48±0.920.304.13
1.63±0.810.294.00
fT4 (pmol/l)MinimumMaximum
41.53±23.9615.44
100
17.21±2.4612
22.01
17.40±2.3512.0822.60
BMD (g/cm2)MinimumMaximum
0.747±0.0910.5400.941
0.789±0.0880.5730.975
0.817±0.0870.5820.977
Ts (SD)MinimumMaximum
-2.64±0.83-4.6-1.0
-2.33±0.80-4.3-0.7
-2.13±0.76-4.2-0.6
BMI (kg/m2)MinimumMaximum
24.80±4.3817.0437.46
25.82±3.9318.2138.07
26.84±3.5519.2139.27

23
Parameter Baseline (1) Follow-up (2) Follow-up (3)Ca (mg/dl)MinimumMaximum
9.83±0.708.28
11.96
9.45±0.358.54
10.20
9.40±0.318.80
10.76Ca++ (mg/dl)MinimumMaximum
4.45±0.383.615.40
4.18±0.243.604.84
4.09±0.203.654.83
P (mg/dl)MinimumMaximum
3.59±0.702.305.80
3.19±0.462.214.70
3.21±0.472.304.62
Mg (mg/dl)MinimumMaximum
2.09±0.351.242.80
2.33±0.231.822.90
2.38±0.221.942.88
AP (U/l)MinimumMaximum
94.84±32.8236
191
76.82±22.3034
136
73.14±18.8934
144
In the study group, 29 patients (24.58%) had a history of non-vertebral pathological fractures.
Group TX-m: prevalence of non-vertebral fragility fractures
The mean TSH values were significantly lower in patients withnon-vertebral fractures (p=0.026), the fT4 values were higher butANOVA test revealed no statistically significant differences betweenthe two groups (p=0.246).
We stratified the fT4 and TSH values in quartiles and wecompared the prevalence of pathological fractures. Analysis showeda significantly lower prevalence of non-vertebral fragility fractures intop quartile of TSH (0%) than the other three quartiles (p = 0.006).Differences between the other TSH quartiles were not significant (p>0.05).

24
Group TX-m: prevalence of non-vertebral fractures by TSH quartilesTSH quartiles Fracture history No fractures1 (0.001-0.030 mUI/l) 10 (31.25%) 22 (68.75%)2 (0.300-0.100 mUI/l) 8 (27.59%) 21 (72.41%)3 (0.100-0.200 mUI/l) 11 (32.35%) 23 (67.65%)4 (0.200-0.270 mUI/l) 0 (0%) 23 (100%)
Group TX-m: prevalence of non-vertebral fractures by TSH quartiles
Group TX-m: prevalence of non-vertebral fractures by fT4 quartilesfT4 quartiles Fracture history No fractures1 (15.44-21.56pmol/l) 5 (17.86%) 36 (82.14%)2 (21.56-37.14 pmol/l) 8 (26.67%) 30 (73.33%)3 (37.14-56.32 pmol/l) 7 (23.33%) 33 (76.67%)4 (56.32-100.00 pmol/l) 9 (30.00%) 25 (70.00%)
Group TX-m: prevalence of non-vertebral fractures by fT4 quartiles
25
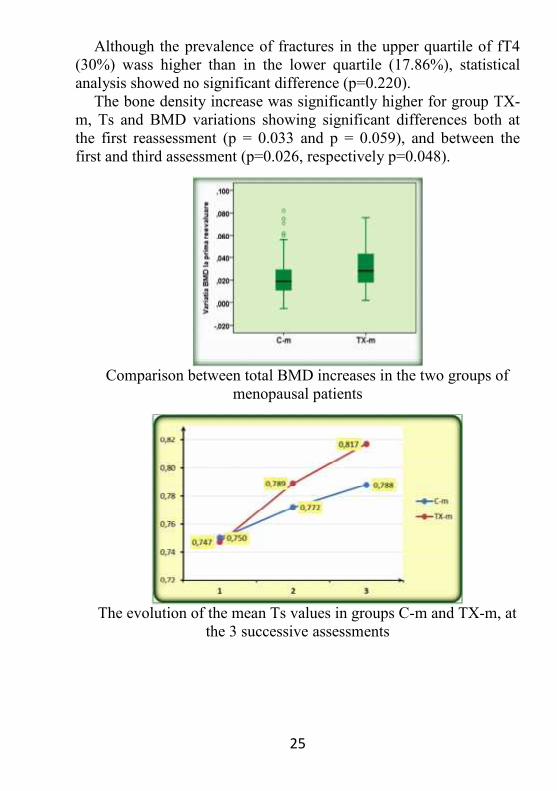
Although the prevalence of fractures in the upper quartile of fT4(30%) wass higher than in the lower quartile (17.86%), statisticalanalysis showed no significant difference (p=0.220).
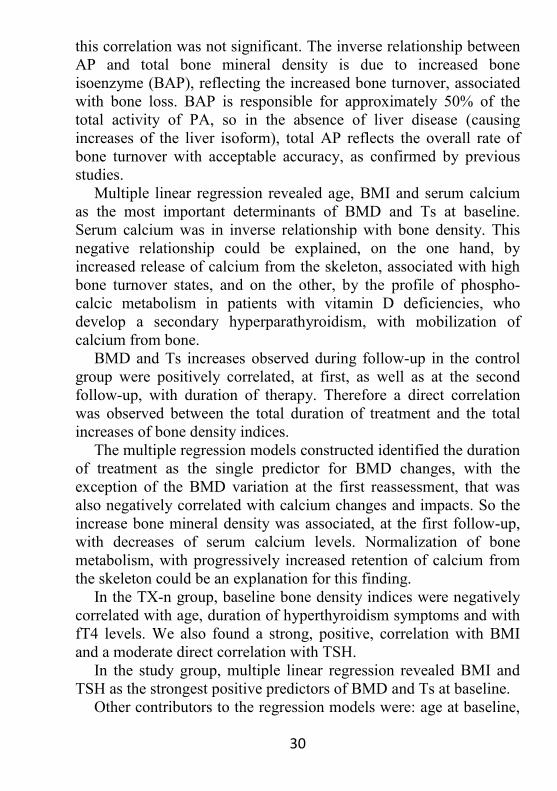
The bone density increase was significantly higher for group TX-m, Ts and BMD variations showing significant differences both atthe first reassessment (p = 0.033 and p = 0.059), and between thefirst and third assessment (p=0.026, respectively p=0.048).
Comparison between total BMD increases in the two groups ofmenopausal patients
The evolution of the mean Ts values in groups C-m and TX-m, atthe 3 successive assessments

26
6.2.3. Analysis of the postmenopausal groups receiving strontiumranelate (C-s, TX-s)
Baseline age, intervals between assessments and bone mineraldensity changes, for the postmenopausal groups receiving strontium
ranelateC-s TX-s
Baseline age (years)MinimumMaximum
65.06±9.145381
64.00±5.135374
Menopause onset (years)MinimumMaximum
47.75±2.594553
49.00±3.114554
Years since menopause (years)MinimumMaximum
17.31±10.234
34
15.00±6.275
26Duration of symptoms (months)MinimumMaximum
- 7.23±4.282
15Interval 1 (months)MinimumMaximum
11.19±3.107
17
11.15±2.268
16Interval 2 (months)MinimumMaximum
11.25±3.027
17
12.08±3.336
18Total follow-up period (months)MinimumMaximum
22.44±4.771431
23.23±5.021534
Total BMD increase (g/cm2)MinimumMaximum
0.086±0.0290.0400.150
0.115±0.0350.0580.171
Total Ts increase (SD)MinimumMaximum
0.70±0210.41.2
0.94±0.280.61.6
Group C-s: the mean values (±SD) of the studied parametersParameter Baseline (1) Follow-up (2) Follow-up (3)TSH (mIU/l)MinimumMaximum
1.772±0.9910.650
4.01
1.731±0.9840.5003.610
1.752±0.9140.6003.700

27
Parameter Baseline (1) Follow-up (2) Follow-up (3)fT4 (pmol/l)MinimumMaximum
17.05±2.8612.8421.98
17.02±2.5412.1920.40
17.75±2.5312.9021.69
BMD (g/cm2)MinimumMaximum
0.699±0.0720.5300.785
0.746±0.0690.5770.820
0.785±0.0720.6290.847
Ts (SD)MinimumMaximum
-3.20±0.68-4.7-2.5
-2.80±0.65-4.3-2.2
-2.50±0.65-3.8-1.9
BMI (kg/m2)MinimumMaximum
26.79±3.2020.2032.49
27.49±2.7321.6432.00
27.73±2.4022.5932.72
Ca (mg/dl)MinimumMaximum
9.36±0.408.75
10.47
9.27±0.518.46
10.36
9.24±0.448.51
10.15Ca++ (mg/dl)MinimumMaximum
4.20±0.323.594.77
4.10±0.323.584.80
4.15±0.283.694.50
P (mg/dl)MinimumMaximum
3.38±0.672.414.39
3.42±0.562.634.73
3.49±0.472.704.35
Mg (mg/dl)MinimumMaximum
2.30±0.221.802.68
2.32±0.231.932.78
2.43±0.281.902.90
AP (U/l)MinimumMaximum
76.69±19.7244
119
81.88±34.5051
198
83.88±26.5250
140
Group TX-s: the mean values (±SD) of the studied parametersParameter Baseline (1) Follow-up (2) Follow-up (3)TSH (mIU/l)MinimumMaximum
0.080±0.0640.0050.200
1.732±0.7650.6902.950
1.634±0.8000.8303.685
fT4 (pmol/l)MinimumMaximum
61.31±24.5825.44
100
18.69±2.6414.1522.14
18.07±2.2914.2521.31
BMD (g/cm2)MinimumMaximum
0.688±0.0570.5800.791
0.757±0.0550.6830.860
0.803±0.0550.7210.921
Ts (SD) -3.30±0.55 -2.70±0.54 -2.33±0.53

28
Parameter Baseline (1) Follow-up (2) Follow-up (3)MinimumMaximum
-4.4-2.5
-3.5-1.8
-3.2-1.4
BMI (kg/m2)MinimumMaximum
23.82±3.6418.0029.90
24.52±3.2919.9330.75
24.71±2.7120.4730.00
Ca (mg/dl)MinimumMaximum
9.82±0.528.95
10.61
9.09±0.578.33
10.25
9.14±0.368.539.79
Ca++ (mg/dl)MinimumMaximum
4.59±0.423.935.36
4.18±0.213.614.39
3.95±0.323.454.37
P (mg/dl)MinimumMaximum
3.76±0.812.674.80
3.64±0.602.504.50
3.72±0.602.654.78
Mg (mg/dl)MinimumMaximum
1.97±0.231.432.43
2.25±0.182.012.59
2.44±0.252.092.79
AP (U/l)MinimumMaximum
102.15±37.4052
173
102.46±29.3250
139
108.31±24.1469
140
The bone mass gain was significantly higher for group TX-s. Themean BMD and Ts were significantly higher both at the firstreassessment (p=0.000), and at the second (p=0.035 for BMD,p=0.014 for the Ts changes). Total increases of BMD and Ts, overthe entire monitoring period, were significantly higher in group TX-sas compared to C-s (p=0.005 for BMD and p=0.002 for Ts changes).
The evolution of the mean BMD values in groups C-s and TX-s,at the 3 successive assessments

29
6.3. Discussion and conclusions
6.3.1. Premenopausal groups (C-n and TX-n)In this group there were no pathological fractures
beforepresentation, or during the study. The mean age at baselinewas similar in the two groups (46.10 years in group C-n, respectively43.77 years in Tx-n).
The average values of body mass index were significantly lowerin group TX-n at the first two evaluations, but at the third assessmentwe no longer found significant differences from control. The BMIincrease is consistent with the remission of hypercatabolic statusassociated with thyrotoxicosis.
Total serum calcium, free calcium, serum phosphorus and alkalinephosphatase had significantly higher mean values at baseline ingroup TX-n, but until the first follow-up (after about 1 year)decreased significantly, so that they were similar, at bothreassessments, with those observed in group C-m. These differencesobserved at baseline, as well as the evolution in time of theseparameters, are consistent with data from other studies that haveassociated thyrotoxicosis with elevated serum levels of calcium,phosphorus and AP, and reported improvements after a few monthsto one year after initiating specific therapy.
Serum magnesium had significantly lower average values in thestudy group at presentation. Subsequently, the values increasedsignificantly and became similar with those found in the controlgroup.
The mean values of BMD and Ts measured at the lumbar spinewere discretely (not statistically significant) lower in group TX-n,and remained so throughout our study, although significantlyincreased at both the first and the second reassessments. In group C-n, significant increases of BMD and Ts were also observed at thefirst and second follow-up.
In the C-n group, the initial mean values of bone density indiceswere strongly and positively correlated with BMI, and negatively,weakly, with age. Also, there was a weak, negative, correlation,between the baseline T-score and alkaline phosphatase levels, whichhad average values in the range of reference in this group; for BMD,
30
this correlation was not significant. The inverse relationship betweenAP and total bone mineral density is due to increased boneisoenzyme (BAP), reflecting the increased bone turnover, associatedwith bone loss. BAP is responsible for approximately 50% of thetotal activity of PA, so in the absence of liver disease (causingincreases of the liver isoform), total AP reflects the overall rate ofbone turnover with acceptable accuracy, as confirmed by previousstudies.
Multiple linear regression revealed age, BMI and serum calciumas the most important determinants of BMD and Ts at baseline.Serum calcium was in inverse relationship with bone density. Thisnegative relationship could be explained, on the one hand, byincreased release of calcium from the skeleton, associated with highbone turnover states, and on the other, by the profile of phospho-calcic metabolism in patients with vitamin D deficiencies, whodevelop a secondary hyperparathyroidism, with mobilization ofcalcium from bone.
BMD and Ts increases observed during follow-up in the controlgroup were positively correlated, at first, as well as at the secondfollow-up, with duration of therapy. Therefore a direct correlationwas observed between the total duration of treatment and the totalincreases of bone density indices.
The multiple regression models constructed identified the durationof treatment as the single predictor for BMD changes, with theexception of the BMD variation at the first reassessment, that wasalso negatively correlated with calcium changes and impacts. So theincrease bone mineral density was associated, at the first follow-up,with decreases of serum calcium levels. Normalization of bonemetabolism, with progressively increased retention of calcium fromthe skeleton could be an explanation for this finding.
In the TX-n group, baseline bone density indices were negativelycorrelated with age, duration of hyperthyroidism symptoms and withfT4 levels. We also found a strong, positive, correlation with BMIand a moderate direct correlation with TSH.
In the study group, multiple linear regression revealed BMI andTSH as the strongest positive predictors of BMD and Ts at baseline.
Other contributors to the regression models were: age at baseline,

31
AP, fT4 and ionized calcium, as negative predictors. Belsing et al.,2010, described fT4as the strongest negative predictor of BMD in agroup of premenopausal women with Graves' disease.
At the first follow-up, increases of bone density indices werecorrelated strongly, positively, with the duration of therapy and withTSH raises. Also, they strongly correlated with the AP decreases. Inmultiple regression models, the AP changes were the strongestdeterminants of BMD and Ts increases, with a negative (inverse)impact on the model. Inverse correlation between changes in bonedensity and alkaline phosphatase after normalization of thyroid statusconfirms previous studies.
At the second follow-up, the increases bone density indicescorrelated only with the therapy duration, which was the onlydeterminant (with positive impact) in the regression models.
The BMD increase in group C-n was 3.25% in the first year (untilthe first follow-up) and of 2.53% in the second, a total of 5.78% overthe first examination (ie. after an average time of 23 months).
The BMD increase in group TX-n was 5.22% during the firstobservation period and 3.36% during the second, with a total of8.58% over the first evaluation; this gain was significantly higherthan that obtained in the control group.
Also, the T score increase in the study group (0.53 SD) wassignificantly higher than that observed in group C-n (SD 0.38, p=0.007) in the 23 months of therapy.
In conclusion, in our study, premenopausal hyperthyroid patientsshowed a faster bone mass gain, in comparinson to patients withosteoporosis / osteopenia and this was especially obvious during thefirst year after initiation of therapy.
So far, there have been few studies on the evolution of bonedensity in young tireotoxic, premenopausal patients, afternormalization of thyroid function. A 1997 study on 17 patients (14women before menopause and 3 men, with ages between 27 and 48years) has reported an increase in mean BMD at the lumbar spine ofapproximately 5.71% and 6.72% at the hip.
Another study analyzed by comparison the evolution of a group of45 hyperthyroid patients, stratified by sex, menopausal status andtype of therapy received (antithyroid drugs or antithyroid drugs plus
32
salmon calcitonin) at 0, 9 and 18 months of treatment. The authorsreported significant increase in bone density in all groups, includingnon-menopausal women, but this gain was limited to the first 9months of treatment. Furthermore, this study has revealed nodifference in bone mass or bone turnover markers changes betweenwomen and men, women before menopause or after, or depending onthe association of antiresorptive therapy.
Belsinget al., 2010, have analyzed the evolution of 32premenopausal women diagnosed with Graves-Basedow disease,after 18 months of treatment with antithyroid drugs and found amean T score increase at lumbar level of 0.8 SD.
6.3.2. The postmenopausal groups (C-m and TX-m)Menopause may exacerbate the bone loss in thyrotoxicosis,
through the synergistic effects on bone, of the hypogonadism withincreased levels of thyroid hormones.
In our study group, mean age at baseline was similar in the twogroups (61.75 years for group C-m, respectively 61.23 years for T-x).Age at menopause onset was significantly higher in the study group.There were no significant differences between TX-m and C-m interms of environment of origin, smoking, or alcohol consumption.
The prevalence of fragility fractures was slightly (notsignificantly) lower in control group.
The interval until the first follow-up was similar (approximately11 months) for the two groups, as well as the interval to the secondfollow-up (about 12 months). All the patients received calcium andvitamin D. 75 (49.02%) patients in group C-m and 39 (33.05%) inTX-m also received alendronate
The mean values of body mass index were significantly lower ingroup TX-m at the first two assessments and, although increasedduring follow-up, they remained significantly lower than thoseobserved in control group.
Total serum calcium, ionized calcium, phosphorus and alkalinephosphatase had significantly higher mean values at baseline ingroup TX-m. These differences observed at baseline are consistentwith data from other studies that have associated thyrotoxicosis withelevated serum levels of calcium, phosphorus and AP.
Subsequently, the average values of total serum calcium decreased

33
and became comparable with those obtained in group Cm. The ioniccalcium values decreased significantly and, although at the firstreassessment they were still significantly higher than the controlgroup, at the second follow-up, free calcium values weresignificantly lower those found in the C-m group. These differencescould be explained by poor adherence of the patients to the treatmentwith calcium and vitamin D preparations.
The mean values of serum phosphorus decreased significantly ingroup TX-m, so that they were statistically similar with those foundin the control group, at the first and the second follow-up. APdeclined steadily and significantly at both reassessments, but wasstill significantly higher in the study group than in C-m at the firstfollow-up; at the second follow-up, AP was comparable in the twogroups. This evolution is consistent with data from other studies,describing an increase in alkaline phosphatase in the first 3 months oftreatment, followed by a slow decrease, over several months(sometimes more than 12 months), the persistence of increasedvalues reflecting a high rate of osteoformation. Mean values of serumMg were significantly lower in the study group at baseline.Subsequently, the magnesium mean values increased significantlyand became similar with those found in the control group.
The mean values of BMD and Ts at the lumbar spine werediscretely (not significantly) lower at baseline in group TX-m, butincreased significantly, so that they were statistically higher thanthose in group C-m, at the first reassessment, as well as at thesecond.
In the control group, significant increases were observed in BMDand Ts at the first follow-up, as well as at the second (p=0.000),although the observed values remained below those found in theTX-m group.
Comparing the values of the studied parameters in patients with ahistory of pathological fractures, in the group C-m, with thoseobserved in the patients without fractures, we found that history offractures was significantly associated in the control group, with olderage, longer duration of postmenopause, and lower mean values ofBMD and Ts, as well and a lower body mass index (p=0.000 for allspecified parameters). So we did not detecte significant differences in

34
TSH and fT4 mean values between the euthyroid subgroups with andwithout a history of fractures.
But strtifying the TSH values in group C-m, we found asignificantly higher prevalence of pathological fractures in the lowestquartile of TSH, in comparison to the highest, suggesting that thehigh-normal TSH values could exert a protective effect against therisk of fractures, while the values of within lower limit of normalmay predispose to fragility fractures. These results are, for the mostpart, consistent with data from other studies: Mazziotti et al., 2010, ina retrospective study of 130 postmenopausal women, reported a highprevalence of pathological fractures in euthyroid patients with TSHin the lower tertile.
Also, in euthyroid patients, our statistical analysis revealed asignificantly higher prevalence of pathological fractures in the upperquartile of fT4, in comparison to the lowest quartile. These resultsare also consistent with some data reported by other authors: in theOPUS study (The Osteoporosis and Ultrasound Study), 2010,including 2374 postmenopausal euthyroid patients, the authorsdescribed an increased risk of non-vertebral fractures in patients withhigh-normal circulating levels of fT4 or fT3.
In the TX-m group, the subgroup of patients with a history ofpathological fractures had the same characteristics with thosedescribed in the control group and in addition, had a longer durationof thyrotoxicosis symptoms (as compared to the hyperthyroidpatients without fractures), significantly lower TSH values, andsignificantly higher mean values of total serum calcium andphosphorus. No statistically significant differences were found in fT4values, according to history of fractures.
We compared, within the TX-m group, the subgroup withsubclinical thyrotoxicosis, with the subgroup with overtthyrotoxicosis. Subclinical hyperthyroidism was associated withsignificantly higher values of TSH, the BMD, Ts, BMI and the serumMg at baseline, and with significantcantly lower values of Ca, P andAP. The prevalence of pathological fractures was statistically similarin the two subgroups. In patients with subclinical thyrotoxicosis,history of fractures did not associate with significant differences inTSH, fT4, or the duration of symptoms, while in the subgroup with

35
overt thyrotoxicosis, the patients with fragility fractures had lowerTSH values and longer durations of symptoms before presentationcompared to those without history of fracture.
At folloe-up, the only significant differences between patientswith subclinical thyrotoxicosis and those with overt hyperthyroidismwere higher mean BMD, Ts and BMI values, found in the group withsubclinical thyrotoxicosis.
In group C-m, the initial values of bone density indices showed aweak, positive, correlation with BMI and a negative one with age andyears elapsed since menopause. This negative correlation betweenbone density and duration of estrogen deprivation is already a knownfact, and many studies have described very similar results with ours,with the years of menopause being a stronger predictor for bone massthan age.
Multiple linear regression revealed BMI and years sincemenopause as the only significant determinants of baseline BMD andTs, in group C-m.
The BMD and Ts increases observed at the first follow-up in thecontrol group showed the most significant correlation with theduration of therapy. They also were negatively correlated with APchanges and positively, with the variation in BMI. We also detectedweak negative correlations between increased BMD on the one hand,and variations of total and ionized calcium on the other hand, andbetween T score changes and serum phosphorus changes. At thesecond follow-up, the only significant correlation was the positiveone, between the duration of therapy and the increase of BMD,respectively Ts.
Multiple regression models have showed that the strongestpredictor for changes in bone density at the first follow-up was theduration of therapy; other factors with significant impact on themodels were: BMI changes (positively correlated with BMD and Ts),calcium and phosphatase alkaline variations (negative correlations).At the second follow-up, duration of treatment was still the strongestpredictor, to the variations of bone density also contributed the BMI(positive correlation) and calcium (negative correlation) changes.
In the TX-m group, baseline bone density indices were negatively,moderately, correlated with the fT4 values and with the symptoms

36
duration. Other negative (weak) correlations, were detected with age,years since menopause, serum ionized calcium and alkalinephosphatase. Bone density indices were positively, strongly,correlated with TSH and BMI. These results confirm the positiveassociation, found by other authors, between TSH and BMD intireotoxic postmenopausal women; the inverse relation between fT4and BMD has been inconsistently reported in the literature.
Multiple linear regression showed that TSH was the strongestpositive predictor of baseline BMD and Ts in the study group. Otherdeterminants in these models were: the duration thyrotoxicosissymptoms, AP and years since menopause. The fT4 values had nosignificant contribution to these models.
At the first follow-up, the bone mass increases in the study groupwere positively correlated with the duration of therapy, with TSHincrease and with BMI changes. They also correlated with fT4 andionized calcium decrease; T score changes negatively correlated withthe changes in alkaline phosphatase. In multiple regression models,the TSH change was the strongest determinant for increases in BMDand Ts, with a positive impact on the model. The variations in bonedensity indices were positively correlated with the duration oftreatment, and BMI changes. In the multiple regression model forBMD changes, the AP variations also had a negative impact.
At the second follow-up, bone mass gain correlated only with theduration of therapy. In the linear regression models, the predictorsfor BMD and Ts changes were the duration of therapy and decreasein alkaline phosphatase.
The BMD gain in group C-m was 2.93% during the first year(until the first follow-up) and of 2.27% during the second, a total of5.20% over the first examination (ie. after an average of 23 months).
The BMD increase in the TX-m group was 5.62% over the firstperiod and 3.74% over the second,with a total of 9.37% over thefirst evaluation, this gain being significantly higher than thatobtained in the control group.
Also, the T score increase in the study group (0.44 SD) wassignificantly higher than that obtained in group C-n (0.37 SD),during the 23 months of therapy.
Existing data regarding the evolution of bone mineral density

37
under treatment are not always congruent and consistent. A studyfrom 1979 reported complete normalization of BMC in the forearm,in 33 patients hyperthyroid treated with antithyroid drugs. Diamondet al., reported an increase in lumbar BMD (measured by DXA) of6.6% after a year of treatment, in 15 female patients, opf which 6were postmenopausal. Another group described a mean increase inlumbar spine BMD by 11.3% in 3 years after initiation of therapy forhyperthyroidism. A 2008 study reported a 5.9% increase in lumbarBMD in hyperthyroid patients treated with metimazole.
6.3.3. The postmenopausal groups receiving strontium ranelate(C-s and TX-s)
Strontium binds to hydroxyapatite and accumulates in bone tissue,in amounts proportional with duration of therapy. Because DXAmeasurements are based on calcium content of bone, the presence ofstrontium, which has a higher atomic weight, increases thedetermined values, these increases being correlated with theproportion of strontium in the tissue. Therefore, assessment of BMDby the DXA method in patients treated with strontium ranelateoverestimates bone density. Currently, it is sought to introduce acorrection factor for BMD measurements in these patients. DXA stillretains its usefulness in monitoring the antiosteoporosis therapy.
The mean values of body mass index were significantly lower ingroup TX-s at baseline and remained so and at the tworeassessments.
Free and total calcium, serum phosphorus and alkalinephosphatase mean values were significantly higher at baseline ingroup and TX-s. By the first follow-up (after about 11 months) totaland ionic calcium were significantly decreased, and at the secondreassessment there was an insignificant total calcium increase and asignificant ionized calcium decrease. At both reassessments, theaverage calcium values were similar with those observed in the C-sgroup, which also decreased (although insignificantly).
Serum phosphorus had a significant descendant trend in groupTX-s, at the first follow-up (probably due to normalization of thyroidstatus), then increased discreetly, while in the control group its meanvalues increased insignificantly, but continuously, so that the mean

38
values were statistically similar in the study group and controls atboth reassessments.
PA average values remained superior to control group and the firstreassessment, and at the latter it had a discrete upward trend in bothgroups. Changes in phospho-calcic metabolism parameters describedabove are most likely due to the effects of strontium ranelatetreatment, which lowers serum calcium and phosphorus andincreases alkaline phosphatase. In the TX group these effects wereprobably summed with the effects of thyroid function normalization,causing a steeper decrease of total and free calcium, despite therapywith calcium and vitamin D preparations.
Serum magnesium mean values was significantly lower in thestudy group at baseline. Subsequently, the values increasedsignificantly, and the average values became similar with thosefound in the control group, following the normalization of thyroidstatus.
The mean values of BMD and Ts at the lumbar spine werediscretly lower in the TX-s group, they significantly increased both atthe first follow-up, and at the second. At the first reassessment, theaverage values of bone density indices were statistically similar withthose observed in group C-s; at the second, BMD was insignificantlyhigher than in control group, while T-score was significantly higherthan average values of C-s.
In the C-s group we also observed significant increases in BMDand Ts the first and second follow-up. The other studied parametersshowed no statistically significant variations between examinations.
In the C-s group, baseline bone density indices were moderately,inversely correlated with age and postmenopausal period. T scorewas also inversely correlated with age at menopause onset. Multiplelinear regression revealedyears since menopause, age and BMI asdeterminants of BMD and Ts at baseline.
The BMD and Ts increases observed during follow-up in groupC-s were positively correlated, at first and second secondreassessment, only with duration of therapy. Therefore a direct,strong, correlation was observed, between the total duration oftreatment and total bone density gain.
Multiple regression models showed that the single predictor for

39
bone density changes was the duration of therapy, with the exceptionof the BMD variation at the first reassessment where BMI changesalso had a positive impact on the model.
In the TX-s group, baseline bone density indices were negatively,strongly, correlated with age, menopause duration and moderatelywith the duration of thyrotoxicosis symptoms. They were positively,strongly, correlated with TSH. Multiple linear regression revealedage and TSH as the strongest predictors for baseline BMD and Ts inthe study group. In the model constructed for baseline Ts, the APalso contributed, as a negative predictor.
At the first follow-up, bone density increases were strongly,positively, correlated with duration of therapy, with ther TSHincrease and with BMI changes. In multiple regression models, theduration of treatment was the strongest determinant for the BMD andTs variations. The model we built for BMD variations was alsoinfluenced by TSH and BMI changes (these parameters correlatedpositively with bone density).
At the second follow-up, bone density increases correlated onlywith the duration of therapy, which was also the only determinant(with positive impact) in the regression model for Ts changes. Theregression model for BMD changes was also influenced by thechanges in BMI.
In the C-s group the BMD increase was 6.72% after the first year(until the first follow-up) and 5.58% after the second, a total gain of12.30% over the first examination (after an average of 23 months).
The BMD increase in group TX-s was 10.03% during the firstperiod and 6.69% during the second, with a total of 16.72% over thefirst evaluation; this gain was significantly higher than that obtainedin the control group.
Also, the T score increase in the study group (0.94 SD) wassignificantly higher than that obtained in the C-s group (0.70 SD),after 23 months of therapy.
The clinical phase III study SOTI (Spinal OsteoporosisTherapeutic Intervention-tion, 2004), including 1649 patients withpostmenopausal osteoporosis on therapy with strontium ranelate 2 g /day, reported a mean increase in lumbar spine BMD of 14.40 % after3 years. A meta-analysis from 2006 identified two clinical trials of
40
strontium ranelate 2 g/day, in osteoporotic postmenopausal women,the mean increased the authorsreported, was 11.29% in the lumbarBMD after 2 years, a value comparable with that obtained by us inthe group C-s.
We found no published study on the evolution of thyrotoxicosteoporosis with strontium ranelate treatment.
In our study, the prevalence of non-vertebral fragility fractures inpostmenopausal women was similar between euthyroid patients withosteoporosis/osteopenia, those with subclinical, respectively overthyperthyroidism.
In all studied groups, bivariate and multiple linear regressionshowed a significant impact of thyroid dysfunction on bone mineraldensity (reflected by significant correlations between TSH and fT4on the one hand, and bone density indices on the other), but wedetected no significant relationship between thyroid function andmineral density in euthyroid patients. In thyrotoxic patients, Ts andBMD were more strongly correlated with TSH than with fT4,suggesting an independent and consistent role of thyrotropin in bonemass loss.
On the other hand, although in euthyroid patients a linearrelationship between mineral density and thyroid function parameterswas not found, the values located in the extremes of the referencerange (the lower quartile of TSH and the upper quartile of fT4) seemto be risk factors for pathological fractures. In our study, bonemineral density was significantly correlated with age, BMI andyearssince menopause, in euthyroid patients. These are widely accepteddeterminants of bone mass and fracture risk.
It is noteworthy that we also identified negative, significantcorrelations between the duration hyperthyroidism symptoms andbone mineral density in all studied groups. Our results thus suggestthat bone loss is greater with more severe and more prolongedthyrotoxicosis.
In all groups of thyrotoxic patients, we found an increase in BMIthroughout the follow-up, most significant during the first period (ie.in the first year after initiation of therapy). These results areconsistent with those reported in literature (Dale et al., Brunova etal.) and are the logical consequence of improving the hypercatabolic

41
status of thyrotoxicosis. One explanation for more rapid weight gainduring the first year after initiation of therapy would consist in ametabolism decrease, along with the persistence, for several months,of increased appetite and caloric intake. Abid et al. quantified afurther decrease in food intake, associated with slow weight gain. Inour groups, BMI changes between the second and third assessementwas insignificant.
It is likely that consistent weight gain contributes to theimprovement of bone mass after normalization of the thyroid statusby increasing protein anabolism and by enhancing peripheralestrogen synthesis in adipose tissue, as well as by increasing themechanical forces acting on the skeleton, optimizing boneremodelling.
In all three groups, bone mass gain after therapy initiation wasfaster in the heperthyroid patients than in the euthyroid ones, and itwas associated with decreases in alkaline phosphatase, serumcalcium and phosphorus.
CHAPTER 7. PROSPECTIVE STUDY ON THEEVOLUTION OF BONE MINERAL DENSITY IN
THYROTOXIC PATIENTS
7.1. Stratification of the studied groups
The prospective study analyzed the evolution of bone mineraldensity (regardless of its value at baseline) in patients with newlydiagnosed thyrotoxicosis, during January-March 2011, after 6months of treatment. We aimed to compare the group who achievedand maintained euthyroidism (A), with the patients who remainedhyperthyroid under therapy (B).
Were excluded from the study all patients who had a history offractures (either pathological or traumatic). In each patient, weassessed: TSH, fT4 Lumbar spine BMD and T score (L1-l4) Hip BMD and T score Femoral neck BMD and T score

42
Whole body BMD and T score phospho-calcic metabolism parameters (total calcium, ionized
and urine calcium, phosphorus, magnesium) Alkaline phosphatase
Group stratification at the 6 months follow-up
7.2. Results
Baseline mean values (±SD) of the studied parametersParameter Mean±SD Parameter Mean±SD
Baseline age (years)MinimumMaximum
43.42±13.432269
Whole body BMD(g/cm2)MinimumMaximum
0.988±0.0990.7651.114
Duration of thyrotoxicosissymptoms (months)MinimumMaximum
5.50±4.690
18
Whole bodyTs (SD)MinimumMaximum
-1.18±1.36-4.10.9
TSH (mIU/l)MinimumMaximum
0.057±0.0540.0010.190
BMI (kg/m2)MinimumMaximum
22.90±3.0717.9030.12
fT4 (pmol/l)MinimumMaximum
59.67±28.4218.12
100
Ca (mg/dl)MinimumMaximum
10.29±0.528.64
11.37Lumbar BMD (g/cm2)MinimumMaximum
0.872±0.1420.6021.082
Ca++ (mg/dl)MinimumMaximum
4.63±0.483.655.62
Lumbar Ts (SD)MinimumMaximum
-1.59±1.29-3.70.3
P (mg/dl)MinimumMaximum
4.02±0.742.305.90
Hip BMD (g/cm2) 0.844±0.166 Mg (mg/dl) 1.91±0.23

43
Parameter Mean±SD Parameter Mean±SDMinimumMaximum
0.5751.188
MinimumMaximum
1.612.42
Hip Ts (SD)MinimumMaximum
-0.78±1.36-3.02.0
AP (U/l)MinimumMaximum
114.63±44.6852
251Femoral neck BMD (g/cm2)MinimumMaximum
0.626±0.1820.3761.175
Calciuria (mg/day)MinimumMaximum
301.90±137.5778
539Femoral neck Ts (SD)MinimumMaximum
-0.89±1.52-3.13.8
Of the total study group, 20 patients (38.46%) werepostmenopausal and 32 (61.54%) were premenopausal. The meanage at menopause onset was 46.20±4.59 years. We comparativelyanalyzed baseline parameters for the two subgroups. The results arefound in the table below.
Comparison of mean values of the studied parameters at baseline,between pre-and postmenopausal subgroups
Parameter Premenopause(n=32)
Postmenopause(n=20) p
Baseline age(years) 35.31±10.03 56.40±5.67 0.000Duration of thyrotoxicosissymptoms (months) 5.25±4.68 5.80±4.78 0.631
TSH (mIU/l) 0.067±0.059 0.040±0.040 0.078fT4 (pmol/l) 58.68±26.52 61.24±31.89 0.755Lumbar BMD (g/cm2) 0.913±0.117 0.807±0.158 0.007Lumbar Ts (SD) -1.25±1.13 -2.12±1.39 0.017Hip BMD (g/cm2) 0.870±0.166 0.804±0.164 0.168Hip Ts (SD) -0.55±1.31 -1.14±1.40 0.127Femoral neck BMD (g/cm2) 0.669±0.170 0.557±0.181 0.028Femoral neck Ts (SD) -0.52±1.43 -1.50±1.51 0.023Whole body BMD (g/cm2) 1.012±0.070 0.951±0.124 0.029Whole body Ts (SD) -0.74±0.98 -1.77±1.53 0.005BMI (kg/m2) 22.30±2.70 23.85±3.45 0.079Ca (mg/dl) 10.30±0.44 10.29±0.63 0.971Ca++ (mg/dl) 4.60±0.52 4.67±0.41 0.563P (mg/dl) 3.93±0.67 4.16±0.83 0.262Mg (mg/dl) 1.92±0.22 1.87±0.18 0.279AP (U/l) 114.31±45.92 114.75±43.60 0.973Calciuria (mg/day) 294.63±137.28 327.55±101.30 0.134

44
Significant differences with significance threshold 0.01 are highlighted in greenSignificant differences with significance threshold 0.05 are highlighted in yellow
No statistically significant differences were found between thesubgroup that reached euthyroid state (A) and that of patients whoremained hyperthyroid (B); all evaluated parameters were similar atbaseline.
Comparisons of mean values of the studied parameters,at baseline, between subgroups A and B
Parameter Group A(n=31)
Group B(n=20) p
Baseline age(years) 42.81±12.90 44.33±14.46 0.692Duration of thyrotoxicosis symptoms(months) 5.58±4.58 5.38±4.96 0.882
TSH (mIU/l) 0.052±0.050 0.065±0.060 0.393fT4 (pmol/l) 58.68±26.52 61.24±31.89 0.183Lumbar BMD (g/cm2) 0.869±0.145 0.877±0.143 0.846Lumbar Ts (SD) -1.60±1.29 -1.57±1.33 0.929Hip BMD (g/cm2) 0.845±0.168 0.844±0.168 0.977Hip Ts (SD) -0.77±1.38 -0.79±1.38 0.944Femoral neck BMD (g/cm2) 0.621±0.176 0.636±0.193 0.809Femoral neck Ts (SD) -0.93±1.48 -0.83±1.62 0.821Whole body BMD (g/cm2) 0.988±0.099 0.989±0.099 0.966Whole body Ts (SD) -1.10±1.30 -1.19±1.35 0.793BMI (kg/m2) 22.69±3.02 23.21±3.20 0.551Ca (mg/dl) 10.25±0.56 10.36±0.46 0.458Ca++ (mg/dl) 4.64±0.47 4.61±0.50 0.883P (mg/dl) 4.04±0.67 3.98±0.84 0.779Mg (mg/dl) 1.90±0.23 1.93±0.24 0.732AP (U/l) 117.52±47.55 110.00±40.57 0.556Calciuria (mg/day) 304.16±146.99 298.57±125.80 0.887
Comparison of mean values of the studied parameters,at follow-up, between subgroups A and B
Parameter Group A(n=31)
Group B(n=20) p
TSH (mIU/l) 1.174±0.999 0.102±0.077 0.000fT4 (pmol/l) 17.72±3.05 49.32±5.54 0.000BMD coloană lombară(g/cm2) 0.886±0.143 0.876±0.138 0.695
Ts coloană lombară (SD) -1.46±1.28 -1.63±1.33 0.588

45
Parameter Group A(n=31)
Group B(n=20) p
BMD hip (g/cm2) 0.860±0.166 0.834±0.165 0.439Ts hip (SD) -0.65±1.36 -0.87±1.35 0.455BMD col femural(g/cm2) 0.636±0.175 0.624±0.192 0.595Ts col femural(SD) -0.82±1.47 -0.92±1.62 0.601BMD total (g/cm2) 0.988±0.099 0.989±0.099 0.356Ts total (SD) -1.00±1.28 -1.31±1.28 0.243BMI (kg/m2) 22.97±2.67 23.28±2.93 0.737Ca (mg/dl) 9.86±0.65 10.33±0.53 0.006Ca++ (mg/dl) 4.39±0.49 4.62±0.46 0.049P (mg/dl) 3.82±0.68 4.08±0.72 0.046Mg (mg/dl) 2.05±0.27 1.90±0.19 0.041PA (U/l) 105.13±38.46 118.35±46.33 0.417Calciuria (mg/24 h) 242.74±111.77 307.33±123.77 0.040
Significant differences with significance threshold 0.01 are highlighted in greenSignificant differences with significance threshold 0.05 are highlighted in yellow
BMD and Ts decreased in group B, while in group A theyincreased (p <0.01 for all examined regions of interest).
Comparison of mean changes in lumbar and whole body BMDbetween subgroups A and B, at follow-up
7.3. Discussion
Baseline bone density indices were correlated negatively with ageand positively with BMI, in all examined regions. We found positivecorrelations of BMD and Ts with TSH and negative correlations withfT4 levels, and duration of thyrotoxicosis symptoms, at all evaluatedlevels.

46
Also, urinary calcium showed negative correlations with BMDand Ts measured; alkaline phosphatase levels correlated inverselywith bone density at the hip and the entire skeleton.
At the 6 months follow-up, 21 patients were still hyperthyroid,and they constituted the subgroup B. We observed a higherfrequency of the patients from rural areas in this group; it is possiblethat less easy access to medical services, for treatment monitoring, orpoor compliance are factors that have contributed to the lack ofsuccess of the therapy.
Analyzing the evolution of subgroup A (patients achievedeuthyroidism) we found significant increases in all indices of bonedensity, in comparison to the first assessment, reflecting decreasedbone turnover and remodelling rebalance, in favor osteoformation, inparallel with thyroid function normalization.
We also found a significant increase in body mass index,consistent with the reversal of the thyrotoxic hypercatabolic state,and a significant increase in serum Mg. Total, free and urinarycalcium, serum P and AP decreased significantly in subgroup Auntill follow-up.
In group A, the bone density increase, at all examined levels, wasstrongly correlated with the TSH increase, suggesting that thyroidstatus affects both, cancellous and cortical bone metabolism.
In our study, fT4 variations were not significantly correlated withthe changes in bone density after reaching euthyroidism. The bonemass gain was positively correlated with changes in body mass index(weight increase was associated with BMD and Ts increases) andnegatively with serum calcium levels (low serum calcium wasassociated with increases in BMD and Ts). Also, negativecorrelations were found with the calciuria and serum phosphorus.
We analyzed, in subgroup A, the differences between pre- (n=21)and postmenopausal (n=10) patients, at follow-up. We found only thepersistence significantly of lower mineral density in postmenopausalpatients, in the lumbar spine and thewhole body; no other significantdifferences were found between the mean values of the studiedparameters.
In subgroup B, there was a significant decrease of fT4 values atfollow-up, though they remained above the upper limit of reference.

47
despite therapy. These patients had significant decreases in BMD andTs in the hip, femoral neck and the entire skeleton, reflectingincreased bone turnover. There were no significant changes in thephospho-calcic metabolism parameters.
In subgroup B, we have identified direct correlations between thechanges in bone density and those of TSH and BMI, and inversecorrelations with the variations and fT4 (for spine, femoral neck andwhole body Ts and BMD). We also observed weak correlationsbetween changes in bone density and calciuria variantions.
We found no statistically significant differences between pre- (n =9) and postmenopausal patients (n = 12) in subgroup B, at follow-up.
At follow-up, in addition to significant differences in thyroidstatus, which were the criteria for the establishment of the groups, wefound significantly higher mean values of total calcium, ionized andurinary calcium, and serum phosphorus in group B; magnesemia wassignificantly lower (although within the reference range) in subgroupB, compared to A. No significant differences were detected betweenthe Ts and the BMD values at any of the regions examined. Also,alkaline phosphatase had similar mean values in the two subgroups.
These changes in the phospho-calcic metabolism reflect thenormalization of thyroid status in subgroup A, associated withreduced bone turnover and increased mineral retention in theskeleton, resulting in decreases in serum calcium and phosphorus,also, attainment of euthyroidism is associated with a markeddecrease in urinary calcium excretion. AP tends to remain high in thefirst months after obtaining euthyroidism, due to the amplifiedactivity of isoenzyme BAP, reflecting the acceleration ofosteoformation during this period.
In our study, the average magnesium values were significantlylower in thyrotoxic patients, in comparison to those who achievedeuthyroidism. These observations are consistent with previousreports, which associated hyperthyroidism with enhanced urinaryexcretion of magnesium and decreased plasma levels, changesreversible with the normalization of thyroid status.
Some authors described a significant increase of PTH during thefirst year of therapy of hyperthyroidism, and this could contribute tothe changes in mineral metabolism described in our study.

48
Comparing the mean variations of the studied parameters,between the two subgroups, divergent trends were observed: insubgroup B, all indices of bone density tended to decrease, whilethey increased in subgroup A, therefore the differences werestatistically significant.
In our study, persistent thyrotoxicosis favored the continued lossof bone, while balancing the thyroid status led to bone massrecovery, evident even in the first 6 months of treatment. Thepositive correlation of bone density changes with TSH variations andthe negative one, with the fT4 variations is an argument that supportsthe causal relationship between thyroid function normalization andbone density recovery.
Although there are still relatively few studies on the evolution ofbone density in hyperthyroid patients, heterogeneous in terms ofinclusion criteria and the type and duration of applied treatments,their results are largely similar with those obtained by us. A 1997study reported significant increases in BMD in the spine, femoralneck and Ward's triangle, after 9 months of therapy, regardless oftherapeutic modality used (antithyroid drugs or antithyroid drugs incombination with calcitonin), the sex of subjects and the pre- orpostmenopausal status.
Other studies also described significant increases in bone mineraldensity, evaluated in different anatomical regions, after treatment ofhyperthyroidism: Wakasugi et al. reported significant increases inBMD measured by DXA at the lumbar spine, after treatment withantithyroid drugs with a median duration of 11 months, in 15hyperthyroid patients. Diamond et al. reported a significant increasein lumbar BMD (measured by DXA) after 1 year of treatment, in 15patients, van de Ven et al. showed significant increases in BMD(DXA) in the spine, hip and femoral neck, in 22 hyperthyroidpatients (women and men), after 1 year of therapy with a block-and-replace regimen; Belsing et al., 2010, described substantial increasesin bone mineral density in the spine and hip (DXA), in 32premenopausal women with Graves-Basedow disease, after the first18 months of therapy with antithyroid drugs.

49
CHAPTER 8. FINAL CONCLUSIONS
If untreated, thyrotoxicosis is a major cause of secondaryosteoporosis, but in the context of modern medicine, prompt andeffective diagnosis and therapy are available, thus bone loss isrelatively insignificant and rapidly reversible.
In our study, there were no significant differences at baseline inage, area of origin, smoking or alcohol consumption between controland study groups, thus we can exclude the influence of lifestylefactors related to the differences between these groups. Theretrospective study, covering a period of about two years, showedthat the recovery of BMD and Ts with appropriate therapy issignificantly faster in patients with thyrotoxic osteopenia orosteoporosis, compared to those with primary osteopenia/osteoporosis. In both cases, the gain is faster during the first year,then it tends to slow down. The BMD and T score increases weredirectly proportional with the duration of therapy, and thisrelationship was most obvious in the case of thyrotoxic patients.
Our results, obtained both from retrospective studies, and from theprospective one, have demonstrated a constant, positive correlation,evidenced in all examined regions, between bone mineral density andTSH levels, in all groups of thyrotoxic patients (pre- andpostmenopausal, with overt or subclinical hyperthyroidism),suggesting that the severity of thyrotoxicosis is a factor determiningthe amplitude of bone loss.
Although a subjective parameter, we introduced in our study theself-reported duration of thyrotoxicosis symptomsbeforepresentation, to reflect the duration of untreated disease. Patientsassessed the time elapse since the emergence of disturbingmanifestations (weight loss, palpitations, insomnia, tremor, agitation,thermofobia), in months. In all groups, the average symptomduration was about 6 months, and this time significantly andnegatively correlated with baseline BMD and Ts. So it seems that theduration of hyperthyroidism is a key factor in bone loss, and that iswhy promptness of diagnosis and therapy is particularly important inthyrotoxicosis for preserving bone density, especially inpostmenopausal women.

50
The retrospective study suggested a discrete, but statisticallysignificant increase of the fracture prevalence in thyrotoxic andeuthyroid patients, with TSH values in the lower quartile, confirmingprevious findings. The prevalence of pathological fractures wassimilar in the subgroups of menopausal patients, with overt,respectively subclinical thyrotoxicosis, suggesting that subclinicaldysthyroidism also increases fracture risk, thus requiring closeclinical monitoring and appropriate therapy, maintain TSH in thereference range.
The prospective study showed that the attainment of euthyroidismis correlated with a significant increase in bone density indices, whilethe in patients with persistent hyperthyroidism, bone mass continuesto deteriorate.
Selected references1. Murphy E, Williams GR. The thyroid and the skeleton. Clin Endocrinol (Oxf);61(3): 285-98, 20042. Vestergaard P, Mosekilde L. Hyperthyroidism, bone mineral, and fracture risk– a meta-analysis. Thyroid; 13(6): 585-93, 20033. Bahn RS, Burch HB, Cooper DS, et al. American Thyroid Association;American Association of Clinical Endocrinologists. Hyperthyroidism and othercauses of thyrotoxicosis: management guidelines of the American ThyroidAssociation and American Association of Clinical Endocrinologists. Thyroid;21(6): 593-646, 20114. Gogakos AI, Duncan Bassett JH, Williams GR. Thyroid and bone. ArchBiochem Biophys; 503(1): 129-36, 20105. Vestergaard P, Rejnmark L, Mosekilde L. Influence of hyper- andhypothyroidism, and the effects of treatment with antithyroid drugs andlevothyroxine on fracture risk. Calcif Tissue Int; 77(3): 139-44, 20056. Donangelo I, Braunstein GD. Update on subclinical hyperthyroidism. Am FamPhysician; 83(8): 933-8, 20117. Belsing TZ, Tofteng C, Langdahl BL, Charles P, Feldt-Rasmussen U. Canbone loss be reversed by antithyroid drug therapy in premenopausal women withGraves' disease? Nutr Metab (Lond); 1(7): 72-81, 20108. Rosen CJ, Adler RA. Longitudinal changes in lumbar bone density amongthyrotoxic patients after attainment of euthyroidism. J Clin Endocrinol Metab;75(6): 1531-4, 19929. van de Ven AC, Erdtsieck RJ. Changes of bone mineral density, quantitativeultrasound parameters and markers of bone turnover during treatment ofhyperthyroidism. Neth J Med; 66(10): 428-32, 200810. Dumitrache C, Ionescu B. Endocrinologie clinică. Ediţia a II-a revizuită andcompletată. Ed. Medicală Naţională, Bucureşti, 2002

51
11. Zbranca E. Endocrinologie (red.). Ghid de diagnostic si tratament in bolileendocrine. Ediţia a III-a. revăzută Ed. Polirom, Iaşi, 200812. Kanis JA, on behalf of the World Health Organization Scientific Group.Assessment of osteoporosis at the primary healthcare level. Technical Report.WHO Collaborating Centre, University of Sheffield, Sheffield, 200713. Zbranca E, Galuşcă B, Mogoş V. Bone Mineral Densitometry. The importanceof BMD in endocrinologist practice. Timişoara Medical Journal; 54(3): 260-7,200414. Kanis JA, Johnell O, on behalf of the Committee of Scientific Advisors of theInternational Osteoporosis Foundation. Requirements for DXA for themanagement of osteoporosis in Europe. Osteoporos Int, 16: 220-38, 200515. Raisz LG. Pathogenesis of osteoporosis: concepts, conflicts, and prospects. JClin Invest; 115(12): 3318-25, 200516. Baim S, Binkley N, Bilezikian JP, Kendler DL, Hans DB, Lewiecki EM,Silverman S. Official Positions of the International Society for ClinicalDensitometry and executive summary of the 2007 ISCD Position DevelopmentConference. J Clin Densitom, 11(1): 75-91, 200817. Institute for Clinical Systems Improvement (ICSI). Healthcare guideline:Diagnosis and treatment of osteoporosis. 6th edition, Sept. 200818. Seibel MJ. Biochemical markers of bone turnover: part I: biochemistry andvariability. Clin Biochem Rev; 26(4): 97-122, 200519. Crofton PM. Biochemistry of alkaline phosphatase isoenzymes. Crit Rev ClinLab Sci; 16(3): 161-94, 198220. Vulpoi C, Ungureanu G, Stoica O. Educaţia terapeutică a patientului - metodăde optimizare a tratamentului bolilor cronice. Rev Med Chir Soc Med Nat Iasi;111(1): 13-8, 2007