pathways to prosperity 101 an introduction to the report and the network pathways network institute...
TRANSCRIPT

1
Pathways to Prosperity 101
An Introduction to the Report and the Network
Pathways Network Institute
October 1, 2014

RELEASED BY HARVARD GRADUATE SCHOOL OF EDUCATION, 2011
THE PATHWAYS TO PROSPERITY REPORT:
THE PROBLEM DEFINED AND THE VISION

THE PATHWAYS TO PROSPERITY REPORT
“The American system for preparing young people to lead productive and prosperous lives as adults is clearly badly broken. Failure to aggressively overcome this challenge will surely erode the fabric of our society.”
3

4
EDUCATION LEVEL OF U.S. LABOR FORCE
No High School8%
High School Diploma /GED
24%
Some College, No Degree
14%Certificate12%
Associate's Degree10%
Bachelor's Degree21%
Graduate Degree11%
Source: Georgetown Center on Education and the Workforce, 2012

U.S. HIGH SCHOOL GRADUATION RATE STAGNATING
Unit
ed S
tate
s
Cze
ch R
ep
Est
onia
Germ
any
Sw
itze
rland
Denm
ark
Canada
Norw
ay
Sw
eden
Russ
ian F
ed
Aust
ria
Slo
venia
Isra
el
Slo
vak R
ep
New
Zeala
nd
Hungary
Finla
nd
UK
Neth
erl
ands
Luxem
bourg
EU
19 A
vg
OEC
D A
vg
France
Aust
ralia
Icela
nd
Belg
ium
Pola
nd
Irela
nd
Kore
a
Chile
Gre
ece
Italy
Spain
Turk
ey
Port
ugal
Mexic
o
Bra
zil
0
10
20
30
40
50
60
70
80
90
100
1990s 1980s 1970s 1960s
Source: Schleicher (2007) based on OECD data. Approximated by percentage of persons with high school or equivalent qualfications in the age groups 55-64, 45-55, 35-44, and 25-34 years
13
1
1
27
5
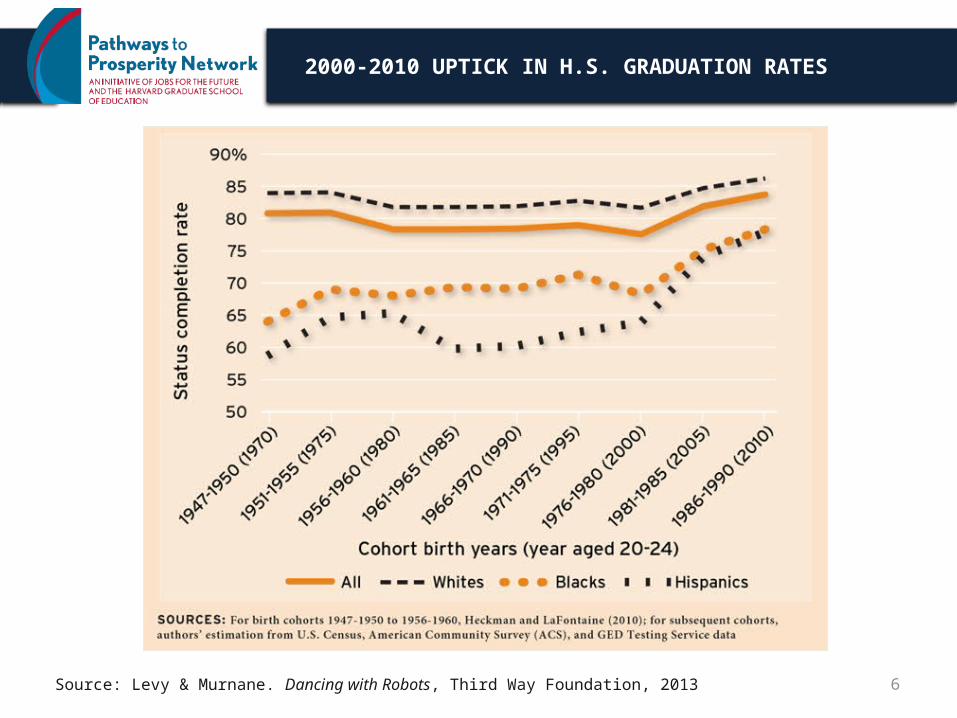
Source: Levy & Murnane. Dancing with Robots, Third Way Foundation, 2013
2000-2010 UPTICK IN H.S. GRADUATION RATES
6

THE U.S. LAGS IN COLLEGE COMPLETION
7

THE US SKILLS GAP HURTS GLOBAL COMPETITIVENESS
We are falling behind in the educational attainment of our young people in an economy where human capital drives productivity and innovation
Canada
Korea
Russia
Japan
New Zealand
Ireland
Norway
Israel
France
Belgium
Australia
United States
0 10 20 30 40 50 60
Percentage of 25 to 34 year olds with an Associates Degree or
higher%
Russia
Israel
Canada
United States
New Zealand
Estonia
Finland
Australia
Norway
Sweden
Netherlands
Switzerland
0 5 10 15 20 25 30 35 40 45 50
Percentage of 55 to 64 year olds with Associate Degree or higher
%
from 4th…
…to 12th

COLLEGE COMPLETION RATES ALARMINGLY LOW
Note: Four-year schools have a six-year graduation window; two-year schools have a three-year graduation window. Source: Condition of Education, NCES, 2013
Four-Year School (BA) Two-Year School (AA or Certificate)0%
10%
20%
30%
40%
50%
60%
70%
59%
31%
9

HS Diploma or Less35%
Some College/AA Degree
30%BA Degree or
Higher35%Sources: Recovery 2020, Georgetown Center on Education and the Workforce, 2013; and Complete College America
2020 EMPLOYMENT PROJECTIONS
10

EXAMPLES OF JOBS THAT REQUIRE MIDDLE SKILLS
Source: “Who Can Fix the Middle Skills Gap?” Harvard Business Review, 2012, T Kochan, D Finegold, P OstermanData from Occupational Outlook Handbook, U.S. BLS, 2010
Sector Type of JobNumber of Openings
Median Annual Pay
Computers & ITComputer Support Specialists
607,100 $46,260
Engineering Electrical Technicians 151,000 $56,040
Health Care Respiratory Therapists 112,700 $54,280
Life, Physical & Social Sciences
Environmental Science Technicians
29,000 $41,380
ProductionSemiconductor Processors
21,100 $33,130
11

OCCUPATION MATTERS
• 43% of young workers with Licenses and Certificates earn more than those with an Associate’s degree
• 27% of young workers with Licenses and Certificates earn more than those with an Bachelor’s degree
• 31% of young workers with an Associate’s degree earn more than those with an Bachelor’s degree
Source: Georgetown University Center on Education and the Workforce 12
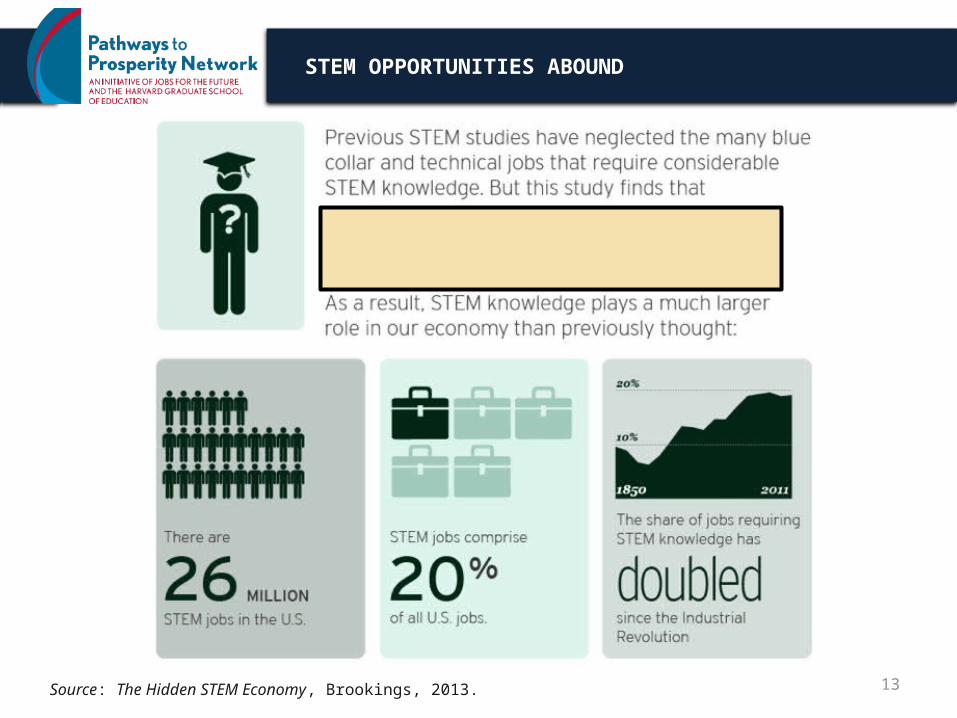
STEM OPPORTUNITIES ABOUND
Source: The Hidden STEM Economy, Brookings, 2013. 13
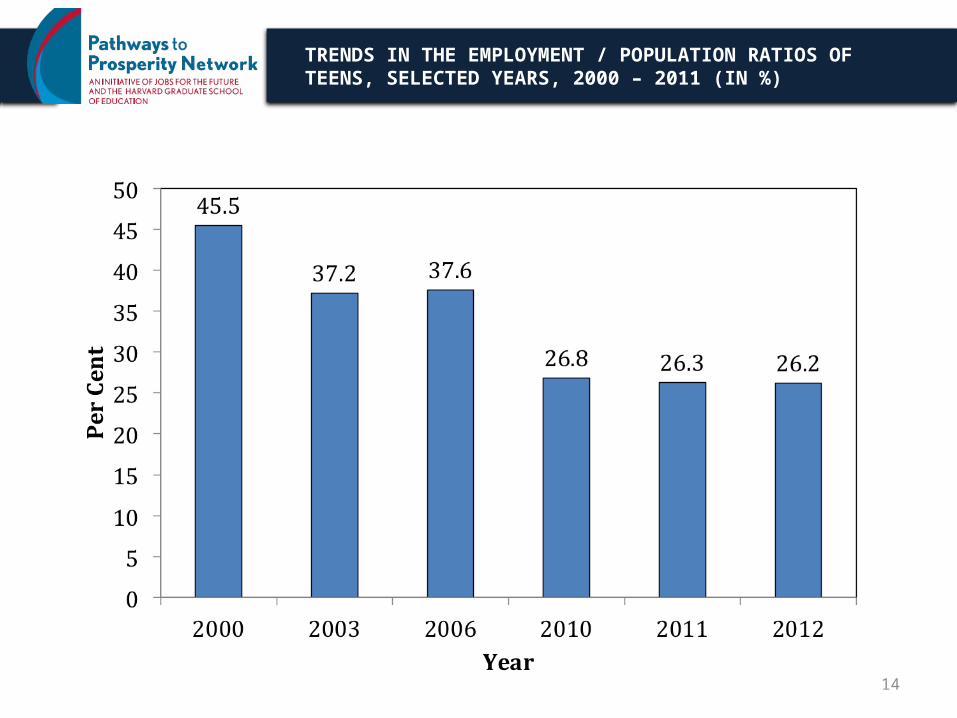
TRENDS IN THE EMPLOYMENT / POPULATION RATIOS OF TEENS, SELECTED YEARS, 2000 – 2011 (IN %)
14

U.S. EMPLOYMENT / POPULATION RATIOS
1999-2000 2011-20120
5
10
15
20
25
30
35
40
34.8
14.8
18.7
23.7
16-1768-75
Per
cen
tComparisons of the Employment/Population Ratios of 16-17 Year Old Males and 68-75 Year Old Males in the U.S. in 1999-2000 and 2011-2012 (in %)
Source: Andy Sum, Key Findings on the Labor Market Experiences of Teens and Young Adults (16-24 Years Old) in the U.S. from 2000 – 2012: Implications for Pathways to Prosperity, 2013

YOUTH UNEMPLOYMENT: 2007 AND 2011
16

STRONG VOCATIONAL SYSTEMS: THE NEW VET
In strong vocational systems, 40% to 75% of upper secondary students choose to participate: VET can be school based or mix of school and work

WHAT MANY AMERICANS THINK . . .
MYTHS ABOUT VOCATIONAL EDUCATION IN EUROPE:
• Early tracking, no choices
• Lack of career advancement
• Narrowly serve needs of employers
• Prepare young people for (dirty dangerous) low wage trades, not a range of professions
• Academics are not rigorous
• Dumping ground for young people who can’t do anything else
18

WHAT ARE TYPICAL HIGH QUALITY VOCATIONAL MODELS?
Dual systems
• Combine school and work on weekly schedule
• Usually 3-4 years to completion
• “School is not the center of the world”
School-based systems
• School is launch pad
• May have school-based enterprises within the school
• Always includes work-based learning; could be 60% of school week, required 6 months, or 1-2 years after 2 years of VET school
Both models serve 40% to 75% of young people
• Students choose at age 15
• Results in a nationally recognized qualification
19

PHOTOGRAPH © 2005 David Binder
THE NEW VOCATIONAL EDUCATION IS OF HIGH VALUE TO STUDENTS
• Has permeable pathways through postsecondary technical education
• Includes modern occupations learned through simultaneous study of sophisticated theory and application to real problems
• Requires STEM competencies, complex problem-solving in messy situations, and expertise in communication, team work, and presentation
• Responds to needs of adolescent development (talent pipeline of young professionals)
20

IN SWITZERLAND NO DEAD ENDS: EDUCATION IS FLEXIBLE
21
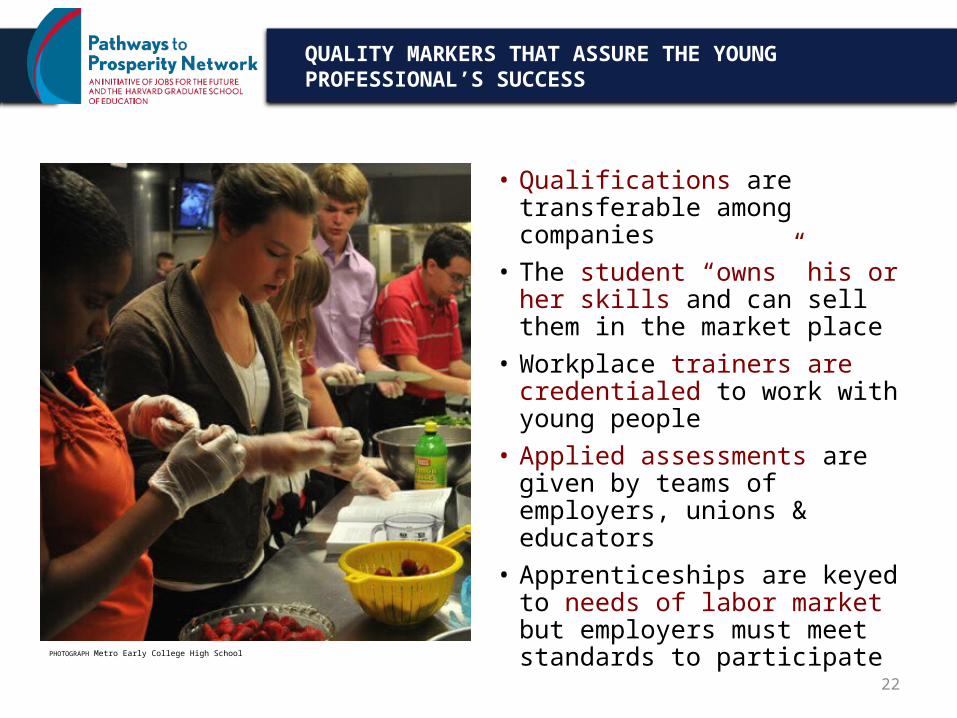
PHOTOGRAPH Metro Early College High School
QUALITY MARKERS THAT ASSURE THE YOUNG PROFESSIONAL’S SUCCESS
• Qualifications are transferable among companies
• The student “owns” his or her skills and can sell them in the market place
• Workplace trainers are credentialed to work with young people
• Applied assessments are given by teams of employers, unions & educators
• Apprenticeships are keyed to needs of labor market but employers must meet standards to participate
22

PHOTOGRAPH Metro Early College High School
STATE POLICIES ENABLE STRONG VET SYSTEMS TO SUCCEED
• Within a legal framework, social partners (unions, employers & government) work with educators:
• Government provides infrastructure, ensures breadth, and controls quality
• State and industry support robust intermediary organizations to provide “glue”
• A social compact ensures the provision of education and training opportunities for all young people between the ages of 16 and 19 but requires them to take advantage of these opportunities
23

NET-BENEFIT FOR AN AVERAGE SWISS TRAINING FIRM
24

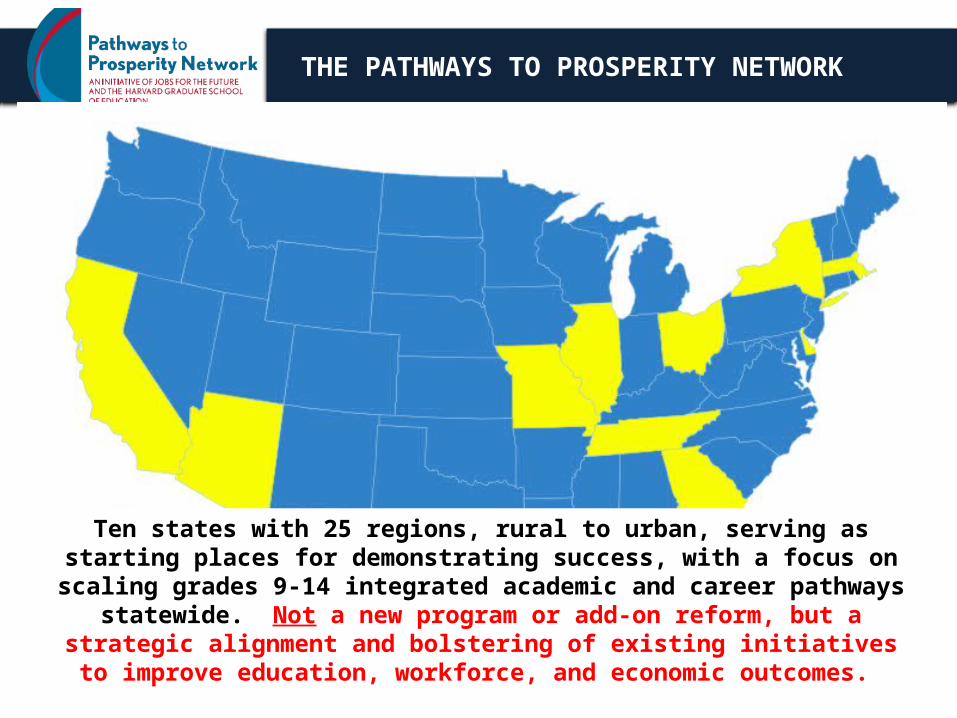
THE PATHWAYS TO PROSPERITY NETWORK
Ten states with 25 regions, rural to urban, serving as starting places for demonstrating success, with a focus on scaling grades 9-14 integrated
academic and career pathways statewide. Not a new program or add-on reform, but a strategic alignment and bolstering of existing initiatives to
improve education, workforce, and economic outcomes.

Regional Level
State Level
Multistate Network
National & Federal Levels
FOUR LEVELS OF PATHWAYS WORK

28
MOST PREVALENT CAREER AREAS OF FOCUS BASED ON REAL-TIME LABOR MARKET DATA
Advanced Manufacturing
Few know the opportunities and salaries, stigma
attached
Health careers
But paths must be carefully chosen to
ensure mobility
Information Technology
Cross-cutting and key to all 21st century
careers, not just in IT fields
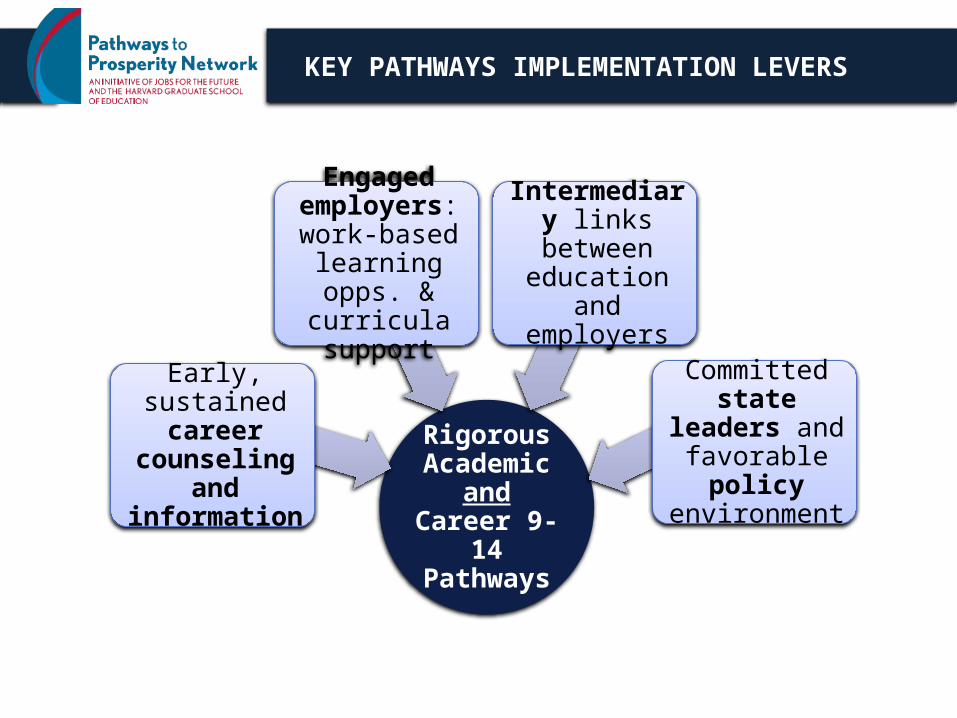
KEY PATHWAYS IMPLEMENTATION LEVERS
Rigorous Academic
and Career 9-14 Pathways
Early, sustained career
counseling and information
Engaged employers: work-based
learning opps. & curricula support
Intermediary links between education and
employers
Committed state leaders and
favorable policy environment

ORGANIZING AROUND AN INTERMEDIARY
Regional Intermediary
Business
K-12
CommunityGovernment
Post- secondary
Source: Learning for Jobs, OECD Reviews of Vocational Education and Training
Essential Roles
Plan: Awareness; asset mapping; data/metrics Convene: Set vision and align goals; coordinate and communicate
Broker: Foster and support partnerships and work-based learning
Evaluate: Define benchmarks and standards; evaluate outcomes

Postsecondary Pathways
System Outcomes:
Financially sustainable, aligned
and integrated 9-14(+) career
pathway systems
Increased number of skilled young
professionals with credentials of value to the labor market
State and regional economies develop talent pipelines in
key industry sectors
Career and Technical Ed.
Advanced Skilled
Jobs
Intern-ships, WBL
Low
Skilled Jobs
Semi-Skilled
Jobs
Middle Skilled
Jobs
Rigorous Academics
Acceleration & College/Career Readiness throughDual Enrollment, Integrated Instruction, and WBL
Stackable Credentials AA/AAS
BA/BS
Secondary Pathways
GRADES 9-14 INTEGRATED PATHWAYS

TAILORED TECHNICAL ASSISTANCE
JFF/HGSE works with each state and region to prioritize needs and tailor technical assistance and supports to advance the state’s vision and goals:
• State Leadership Development
• Asset Mapping
• Regional Pathways Design and Mobilization
• Policy Development
• Communications and Marketing
• Fundraising
• Other JFF Services, which may include:
– labor market information consulting, early college design services, student-centered learning strategies, instructional improvement coaching, teacher/leader professional development, and others
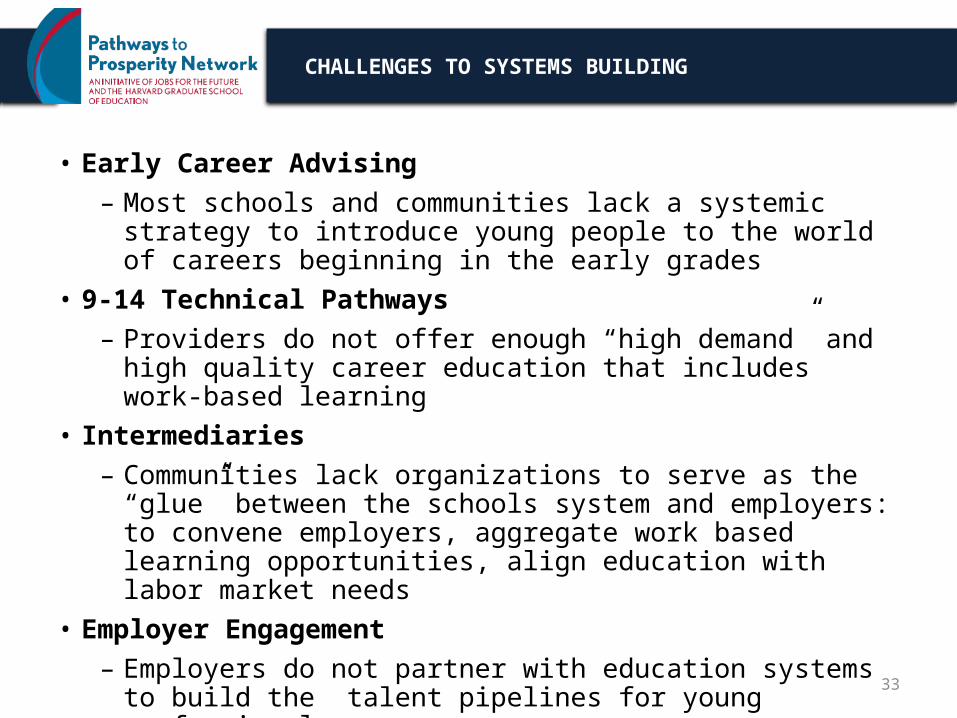
CHALLENGES TO SYSTEMS BUILDING
• Early Career Advising
– Most schools and communities lack a systemic strategy to introduce young people to the world of careers beginning in the early grades
• 9-14 Technical Pathways
– Providers do not offer enough “high demand” and high quality career education that includes work-based learning
• Intermediaries
– Communities lack organizations to serve as the “glue” between the schools system and employers: to convene employers, aggregate work based learning opportunities, align education with labor market needs
• Employer Engagement
– Employers do not partner with education systems to build the talent pipelines for young professionals
33

• New model legislation in some states, such as:– Career Clusters/Pathways, HB 186, GA
– California Career Pathways State Fund, AB 86, CA
• New resources at state level, such as:– Innovation Campuses, MO
– P-TECH Replications, NY
– Straight A Fund, OH
– Performance Incentive Funds to Community Colleges, MA
– SEA-hired Pathways Directors and Staff: MA, MO, TN
– $250M Career Pathways Trust in CA; +$250M next year
• Employers driving interest in advanced manufacturing and IT pathways, such as:– Volkswagen and Wacker in TN
– Cisco, IBM, Microsoft, Motorola, SAP, and Verizon in IL
– Southwire in GA
EXEMPLARY STATE POLICIES / RESOURCES
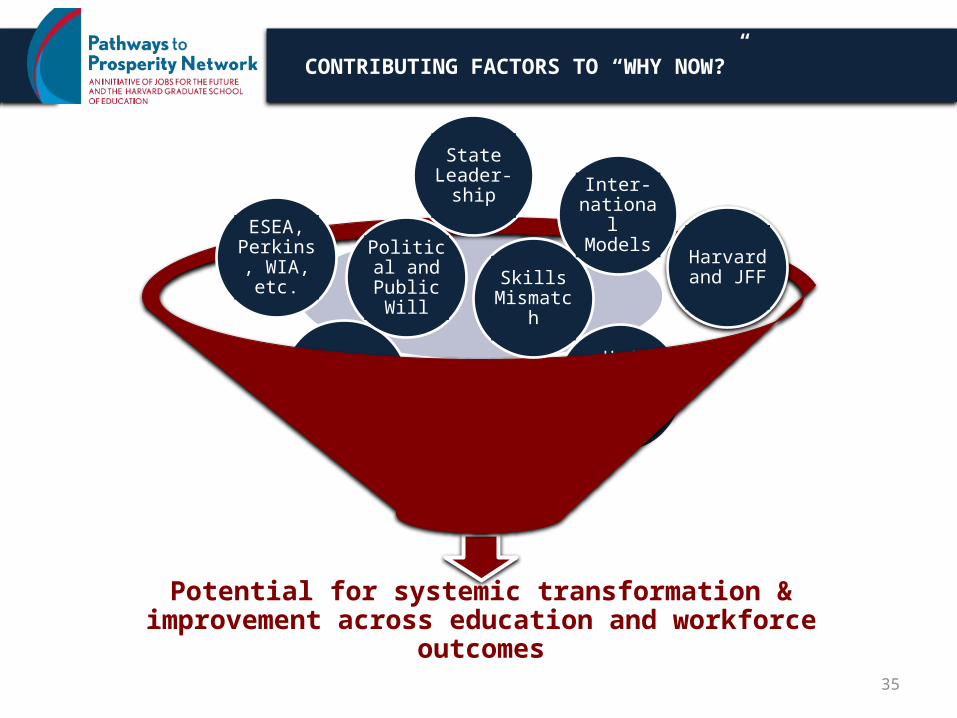
CONTRIBUTING FACTORS TO “WHY NOW?”
35
Potential for systemic transformation & improvement across education and workforce outcomes
Economic Crisis
Un/under-employ-
ment
Interest in P-TECH
Harvard and JFF
ESEA, Perkins, WIA, etc.
Skills Mismatch
Inter-national Models
Political and
Public Will
State Leader-
ship

WHAT DOES THIS MEAN FOR YOUR REGION?
You have the opportunity to create pathways for your young people through building partnerships that prepare students for college, career, and
a lifetime of citizenship
• How do youth in your region learn about career/college possibilities?
• How many young people do you know who are working, and how did they find their jobs?
• What do young people go on to do after graduating from high school?
• How do local employers currently support education (high school and college) in your region?
• How do high schools work with colleges? Any dual enrollment?
• How is your region connecting education, workforce, and economic development? Are there regional goals across them?