pathways to prosperity: from report to action robert schwartz
TRANSCRIPT

Pathways to Prosperity: From Report to ActionRobert Schwartz
2
2
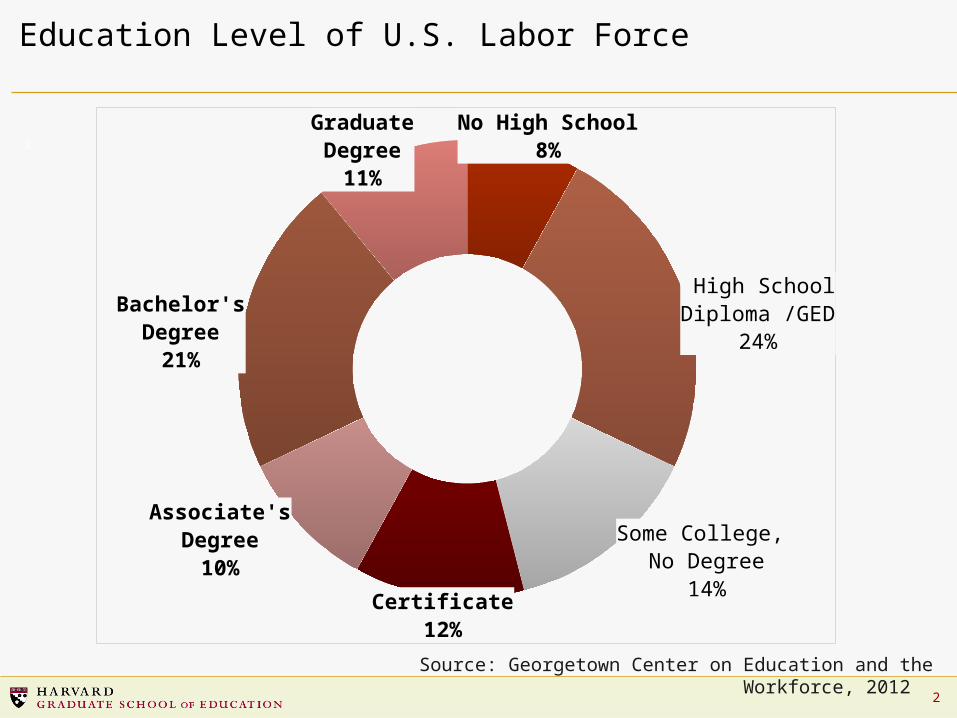
No High School8%
High School Diploma /GED
24%
Some College, No Degree
14%Certificate12%
Associate's Degree10%
Bachelor's Degree21%
Graduate Degree11%
Source: Georgetown Center on Education and the Workforce, 2012
Education Level of U.S. Labor Force
3
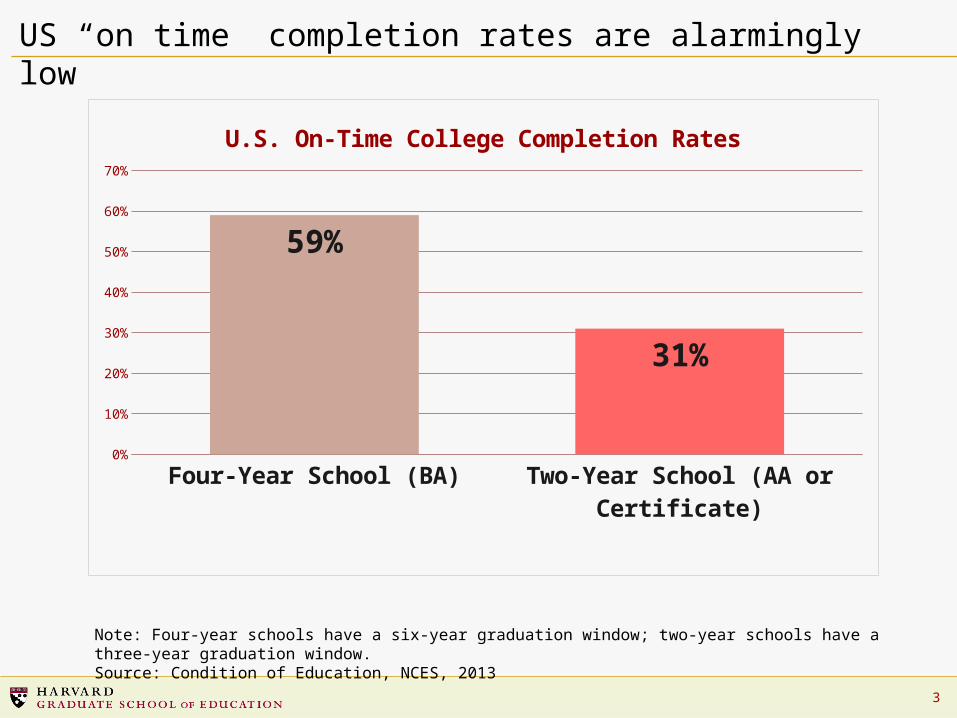
US “on time” completion rates are alarmingly low
Note: Four-year schools have a six-year graduation window; two-year schools have a three-year graduation window. Source: Condition of Education, NCES, 2013
Four-Year School (BA) Two-Year School (AA or Certificate)0%
10%
20%
30%
40%
50%
60%
70%
59%
31%
U.S. On-Time College Completion Rates
4
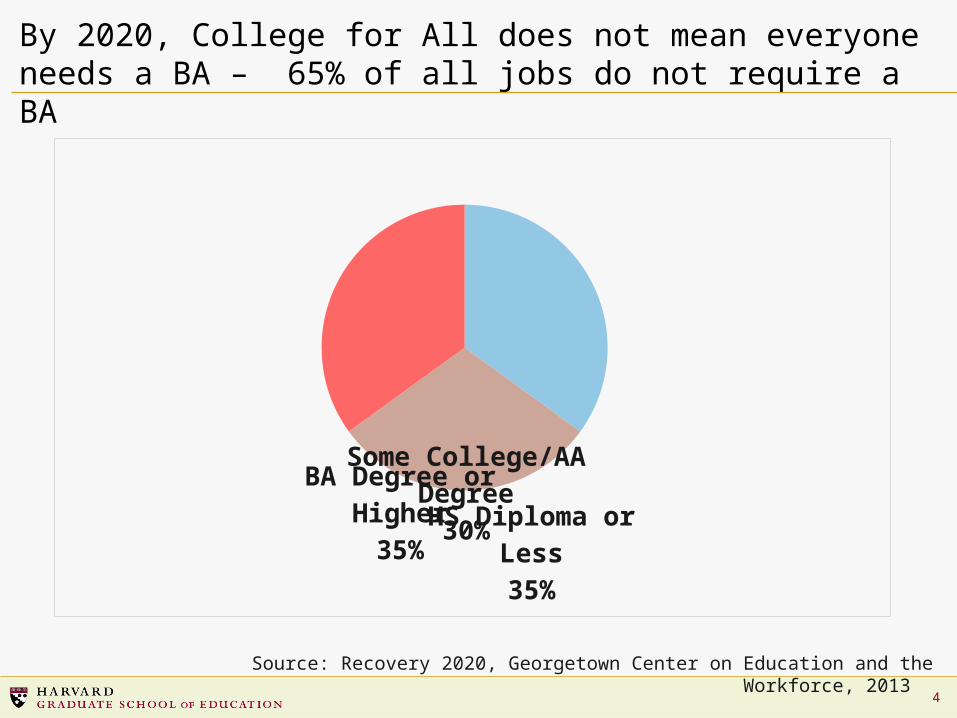
By 2020, College for All does not mean everyone needs a BA – 65% of all jobs do not require a BA
HS Diploma or Less35%
Some College/AA Degree
30%
BA Degree or Higher
35%
Source: Recovery 2020, Georgetown Center on Education and the Workforce, 2013

5
Examples of jobs that require middle skills
Source: “Who Can Fix the Middle Skills Gap?” Harvard Business Review, 2012, T Kochan, D Finegold, P Osterman
Data from Occupational Outlook Handbook, U.S. BLS, 2010
Sector Type of JobNumber of Openings
Median Annual Pay
Computers & ITComputer Support Specialists 607,100 $46,260
Engineering Electrical Technicians 151,000 $56,040
Health Care Respiratory Therapists 112,700 $54,280
Life, Physical & Social Sciences
Environmental Science Technicians 29,000 $41,380
ProductionSemiconductor Processors 21,100 $33,130
6
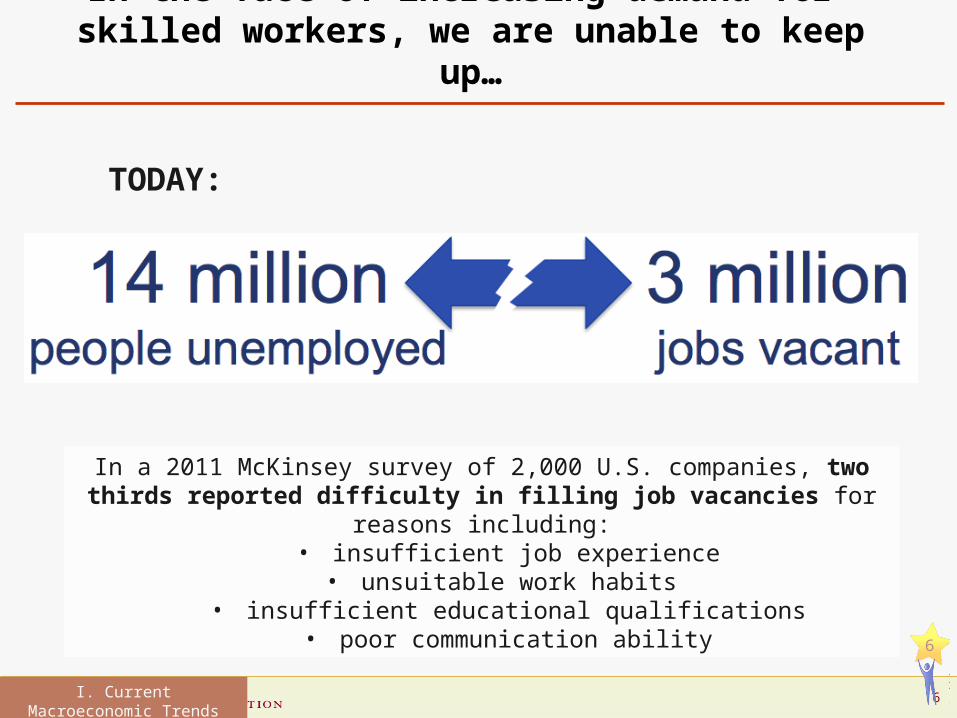
In the face of increasing demand for skilled workers, we are unable to keep
up…
In a 2011 McKinsey survey of 2,000 U.S. companies, two thirds reported difficulty in filling job vacancies for reasons
including:• insufficient job experience
• unsuitable work habits • insufficient educational qualifications
• poor communication ability
TODAY:
6
I. Current Macroeconomic Trends

7
8
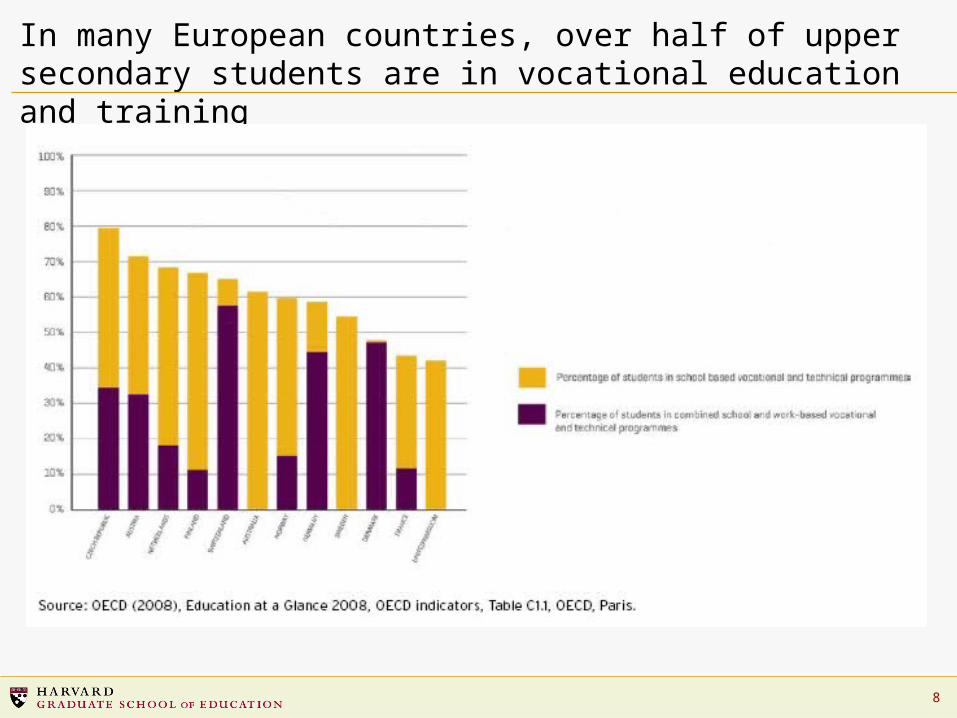
In many European countries, over half of upper secondary students are in vocational education and training
9
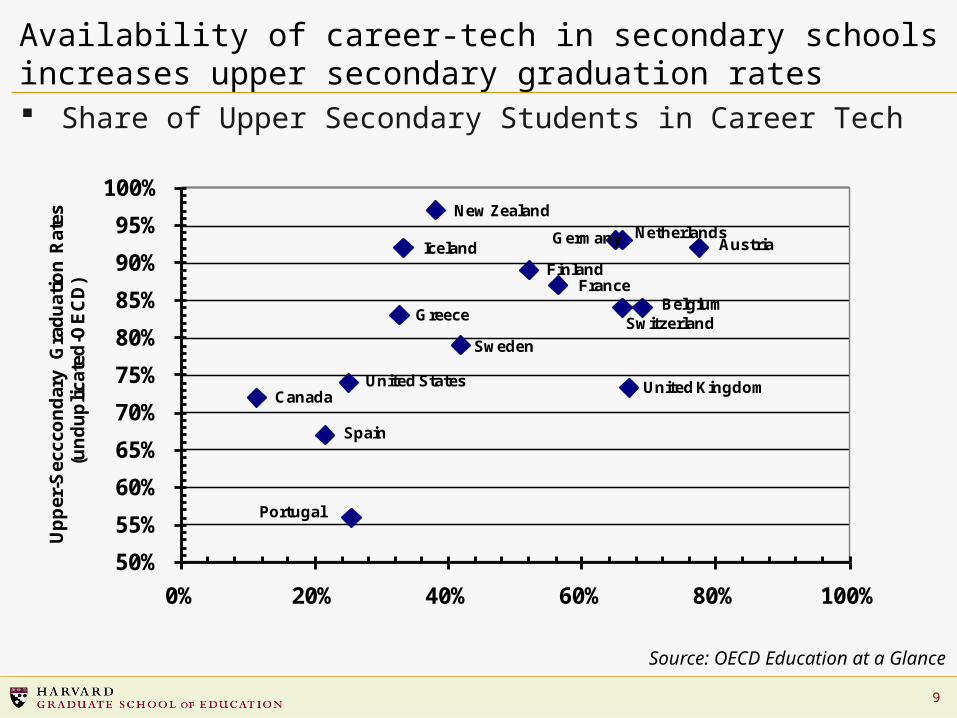
Availability of career-tech in secondary schools increases upper secondary graduation rates
Austria
BelgiumGreece
FinlandFrance
Germany Netherlands
Sweden
Switzerland
United Kingdom
Spain
United StatesCanada
Iceland
Portugal
New Zealand
50%
55%
60%
65%
70%
75%
80%
85%
90%
95%
100%
0% 20% 40% 60% 80% 100%
Up
per
-Sec
cco
nd
ary
Gra
du
atio
n R
ates
(u
nd
up
lica
ted
-OE
CD
)
Source: OECD Education at a Glance
Share of Upper Secondary Students in Career Tech

10
Unit
ed S
tate
s
Cze
ch R
ep
Est
onia
Germ
any
Sw
itze
rland
Denm
ark
Canada
Norw
ay
Sw
eden
Russ
ian F
ed
Aust
ria
Slo
venia
Isra
el
Slo
vak R
ep
New
Zeala
nd
Hungary
Finla
nd
UK
Neth
erl
ands
Luxem
bourg
EU
19 A
vg
OEC
D A
vg
France
Aust
ralia
Icela
nd
Belg
ium
Pola
nd
Irela
nd
Kore
a
Chile
Gre
ece
Italy
Spain
Turk
ey
Port
ugal
Mexic
o
Bra
zil
0
10
20
30
40
50
60
70
80
90
100
1990s 1980s 1970s 1960s
U.S. rate has stagnated while most industrialized countries have improved.
School completion: Dramatic change in global skill supply
Source: Schleicher (2007) based on OECD data. Approximated by percentage of persons with high school or equivalent qualfications in the age groups 55-64, 45-55, 35-44, and 25-34 years
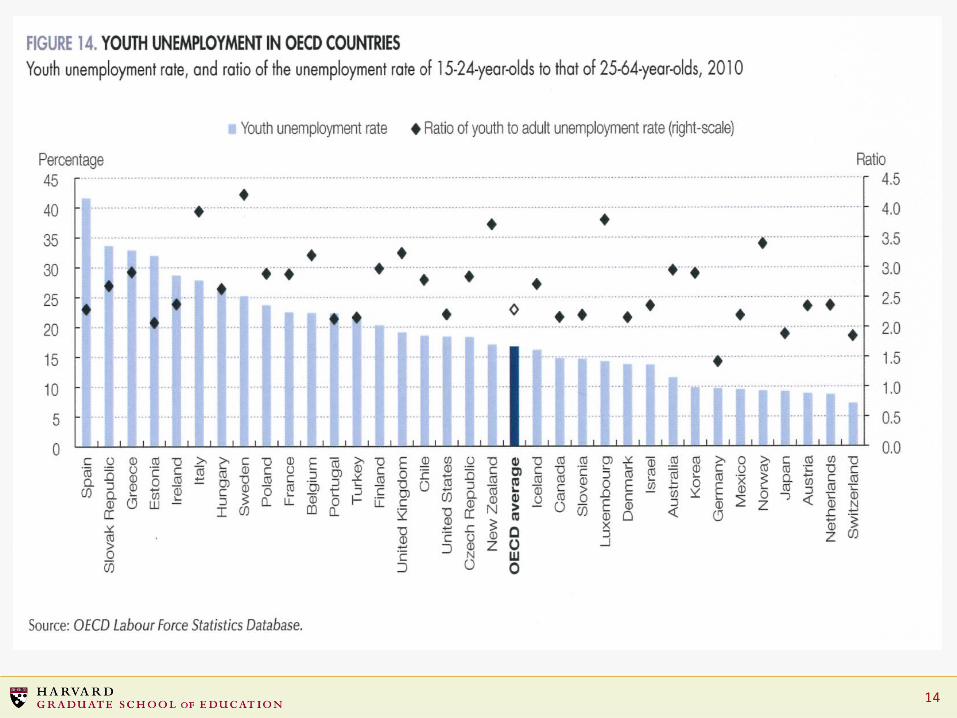
13
1
1
27
11
Austra
lia
Austria
Belgiu
m
Canad
aChile
Czech
Rep
ublic
Denm
ark
Estonia
Finla
nd
France
Germ
any
Greec
e
Hungary
Icel
and
Irela
ndIs
rael
Italy
Korea
Luxem
bourg
Mex
ico
Nether
lands
New Z
eala
nd
Norway
Poland
Portugal
Slova
k Rep
ublic
Slove
nia
Spain
Sweden
Switzer
land
Turkey
United K
ingdom
United S
tate
s n
20
40
60
80
100
120
84 88
82
92 88
94
80 86
90
83 87
80
87
75
85 90
71
98
83
44
82 80 84
94
56
94 94
65
91 89
43
84 89
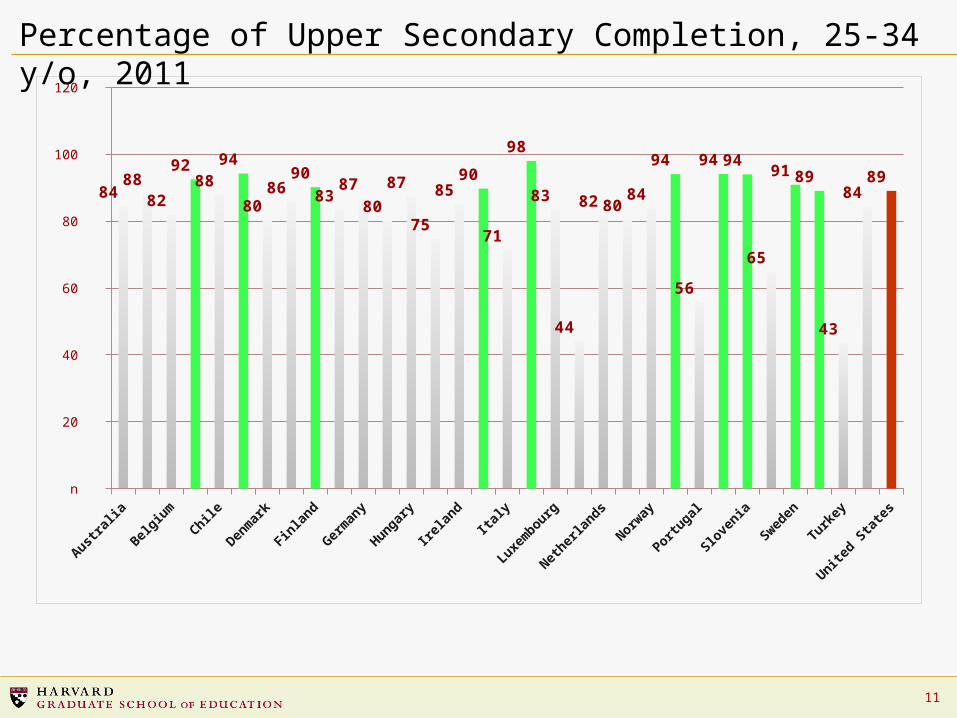
Percentage of Upper Secondary Completion, 25-34 y/o, 2011

12
Even more alarming, U.S. college completion rates have stagnated while others have improved.
College level graduation rates
Aust
ralia
Icela
nd
New
Zeala
nd
Finla
nd
Denm
ark
Pola
nd
Neth
erl
ands
Italy
Norw
ay
UK
Irela
nd
Sw
eden
OEC
D A
vg
Hungary
Japan
EU
19 A
vg
Isra
el
Unit
ed S
tate
s
Spain
Port
ugal
Slo
vak R
ep
Sw
itze
rland
Gre
ece
Cze
ch R
ep
Aust
ria
Germ
any
Slo
venia
Turk
ey
0
10
20
30
40
50
60
70
2005 1995
15
2
Decline of the relative position of the US from 1995 to 2005
Source: Schleicher (2007) based on OECD data. Percentage of tertiary type A graduates to the population at the typical age of graduation.
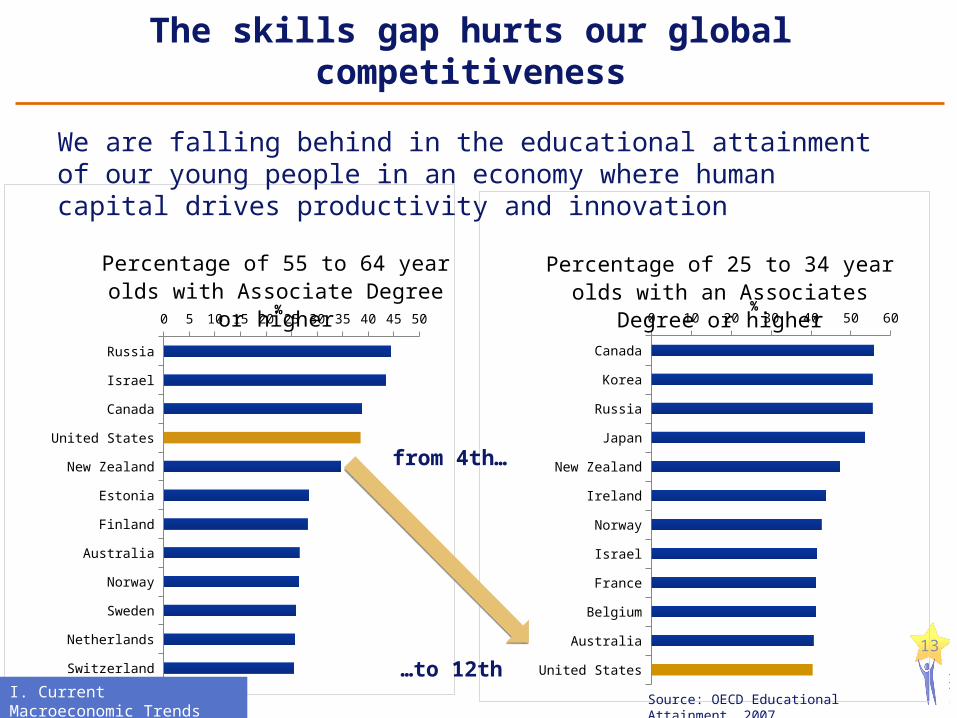
The skills gap hurts our global competitiveness
Canada
Korea
Russia
Japan
New Zealand
Ireland
Norway
Israel
France
Belgium
Australia
United States
0 10 20 30 40 50 60
Percentage of 25 to 34 year olds with an Associates Degree or
higher%
Russia
Israel
Canada
United States
New Zealand
Estonia
Finland
Australia
Norway
Sweden
Netherlands
Switzerland
0 5 10 15 20 25 30 35 40 45 50
Percentage of 55 to 64 year olds with Associate Degree or higher
%
Source: OECD Educational Attainment, 2007
We are falling behind in the educational attainment of our young people in an economy where human capital drives productivity and innovation
13
I. Current Macroeconomic Trends
from 4th…
…to 12th
14

15
Innovation & Competitiveness: Switzerland at Top
15
Rank European Innovation Scoreboard 2010
WEF Global Competitiveness Index2011-2012
IMD World Competitiveness Scoreboard2011
1 Switzerland Switzerland Hongkong
2 Sweden Singapore USA
3 Denmark Sweden Switzerland
4 Germany Finland Singapore
Sources: EIS: European Innovation Scoreboard, 2012 WEF: Global Competitiveness Report, 2012
IMD: World Competitiveness Yearbook, 2012
ETHZ/KOF • Prof. Dr. Ursula Renold

16
December 2012

17
Four levels of pathways work
Regional Level
State Level
Multistate Network
National & Federal Levels
18
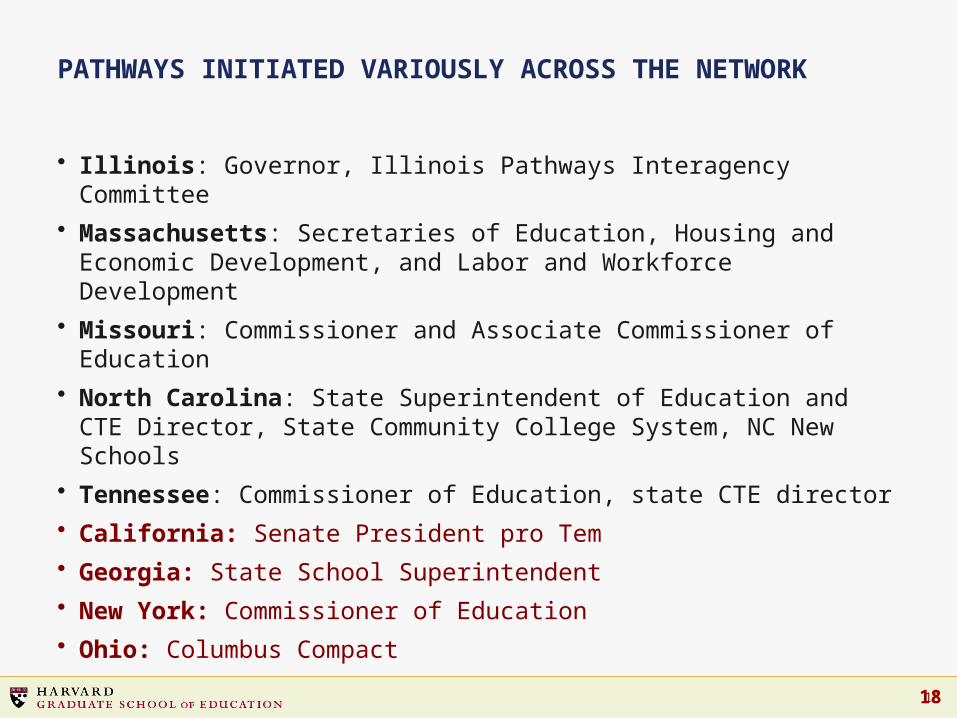
PATHWAYS INITIATED VARIOUSLY ACROSS THE NETWORK
• Illinois: Governor, Illinois Pathways Interagency Committee
• Massachusetts: Secretaries of Education, Housing and Economic Development, and Labor and Workforce Development
• Missouri: Commissioner and Associate Commissioner of Education
• North Carolina: State Superintendent of Education and CTE Director, State Community College System, NC New Schools
• Tennessee: Commissioner of Education, state CTE director
• California: Senate President pro Tem
• Georgia: State School Superintendent
• New York: Commissioner of Education
• Ohio: Columbus Compact
18

19
SAMPLE STATE ENTRY POINTS…
• Massachusetts: – Community colleges, WIBs, and employer
associations leading the work in the regions – Three secretariats co-lead at the state level
• Illinois: – IL Pathways Interagency Committee– Statewide Learning Exchanges
• Tennessee:– Rural economic and community development strategy– Science park, strong employer partners (VW, Wacker)
20
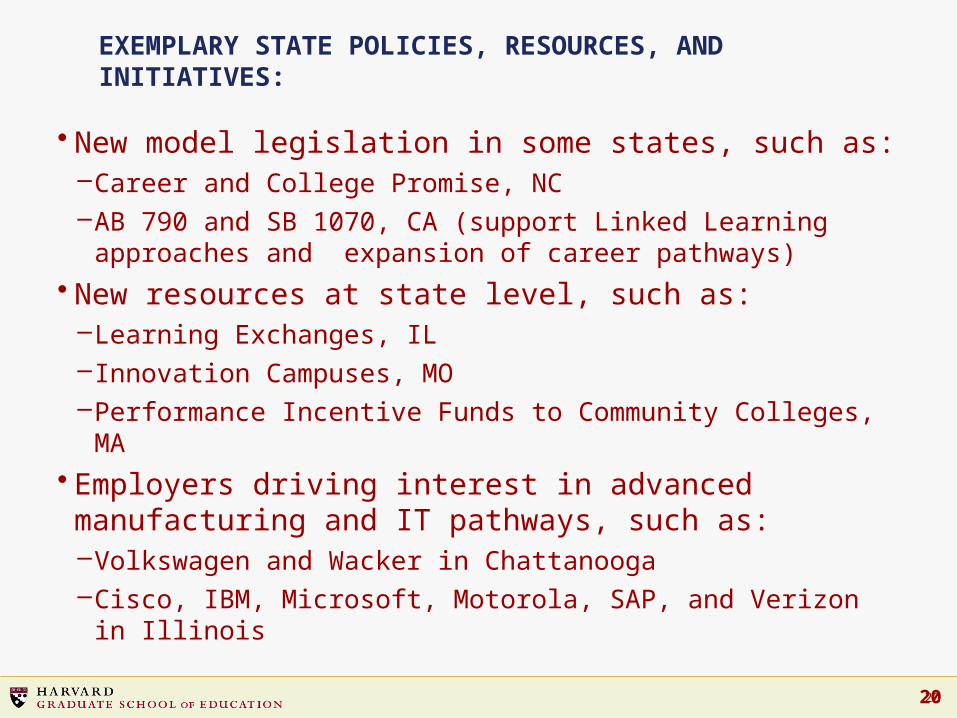
EXEMPLARY STATE POLICIES, RESOURCES, AND INITIATIVES:
• New model legislation in some states, such as:– Career and College Promise, NC– AB 790 and SB 1070, CA (support Linked Learning
approaches and expansion of career pathways)
• New resources at state level, such as:– Learning Exchanges, IL– Innovation Campuses, MO– Performance Incentive Funds to Community Colleges, MA
• Employers driving interest in advanced manufacturing and IT pathways, such as:– Volkswagen and Wacker in Chattanooga– Cisco, IBM, Microsoft, Motorola, SAP, and Verizon in Illinois
20
2121
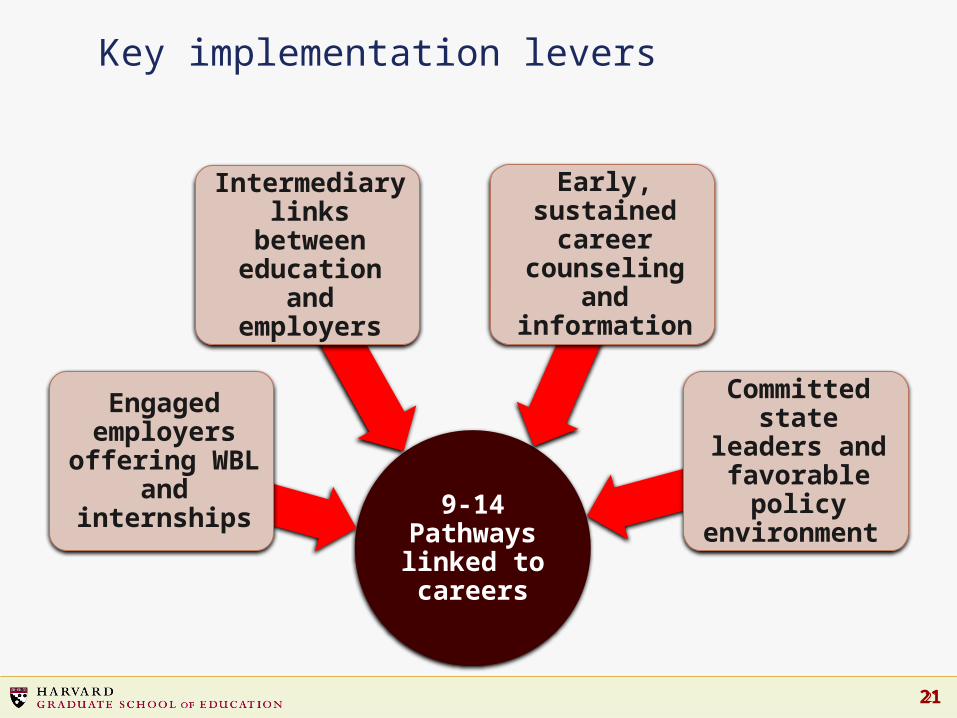
Key implementation levers
9-14 Pathways linked to careers
Engaged employers
offering WBL and internships
Intermediary links between education and
employers
Early, sustained career
counseling and information
Committed state leaders and favorable
policy environment
22
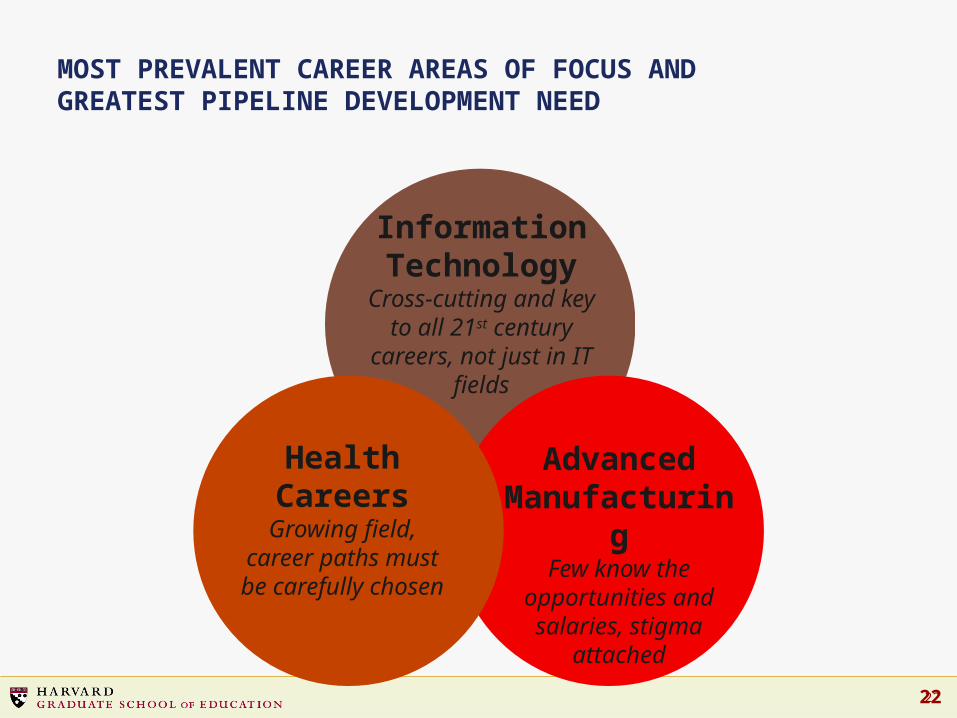
MOST PREVALENT CAREER AREAS OF FOCUS AND GREATEST PIPELINE DEVELOPMENT NEED
22
Advanced Manufacturing
Few know the opportunities and salaries, stigma
attached
Health Careers
Growing field, career paths must
be carefully chosen
Information Technology
Cross-cutting and key to all 21st century
careers, not just in IT fields
23
• Early Career Advising
– Most districts lack a systemic strategy to introduce young people to the world of careers beginning in middle grades
• 9-14 Pathways
– Few 9-14 pathways align and integrate high school career pathways with community college
– Community colleges’ “high demand” career programs are not accessible to young entrants; therefore, integrated 9-14 programs of study must be built
CHALLENGES TO SYSTEMS BUILDING
23
24
• Intermediaries
– Communities lack organizations to serve as the “glue” between schools, colleges and employers: to convene, muster resources, align education with labor market needs. Chambers, sector organizations need to step up.
• Employer Engagement
– Employers are not interested in general “please engage with schools” requests; instead, we need to engage employers to build talent pipelines for young professionals into specific career areas.
CHALLENGES TO SYSTEMS BUILDING (CONTINUED)
24
25
• New model legislation in some states, such as:– Career and College Promise, NC– AB 790 (Linked Learning Pilot) and SB 1070 (CTE Pathways),
CA
• New resources at state level, such as:– Learning Exchanges, IL– Innovation Campuses, MO– Performance Incentive Funds to Community Colleges, MA
• Employers driving interest in STEM fields, such as:– Volkswagen and Wacker in TN– IT employers in Illinois
• Regional integrated 9-14 models– P-Tech in NYC, Chicago– Early colleges across NC, nation
25
EXEMPLARY POLICIES, RESOURCES, AND INITIATIVES
26
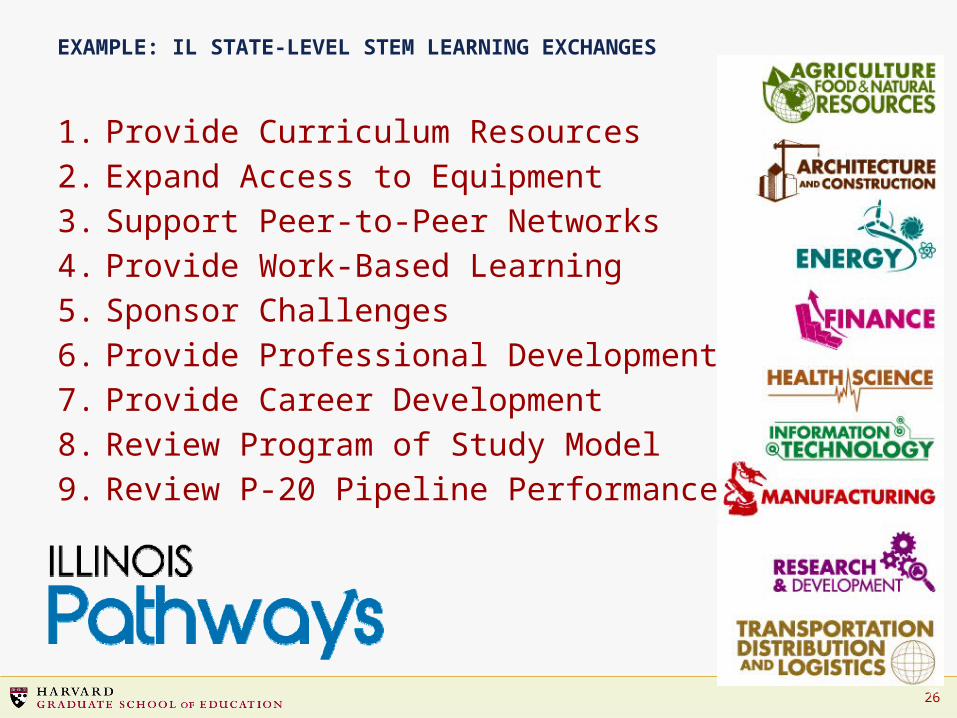
1. Provide Curriculum Resources
2. Expand Access to Equipment
3. Support Peer‐to‐Peer Networks
4. Provide Work‐Based Learning
5. Sponsor Challenges
6. Provide Professional Development
7. Provide Career Development
8. Review Program of Study Model
9. Review P‐20 Pipeline Performance
26
EXAMPLE: IL STATE-LEVEL STEM LEARNING EXCHANGES
27
Next steps for the network
– State and regional work plans• One- and three-year implementation metrics and goals• Place-based strategies with practices and principles that can
be scaled statewide–9-14 high school/community college pathway design–Customized TA, support, and resources from JFF,
Harvard, and other expert consultants around four levers• Based on work plan needs, with capacity-building focus• Webinars, convenings, site visits, coaching
–Community of practice and Network collaboration–Phasing in GA, CA, OH, NY
27

28
“And so tonight, I ask every American to commit to at least one year or more of
higher education or career training. This can be community college or a four-year
school; vocational training or an apprenticeship. But whatever the training may be, every American will need to get
more than a high school diploma.”President Barack Obama
Speech to Joint Session of Congress, February 2009