pavement evaluation using the road rater deflection...
TRANSCRIPT

Pavement Evaluation Using the Road Rater™
Deflection Dish
Final Report for
MLR-89-2
May 1989
Highway Division .
~ti& Iowa Department ------- ~i of Transportation

PAVEMENT EVALUATION USING THE ROAD RATER TM
DEFLECTION DISH
Final Report for
Project MLR-89-2
By Charles J. Potter, P.E.
Special Investigations Engineer 515-239-1232
Off ice of Materials
and
Kermit L. Dirks Soils Geologist
515-239-1476 Off ice of Road Design
Highway Division Iowa Department of Transportation
Ames, Iowa 50010
May 1989
TABLE OF CONTENTS
Page
Abstract........................................................................... 1
Introduction ........................................................... 2
Equipment ...................................................................... 3
Test Procedure........................................................................... 12
Development of Flexible Pavement Asphaltic Concrete Overlay Design Procedure. .. . .. .. .. . .. .. . . .. . .. .. .. .. .. . .. .. .. .. .. .. .. .. .. .. .. .. .. .. .. . .. .. . .. .. . .. . 14
Development of Rigid and Composite Pavement - Asphaltic Concrete Overlay Design Procedure ........•...•..••.....••.. 18
Development and Verification of Soil Support K Value Charts for Rigid, Composite and Flexible Pavements .•...••..•...... 24
Development of Temperature Corrections for Rigid and Composite Pavements. • . . • • . . • . . . . • . . . • . . . . . . • . . • . . . • . . . . . . . . 2 9
Verification of Flexible, Rigid and Composite Pavement Base Relationships ............................................................. 33
Verification of Coefficient of Asphaltic Concrete ..•...•... 34
Application of Road Rater Values for Asphaltic Concrete Overlay Design................................................................................ 35
Void Detection Testing................ .. .. .. . .. .. . .. .. . .. .. .. .. .. .. .. .. .. .. .. .. .. .. .. .. .. .. .. 36
Road Rater Testing of Retrofitted Load Transfer Dowels ..... 38
Conclusions........... .. .. . .. .. .. .. .. .. .. .. . .. .. .. .. .. .. .. . .. .. .. .. .. . .. . . . .. .. .. . .. .. . . .. .. .. .. 39
References....... .. . . .. .. .. .. . .. .. .. .. . . . .. . .. .. .. .. .. .. .. . .. .. .. .. . . .. .. .. . . .. .. .. .. .. .. .. .. 39
Appendices
Appendix A - Method of Test for Determining Pavement Deflection Using the Road Rater ....••..•.• 41
Appendix B - Asphaltic Concrete Overlay Design of Flexible Base Pavements Based on Road Rater Deflection Data............. . . .. .. .. .. .. . .. .. .. . .. .. . .. .. . .. .. 48
(cont'd)

Appendix C - Work Plan to Evaluate Road Rater Effectiveness on Rigid Pavements ••...•••.....•. 59
Appendix D - Method of Determination of Present Serviceability Index...................... 62
Appendix E - Rigid Pavement Road Rater Research Spread Sheets and Plots. . . .. . . .. .. . .. . .. . .. . . . . .. .. .. .. . .. .. .. 6 9
Appendix F - Long Term Monitoring Core Pictures ...•.•.. 87 Appendix G - Tables 1 Through 16 ......••...•••.....•... 131
DISCLAIMER
The contents of this report reflect the views of the authors and do not necessarily reflect the official views or policy of the Iowa Department of Transportation. This report does not constitute a standard, specification or regulation.
·-·-·-·-·-·~·-·-·-·-···------

PAGE 1
ABSTRACT
In recent years the Iowa Department of Transportation has shifted
emphasis from the construction of new roads to the maintenance
and preservation of existing highways. A need has developed for
evaluating pavements structurally to select the correct rehabili
tation strategy and to properly design a pavement overlay if nec
essary. Road Rater non-destructive testing has fulfilled this
need and has been used successfully to evaluate pavement and sub
grade conditions and to design asphaltic concrete overlays and
portland cement concrete overlays. The Iowa Road Rater Design
Method has been simplified so that it may be easily understood
and used by various individuals who are involved in pavement res
toration and management.
Road Rater evaluation techniques have worked well to date and
have been verified by pavement coring, soils sampling and test
ing. Void detection testing has also been performed, and results
indicate that the Road Rater can be used to locate pavement voids
and that Road Rater evaluation techniques are reasonably accu
rate. The success of Road Rater research and development has
made dynamic deflection test data an important pavement manage
ment input.

PAGE 2
INTRODUCTION
In recent years the Iowa Department of Transportation has shifted
emphasis from the construction of new roads to the maintenance
and preservation of the existing 10,000 mile Primary Highway Sys
tem. This shift in emphasis has been due to funding shortages,
completion of the Interstate Highway System, and the overall age
of the existing highway system. A need has developed for evalu
ating pavements structurally to select the correct rehabilitation
strategy and to properly design a pavement overlay if necessary.
The Iowa Department of Transportation purchased a Model 400 Road
Rater from Foundation Mechanics, Inc., A Wyle Company of El
Segundo, California, in November 1975. This dynamic device which
measures amplitude of movement (hereafter called deflection) re
placed the Benkelman Beam, which was last used in Iowa in 1977
(!). A method for designing asphaltic concrete (a.c.) overlays
for flexible pavements, utilizing Road Rater deflection measure
ments, was developed in 1979 and became operational in May 1980.
This flexible pavement - a.c. overlay design method has worked
well. At this time, 4,560 miles of Iowa's Primary Highway System
are portland cement concrete (p.c.c.). In addition, 3,700 miles
of Iowa's a.c. pavements are composite (a.c. over p.c.c.) pave
ments rather than full depth flexible pavements. The flexible
pavement - a.c. overlay design method, therefore, has been most
useful on secondary highways.

PAGE 3
A rigid and composite pavement - a.c. overlay design method was
developed in November 1982. Charts were also developed in 1983
to estimate Westergaard's modulus of subgrade reaction (K) (~).
Experience gained since 1983 has verified the validity of the
rigid and composite pavement - a.c. overlay design method and
subgrade reaction (K) charts <1>· A Road Rater structural analy
sis is now performed on most rehabilitation and resurfacing
project candidates.
Since the deflection based a.c. overlay design methods were em
pirically derived, the purpose of this report is to document re
search performed to date in Iowa. Development of the design
methods, verification of the models, and application of the re
sults are discussed. In addition, void detection testing has
been performed in Iowa, and the results are also reviewed in this
report.
EQUIPMENT
The Iowa DOT purchased a Model 400 Road Rater mounted in a Ford
E250 van in 1975 from Foundation Mechanics, Inc., A. Wyle Company
of El Segundo, California. The Road Rater is a dynamic de
flection measuring device used to determine the structural ade
quacy of pavements. A large mass is hydraulically lowered to the
pavement and oscillated through a servo value to produce a load
ing force <i>· This force varies from 800 to 2,000 pounds on
flexible pavements, and from 400 to 2,400 pounds on rigid and
composite pavements. The resulting deflection is measured by

PAGE 4
four velocity sensors. One sensor is positioned directly under
the ram, and the other three sensors are positioned at one foot,
two feet and three feet respectively, from the ram (Figures 1, 2
and 3).
~
"-~
w u cc: 0 "-
~ N M """ """ ""' ""' ""' ,._ ,._ ,._ ,._ 0 0 0 0 VJ VJ VJ VJ c c c c OJ OJ OJ OJ
VJ VJ VJ C/)
~ 1 ' l't l'~ J
Figure 1 Road Rater Deflection Dish

Figure 2 Model 400 Road Rater
Figure 3 Mass and Sensors
PAGE 5

PAGE 6
The force applied to the pavement is also monitored by a velocity
sensor (Figure 4). This velocity sensor is mounted on top of the
hydraulic two-way ram and measures amplitude or peak-to-peak mass
displacement. Force imparted to the pavement is expressed by the
following equation:
F 32.70f 2 D
Where F is the peak-to-peak force in pounds, f is the frequency
of the loading in Hertz, and D is the peak-to-peak displacement
of the mass in inches. A force setting of 25 Hz and 0.058 inch
mass displacement is used on flexible pavements and results in
1,185 pounds of peak-to-peak force.
F = 32.70(25) 2 (0.058) = 1,185 pounds
The force setting of 25 Hz and 0.058 inch mass displacement was
recommended by the manufacturer for flexible pavements since that
force setting correlated best to the Benkelman Beam (correlation
coefficient =0.89). A similar study in Iowa yielded a corre
lation coefficient of 0.83 between the Road Rater and Benkelman
Beam.
The manufacturer recommended a force setting of 30 Hz and 0.068
inch mass displacement on rigid and composite pavements which
produces a peak-to-peak force of 2,000 pounds.
F = 32.70(30) 2 (0.068) = 2,000 pounds

PAGE 7
This is the maximum functional force output of the Model 400 Road
Rater. Hydraulic and electrical power are provided by an auxil
iary motor mounted in the rear of the van (Figure 5).
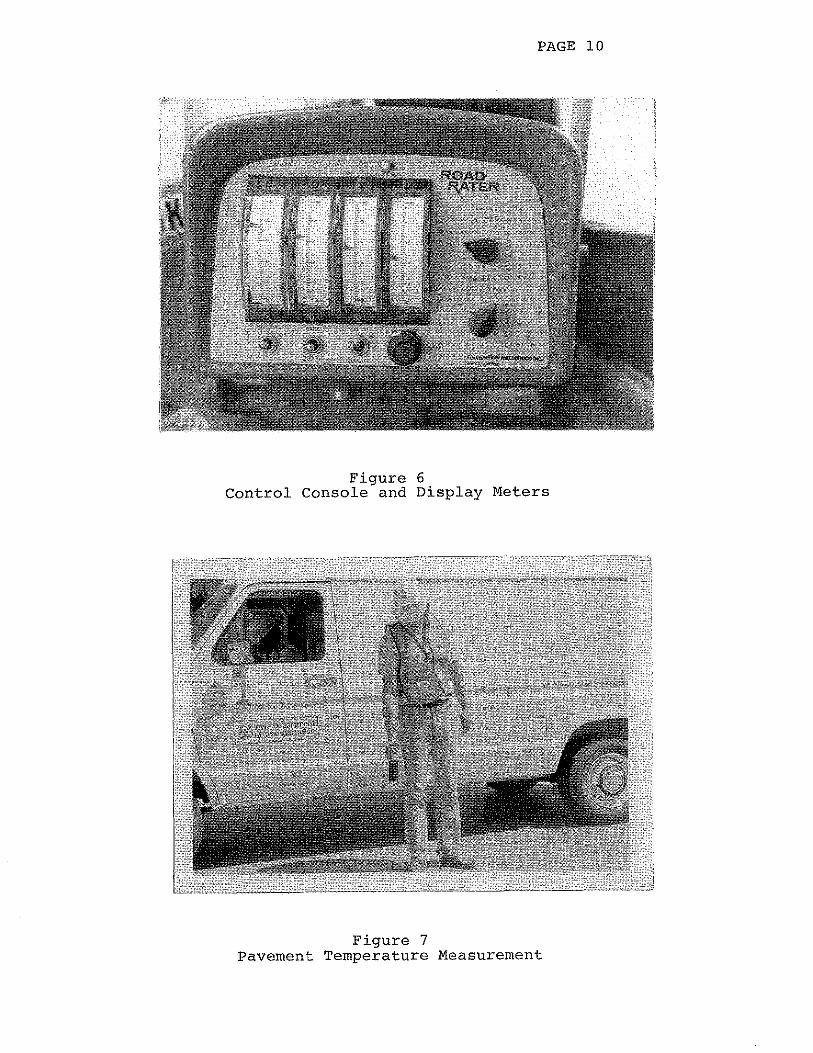
The control console mounted in the van has four display meters to
indicate deflections from the four velocity sensors placed on the
pavement (Figure 6) . Display Meter Number 4 is also used to cal
ibrate mass displacement when the power switch is in the "moni-
tor" position (.?_) • A rotary "level" control is used to adjust
the mass displacement to the desired output. Other switches are
used to raise, lower and vibrate the mass. A six-position
"range" switch has settings of 1, 2, 3, 5, 10 and 20, which are
multipliers of the display meter readings. If Display Meter Num
ber 1 reads 52 (0.52 of full scale) at range setting 3, the pave-
ment deflection would be 1.56 mils (0.52 x 3 l.56mils). The
five-position "frequency" control has settings for 10, 20, 25, 30
and 40 Hertz. This feature allows the load frequency to be
changed for different types of pavements. The frequency control
is used in conjunction with the monitor position of the power
switch and level control to change the peak-to-peak force from
1,185 pounds on flexible pavements to 2,000 pounds on rigid and
composite pavements. The Road Rater was originally purchased be
cause of the load-varying versatility.
A Model R-380 RVF Raytek infrared gun is used to measure pavement
temperatures. This instrument enables pavement temperatures to
be taken quickly for pavement inventory purposes (Figures 7 and

PAGE 8
8) . Calibration of the infrared gun is performed by moving an
adjustment knob while aiming at a metal block of known temper
ature. The metal calibration block is painted flat black and has
a circular temperature dial mounted directly to it (Figure 9).
The original 1975 Ford E250 van had 100,000 miles when it was re
placed in the winter of 1984 and 1985 with a 1985 Ford E350 van.
Conversion work of the new van was performed in the Iowa DOT Ma
terials Laboratory. The automatic transmission of the original
van was rebuilt once, the brakes were rebuilt several times, and
the engine had a value job and new timing chain, but overall the
van performed extremely well considering the abusive stop-go use.
The Road Rater mechanism itself has also been very rugged and
trouble-free. Most problems have been minor such as broken sen
sor wires at plug connections and frequent oil filter replace
ments for the hydraulic system.
The Iowa DOT paid $25,000 for its Model 400 Road Rater mounted in
a van in 1975. Another Model 400 Road Rater was purchased in
1986 due to increased demand for deflection testing and cost
$40,000 mounted in an Iowa DOT van. Two Road Rater crews operate
simultaneously in the springtime annually. Safety vehicles with
signs (or a flashing arrow board) are used to control traffic and
protect the test vehicle (Figure 10).

Figure 4 Velocity Sensor on Top of Ram
Figure 5 Auxiliary Motor
PAGE 9
PAGE 10
Figure 6 Control Console and Display Meters
Figure 7 Pavement Temperature Measurement

PAGE 11
Figure 8 Raytek Infrared Temperature Gun
Figure 9 Infrared Temperature Gun Calibration

PAGE 12
Figure 10 Road Rater Safety Vehicles
TEST PROCEDURE
The Road Rater test procedure (Test Method No. Iowa 1009-B) is
included in Appendix A of this report. Annual testing is per-
formed in the outside wheeltrack during the months of April and
May when the roadways exhibit the greatest instability. Test
data is recorded on coding sheets for processing by an IBM 3081
mainframe computer. All base relationships which convert pave-
ment deflections and deflection basin shapes to Structural
Ratings and Soil Support K Values, respectively, have been pro-
grammed into the computer.
Joints and mid-panel locations are tested on rigid and composite
pavements. The ram is placed about one foot from the joint, and

PAGE 13
all sensors are positioned on the same pavement panel behind the
joint. The condition of joints is evaluated by comparing the
Structural Ratings and Soil Support K Values at joints with mid
panel values. In general, the mid-panel 80th Percentile Struc
tural Rating is an adequate basis for design of asphaltic
concrete overlays.
Thirty tests per control section are generally considered the
minimum necessary to yield statistically valid information. For
logistical reasons, only 10 joints are tested for each control
section over 2 miles in length. Also due to logistical reasons,
only 15 mid-panel locations and 6 joints are tested for control
sections 2 miles or less in length.
Test data collected in this manner is used for inventory purposes
in the pavement management system. It is also used to determine
the nominal thickness of a.c. and p.c.c. overlay designs on indi
vidual projects. Detailed project design requires deflection
readings every 100 to 200 feet and has never been done in Iowa
due to the time required for the extensive evaluation.
Calibration procedures for the Model 400 Road Rater involve use
of the monitor position of the power switch, the vibrate position
of the function switch, the frequency control, and the level con
trol to adjust the mass displacement to the desired setting. A
daily repeatability check is also performed. Once a month, the
monitor circuit (including the sensor and read-out equipment) and
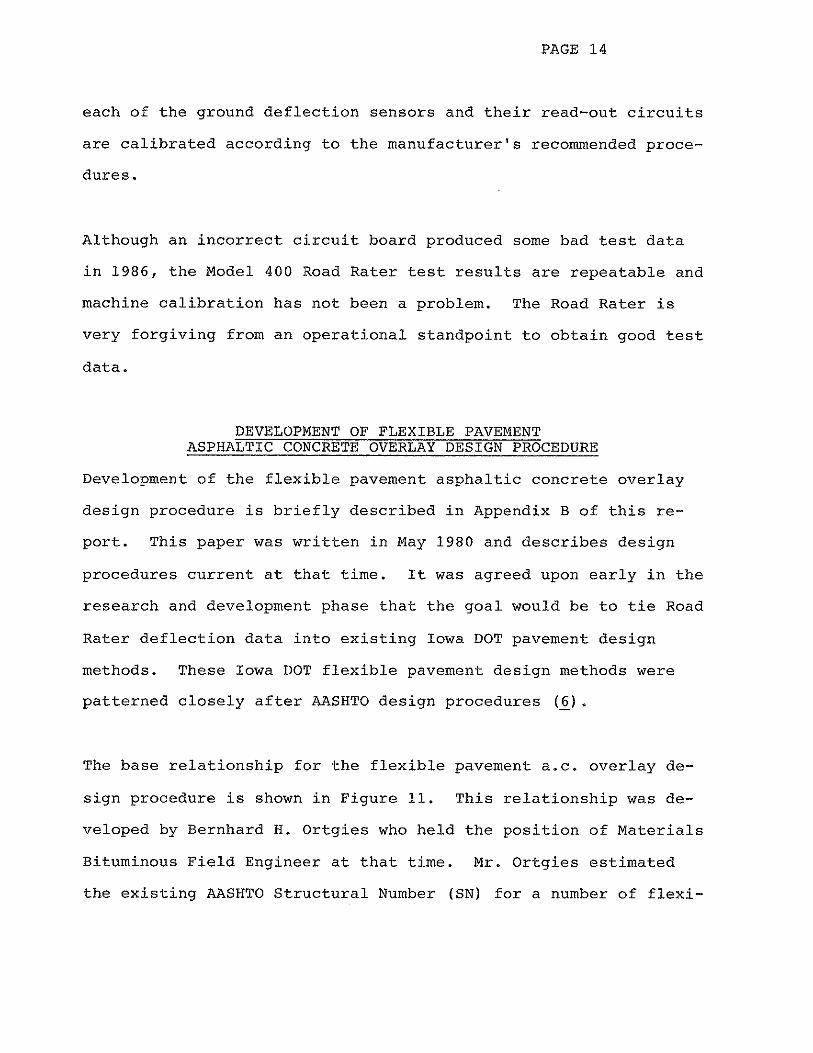
PAGE 14
each of the ground deflection sensors and their read-out circuits
are calibrated according to the manufacturer's recommended proce-
dures.
Although an incorrect circuit board produced some bad test data
in 1986, the Model 400 Road Rater test results are repeatable and
machine calibration has not been a problem. The Road Rater is
very forgiving from an operational standpoint to obtain good test
data.
DEVELOPMENT OF FLEXIBLE PAVEMENT ASPHALTIC CONCRETE OVERLAY DESIGN PROCEDURE
Development of the flexible pavement asphaltic concrete overlay
design procedure is briefly described in Appendix B of this re-
port. This paper was written in May 1980 and describes design
procedures current at that time. It was agreed upon early in the
research and development phase that the goal would be to tie Road
Rater deflection data into existing Iowa DOT pavement design
methods. These Iowa DOT flexible pavement design methods were
patterned closely after AASHTO design procedures (~) .
The base relationship for the flexible pavement a.c. overlay de-
sign procedure is shown in Figure 11. This relationship was de-
veloped by Bernhard H. Ortgies who held the position of Materials
Bituminous Field Engineer at that time. Mr. Ortgies estimated
the existing AASHTO Structural Number (SN) for a number of flexi-

G z f-<( a: ....! ..::( c: :::> f-0 :::> c::: !-(/)
0 w !-<( ::;: '-. (/)
w
10
9
8
I 7
6
5
4
31
2J
. ~ ..
STRUCTURAL RA TING;::::::
Figure ·11
FLEXIBLE PAVEMENT
BASE RELATIONSHIP
. . . . . . .
• ... . .
. . . . .
..
AASHTO STRUCTURAL NUMBER CORRELATION COEFFICIENT R = -D.874
. .
..
.1. ••••
1+-~~~~~~~~~~~~~~~~~~~~~~~~~~~~~~~~~~~~~~~~
.4 .5 .6 . 7 .8 .9 1.0 2 3 4 5 6 7 8 9 10
AVERAGE ROAD RATER DEFLECTION (MILS) AT 80°F
-0 )> G:> m
u;

·····-·-·-·-·-·-·-·-·-·-·- -·-·-·-·-· ----·-·-·-·-·-·--------
PAGE 16
ble pavements ranging from inverted penetration surfaces on minor
primary routes through full-depth a.c. Interstate highways.
These estimated Structural Numbers were called Structural Ratings
(SR's) to distinguish them from direct usage of AASHTO Flexible
Design Guide Values. Mr. Ortgies used his best judgment to as
sign SR values that would either relate to or be identical to
AASHTO SN's developed by Iowa DOT design procedures. The present
condition of the pavement was considered when assigning SR val
ues, and AASHTO values were depreciated as deemed appropriate to
account for pavement deterioration, pavement performance, materi
als and traffic.
Estimated Structural Ratings were graphically related to average
Sensor #1 deflection values in the flexible pavement base re
lationship. Average Sensor #1 deflection values were temperature
corrected to 80°F using the principles developed by H. F.
Southgate and R. c. Deen (ll. A nomograph shown on page 54 was
developed by Douglas M. Heins, Iowa DOT. This nomograph temper
ature corrects Sensor #1 deflection values to 80°F and converts
them to Structural Ratings.
For design purposes, the 80th Percentile Structural Rating is
used so that most or all weak areas are sufficiently strengthened
by nominal a.c. overlay thickness design after normal surface
preparation and patching procedures. The existing 80th
Percentile Structural Rating is subtracted from the required
Structural Number for the design life and the difference divided

PAGE 17
by an assigned coefficient to determine the nominal overlay
thickness needed.
Assumed soil support values were used until 1983 when the flexi
ble pavement - a.c. overlay design procedure was refined by in
corporating soil support values determined from the Road Rater
deflection basin. Development of soil support charts based on
Road Rater deflection basins is discussed elsewhere in this re
port. Soil support values are expressed as Westergaard's modulus
of subgrade reaction (K) on Road Rater computer printouts as
shown on page 47.
The Surface Curvature Index (SCI) is the difference in mils be
tween Sensor #1 and Sensor #2. The SCI divided by average Sensor
#1 deflection (SCI/SENS 1) provides a ratio which was incorpo
rated into the computer program in 1978 for future study because
of research performed by M. C. Wang and T. D. Larson of
Pennsylvania State University and A. C. Bhajandas and G.
Cumberledge of Pennsylvania Department of Transportation (~).
Although use and application of the SCI/SENS 1 Ratio was not
thoroughly understood in 1978, it was used later in 1983 to de
velop subgrade reaction K charts.
The flexible pavement a.c. overlay design example in Appendix B
illustrates that calculations are few and simple to perform when
a Road Rater computer printout and Primary Pavement Determination
traffic appendix are provided. This flexible pavement - a.c.

PAGE 18
overlay design procedure based on Road Rater deflection data has
worked very well in Iowa. This may be explained by the close
proximity of Iowa to the AASHO Road Test conducted at Ottawa,
Illinois, in the late 1950's. Many pavements designed in Iowa
since that study have now reached terminal serviceability, and
the performance curves and concepts of the AASHO Road Test have
been verified as reasonably correct.
DEVELOPMENT OF RIGID AND COMPOSITE PAVEMENT-ASPHALTIC CONCRETE OVERLAY DESIGN
PROCEDURE
.Since about 83 percent of Iowa's Primary Highway System consists
of either rigid or composite pavements, there was a great need to
develop a rigid and composite pavement asphaltic concrete overlay
design procedure. This was attempted prior to 1981 at the 25
Hertz and 58 percent mass displacement settings, but no pattern
was found for the difference in deflection on sound concrete and
the deflection on broken or unsound concrete. It was felt,
therefore, that the Model 400 Road Rater had insufficient force
to evaluate rigid and composite pavements. This thinking was
prevalent until a FHWA short course entitled "Pavement Management
Principles and Practices" by ARE, Inc. of Austin, Texas was con-
ducted in Ames, Iowa from November 30 to December 2, 1981. The
instructors were W. Ronald Hudson and John P. Zaniewski. Dr.
Zaniewski indicated that the Dynaflect had been favorably corn-
pared with the U.S. Army Corps of Engineers' Waterways Experiment
Station (WES) Vibrator in a study conducted by H.J. Treybig (~).

PAGE 19
This paper revised our thinking that light load Nondestructive
Testing (NDT) equipment could simulate heavy load NDT equipment.
Mr. J. W. Johnson, President of Foundation Mechanics Inc., was
consulted to determine the best setting to use to evaluate rigid
and composite pavements. Mr. Johnson recommended a setting of 30
Hertz and 68 percent mass displacement which produces a peak-to
peak force of 2,000 pounds. This is the maximum force output of
the Model 400 Road Rater.
A work plan was developed in January 1982 to evaluate Road Rater
application to rigid pavements and is shown in Appendix C of this
report. The basic strategy was to search for correlations be
tween Road Rater deflection readings and various rigid pavement
performance variables. The Road Rater was correlated to the FHWA
"Thumper" in April 1982 as itemized under Steps 6 and 7 of the
work plan. Unfortunately, the 30 Hertz frequency was the only
Road Rater frequency which would not function properly. Since
the 30 Hertz frequency was inoperative, the 25 Hertz and 58 per
cent mass displacement setting was used to correlate the Road
Rater to the FHWA "Thumper".
Road Rater deflections at the 1,185 pound peak-to-peak force cor
related very well to 9,000 pound FHWA "Thumper" deflections (Fig
ure 12). Data to perform this correlation was obtained from 39
different pavement sections ranging from 10" of p.c.c. pavement
or 25" of a.c. pavement to a newly graveled unpaved road (10).

.!!J. :E c: .2 ti "' o; c ~
"' a. E ::>
.t:: .... <i: 3: J: u.
130
120
110
100
90
80
70
60
50
40
30
20
10
Figure 12
COMPARISON OF THE IOWA DOT ROAD RATER DEFLECTION AND THE FHWA THUMPER DEFLECTION
D
• *~: '-'·* .. .
• . • * * ;,
<:," '°!)·
e;;:..' ~
I:>~ . ~ o'b- <:,"!> ~ f;'
~ ~ ~ ""' \:: <:,. ./:.'"
0
/,.- ortJ e' Ci
""~ ~ ~, ~o ,<,."<::- q;.'b-
~' c?
•
• Flexible Pavements *Rigid Pavements o Other
/
0
O+-'--.-~....,..~-.~~.--~...-~....-~-...~--..--~...-~-.-~-.-~-r~~
0 1 2 3 4 5 6 7 8 9 10 11 12
Road Rater Deflection, Mils
" J> G) rn N 0
-·- -----, ~--------·-:--·-.~~--''.''"'=---:--:·

PAGE 21
The FHWA Thumper tested most of the 39 pavement sections at the
3,000, 6,000 and 9,000 pound force settings. A linear relation
ship existed among deflections at these force settings. That is,
the 6,000 pound deflection was twice the 3,000 pound deflection,
and the 9,000 pound deflection was three times the 3,000 pound
deflection. This information provided the confidence that the
Model 400 Road Rater had sufficient force to evaluate rigid and
composite pavements.
An expert panel was proposed in Steps 3 and 4 of the work plan to
estimate depreciated SN coefficients and nominal a.c. overlay
thicknesses required on 23 test sections (each 1/2 mile in
length), but the panel could not be assembled in 1982. Steps 1
and 2 of the work plan to determine structural composition and
crack and patch survey of 23 test sections was accomplished, how
ever, as was Step 5, Road Rater deflection testing at the 30
Hertz frequency when it was repaired in September 1982. An unu
sually wet summer and fall in 1982 permitted valid Road Rater
test information to be obtained in October and November 1982.
The crack and patch survey in Step 2 of the work plan was per
formed according to Iowa Test Method No 1004-C included in Appen
dix D of this report. Cracking, C, is the linear feet of
cracking 1/4" wide or sealed per 1,000 square feet of pavement.
Patching, P, is the square feet of surface or full depth patches
per 1,000 square feet of pavement. The crack and patch deduction
on rigid pavements is 0.09 multiplied by the square root of the
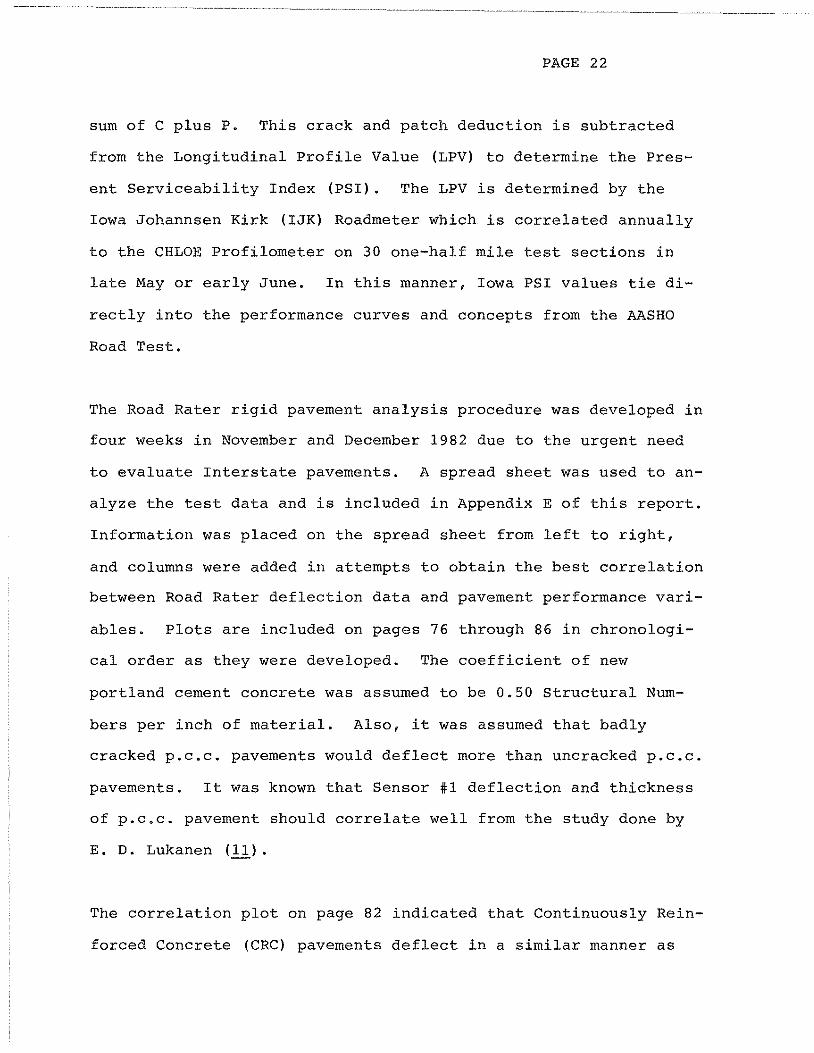
PAGE 22
sum of C plus P. This crack and patch deduction is subtracted
from the Longitudinal Profile Value (LPV) to determine the Pres
ent Serviceability Index (PSI). The LPV is determined by the
Iowa Johannsen Kirk (IJK) Roadmeter which is correlated annually
to the CHLOE Profilometer on 30 one-half mile test sections in
late May or early June. In this manner, Iowa PSI values tie di
rectly into the performance curves and concepts from the AASHO
Road Test.
The Road Rater rigid pavement analysis procedure was developed in
four weeks in November and December 1982 due to the urgent need
to evaluate Interstate pavements. A spread sheet was used to an
alyze the test data and is included in Appendix E of this report.
Information was placed on the spread sheet from left to right,
and columns were added in attempts to obtain the best correlation
between Road Rater deflection data and pavement performance vari
ables. Plots are included on pages 76 through 86 in chronologi
cal order as they were developed. The coefficient of new
portland cement concrete was assumed to be 0.50 Structural Num
bers per inch of material. Also, it was assumed that badly
cracked p.c.c. pavements would deflect more than uncracked p.c.c.
pavements. It was known that Sensor #1 deflection and thickness
of p.c.c. pavement should correlate well from the study done by
E. D. Lukanen <.b!J·
The correlation plot on page 82 indicated that Continuously Rein
forced Concrete (CRC) pavements deflect in a similar manner as

PAGE 23
non-reinforced concrete pavements, but cracks were less than 1/4"
wide and, therefore, CRC pavements did not follow this depreci
ated SN model. The correlation plot on page 83 excluded CRC
pavements, but a few badly cracked pavements still would not fol
low the depreciated SN model based on the amount of cracking, C.
The SCI/SENS 1 ratio compensated for this problem and was incor
porated on the plot on page 84.
The base relationship to evaluate rigid pavements with the Road
Rater is shown on page 85 of Appendix E and was verified with ad
ditional test data obtained in 1983. These additional data
points are shown added to the base relationship on page 86. Some
badly cracked pavements deflected less than expected, and this
may be due to unusually good subgrade support, interlocking pave
ment pieces because of tighter cracks or joints, or collapsed
pavement pieces into voids beneath the pavement. If pavements
behaved in a totally predictable manner based on thickness and
amount of cracking, there would be no need to perform Road Rater
deflection testing. As it is, the Road Rater can be used to
identify a "rubble" condition in the lower portion of a rigid or
composite pavement. The Road Rater tends to read the inches of
sound material from the top of the pavement to the first delami
nation plane. This was illustrated by pavement cores drilled on
Iowa's 21 Long Term Monitoring (LTM) Sections for a FHWA Study
(see Appendix F). The Road Rater can also be used to determine
the subgrade support values for each individual pavement in the
critical spring-thaw period annually. The rigid and composite

PAGE 24
pavement-asphaltic concrete overlay design procedure was reported
on December 14, 1982, and used the nomograph on page 57 in a sim-
ilar manner as was used in the flexible pavement - a.c. overlay
design procedure. The mid-panel 80th percentile structural rat-
ing is sufficient in most cases to design an a.c. overlay which
will adequately strengthen the joints. Comments were solicited
on January 4, 1983, on the new deflection-based a.c. overlay de-
sign procedure, and a presentation was given on February 10,
1983. At the presentation, it was suggested that verification
data be collected to develop confidence as was done with the
flexible pavement-a.c. overlay design procedure. A Soil Support
K Value Chart for rigid and composite pavements had also been de-
veloped at this time. The work plan to evaluate rigid and com-
posite pavements was considered completed.
DEVELOPMENT AND VERIFICATION OF SOIL SUPPORT K VALUE CHARTS FOR RIGID, COMPOSITE AND FLEXIBLE PAVEMENTS
Soil Support K Value Charts were developed since it was recog-
nized that the existing subgrade soil support could affect the
overlay thickness required by several inches when using the
AASHTO Design Chart for Flexible Pavements, pt=2.5. It was also
recognized that subgrade moisture could affect Road Rater de-
flection readings, but that this effect could be normalized by
annual testing in April and May (only) when the pavements are in
their weakest condition after the frost is out. Subgrades are
generally saturated in April and May and can be identified by
soil type or density through Road Rater deflection testing in
PAGE 25
this condition. At other times of the year, all subgrades are
firm and deflect in a similar manner when tested with the Road
Rater. It is extremely difficult or impossible to seasonally ad
just Road Rater deflection data taken at other times of the year
to a springtime condition unless detailed soils information is
available. The only exception is a wet fall following an unusu
ally wet and cool summer when Road Rater testing conditions may
be very similar to springtime conditions. Since detailed soils
information is not always available and since soil types can vary
somewhat on the same pavement section, all Road Rater testing is
conducted in April and May. This also restricts pavement temper
atures to a lower range to prevent joint lockup on rigid and com
posite pavements, and to prevent large temperature corrections to
deflections on flexible pavements.
The base relationship for Soil Support K Values for Rigid and
Composite Pavements From Road Rater Deflection Dishes is shown in
Figure 13. This relationship was developed using a similar ap
proach as was used by R. W. Kinchen and W. H. Temple in Louisiana
(ld) . The Louisiana DOT was one of the few states in early 1983
that had done much research and development work on rigid pave
ments using lightweight NDT equipment. Dynaflect was used in
Louisiana DOT research, and Spreadability or Percent spread ver
sus Dynaflect Sensor #1 Deflection was used to determine the sub
grade strength (modulus of elasticity, Es). Spreadability
conveyed as percent was the average of five Dynaflect sensor
readings divided by the Sensor #1 deflection reading. The

"
0.00
0 0.10
f-<l'. a: 'r-
(f)
z w (f) ...__._
0 0.20 (f)
0.30
Figure 13
Soil Support K Values For Rigid & Composite Pavements
From Road Rater Deflection Dishes LEGEND
0 611 PCC W 611 PCC, H" GRAVEL L?:.. 6" PCC, 3" STAB. f~. 7" PCC ] H" PCC (;] 811 PCC ~ 8-}" PCC, 4" CL. A SB
1 9" PCC 9'' PCC, 4'' CL. A SB 10" PCC 10" PCC, 4" GSB
" 'ls <:i + /\ "
+: "" .['l <:i ..,. ,._']..
.,, " + ,._<:;
~ 'I')
" ~
4.0 3.0
"" ~'i
']..')
+:'1-
2.0 1.0
AVERAGE SENSOR 1 DEFLECTION (MILS)
y @
0.0
-c> )> G> rn N
"'

0.00
0.10
0.20
0 f- 0.30 <t a: ,...-
(./)
z w (./) --.... 0 (/)
0.40
0.50
0.60
9.0
Figure 14·
Soil Support K And S Values For Flexible Pavements
From Road Rater Deflection Dishes
LEGEND 0 Flexible Pavement Sections
0
0
8.0 7.0 6.0 5.0
s" +'"'); ~
'
..,.s "'
4.0 3.0
AVERAGE SENSOR 1 DEFLECTION (MILS)
2.0 1.0 0.0
" )> G'.l rri
N -..J

-·-·-·-·-·~~-·-·~~·-·-·~·~·-···· ---. ----
PAGE 28
Louisiana DOT pavement evaluation chart was a modified version of
a chart developed by N. K. Vaswani (J:2).
Soil subgrade factors, as used by the Iowa Department of Trans
portation rigid and flexible pavement design, were developed by
correlating Plate Load Test information to standard Proctor Den
sity and AASHTO Soil Group Index. These values have provided a
basis for Iowa designs since the adaptation of the AASHO Road
Test Guides during the late 1950's.
These historical subgrade values were applied for the development
of the current Road Rater deflection basin derived "K" charts.
Initial testing for this portion of the program was done on new
roadways which contained known subgrade soils and subbase treat
ments. Deflection basins were developed for typical soil types
and combinations of various soils and granular subbases. These
first comparisons produced marginal results. It was apparent
that a greater number of soil and subbase factors were needed.
Load testing data for Illinois soils, published by Michael I.
Darter (14), compared AASHTO soil types and their strengths at
various states of saturation. This information was incorporated
with Iowa "standard" subgrade design information. Using these
new "expected" values, Road Rater K values were developed to pro
vide answers for the various deflection basin problems.
In 1983 extensive pavement and subgrade testing was done for a
selected study group of Iowa pavements (21 LTM Sections). Soil

PAGE 29
core samples were obtained at individual Road Rater test points.
These samples were tested for in-place density, moisture content
and AASHTO classification. Items investigated included moisture
and in-place density effects for various soil types, values for
glacial clay treatments commonly used in Iowa, common values for
sand and gravel or crushed stone "special" treatments and effects
of high saturation levels on silts and granular subbase. Sample
comparisons of values are shown in Tables 1-5 of Appendix G.
The results obtained by this testing verified that individual ma-
terials and specific conditions yield reproducible, predictable
Road Rater deflection basins. The necessary load testing to ob-
tain companion "Westergaard" information was not performed; how-
ever, the assigned values provide a reasonable design range and
the relationships for various materials are acceptable.
DEVELOPMENT OF TEMPERATURE CORRECTIONS FOR RIGID AND COMPOSITE PAVEMENTS
Temperature correction factors for Road Rater deflection data
were more difficult to determine for rigid and composite pave-
ments than for flexible pavements. This was due to discontinui-
ties because of joints, joint lockup during high pavement
temperatures, and slab curling due to temperature differentials
on rigid pavements. Temperature corrections for composite pave-
ments were originally thought to be functions of the a.c. overlay
thickness, materials properties of the a.c. overlay, and the con-
dition of the underlying p.c.c. pavement. A study of the effects
of temperature on Iowa's rigid pavement study sections is shown

PAGE 30
in Figure 15. A full range of temperatures could not be obtained
at one time and, therefore, the seasonal effects and influence of
different subgrade conditions complicated attempts to develop a
general temperature correction factor or equation which could be
applied to all rigid pavements. Most of the rigid pavement tem
perature study sections in Figure 15 had very flat slopes indi
cating very little influence on the Structural Ratings from
temperature. Some rigid pavements do have a tendency to deflect
more at high pavement temperatures, however, and this is attri
buted to slab curling at mid-panel which is concave in shape and
results in higher Road Rater deflections. Since no well-defined
trends could be established from Figure 15, no temperature cor
rection factors are applied to rigid pavements. This is a log
ical strategy since all Road Rater testing is conducted in April
and May only when the average pavement temperature is about 70°F,
and the range of temperatures is relatively small. Composite
pavement temperature study sections are shown in Figure 16. The
slopes of most composite pavement lines were similar and resulted
in the following temperature correction equation:
Temp.Corrected SR = Non-Temp. Corrected SR
+(70°F-Pave.Temp.) (-0.0145 SR/°F)
where the pavement temperature is in degrees Fahrenheit. This
temperature correction equation was developed in December 1983,
and it was incorporated into the Road Rater computer program in
1984. Many of the data points in Figure 16 have been collected

""'"""::::,;,.c.:.:
(.'.) z ~ D:'.
~ :::i
b :::i D:'. f-([)
6 --------
FIGURE 15 ROAD RATER STRUCTURAL RATING
VERSUS PAVEMENT TEMPERATURE
FOR RIGID PAVEMENTS
------ 0
------- x --------- ¥ -------- 0 5~-·-·-·-·-·-·-·-·~-- ·--·-·-·-·r--·---"' J~ "' x x -------- 6. 0
. A (> X.::,_~===-===~;::==::..::=:~':=~~>=~~~~--;~"'"-~..,,':' ::.2_~'=---~--=::-~-=:-::---------z;.::-=:= 9 -------- . <> 0 0 -- -~ - =----- ~ 0 - -
-~=------~-::::-:~--~4: I --75: - - ~---_----'" b • ··----------~ ·--
0 w---------- ----3
21
1
0
0 10
LEGEND:
20 30 40 50 60 70
* <>
80
<>
90
PAVEMENT TEMPERATURE, DEGREES F
0 0 0 IA 160 POLK CO & & & IA 415 POLK CO -&~ US 30 STORY CO
-0--0-~ IA 1 7 BOONE CO ~X US 30 BOONE CO
100
---------------
110 120 130 140
+-+-+ IA 17 POLK CO +-->!<---* US 30 MARSHALL CO
" )> G) fT1
w ~

('.) z ~ a::
~ :::J
tJ :::J a:: fUJ
6
FIGURE 16 ROAD RATER STRUCTURAL RATING
VERSUS PAVEMENT TEMPERATURE
FOR COMPOSITE PAVEMENTS
--- !:. D --------------= -L__ " o-; " . ----------
x ------- -------- -------- x _., -~-~.-=- -~---~- -------------------------- w ----x----- . ------- . ;Z___ 'j ·0.0145 SR/"r , ~~----~·=---=·::::.: -- ---------- . x <> _______ *"_ ------- ------------~-------
3
-- -- ----' ------ -------- - + + + -------=t: --- ---- 0 ---
-- -----
---------
2
i
0
0 10 20
LEGEND: DOD A A A
30 40 50 60 70 BO 90
PAVEMENT TEMPERATURE, DEGREES F
IA 14 MARSHALL CO US 30 BOONE CO
'
-0---0--<7 IA 17 BOONE CO ~~ US 65 POLK CO
100 110 120 130 140
+-+---+ IA 330 MARSHALL CO +-+---¥ US 69 POLK CO
--0 )>
"' ,.,., w N

PAGE 33
since December 1983, and they have generally supported this
equation.
VERIFICATION OF FLEXIBLE, RIGID AND COMPOSITE PAVEMENT BASE RELATIONSHIPS
The flexible pavement - a.c. overlay design procedure has yielded
reasonable results as described on page 50. In addition, Table 6
in Appendix G compares Road Rater a.c. overlay design estimates
with District #5 recommendations on Iowa 22 and Iowa 70 in
Johnson and Muscatine Counties. Road Rater a.c. overlay design
estimates were reasonable and compared favorably with District #5
recommendations.
The rigid and composite pavement base relationship is verified by
core samples drilled in October and November 1983 on 21 Long Term
Monitoring Sections. These cores are shown in Appendix F of this
report. Road Rater deflections are affected by subgrade condi-
tion, strength of materials, amount of cracking, delamination
planes, temperature, etc., so Structural Ratings do not always
agree with core condition and thicknesses. They do agree in gen-
eral, however. For example, core #127 should have a structural
number of 5.99 ( (2:\" AC x 0.44)+(10" PC x 0.50) = 5.99). The
Road Rater structural rating on October 17, 1983 was 5.60. Core
#128 should have a structural number of 6.65 ((3 3/4" AC x
0.44)+(10" PC x 0.50) = 6.65). The Road Rater structural rating
on October 17, 1983 was 6.65. The Road Rater was able to distin-
guish the difference in a.c. thickness between core #127 and core
PAGE 34
#128. The Road Rater could also detect different thicknesses of
sound concrete and rated cores correctly relative to each other.
One of the best cores was #285 which had a structural number of
10 • 9 5 (( 7 ! " AC x 0. 4 4) + ( 2 2 ~ " ATB x 0. 3 4) = 10 . 9 5) • The Road
Rater structural rating on November 3, 1983 was 10.00+. One of
the worst cores was #303 which had a structural number of 5.84
((2 3/4" AC x 0.44)+(9lt" x 0.50) = 5.84). The Road Rater struc-
tural rating on November 4, 1983 was 2.55 which accounted for the
condition of D-cracked concrete missing from the core.
Tables 7 through 12 in Appendix G show Road Rater a.c. overlay
designs for rigid and composite pavement study sections. Pave-
ments ranged in condition from very poor to new. Overlay designs
were reasonable although very thick overlays (or reconstruction)
were required on most Interstate pavements.
VERIFICATION OF COEFFICIENT OF ASPHALTIC CONCRETE
The AASHTO design coefficient for asphaltic concrete for a Type A
or Type B surface course was 0.44 structural numbers per inch of
material. This coefficient for asphaltic concrete of 0.44 was
verified on flexible pavements by a study of Road Rater de-
flections before and after placing asphaltic concrete overlays.
The results of this study are shown in Table 13 of Appendix G.
The average coefficient for asphaltic concrete was 0.52 struc-
tural numbers per inch of material which compares favorably with
the AASHTO value of 0.44. Extra asphaltic concrete overlay

PAGE 35
thickness in wheeltracks to remove rutting may be responsible for
study coefficients greater than 0.44.
The results of a similar study to verify the coefficient for
asphaltic concrete of 0.44 on rigid pavements are shown in Table
14 of Appendix G. The average coefficient for asphaltic concrete
on rigid pavements was 0.45 structural numbers per inch of mate-
rial which also compares favorably with the AASHTO value of 0.44.
APPLICATION OF ROAD RATER VALUES FOR ASPHALTIC CONCRETE OVERLAY DESIGN
The Iowa Road Rater Design Method has been simplified so that it
may be easily understood and used by the widely diverse groups of
individuals who may be involved in pavement restoration and man-
agement. Basic "effective thickness" values were established by
testing various new pavements. Standard AASHTO flexible coeffi-
cients were used to describe these design sections and applied as
a scale for the Road Rater deflection information. Thus, all
test information is displayed in effective new pavement units.
These values may be easily converted for percent of deterioration
or remaining life calculations.
The designer may determine a required thickness by any preferred
design method. It is only required that the Road Rater subgrade
values or their equivalent be applied to the overlay design. The
existing effective thickness is subtracted from the required
thickness or total required structure to arrive at a desired
overlay thickness. This procedure has been cross checked with
PAGE 36
recommended AASHTO Interim Guidelines since the system was first
introduced in Iowa on secondary pavements in 1979. Correlation
has been excellent when the roadway conditions are "normal" or
average. Investigations have been made by other test methods
when Road Rater values have differed significantly from the re
quired AASHTO values. In all cases to date, the additional test
ing has verified the information provided by the Road Rater.
These verifications have ranged from cases of hidden deteri
oration to pavement sections which are significantly different
from that indicated by existing records.
VOID DETECTION TESTING
Experimental void detection testing using the Road Rater was con
ducted in October 1984 on an I-80 subsealing project in Scott
County. The purpose of this study was: 1) To determine if the
Road Rater could locate voids under a pavement, and 2) to deter
mine how well the contractor was filling voids.
Road Rater testing to locate voids must be done at cool temper
atures when the joints are not locked up. Therefore, this type
of Road Rater testing is normally done in the morning hours - es
pecially in the summer months. Testing was conducted in the out
side wheeltrack going against traffic at all joints and at
midpanel cracks in the test section. This requires lane closure
with cones to protect the testing crew and traveling public. The
purpose of testing against traffic is: 1) To string the sensors
out on the down-stream panel where voids are located so that Road

PAGE 37
Rater K Value Soil Support Charts can be used, and 2) to place
the weight of the Road Rater van on the up-stream panel to reduce
the effects of any pre-loading which may close the voids prior to
testing. The static load of the Road Rater in this configuration
is 1,480 pounds.
The minimum Road Rater soil support K value possible from the
data evaluation program is K=50. This was estimated to be the
lowest K value possible on saturated clays in springtime friable
conditions. Therefore, a sound 10" p.c.c. pavement over a void
would be expected to have an unusually low Structural Rating and
a soil support value of K=50.
The results of this study are illustrated by Table 15 in Appendix
G. Road Rater testing was conducted on a section of I-80 at the
joints on October 10, 1984, at 9:30 a.m. and a pavement temper
ature of 60°F before subsealing. The same joints were tested on
October 11, 1984, at 10:35 a.m. and a pavement temperature of
60°F two hours after subsealing. For a sound 10" p.c.c. pave
ment, the joints before subsealing had unusually low Structural
Ratings and soil support K values, but showed dramatic improve
ment two hours after subsealing. From this study it was con
cluded that: 1) The Road Rater can be used to locate voids
beneath a p.c.c. pavement, and 2) the contractor was doing a good
job of subsealing on this project. Further research using the
Road Rater for void detection testing is being conducted.

PAGE 38
ROAD RATER TESTING OF RETROFITTED LOAD TRANSFER DOWELS
Retrofitted load transfer dowels were installed in 1986 on the
eastbound lanes of I-80 at milepost 290 in Scott County. This 10
inch thick mesh-dowel pavement has 76' 6" joint spacing and was
built in 1960 on 4 inches of granular subbase. Diamond grinding
and subsealing was performed on both lanes before dowels were in-
stalled. Dowels were inserted in the driving lane and in both
lanes at some locations. Three or four bars were placed in each
wheeltrack in slots at mid-depth (or above) to avoid mesh. Slots
were partially filled with neat epoxy grout (no aggregate) which
was displaced by dowels. Slots were topped off with epoxy and
aggregate.
Table 16 in Appendix G illustrates Road Rater testing results on
pavement sections with and without retrofitted dowels. Testing
was performed on September 15, 1988 at 9:30 a.m. and at a pave-
ment temperature of 70°F. The Road Rater ram was placed on the
down-traffic side of cracks and joints where voids would be lo-
cated, if any.
Structural rating numbers and soil support K values were substan-
tially higher where dowels had been installed. The difference in
Road Rater deflections is very pronounced at the boundary between
doweled and undoweled pavement sections.

PAGE 39
The Road Rater could distinguish where retrofitted dowels had
been installed, and dowels appear to benefit the pavement through
two years of service.
CONCLUSIONS
This report summarizes our experience to date with the Road
Rater. Conclusions are as follows:
1. The Road Rater has been an effective tool to evaluate pavement and subgrade conditions for both flexible and rigid pavements.
2. An asphaltic concrete and portland cement concrete overlay design procedure based on Road Rater deflection data has been developed and is working well to date.
3. Void detection testing has been performed with encouraging results both in the Road Rater's ability to locate voids and in the verification of our analysis techniques.
4. Successful Road Rater research and development has made dynamic deflection data an important pavement management input.
REFERENCES
1. Heins, D. M., "Dynamic Deflections for Determining Structural Rating of Flexible Pavements", Final Report for Project HR-178, Iowa Department of Transportation, February 1979.
2. McPhail, H. B. "Guide for Primary and Interstate Pavement Design", Office of Road Design, Soils Section, Iowa Department of Transportation, October 1976.
3. Marks, V. J,, "Improving Subgrade Support Values With Longitudinal Drains", Interim Report for Materials Laboratory Research MLR-84-3, Iowa Department of Transportation, January 1984.
4. Marks, V. J., "Dynamic Pavement Deflection Measurements", Progress Report for Iowa Highway Research Board Project HR-178, Iowa Department of Transportation, May 1977.
5. Owners Manual Operation and Maintenance Guide for Model 400 Road Rater, Foundation Mechanics, Inc., A Wyle Company, No Publication Date.

PAGE 40
6. Operating Sub-Committee on Roadway Design, AASHTO Interim Guide for Design of Pavement Structures 1972, AASHTO, 1972.
7. Southgate, H. F., and Deen, R. C., "Deflection Behavior of Asphaltic Concrete Pavements", Research Report 415, Interim Report KYHPR-70-49, HPR-PL-1(10), Division of Research, Bureau of Highways, Kentucky Department of Transportation in Cooperation With U.S. Department of Transportation, Federal Highway Administration, January 1975.
8. Wang, M. C., and Larson, T. D. of Pennsylvania State University and A. C. Bhajandas and G. Cumberledge of Pennsylvania DOT, "Use of Road Rater Deflections in Pavement Evaluation", Transportation Research Record 666, Transportation Research Board, Washington, D.C. 1978.
9. Treybig, H. J., President of ARE Inc., "Comparison of Airfield Pavement Evaluation Using Light and Heavy Load NDT", A Paper Prepared for Publication by American Society of Civil Engineers, No Publication Date.
10. Marks, V. J., "Dynamic Deflections to Determine Roadway Support Ratings", Final Report for Project HR-245, Iowa Department of Transportation, February 1983.
11. Lukanen, E. o., "Evaluation of the Model 2000 Road Rater", Investigation No. 201 Final Report, Office of Research and Development, Minnesota Department of Transportation In Cooperation With U.S Department of Transportation, Federal Highway Administration, August 1981.
12. Kinchen, R. w., and Temple, W. H., "Asphaltic Concrete Overlays of Rigid and Flexible Pavements", Research Report No. FHWA/LA-80/147, Research Project No. 69-3B, Louisiana HPR 0010(004), Louisiana Department of Transportation and Development, Research and Development Section, In Cooperation With U.S. Department of Transportation, Federal Highway Administration, October 1980.
13. Vaswani, N. K., "Method for Separately Evaluating Structural Performance of Subgrades and Overlying Flexible Pavements", Highway Research Record No. 362, Highway Research Board, Washington, D.C. 1971.
14. Darter, M. I., "Design of Zero-Maintenance Plain Jointed Concrete Pavement", Report No. FHWA-RD-77-111, Federal Highway Administration, June 1977.

PAGE 41
APPENDIX A
METHOD OF TEST FOR DETERMINING PAVEMENT DEFLECTION USING THE
ROAD RATER

PAGE 42
Test Method No. Iowa 1009-B March 1985
IOWA DEPARTMENT OF TRANSPORTATION HIGHWAY DIVISION
Office of Materials
METHOD OF TEST FOR DETERMINING PAVEMENT DEFLECTION USING THE ROAD RATER
Scope
The Road Rater is an electronically controlled, hydraulically powered unit mounted in the back of a van type vehicle. The unit inputs a dynamic force into the pavement aOd measures the movement of the surface using velocity sensors. This velocity is integrated to show displacement which is referred to as pavement deflection. Pavement deflection is a measure of structural adequacy especially in the critical spring-thaw period occurring in April and May annually. The pavement deflection data can be used to predict the performance of the surface, the probable main-· tenance required, and the resurfacing needed to restore the surface to required structural cap-abi 1 ity.
Procedure
A. Apparatus
1. Road Rater (figure l) 2. Air Pressure Gauge 3. Temperature Equipment (Raytek Infrared
Gun) 4. Safety Support Vehicles
8. Test Record Form
Original data is recorded on a data processing coding form (see example on page 5). The following data is recorded:
1, Sheet number is recorded in the upper right-hand corner sequent i a 11 y from 01 to 99 per batch. Coding sheets with the same lab. number cannot be separated between batches. Therefore,. it may be necessary to stop one batch at sheet number 97 or 98 and start another batch at 01. In addition, the northbound sheet must always precede the southbound sheet in sheet order, and the eastbound sheet must always precede the westbound sheet for each lab. number. If more than one coding sheet is needed to record all data in one direction for a specific lab. number, the second codlng sheet must have an identical sheet number as the first coding sheet. Cross out the heading on the second coding sheet and print ncontinued 11
• Also, on the righthand side of the coding sheet (toward the middle), change the numbers in the vertical column to 13 through 24. This changes numbers on the first sheet precoded from 01 through 12.
2. County numeric designation in alphabetical order from 0 to 99 is entered.
3. Highway system is entered using the following codes:
U - United States (US) Route S - Iowa (State) Route I - Interstate Route C - County Route M - Municipal (City) Route A - Airport
4. State or county route designation is entered. This field may include .. letters as well as numbers to accommodate county routes (M-27 for example).
5. Beginning and ending mi 1epost on the primary system or mileage designation on the secondary system is entered. Mileposts are entered in ascending order for northbound and eastbound directions, and descending order for southbound and westbound directions.
6. Direction of the lane being tested is entered (N, S, E or W).
7. Pavement type is entered using the following codes:
PC - Portland Cement Concrete AC - Asphaltic Concrete SC - Seal Coat COMP - Composite Pavements, Asphaltic
Concrete Over Portland Cement Concrete
Seal Coat (SC) is to be used for inverted penetration roads only. If an asphaltic concrete or composite pavement has been seal coated, it is to be coded as AC or COMP, respectively.
8. Date tested is entered by month. day and year in a six-digit code as follows: February 22, 1984-022284.
9. Time is entered based on a 24-hour clock when testing begins.
10. lab. number is entered in sequential order as projects or control sections are tested. The first number represents the year tested. RA4-0001 is the first project tested in 1984 for example. A separate lab. number is used for joints on rigid and composite pavement sections.
11. Year built is the year of the most recent construction project. Do not consider a seal coat as the most recent construction project on an asphaltic concrete or composite pavement. for example, this pavement
Seal Coat 1984 3" AC 1969 9" PC 1949

Test Method No. Iowa 1009-B March 1985
is coded as a composite pavement built in 1969.
12. Observer is entered as the person operating the Road Rater and the person recording the test data.
13. Weather is entered as can best be described in five characters. CLEAR or CLOUD can be used to describe sunny or cloudy days, for instance.
14. Frequency in hertz is entered and must be either 25 or 30.
15. Beginning and ending pavement temperature for the direction tested is entered.
16,' Test type is entered and must either be left blank, coded JT for joint, or coded SI for supplementary information. All nonprimary, research and special testing (such as ramp testing or void detection testing) is coded as SI. The SI or JT codes remove Road Rater test data from the pavement management matrix listing.
17. History is entered by date tested, average structural rating and average soil support K value, History data is only recorded on one coding sheet (one direction) for each lab. number.
18. Location is entered by mi",epost, range (Road Rater console selection), Sensor 1 (per cent of meter), Sensor 2, .Sensor 3, Sensor 4 and remarks (an identification of a complete remark shown at the bottom of the coding sheet).
19. Remarks are entered and include lane designation on multi13.ne roadways, unusual conditions, etc. The first four positions in the Remarks Section of the coding sheet must match exactly to the remark identification at specific locations. SECL and SECH for superelevated curve low sidci and supereievated curve high side, respectively, are pre-coded and need not be explained in the Remarks Section of the coding sheet. One lab. number has provisions for eight different remarks (four remarks in each direction). This may be expanded by using the same procedure explained in Bl. of this test method for additional deflection readings (over 36 per coding sheet). That is, the extra sheet has the same sheet number, and the numbers 1 through 4 on the right-hand side of the coding sheet are changed to 5 through 8.
C. Test Procedures
1. Determination of testing frequency
PAGE 43
Page 2
a. The minimum number of individual tests for inventory purposes shall be obtained ;:i.ccording to the following schedule:
Test Section Length (Mil es)
AC and SC Pavements (Tests)
PC and COMP Pavements (Tests)
2.0 or less Over 2.0
Mid-Panel Joints Mid-Panel Joints
15 0 15 6 30 0 30 10
1. Individual tests should be equally spaced and offset so the tests in one lane are between the tests in the adjacent lane.
2. The test interval shall not exceed 1.0 mile (0.50 miles between tests in adjacent lanes).
b. Testing frequency shall be as noted or as directed by the engineer for special test sections, research projects, or voids detection testing.
2. Preparation prior to testing
a. Turn on fan switch which ventilates tr.e engine compartment. Also, open any engine compartment vent doors (if any),
b. Check engine oil level.
c. Start the engine and allow to run for a five minute warm-up period.
d. Check air pressure in the two upper air springs with a good tire air pressure gauge. Add air if required to bring the spring pressure to 50±5 psi.
e. Check air pressure in the six center air springs. This check must be made with the small valve that separates the two sets of air springs in the open position (clockwise to open). Add air as may be required to bring this pressure to 40+5 psi. Close the small valve (counter-clockwise) until finger-tight.
f. Install the channel that holds the sensors in the recess at the base of the foot. lock the channe 1 in p 1 ace with set screws. Install Sensor No. 1, Sensor No. 2, Sensor No. 3 and Sensor No. into the channel and secure electrica· connections to designated recept i c 1 es.
g. On the console (figure 2) within the vehicle place the power switch to "monitorn. Hold the function switch to "elevate". Hold the movement switch ;n the "raise" position until the elevator cylinders are "full up" against the stops.

PAGE 44
Test Method No. Iowa 1009-B Page 3 March 1985
h.
j.
k.
With the unit in the "full up" condition lift the upper lock rings on the elevator cylinders and remove the two sets of mechanical locking tubes.
With the power switch to '1monitor11 and the function switch held to 11 elevate11
,
hold the movement switch to "lower" until the unit has been lowered sufficiently to elevate the van. Maintain these switch positions until no motion is e\iident (allow about 5 seconds).
With the function switch held to "elevate'' and the movement switch held to "lower", read the system hydraulic pressure on the gauge. The pressure should be 600+25 psi.
Set the frequency ·control according to the following schedule:
Pavement Type Frequency Setting
Interstate Pavements (Hertz)
30 30 25
Other Rigid (PC) & Composite Pavements Other Flexible (AC & SC) Pavements
1. Place the function switch to vibrate aod set Meter No. ff' to read 68 for the 30 Hertz frequency setting or 58 for the 25 Hertz frequency setting with the "level" control.
by adjusting
m. Change the po1•1er switch to "on" and observe the reading on Meter No. 1.
n. Repeat steps g, i, l and m to check the repeatability of the setting each morning prior to testing operation.
o. Raise the unit to the "full up" position.
p. Stop the engine and check the level of hydraulic oil in the reservoir. Use clean "Aeroshell Fluid 4" to bring the level to between 1 and 2 inches from the top of the reservoir.
3. Testing Operation
a. Record computer coding sheet heading information as described in Section B (Test Record Form) of this test method.
b. Calibrate the Raytek Infrared Temperature Gun. Usethe 11 indoor11 setti'ng and adjust the calibration knob to read exactly the temperature shown on the thermometer inset in the flat-black calibration standard.
c. Change the Raytek Gun setting to 11 outdoor'1,
take a beginning pavement temperature, and record this reading on the computer coding sheet.
d. With the engine running, position the Road Rater foot over the outside wheel track at the predetermined \<,·ngitudinal location. Test the driving lane (only) on 4-lane divided highways unless directed to do otherwise by the engineer. Test inside of a pavement widening crack if it occurs in the outside wheeltrack.
e.
f.
g.
h.
Place the vehicle in the 11 park position 11,
Lower the unit sufficiently to elevate the van, maintain the switch positions for about 5 seconds until no mot ion is evident.
With the power switch in "monitor 11
and the function switch in "vibrate" verify a 58 per cent or 68 per cent reading on Meter No. 1 for 25 Hertz and 30 Hertz, respectively.
Change the power switch to "on" and select a range that will yield a reading between 50 and 100 on Meter No. l.
Record the milepost location, range, and readings for Sensor #1, Sesnor #2, Sensor /f3 and Sensor #4. Note any changes in surface type.
j. Raise the unit and proceed to the next test location.
k. Take an ending pavement temperature reading after completing one direction of testing as described in steps b and c.
4. After testing operation
a. When traveling between testing locations assure that the elevator cylinders remain in the up position. If traveling more than 2 mil es without testing, engage the mechanical locking tubes and "lower" the unit to secure them.
b. Upon completion of testing, remove the channel holding the sensors.
D. Precautions
l. Do not move the vehicle with the unit in the do1vn position. A red light on the console indicates that the testing unit is too low to travel.
2. Before moving onto the traveled portion of the roadway, insure that all traveling safety is as required by the Traffic Engineering layout. Be sure that the required signs are in position and that all warning lights are functioning.
3. Read the Road Rater "Owners Manua 1 Operations and Maintenance Guide 11 before operating the unit.
4. Coding sheet entries must be neat and legible. Make sure 6's and O's or 4's and 9's do not look alike.

Test Method No. Iowa 1009-B March 19B5
Figure 2 Road Rater Control Console
Figure 1 The Road Rater
PAGE 45
Figure 3 Raytek Infrared Temperature Gun
Page 4

Fo<ma200<0 2·$< Office of Materials
Road Rater Tests Sheet No. la..LLJ '"
L1J I
County!Qflj Highway Sys.UJ Route I ,Z,/ ,81 Beginning MPibQ&J.13.iQJ Ending MP~11J.lJ.iQJ Pavement Ty;e IC101/!l,fl ~ate Testedlb,z,z ,z.,8/(1 Time! 1 /10/f.,SI Lab Number RA lfJ-l2to_i0_JJ Observer l(T),CC~1E1 L6f<,£1T1T1't. I I Weather~ FREO H<: M Beg.
0
~em;. Li£i2J
Direction l/1J Year Bui;; 18.QJ
" End Temp. L,5_iQJ "
Test W Type 72 42 s (25, 30) 6~ 66
,.J r-.Joinr; Sl·S1.1pplomenta1 Jrrfotmatmn/
t 2J
L2.J
t..?J
t..?J
t2J
l1J
t..?J
t..?.J
w L.2_1
t?.J
w
History: Date I s,9L.i._i_J Kl_i__ij Date SR l.i._i_J K l_i__ij Date SR l.i._i_J K Li_c_j 7G ~ ~ 86 92 S5 H * 1W
Location Reading I Reading
!Range Sensor ii s~nwr 2 Ser.so< 3 S<.>,-,so<.:.: Remarks Location Rar.ge se:"sor 1 S.:,"sor 2isenso< 3 senso< 4 Remarks I 28 30 32 3.1 36 28 42 .:.:a ~o s2 s" ss 56 I
Reading Location Rangel Ser.so< 'I Se,,sx 2jsensor 3lls~:--s.:Jr-!l_Remarks
8 10 12 14 16 HI 1!22
"ld.J.01.cQ010!0,z .:~:Qi.&18- .31<: .. z/,,_§ Z.LC.J.10J01Qf.O_iZ. .L£1.Ltft~ .!~.& .. c3~Q_L.LL ...L..L.J .L.l . ..L._l_ .L..L. .L..L..LL .LJL _ _j_L.[
ibL£6 .. 5Q.cQIQ,k.:&'..cl2.[·'~~r~4>1.,z81- z_, LLi.QJ.'2.cQQ,J,: .L'l.1'1:1.llf:t;,_ .L~Q. .:?,if._, ..LL . ..L.Ll. l_l_L. _._.!_..J_ .LL..L..L.l.L.L._j_L.J._
~/_i/.J .~O.a.Z.. .c8J.t.·1·• .~'t.j"Lto .al Z:i.L,8J.1010.JQ_~ .£~.'3.H: .ct.JI: .tl.18. ' 1 1
...L..L.J. '--L-'- ..... L.L..L. .LL .LLJ.LL-Ll..L.
~.l/.J . .2:t.Ml.M.:8A~+L'ti~1-L~4-.~ ''I ...L..L.J.' I .LL1.L.L..LL. ' ' ' ' ...L..L.J.L.L.l _ _l_.L..L..L.L..L.L..L.L._l_L.l
r~.../.l,il:,.:0...i.12.,Q.1.M .s,~+,lf:,b_ .. 13.i\I'.. "'30 , , , _i_]_.• • , .LLf .LL.. .LL .L..L. , , l...L..L.J .u .... L ..... L.. .L . .L-.L..L,.L..L..u ___ ..J_L.l
1
b1.Lz,.1,2;0iQlo,z .L7-'z.,.s,it_ .,~f. . .30 . , , 1
...L..L.J.L.L, , .L..l..... .L.L..L.L. .L.J _ _l_,.....L.. _l_Ll .L..LL. _L .• L....L..1.L.L.L.L.....L.L __ L.L..L.
~~-lo,0,0.0.&..1~-~l.s,z. .~.c?,_& , , , _J_L..J.L.l_l_1..L.LL.L.L..L.L..L..L. .... L . .J • ..L. , , .LL. .....J ...... L..L .• l_l_.L.L .• LJ....._j_L.J.
~~li31.5QJ.Q0.LL.Llf-,ol,,3·o 1 .~~-'z,o ~~..iii. _t_L..L..L.L.L.L..L.L..l....L...LL LL , L.J . ....J. _l_.L.JL .• L.L.L.L..LL , , , . 7<.11f,.,aLQia,01z,.aB1.§Q 1 .,ito~1 "'3.orl_J_..J_ 1~....J.L , , L...l....L.. .L.L ..• L..L.. .i.....L.._• _._.. ~ -~~-· •• u~~ .~~,_j: l.z. J ' ... L.lf.. ,5J.Oco1.o._,_1_11
• tfu. 'f.. t .. :5. QI. ~i?i. cZ,~l-'-:::L.L. r. i .J. L.L..l..... ....! ..•.• LL.I. l_L_ • l...J ....• l . .J._ .... J.....J ..... '..... _, ..J_J. L.L.L-[-..l..... • L .. L.I' · '-L-1·'·-L.. • L.L .. _l_L.L.
1?.J.t.5.,. '°. :OiOiO'.'- .clh~t.:~ZyZ.ibl. l.z.l~~Slc:~LHll-LL.J.L..l_j_l......L .LL. LL.·'-' ' LL._L..LL/ -'-L..J. L .. l .... LL.L.. .l . ..J •..• L_L...L.L .L..L..
lb_J,5, s_._o_.ilLQL~C/_,O: ,/f,Z; ,z,~, I l ! I I-' ' ' ' -' I I ! I I l I I j I ' I I I I t j I.I I 1 I .I . ! ! I J Remarks
SECL - Superelevated Curve. Low Side. SECH - Superetevated Curve. High Side.
I~ J l--.L___L_l.J..-L. .. l ___ L_t __ I . L_Lt.-l. •. L,.'.__.L.J ...... L.'._L.._L_i___l •• ~' ~' ~· .....1 ••• LL..Ll_____L.._L....LJ._l__l___l____l____!_L..L.L_J.....L___!_..L....L..l.._J___L_J __ L..l~L..:.-l __ J_.J___LLJ.....l .• L.L._L<._....L.L...l _ _L_J ..• L_L_l_I
L'.1 L _J_ _J,_L_L.l. L_L_L_L__L_L__L.L.L •. LL..L..l.._L_L_ L ._L_J_ _ L_J__j_ l _ .L _j_____L_l____L_L_j_____L__j___L__J __ L..L_i__L_L_J_J.__J_J_. J___J _ _l ___ L..J _ _l. __ ~ _ _L_l______l____ __ l__L.L..L. _1__J__J_l_L.J
l~J L1 .L .l l L. _\ __ J __ l. ; .• L.i. .L .. J __ L._L_L__l_ .L.L..J_l-L.L...Ll .. J._J __ J__J_L__J____l_L_L--1---!___J__i ... L_L_1 ..L..!_J._L .. J ...J._i__l_L..L.L...l ___ _L._!___l_...J._J_.L_L L .. L i._L.J __ L. J
l3.i L l l ! I l L _l_ L l ___ J_j_____.!_____l.._l__l_J __ J ._L____: __ J_J ._J ___ i ___ L_L .. L! __ t .. L.1-.,L- L_l_L..L.1 _ _:____ " .... 1 .... L.1 ... J __ ! . __L_i___L_L.L. l .. .l_!
t.2JJ.J
&LS
&.bi;
c.Q.W
&.i.fu
&1_§_1
;_Q.ilj
cQ.&J
&_&J
L.~
tl.!.LJ
L1.J1.J "'
lQL}J
19.t?1 &i.~!
:?,~4]
..., ro "' "" "' ro "" ~ 3:0
"' 0. ~ 0 z ~o
"'-000 "'~
"' 0 0
"' I
"'
.,, "' !.O ro
"' " J> G) rn
+>
°'
tii~
;;;~,

PROGRAM .NU.MS ER~ ... -P222Q_Q5_0 ·--·----·-----·-------·-- __ _off! C.E .. OF. MAI_EfUALS ______ .. _. COMPUTER RUN DATE- 11-29-84 ROAD RATER TESTS-
COUNTY- BREMER U.S. ROUTE •••••• 0218 PAVEMENT TYPE ••• COMP
BEGINNING MP •••• 209.30 ENJ ING MP ••• " ••• 218.30 COMPUTED MILcS.. 9.00
.LAB NO •••••• RA4-0001 YEAR BUILT.. 1983 DATE TESTED. 02-22-84
WEATHER CLEAR OBS •••• MCCAULEY-FRETTE TIME.•• 10:45
FREQ. HZ ••• 30 DISP % ••••• 68 TEST TYPE..
.NORTHBOUND ROAD RATER.DEFLECTION IMlLSl
SOUTHBOUND
M-P
209. 750 210.000 210.250 21 o. 500 210.750 211. 000 211. 250 211. 500 211.750 212.000 212.250 212.500
SENS l SENS 2 SENS 3 SENS 4 S.R. SOIL K SENS 1 SENS 2 SENS 3
0.64
1. 00
1.20
0.68
0.64
0. 52
a.so
SENS 4
0.44
0.70
o .• 66
o.52
0 .44"
0.40
0.12
o.44,
0.48
0.32
s. P..
212. 750 213. 000 213.250 213.500 213.750 214.000 214•250 214.500 214.750 215. 000 215.250 215. 500 215.750 216.000 216.500 211.000. 217. 500 218.000
* * * ·*--*-* DIRECT JON ·-1
NORTH SOUTH I
' COMB
1.60
1. 20
1.68
1.76
o. 96
o. 92' -
1. 08
o. 96
o. 92
1. 08_
''
0.64
o. 72
0.80
0.52
0.68
o. 72·
o. 52
0.56 ' 0.64
0.44
0.60
.. o. 60 ....
1;0;, -o~64 0. 5z
3.31
4.27
3.17
3.04
4.40
_3 .64
3.83
1.04 0.84
3.10 1,.80
2.94 1. 62
t.92 1. 08
1.68 1. 04
0.88 o. 64
1.28 1.04
4.99·
-1. 95
2.04
2.96
1.16
1.44
1~36
0.40
1.56.
0.84
0:42
2 • .70.
1; 12 .
l ._88.
1;16
'().30· __ 0.22 0.20
225+
225+.
225+
225+
221.
225+
224.
225+
225+
22·s.+ _
· 1.20 1.00 _·o .• 12
0.60
0.40
3.32
5.74
4.18
·4.42
4.42
5.34
3.88
!. 00 0.80
10.96
3.39 1.20 0.88
0.96 o. 58 .. ,0. 50 ···-· '.0.32:_.
6;32
1. 26
0.60
0 •. 26
0:22 . 0·:·54. o. 60
.... 5.8.3'
10;·51 . 225+' 22s+:_
214; .
. 1 ;40 o. 96 0;60 .. ·-.. 0.44
0.20 0.18 0;90 -.. · o.60
0.24 .. _. ---
.6.12 o. n o; 12
0.92_ 0.60
.. 6. 68 0~48 'o. 48.
o.36
. 2.05 . , '4·~-5·4'
. ... 2.B7
4;40 225+_
225+
*~-*. *·~*,-*--~t ··~~*--·*--*:*-:*"''*"'*"'s'"u"·1·f M-A--:·-R ·y ''o''"F- D A-r·---.a:·· SENS! SENS2 SENS31 SENS4
STD.DEV. MAX. MIN. AVE. 80% AVE. AVE. AVE.
o.5s:: 2.10. 0~40 T~35·::1:;a4 b.B6 0.59 .:.o.4B
8:U,cJ:t8Jc8:4~. 1;~LJ:53 .- 8:ri 8:g~ 8:41
0.48 0.30
f.84. ··.-· 1.16
1.40 0.60
i:.·9·a 1. 02
0.40 0.24
o. 60" o .. 42
9.54
3.07
3.88
2.aa·
:~t *' *.,_.*--* »: *-.,*·-:*--* *' ____ #_"* * *-* * * *:* * SCI
o.49 o.5a o.54 ·
SCI/SENS! AVE. 80'!: I AVE.
SR SR SOIL K
0:366 I 4.68 2.48 I 225.
8:Hr; . t:H -~=~t . ni:
SOIL K
220.
225+
225+
225+
225+
225+
212.
206.
225+
225+ .
225+ '
225+
225+.::
225+
225+ -
REMARKS
SECH .
SECH SECH
*'' * * * .. *"'','°t''* '* BEG. END l TEMP TEMP · .. ·••··· so. - 50. . ·-
-6 ?_·----~--~-?::·~,'.'£~77'.it ~7?'; y'.'Jj,_ {"'l;'l:-~IT¥"~ r:c:;:~r~IR~~f-I~~'E:?"sUPEREL~vAi•iiilc5R.vE; ··(a~'s IDE.
* DATE . _ , ~· ., ., :._:,,_. .,. . . . .. , * * * * ·· si:t~~for-~I~I~~'~i~[) ~;;~vE: fir ~~~-~i6"f ''~·~72
* TESTED- •·AVE.SR-·> AVE.SOIL. K .. ·. *,;;, .. ;. ·· . -.-c..,,·----·---~"'-: -- ._ .. -,,.,-,·.,., .~.,,,., .. ''''-'•»; .. - ·o>"~.
~------------------------··------·-····-·----··-·
-;
"' ~ c+
3:
"' c+ =r 3: 0 ~ 0. ~
" z =r 0
<D -co 0
"' ~ ~ 0 0 <D I
00
c
c
-0 ~
'° ro
"' -0 )> G) rri
+> _,

PAGE 48
APPENDIX B
ASPHALTIC CONCRETE OVERLAY DESIGN OF FLEXIBLE BASE PAVEMENTS
BASED ON ROAD RATER DEFLECTION DATA

ASPHALTIC CONCRETE OVERLAY DESIGN OF FLEXIBLE BASE PAVEMENTS BASED ON ROAD RATER DEFLECTION DATA
PAGE 49
By c. J. Potter 5/15/80
Background Information:
The Road Rater was purchased in the Spring of 1976 as a replacement for the old Benkelman Beam. The Benkelman Beam Versus Road Rater correlation coefficient was 0.83. The basic differences between the Road Rater and Benkelman Beam are as follows:
1. The Benkelman Beam uses a static 18,000 lb. load while the Road Rater uses a dynamic 800 to 2,000 lb. loading.
2. The Road Rater tests much faster and more economically than the Benkelman Beam.
3. The Road Rater better simulates a moving truck than the Benkelman Beam.
The Road Rater deflection ram was originally front-mounted but was rear'-mol.lhtedduring the winter of 1977-78. Since that time van handling has greatly improved, and front suspension parts are no longer overstressed.
Committee meetings including B. c. Brown, R. A. Shelquist, B. H. Ortgies, R. A. Britson, D. M. Heins and c. J. Potter have been held periodically since the Spring of 1978 to provide guideance for the Road Rater program. Temperature correction factors were developed in 1978, but seasonal correction attempts have been unsuccessful. All Road Rater testing is now performed in April and May every year when pavements are in their weakest condition. The Road Rater does not have sufficient ram weight to effectively evaluate rigid pavements, although it has been used occasionally to identify severely deteriorated rigid pavements beneath asphaltic concrete resurfacing.
In the Winter of 1978, Al Torkildson of Data Processing was extremely cooperative in developing a computer program to perform statistical analysis on Road Rater deflection data. We now have Road Rater computer printouts similar to Pavement Friction computer printouts, which have eliminated many man-hours of manual data reduction time.
In the Spring of 1979, the Road Rater was used to rank forty-four (44) airports having flexible base runways for the Aeronautics· Division. The Aeronautics Division plans to use this information to help set priorities for State participation in airport projects and to check consultants' asphaltic concrete overlay designs.
PAGE 50
~n the Fall of 1979, the Road Rater was used to rank 124 miles of asphaltic concrete pavement for Lloyd Herbst, Sioux County Engineer. Road Rater results correlated fairly well to field conditions. The Road Rater identified the only full~depth A.C. section (4" SASB, 6" ATB, 2" Type B) as number one of nineteen sections. Other sections (4" SASB, 6" Bit. Tr. Agg. Base, 2 1/2" Type B) which had not been resurfaced were ranked 19, 18, 17, 16, 15, 13, 12 and 10 respectively. Nominal asphaltic concrete overlay thicknesses based on Road Rater information were determined for five (5) Sioux County sections totaling thirtyeight (38) miles. Two inches of resurfacing has been used in the past in Sioux County with good success. Road Rater designs were 2 3/4", 1 3/4", 2 1/2", 1 1/2" and l" respectively.
Other 1979 Road Rater A.c. Overlay designs included Monona County FR-175-1(20) on Iowa 175 from the Missouri River to I-29 and from 4th Street in Onawa easterly to county road L-12; and Keokuk County FR-78-1(16) on Iowa 78 from Iowa 149 east to Iowa 1. Road Rater designs were 3" and 4" from Iowa 175 and Iowa 78 respectively, while Project concept Statements called for 3" on both projects. 3" is adequate on Iowa 78 based on average Road Rater deflection, and the Road Rater printout was used to identify weak areas for possible subdrains or strengthening courses.
In Grundy County, the Road Rater was used in 1979 on S75 from Whitten north to Iowa 175 and on T55 from Iowa 175 north to Dike. Road Rater designs were a sealcoat on S75 and 2" on T55.
In 1980, Road Rater information was used for Tama County on Iowa 8 from Traer to Iowa 21. The Road Rater design was 3 1/4" while the proposed overlay thickness was 3".
An asphaltic concrete overlay desig~ method for flexible base pavments is now fully operational and submitted herein to the Soils Design Section of the Office of Road Design for use and further development. So far, A.C. Overlay designs based on Road Rater deflections seem reasonable and support designs based on field review and engineering judgment. Road Rater information must be used in conjunction with a field review, however, to identify the type and amount of surface distress. In some instances, a thicker A.C. Overlay may be necessary to control reflective cracking than determined by Road Rater structural rating alone.
The 1980 Road Rater program includes an inventory of all primary flexible base pavements which have not previously been tested. We hope to complete this inventory in 1981 as well as update older Road Rater information.
Definition of Terms:
The Road Rater measures pavement deflection in mils under an 800 to 2000 lb. dynamic force at 25 cycles per second. Sensor 1 is located directly under the raml Sensor 2 is located one foot away from the ram; Sensor 3 is located two feet away from the ram; and Sensor 4 is located three feet away from the ram. We presently only use and report Sensor 1 and Sensor 2 since most structural information can be determined from these sensors alone. All Road Rater testing is performed at OWT and results are recorded on
• ...

PAGE 51
coding sheets which are later sent to Data Processing. Road Rater tests are staggered in adjacent lanes and taken every 1/2 mile with a minimum of 30 tests per test sect.ion. More tests (50 minimum) are needed for special evaluation of a given roadway to isolate weak areas.
The Road Rater Structural Rating (SR) is a number which represents the present pavement level of performance based on Sensor 1 deflection. The SR can be thought of as the existing in situ Structural Number (SN) determined from AASHTO coefficients. For design purposes, the 80th percentile Sensor 1 deflection is corrected for temperature to so° F and used to determine the SR.
The Surface Curvature Index (SCI) is the difference in mils between Sensor 1 and Sensor 2 deflection. Smaller SCI's indicate foundation or drainage problems while higher SCI's indicate surface weakness.
The SCI divided by average Sensor 1 deflection (SCI/SENS 1) provides a ratio which is an indication of pavement strength. Smaller SCI/ SENS 1 ratios indicate stronger pavements.
Beginning and ending mileposts on Road Rater computer printouts will correspond with those in Test Sections By Mileposts, Highway Division, Office of Materials, Maro.h 1979. This book is updated every two years.
Pavement temperatures are noted in the Remarks column of Road Rater Computer printouts in °F.
A.C. Overlay Design Procedures:
The asphaltic concrete overlay design method we are currently using enters Road Rater information directly into flexible pavement design procedures in the Guide For Primary And Interstate Pavement Design, Office of Road DEBign, Soils Section, October, 1976. J?.avement .determination traffic appendices from Advance Planning are used with nomographs in the AASHTO Interim Guide for Design of Pavement Structures 1972 to determine the Structural Number (SN) required based on a 15 year asphaltic concrete overlay design life.
The present 80th Percentile Structural Rating (SR) determined by the Road Rater is subtracted from the required SN and the difference divided by the coefficient of Type "B" asphaltic concrete (0.44) to design the nominal A.C. Overlay thickness. The 80th percentile deflection is used to assign SR values so that most or all weak areas are removed by nominal thickness design and normal surface preparation and patching procedures.

PAGE 52
Example:
A.C. Overlay Design for Iowa 229 from Garwin to U.S. 63
6" Rolled Stone Base 3" A.C. Seal Coat
6" x 0.10 3" x 0.35 l" x 0.20
= 0.60 = 1.05 = 0.20
1957 1957 1974
1.85 Calculated Existing SN
1980 Road Rater 80% SENS 1 Deflection = 4.09
Must Correct For Temperature Using Nomograph on Page 20, Road Rater, Dynamic Deflections for Determining Structural Rating of Flexible Pavements, Highway Division, February 1979, Iowa Highway Research Board Final Report HR-178.
Enter Surface Temperature on Left (40° F)
Enter 80% Road Rater SENS 1 Deflection on Right (4.09 Mils)
Read 80% SR = 1.77
For SN = 3, 8 + 11 = 19 (18K Single Axle Loads Per Day, 20 years)
19 x 15 = 14.25 (18K Single Axle Loads Per Day, 15 Years) 20
Pt= 2.5, S = 2.5, R = 2.0
Enter AASHTO Nomograph
Read Required SN= 3.22
80% SR = 1.77 1.45 + 0.44 = 3 1/4"

)
i
PROGRAM NUMBER.:: ·--· 1'2220050 COMPUTER RUN DATE- 32/24/80
OFFICE -OF-MATERiAls ROAD RATER TESTS
---·couNTv-·--TANA ------·---·-··------ -----·. BEG iNN l NG MP ...... - o. 49'" _________ .. LAB -No ••••• --.- RRi:. 000·9--PR IMAR Y ROUTE ••• 0229 ENDING MP....... 5.41 YEAR BUILT.. 1974
WEATHER CLOY OBS •••• TWOHEY-PAGE
. -----···· PAVEMEMT TYPE.,_. __ .?<;_ ____ ···-· COMPUTEp _Ml L_~S ''--· if.,_9_2 _________ 0ATE_ TESTED. Q_4-:.L'!-:-_8.Q T IM E _. __ '! .!.. __ J3_ :_ 14 -------------·---------------
···-------··----------------- ..... ____ .. _l<QAQ __ RATER _QEF_LECilllN .J!'l!l.Sl.. ____ --·--------·------·-·-··---···-··---···--··-··-----, EAST BOUND ~;E STBOUND
M.::P. __ _ ____ Sf'f'!Ll_ __?@_s 2 ________ SEN.LJ __ s_~NS .. L_KEMAIS.K~---------·---- ____________________ _
0.550 2.88 2.28 0.100 3.00 1.90 --.--------·--------------·-·-------- 0.850 ---------· --- ·------- ---·-------····--· ·
3.50 2.60 1.000 2.40 .1. 56
- ---------------------------·· 1.150 ----·- ··-----· ------~-·-·---;>_· 59 ____ 2,_5 0---·-----·-------·· --- - ------------------ -·---.---·-1.300 1.450
-----------···--_ l.600 1.750 1.900
3.00 2.10
___ 4,90 _____ 2.so 2
• 46 y.ao
-·- ·--------- -4. 00--~--2:0 6 3.00 2.50
SECL
------------------- ------- 2_.050 ________ ·--------- _______ . ~.3() __ . __ 2. 3Q_ __ s_E(;_l:L__ _____________ . ----------------2 .200 4.20 3.oo Z-350 3.90 2. 70
--------------·····------ ·-- 2. 500 - 4.00 2 .. 50 2.650 4.40 2. 80 2.800 2.22 1.38
.950 ··---·-----------. - ____ .3. sa._____ ____ 2 l 6 0._----104_0 _____________ --------------------· 3.100 2.58 1.92 3.250 4.80 3.50
·----------- ----- .... 3_.400 _______ 2_.4_0 _____ l. 9 8 -- ---- ----·- -- ----·------ ___ . ___ Hl4Q ___________ _
~,, 3.550 5.80 4.00
4.40 3.20 3.700 3.850 4.ooo
_____________ --·- -----·--··-------•· 00 _____ 2_._30 __________________ . _____ ----·-4., oo 2.60
4.150 2. 70 2.16 .4.3.00 __ ,c ... ___ 3.Po .. ___ 2,00 ...... -- __ _ 4.450 3 .so 2.30 4.600 3.00 2.20
----·------------------ .... 4 .J 50 4.900
.. ---- -------··-·- ________________ 2..28 _______ 1. •. 1.'t ______ ··------·---------· -- . --------------------2. 58 l.98
- -- -·--·,- ·--·-·---- - ····-· -·- ---- . -·-------·----·-·----------· -------···- -- ---·-···- -* * * * * * * * * S U M M .A R Y 0 F D A A * * * * * * * * * * * * * * * * * H l S T 0 R Y * * * * *
* ..
--~--
-0 i )> ! Ci? ' r'1 .
---- ------ __ l
"' w ---------------·-----.[_ _____ ··-·- SENSL ________ -----·-···--- .. L.SENS2 J __ ---- * ----------------- - -- ·----- ·-· * ~-·---·----
DIRECTION !STD.DEV. MAX. MIN. AVE. BOK I AVE. j SCI SCI/SENSl * I l I *
_________ _ EAST. ... -----L. o •. H ...... 4.40 .... 2.22..3 .• !9 .. _.3.80. __ J .... 2.24 .. I .0.9't ....... 0.296 _____ * WEST I 0.93 5.80 2.28 3.57 ~ I 2.51 I 1.06 0.298 *
*
-··- -----·-·-·- ----
* * * * * COMB I O. 84 4.-4-6- 2.22 3.38 ~ I Z.37 I l.00 0.297
-·-··----------·--- ---------- . __ 5·8"------·- ... --------- ---- ---------------------- ··------- -----·----- ---- .. -------- --- ____________ , REMARKS: TNNN- SURFACE TEMPERATURE. SECL- SUPERELE /ATED CURVE, LOW SIDE. - - . ~t~H- ~UYtKtLtVAitO CURVE, HIGH SIDE
(

PAGE 54 "'. "' " "'
I "' M
"' srr !"-i
N
I ·YI .:ra~li.>(J
P&o~ - NO!J.J37d:ila
"'
I
' DNIJ....ni ~VHOJ.;)OHJ.S
I ro " "' "' ...
" "' "' "' 1 "· "' " ": ~ "\ .
M
.£1 008 0'1 pa:.i.;)a.l.:co::> s1::;q - NOIJ.03:'1daa
I J
' .Ji
1 z 0
I-u ...
.i:::
t t!l UJ
11<
z...J 0
ro
-u.. 0
H
I- UJ co
ti>
<tr::l ~
er 0
1 er +'
0
...l UJ
z
<ti- 'Cl er .,,; QJ ro ::::i er +'
j I- u Ur::l QJ
=>er. ....
Q)
Q:'.O ....
H
I- er 0
::s
U) u
ti> .... Ii<
::E:
J 0 Cl:'. u..
' I J l 0 0 0 0
mtOJ.W3:dH3J. 38VdCIOS
M N M 0 0 0 0 0 0 0 0
.. M M .... "' ro " "' "' M N
0
~ u 0 0 0 0 0
0
0 "' " M
N

,, .
,, IS
" I - tJ G ·-' .
•
z, •. I'
"
J:Y:r~'"'' 'i.·,;:.,,.~~. ,,
"
-- ... /-~ . ! ;' ! -.c• ]___ . ~
i• ~' .. '/..
. / • I Ao ,,
••
-1f--F,1=>P1J~~~~i":': = t.l!
; y
"~ I . ·;.1
-+--ihy----;· +o-·-t'-'c",--lh·l-:--1C..---::i- -II--'-"'-+----~~ :;1 . '

1
i
l l 1 l ~
- -TAHA -- ·--· -- -co<.mrv --- - ----- - - -·-----PRfMARY ____ PAVE~ENT-DETERMl''AT!ON ________ _ LCCaTIUN OF PnUJECT IS 14 229-ECL GARAIN TO us 63 Pf· OJ EC T .~L'J,'~f
Sl,JKCE UF TH.\Fr-:IC-[$ .. 4256 THE p~~t;KA.~ YEAR rs l979 THF. DES[Gi~ YEAK IS tg99
--THE TOTAL p;.1,.0G1{A1'·f.Yt.iK TRAFf-tC. IS -D(S!Gtl YE~'' HUCK TRAFFIC IS DESIGN YEAR P.C. & P.U. IS
-·---TOTAL ~fSIGI< Yc,\R.Ui\FFfCIS ___ _
90 540 630-
SECTION DESCRIPTIL~ ·p(·
LEi~UTH SU 2 lt.92 4.3
TGTAL SECTl£JN LErlGTH = 4.92 MI LES
530
SU 3 BUSES -- 7----. l
RV TK TS 3 -c- --5-----5-TS 4
-4-·
--·------··· ------·- ---- - -------FLEXI8LE ----------·----R-IGID·-·
TS 5• DB 24 6
NO .. CF S1NVLE .\XLES OJT:-1 Oif<.ECTlL).\JS DAILY 20 YEAR DALLY 20 YE:\R S!~;LE AXLc MElG~IT GRO,J~ 22,001 AND JP Q.03 219.00 0.03 219.00
AXLl .. iYf[i ;HT ·G,~Uvr' _________ LV,DJl - 22,oao ____ o.o~ 219.J0-------0.03··--·--219.JO
i\XL£ Y1Ei< ;rlT GROdP 13,001 - 20,000 0.31 2263.00 0.31 2263.00 AXLI: WEI· ;HT Gi{OUP 16,001 - 1a,u00 1.14 3322 .. 00 1.14 8322.00
EST iMATE-~-425_6 _______ _
TOTAL 9·0
----
1 j
AXLE ·we{\ ;Hr GRU:J? --- 12,00l - L6,ooo _____ s.04---· 367~2.oo··-----··- 5.04.-36792.00 ·-------------------------··--AXLE WE.I( ;HT GROuP s,001 - 12,000 20.88 152424.00 20.BB 152424.DO AXLC WE It iHT GR[;UP 7,001 - 8,000 5 .. 16 37668 .. UO 5 .. 16 37663.00 A.XLE -WE L ;Hr s:.:1,cu? ·· -3" ~d'J l .. - 1 ,ooo---·- ·2a. 37-- 2011 of:oo--------2a.3·1---20110 l.oo
5l'l.;LE AXLE WE.!·.;HT GRGUP 0 - 3,000 14 .. 43 l05j}9.00 14.43 105339.00
_ --~~-~--E_•~J~'J.~L-~-~~ f_ -(f)GL_~---~~~_§ _L_J?~\0$ PEK _ U~'!..' .. 2.~ .. _Y_R ____________ ---·---·-------·-t)-----··i-;;-----·-1
s~+ 4 = B 0 8 = 7 SN 5 = 7 D 9 = 7 s1r·-& = - ______ 6___ ------ -- -----·--------------·----- o 10·-;;--------6--
' i-10. GF T~_.·io::.-~ f,XLES .JUTd OIR.ECTia:is DAiLY 20 YEAR DAILY 20 YEAR J.'.,.-i.JEH AXLt '.'iE!·Jl1f r:;:~;jjp 46,UOl ~NO JP 0 .. 0'0 J.oo o.oo O.JO TJ..:;(,£.,•1 AXLE i·{ClGiiT-·GK.C-JI' ·----· 't't,001 - 46,000----0.01 ---·----·73.00 0.01 ----73.00·----TANDEM AXLE ~EIGHT GRGUP 42,CGl - 44r000 0.04 292.00 0.04 292 .. 00 TA;iJf~ AXLE wEIGtfT G~OJ~ 40,001 - 42,000 0.09 657.00 0.09 657.00
I I TAN;JE:-i ._AXLC ·;,.1E: (GHr·· GR.GJP------3~, 001 - ·40,000· O. 26 ____ -189-3.-06 0.26 ---1898. Jd---------------- ------
TaN1)EM AXL~ ~E!~rlf G~OJP J6,0JL - 36,0JO 0.45 3235.00 0.45 3285 .. 00 i T~NOE~ AXLE hE{•;HT G•~OU? 34,001 - 36,000 0.92 6716.00 0.92 6716.00
14 TA:,jJf:-1 AXLE i-i.:'.[GHT"""G:.i..OU?. ---··· 32,COl -··34,ood ____ l.66_, ____ f211a.o"6--------·---·1.66 ----fzl-18 .. 00
TA~OEM AXLE WE[GHT GRG;JP 30,001 - 32,000 3.77 27521.00 3.77 27521.00 , TA~DE~ AXLE WEIGHT GkOU? 24,001 - 30,000 5.43 39639.00 5.43 39639.00 1 -1si<--EQJIVALENT ..a.~0E'1 ·-Ax-LE"°-LOA"US" PER -0·4y, --zo-·vR----~-----·-·------ -·------. ·---'----------~ SN 3 = (lj) D 7 = I 7 i -~~---~-: {~ --·-··------- ------------g--~ ~----i~--------1 SN 6 = lD 0 10 = 18
·-------·---0 )>
,,,
!~~~--~~~~------------------------~-~~~~-~~~-~-------------------c..n

I J I
• I . I .I I I J l I I t I '(· .,
• l
.. N ""
NS
"' 0 0 . . . 0 ... "'
llOJ.:lV .:I l Hl3ll - ll
1'.lOlllS - !Ll_
SNO 11 V'.l llddV 0 Jl!lN IS 41 ll-lll A 11 '«l
31XV N31VAlffi3
N
PAGE 57
0 li)
-~..;,...ilj.!l,lj..µL,-J--mll!W-l-\.-1-y-L-;~~1.J-L-..J;u.iiu_.__J. ·
SONVSO<l11 . 'SNOl.lV'.lllddV . OVOl 31X 3l!lNIS 41ll-8l 1N31VAll'tl3 lV!Ol
..,. ....
3'11VA ll!Odcll'IS llOS - S
N
l/')
• IN
.... i::i. . Ul .... c Cl) e Cl)
>
" i::i. Cl).
rl .0 ..... x Cl) rl f«
... ... I 0
..... .... ... <l. ,::: u c bll ..... !I) Cl) Q
rl I
H H
Cl) ... :l bll .....
f«

TABLE I
Component
Surf ace course Type A Asphalt Cement Concrete Type B Asphalt Cement Concrete Type B Asphalt Cement Concrete Class 2 Inverted Penetration
Base Course Type A Binder Placed as Base Type B Asphalt Cement Concrete Base
Class I Type B Asphalt Cement Concrete Base
Class II Asphalt Treated Base Class I Bituminous Treated Aggregate Base Asphalt Treated Base Class II Cold-Laid Bituminous Concrete Base Cement Treated Granular (Aggregate) Base Soil-Cement Base Crushed (Graded) Stone Base *** Macadam Stone Base Portland Cement Concrete Base (New) Old Portland Cement Concrete
Subbase course Soil-Cement Subbase Soil-Lime Subbase Granular Subbase Soil-Aggregate Subbase
---- -- - - ····-----
PAGE 58
Coefficient
New Road
Old Road
0.44* .35 0. 44-* . 35 0.40 .30 0.20 .20
0.40
0.38
0.30 0.34* 0.23 0.26 0.23 0.20* 0.15 0.14* 0.12 0.50 0.40**
.30
.30
.25
.25
.20
.20
.15
.15
.10
.10
.10
.40
0.10 .10 0.10 .10 0.10* .10 0.05* .05
Minimum Thickness Permitted
3 (::»300 tpd) 2 (<300 tpd)
2
2 4 6 4 6 6 6 6 6
6 6 4 4
*Indicates coefficients taken from AASHTO Interim Guide for the Design of Flexible Pavement Structures.
**This value is for reasonably sound existing concrete. Actual value used may be lower, depending on the amount of deterioration that has occurred.
***No current specification

APPENDIX C
WORK PLAN TO EVALUATE ROAD RATER EFFECTIVENESS
ON RIGID PAVEMENTS
PAGE 59

WORK PLAN TO EVALUATE ROAD RATER EFFECTIVENESS
ON RIGID PAVEMENTS
PAGE 60
An Asphaltic Concrete Overlay design procedure based
on Road Rater deflection values was developed by D. Heins
and C. Potter in 1978 and 1979 and was presented to the
Office of Road Design as operational in May 1980. This
A.C. Overlay design procedure is working reasonably well
without further development or refinement as. recently
1/7/82
C. Potter
related to me by Kermit Dirks of Soils Design. The present
A.C. Overlay design procedure does have limitations, however,
in that it is restricted to flexible pavements.
The objective of this work plan is to expand the present
A.C. Overlay design procedure to include rigid or composite
pavements. This entails testing a number of rigid pavements
of various thicknesses andlevels of deterioration with the
Road Rater to search for correlations between Road Rater
deflection readings and various rigid pavement composition and
performance variables such as thickness, CHLOE slope variance, PSI,
crack and patch deduction, depreciated SN values, estimated A.C.
Overlay thickness by visual observation, etc.
An A.C. Overlay design procedure for rigid and composite
pavements will be pursued if meaningful relationships between
Road Rater deflection readings and rigid pavement performance
variabl~can be found.
The Work Plan is as follows:
Heins 1. Determine the structural composition of 23 CHLOE Test sections from historical information.
Frette 2. Crack & Patch survey 23 CHLOE test sections.

Britson &
Potter
Britson &
Potter &
Shelquist
Potter
Potter &
Marks
Potter &
Marks
Potter &
Marks &
Dirks
Potter
Potter
Potter
PAGE 61
3. Estimate a depreciated SN coefficient for each of 23 CHLOE test sections.
4. Estimate visually the nominal A.C. Overlay thickness required on 23 CHLOE test sections.
5. Test 23 CHLOE test sections with the Road Rater in April 1982. Minimum of 30 tests per section approximately equally spaced. No effort made to hit or miss cracks, construction joints, patches, etc. (statistically randomly selected locations). Test at 68% mass displacement and 30 Hertz frequency.
6. Test as many CHLOE test sections as possible with FHWA "Thumper" in April 1982.
7. Correlate Iowa DOT Road Rater To FHWA "Thumper".
8. Evaluate Iowa DOT A.C. Overlay design procedure against FHWA A.C. Overlay design procedure and select the best procedure for use in Iowa.
9. Periodically (every two or three months) test 23 CHLOE test sections with the Road Rater in 1982 and 1983 to check for temperature and seasonal variations on rigid pavements.
10. Expand the Road Rater study of rigid pavements to include D-cracked pavements, CRC pavements, etc., if meaningful relationships exist between Road Rater deflection readings and performance variables on 23 CHLOE test sections.
11. Develop an A.C. Overlay design procedure on rigid or composite pavements based on Road Rater deflection readings assuming this is possible (California says Dynaflect cannot evaluate rigid pavements; Louisiana & Texas says it can. There is much disagreement nationwide at present whether lightweight dynamic delfection.measuring equipment such as Dynaflect and the Model 400 Road Rater can effectively evaluate rigid pavements.)

PAGE 62
APPENDIX D
METHOD OF DETERMINATION OF PRESENT SERVICEABILITY INDEX

' '
r: '' ~J
Page 1 of 6
PAGE 63
Test Method No. Iowa 1004-C December 1981
IOWA DEPARTMENT OF TRANSPORTATION HIGHWAY DIVISION
Office of Materials
METHOD OF DETERMINATION OF PRESENT SERVICEABILITY INDEX .
General Scope
The Present Serviceability Index (PSI) was developed by the AASHO Road Test as an objective means of evaluating the ability of a pavement to serve traffic. The Present Serviceability Index is primarily a function of longitudinal profile with some influence from cracking, patching and rut depth.
The AASHO rating scale ranges from O to 5 with adjective designations of:
Very Poor 0 - l Poor l - 2 Fair 2 - 3 Good 3 - 4 Very Good 4 - 5
The Bureau of Public Roads has a similar scale with the following designations which are more realistic in the evaluation of new pavements:
PSI Ratin:;t.
Above 4.5 Outstanding 4.5 - 4.1 Excellent 4.1 - 3.7 Good 3.7 - 3.3 Fair Below 3.3 Poor
The test is conducted in two parts: (1) Determination of the Lon"gitudinal Profile Value (LPV), (2) Determination of Deduction for Cracking, Patching ·and t{Ut Depth.
Part I. Determination of the Longitudinal Profile Value
Scope:
The Iowa DOT uses three methods for determination of the longitudinal profile value:
1. CHLOE Profilometer 2. BPR Type Road Roughometer 3. IJK Type Road Meter
Test Procedure:
1. The determination of longitudinal profile value by the CHLOE Prof ilometer is described in Test Method No. Iowa 1003-A.
2. The determination of road roughness by the BPR Type Roughometer is described in Test Method No. Iowa 1001-A.
The inches per mile as described therein is then used in conjunction with the most current correlation of road roughness (inches/mile) vs. longitudinal profile value (LPV) determined by the CHLOE Profilometer to obtain a longitudinal profile value.
3. The determination of the road ·meter roughness value, which is the same as the Longitudinal Profile Value, by the IJK Type Road Meter, is described in Test Method No. Iowa 1002-B.
Part II. Determination of Deduction for Cracking, Patching and Rut Depth
Scope:
The purpose of this portion of the test is to determine the value of the Present Serviceability Index lost due to physical deterioration of the roadway.
The evaluation is condUCted according to general procedure established by the AASHO Road Test and described in detail in the "Highway Research Board Special Report 61E."
Test Procedure -- Flexible Pavement:
The equation for Present Serviceability Index of flexible pavement is:
PSI = LPV - .01 '\/C+P - 1.38 RD2
where;
PSI
LPV
C+P
Present Serviceability Index
Longitudinal Profile Value
Measures of cracking and patching of the pavement
A measure of rutting in the wheel paths
Cracking, c, is defined as the square feet per 1000 square feet of pavement surface exhibiting alligator or fatigue cracking. This type of cracking is defined as load related cracking which has progressed to the state where cracks have connected together to form a grid like pattern resembling chicken wire or the skin of an alligator. This type of distress can
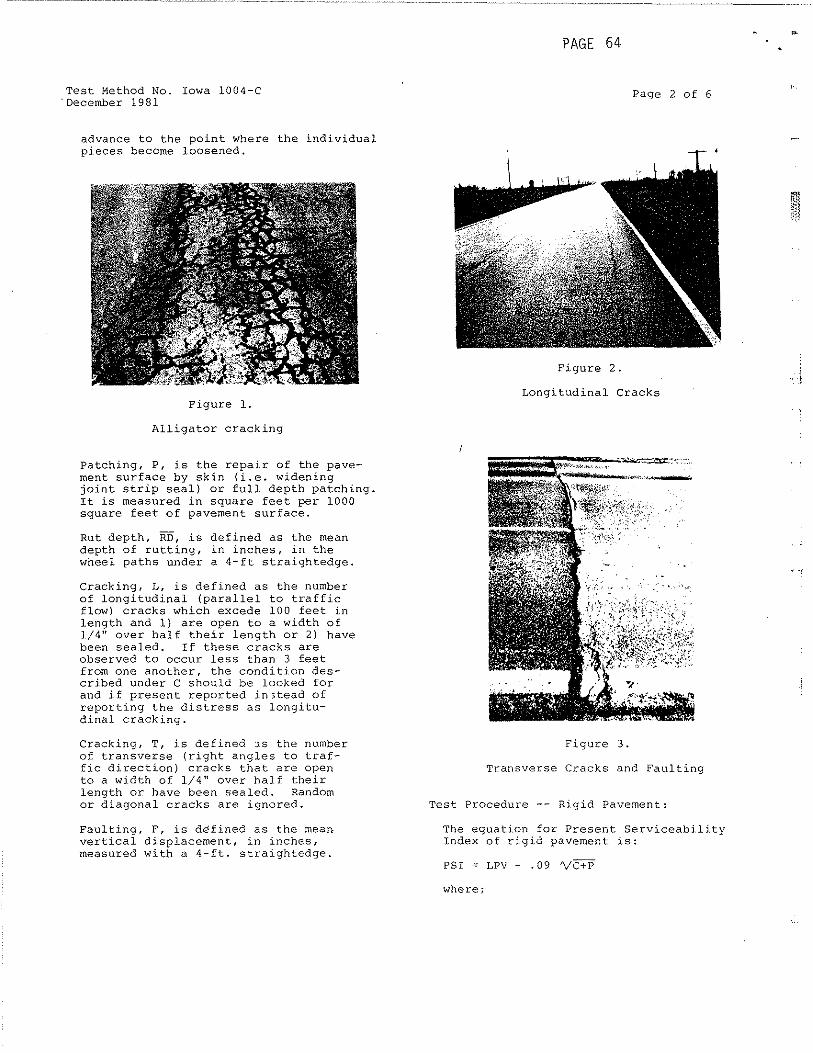
PAGE 64
Test Method No. Iowa 1004-C Page 2 of 6 'December 1981
advance to the point where the individual pieces become loosened.
Figure 1.
Alligator cracking
Patching, P, is the repair of the pavement surface by skin (i.e. widening joint strip seal) or full depth patching. It is measured in square feet per 1000 square feet of pavement surface.
Rut depth, RD, is defined as the mean depth of rutting, in inches, in the wheel paths under a 4-ft straightedge.
Cracking, L, is defined as the number of longitudinal (parallel to traffic flow) cracks which excede 100 feet in length and 1) are open to a width of 1/4" over half their length or 2) have been sealed. If these cracks are observed to occur less than 3 feet from one another, the condition described under c should be looked for and if present reported in~tead of reporting the distress as longitudinal cracking.
Cracking, T, is defined ).S the number of transverse (right angles to traffic direction) cracks that are open to a width of 1/4" over half their length or have been sealed. Random or diagonal cracks are ignored.
Faulting, F, is defined as the mean vertical displacement, in inches, measured with a 4-ft. straightedge.
Figure 2.
Longitudinal Cracks
Figure 3.
Transverse Cracks and Faulting
Test Procedure -- Rigid Pavement:
The equation for Present Serviceability Index of rigid pavement is:
PSI = LPV - . 09 '\/C+P
where;

Page 3 of 6
PSI Present Serviceability Index
LPV Longitudinal Profile Value
C+P Measures of cracking and patching of the pavement
Cracking, C, is defined as the lineal feet of cracking per 1000 square feet of pavement surface. Only those cracks which are open to a width of 1/4 11 or more over half their length or which have been sealed are to be included.
Patching, P, is the repair of the pavement surface by skin or full depth patching. It is measured in square feet per 1000 square feet of pavement surface.
Rut depth, RD, is defined as the mean depth of rutting, in inches, in the wheel paths under a 4-ft. straightedge.
Faulting, F, is defined as the mean vertical displacement, in inches, measured with a 4-ft. straightedge.
D-cracking, D, refers to a characteristic pattern than can develop in portland cement concrete. Initially, the occurrence of D-cracking may be preceded and accompanied by staining of the pavement surface near joints and cracks. However, not all stained joints and cracks de'VeIQP D-cracking. D-cracked concrete will first exhibit fine parallel cracks adjacent to the transverse and longitudinal joints at the interior corners. The D-cracks will bend around the corner in a concave or hourglass patterr~. As the D-cracking progresses, the entire length of the transverse, longitudinal and random cracks will be affected. The cracked pieces may become loose and dislodged under the action of traffic. The occurrence of Dcracking in the check sections will be rated on a point scale as described in the Test Procedure section.
Procedure
PAGE 65
Test Method No. Iowa 1004-C December 1981
Figure 4.
D-cracking - Initial stages
Figure 5.
D-cracking - All joints affected
A. Apparatus
1. A passenger vehicle with an accurate odometer.
2. A four foot long rut/fault gauge.
3, Mechanical counters.
4. A 50-foot tape.
5. Safety equipment -- hard hats, safety vests, survey signs.

Test Method No. Iowa 1004-C December 1981
B. '!'est Record Forms
1. Crack and Patch Survey worksheet (A.C. or P.C.C.).
2. Crack and Patch Calculation and Summary Sheet.
3. Present Serviceability Index summary (Form 915).
C. Test Procedure
The control sections are as described in the "Control Sections by Mileposts" booklet. For control sections of 0-5.00 miles in length, one representative 1/2 mile test section will be evaluated. For 5.01-10.00 miles, two 1/2 mile test sections are used. Three 1/2 mile sections are used for any control section greater than 10.0 miles.
After determining a location for the representative 1/2 mile test section or sections, the county, highway number, beginning and ending control section milepost, pavement width, beginning and ending milepost of the 1/2 mile test section being surveyed, date of survey and names of those doing the survey shall be recorded on the worksheet.
Flexible
The procedure for evaluation of flexible pavement is to drive on- the shoulder, if possible, and estimate_ the area of each instance of all~gator cracking and patching recording them individually on the worksheet.
The rut depth is measured in the outside and inside wheeltrack in both lanes at 0.05 mile intervals and r~corded (10 sets of readings per test.section).
While driving the first and last 0.05 mile portion of the test section the· number of longitudinal and transverse cracks meeting the previously described criteria Mill be counted and recorded. Transverse cracks extending across only one lane will be counted as "half cracks" and recorded as such.
While driving the first and last 0.05 mile portions, the occurrence of faulted cracks will be looked for and the worst instance in each portion will be measured. These measurements will be taken one foot in from the pavement edges at the two cracks selected and the data recorded.
PAGE 66
Page 4 of 6
The procedure for rigid pavem~nt is to drive on the shoulder, if possible, and count all cracks meeting the previously described criteria. Cracks extending across only one lane are recorded as "half cracks 0 and summed to full cracks during the data summary phase. Longitudinal, diagonal and random cracks are accounted for by· estimating how many times they would extend across the roadway and recording that number.
The area of eacn patch is estimated and recorded indi 'lri.dually on the worksheet.
The rut depth is measured in the outside and inside wheeltracks of both lanes. One set of measurements will be taken at the beginning of the 1/2 mile test.section and one set at the end.
Faulting is measured one foot in from each pavement edge at 0.05 mile intervals and recorded (10 sets of readings per check section).
The D-crack Occurrence Factor {DOF) in the test-section-will be evaluated and assigned a numerical rating based on the following description.
DOF Value
0 No D-cracking noticeable
l
2
3
4
5
D-cracking is evident at some joints especially the interior corners. Pavement is sound condition and no maintenance is required due to D-cracks.
D-cracking is evident at most joints and has progressed across width of slab. Pavement is in sound condition and no maintenance is required due to D-cracking.
D-cracking is evident at virtually all joints and random cracks. Minor raveling and spalling are occurring and traffic is causing some loosening of cracked pavement. Some minor maintenance of spalled areas is required.
D-cracking very evident as in 3 above. Spalling and removal by traffic has progressed to point that regular maintenance patching is required. Effect on riding quality of pavement is now noticeable.
D-cracking has continued to progress at sites identified in 3 above and requires regular maintenance patching. Full depth patches may be necessary. Ride quality has deteriorated to point where reduced driving speed is necessary for comfort and safety.

Page 5 of 6
DOF 0
DOF 1
)' ,.
DOF
'·
PAGE 67
Test Method No. Iowa 1004-C December 1981
DOF 3
DOF 4
DOF 5
Figure 6. Examples of D-crack Occurrence Factors

Test Method No. Iowa 1004-C December 1981
D. Calculations
1. Flexible Pavement
a. The area of cracking is totaled and divided by the area of the test section in thousands of square feet to obtain C.
b. The area of patching is totaled and divided by the area of the test section in thousands of square feet to obtain P.
c. The rut depth measurements are totaled and averaged to obtain RO.
D. The number of longitudinal cracks in the two areas survey·~d are totaled, averaged, and reported as L.
e. The number of transverse cracks and 1/2 cracks (divided by 2) in the two areas surveyed are totaled, averaged, and reported as T.
f. The faulting measurements are totaled and averaged to obtain F.
g. Cracking {C) , patching (P) , and rut depth (RD) as calculated above and LPV, as determined in Part I, are used in the following formula to determine the Present Serviceability Index (PSI):
PSI = LPV - 0. 01 'l/C+P - l. 38 RD2
2. Rigid Pavement
a. The number of cracks and 1/2 cracks {divided by 2) are totaled and multiplied by the width of the roadway and divided by the area of the test section in thousands of square feet to obtain c.
b. The area of patching is totaled and divided by the area of the test section in thousands of squa,re feet to obtain. P.
c. The rut depth measurements are totaled and averaged to obtain RD.
d. The faulting measurements are totaled and averaged to obtain F.
PAGE 68
Page 6 of 6
e. Cracking (C) and patching (P) as calculated above and LPV as determined in Part I are used in the following formula to determine the Present Serviceability Index (PSI):
PSI = LPV - .09 'l/c+f
E. Reporting Results
l. Lab; Number.
2. Beginning Milepost.
3. Ending Milepost.
4. Road Number.
5. Length.
6. Sur' face Type.
7.
8.
9.
10.
Direction and Lane.
RMRV or LPV.
9 ,J
' .. I ~ .'
APPENDIX E
RIGID PAVEMENT ROAD RATER RESEARCH SPREAD SHEETS
AND PLOTS
INTRODUCTION
PAGE 69
Spread sheets on pages 70 through 75 were used to develop the best correlation between Road Rater deflection data and pavement performance variables. This was accomplished by adding columns from left to right as plots on pages 76 through 86 indicated improved correlation. These plots are in chronological order and resulted in the base relationship to evaluate rigid pavements shown on page 85. Additional test data obtained in 1983 supported this base relationship and is shown on page 86.

c 0
:;:; s... 0.
·~ 0 E 0
-;;; :z:
• r
15
ZN
6E
. 0 0.
- 0 0 c . w ·-0 c ~. X> u
~ 0 µ c •o
0 ·-µ ., v
0 ~u
o• •O c
u
]J
::; . • 0
- x > • ·~ • c 0-
µ c ~ • c
0
c -o . ·C µ
0 ·µ" 00 00 c E µo 0u
6.20 .35 4.15 6"PCC
5. 83 . 25 4. 35 6"PCC
44.16 .56 1.94 8"PCC
llN 10.74 O. 3.81 4"G58 S"CRC
12N 10.96 .40 3.39 4"G58 8"CRC
135 10.63 .25 3.57 4"G58 811CRC
14$ 9.09 0. 4.00 4"GSB 8"CRC
21 E 13. 54 . 55 3. 02 6"PCC
22E 12.39 .41 3.25 6"PCC
23W 12.83 .39 3.23 6"PCC
24W 12. 82 . 35 3. 27 6"PCC
26W 12.31 .48 3.19 6"PCC
2711 13. 32 . 37 3. 22 6"PCC
• :;r
;" ¥ c c 0 ··u¥ c 0 . . o-~
~. ~o 0 00
0
~ . ~
0 z w 0 ~
~ ~
RIGID PAVEMENT ROAD RATER RESEARCH October 1982
" µ c . ·
- 0 ·-~ ¥ cµ .. 0 cc • 0 o·-
¥ ~ v ~.
o-00~ .
0
Charles Potter, P.E.
" µ c 0 ~
µ . 0
µ . ~
~ z w 0 ~
u 0
" ¥ c 0 ~
~ . u 0
z 0
c • ~· E w oz
z c - .
·~ C3 0 µ v > c
µ 0
z 0
> z. 0Z
u ·¥-•O -~ v • •o ·~ 00 . ., OU
'
µ ~
'* uo -o
0 me~ c¥ ~. v • ·~ c
u c . • c ~
z Z0
0 > uw •z ¥. u
·~ -~ o~
•u o-
'
c 0
µ 0 • ~ . 0 . m . c • "
c 0
µ 0 . " -µ ~ c . ·-00 ~ .
m~ .. c • "
z 0
ii: z
2'l z:::-.1 00 u' ·¥-
-~,.:t u-~ .-IN 00 •z ow
0
:::0-1 u 0
~
~
0
z 0 , • z
z-00
m u. 2..'2 ·v •0 cz ow W0 o~
Ll 0
z 0
z 0' . uz ·µ
-~:=.: VO
·~ -~ Ou ·-0'
z 0
ii: z
:;;
"' 0
~
. ~
u·•~ c ·- c o m o-." ~ 0
0 ~ • c -. .. •> > o~
:i-= "' 12 3.50 .220 0.69 3.99 .285 0.98 3.00 1.50 15.15 1.99 3.11 3.44 2.02 2.27 2.24 2.26 2 1/4"
12 3.11 .200 0.54 3.74 .246 0.84 3.00 1.93 7.58 2.49 2.72 3.42 2.37 2.33 2.62 2.48 1 3/4"
14 2.59 .110 0.22 3.22 .195 0.48 4.00 0.80 35.61 0.83 1.96 2.46 3.14 3.51 1.63 2.57 4"
15 1. 71 .098 0.15 l.55 .066 0.10 4.40 4.40 0. 4.40 1.52 1.46 1/4"
15 1.42 .105 0.14 1.62 .089 0.13 4.40 1.89 o. 4.40 1.32 1.44 l/4"
15 1.51 .131 0.18 1.58 .163 0.22 4.40 2.83 o. 4.40 1.35 1.35 1/2"
15 1.32 .104 0.13 1.40 .119 0.15 4.40 4.40 0. 4.40 1.21 1.27 6 1 /2"
18 3.39 .213 0.60 3.50 .256 0.80 3.00 0.54 24.24 1.38 2.82 3.12 1. 75 2.29 1. 79 2.04 2"
18 3.43 .198 0.61 3.50 .295 0.94 3.00 1.24 14.02 2.07 3.06 3.17 2.17 2.34 2.30 2.32 2 1/4"
18 3.38 .201 0.60 3.97 .267 0.92 3.00 1.33 12.88 2.14 2.97 3.46 2.19 2.33 2.36 2.35 2"
18 3.28 .198 0.55 3.16 .267 0.80 3.00 1.50 14.77 2.02 2.75 2.98 2.15 2.34 2.26 2.30 2"
19 2.66 .182 0.43 3.07 .266 0.76 3.00 0.94 11.36 2.24 2.38 2.88 2.36 2.39 2.43 2.41 1/2"
19 2.73 .142 0.34 2.95 .223 0.58 3.00 1.41 11.74 2.22 2.40 2.62 2.69 2.53 2.41 2.47 1/2"
28E 11.33 .37 3.38 6"PCC 19 3.02 .159 0.41 3.36 .220 0.66 3.00 1.41 8.71 2.42 2.60 3.02 2.63 2.47 2.56 2.52 1"
29E 11.12 .34 3.43 6"PCC 19 3.12 .137 0.37 3.33 .215 0.66 3.00 1.54 6.44 2.57 2.70 3.05 2.93 2.54 2.68 2.61 1 1/4"
38W 19.83 .54 2.66 3"Stab. 25 2.79 .219 0.54 4.57 .289 0.97 3.30 0.75 18.94 1.91 2.47 3.36 2.09 2.50 2.26 2.38 l 1/4" 6"PCC
39E 29. 38 . 56 2. 29 3"Stab. 25 2.57 .194 0.45 4.69 .307 1.07 3.30 0.66 24.62 1.49 2.32 3.50 2.02 2.59 1.95 2.27 1" 6"PCC
40W 26. 82 . 53 2. 40 3"Stab. 28 2.54 .176 0.41 7.15 .514 2.52 3.30 0.80 22.73 1.63 2.36 4.90 2.22 2.65 2.05 2.35 3/4" 6"PCC
-0 )>
"' ,,, ....., 0

c 0
µ. u w WD
V>E 0
µz
" w ~
w ~ 0 w
- u V> c 0
w·o c ~. => u
>, µ
D . w u ...c .,... x
u > w ...., c I.. ""O <'O 0 <l> c
a...,... vi-µ
~ u µ 0 c
~u w u. " oO W L L
u ~
c -o . ·c µ
0 -µ" u 0 o~ c E
µ 0 V>U
:!! ~c co . -u ~ LU •• ~-~
~ w w ~o
"' 0 °' 00
0
µ . ~
V> z w V> ~
Ll V>
u V>
RIGIO PAVEMENT ROAD RATER RESEARCH October 1982
" ~ <V .;: -o -- ~ µ cµ .. u c c w 0 ~--~ ~u ~w o-00 ~
w 0
Charles Potter, P.E.
" µ c ·:; ~
µ . 0
:;:; 0
oc
V>
"" V> ~
u V>
" ~ c :; ~
µ . u V>
z V>
c w
~· E W oz z
c -· -~ L3 0 ~ u 0 c ~ V>
z V> ,
z w V>Z
u ·µ-oO --~ u • WO -~ ~~ wo<> OU
'
;:'.
cr V>
uo -o
0 ,,,_ c~ ·- ~ ~w u w -~ c UC .
w c ::;
z ZV> V> , u w wz ~-0
uw~ c~ ~~ WU o-
'
c 0 :;:; u 0 :;:
"' 0
"' E w >
""'
c 0
~ u ·-~ ~ c w -00 ~
w "'~ .. c w
"
z V>
~ z
z V> , w z
zV>O
"' u. wO ~::=::: ·;:;.-WV> CZ ~w OV> o~
u V>
'
z V>
z V> ,
w uz w~
.~:::::: uo ·~ c~ ~u ·-0'
z V> , • z
·;::; C>
t.'<:r;IN ~o
·~ 0
;;;
"" V>
u V>
-
.!'. u __
-~ L
- c 0"' cr ._ ·oc 0 0
>, • c
- 0 cw • >, > o~
u""' c 0 ~
41E 27.02 .55 2.37 3"Stab. 28 2.49 .168 0.39 3.53 .357 1.06 3.30 0.71 21.21 1.74 2.31 2.96 2.29 2.68 1.94 2.31 3/4"
44\~
4511
46[
47£
48E
49E
51W
52N
53N
545
SSS
6"PCC
5.82 .43 4.17 6"PCC 14 3.06 .168 0.47 3.31 .265 0.75 3.00 1.16 22.35 1.51 2. 77 2.84 2.09 2.44 1.88 2.16 1 1/2"
7.87 .47 3. 70 6"PCC
6. 21 .26 4.24 6"PCC
6.20 .36 4.14 6"PCC
7.85 .31 3.87 6"PCC
6.45 .20 4.24 6"PCC
7. 78 .33 3.86 6"PCC
5.96 .16 4.40 6"PCC
5.52 .35 4.34 6"PCC
5.44 .49 4.22 6"PCC
5.65 .17 4.48 6"PCC
14 2.54 .168 0.39 4.43 .298 1.05 3.00 0.99 27.27 1.18 2.33 3.54 1.93 2.44 1.64 2.04 3/4"
14 2.59 .136 0.31 4.00 .260 0.84 3.00 1.89 8.33 2.44 2.29 3.24 2.87 2.55 2.58 2.56 3/4"
14 2. 70 .166 0.41 2. 71 .170 0.42 3.00 1.46 16.29 1.91 2.48 2.47 2.31 2.45 2.19 2.32 1"
14 2.94 .172 0.38 3.82 .259 0.82 3.00 1.67 11.74 2.22 2.57 3.18 2.42 2.43 2.41 2.42 l 1/4"
14 2.64 .158 0.39 3.70 .215 0.64 3.00 2.14 4.92 2.67 2.48 2.98 2.76 2.47 2.75 2.61 3/4"
14 3.40 .150 0.46 5.19 .253 0.96 3.00 1.59 13.26 2.12 2.65 3.79 2.56 2.50 2.34 2.42
18 3.14 .1'87 0.51 5.04 .268 1.02 3.00 2.31 3.03 2.80 2. 73 3.80 2.60 2.38 2.85 2.62
18 3.08 .152 0.44 3.67 .230 0. 77 3.00 1.50 15.53 1.96 2.87 3.35 2.46 2.49 2.22 2.36
3/4"
3/4"
3/4"
18 3. 51 .180 0.57 4.19 .274 1.02 3.00 0.90 29.54 1.03 3.17 3. 72' 1. 77 2.40 1.53 1.97 2 1/4"
18 2.92 .175 0.47 3.46 .255 0. 77 3.00 2.27 3.41 2. 77 2. 70 3.01 2.67 2.42 2.83 2.63 1 /2"
56W 12.53 .24 3.41 l 1/2"Grav 26 2.85 .159 0.41 3.61 .173 0.47 3.15 2.07 7.20 2.65 2.54 2.71 2.81 2.59 2.77 2.68 1" 6"PCC
57W 12.43 .39 3.27 1 1/2"Grav 26 2.55 .139 0.32 3.53 .265 0. 78 3.15 1.40 5.68 2.75 2.30 2.94 3.07 2.66 2.85 2.76 1/2" 6"PCC
58W 10.14 .18 3.69 1 1/2"Grav 26 2.65 .165 0.39 2.93 .195 0.52 3.15 2.34 4.16 2.86 2.34 2.64 2.86 2.57 2.93 2. 75 3/4" 6"PCC
59W 13.22 .16 3.43 1 1/2"Grav 26 2.48 .164 0.37 2.95 .233 0.59 3.15 2.43 1.51 3.04 2.26 2.54 2.96 2.58 3.07 2.83 1/2" 6"PCC
60E 11.90 .31 3.39 1 1/2"Grav 26 2.43 .179 0.40 3.30 .220 0,63 3.15 1. 76 8.33 2.57 2.21 2.87 2.60 2.52 2. 71 2.62 1/4" 6"PCC
-0 )> G) ,..,., _,

c 0
:; lu o ·~ 0 E
0 c;z • r
• 0 0 0
- u 0 c . w" oc ~. ~> u
~ u ~c • 0 o·" ~ .. ~
~u uo 00 c
u
~ ~
~ . . u ." x > • Cu • c 0-
~ c ~ 0 c
0
c - 0 .. " -~ 0"
~· u 0 0 0 c E ~o 0U
0
;:; c: c 0 .. " u~ c u .. o:;: ~.
o ~o
.'l g
0
:;; . ~
0 z w
"' u 0
u 0
RIGID PAVEMENT ROAD RATER RESEARCH October 1982
. ~ c . ."
-o ·"~ ~ c~ .. u c c • 0 o·" ~
~ u ~· o-00~ • 0
Charles Potter, P.E.
. ~ c ·;; ~
~ . 0
~ . ~
0 z w
"' g
" ~ c ·;; ~
~ . g
z 0
c . ~,
g~ z
c -· -~ "" 0 ~ u 0 c ~ 0
z 0 ,
z • 0Z
u ·~-·~;: u • 00
-~ 00 ... OU ..,
61E 11.84 .30 3.41 l 1/2"Grav 26 2.49 .166 0.38 2. 70 .235 0.56 3.15 1.80 6"PCC
62E 11. 75 .35 3.36 1 1/2"Grav 26 2.51 .141 0.32 2.86 .254 0.67 3.15 1.58 6"PCC
63£ 12.50 .26 3.39 1 1/2"Grav 26 2.75 .159 0.33 2.41 .167 0.37 3.15 1.98
64W
65W
66E
67E
6"PCC
4.97 .10 4. 78 6"PCC
5.88 .11 4.47 6"PCC 5
5. 79 .12 4.49 6"PCC 5
5.18 .16 4.64 6"PCC
2.25 .141 0.29 3.00 .189 0.48 3.00 2.57
2.55 .128 0.28 3.39 .167 0.45 3.00 2.52
2.70 .116 0.25 3.61 .230 0.64 3.00 2.49
2.22 .104 0.21 2.52 .157 0.34 3.00 2.31
68H 19.29 .39 2.84 3"Stab 27 2.25 .165 0.34 3.13 .235 0.64 3.30 1.46 6"PCC
.; ~
j WO -o
0 ~c~
"~
~· u 0
-~ c we . • c
:;;
z Bi0 u~ wz ~-.~-u--~ -~ ~~
'
c 0
:;; u . ~ . 0
0 ~ . c . "'
c 0
:;; u . " -~ ~ c •·" 00 ~
0 ~~ . . c 0
"'
~
0 , . z
u> ·~ ~-~;±, u~ ·-c IN 00 oz ow
0
u
~ ~
0
z 0 ,
0 z
z-00 ~ v.
00 ~~ ·u 00 CZ ow 00 o~
u ::'.C
'
z 0
z 0>
0 uz o~
.~::::: uo -~ -~ ow ·-0'
z 0
~ z
'.:> s ~1
zw 0-, u-·~+ -~ uo -~ c • 00 Q; -....,
0
v; z w 0 ~1
g
-
0 ~
u·" ·~ c ." c
NO~
o·" .. ~.
~o • c -. cw ~~ o~
u"' c ~
6.44 2. 70 2.31 2.39 2. 77 2.57 2.81 2.69 1/2"
2.65 2.96 2.30 2.65 3.15 2.66 3.01 2.84 1/2"
7.20 2.65 2.44 2.23 2.81 2.59 2. 77 2.68 1"
1.14 2.92 2.03 2.52 3.00 2.53 2.94 2. 74 O"
i.51 2.90 2.19 2.10 3.oo 2.57 2.n 1.15 o"·
1.89 2.87 2.17 2. 79 3.00 2.61 2.91 2. 76 1/4"
3.03 2.80 2.02 2.19 3.00 2.65 2.85 2. 75 O"
7.20 2.77 2.05 2.70 2.89 2.70 2.90 2.80 1/4"
69W 22.74 .54 2.54 3"Stab 27 2.68 .185 0.43 3.46 .229 0.72 3.30 0.75 11.36 2.47 2.33 3.14 2.57 2.62 2.68 2.65 1" 6"PCC
70E 22. 75 .53 2.55 3"Stab 27 2.61 .174 0.39 4.41 .293 0.91 3.30 0.80 10.98 2.49 2.25 3.12 2.67 2.66 2. 70 1.68 1" 6"PCC
71E 22.28 .43 2.67 3"Stab 27 2.16 .174 0.35 4.41 6"PCC
.374 1.10 3.30 1.27
721;1 6. 20 0. 4. 50 6"PCC 2.25 .170 0.34 3.00 3.00
73H 7.65 .08 4.13 6"PCC 2.53 .169 0.38 7.17 .320 l.98 3.00 2.66
74E 9.08 o. 4.00 6"PCC 2.39 .174 0.37 6.36 .324 1.88 3.00 3.00
75E 6. 94 0. 4.34 6"PCC 2.44 .170 0.39 7.49 .283 1.88 3.00 3.00
76W 15.02 .06 3.41 4"GSB 18 1.09 .159 0.15 3.70 .620 1.48 5.40 4.94 lO"PCC
7.20 2. 77 2.02 2.94 2.89 2.66 2.90 2. 78 O"
0. 3.00 2.02 2.82 2.43 3.00 2. 72 O"
0.76 2.95 2.25 6.18 2.81 2.44 2.96 2. 70 O"
0.
0.
3.00 2.13 5.80 2. 79 2.42 3.00 2. 71 O"
3.00 2.30 6.64 2.82 2.43 3.00 2. 72 O"
0.45 5.35 0.91 2.38 5.22 4.45 5.36 4.91 3/4"
" )>
"' rn __, N

!l g
l-80
I-80
l-8-0
!-80
~ 8
Pott.
Pott.
Pott.
Pott.
l-680 Pott.
l-8-0 Oallas
l-80 Dallas
~ ~ '5 EB
"'
" 1 £
l 6.61
6.61
" ! £ ~
z 3o
~~ -t~ EC>
2 ~ . Jj " . .t
-o
~~ oo ~~ ~8
11.52 0.00 3.50 4"GS8 a~cRCP
11.52 0.05 3.50 4~GSB B"CRCP
RIGID PAVEMENT ROAD RATER RESEARCH October 1982
Charles Potter, P.E.
. !~ •;;: .
" ~g
~ ,1
~ z ~
tl fl
,! ~
~! ~~ g::
"' 13 2.49 0.103 0.18 2.18
13 1.88 0.020 0.03 l.95
~ . 0
" " '1 !'! ~
" 0
~ " . fl
~ ~
~, 5~ ~g ~~ t
~
" ;~ ~~ 2'.!2. ~· ·~ or
£
--- Jf
~~ ~! 0~
~ 0.149 0.27 4.40 4.40 0.
~e;; v>
~~ ·-2'.~ ~s
:0
g
~
"' ~ ' 1
. 0
" ~~ ':~ e~
1 4.40 1.73 1.82
0.04Z 0.08 4.40 4.09 0.38 4.36 1,59 1.80
l
~
0
" 2~ ~-
~~ ~;:;;
}~ g x
~ ~~
~; i~ c'!jf
" ! 25 ~~ i~ oolN ·o-~ ~ ~
0 ~
v~
ii ~~ t~ 3~
~~
lo 1/2"
9"
ES 11.52 18.93 0.10 3.80 4"AT8 8"CRCP
13 1.53 0.102 0.13 1.50 ·0.011 -0.02 5.36 4.59 1.14 5.22 1.30 1.42 7 112~
WB 11.52
EB 18.93
WB 18.93
EB 27 .00
WB 27 .00
ES 13.05
WB 13.05
18.93 0.00 4.05 4"AT8 S"CRCP
27 .OO 0.10 3.45 4"ATB a~cRCP
27 .oo 0.05 3.50 4"ATB 8"CRCP
33.80 0.45 3.05 4"GS8 S"CRCP
JJ.so a.so J.1s 4"GSB S"CRCP
29.21 0.10 3.85 4nGSs snCRCP
29.21 0.30 3.80 4"GSB S"CRCP
EB 100.80 106.16 0.10 2.95 AC/PC Var.
118 100.80 106.16 0.45 3.20 4"GS8 10" Std. PCCP
EB 106.16 111.14 0.40 3.00 4"GSB 8" Bar Mats
WB 106.16 111.14 0.35 3.15 4"GSB 8" Bar Mats
13 1.48 -0.023 -0.03 1.48
13 1.57 0.130 0.18 1.28
13 l.53 0.054 0.07 l.66
16 1.83 0.129 0.20 2.07
16 2.00 0.145 0.24 1.75
16 1.71 0.043 0.07 2.75
16 2.13 0.075 0.13 2.70
16
16 1.29 0.054 0.06 3.00
16 1.92 0.127 0.19 2.63
16 2.11 0.101 0.18 1.79
0.0 o.o 5.36 5.36 o. 5.36 1.31 1.32 7 1/4"
0.118 0.14 5.36 4.59 1.14 5.22 1.37 1.22 7 3/4"
0.023 0.03 5.36 4.98 0.57 5.29 1.31 1.41 7 1/2"
0.125 0.22 4.40 1.57 o. 4.40 1.57 1.73 8 3/4TI
0.115 0.1-8 4.40 1.26 0. 4.40 1.62 1.54 9 1/2"
0.081 0.16 4.40 3.77 o. 4.40 1.53 1.98 4 3/4"
0.075 0.17 4.40 2.51 3.17 4.09 1.76 2.25 6 l/4TI
7"
0.215 0.51 5.40 1.93 4.17 4.90 1.13 2.36 5.40 5.08 5.02 5.05 6 1/4"
0.222 0.50 4.40 1.89 0.19 4.38 1.47 2.23 9 1/4~
0.047 0.08 4.40 2.20 o. 4.40 1.74 1.69 10"
-0 ,,. "' ,.,, -.J w
"

RIGIO PAVEMENT ROAD RATER RESEARCH October 1982
$
~ I-80
I-80
~ 8
Dallas
Dallas
0 0
" u
~
" ! ~
!
" 0
~
;; 0 ~
~
$0 .>:'..;;:
;I 30
]J
~ .; ~ ~]
~ .t
0 - 0 ., '" .B~ uo on
~8 EB 111.14 118.00 0.60 2.65 4"GSB
8" Bar Mats
WS 111.14 118.00 0.50 3.15 4"GSB 8" Bar Mats
EB 118.00 122.40 0.30 3.00 4"GSB 8" Bar Mats
WS 118.00 122.40 0.50 3.20 4"GSS an Bar Mats
US 30 Story EB 148.00 156.21 0.10 3.05 4"GSB 10" PCCP
\IB 148.00 156.21 0.10 3.10 4"GSB 10" PCC?
IA 17 Boone NS 21.63
21.63
39.76
39.76
32.76 0.00 4.20 8" PCCP
SB 32.76 0.00 4.20 8" PCCP
IA 17 Hami 1 ton NB 48.95 0.00 4.20 7 1/2" PCCP
SB 48.95 0.00 4.20 7 1/2" PCCP
IA 17 Hamilton NB 134.00 135.39 0.00 4.10 8" PCCP
520
520
SB 134.00 135.39 0.00 4.10 gn PCCP
Hamilton EB 135.58 140.09 0.00 4.30 4" Cl. ASS 8 1/2" PCCP
\.18 135.58 140.09 0.00 4.30 4" Cl. ASS 8 1/2" PCCP
Hamilton EB 141.50 149.50 0.05 4.15 4" Cl. ASS 9" PCCP
WB 141.50 149.50 0.10 4.15 4" Cl. ASS 9" PCCP
Charles Potter, P.E.
0
:t
eo
]i zg ~
~
i :;\
0 0"
z~ g~ ~o 00 no z~ o~~
~
16 2.32 0.100 0.19 2.62
16 2.38 0.115 0.22 2.09
16 2.48 0.125 0.27 3.09
16 2.98 0.169 0.41 2.72
18 l.24 0.055 0.06 1.41
18 1.17 0.012 0.01 1.42
1.59 0.157 0.21 4.33
1.28 0.151 0.17 3.03
1.65 0.098 0.14 2.88
1.73 0.113 0.17 3.05
1.38 0.118 0.14 l.84
l.41 0.090 0.10 1.75
1.06 0.097 0.09 2.59
1.09 0.099 0.10 2.37
l.08 0.096 0.09 2.28
l.13 0.094 0.09 l.SO
" ~ . ~ ;;
~
~ !;l
·,
~ ' i~ ~g ~§
~ ~
" i~ ~~ ~~
l
cl ___ 7 uo ~g
f] u;
~
~ti: -g & ez
-~~
i5 ol
! ~ ~
~
~
"
0 0
" ~~ O,!J
~" ~IQ
"
" ! ~
Bi~
~~ ~::: ~~ 0~\N
~
0
" ! 2~
~g
~~ ~~ g.~ o-
~ r
<"&-.··
2" j~ uo ~~
£:t
2
1 ~~·
~
" l~ :~ ,!:! ; ,. J; ~~
0.168 0.37 4.40 0.63 0.95 4.31 l.93 2.21 10 l/Ztt
0.103 0.19 4.40 1.26 o. 4.40 1.89 1.86 10 1/2!1
0.177 0.47 4.40 2.51 2.65 4.14 2.12 2.64 10 3/4"
0.135 0.31 4.40 1.26 o. 4.40 2.45 2:.29 11 i1z'1
0.216 0.26 5.40 4.63 0.95 5.29 1.04 1.22 5.40 5.07 5.31 5.19 2 3/4~
0.207 0.25 5.40 4.63 0.76 5.31 0.98 1.22 5.40 5.33 5.33 5.33 2"
0.296 1.00 4.00 4.00 o.
0.320 0.86 4.00 4.00 0.
0.252 0.57 3. 75 3.75 o.
0.262 0.68 3.75 3.75 o.
0.121 0.17 4.00 4.00 o.
0.150 0.20 4.QO 4.00 o.
0.280 0.60 5.61 5.61 0.
0.258 a.so s.61 5.61 o.
4.00 1.36 3.39 3.91 3.30 4.00 3.65 0"
4.00 i.11 2.67 3.99 3.33 4.oo 3.67 o~
3.75 1.46 2.27 3.75 3.34 3.75 3.55 0"
3.75 . 1.50 2.58 3.75 3.28 3.75 3.52 0"
4.00 1.18 1.42 4.00 3.48 4.00 3.74 1 3/4"
4.00 1.11 1.36 4.00 3.60 4.00 3.80 l 3/4"
5.61 U.91 2.14 5.61 5.00 5.61 5.31 2"
5.61 0.97 1.92 5.61 4.99 5.61 5.30 2 1/4"
0.260 0.38 5.86 5.44 0.25 5.83 0.97 1.45 5.86 5.23 5.84 5.54 2 1/4"
0,239 0.38 5.86 5.02 1.20 5.70 0.99 1.57 5.86 5.25 5.74 5.50 2 1/2"
-0 )>
"" rn __, .,,.
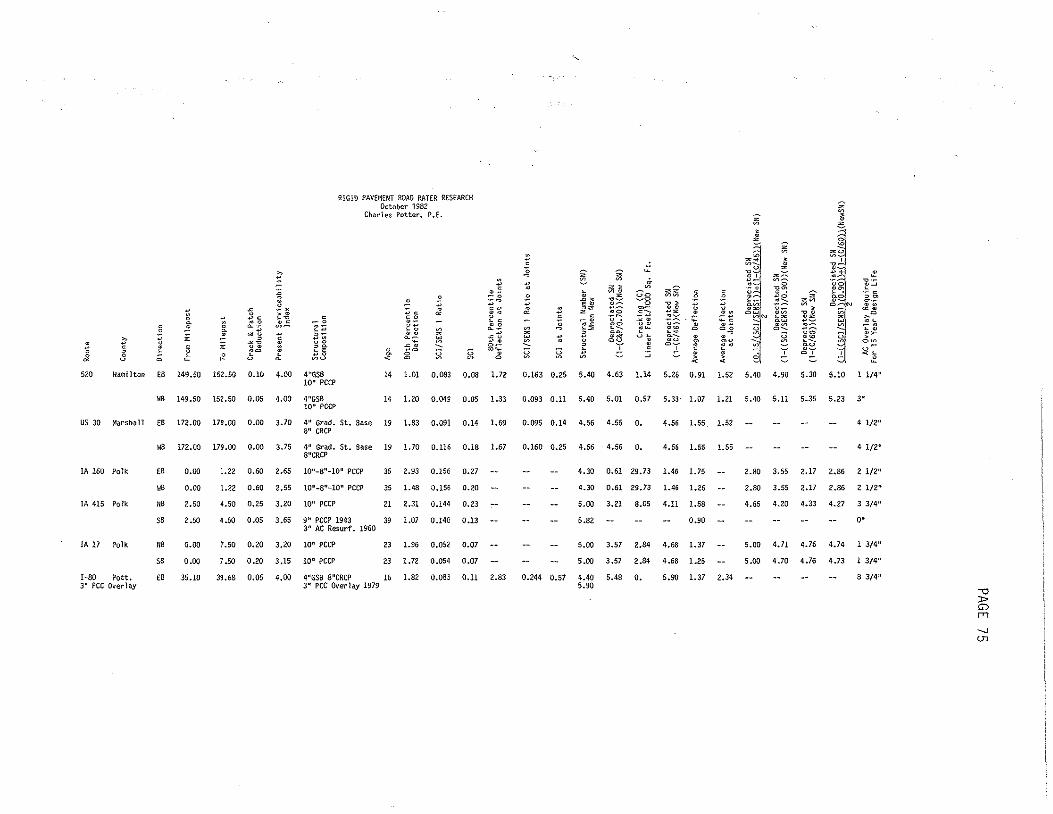
" i d1 8
0 0
" 1
" ! " l
" 0
~
" ~
~g ~~ u< 30
;:
1~ ~]
j k
0
- 0
i~ g g_ . . t:8
RIGID PAVEMENT ROAD RATER RESEARCH October 1982
Charles ?otter, f>.E.
.!'
~
"" ~~ .. ~o:
.z~ g
0
" tJ
~ z
ti :;] Ol
" 0 . --o ·-~ g~ ~o ~~
~.! ro~
,g
520 Hamilton EB 149.50 152.50 0.10 4.00 4~GsB 10" PCCP
14 1.01 0.083 0.08 1.72
WS 149.50 15Z.50 0.05 4.00 4"GSB 10" PCCf>
14 1.20 0.04S 0.05 1.33
US 30 Marshall EB 172.00 179.00 0.00 3.70 4" Grad. St. Base 19 1.83 0.091 0.14 1.69 a~ CRCP
IA 160 Polk
IA 415 Polk
IA 17 Polk
I-80 Pott. 3" PCC Overlay
WB 172.00 179.00 0.00 3.75 4" Grad. St. Base 19 1.70 0.116 0.18 1.67 8"CRC?
" WB
NS
SB
'" SB
EB
0.00
0.00
2.50
2.50
0.00
0.00
35.10
1.22 0.60 2.65 10"-8"-10" PCC?
1.22 0.60 2.55 lOn-8"-lOa f>CCP
4.50 0.25 3.20 10" PCCP
35 2.93 0.156 0.27
35 1.48 0.156 0.20
21 2.31 0.144 0.23
4.50 0.05 3.65 9" PCCP 1943 39 1.07 0.140 0.13 3" AC Resurf. 1960
7.50 0.20 3.20 10" PCCP
7 .50 0 .20 3 .15 10" PCCP
23 l.96 0.052 0.07
23 1.72 0.054 0.07
39.68 0.05 4.00 4"GSB 8"CRCP 16 1.82 0.083 0.11 2.83 3~ PCC Overlay 1979
~ z ~ -:;]
" ~ 0
:;]
.,
z ~
1l )< .. :~ ~~ ~
"'
Bi ~4 ]~ .::g
~~ ·~ OU
'
.i uo
i~ 1~
~ ~
i5Bi "Z 6
]~ ~~ Q~
g
~ g
f "-
0
" 0 .. -~ o ·~ 00
~: ~.
~
Bi
! 2
"'' z~
~~ $,!..
gl 02 o~ ~N
:;] ~
0
2~ ~g
~~ tl'.5 g!:Z_
:;]
'
z z~ ~,
~.
~~ 00 ~:.:e. ~u
~6
z
~
"'"
~
"O ~ !~ g~ :g ~: ·~ 6~
"' . " 0.163 0.25 5.40 4.63 1.14 5.26 0.91 1.52 5.40 4.90 5.30 5.10 1 1/4"
0.093 0.11 5.40 5.01 0.57 5.33· 1.07 1.21 5.40 5.ll 5.35 5.23 3~
0.095 0.14 4.56 4.56 0. 4.56 1.55. 1.52
0.160 0.25 4.56 4.56 o. 4.56 1.56 1.55
4.30 0.51 29.73 l.46 1.75
4.30 0.61 29.73 1.46 1.26
5.00 3.21 8.05 4.ll 1.58
5.82 0.90
5.00 3.57 2.84 4.68 1.37
5.00 3.57 2.84 4.68 1.25
0.244 0.57 4.40 5.48 o. 5.90
5.91) 1.37 2.34
4 1/2"
4 1/2"
2.80 3.55 2.17 2.86 2 1/2"
2.80 3.55 2.17 2.86 2 1/2"
4.65 4.20 4.33 4.27 3 3/4"
0"
5.00 4.71 4.76 4.74 1 3/4"
5.00 4.70 4.76 4.73 1 3/4"
8 3/4"
" )> G:l rrt
__, 01

4
53 :::;: '-""
z 0
ts w ;:;: ~2 w _J
~ w 0 a:: w CL
~ 1 00
BOTH PERCENTILE DEFLECTION VERSUS
PRESENT SERVICEABILITY INDEX
<> ~
D. <><>
<> <> + +
* D. fr ~ + +rii--¥
D. D.
x
D
<><> <>
<> ~ <> <>
<> $ <> + <> <> <>
<> <> <> <> <>
x x
x
0 ..,_~~~~~~~~~~~~~~~~~~~~~~~~~~~~~~~~~~~~~~~~-,---,-
0
LEGEND:
1 2 3
PRESENT SERVICEABILITY INDEX (PSI)
0 10' PCCP ON 4' GSB D. 6" PCC ON 3" STAB.
<> 6" PCC ON SUBGRADE X B" CRCP ON 4" GSB
4 5
+ 6' PCC ON 1.5" GSB * B' PCCP ON SUBGRADE
-u )> G) rn _, °'

4
~ ~
~3 :::;; '-'
z 0 f= 0 w _j LI..
~2 w
IJ f--0 ro
0
0
LEGEND:
& <>
<> <>
~
D !:;.
BOTH PERCENTILE DEFLECTION VERSUS
<>
<>
10
10" PCCP ON 4" GSB 6' PCC ON 3" STAB.
AGE
<> g <>
<> s <> <> <> <>
~ s
x ~ x
D
20
AGE (YEARS)
<> 6" PCC ON SUBGRADE X 8' CRCP ON 4" GSB
+
*
!:;. + + + ~ !:;.
* ts ~
30
6" PCC ON 1.5" GSB 8" PCCP ON SUBGRADE
-0 3>
"' fT1
--J --J

30
++
~
Vl 20
g ~ 0 <><> w 0 <
<>
1 10
<><><> <>
<>
0
AGE VERSUS
CRACK AND PATCH DEDUCTION
l!. l!. ++ ++ + +
<> <> <> <> <>
x x <> <> <> <> <>
<> <>
<> <>
<>
l!. l!. M
l!. l!.
<>
*
..,...,.~~~~~~~~~~~~~~~~~~~~~~~~~~~~~~~~~~~~~~~~~~~~
0.0 0.1
LEGEND: 0 l!.
0.2 0.3 0.4 0.5 0.6 0.7
CRACK AND PATCH DEDUCTION
10' PCCP ON 4" GSB 6' PCC ON 3' STAB.
<> 6' PCC ON SUBGRADE X 8' CRCP ON 4" GSB
+ *
0.8 0.9 1. 0
6" PCC ON 1.5" GSB 8" PCCP ON SUBGRADE
" )> G") rr1
__, 00
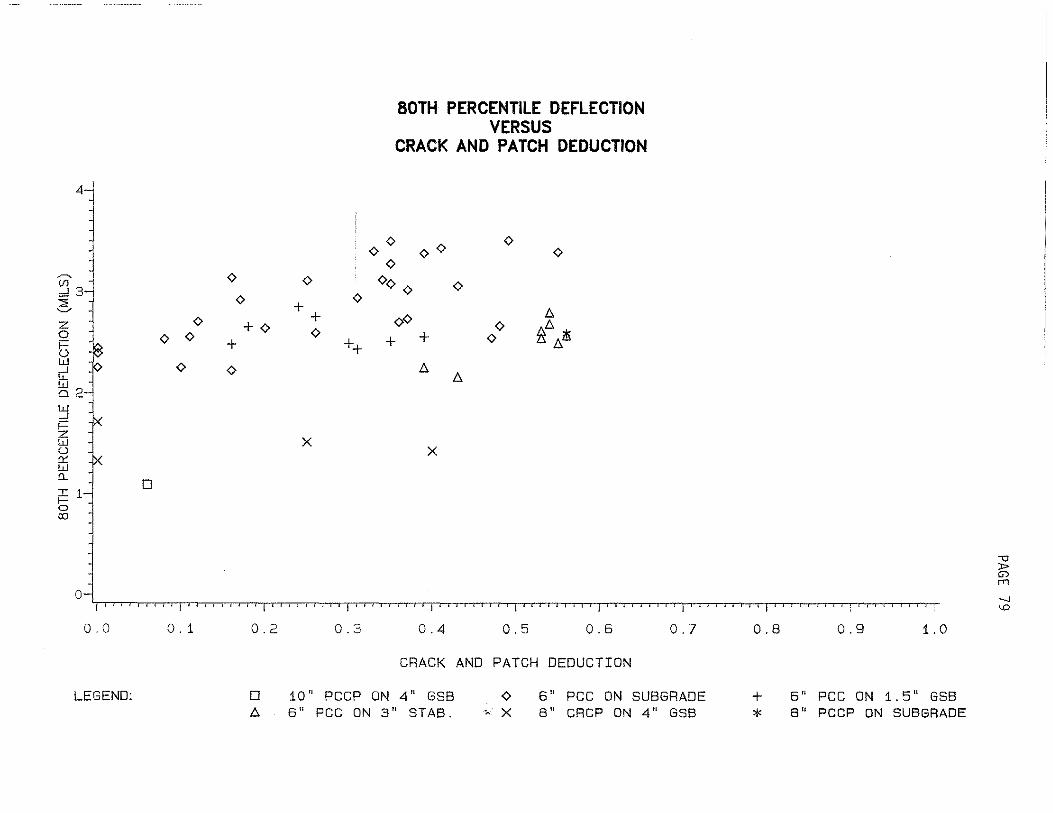
4
~ <> (f)
d3 ::;: <> ~
<> z + <> 0
ti <> <> + w f <> --' <> LI..
l!5 2 w --' ;= z
i w u Q:'. w 0..
::r: 1 -I 0 f--0 ro
~ o-l
0.0 0.1 0.2
LEGEND: 0 6.
<>
+ <> + <>
++
x
0.3
<>
BOTH PERCENTILE DEFLECTION VERSUS
CRACK AND PATCH DEDUCTION
<> <> <> <> <>
<> <>o <> <>
!:;.. o<> <> !:;.. 'e. !:;'If. + + <>
!:;.. !:;..
x
0.4 0.5 0.6
CRACK AND PATCH DEDUCTION
0.7
10' PCCP ON 4' GSB <> 6' PCC ON SUBGRADE 6' PCC ON 3" STAB. " x 8' CRCP ON 4' GSB
-0 )> G) rn
-.j
'-"
0.8 0.9 1. 0
+ 6' PCC ON 1.5' GSB
* 8' PCCP ON SUBGRADE

4
<> ~ (f) ....1
~3 z /::,. a
It, ~ w ....1 "- /::,. w
/::,. Cl
t:l 2 ;::
!J ro
~
0
0
LEGEND: 0 /::,.
<P <>
<> <> +
1
BOTH PERCENTILE DEFLECTION VERSUS
DEPRECIATED STRUCTURAL NUMBER (1-(4.5-PSl)/2.00)*NEW SN
<> <> <>
<> <> <>
<> + + <> + $
+++t <> <> <>
x x
0
2
DEPRECIATED STRUCTURAL NUMBER
~ <>
<>
x
10" PCCP ON 4" GSB <> 6" PCC ON SUBGRADE 6" PCC ON 3" STAB. x 8" CRCP ON 4" GSB
<> <>
<>
~
x
-0 )> G) fT1
co 0
3 4
+ 6" PCC ON 1.5" GSB
* 8" PCCP ON SUBGRADE

4
~ <>
<> ~
(fJ
<> <> <> <>
<> -' ~3 <> <> <><> z
~ /::,. 0 /::,. <> [3 /::,./::,.~ <> w
<><> + +
-' "-w 0
/::,. /::,.
':::J 2 i= z w (.) a::: w a.. I
b 1 (lJ
0
BOTH PERCENTILE DEFLECTION VERSUS
DEPRECIATED STRUCTURAL NUMBER (1-(C 8c P)/0.70)*NEW SN
<> <> <> <>
++ <> <> <> +
++ + <> <> $
<> <> <>
x x x
x D
'T-~~~~~~~~~~~~~~~~~~~~~~~~~~~~~~~~~~~~~~~~~~~~
0
LEGEND:
1 2 3
DEPRECIATED STRUCTURAL NUMBER
0 10" PCCP ON 4" GSB /::,. 6" PCC ON 3" STAB.
<> 6" PCC ON SUBGRADE X 8" CRCP ON 4" GSB
4 5
+ 6" PCC ON 1.5" GSB * 8" PCCP ON SUBGRADE
-0 )> G)
rn
()) ~

4
§' ~3 z 0
§ ~ w 0
'::J 2
~ t5 a:: w n. ::r: bi (()
B
<> <>
<>
<> fl. fl. fl.
BOTH PERCENTILE DEFLECTION VERSUS
DEPRECIATED STRUCTURAL NUMBER (1-(C/45))*NEW SN
<> <>~ <>
<><> <> <> <> + <> <>
~ i + ~ ~+~+ ~
t <><> A
~ B
§ B
*
* A
** * A
~ A
h:j:j: A A A D
~
0 ..,._,.....,.-,--.-,--,--,-.,-,,-,-...,-.,--,-,-..,.-,.....,.-,--,--,.....,.-,--.-,--,--,-.,-,,-,-...,--r-,-,-..,.-r-r-,--.-r-r-,--r-r-r-,-.,-,,-,-...,-.,-,-,-..,.-,.....,.-,--,-,.....,.-r
0 i
LEGEND:
2 3 4
DEPRECIATED STRUCTURAL NUMBER
D 10' PCCP ON 4' GSB fl. 6' PCC ON 3' STAB. :j:j: 8' CRCP ON 4' ATS
<> 6' PCC ON SUBGRADE + ~ X 7.5' PCCP ON SUBGRADE * ,. A 8' CRCP ON 4' GSB B
5 6
6' PCC ON 1.5' GSB 8' BAR MATS ON 4' GSB 8' PCCP ON SUBGRADE
" J> G) fT1
co N

ffi O'.l :::;: :::i z
~ § :::i
~
10.0
Cl 1.0 w ';;: u w ~
th Cl
0.1
0.1
LEGEND:
AVERAGE DEFLECTION VERSUS
DEPRECIATED STRUCTURAL NUMBER (1-(C/45))*NEW SN
bl DODD
** * »:
~~~ ~<o<>o~ {g
~ i <>
<>
*
1. 0
AVERAGE DEFLECTION (MILS)
10.0
D 10" PCCP ON 4" GSB 6 6" PCC ON 3" STAB.
<> 6" PCC ON SUBGRADE . + 6" PCC ON 1.5" GSB X 7.5" PCCP ON SUBGRADE * 8" PCCP ON SUBGRADE
'° )O> G? rr1
00 w

n:: w CD 2 :::i z _J <( n:: :::i f-0 :::i n:: I-(/)
a w ~ u w n:: Q_ w a
10.0
1. 0
0.1
AVERAGE DEFLECTION VERSUS
DEPRECIATED STRUCTURAL NUMBER .5(( 1-{(SCl/SENS1)/0.90))+(1-(C/SO)))*NEW SN
c,-~~~~~--.~~~-r~~-,-~--.~--.----.~.,--..--.-~~~~~~-,--~~~.-~----,~~.---r~.----r-----i--r
0.1
LEGEND:
1. 0 10.0
AVERAGE DEFLECTION (MILS)
D 10" PCCP ON 4" GSB A 6" PCC ON 3" STAB. # 8" PCCP ON SUBGRADE
0 6" PCC ON SUBGRADE + 6" PCC ON 1.5" GSB X 7.5" PCCP ON SUBGRADE * 8.5" PCCP ON 4" CL.A A 9" PCCP ON 4" CLASS A SUB.
-0 J>
"' rn 00
""

~'i~"~1J·::,
8 0 ~
~
"' z
_J
~ 2
B ~~ .,., i;: 'co 2w2E-m -
~
;1 T
L ;;
i :- . '. : ! ii l : ! '
Structural Rating ~ AASHO Structural Number
.5
AVERAGE .ROAD RATER DEFLECTION .VERSUS
ESTIMATED STRUCTURAL RATING
.6 ,7 .8
Correlation Coefficient R= -0.895 -+-i--c++~-t~-rl+-7.;~-t-~+--
1 ' ; ' , "
, 1 1 r r 1 1 1 1 rrrrrnH H 1i1 · · j l ! .~T!>-:-:-!ii'
,1 • 2 i3 ,4 5 ,6 7 8 9 1,0
/\VE~AGE ROAD RATER DEFLECTION <MILSJ
! '' l ~ ! f ii t
ITTTI
2
2
NOVEMBER 22, 1982
3 4 5
Tl 'j ' if;
6 7 8 9 JO
9
8
7
6
5
4
3
2
" J> G:> rrl
00 U"1


APPENDIX F
LONG TERM MONITORING CORE PICTURES
INTRODUCTION
PAGE 87
Core samples shown on pages 88 through 130 were obtained in October and November 1983 on 21 Long Term Monitoring Sections. The Road Rater tested in the outside wheeltrack and then was moved to permit core drilling and soil sampling at the same location. Road Rater testing in the spring of 1983 was performed in the outside wheeltrack at approximately the same locations. Cores are shown measured from the top down with the top located at the left-hand side of the photos.

LTM PAVEMttH CORES
PAGE 88
. ·«.:.-:;:~;·/·<~: ;'i
I Core No. Route Milepost Dir. County Core No. Route Milepost Dir. County
88 us 30 141. 35 WB Boone 89 us 30 140,85 W!l Boone
Date Pave. Struct. Soi 1 i)upport Tested Temp °F Rating K Value
Date Pave. Struct. Soil Support Tested Temp °F Rating K Value
5-19-83 55° 6. 35 225 10-14-83 75° 6. 10 225+
5-19-83 55° 4.55 225+ 10-14-83 75° 3. 30 225+
Core No. Route Milepost Dir. County Core No. Route Milepost Dir. County
90 US JO 140.35 WB Boone 91 us 30 139.85 WB Boone
Date Pave. Struct. Soil Support Date Pave. Struct. Soil Support Tested Temp °F Rating K Value Tested Temp of Rating K Value
5-19-83 55° 7.00 225+ 5-19-83 55° 7. 50 150 10-14-83 75° 6,60 225+ 10-14-83 75° 6. 10 225+
Core No. Route Milepost Dir. County Core No. Route Milepost Dir. County
92 us 30 139. 50 EB Boone 93 us 30 140.00 EB Boone
Date Pave. Struct. Soii Support Date Pave. Struct. Soi 1 Support Tested Temp °F Rating K Value Tested Temp °F Rating K Value
5-19-83 55° 5. 70 215 5-19-83 55° 6.35 225 10-14-83 75° 5. 70 225+ 10-14-83 75° 5. 45 225+

LTM PAVEMENT CORES PAGE 89
'. ~I
. 8 4 ' , ,' i
Core No. Route Milepost Dir. County Core No. Route Milepost Dir. County
94 us 30 140.50 EB Boone 95 us 30 141.00 EB Boone
Date Pave. Struct. Soi I Support Date Pave. Struct. Soil Support Tested Temp °F Rating K Va 1 ue Tested Temp °F Rating K Value
5-19-83 55° 4.55 185 5-19-83 55° 6. 70 110 10-14-83 75° 5.80 225+ 10-14-83 75° 5.80 225+
8 B. . c v \ l, '.
~ , 2 :" ,,: '" , ~) \ ~ I
Core No. Route Milepost Dir. County Core No. Route Milepost Oir. County
96 us 30 141.50 EB Boone 97 us 30 141.00 EB Boone
Date Pave. Struct. Soil Support Date Pave. Struct. Soil Support Tested Temp °F Rating K Value Tested Temp OF Rating K Value
5-19-83 55° 5. 70 190 5-19-83 55° 6. 70 225+ 10-14-83 75° 5.80 210 10-14-83 75° 6.-35 225+
88 . -·
Core No. Route Milepost Dir. County Core No. Route Milepost Dir. County
98 us 30 141. 50 EB Boone 99 us 30 143.00 EB Boone
Date Pave. Struct. Soi J Support Date Pave. Struct. Soil Support Tested Temp OF Rating K Value Tested Temp OF Rating K Value
5-19-83 55° 5.55 105 5-19-83 55° 4.95 180 10-14-83 750 5.55 215 10-14-83 75° 5.90 225+

LTM PAVEMENT CORES PAGE 90
Core No. Route Mi 1 epost Dir. County Core No. Route Milepost Dir. County
100 us 30 173.00 EB Marshall 101 us 30 173.80 EB Marsha 11
Date Pave. Struct. Soil Support Date Pave. Struct. Soil Support Tested Temp °F Rating K Value Tested Temp °F Rating K Value
6-16-83 65° 4.30 80 6-16-83 65° 4.55 170 10-14-83 50° 3.60 225+ 10-14-83 50° 3.85 225
Core No. Route Milepost Dir, County Core No. Route Milepost Dir. County
102 us 30 175.00 EB Marsha 11 103 us 30 175.80 EB Marsha 11
Date Pave. Struct. Soi 1 Support Date Pave. Struct. Soi J Support Tested Temp °F Rating K Value Tested Temp °F Rating K Value
6-16-83 65° 3.45 145 6-16-83 65° 3.90 155 10-14-83 50° 2.75 160 10-14-83 50° 3. 90 220
Core No. Route Milepost Dir. County Core No. Route Milepost Dir. County
104 us 30 177 .00 EB Marshall 105 us 30 177 .80 EB Marshal 1
Date Pave. Struct. Soil Support Date Pave. Struct. Soil Support Tested Temp °F Rating K Value Tested Temp °F Rating K Value
6-16-83 65° 3.60 155 6-16-83 65° 4.25 190 10-14-83 500 3. 70 195 10-14-83 50° 3.10 225·~

LTM PAVEMENT CORES PAGE 91
Core No·. Route Milepost Dir. County Core No. Route Milepost Dir. County
106 us 30 178.00 EB Marsha 11 107 us 30 177.10 NB Marsha 11
Date Pave. Struct. Soil Support Date Pave. Struct. Soil Support Tested Temp °F Rating K Value Tested Temp °F Rating K Value
6-16-83 65° 4.10 185 6-16-83 65° 3. 70 50 10-14-83 50° 3. 45 215 10-14-83 50° 2. 35 195
Core No. Route Milepost Dir. County Core No. Route Milepost Dir. County
108 us 30 176.00 W8 Marshall 109 us 30 174.80 WB Marsha 11
Date Pave. Struct. Soil Support Date Pave. Struct. So 1 l Support Tested Temp OF Rating K Value Tested Temp °F Rating K Value
6-16-83 65° 3.35 135 6-16-83 65° 2. 95 140 10-14-83 50° 3.30 205 10-14-83 50° 3. 10 165
Core No. Route Milepost Dir. County Core No. Route Milepost Dir. County
110 us 30 174.00 NB Marshall 111 us 30 173.60 NB Marsha 11
Date Pave. Struct. Soil Support Date Pave. Struct. Soil Support Tested Temp OF Rating K Value Tested Temp °F Rating K Value
6-16-83 65° 3. 70 165 6-16-83 65° 3.45 165 10-14-83 50° 2. 40 200 10-14-83 50° 3. 60 225+

LTM PAVEMENT CORES PAGE 92
Core No. Route Mi 1 epost Dir. County Core No. Route Milepost Dir. County
112 us 30 124.15 WB Boone 113 us 30 113. 75 \4B Boone
Date Pave. Struct. Soil Support Date Pave. Struct. Soil Support Tested Temp °F Rating K Value Tested Temp °F Rating K Value
6-15-83 70° 5.00 215 6-15-83 70° 2.85 80 10-14-83 50° 4. 10 185 10-14-83 50° 4.85 215
Core No. Route Milepost Dlr. County Core No. Route Milepost Dir. County
114 us 30 123.25 WB Boone 115 us 30 123.00 EB Boone
Date Pave. Struct. Soil Support Date Pave. Struct. Soil Support Tested Temp OF Rating K Value Tested Temp OF Rating K Value
6-15-83 70° 5.00 200 6-15-83 70° 5.00 215 10-14-83 50° 6.00 225+ 10-14-83 50° 6.20 225+
Core No. Route Milepost Dir. County Core No. Route Milepost Dir. County
116 us 30 123.50 EB Boone 117 us 30 123.80 EB Boone
Date Pave. Struct. Soil Support Date Pave. Struct, Soil Support Tested Temp OF Rating K Value Tested Temp OF Rating K Value
6-15-83 70° 6.30 225 6-15-83 70° 4.85 180 10-14-83 50° 6.50 225+ 10-14-83 50° 3.35 225+

l TM PAVEMENT CORES PAGE 93
Core No. Route Mi 1 epost Dir. County Core No. Route Milepost Dir. County
118 us 20 136.50 W8 Hamil ton 119 us 20 135. 50 fJB Hamil ton
Date Pave. Struct. Soi 1 Support Date Pave. Struct. Soil Support Tested Temp °F Rating K Value Tested T ernp °F Rating K Value
7-7-83 95° 3.60 225+ 7-7-83 95° 3.80 215 10-14-83 60° 5. 55 225+ 10-14-83 60° 4. 95 215
·~
'
Core No. Route Milepost Dir. County Core No. Route Milepost Dir. County
120 us 20 134. 50 W8 Hami 1 ton 121 us 20 135.00 EB Hamil ton
Date Pave. Struct. Soil Support Date Pave. Struct. Soil Support Tested Temp °F Rating K Value Tested Temp °F Rating K Value
7-7-83 95° 3.50 225+ 7-7-83 95° 3.90 220 10-14-83 60° 5.45 225+ 10-14-83 60° 4.85 215
Core No. Route Milepost Dir. County Core No. Route Milepost Dir. County
122 us 20 136.00 EB Hamil ton 123 us 20 137 .00 EB Hamilton
Date Pave. Struct. Soil Support Date Pave. Struct. Soil Support Tested Temp OF Rating K Value Tested Temp °F Rating K Value
7-7-83 95° 3.60 225+ 7-7-83 95° 4. 25 210 10-14-83 60° 6.00 225+ 10-14-83 60° 5.80 225+
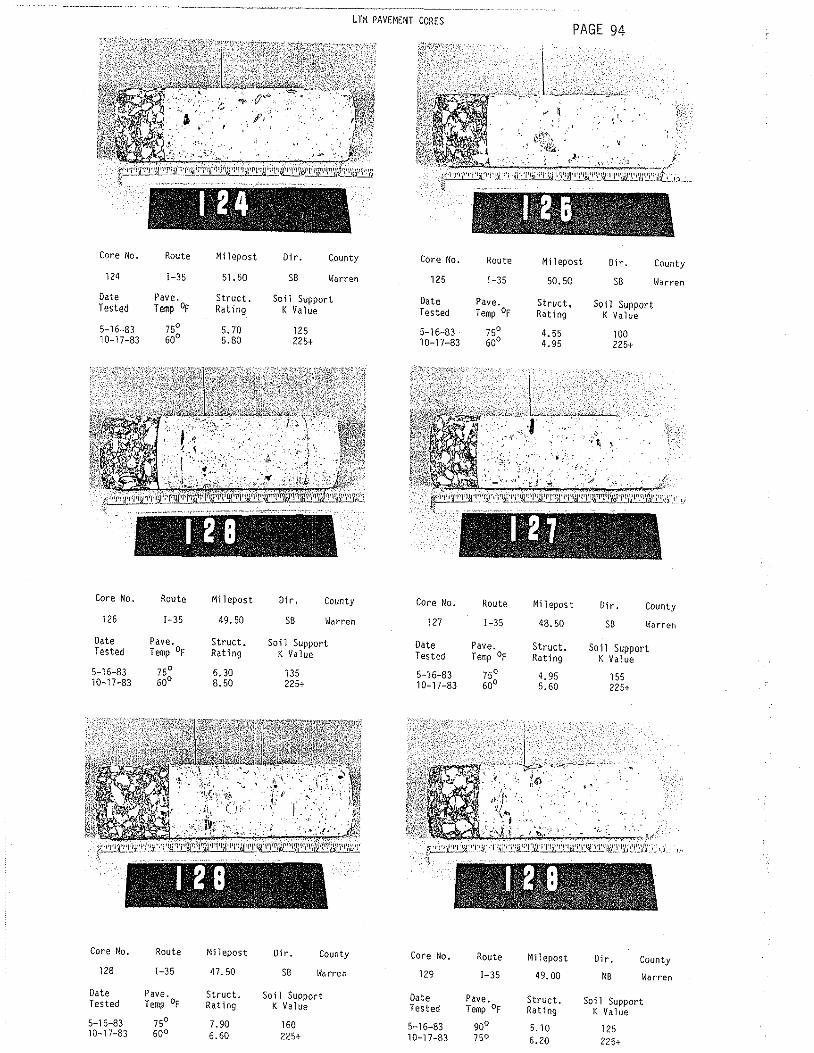
LTM PAVEMENT CORES PAGE 94
) .. ' ·I"·.
Core No. Route Mi 1 epost Dir. County Core No. Route Milepost Dir. County 124 I-35 51. 50 SB Warren 125 l-35 50. 50 SB Harren
Date Pave. Struct. Soil Support Date Pave. Struct. Soil Support Tested Temp "F Rating K Value Tested Temp OF Rating K Value
5-16-83 75° 5. 70 125 5-16-83 75° 4.55 100 10-17-83 60° 5.80 225+ 10-17-83 60° 4. 95 225+
/-.. , , .•. ,, . ·~ J · •. f
·:· wri·~·1,;~!l'.:,2!:_P!"_1_jf•'l'l_k!.'.L~~~1~~li:\~-~1.J.:.'i!)''_\' '.' .'l ···-·· - .
. ,. 2.8 ' . .
Core No. Route Milepost Dir, County Core No. Route Milepost Dir. County 126 l-35 49. 50 SB Warren 127 I-35 48.50 SB Warren
Date Pave. Struct. Soil Support Date Pave. Struct. Soi 1 Support Tested T ernp OF Rating K Value Tested Temp OF Rating K Value 5-16-83 75° 6. 30 135 5-16-83 75° 4. 95 155 10-17-83 60° 8. 50 225+ 10-17-83 60° 5.60 225+
Core No. Route Milepost Dir. County Core No. Route Milepost Dir. County 128 I-35 47. 50 SB Warren 129 l-35 49. 00 NB Warren
Date Pave. Struct. Soil Support Date Pave. Struct. Soil Support Tested Temp OF Rating K Value Tested Temp °F Rating K Va 1 ue 5-16-83 75° 7.90 160 5-16-83 90° 5. 10 125 10-17-83 60° 6.60 225+ 10-17-83 750 6. 20 225+
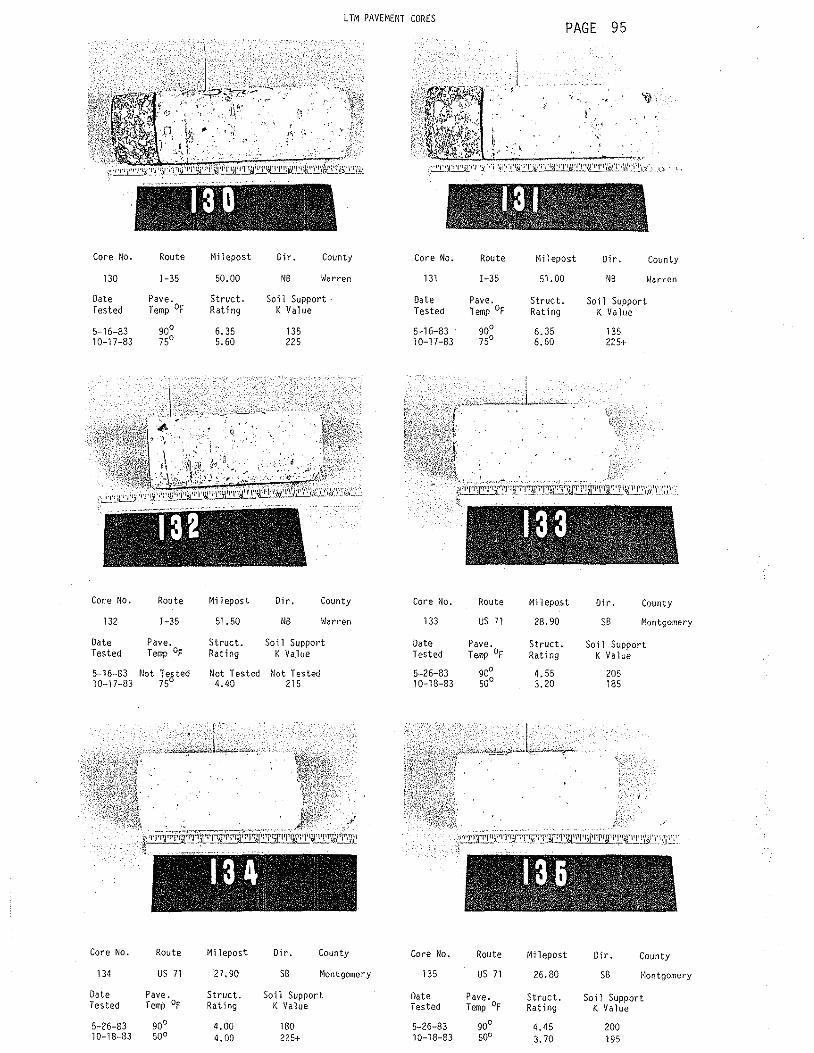
LTM PAVEMENT CORES PAGE 95
,,
' . - 18 0 .• . : { '·,' . tc d \ !' ' '\ ' } ~' ' \ t
I",· ,1 I\ ' '< ,, ' (
Core No. Route Milepost Dir. County Core No. Route Milepost Dir. County
130 1-35 50.00 NB Warren 131 1-35 51.00 NB \.larren
Date Pave. Struct. Soil Support Date Pave. Struct. Soil Support Tested Temp °F Rating K Value Tested Temp OF Rating K Value
5-16-83 90° 6.35 135 5-16-83 90° 6.35 135 10-17-83 750 5. 60 225 10-17-83 75° 6. 60 225+
', '·
.:'tdl;';,J: 1> i!~:p-~;fi~1·'12J:'1~·r_!Pij7!:~~M'.1111rzr1'rra•1·r191·1 1 1'"'.i':O'-'\'_.,\'_:_·,:··,t
Core No. Route Milepost Dir. County Core No. Route Milepost Dir. County
132 1-35 51.50 NB \.larren 133 us 71 18. 90 SB Montgomery
Date Pave. Struct. Soil Support Date Pave. Struct. Soil Support Tested Temp OF Rating K Value Tested Temp °F Rating K Va Jue
5-16-83 Not Tested Not Tested Not Tested 5-26-83 90° 4.55 205 10-17-83 75° 4.40 215 10-18-83 50° 3. 20 185
.i
· ~~.-. ·1··i;r,i~~r;~~~Ti5iff~u:;;1;1~~·1;1;iw;·1·1i;,:.:l::iw/~·;W0 ,- .. '
13 A , ' j'
' :" ~ ~ i : . '
Core No. Route Milepost Dir. County Core No. Route Milepost Llir. County
134 us 71 27. 90 SB Montgomery 135 us 71 26.80 SB Montgomery
Date Pave. Struct. Soil Support Date Pave. Struct. Soil Support Tested Temp °F Rating K Value Tested Temp OF Rating K Value
5-26-83 90° 4.00 180 5-26-83 90° 4.45 200 10-18-83 50° 4.00 225+ 10-18-83 so0 3. 70 195
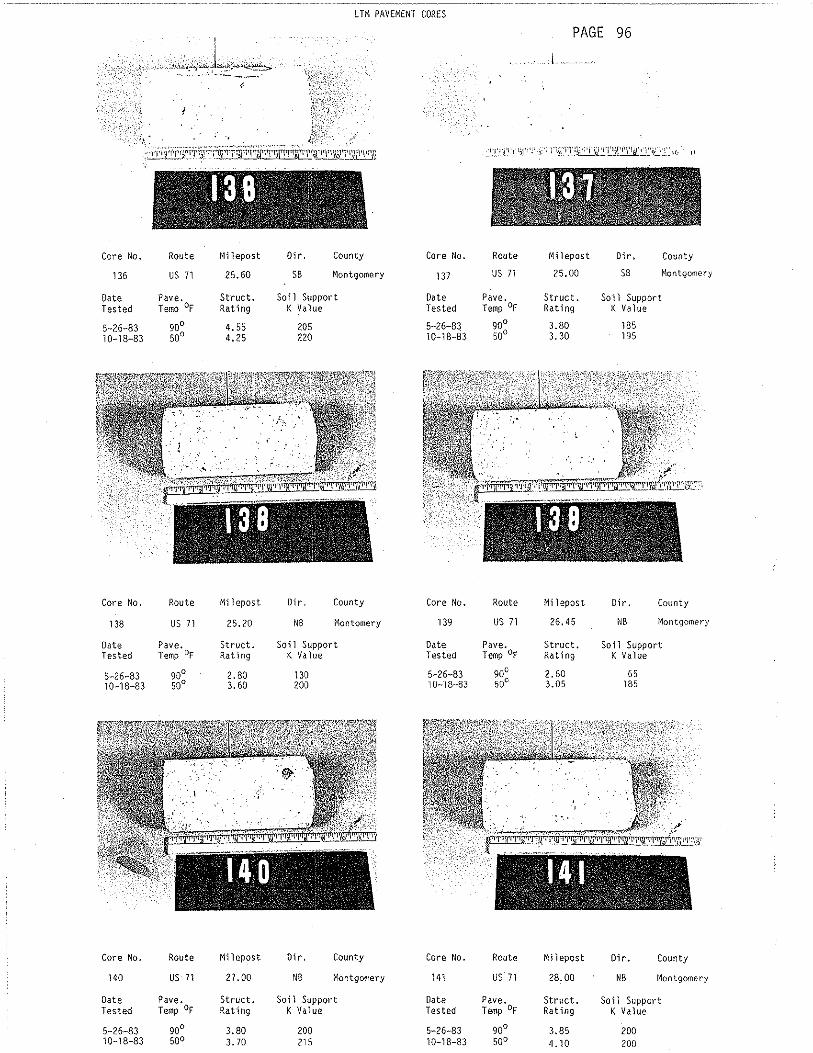
LTM PAVEMENT CORES
PAGE 96
I.
'\.
:·1'f'i'\!'Pr1z:•.1~~~7f§~~·~;~·r~~91~\~~\~i:~~~t
Core No. Route Milepost Dir. County Core No. Route Milepost Dir, County
136 us 71 25.60 SB Montgomery 137 us 71 25.00 SB Montgomery
Date Pave. Struct. Soil Support Date Pave. Struct. Soil Support Tested Temp OF Rating K Value Tested Temp °F Rating K Value
5-26-83 90° 4.55 205 5-26-83 90° 3.80 185 10-18-83 50° 4.25 220 10-18-83 50° 3.30 195
Core No. Route Milepost Dir. County Core No. Route Milepost Dir. County
138 us 71 25.20 NB Montomery 139 us 71 26. 45 NB Montgomery
Date Pave. Struct. Soi 1 Support Date Pave. Struct. Soil Support Tested Temp °F Rating K Value Tested Temp OF Rating K Value
5-26-83 90° 2.80 130 5-26-83 90° 2.60 65 10-lB-83 50° 3.60 200 I o--18-83 so' 3.05 185
Core No. Route Milepost Dir. County Core No. Route Milepost Dir. County
140 us 71 27.00 NB Montgomery 141 us 71 28.00 NB Montgomery
Date Pave. Struct. Soil Support Date Pave. Struct. So i1 Support Tested Temp OF Rating K Value Tested Temp °F Rating K Value
5-26-83 90° 3.80 100 5-26-83 90° 3.85 200 10-18-83 50° 3. 70 215 10-18-83 50° 11. 10 200

LTM PAVEMENT CORES PAGE 97
Core No. Route Milepost Dir. County Core No. Route Milepost Dir. County
142 us 71 29.00 NB Montgomery 143 us 71 30.00 NB Montgomery
Date Pave. Struct. Soil Support Date Pave. Struct. Soil Support Tested Temp °F Rating K Value Tested Temp OF Rating K Value
5-26-83 90° 4.00 180 5-26-83. 100° 4.40 95 10-18-83 50° 4.00 210 10-18-83 65° 5.10 90
Core No. Route Milepost Dir, County Core No. Route Milepost Dir. County
144 us 71 31.00 NB Montgomery 145 us 71 32.00 NB Montgomery
Date Pave. Struct. Soil Support Date Pave. Struct. Soil Support Tested Temp °F Rating K Value Tested Temp °F Rating K Value
5-26-83 100° 5.05 110 5-26-83 100° 4.75 130 10-18-83 65° 5.50 215 10-18-83 65° 4.95 185
. /.;-·,·'.·,_::.: .. -'.-,,,, t·:, .. 1;·P~±b~>fi~!irJi'.!T!~':1<1~+111~~~~1Jtri•11'1 1,~\~J.::'1\,. .,: " . - .. ···-' .. -- ,._,"
"
Core No. Route Milepost Dir. County Core No. Route Milepost Dir. County
146 us 71 33. 10 NB Montgomery 147 us 71 34.00 NB Montgomery
Date Pave. Struct. Soil Support Date Pave. Struct. Soil Support Tested Temp °F Rating K Value Tested Temp OF Rating K Value
5-16-83 100° 5.05 110 5-26-83 100° 4. 75 150 10-18-83 65° 7.50 230 10-18-83 65° 5.50 205

LTM PAVEMENT CORES PAGE 98
Core No. Route Milepost Dir. County Core No. Route Milepost Dir. County
148 us 71 35.00 NS Montgomery 149 us 71 37 .oo NB Montgomery
Date Pave. Struct. Soil Support Date Pave. Struct. Soil Support Tested Temp °F Rating K Value Tested Temp °F Rating K Value
5-26-83 100° 5.05 110 5-26-83. 100° 4. 50 60 10-18-83 65° 5. 50 165 10-18-83 65° 4.60 215
Core No. Route Milepost Dir. County ·Core No. Route Milepost Dir. County
150 us 71 38.00 NB Montgomery 151 us 71 39.00 NB Montgomery
Date Pave. Struct. Soi 1 Support Date Pave. Struct. Soil Support Tested Temp OF Rating K Value Tested Temp °F Rating K Value
5-26-83 100° 3.90 125 5-26-83 100° 4.75 170 10-18-B3 65° 5. 35 95 10-19-83 50° 4. 70 210
Core No. Route Milepost Dir. County Core No. Route Milepost Dir. County
152 us 71 40.00 NB Montgomery 153 us 71 40. 50 NB Montgomery
Date Pave. Struct. Soil Support Date Pave. Struct. Soi 1 Support Tested Temp °F Rating K Value Tested Temp OF Rating K Value
5-26-83 100° 3.45 85 5-26-83 100° 4. 75 110 10-19-83 50° 4.55 220 10-19-83 50° 3.80 195

CORES PAGE 99
Core No. Route Milepost Dir. County Core No. Route Milepost Dir. County
154 us 71 41.10 NB Montgomery 155 us 71 41. 50 NB Montgomery
Date Pave. Struct. Soil Support Date Pave. Struct. Soi 1 Support Tested Temp °F Rating K Value Tested Temp °F Rating K Value
5-26-B3 100° 5. 10 140 5-26-83 100° 5.90 125 10-19-83 50° 6.90 235 10-19-83 so0 5.30 230
Core No. Route Milepost Dir. County Core No. Route Milepost Dir. County
156 us 71 40.30 SB Montgomery 157 us 71 39.80 SB Montgomery
Date Pave. Struct. Soil Support Date Pave. Struct, Soil Support Tested Temp °F Rating K Value Tested Temp °F Rating K Value
5-26-83 90° 4. 95 95 5-26-83 90° 3.30 110 10-19-83 so0 4.70 210 10-19-83 50° !), 30 100
. 16 8, . . '
· . .:·, I Q.8 . • > \, -;~ y
! ' "" ' £ - ~ I ", ,,', ({'~, ~: r,;'•, ;~~~,:"(:'.;';;.,
Core No. Route Milepost Dir. County Core No. Route Milepost Dir. County
1S8 us 71 39.20 SB Montgomery 159 us 71 38.80 58 Montgomery
Date Pave. Struct. Soil Support Date Pave. Struct. Soil Support Tested Temp OF Rating K Value Tested Temp °F Rating K Value
5-26-83 Not Tested Not Tested Not Tested 5-26-83 90° 3.55 105 10-19-83 50° 6.00 245 10-19-83 50° 4.40 230

LTM PAVEM£NT CORES PAGE 100
Core No. Route Mi 1 epost Dir. County Core No. Route Milepost Dir. County
160 us 71 37. 50 SB Montgomery 161 us 71 36.80 SB Montgomery
Date Pave. Struct. Soi 1 Support Date Pave. Struct. Soil Support Tested Temp OF Rating K Value Tested Temp °F Rating K Value
5-26-83 90° 5. 20 155 5-26-83 90° 4.30 80 10-19-83 50° 3. 60 200 10--19-83 so0 4.80 215
Core No. Route Mi 1epost Dir. County Core No. Route Milepost Dir. County
162 us 71 35.80 S8 Montgomery 163 us 71 34.80 SB Montgomery
Date Pave. Struct. Soil Support Date Pave. Struct. Soil Support Tested T ernp OF Rating K Value Tested Temp °F Rating K Va Jue
5-26-83 90° 3. 30 95 5-26-33 90° 4.60 155 10-19-83 50° 3.BO 205 10-19-B3 50° 4.BO 215
l_)
Core No. Route Milepost Dir. County Core No. Route Milepost Oir. Coun~y
164 us 71 33.80 SB Montgomery 165 us 71 32.80 SB Montgomery
Date Pave. Struct. Soil Support Date Pave. Struct. Soil Support Tested Temp °F Rating K Value Tested Temp OF Rating K Value
5-26-83 90° 5.40 150 5-26-83 90° 6. 90 200 10-19-83 50° 5.60 250 10-19-83 so0 6.40 230

LTM PAVEMENT CORES PAGE 101
Core No. Route Milepost Dir. County Core No. Route Milepost Dir. County
166 us 71 31.80 SB Montgomery 167 us 71 30.80 SB Montgomery
Date Pave. Struct. Soi 1 Support Date Pave. Struct. Soil Support Tested Temp °F Rating K Value Tested Temp °F Rating K Value
5-26-83 90° 6.25 160 5-26-83 90° 4.05 125 10-19-83 50° 6.00 235 10-19-83 50° 4. 25 165
I
Core No. Route Mi 1 epost Dir. County Core No. Route Milepost Dir. County
168 us 71 29.80 SB Montgomery 169 1-80 35.40 EB Pottawattamie
Date Pave. Struct. Soil Support Date Pave. Struct. Soil Support Tested Temp °F Rating K Value Tested T emP °F Rating K Value
5-26-83 90° 4.60 135 3-2-83 60° 4.40 185 10-19-83 50° 5.20 130 10-10-83 45° 3.85 215
. . JlQ ... . . . " :i ;,k' ." -:~: '~ '' -'~ -~'\ \ t:/~~ i ~~
Core No. Route Milepost Dir. County Core No. Route Milepost Dir. County
170 1-80 36.00 EB Pottawatt().mie 171 1-80 36.60 EB Pottawattamie
Date Pave. Struct. Soil Support Date Pave. Struct. Soil Support Tested Temp OF Rating K Value Tested Temp °F Rating K Value
3-2-83 60° 5. 50 215 3-1-83 6~0 3.80 185 10-20-83 450 4.55 225+ 10-20-83 4 0 3.05 200

LTM PAVEMENT CORES PAGE 102
Core No. Route Milepost Dir. County Core No. Route Milepost Dir. County
171 l-80 37.20 EB Pottawattamie 173 I-80 37. 50 EB Pottawattamie
Date Pave. Struct. Soi 1 Support Date Pave. Struct. Soil Support Tested Temp °F Rating K Value Tested Temp °F Rating K Value
3-2-83 60° 3.80 185 3-2-83 60° 4.40 130 10-20-83 45° 3.50 200 10-20-83 45° 3. 10 220
Core No. Route Milepost Dir. County Core No. Route Milepost Dir. County
174 l-80 37.80 EB Pottawattamie 175 l-80 38.00 EB Potta111attamie
Date Pave. Struct. Soil Support Date Pave. Struct. Soil Support Tested Temp °F Rating K Value Tested Temp °F Rating K Value
3-2-83 60° 4.00 180 3-2-83 60° 4. 70 195 10-20-83 45° 3.60 190 10-20-83 45° 4.55 205
Core No. Route Milepost Dir. County Core No. Route Milepost Dir. County
176 l-80 38.20 EB Pottawattamie 177 1-80 38.60 EB Pottawattamie
Date Pave. Struct. Soil Support Date Pave. Struct. Soil Support Tested Temp OF Rating K Value Tested Temp OF Rating K Value
3-2-83 60° 3.85 150 3-2-83 10° 5. 10 160 10-20-83 45° 3. 70 2"5 10-20-83 45° 5.30 225

LTM PAVEMENT CORES PAGE 103
· il B . : -' , ( ' l
. 1 ,, 0 ' ~ j
' ~ " '
Core No. Route Milepost Dir. County Core No. Route Milepost Dir. County
178 I-80 39.00 EB Pottawattamie 179 I-29 67.20 NB Pottawattamie
Date Pave. Struct. Soil Support Date Pave. Struct. Soil Support Tested Temp °F Rating K Value Tested Temp °F Rating K Value
3-2-83 60° 5.00 180 6-2-83 75° 6.05 220 10-20-83 45° 5. 10 205 10-20-83 55° 7.65 225+
------ -· 1 e o· .
Core No. Route Milepost Dir. County Core No. Route Milepost Dir. County
180 I-29 68.40 NB Pottawattamie 181 I-29 69.60 NB Pottowattamie
Date Pave. Struct. Soil Support Date Pave. Struct. Soil Support Tested Temp °F Rating K Value Tested Temp OF Rating K Value
6-2-83 75° 5. 70 200 6-2-83 75° 5.50 220 10-20-83 55° 6.35 225+ 10-20-83 55° 6. 10 225+
Core No. Route Milepost Dir. County Core No. Route Milepost Dir. County
182 l-29 72. 10 SB Pottawattamie 183 I-29 71. 30 SB Pottawattan:ie
Date Pave. Struct. Soil Support Date Pave. Struct. Soil Support Tested Temp °F Rating K Value Tested Temp °F Rating K Value
6-2-83 75° 4.00 180 6-2-83 75° 4.30 195 10-21-83 50° 5.80 215+ 10-21-83 50° ,.20 225+

LTM PAVEMENT CORES
Core No. Route Milepost Dir, County Core No.
184 I-29 70. 20 SB Pottawattamie 185
Date Pave. Struct. Soil Support Date Tested Temp °F Rating K Value Tested
6-2-83 750 5. 75 215 6-2-83 10-21-83 50° 4.40 Z25 10-21-83
Core No. Route Mi 1 epost Dir. County Core No.
186 I-29 67.80 58 Pottawattamie 187
Date Pave. Struct, Soil Support Date Tested Temp °F Rating K Value Tested
6-2-83 75° 5.50 200 6-2-83 10-21-83 50° 4. 70 225+ 10-21-83
Core No. Route Milepost Dir. County Core No.
188 I-29 70. 40 NB Pottawattamie 189
Date Pave. Struct, Soii Support Date Tested Temp °F Rating K Value Tested
6-2-83 75° 5.00 180 6-2-83 10-21-83 50° 4.85 225 10-21-83
PAGE 104
Route Milepost Dir. County
I-29 69.00 SB Pottawl:lttamie
Pave. Struct. Soil Support Temp OF Rating K Va 1 ue
75° 6.75 210 50° 6.65 225+
if' ·,-',·1.~;:•'_i.'.1Si'.'.J.':1~!"~!:'.I.:JJ1Pf'teJ'l'\~~1iQ __ f1._J'.£~·:b .
Route Milepost Dir. County
l-29 67 .00 SB Pottav1attamie
Pave. Struct. Soil Support Temp Of Rating K Value
75° 6.35 205 50° 4.85 225+
Route Milepost Dir. County
I-29 71.20 NB Pottawattamie
Pave. Struct. Soil Support Temp °F Rating K Value
75° 4. 70 175 50° 5. 45 225+

l TM PAVEM£NT CORES PAGE 105
Core No. Route Milepost Dir. County Core No. Route Milepqst Dir. County
190 1-29 71. 70 NB Pottawattamie 191 l-29 127 .00 NB Woodbury
Date Pave. Struct. Soi 1 Support Date Pave. Struct. Soil Support Tested Temp OF Rating K Value Tested Temp °F Rating K Va 1 ue
6-2-83 75° 5.00 200 6-29-83 750 4. 10 145 10-21-83 50° 4.40 215 10-24-83 50° 4.85 225+
·· .. '.':' . ,J .'I
, .. •'.,(; .. :.-·
.-<>, ;/
Core No. Route Milepost Dir. County Core No. Route Milepost Dir. County
192 l-29 128.00 NB Woodbury 193 l-29 129.00 NB Woodbury
Date Pave. Struct. Soil Support Date Pave. Struct. Soil Support Tested Temp °F Rating K Value Tested Temp °F Rating K Value
6-29-83 75° 4. 30 150 6-29-83 75° 5.10 225+ 10-24-83 50° 4. 70 225+ I 0-24-83 50° 5. 40 225+
" ' • ·f:'·'}
]· ~· ' ,. . "'·~·.-"
' '
184 .
Core No. Route Milepost Dir. County Core No. Route Milepost Dir. County 194 l-29 !30.00 NB Woodbury 195 l-29 !31.00 NB Woodbury
Date Pave. Struct. Soi l Support Date Pave. Struct. Soil Support Tested Temp °F Rating K Value Tested Temp OF Rating K Value 6-29-83 75° 4.00 140 6-29-83 75° 4. 95 155 10-24-83 50° 4. 25 225+ 10-24-83 50° 5. IO 205

LTM CORES PAGE 106
Core No. Route Milepost Dir. County Core No. Route Milepost Dir. Cou1ty
196 !-29 131.00 NB Woodbury 197 I-19 132.BO NB \1oodbury
Date Pave. Struct. Soil Support Date Pave. Struct. Soil Support Tested Temp °F Rating K Value Tested Temp °F Rating K Value
6-29-83 75° 4.55 185 6-29-83 75° 4.90 180 10-25-83 40° 3.B5 225 10-25-83 40° 3. 70 215
.· . '18 8, . l
~ ;, • :; ·~ /. ~ 1 > ' ' ' I ' '
Core No. Route Mi 1epost Dir. County Core No. Route Milepost Dir. County
198 I-29 133. 30 SB ~loodbury 199 I-19 132. 90 SB Hood bury
Date Pave. Struct. Soil Support Date Pave. Struct. So i1 Support Tested Temp °F Rating K Value Tested Temp °F Rating K Value
6-29-83 750 4. 95 180 6-29-83 75° 4.90 180 10-25-83 40° 4.40 215 10-25-83 40° 4.40 215
200.
Core No. Route Milepost Dir. County Core No. Route Milepost lJir. County
200 I-29 132. 25 SB Woodbury 201 I-29 131.25 SB \.loodbury
Date Pave. Struct. Soil Support Date Pave. Struct. Soil Support Tested Temp °F Rating K Value Tested Temp °F Rating K Value
6-29-83 75° 5. 50 205 6-29-83 75° 5. 10 205 10-25-83 40° 3. 90 220 10-25-83 40° 4.85 22$

l TM PAVEM£NT CORES
PAGE 107
Core No. Route Milepost Dir. County Core No. Route Milepost Dir, County
101 I-29 130.25 SB Woodbury 103 I-29 119.25 SB Hood bury
Date Pave. Struct. Soil Support Date Pave. Struct. Soil Support Tested Temp °F Rating K Value Tested Temp OF Rating K Value
6-29-83 75° 4. 70 180 6-19-83 75° 4.20 175 10-25-83 40° 4. 70 215+ 10-15-83 40° 4.55 225+
Core No. Route Mi 1 epos t Dir. County Core No. Route Milepost Dir. County
204 1-19 118.15 SB Woodbury 205 IA 3 70.00 EB Buena Vis ta
Date Pave. Struct. Soil Support Date Pave. Struct. Soil Support Tested Temp °F Rating K Value Tested Temp °F Rating K Value
6-29-83 75° 4. 70 190 7-11-83 100° 3.40 195 10-25-83 40° 5. 40 215 10-15-83 60° 3.45 125
Core No. Route Milepost Dir. County Core No. Route Milepost Dir. County 206 IA 3 72.00 E8 Buena Vista 207 IA 3 73.00 EB Buena Vista
Date Pave. Struct. Soil Support Date Pave. Struct. Soi 1 Supper t Tested T ernp °F Rating K Value Tested Temp OF Rating K Value
7-21-83 100° 3. 10 170 7-21-83 100° 3. 50 170 10-25-83 60° 3. 50 220 10-25-83 60° 3.45 225

l TM PAVEMENT CORES PAGE 108
Core No. Route Milepost Dir. County Core No. Route Milepost Dir. County
208 IA 3 74.00 EB Buena Vista 209 IA 3 75.00 EB Buer111 VistG
Date Pave. Struct. Soil Support Date Pave. Struct. Soi'l Support Tested Temp °F Rating K Value Tested Temp °F Rating K Value
7-21-83 100° 2.30 80 7-21-83 100° 2.60 190 10-25-83 60° 3. 75 210 10-25-83 60° 3, 1'.10 210
Core No. Route Milepost Dir. County Core No. Route Mi 1epost Dir. County
210 IA 3 77.00 EB Buena Vista 211 IA 3 78. 50 EB Buena Vista
Date Pave. Struct. Soil Support Date Pave. Struct. Soi 1 Support Tested Temp °F Rating K Value Tested Temp OF Rating K Value
7-21-83 100° 2. 90 180 7-21-83 100° 3. 60 200 10-25-83 60° 2.80 185 10-25-83 60° 3.45 215
Core No. Route Milepost Dir. County Core No. Route Milepost Oir. County
212 IA 3 79. 00 EB Buena Vista 213 IA 3 79. 50 EB Bueria Vis ta
Date Pave. Struct. Soi 1 Support Date Pave. Struct. Soil Support Tested Temp °F Rating K Value Tested Temp °F Rating K Va 1ue
7-21-83 100° 3.60 200 7-21-83 100° 3.40 190 10-25-93 60° 3.25 225 10-25-83 60° 3.45 205

PAGE 109
Core No. Route Milepost Dir. County Core No. Route Milepost Dir. County
214 IA 3 80.00 EB Buena Vista 215 IA 3 80. 50 EB Buen" Vis ta
Date Pave. Struct. Soil Support Date Pave. Struct. Soil Support Tested T ernp °F Rating K Value Tested Temp °F Rating K Value
7-21-83 100° 3.60 215 7-21-83 100° 2. 90 125 10-25-83 60° 3. 75 225+ 10-25-83 60° 2.80 200
Core No. Route Mi 1 epost Dir. County Core No. Route Milepost Dir. County
216 IA 3 81.00 EB Buena Vista 217 IA 3 81.30 WB Bueno Vista
Date Pave. Struct. Soil Support Date Pave. Struct. Soil Support Tested Temp OF Rating K Value Tested Tef!ll OF Rating K Va 1 ue
7-21-83 100° 3. 60 200 7-21-83 100° 4.25 210 10-15-83 60° 3.60 225 10-25-83 60° 4, 30 215
Core No. Route Milepost Dir. County Core No. Route Milepost Dir. County
218 IA 3 80.80 W8 Buena Vista 219 IA 3 80.30 flB Buena Vis La
Date Pave. Struct. Soi 1 Support Date Pave. Struct. Soil Support Tested Temp OF Rating K Value Tested Temp °F Rating K Value
7-21-83 100° 2.90 125 7-21-83 100° 3. 50 185 10-25-83 60° 2.90 220 10-25-83 60° 3.60 225

l TM PAVEM£NT CORES PAGE 110
Core No. Route Milepost Dir. County Core No. Route Milepost Dir. County
110 IA 3 79.80 WS Buena Vista 111 IA 3 79. 30 f!S Buena Vista
Date Pave. Struct. Soil Support Date Pave. Struct. Soil Support Tested Temp °F Rating K Value Tested Temp °F Rating K Va 1 ue
7-11-83 100° 3. 70 110 7-11-83 100° 3.10 185 10-16-83 30° 3.60 115 10-16-83 30° 3.10 110
Core No. Route Milepost Dir. County Core No. Route Milepost Dir. County
121 IA 3 78. 30 ws Buena Vista 213 IA 3 77.50 om Buena Vista
Date Pave. Struct. Soil Support Date Pave. Struct. Soil Support Tested Temp °F Rating K Value Tested Temp Of Rating K Value
7-21-83 100° 3.85 210 7-21-83 100° 3.60 190 10-26-33 30° 2. 95 210 10-26-83 30° 3.10 160
Core No, Route Milepost Dir. County Core No. Route Milepost Dir. County
224 IA· 3 76. 50 ws Buena Vista 225 IA 3 75.50 olS Buena Vista
Date Pave. Struct. Soil Support Date Pave. Struct. Soil Support Tested Temp °F Rating K Value Tested Temp °F Rating K Value
7-21-83 100° 3. 70 220 7-21-83 100° 3. 30 200 10-26-83 30° 3. 70 225 10-26-83 30° 3. 70 215

PAGE 111
Core No. Route Milepost Dir. County Core No. Route Milepost Dir, County
226 IA 3 74. 50 WB Buena Vista 227 IA 3 72.50 \·IB Buena Vis ta
Date Pave. Struct. Soil Support Date Pave. Struct. Soi 1 Support Tested Temp °F Rating K Value Tested Temp °F Rating K Value
7-21-83 100° 3.40 190 7-21-83 100° 2. 90 205 10-26-83 30° 3.25 205 10-26-83 30° 2.70 190
Core No. Route Milepost Dir. County Core No. Route Milepost Dir. County
228 IA 3 71.00 WB Buena Vista 229 IA 4 127 .00 NS Emmet
Date Pave. Struct. Soil Support Date Pave. Struct. Soil Support Tested Temp °F Rating K Value Tested Temp °F Rating K Value
7-21-83 Not Tested Not Tested Not Tested 7-20-83 12g0 3.45 145 10-26-83 30° 4.00 225 10-26-83 70 4. 10 200
Core No. Route Mi 1 epost Dir. County Core No. Route Milepost Dir. County
230 IA 4 128.00 NB Emmet 231 IA 4 129.00 NB Emmet
Date Pave. Struct. Soii Support Date Pave. Struct. Soi 1 Support Tested Temp of Rating K Value Tested Temp OF Rating K Value
7-20-83 125° 4.00 180 7-20-B3 125° 2. 15 165 10-26-83 10° 4. 30 155 10-26-83 700 2. 95 165

LTM PAVEMtNT CORES PAGE 112
Core No. Route Milepost Dir. County Core No. Route Milepost Dir. County
232 IA 4 129.25 SB Emmet 233 IA 4 128. 50 SB Emmet
Date Pave. Struct. Soi 1 Support Date Pave. Struct. Soil Support Tested Temp OF Rating K Value Tested Temp OF Rating K Value
7-20-83 125° 3.60 225+ 7-20-83 125° 2.40 115 10-26-83 10° 3.85 225 10-26-83 70° 3.30 180
Core No. Route Milepost Dir. County Core No. Route Milepost Dir. County
234 IA 4 127. 50 SB Emmet 235 I-35 205.00 NB Ylorth
Date Pave. Struct. Soil Support Date Pave. Struct. Soil Support Tested T e'mp °F Rating K Value Tested Temp °F Rating K Value
7-20-83 125° 2.60 130 7-21-83 120° 3.80 200 10-?6-83 10° 3.45 180 10-28-83 45° 4.30 225+
Core No. Route Milepost Dir. County Core No. Route Milepost Dir. County
236 1-35 206.00 N3 Worth 237 1-35 207.00 NB Worth
Date Pave. Struct. Soi ·1 Support Date Pave. Struct. Soil Support Tested Temp OF Rating K Value Tested Temp °F Rating K Value
7-21-83 120° 4.25 220 7-21-83 120° 3.60 50 10-28-83 4,so 4.40 225+ 10-28-83 45° 4.55 225+

••--.. ·-····-~~-.-····~·~·-·~ .. -~····----- ----LTM PAVEMCNT CORES
PAGE 113
Core No. Route Milepost Dir. County Core No. Route Milepost Dir. County
238 l-35 208.00 NB Worth 239 I-35 209. 00 NB Worth
Date Pave. Struct. Soil Support Date Pave. Struct. Soil Support Tested Temp °F Rating K Value Tested Temp °F Rating K Value
7-11-83 120° 4. 70 110 7-21-83 120° 4.70 110 10-28-83 45° 3.60 175 10-18-83 45° 4.00 225
Core No. Route Milepost Dir. County Core No. Route Milepost Dir. County
240 l-35 210.00 NB Worth 241 1-35 111.00 NB Horth
Oat·e Pave. Struct. Soil Support Date Pave. Struct. Soil Support Tested Temp °F Rating K Value Tested Temp °F Rating K Value
7-11-B3 120° 5.30 225+ 7-21-83 120° 6.00 225+ 10-18-83 45° 4. 85 225+ 10-18-83 45° 4. 55 120
Core No. Route Milepost Dir. County Core No. Route Milepost Dir. County
141 1-35 211. 00 NB Worth 143 1-35 211.80 SB Worth
Date Pave. Struct. Soil Support Date Pave. Struct. Soil Support Tested Temp °F Rating K Value Tested Temp °F Rating K Value
7-21-83 120° 4.60 105 7-11-83 120° 4. 40 110 10-18-83 450 4.40 135 10-28-83 55° 5. 15 225+

LTM PAVEMENT CORES
PAGE 114
Core No. Route Milepost Dir. County Core No. Route Milepost Dir. County
244 I-35 210. 30 SB Worth 245 1-35 209. 30 SB Worth
Date Pave. Struct. s·oi 1 Support Date Pave. Struct. Soil Support Tested Temp °F Rating K Value Tested Temp °F Rating K Va 1 ue
7-21-83 120° 4.60 205 7-21-83 120° 5. 10 160 10-2B-83 55° 4.85 225+ 10-28-83 55° 4.85 225+
Core No. Route Milepost Dir. County Core No. Route Milepost Dir. County
246 1-35 208.80 SB Worth 247 1-35 207. 80 SB Worth
Date Pave. Struct. Soil Support Date Pave. Struct. Soil Support Tested Temp °F Rating K Value Tested Temp °F Rating K Value
7-21-83 120° 5. 10 160 7-21-83 120° 5. 75 225+ 10-28-83 55° 4. 10 225 10-28·83 55° 5. 30 225
Core No. Route Milepost Dir. County Core No. Route Milepost l.lir. County
248 1-35 206.80 SB ~lorth 249 1-35 205.80 SB Worth
Date Pave. Struct, Soii Support Date Pave. Struct. Soil Support Tested Temp °F Rating K Value Tested Temp °F Rating K Value
7-21-83 120° 4.60 220 7-21-83 120° 4. 15 200 10-28-83 550 4.85 215 10-28-83 55° 4. 70 225+

LTM PAVEM[NT CORES PAGE 115
Core No. Route Milepost Dir. Co.unty Core No. Route Milepost Dir. County
250 1-35 204.80 SB Worth 251 us 18 207.50 EB Floyd
Date Pave. Struct. Soil Support Date Pave. Struct. Soil Support Tested Temp °F Rating K Value Tested Temp °F Rating K Value
7-21-83 120° 3. 30 125 4-21-83. 65° 3.80 185 10-28-83 55° 4.95 225+ 10-31-83 50° 4.30 125
Core No. Route Milepost Dir. County Core No. Route Milepost Dir. County
252 us 18 208. 50 EB Floyd 253 US IB 209. 50 EB F 1 oyd
Date Pave. Struct. Soil Support Date Pave. Struct. Soil Support Tested Temp °F Rat 1 ng K Value Tested Temp °F Rating K Value
4-21-83 65° 5. 55 140 4-21-83 65° 5. 50 215 10-31-83 50° 4.85 225+ 10-31-83 50° 4. 95 225+
'.
' ' ' ' - ~'.'"!\'.'.::;;;~,;;\0··~- .. , ' ', ' .. , - ' . · ·:t~l5!. ' .. 11~1!I1g "I i1J l'I IH'll'l&2'.fl['.T19~1\;i::. •
Core No. Route Milepost Oir. County Core No. Route Milepost Dir. County
254 us 18 209.65 WB Floyd 255 us 18 209. 00 WB Floyd
Date Pave. Struct. Soil Support Date Pave. Struct. Soil Support Tested Temp °F Rating K Value Tested Temp OF Rating K Value
4-21-83 65° 5. 55 200 4-21-83 65° 4. 95 155 10-31-83 50° 5. 10 225+ 10-31-83 50° 4.55 225+

PAGE 116
. ~' :.X .. :·! \· :_·. ·~;''-''"'"":''-:'.'J:!;~:•<.,,.,,,;;:ifr":''•~-r~'""""·;:,~i-;1"''""~'7'.~.t-;i~;-;.;~ .::-· .. _ c£'..z'.'i
'.i~·l' I '11 I I ij I i"~~,~~·:~!2.~'.~:l''.'I'.:;• 'hl
2 68'.. ', , (_, ' > ' I 1
Core No. Route Milepost Dir. County Core No. Route Milepost Dir. County
256 us 18 208.00 WB Floyd 257 rn 21 95. 25 SB Black Hav1k
Date Pave. Struct. Soll Support Date Pave. Struct. So11 Support Tested Temp °F Rating K Value Tested Temp °F Rating K Value
4-21-83 65° 6.10 155 4-11-83 55° 4.60 100 10-31-B3 50° 6.20 225+ 11-1-83 so0 5.00 235
Core No. Route Milepost Dir. County Core No. Route Milepost Dir. County
25B IA 21 94.25 SB Black Hawk 259 IA 21 93. 25 SB Black Hawk
Date Pave. Struct. Soi 1 Support Date Pave. Struct. Soil Support Tested Temp °F Rating K Value Tested Temp OF Rating K Va Jue
4-11-B3 55° 2.95 60 4-11-B3 55° 2.55 14 5 11-1-83 so0 5.00 225 11-1-83 so0 3.95 235
._28:0 ' "' ' :-, ' t ' c; ', ' ~,'
Core No. Route Milepost Dir. County Core No. Route Milepost Dir. County
260 IA 21 92.25 SB Black Hawk 261 IA 21 91. 25 SB Black Hilv1k
Date Pave. Struct. Soil Support Date Pave. Struct. Soi 1 Support Tested Temp OF Rating K Value Tested Temp °F Rating K Value
4-11-83 65° 4. 70 120 4-11-83 65° 3.60 95 11-1-83 50° 5.60 250 11-1-83 50° 4. 70 225

LTM PAVEMCNT CORES PAGE 117
Core No. Route Milepost Dir. Count.y Core No. Route Mi lep·ost Dir. County
262 IA 21 90.25 SB Black Hawk 263 IA 21 89. 25 SB Black Hawk
Date Pave. Struct. Soi 1 Support Date Pave. Struct. Soil Support Tested Temp OF Rating K Value Tested Temp °F Rating K Value
4-11-B3 65° 3. 90 80 4-11-83 65° 4.55 75 11-1-83 50° 4. 70 225 11-1-83 50° 4. 45 225
Core No. Route Milepost Dir. County Core No. Route Milepost Dir. County
264 IA 21 BB.25 SB Black Ha1~k 265 IA 21 87. 25 SB Black Havik
Date Pave. Struct. Soil Support Date Pave. Struct. Soi 1 Support Tested Temp °F Rating K Value Tested Temp °F Rating K Value
4-11-83 65° 4.55 155 4-11-83 65° 3. 75 85 11-1-83 50° 5. 50 240 11-1-83 50° 4.20 215
Core No. Route Milepost Dir. County Core No. Route Milepost Dir. County
266 IA 21 88. 50 NB Black Hawk 267 IA 21 B9.00 NB Black Hawk
Date Pave. Struct. Soil Support Date Pave. Struct. Soil Support Tested Temp OF Rating K Value Tested Temp OF Rating K Value
4-11-83 55° 3.40 70 4-11-83 55° 4.30 75 11-1-83 60° 5. 70 185 11-1-B3 60° 5. 50 250

PAGE 118
Core No. Route Milepost Dir. County Core No. Route Milepost Dir. County
268 IA 21 90.00 NB Slack Hawk 269 IA 21 91.00 NB 3lack Hav1k
Date Pave. Struct. Soil Support Date Pave. Struct. Soil Support Tested Temp OF Rating K Va 1 ue Tested Temp OF Rating K Value
4-11-B3 55° 4.20 100 4-11-B3 55° 5.00 95 11-1-83 60° 6. 30 180 11-1-83 60° 5.80 245
Core No. Route Milepost Dir. County Core No. Route Milepost Dir. County
270 IA 21 92.00 NB Black Hawk 271 IA 21 93.00 NB Black Hawk
Date Pave. Struct. Soil Support Date Pave. Struct. Soil Support Tested Temp OF Rating K Value Tested Temp °F Rating K Value
4-11-83 55° 3. 35 75 4-11-83 55° 3. 70 80 11-1-83 60° 4.00 225 11-1-83 60° 4.50 230
Core No. Route Milepost Dir. County Core No. Route Milepost Dir. County
212 IA 21 94. 00 NB Black Hawk 273 IA 21 94. 50 NB Black lfowk
Date Pave. Struct. Soi"I Support Date Pave. Struct, Soi 1 Support Tested Temp °F Rating K Value Tested Temp °F Rating K Value
4-11-83 55° 2.85 90 4-11-83 55° 2.65 90 11-1-83 600 4. 70 200 11-1-83 60° 4.10 205

LTM PAVEMENT CORES PAGE .119
Core No. Route Milepost Dir. County Core No. Route Milepost Dir. County
274 IA 21 95.00 NB Black Hawk 275 IA 51 o. 50 NB Al 1amakee
Date Pave. Struct. Soil Support Date Pave. Struct. Soil Support Tested Temp °F Rating K Value Tested Temp OF Rating K Value
4-11-83 55° 5.00 95 4-26-83 50° 3.60 50 11-1-83 60° 5. 60 240 11-1-83 55° 4.55 225+
Core No. Route Milepost Dir. County Core No. Route Milepost Dir. County
176 IA 51 1. 70 NB Allamakee 177 IA 51 2. 70 NB Allamakee
Date Pave. Struct. Soil Support Date Pave. Struct. Soil Support Tested Temp OF Rating K Value Tested Temp °F Rating K Value
4-16-83 50° 4.40 90 4-26-83 50° 4.40 165 11-1-83 55° 3. 75 225+ 11-2-83 55° 4.85 225
Core No. Route Milepost Dir. County Core No. Route Milepost Dir. County 278 IA 51 3.05 SB Allamakee 279 IA 51 2.00 SB Allamakee
Date Pave. Struct. Soi 1 Support Date Pave. Struct. Soil Support Tested Temp °F Rating K Value Tested Temp °F Rating K Value
4-26-83 50° 4. 90 115 4-26-83 50° 3.60 155 11-2-83 55° 4.95 225+ 11-2-83 55° 4. 10 125

L TM PAVEMENT CORES PAGE 120
Core No. Route Milepost Dir. County Core No. Route Milepost Dir. County
280 IA 51 1.00 SB A 11 amakee 281 1-80 258.00 EB Cedar
Date Pave. Struct. Soil Support Date Pave. Struct. Soil Support Tested Temp °F Rating K Value Tested Temp °F Rating K Value
4-26-83 50° 4.20 125 5-9-83 85° 8.00+ 180 11-2-83 55° 4. 55 225+ 11-3-83 45° 8. 25 225+
Core No. Route Mi 1 epost Dir. County Core No. Route Milepost Dir. County
282 1-80 259.00 EB Cedar 283 1-80 260.00 EB Cedar
Date Pave. Struct. Soil Support Date Pave. Struct. Soi 1 Support Tested Temp OF Rating K Value Tested Temp °F Rating K Value
5-9-83 85° 8.00+ 140 5-9-83 85° 8.00+ 120 11-3-83 45° 6.50 225+ 11-3-83 45° 7 .80 225+
\ ~~~·~·~a.~~;;,,."''''-·,,:~·,;,il';;f~J:l(tf-<::·~·.·· ·..-1
Core No. Route Milepost Dir. County Core No. Route Milepost Dir. County
284 1-80 261.00' EB Cedar 285 1-80 262.00 EB Cedar
Date Pave. Struct. Soil Support Tested Temp OF Rating K Value
Date Pave. Struct, Soil Support Tested Temp °F Rating K Va Jue
5-9-83 B5° 8.00 165 11-3-83 45° 7. 10 225+
5-9-83 85° 8.00+ 180 11-3-83 45° 10.00+ 205
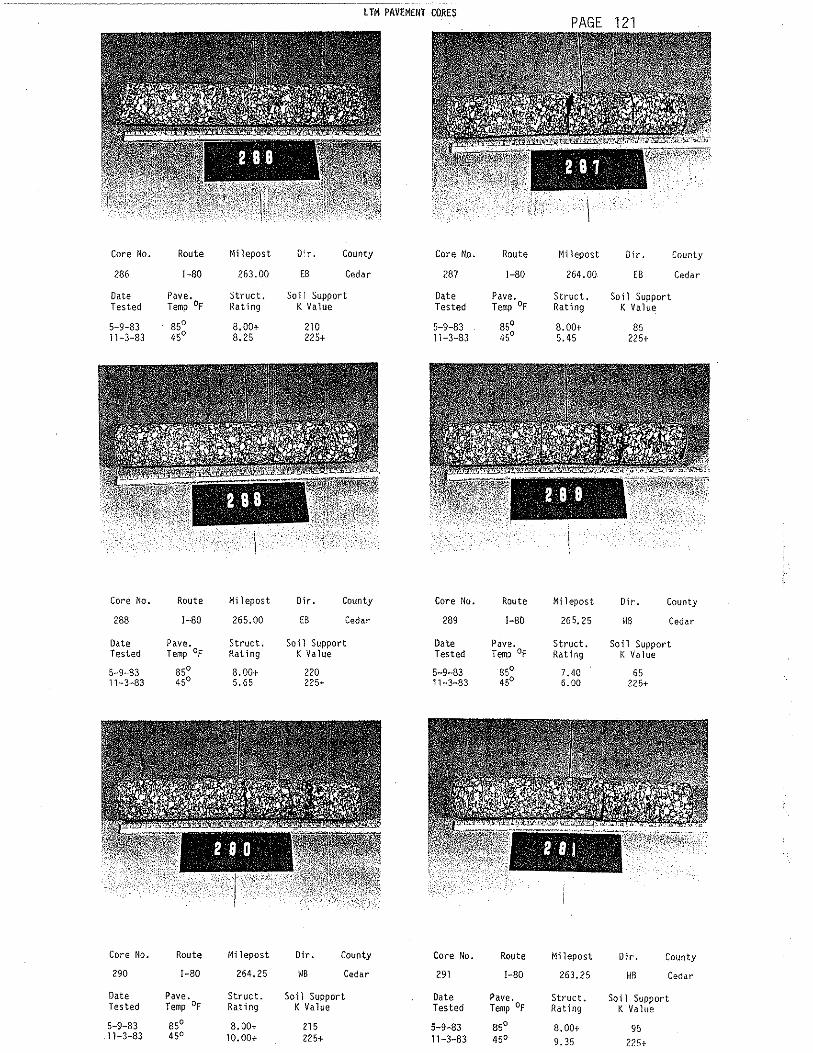
LTM PAVEMENT CORES PAGE 121
287
·, ~
\ \'_i
Core No. Route Milepost o~ r. County Core No. Route Milepost Dir. County
286 1-80 263.00 EB Cedar 287 1-80 264.00 E8 Cedar
Date Pave. Struct. Soil Support Date Pave. Struct. Soil Support Tested Temp OF Rating K Va1ue Tested Temp °F Rating K Value
5-9-83 85° 8.00+ 210 5-9-83 85° 8.00+ 85 11-3-83 45° 8.25 225+ 11-3-83 45° 5.45 225+
Core No. Route Mi 1epost Dir. County Core No. Route Milepost Dir. County
288 1-80 265.00 EB Cedar 289 1-80 26 5. 25 '18 Cedar
Date Pave. Struct. Soil Support Date Pave. Struct. Soil Support Tested Temp °F Rating K Value Tested Tern;> °F Rating K Value
5-9-83 85° 8.00+ 220 5-9-83 85° 7.40 65 11-3-83 45° 5.65 225+ 11-3-83 45° 6.00 225+
· 2 BI · . . ' ~ i ~ ,- '~ '
Core No. Route Milepost Dir. County Core No. Route Milepost Uir. County
290 1-80 264.25 WB Cedar 291 1-80 263.25 JIB Cedar
Date Pave. Struct. Soil Support Date Pave. Struct. Soil Support Tested Temp °F Rating K Value Tested Temp °F Rating K Value
5-9-83 85° 8.00+ 215 5-9-83 85° 8.00+ 95 11-3-83 45° 10.00+ 225+ 11-3-83 45° 9.35 225+

LTM PAVEMENT CORES PAGE 122
Core No. Route Milepost Dir. County Core No. Koute Milepost Dir. County
191 I-80 161.25 WB Cedar 193 I-BO 161.15 WB Cedar
Date Pave. Struct. Soil Support Date Pave. Struct. Soil Support Tested Temp °F Rating K Value Tested Temp °F Rating K Value
5-9-83 85° 8.00+ 90 5-9-83 85° 7.40 160 11-3-83 45° 7.45 225+ 11-3-83 45° 5.40 170
--'tl:Mrl~~1~\,~!~~i!~ ' • v, ;, ·:·· •• './'.·,··~'
Core No. Route Milepost Dir. County Core No. Route Milepost Dir. County
194 1-80 160.15 we Cedar 195 I-80 159.15 WB Cedar
Date Pave. Struct. Soi 1 Support Date Pave. Struct. Soil Support
Tested Temp °F Rating K Value Tested Temp °F Rating K Value
5-9-83 85° 8.00+ 130 5-9-83 85° 8.00+ 90 11-3-83 45° 8. 75 225+ 11-3-83 45° 5.40 225+
. 2 8 8 .
Core No. Route Milepost Dir. County Core No. Route Milepost Dir. County
296 I-80 258.25 W8 Cedar 297 us 218 65.50 SB Washington
Date Pave. Struct. Soil Support Date Pave. Struct. Soil Support Tested Temp °F Rating K Value Tested Temp OF Rating K Value
5-9-83 85° 7.60 90 5-5-83 65° 3.70 50 11-3-83 45° 5.40 225+ 11-4-83 35o 3.60 225

LTM PAVEMCNT CORES PAGE 123
Core No. Route Milepost Dir. County Core No. Route Milepost Dir. County
298 us 218 64. 50 SS Washington 299 us 218 63. 50 SB Washington
Date Pave. Struct. Soi l Supper t Date Pave. Struct. Soil Support Tested Temp °F Rating K Value Tested Temp °F Rating K Value
5-5-83 65° 4.00 65 5-5-83 65° 5.10 185 11-4-83 35° 3. 75 225 11-4-83 35° 3. 70 225+
Core No. Route Mi.lepost Dir. County Core No. Route Milepost Dir. County
300 us 218 62. 50 SB Washington 301 us 218 61. 50 SB Washington
Date Pave. Struct. Soil Support Date Pave. Struct. Soil Support Tested Temp OF Rating K Value Tested Temp OF Rating K Value
5-5-83 65° 4.00 105 5-5-83 65° 2.40 50 11-4-83 35° 3.60 225 11-4-83 35° 2.00 225+
Core No. Route Mi 1 epost Dir. County Core No. Route Milepost Uir. County
302 us 218 62.00 NB Washington 303 us 218 63,00 NB ~Jashington
Date Pave. Struct. Soi 1 Supper t Date Pave. Struct. Soil Support Tested Temp OF Rating K Value Tested Temp OF Rating K Value
5_5cg3 65° 1.20 185 5-5-83 65° 3.35 50 11-4-83 35o 2.10 225+ 11-4-83 35o 2. $5 225+

LTM PAVEMENT CORES PAGE 124
I Jill
Core No. Route Milepost Dir. County Core No. Route Milepost Dir. County
304 us 118 64.00 NB Washington 305 us 218 65.00 NB ~/ashington
Date Pave. Struct. Tested Temp OF Rating
Soil Support Date Pave. Struct. Soil Support K Value Tested Temp °F Rating K Value
5-5-83 65° 3. 50 11-4-83 35° 2.60
50 5-5-83 65° 4.25 155 190 11-4-83 35° 2.55 170
\.; ····1 ···
I '
I J
. ( ':- ~
.. ·.· . _.: , .. :·.:·'' . ' - , ,., .,., : - ·t' •?- "i"f''!Jl.:!.'..!~l.1J.'.1.: j ·1.~ '. '.'.i.: ~ '.'.'.~~~ 'i' I' iiJ' l'i' Ii\ 'I '!'I/ii' I'\' 11!2'I:lli~.J!i.~!~':!f !. i\~· _; \ " '~ _ .. _ ... ,.
Core No. Route Milepost Dir. County Core No. Route Milepost Dir. County
306 us 218 66.00 NB Washington 307 us 34 167.25 WB Monroe
Date ?ave. Struct. Soil Support Date Pave. Struct. Soil Support Tested Temp °F Rating K Value Tested Temp OF Rating K Value
5-5-83 65° 4.30 115 5-12-83 so0 5.55 100 11-4-83 35° 2.90 220 11-7-83 65° 5.70 2251
, : ~2!_'.!ji'l'i '1;) ~I~ l_'!.J!.: '.!_ • 1_1\.' .. ~'.~2'..[].!'i' I '17!' I'! 'l/J' I' I 'l.\!.:.:'.i'..:J£.jl\li~:ci~;~~::,'.: . ·;:_ __ :·.-_____ · .... _-·:··--· . ·- "- . ',. -.--·e.--
Core No. Route Milepost Dir. County Core No. Route Milepost Dir. County
308 us 34 166.50 (;8 Monroe 309 us 34 165.50 \IB Monroe
Date Pave. Struct. Soil Support Date Pave. Struct. Soil Support Tested Temp OF Rating K Value Tested Temp °F Rating K Value
5-12-83 80° 6.35 190 5-12-83 80° 6.50 205 11-7-83 65° 6.75 225+ 11-7-83 65° 6.60 225+

LTM PAVEMENT CORES PAGE 125
Core No. Route Milepost Dir. County Core No. Route Milepost Dir. County
310 us 34 164.25 WB Monroe 311 us 34 163.25 flB Monroe
Date I' ave. Struct. Soil Support Date Pave. Struct. Soil Support Tested Temp °F Rating K Value Tested T enp OF Rating K Value
5-12-83 80° 6.10 155 5-12-83 B0° 4.55 100 11-7-83 65° 6.50 225+ 11-7-83 65° 5.40 225+
Core No. Route Milepost Dir. County Core No. Route Milepost Dir. County
312 us 34 162. 25 WB Monroe 313 us 34 161. 25 flB Monroe
Date Pave. Struct. Soil Support Date Pa•te. Struct. Soil Support Tested Temp °F Rating K Value Tested Temp °F Rating K Value
5-12-83 80° 4.55 100 5-12-83 80° 5. 10 130 11-7-83 65° 5.55 225+ 11-7-83 65° 6.00 225+
.. . . '
.· 311. ', ' ',. "
' --~- r \~ ~ ~ '
): " l. • ~t 0 " - '
Core No. Route Milepost Dir. County Core No. Route Milepost Dir. County
314 us 34 160. 25 '~B Monroe 315 us 34 159. 25 flB Monroe
Date Pave. Struct. Soil Support Date Pave. Struct. Soil Support Tested Temp OF Rating K Value Tested Temp °F Rating K Value
5-12-83 80° 5.75 190 5-12-83 80° 6.00 195 11-7-83 65° 6.50 225+ 11-7-83 65° 5. 40 225+

l TM PAVEMENT CORES PAGE 126
Core No. Route Mi 1 epost Dir. County Core No. Route Milepost Dir. County
316 us 34 159.00 EB Monroe 317 us 34 160.00 EB Monroe
Date Pave. Struct, Soil Support Date Pave. Struct. Soi l Support Tested Temp OF Rating K Value Tested Temp °F Rating K Value
5-12-83 80° 4. 30 80 5-12-83 80° 5.45 195 11-7-83 65° 4. 70 225 11-7-83 65° 6.00 225+
Core No. Route Milepost Dir. County Core No. Route Mi 1 epost Dir. County
318 us 34 161.00 EB Monroe 319 us 34 162.00 EB Monroe
Date Pave. Struct. Soi 1 Support Date Pave. Struct. Soil Support Tested Temp OF Rating K Value Tested Temp OF Rating K Value
5-12-83 80° 6.90 170 5-12-83 80° 5. 70 225+ 11-7-83 65° 6. 50 225+ 11-7-83 65° 6.35 225+
Core No. Route Mi 1 epost Dir. County Core No. Route Milepost Dir. County
320 us 34 163.00 EB Monroe 321 us 34 164.00 EB Monroe
Date Pave. Struct. Soil Support Date Pave. Struct. Soil Support Tested Temp °F Rating K Value Tested Temp °F Rating K Value
5-12-83 80° 4.10 150 5-12-83 80° 6. 75 145 11-7-83 550 5. 55 225+ 11-8-83 50° 6.50 225+
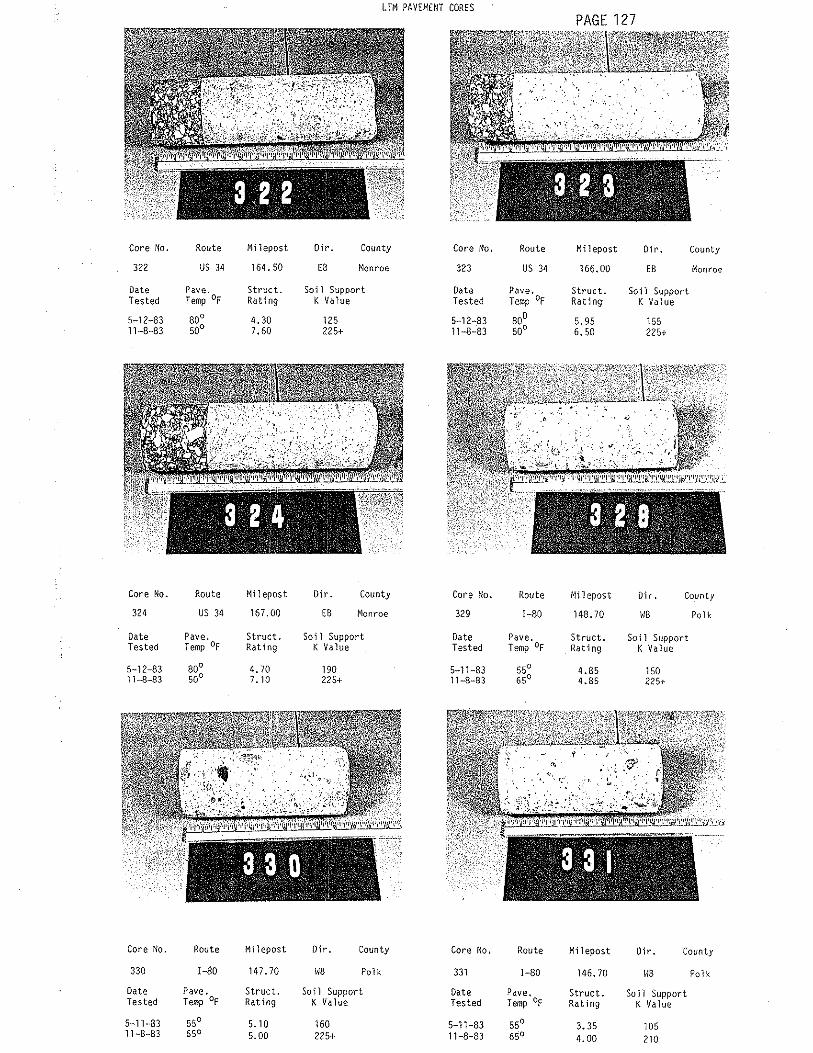
LTM PAVEM£NT CORES PAGE 127
Core No. Route Milepost Dir. County Core No. Route Milepost Dir. County
322 us 34 164. so EB Monroe 323 us 34 166.00 EB Monroe
Date Pave. Struct. Soil Support Date Pave. Struct. Soil Support Tested Temp °F Rating K Value Tested Temp °F Rating K Value
S-12-83 80° 4.30 12S S-12-83 80° S.95 lSS 11-8-83 so0 7.60 225+ 11-8-83 so0 6. so 225+
Core No. Route Milepost Dir. County Core No. Route Milepost Dir. County
324 us 34 167.00 ES Monroe 329 I-80 148. 70 WB Polk
Date Pave. Struct. Soi 1 Support Date Pave. Struct. Soil Support Tested Temp OF Rating K Value Tested Temp °F Rating K Value
5-12-83 80° 4.70 190 S-11-83 ss0 4.BS 150 11-8-83 so0 7. 10 225+ 11-8-83 6S0 4.85 225+
Core No. Route Mi 1 epost Dir. County Core No. Route Milepost Oir. County
330 I-80 147. 70 WB Polk 331 I-80 146. 70 f!B Polk
Date Pave. Struct. Soil Support Date ?ave. Struct. Soi 1 Support Tested Temp °F Rating K Value Tested Temp °F Rating K Va 1 ue
S-11-83 ss0 5. 10 160 S-11-83 ss0 3.3S 105 11-8-83 6S0 S.00 22S+ 11-8-83 65° 4.00 210

l TM PAVEMENT CORES PAGE 128
Core No. Route Milepost Dir. County Core No. Route Milepost Dir. County
332 1-80 145.70 WB Polk 333 1-80 144.70 W8 Polk
Date Pave. Struct. Soil Support Date Pave. SLruct. Soil Support Tested Temp °F Rating K Value Tested Temp °F Rating K Value
5-11-83 55° 3.60 105 5-11-83 55° 4.40 160 11-8-83 65° 3.75 210 11-8-83 65° 4.20 225+
Core No. Route Milepost Dir. County Core No. Route Milepost Dir. County
334 1-80 144.20 l~B Polk 335 1-80 142.90 WB Polk
Date Pave. Struct, Soil Support Date Pave. Struct. Soil Support Tested Temp OF Rating K Value Tested T ernp °F Rating K Value
5-11-83 55° 5. 10 125 5-11-83 55° 4.40 90 11-8-83 65° 5.80 ??5+ 11-10-83 200 4.55 220
338
Core No. Route Milepost Dir. County Core No. Route Milepost Dir. County
336 1-80 142.00 W8 Polk 337 1-80 143.00 EB Polk
Date Pave. Struct. Soi 1 Support Date Pave. Struct. Soil Support Tested Temp of Rating K Value Tested T ernp °F Rating K Value
5-11-83 55° 4.00 65 5-11-83 55° 4.20 85 11-10-83 200 4.85 225+ 11-10-83 20° 4.40 215

LTM PAVEMENT CORES PAGE 129
\
Core No. Route Milepost Dir. County Core No. Route Milepost Dir. County
338 l-80 143.50 EB Polk 339 l-80 144. 50 EB Polk
Date Pave. Struct. Soil Support Date Pave. Struct. Soi 1 Support Tested Temp °F Rating K Value Tested Temp °F Rating K Value
5-11-83 55° 6.35 135 5-11-83 55° 4.85 115 11-10-83 20° 5.40 225+ 11-10-83 20° 4.00 225
... '• . '
::c~.:!..il.!l..:;_:ir•:.1·1;{• 1.:~il:.;.1'..:~'.:.:.~iJ'i'•1·1n•1•t•iM'';1'1~~\~lt'.X
. . 3 A. O" .. . ! <! j '
~" • •, ' ., ! • ' • " - t'
' I ' ' . . . \ ~ ' ' "'•/ ,l 1 •' ~ '! l ' -
Core No. Route Milepost Dir. County Core No. Route Milepost Dir. County
340 l-80 145. 50 EB Polk 341 l-80 146.50 EB Polk
Date Pave. Struct. Soil Support Tested Temp °F Rating K Value
Date Pave. Struct. Soil Support Tested Temp °F Rating K Value
5-11-83 55° 5. 10 160 11-10-83 20° 4.85 225+
5-11-83 55° 4.40 90 11-10-83 20° 5. 10 225+
Core No. Route Milepost Dir. County Core No. Route Milepost Dir. County
342 l-80 147. 50 EB Polk 343 l-80 148.00 EB Polk
Date Pave. Struct. Soi 1 Support Date Pave. Struct. Soil Support Tested Temp OF Rating K Value Tested Temp OF Rating K Value
5-11-83 55° 6. 35 205 5-11-83 55° 4.55 95 11-10-83 200 4.00 225+ 1,_,0-83 20° 3.35 225

LTM PAVEMENT CORES PAGE 130
Core No. Route Milepost Dir. County Core No. Route Milepost Dir. County
344 l-80 T48. JO EB Polk
Date Pave. Struct. Soil Support Date Pave. Struct. Soil Support Tested Temp °F Rating K Value Tested T ernp °F Rating K Value
5-11-83 55° 4.55 140 11-10-83 20° 4.70 175

TABLE 1
TABLE 2
TABLE 3
TABLE 4
TABLE 5
TABLE 6
TABLE 7
TABLE 8
TABLE 9
TABLE 10
TABLE 11
TABLE 12
PAGE 131
APPENDIX G
Moisture-Density-Silt Content Relationships
Glacial Clay Subgrade Treatment
Silty Sand and Gravel Subgrade Treatment
Saturated Silty Clays and Various Granular Treatments
High Silt Content in Granular Subbase
IA 22 & IA 70 Road Rater A.C. Overlay Designs
Requested Rigid Pavement Road Rater Testing
Requested Flexible Pavement Road Rater Testing
Requested Composite (AC/PC) Pavement Road Rater Testing
Rigid Pavement Road Rater Study Sections
Rigid Pavement Road Rater Study Sections (Cont'd)
Composite (AC/PC) Pavement Road Rater Study Sections
TABLE 13 Flexible Pavement Coefficient of Asphaltic Concrete From Road Rater Deflection Testing
TABLE 14 Rigid and Composite Pavement Coefficient of Asphaltic Concrete From Road Rater Deflection Testing
TABLE 15 Road Rater Void Detection Testing I-80 EB - Scott County
TABLE 16 Road Rater Testing of Retrofitted Load Transfer Dowels

Pavement Type Core #
PC 133
PC 134
PC 134
PC 136
PC 138
PC 139
PC 140
PC 141
PC 142
Table 1 Moisture - Density - Silt Content Relationships
Field Silt Moisture Density K Value Content Content {pcf) {psi/in) ( %) ( %) Layer
111 205 35 16.2 B
109 180 48 16.5 B
111 200 42 17.4 B
108 205 37 18.3 B
100 130 61 21.6 B
95 65 48 25.2 B
108 200 40 17.8 B
118 200 41 12.7 B
104 180 41 19.6 B
Description
Gr Br Glacial Clay
Dk Br Silty Clay Loam
Gr Br Glacial Clay
Gr Br Glacial Clay
Br Gr Silty Clay
Gr Br Silty Glacial Clay
Gr Br Glacial Clay
Dk Br Sandy Silty Clay
Br Gr Glacial Clay
-0 )>
"' .,., w N

Table 2 Glacial Clay Subgrade Treatment
Field Silt Moisture Pavement Density K Value Content Content
Type Core # (pcf) (psi/in) ( %) ( %) Layer Description
PC 211 118 200 36 14.0 B Gr Br Clay Loam
PC 212 124 200 B Br Gr Clay Loam
PC 213 118 190 42 12.2 B Gr Br Glacial Clay
PC 214 120 215 36 12.3 B Gr Br to Br Gr Glacial Clay
PC 215 115 125 11.8 B Br Sand Clay Loam w/Sand Seams
PC 216 123 200 44 13. 5 B Br Sandy Clay Loam
PC 217 112 210 14.9 B Dk Br Silty Clay Loam w/Gravel
PC 218 123 125 57 11.3 B Br Sandy Loam
PC 219 115 185 36 10.6 B Gr Br Sandy Clay Loam
PC 220 119 220 36 12.1 B Br Gr Glacial Clay
PC 221 119 185 39 12.2 B Gr Br Silty Glacial Clay -0 3" G>
35 15.7 B Gr Br Glacial Clay rTt
PC 222 112 210 w w
PC 223 115 190 35 13.5 B Dr Br Clay Loam
PC 225 105 220 41 19.7 B Br Gr Clay Loam
PC 225 105 200 43 17.7 B Dk Br Clay w/Gravel + Sand Seams
PC 226 118 190 49 12.5 B Gr Br Glacial Clay

Tab 1 e 3 Silty Sand and Gravel Subgrade Treatment
Silt K Value Content
Pavement Type Core # (psi/in) (%) Layer Description
PC 169 185 10 B Sand + Gravel PC 170 215 10 B Sand + Grave 1 PC 171 185 8 B Sand + Gravel PC 172 185 9 B Sand + Gravel PC 173 130 10 B Sand + Gravel PC 174 180 9 B Sand + Gravel PC 175 195 17 B Sand + Gravel PC 176 150 20 B Sand + Gravel PC 177 160 19 B Sand + Gravel PC 178 180 14 B Sand + Gravel PC 191 145 14 B Sand + Gravel PC 192 150 19 B Sand + Gravel PC 193 225+ 15 B Sand + Gravel PC 194 140 21 B Sand + Gravel PC 195 155 21 B Sand + Gravel PC 196 185 26 B Sand + Gravel PC 197 180 25 B Sand + Gravel PC 198 180 23 B Sand + Gravel PC 199 180 28 B Sand + Gravel PC 200 205 28 B Sand + Gravel PC 201 205 26 B Sand + Gravel " PC 202 180 B Sand + Gravel )>
Ci)
PC 203 175 3 B Sand + Gravel rn
PC 204 190 21 B Sand + Gravel w -"'

Tab 1 e 4 Saturated Silty Clays and Various Granular Treatments
Field Silt Moisture Pavement Density K Value Content Content
Type Core # (pcf) (psi/in) ( %) ( %) Layer Description
PC 253 215 2 B Br Sand w/Occ Gravel
PC 254 200 2 B Br Sand w/Occ Gravel
PC 255 113 155 33 13.8 B Gr Br Clay Loam
PC 256 155 8 B Br Sand w/Gravel
PC 275 102 50 73 19.9 B Br Gr Silty Clay
PC 276 104 90 73 20.0 B Br Gr Silty Clay
PC 277 165 9 B Gravel (Limestone)
PC 278 106 115 63 19. 0 B Br Gr Silty Clay
PC 279 155 12 B Gravel (Limestone)
PC 280 98 125 73 22.5 B Br Gr Silty Clay
" )>
"' fTl
~
w <.n

Tab 1 e 5 High Silt Content in Granular Subbase
Silt Layer C Pavement K Value Content Thickness Density - Moisture
Type Core # (psi/in) (%) Layer Description (inches) (pcf) (%)
PC 329 150 10 B Sand and Gravel 6" 111 lb. @ 15.9
PC 330 160 8 B Sand and Gravel 4. 5" 118 lb. @ 15.3
PC 331 105 16 B Sand and Gravel 5" 111 lb. @ 16.7
PC 332 105 11 B Sand and Gravel 6" 118 lb. @ 15.3
PC 333 160 8 B Sand and Gravel 6" 111 lb. @ 15.8
PC 334 125 11 B Sand and Gravel 5"
PC 335 90 13 B Sand and Gravel 4" 110 lb. @ 17.5
PC 336 65 14 B Sand and Gravel 6" 102 lb. @ 19.8
PC 337 85 12 B Sand and Gravel 5" 108 lb.@ 17.6
PC 338 135 12 B Sand and Gravel 5" 111 lb. @ 16.9
-0 )>
"' rn
~ O'>

Map Section Number
l
2
3
5
7
6 I
4
I
'
Table 6 IA 22 & IA 70 Road Rater A.C.
Overlay Designs
Road Rater Structural Rating
r-~~~~~,-~~~~~-;~~~~~~~~~~~~~~~~~~~~--1'."oad- Rater ~.c .. Overlay
Route From To 1977 1978 . 1979 1980 I
IA. 22 us 218 IA.405 1-65/1.45 *
IA. 22 IA. 4 05 Nichols I 3. 2s;2. 9o 4.20/3.70 4.00/3.60
IA. 22 Nichols E.Jct. I 3.20/2.70 IA. 70 3.25/2.75
IA. 22 IA. 70 Muscatine 2.90/2.45 2.38/2.18
IA. 70 Columbus Conesville 2.95/2.52 Junction
IA. 70 I Cones- I Nichols I I I I 2.20/1. 851 ville
IA. 70 I IA. 22 West I I I I 2.80/2.451 Liberty
NOTjS' * T o Low For ~eaningful ~tructural ijating
i.so~1.10 The~First Number rs The st1uctural Rating Based on !Average Def The econd Num·er Is The S ructural Rlting Based Ol SOth Percerltile Deflec Desi_,\n Purpose .
),982
1. 50/1.10
4.20/3.60
3.50/3.00
2.37/1.90
3.00/2.45
2.38/2.05
3.10/2.60
ection. ion For
Estimate Based bn 15 Year IDjstrict #5 ~esign Life Recommendation
7 "· I Reconstruction 1986
2" ! Minor Resurfacing
3~"
In Future
Resurfacing 1984
7" 3" - 4" Resurfacing 1984
3"
4"
51:/"
Resurfacing In Future
Resurfacing In Future
3" - 4" Resurfacing
1984
-0 )>
"' "1
w -...J

Table 7 Requested Rigid Pavement Road Rater Testing
I I !
' I ! Po.VE. SR
As Const. ' !
STl'UCTURi\L I
A'1'
ROUTE] COUNTY ?ROi·i TO COMPOSITION NE\·: S:\ AVE. SR JOINTS
I RE()UESTEJ: ruom "'t ~ ~'1 =<~ '
I-80 Pott. MP 6.61 MP 11. 52 11969 4" GSB 4.40 EB 3.40 3.25
council sec. 11, 8" COCP VJB 3.60 3.28
Bluffs R-43i;, T-75N
5.36 EB 4.28 I 3.98 I-80 Pott. MP 11.52 MP 18. 93 1969 4" ATB
Sec. 11, Underv.xxxl 8" CRCP WB 4. 28 I 4.24
R-43W I T-75N I
I-80 Pott MP 18.93 MP 27.00 1969 4" A'.IB I 5.36 EB 4.10 4.50
Underv.DO<l I-680 8" CRCP I ~\13 4. 28 4.00
I I EB I-80
I
Pott MP 27.00 MP 33.80 1966 4" G3B 4.40 3.66 3.40
I-680 Shelby 8" CRCP WB 3.59 3.72
I-680 I Pott. MP 13.05 MP 29.21 1966 4" GSB 4.40 EB 3.73 3.03
I-29 I-80 8" CRCP h'B 3.34 l 2.74
' ' l
I-80
I Dallas MP 100.80 MP 106.16 1966 4" GSB PC Various I EB 4.60
I 2.02
Redfield p 58 10" Std. PCCP 5.40 WB 4.80 2.63
I Inter- Westbound.
I change East1:ound Consists of AC And PC Sections of Various Ccrnposition. Eastbound PC Sections (Only) Were Tested And Averaged..
I-80 i Dallas MP 106.16 MP 111.14 1966 4" GSB 4.40 EB 3.87 2.75
P58 us 169 8" Bar Mats NB 3.36 i 3.45
I-80 Dallas I MP 111.14 I
MP 118.00 1966 4" GSB 4.40 EB 3.08
I 2.78
us 169 R22 8" Bar !'-E.ts I WB 3.14 3.20
I-80 Dallas ! MP 118. 00
I I l
MP 122.40 1966 4" GSB 4.40 I ER 2. 86 i 2.40
R 22 Polk CO. 8" Bar M:lts WB 2.55 2.70
Line I ! ' ! i
I
I
80th '51 SR
2.50 3.15
3.73 3.83
3.67 3.73
3.24 3.00
3.40 2.85
4.00 4.30
3.10 2.87
2.65 2.60
2.52 2.17
'
A.C. OVERLAY THICKNESS REQUIRED
10 YE.l'i.R 15 Year
I 20 YEAR
DESIGN OE'.31Gi'! DESIGN
LIFE LIFI:: L:fE
10" 10 1/2" 10 8 1/4" 9" 9"
6 3/4" 7 1/2" 7 : 6 3/4" 7 1/4" 7 J
7" 7 3/4" 7 6 3/4" 7 1/2" 7
8" 8 3/4" 9' 8 3/4" 9 1/2" 9
3 3/4" 4 3/4" 5 5" 6 1/4" I
6
6 3/ 4 ti 7" 7 6" 6 1/4" 6
9" 9 1/4" 9 9 1/2" 1011 10"
10" 10 1/2" 10 10 1/4" 10 1/2" 10
10 1/2" 10 3/4" 11" 11 1/4" 11 1/2" 11
'
-cl )> G) rn
w 00
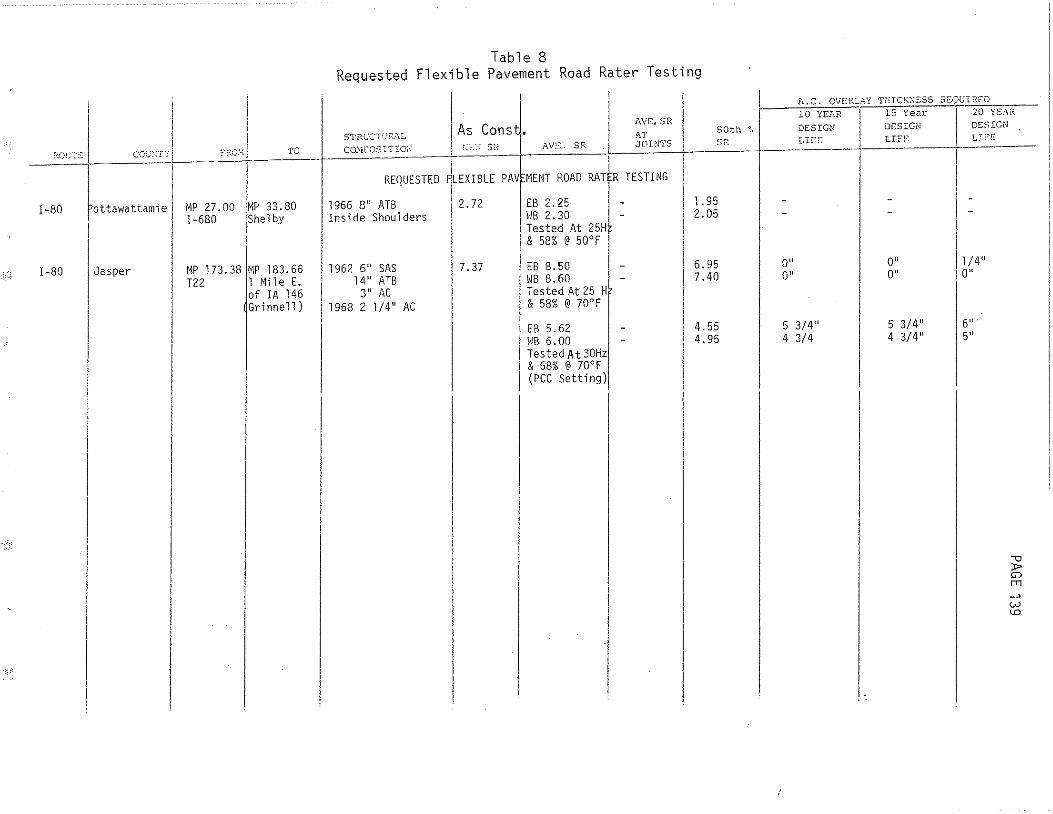
Table 8 Requested Flexible Pavement Road Rater Testing
I I I
I AVE.SR
co;;:·•: I S1'Rt.iC?C?.,\L As Consj. AT
80th ~
co;;: T·:i ?:.:o:.; TO co:··E'OS ::7IO~,; ! ;;~:.-: sc-; 1\V;:. SR J0INTS I sr::
~ I
' REOUESTED .
1
LEXIBLE PAV~MENT ROAD RAT R TESTING
I ottawattamie I l-80 MP 27.00 MP 33.80 1966 8" ATB 2.72 I EB 2.25 l. 95
l-680 Shel by Inside Shoulders llB 2. 30 2.05
1 Tested At 25Hf
I I & 58% @ 50'F
I-80 I Jasper MP 173.38 MP 183. 66 1962 6" SAS 7.37 I EB 8. 50 - 6.95
T22 l Mile E. 14" ATB ' l·IB 8.60 ' 7.40
I i -
of IA 146 3" AC Tested At 25 H
I I Grinnell) 1968 2 1/4" AC & 58% @ 70'F I I ' i
I EB 5.62 - 4.55
I WB 6.00 - 4.95
I
Tested At30Hz & 68% @ 70'F (PCC Setting)
I
A.C. OVERL.:..Y Tl!IC!G~SSS ?<£QUIRED
10 YEAR
I 15 Ye.:!.r
DESIGN DESIG<-l
LIFE LIF!".
- -- -
O" O" O" O"
5 3/4" 5 3/4" 4 3/4 4 3/4"
I 20 YE:\R
DESIGN L::~1:
I
--
l/4u i 0"
5u. 5"
I
-cl );> G) rn
w <.D

I CO'/l::J
!
us 30 I Linn
us 30
us 30
I
I i Cedar I I
I
Tama
Table 9 Requested Composite (AC/PC) Pavement Road Rater Testing
A.C. OVE:\L.t:.Y '!'llICKt-;ESS R.£:0jiLS!'~D
DE:::IGN 10 YEAR I 15 Year OCSIGN oESIG~l
20 YE:t,rt
LI::"~:
'PO co". ·1 :c:::o:::i- -t·
I I MP 258.44
IA 13 MP 268.57 Cedar Co Line
A C t i I •\',l".SR
snucTURAL I s ons ~ ,0•
c::~:,~::::N COMPOS!;; (A:;/PC) PA;:::~NT5
:0ADIRAH~o:-:-:"-:-irl-ll G--"-"--t-i ------+-------+--·
1953 9 1/2" PCCP 6.07 EB 5.40 I 3.73 4.55 1965 3" AC HB 5.83 3.18 4.45
30th ·R LIFE LIFE
1 3/4" 2 1/2" 3 1/4"
I
MP 268. 57 Cedar Co. i Line
i I MP 204. 42 I Tama
I '
MP 284.08 Clarence
MP 209.78 Old IA 212
1927 7" PCCP 1951 3" AC 1960 2" AC
1951 9" PCCP 1964 3" AC
1931 7" PCCP 1956 6" PCCP 1964 3" AC
5. 70
5.82
7.82
. 0 Hz & 68% @ 47°F
EB 3.80 HB 4.55 30 Hz & 68%
@ 49°F
EB 4. 32 HB 4.32 30 Hz & 68% @ 34°F
EB 4 .67 HB 3.15 30 Hz & 68% @ 34°F
I I I I I i
I
2.85 1.88
2.80 3.58
3.03 3.88
3.00 3.88
3.06 3.25
3.72 2.18
4 1/4" 5" 5 3/4"
4 3/4" 5 1/2" 6 l /2"
6 l /4" 7" 7 3/4"
-0 J>
"' rn
+> 0

I I i
C:XTC I I I ,,o) C,J:.;::-r·:j TO
' ' I
I Boone us 30 MP 131.00 MP 131.50 Just West O'
I I Des Moines liver
us 30 I Story MP 148.00 I MP 156.21
I I us 69 Nevada
I I I
us 30 I Marsha 11 I MP 172.00 MP 179.00
' State Cente i r S 70 I
I I I I
IA 17 Boone I MP 21.63 MP 32.76
11 Mile N. Hamilton of US 30 Co. Line
IA 17 I Hami 1 ton ' MP 39.76 MP 48.95 i l Mile N. 520 I Of Stanhope
IA 17 Hamil ton MP 134.00 MP 135.39 W.End 01 d us 20 Of 520
520 I Hami 1 ton MP 135.58 MP 140.09
I W. End IA. 17 I Of 520
520 Hamilton MP 141.50 MP 149.50 2 Miles E. us 69 Of I A 17
i . 520 I Hamilton MP 149.50 MP 152.50
us 69 I-35
I ;.,';;
Table 10 Rigid Pavement Road Rater Study Sections
I i As Constl
I /\VF. SR
STRUCTC:C;,L ;:;.·. .s•; 1 AT
CO<·lr':JS1TIC;·i ;..v::.-. S!:: J"Ot:!TS
RIGID PA~EMENT ROAD ~''' ''""' '1"''""' 1964 4" GSB 5.40 ;m 5. 70 2.60
10" PCCP
I 1964 4" GSB 5.40 EB 5.13
I 4.50
l O" PCCP WB 5. 38 4.50
I ' 1963 4" Grad.St. 4.56 fEB3.70
I 3.75
I '
Base I i WB 3. 70 3.70 8" CRCP I I
I 1980 8" PCCP 4.00 NB 4. 13 l. 95
SB 4.90 2.37
1978 7 1/2" PCCP 3.75 NS 3.88 ! 2. 72
I SB 3.80 2.43 I
I 1979 8" PCCP 4.00 NB 4.60 4.00
SB 4.90 I 4.10
1979 4" Cl. A SB 5 .61 I EB 5. 70 2.85
8 1/2" PCCP WB 5.43 3.10
1975 4" Cl. A SB 5.86 EB 5.43 i 3.90
9" PCCP WB 5.34 3.67 I I
1968 4" GS8 5.40 EB 5. 70 ' 3. 77 I l O" PCCP WB 5.00 I 4.50
I .I
I I
SO th SR
4.95
4.43 4.67
3.23 3.42
3.62 4.30
3. 51 3. 38
4.04 4.00
5.05 4.95
4.95 4.78
5.30 4.55
A.C. OVERL.:..Y THICK'.'1£SS REC.'UIRED 10 YCAR l 15 Year ! 20 YEAR
DCSIGi'l LIFE
0"
l l /4"
l " l l I 4"
l /4" l /2"
l /2" 2 1/4" I
DESIGN LTF:"
O"
l 3/4"
2" 2 1/4"
2 1/4" 2 1/2"
l l /4" 3"
DESIGN f.IF!::
. O"
2 1/4"
2 1/4" 2 1/2"
2 1/2" 3"
" )>
l 3/4 11 ~ 3 1/2u -->
+> ~

Table 11 Rigid Pavement Road Rater Study Sections
I , .. I w •. ,, •••• , '"
I I-80 Pott. IMP35.10 IMP39.68
i I Shelby US 59
IA 160 1
1 Polk I MP 0.00 IA 415
IA 41511 Polk _ MP 2.50 1 2 Mil es
I S. of IA 160
IA 17 I Polk
I MP 0.00 IA 141
I
MP l. 22 us 69
MP 4. 50 IA 160
MP 7.50 Boone Co. Line
snccTco..\L I As Const,. co:-:"CS: :·re: l •fr.<·1 s:-: I AV£. sc l.
RIGIO PAVEMENT ROAD RATER STUDY SECTION1
19664"GSB 5.90 EB4.10 8" CRCP
1979 3" PCC Overlay EB I
1947 10" -8" -10" 4.30 EB 3.35 PCCP I HB 4.40 I
1961 l O" PCGP
11959 10" PCCP
5.00
5.00
I NB 3.64
I NB 4.10 SB 4.40
1-35 Story MP 111.60 I MP 116.77 11967 4" GSB US 30 E 29 8" CRCP
4.40 NB 4.00 SB 4.30
t\Vl:'. SR
,'\T
(CONT'D)
2.65
3.90 4.25
SOth "'>
s
3.25
2.20 3.83
2.66
3.05 3.40
3.67 3.97
8"
p.,-.C. ovr:~:;:_;y THICK?-!f,SS HE\:'' ;,.!<::.D
10 YEAR
DESIGN
15 Year DSSIGN
LIFE LIF:-: !", :w J._ ....
20 YEAR DESIGO·l
8 3/4" I 9"
"'""'''~ ····~·· ''''""'"'''""' 12/7/821 I ' I I " I"
I I
6 1/4" 5 1/2"
7 1/4" 6 1/2"
7 1 /2" 6 3/4"
" )>
"' f'T1
_,,. N

·::<;:.:~2
us 69
us 65 I i I I
IA 330 I '
I Cco•~vl co•···' I uv.-. t. . ··-~··
I T I I
Polk IMP 97 .00 I M 1 Mile N. i I Of Ankeny i
Polk JMP 84.30 p-80
i Marshall IMP 20.21
1US 30
M B
M M t
IA 415( Polk MP 2.50 2 Mil es S. of IA 160
M I I
l
TO
Table 12 Composite (AC/PC) Pavement Road Rater Study Sections
I As ConsJ
' I I
I A\'F. SR I ~-TRUCTURAI. ' SOth ~-A'l'
COHPOSITIO:·; I NE\· s:i AVE. S!Z JOINTS SR
\fioSITE (AC/PC) PAVEMEJT ROAD RATI R STUDY SECTIO S I I
I 1923 8" PCCP I 6.31 NB 4. 18 - 3.45
1948 3" AC SB 4. 05 - 3.28
1956 l 1/2" AC ' 30 Hz & 68% I I
1967 3/4" AC I @ 3s°F I
I 1934 l O" PCCP I 7. 64 SB 4.25 I 3.00 3.75
1951 311 AC
i
30 HZ & 68% i 1980 3" AC @ 48°F
1924 8" PCCP I 5.32 NB 3.45 3.10 2.75
Or SB 3.33 3.75 2.73
1937 7 1 /2" PCCP 30 Hz & 68%
And @ 48°F
1952 3" AC I
1943 9" PCCP ' 5.82 SB 5. 78 · - 5.00
1960 3" AC 30 Hz & 68% I @ 20°F
I
I
I I ' ' l
I I
i
A. C. OVERLAY THICKNESS RF.QC IRED
10 YEAR 15 Year I 20 YE:\R
DESIGN DESIGN ' CSSIGU I LIFE I.IF::'. LIE'!_-;
1/4" 1 l /2" 12"
2 1/2" 2 3/4" 3 3/4"
2 1/2" 3" 3 1/2"
Requeste< Pavement DeteJ i nation 12/7 /8
-0 ~ G') rn ~ .,,, w
!

i;-,,,,.~ .. ~~..:___;.-,._,__,, ____ .__ ___ _
Table 13
Flexible Pavement Coefficient of Asphaltic Concrete
From Road Rater Deflection Testing
Nominal Road Rater From To AC Overlay Year Before Resurf.
Count}:' Route Mile12ost Mile12ost Thickness Resurf. Ave.SR Year
Boone IA 210 1.90 6.87 3" 1979 2.70 1978
Hamilton IA 175 159.04 164.53 4 1/2" 1977 2.20 1977
Story IA 210 15.15 20.19 3" 1978 3.30 1978
Kossuth IA 91 0 .47 3. 71 3" 1978 1.80 1978
Jasper IA 117 6.49 17 .43 3" 1978 3.88 1977
Marshall IA 233 0.63 5.30 3" 1977 2.34 1977
Keokuk IA 78 0.00 13 .31 3" 1980 3.16 1980
Road Rater After Resurf. Ave.SR Year
4.62 1980
3.90 1978
4.33 1979
3 .66 1979
5.09 1979
3.43 1978
5.92 1984
Average
Coefficient of
Asphaltic Concrete
0.64
0.38
0.34
0.62
0.40
0.36
0.92 --0.52
-0 )> G? rri
_,,. _,,.

Tab le 14
Rigid Pavement Coefficient of Asphaltic Concrete
From Road Rater Deflection Testing
Nominal Road Rater: From To Pavement AC Over 1 ay Year B:efore ·Resurf.
County Route Ni lepost Milepost Type Thickness Resurf. Ave. SR · Year
Mills us 34 21.88 63. 73 PC 311 1983 3.95 1983 Montgomery & Adams
Pottawattamie I-680 13.05 29.21 PC 1 1/211 1983 3.64 1982
Dallas I-80 WB 99.21 100.80 PC 511 1988 4.92 1987
Polk I-35 NB 92.77 101. 78 PC 4 II 1988 5. 56 1987
Story I-35 NB 105. 80 111 • 60 PC 4 1 /2 11 1987 5. 18 1987
Polk I-80 127.17 132.00 PC 2 II 1988 4.53 1988
\
'
Road Rater After Resurf. Ave.SR Year
5. 12 1984
4.25 1984
8.02 1989
6.92 1989
8.41 1988
5. 14 1989
Average
Coefficient of
Asphalt i c Concrete
0.39
0.40
0.52
0.34
o. 72
o. 31 ==== 0.45
" )>
"' r'1
"" <.n

L=-~-';··-··
Table 15
Road Rater Void Detection Testing
1-80 EB SCOTT COUNTY
Before 2 Hours After Subseallng Subsealing
Station SR Soil K SR Soil K -- -529+00 1.73 50 2.22 122 529+25 1.77 50 3.46 207 529+50 1.57 50 2.75 198 529+75 1.33 50 2.30 179 529+00 1.77 50 3.33 173 530+25 1.57 50 2.75 183 530+50 1.51 50 3.21 192 530+75 1.73 50 3.68 197 531+00 1.46 50 3.46 197 531+25 1.37 50 2.48 161 531+50 1.44 50 2.48 161 -0
)>
531+75 1.70 50 2.22 144 G) rrt
532+00 1.25 50 3.21 192 ~
+> °' 532+50 2.15 137 2.88 219
533+00 1.73 50 3.53 188 534+00 1.46 50 3.10 194

PAGE 147
TABLE 16 ROAD RATER TESTING OF RETROFITTED
LOAD TRANSFER DOWELS
STRUCT. SOIL SUPPORT MILEPOST RATING K VALUE LOCATION REMARKS
290.154 4.90 169 MIDP LOAD TRANSFER 290.156 4.56 206 CRCK DOWELS INSTALLED 290.160 3.80 173 JT 290.164 4.02 185 CRCK 290.165 4.56 155 MIDP 290.167 4.02 185 CRCK 290.170 2.67 143 JT 290.172 5.34 133 MIDP 290.175 2.50 106 JT 290.181 3.60 199 CRCK 290.182 5.34 133 MIDP 290.184 3.13 163 CRCK 290.187 1. 33 50 CRCK NO LOAD TRANSFER 290.190 2.04 50 JT DOWELS INSTALLED 290.194 1. 51 50 CRCK 290.196 4.56 50 MIDP 290.198 1. 51 50 CRCK 290.202 2.34 115 CRCK 290.205 3.27 176 JT 290.209 1. 85 50 CRCK 290.211 6.12 130 MIDP 290.212 1. 70 50 CRCK 290.215 1. 27 50 CRCK 290.217 1.57 50 CRCK