pay and allowances2 expenditure on pay and allowances of central govt. civilian employees including...
TRANSCRIPT
GOVERNMENT OF INDIA
BROCHURE
ON
PAY AND ALLOWANCESOF
CENTRAL GOVERNMENT CIVILIAN EMPLOYEES
2001-2002
PAY RESEARCH UNITDEPARTMENT OF EXPENDITURE
MINISTRY OF FINANCENEW DELHI
For official use onlyBrochure - 24
PREFACE
The Pay Research Unit of the Department of Expenditure, Ministry of Finance brings out a“Brochure on Pay and Allowances of Central Government Civilian Employees” on an annual basis.As in the past, the Brochure for 2001-2002 provides statistical information on expenditure incurredby different Ministries/Departments of the Central Government on pay and allowances includingDearness Allowance, House Rent Allowance, City Compensatory Allowance, Overtime Allowance,etc. in respect of its regular employees. The Brochure also contains information on the groupwisenumber of sanctioned posts and of incumbents in position in various Ministries/Departments.
2. The data in the Brochure has been compiled on the basis of quarterly returns on expenditure onpay and allowances and annual returns on the strength of Central Government civilian employeesfurnished by the Central Government establishments to the Pay Research Unit of this Department.
3. The Brochure may be of use for personnel planning and for preparation of reliable estimates offinancial implications on pay and allowances of Central Government employees. While all effortshave been made to present the data in a meaningful manner, suggestions for further improvementwould be welcome.
4. Ministry of Finance would like to thank all the Central Government Ministries/Departments/Organisations for their cooperation in furnishing the data without which this compilation would nothave been possible. This Ministry would also like to acknowledge the contribution of the NationalInformatics Centre (North Block) for their assistance and guidance in the presentation of the Brochure.
(Sushama Nath)September, 2003 Joint SecretaryNew Delhi. Ministry of Finance
Department of Expenditure
PROJECT STAFF
Name Designation
1. Smt. Anuradha Mitra Director (Pay)
2. Shri P.K. Dhamija Senior Research Officer
3. Shri H.K. Bhatt Research Assistant
4. Smt. Veena Jain Research Assistant
5. Shri A.K. Puri Jr. Research Assistant
6. Smt. Seema Rani Gupta Jr. Research Assistant
7. Smt. Pushp Lata Computor
8. Smt. Simmi Takkar Computor
9. Shri S.S.Phuloria Computor
10. Shri Umesh Kr. Saini Computor
11. Shri Chander Prakash U.D.C.
(iii)
CONTENTS
Table Number
Salient Features with tabular representation
Bar Chart showing Expenditure on Pay and Dearness Allowance from 1989-90 to2001-2002.
Pie chart (for Table 1) showing expenditure on pay and different types of Allowancesof Central Government Civilian employees during 2001-2002.
1. Expenditure on pay and different types of allowances of Central Government Civilianemployees (excluding the employees of UTs) from 1999-2000 to 2001-2002.
Pie chart (for Table 1 A) showing expenditure on pay and different types ofAllowances of Central Government Civilian employees including employees ofthe Union Territories during 2001-2002.
1A Expenditure on pay and different types of allowances of Central Government Civilianemployees including employees of Union Territories from 1999-2000 to 2001-2002.
1.1 Expenditure on pay and different types of allowances of the employees of M/ORailways from1999-2000 to 2001-2002.
1.2 Expenditure on pay and different types of allowances of the employees of M/ODefence (Civilian) from 1999-2000 to 2001-2002.
1.3 Expenditure on pay and different types of allowances of the employees of M/OCommunications from 1999-2000 to 2001-2002.
1.4 Expenditure on pay and different types of allowances of the employees of M/OHome Affairs from 1999-2000 to 2001-2002.
1.5 Expenditure on pay and different types of allowances of the employees of OtherCentral Government Departments from 1999-2000 to 2001-2002.
1.6 Expenditure on pay and different types of allowances of the employees of UnionTerritory Administrations from 1999-2000 to 2001-2002.
1.7 Expenditure on pay and different types of allowances of regular employees andlocal recruits in Indian Missions abroad from 1999-2000 to 2001-2002.
Pie chart (for table 1.8) showing total expenditure on pay and allowances of CentralGovt. Civilian Employees including employees of UTs for major Departments during2001-2002.
1.8 Total Expenditure on pay and allowances of Central Govt. Civilian Employees(including employees of Union Territories) for major departments from 1997-98 to2001-2002.
(v)
Page
(vii) - (viii)
1
2
3
4
5
6
6
7
7
8
9
9
10
11
2 Expenditure on pay and allowances of Central Govt. Civilian Employees includingemployees of Union Territories as a percentage of Revenue Receipts and RevenueExpenditure from 1997-98 to 2001-2002.
3. Expenditure on House Rent Allowance of Central Government Civilian Employeesincluding employees of Union Territories by class of cities from 1999-2000 to2001-2002.
3A Rates of House Rent Allowance for different classes of cities.
4. Expenditure on Compensatory (City) Allowance of Central Government CivilianEmployees including employees of Union Territories by Class of Cities from1999-2000 to 2001-2002.
4A Rates of Compensatory (City) Allowance for different classes of cities.
4B Rates of Transport Allowance for different classes of cities.
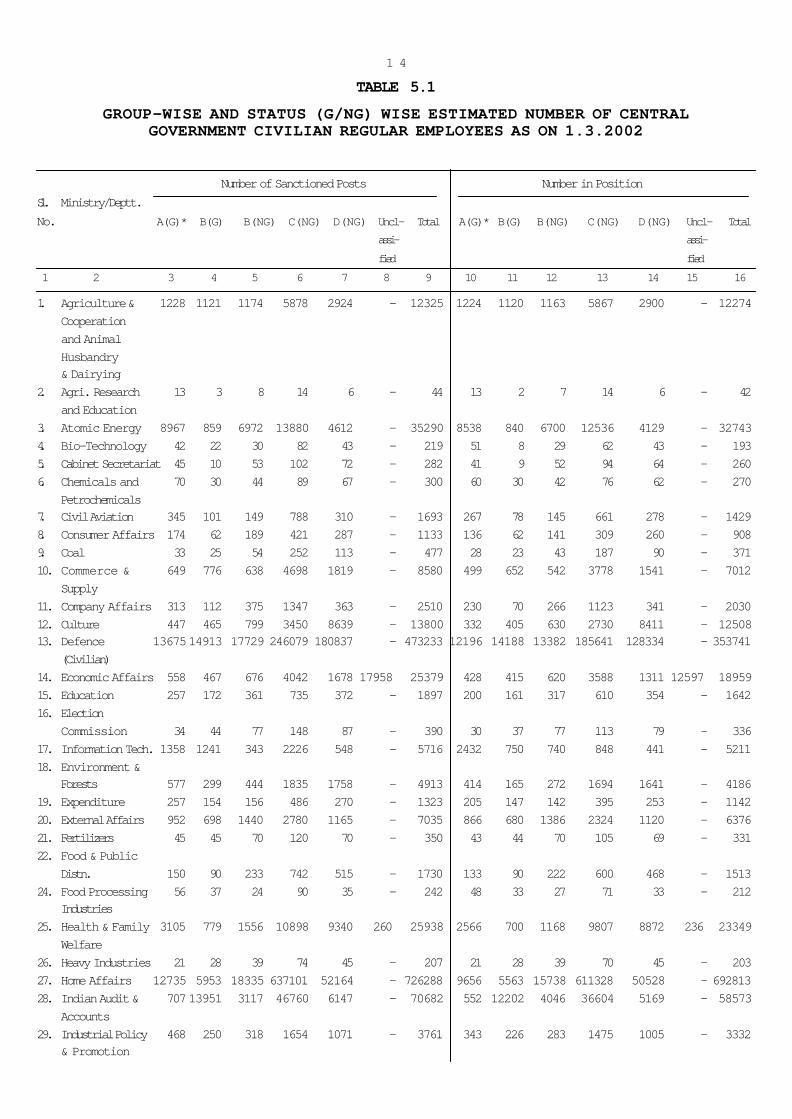
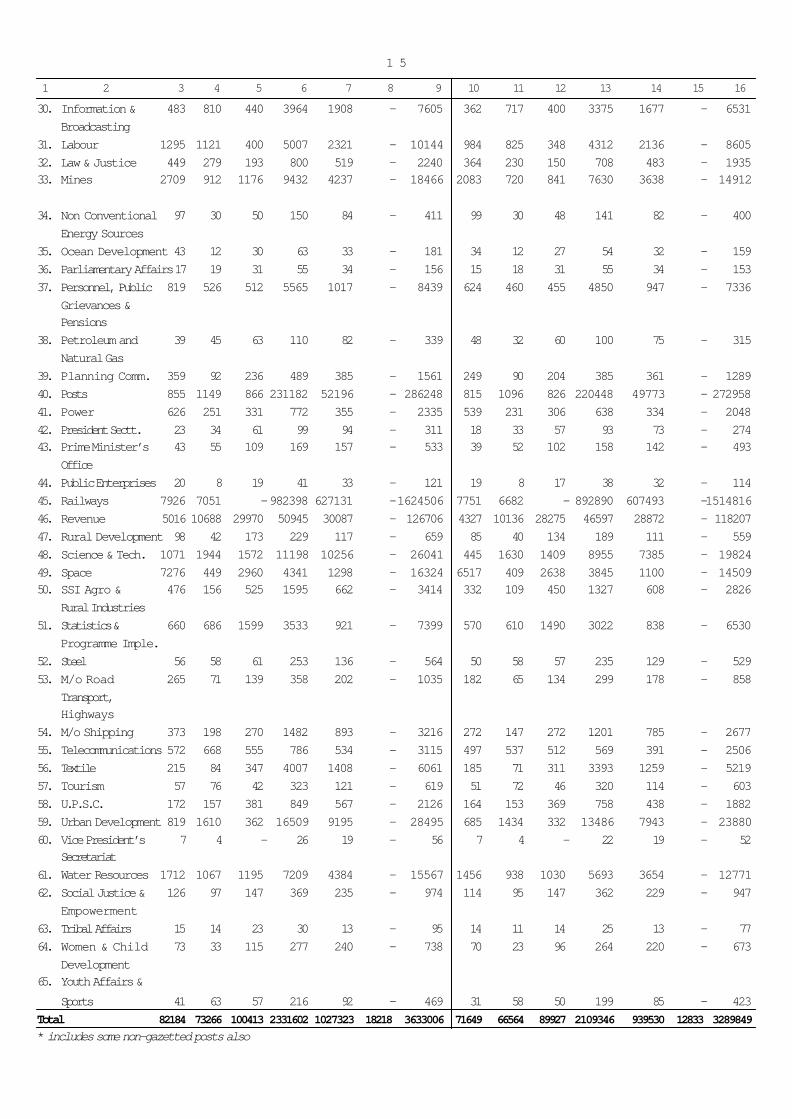
5.1 Group wise and status wise (G/NG) estimated number of Central GovernmentCivilian regular employees as on 1.3.2002 in different Ministries/Departments.
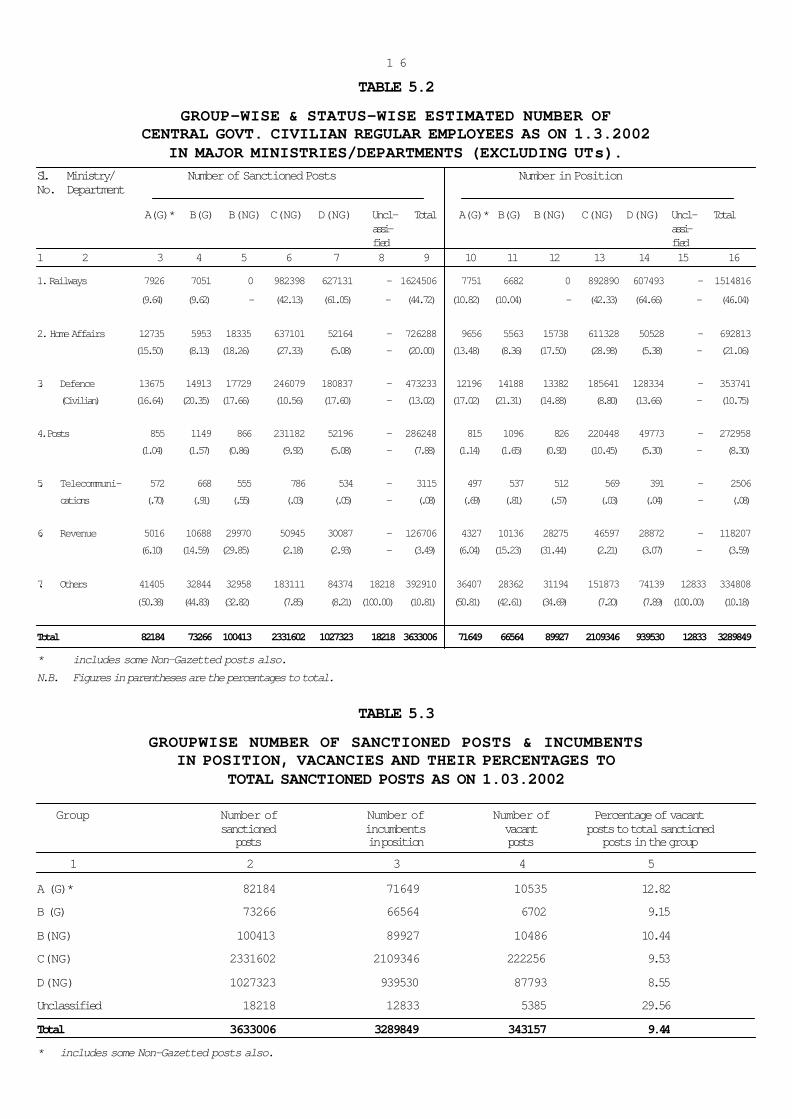
5.2 Distribution of Group wise & Status-wise estimated number of Central GovernmentCivilian regular employees as on 1.3.2002 in major Ministries/Departments(Excluding UTs).
5.3 Distribution of Group wise sanctioned posts & incumbents in position, vacanciesand their percentages to total sanctioned posts as on 1.3.2002.
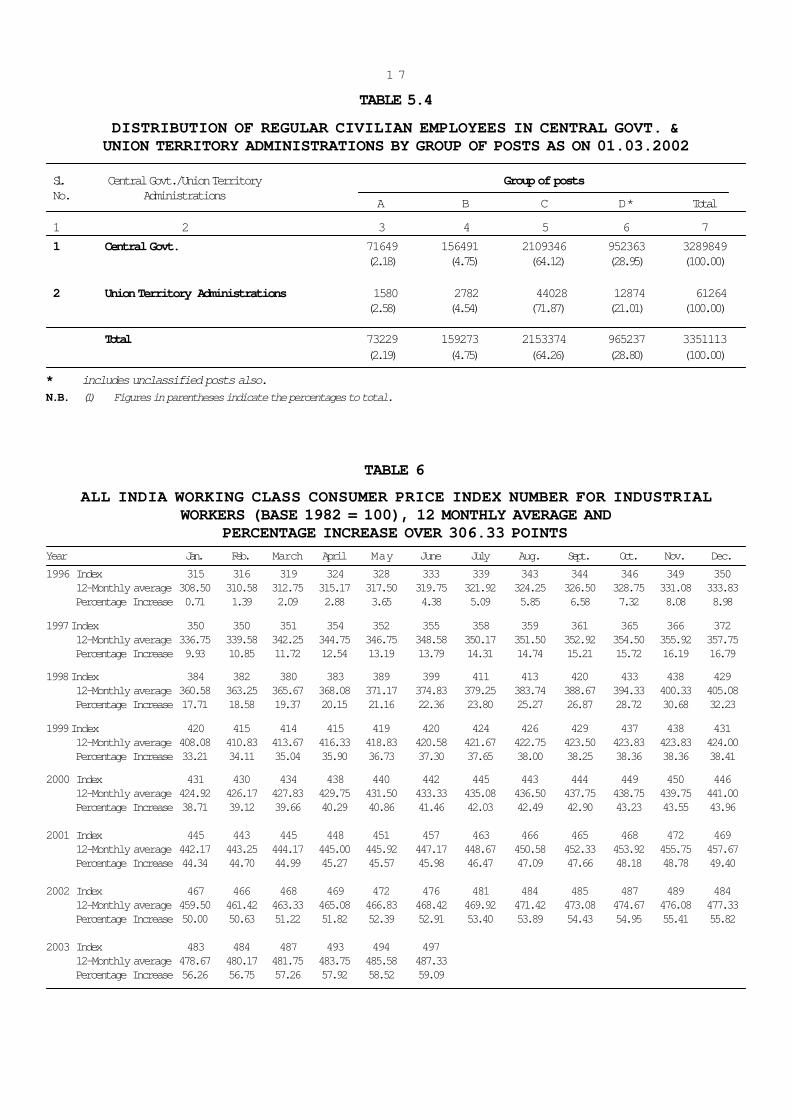
5.4 Distribution of regular employees in Central Government and Union TerritoryAdministrations by group of posts as on 1.3.2002.
6. All India Working Class Consumer Price Index No. for Industrial Workers, (Base1982=100), 12 Monthly Averages and percentage increase over 306.33 points fromJanuary, 1996 onwards.
7. Total emoluments (Pay +DA) at the minimum and maximum of scales of pay inrespect of some selected posts under the Central Government as on 1st Jan. 1998onwards.
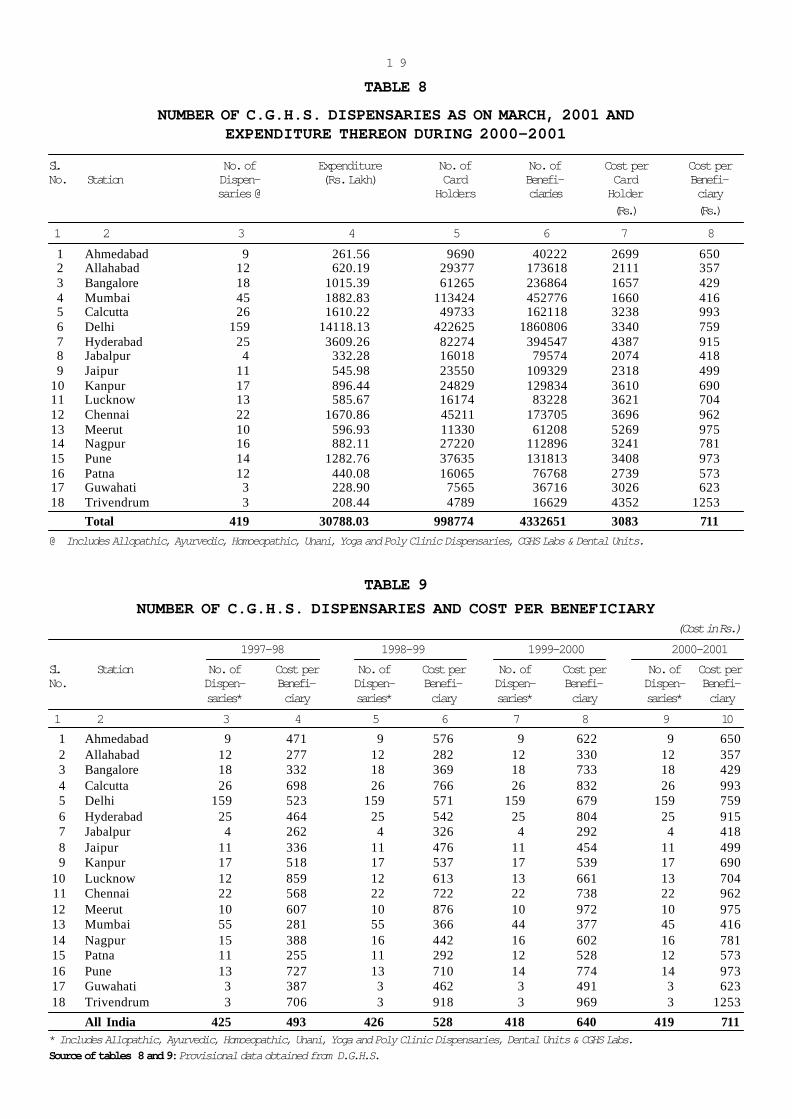
8. Number of C.G.H.S Dispensaries, card holders and beneficiaries as on March,2001 and Total Expenditure and cost per beneficiary during 2000-2001.
9. Number of C.G.H.S Dispensaries and Cost per Beneficiary from 1997-98 to2000-2001.
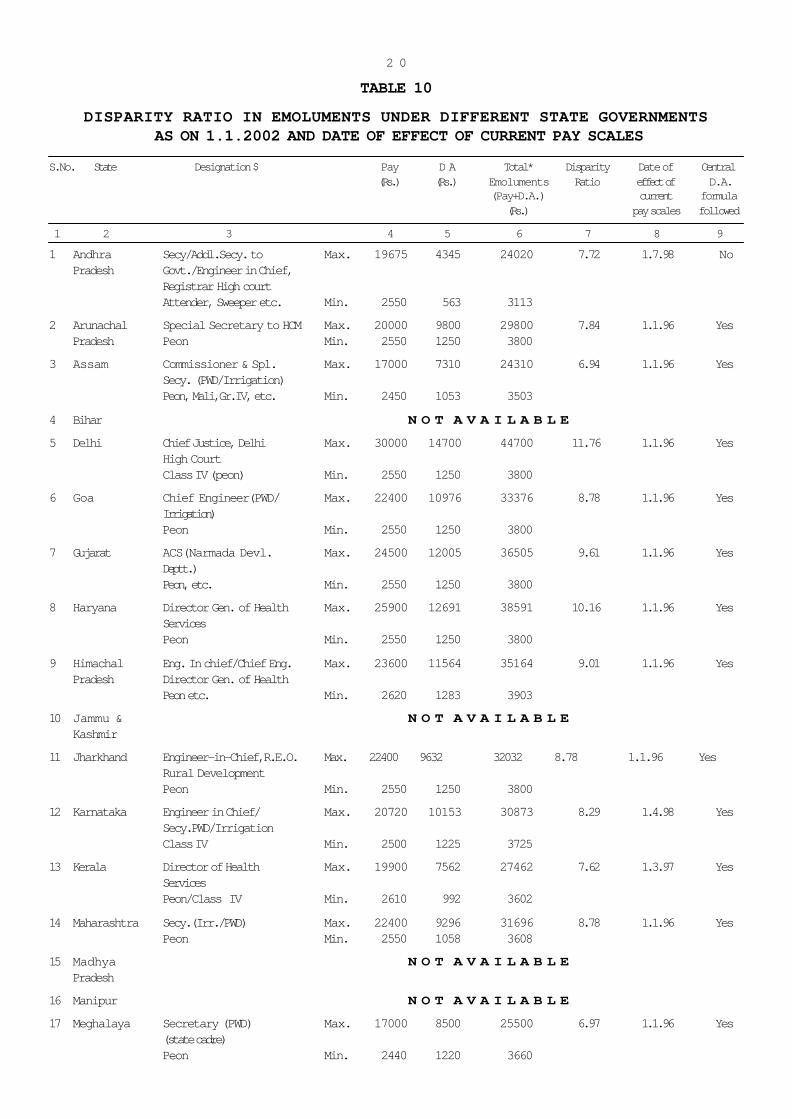
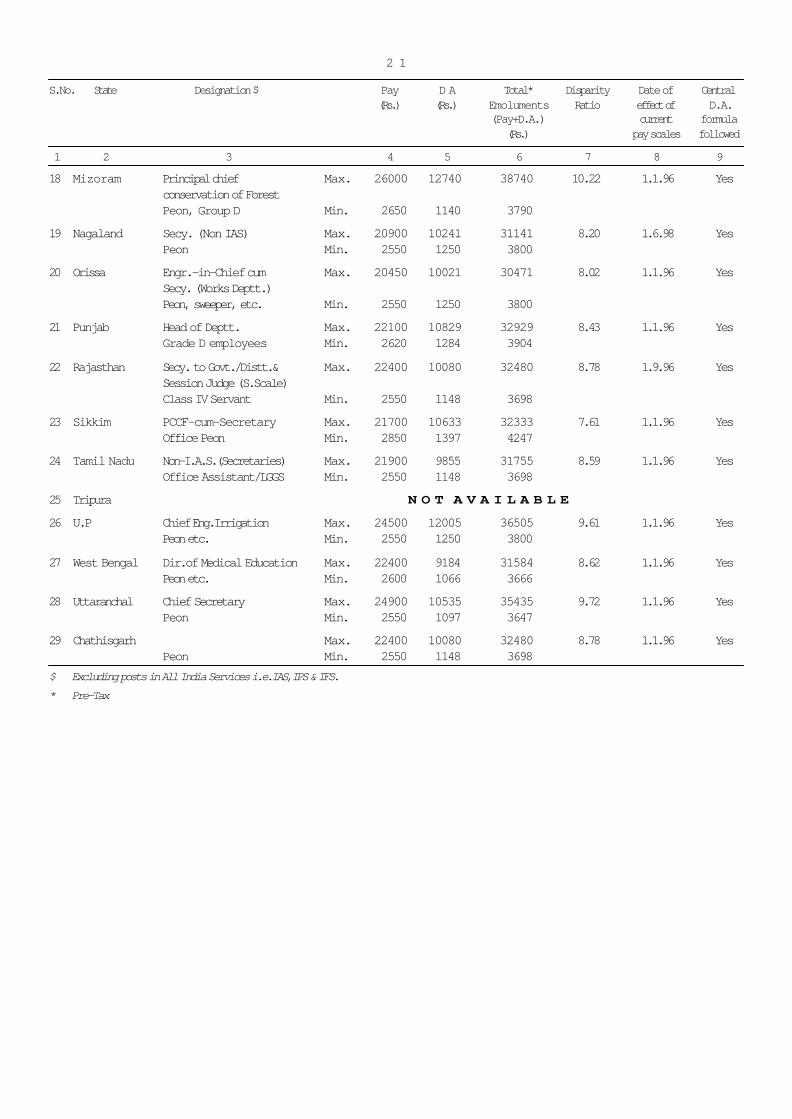
10 Disparity ratio in emoluments under different State Governments as on 1.1.2002and date of effect of current pay scales.
AnnexureI. Expenditure incurred on Pay and Allowances by the different Ministries/
Departments on their Civilian Regular Employees during 2001-2002.(vi)
11
12
12
13
13
13
14-15
16
16
17
17
18
19
19
20-21
22-23
Table Number Page
SALIENT FEATURES
1. The total expenditure on Pay and Allowances (excluding Productivity Linked Bonus /Ad-hoc Bonus,Honorarium, Encashment of Earned Leave and Travelling Allowance) for Central Government CivilianRegular employees including employees of the Union Territories was Rs.31407.26 Crore in 2001-2002 ascompared to Rs.33986.18 Crore in 2000-2001. Thus, there is decrease in expenditure by Rs.2578.92 Croreover the previous year, which in relative terms works out to 7.59 per cent. This decrease in the expenditureon pay and allowances over the previous year is primarily due to huge reduction in the strength of theDepartment of Telecommunications w.e.f. 1st Oct. 2000 consequent to the formation of BSNL.
2. Out of the total expenditure of Rs.31407 Crore, the percentage expenditure on Pay is 58.70, on DearnessAllowance 26.71, on House Rent Allowance (HRA) and Compensatory (City) Allowance (CCA) 6.62 andon other allowances 7.97 per cent.
3. The expenditure on Pay, DA and HRA plus CCA changed by (-) 11.51 percent, (+) 1.54 percent & (-) 7.74percent respectively as compared to the corresponding expenditure of the previous year.
4. The total expenditure on Pay and Allowances as percentage of total Revenue Receipts and total RevenueExpenditure for the year under report works out to 15.6 per cent and 10.4 per cent respectively. Last yearthese percentages were 17.6% & 12.2% respectively.
5. Of the total expenditure on Pay and Allowances, the Ministry of Railways continues to have the largestshare at 39.62 per cent, marginally up from 39.41 percent, in 2000-2001. The shares of the Ministry ofDefence and Home Affairs as also the Department of Posts have increased marginally over the previousyear. In respect of Department of Telecom, the share has undergone a fall from 5.82% in the previous yearto 0.07% in 2001-2002 for the reasons brought out in Para 1 above.
6. The disparity ratio at the minimum of the scale of lowest and maximum of the scale of highest paid CentralGovernment employees (Pay plus Dearness Allowance) as on 1.1.2003 is 1:11.76 which is the same asthat on 1.1.2002, 1.7.2002 .
7. In State Governments, the disparity ratio in emoluments (Pay plus DA) of lowest and highest paid StateGovt. employees as on 1.1.2002 is lowest in Assam at 6.94 and highest in Delhi being 11.76.
8. There were 419 Dispensaries under the Central Government Health Scheme as on March 2001 spreadover 18 Centres in the country. The annual costs per card holder and per beneficiary during 2000-2001 areRs.3083 and Rs.711 indicating an increase of 12.15per cent & 11.09 per cent respectively over thecorresponding figures of 1999-2000.
9. The new series of CPI has registered an increase of 59.09 per cent over 306.33 points up to June 2003.
10. The total number of Central Government (Civilian) Regular employees in position (excluding UnionTerritories) as on 1.03.2002 were 32.90 lakh as compared to 34.26 lakh as on 1.3.2001, thus, indicatinga decline of 1.36 lakh which in relative terms works out to be 3.97 per cent.
11. Of the total strength of 32.90 lakh, the percentage share of the Railways is 46.04, Home Affairs 21.06,Defence (Civilian) 10.75, Posts 8.30 and all other Ministries/Departments 13.85.
12. Of the total number of 36.33 lakh sanctioned posts 9.44 per cent of the posts were vacant as on 1.3.2002.
(vii)
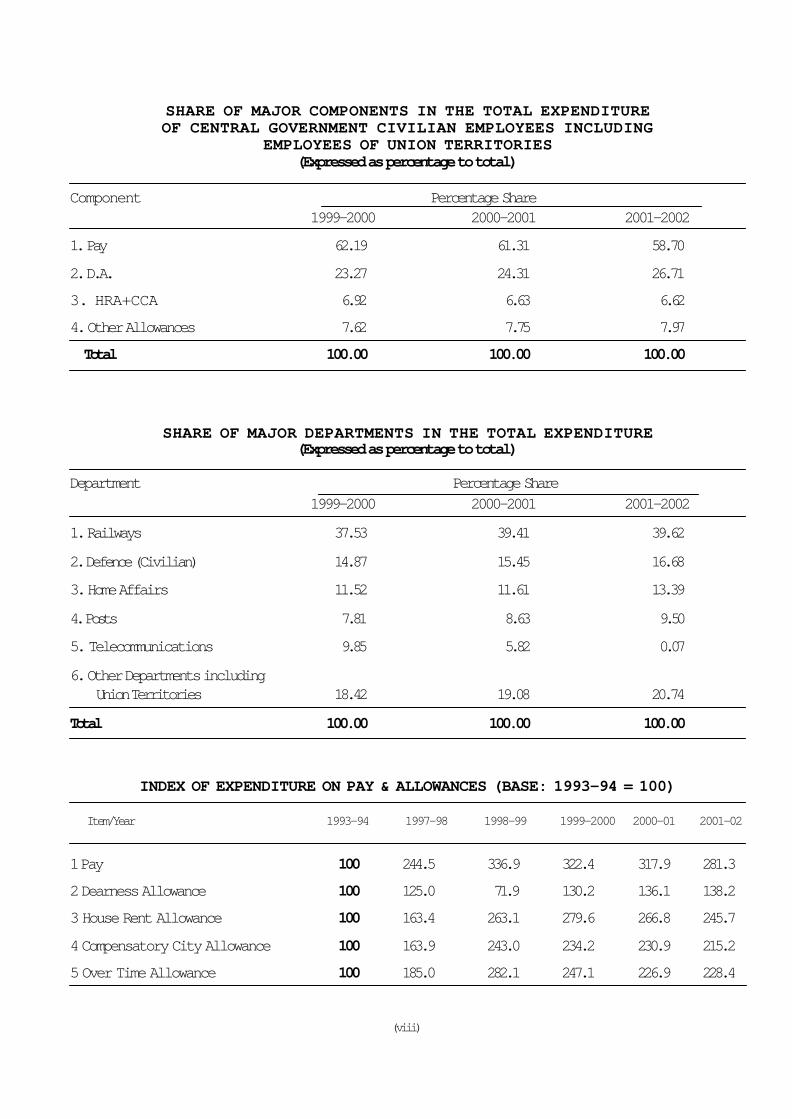
SHARE OF MAJOR COMPONENTS IN THE TOTAL EXPENDITUREOF CENTRAL GOVERNMENT CIVILIAN EMPLOYEES INCLUDING
EMPLOYEES OF UNION TERRITORIES(Expressed as percentage to total)
Component Percentage Share1999-2000 2000-2001 2001-2002
1. Pay 62.19 61.31 58.70
2. D.A. 23.27 24.31 26.71
3. HRA+CCA 6.92 6.63 6.62
4. Other Allowances 7.62 7.75 7.97
Total 100.00 100.00 100.00
SHARE OF MAJOR DEPARTMENTS IN THE TOTAL EXPENDITURE(Expressed as percentage to total)
Department Percentage Share1999-2000 2000-2001 2001-2002
1. Railways 37.53 39.41 39.62
2. Defence (Civilian) 14.87 15.45 16.68
3. Home Affairs 11.52 11.61 13.39
4. Posts 7.81 8.63 9.50
5. Telecommunications 9.85 5.82 0.07
6. Other Departments including Union Territories 18.42 19.08 20.74
Total 100.00 100.00 100.00
INDEX OF EXPENDITURE ON PAY & ALLOWANCES (BASE: 1993-94 = 100)
Item/Year 1993-94 1997-98 1998-99 1999-2000 2000-01 2001-02
1 Pay 100 244.5 336.9 322.4 317.9 281.3
2 Dearness Allowance 100 125.0 71.9 130.2 136.1 138.2
3 House Rent Allowance 100 163.4 263.1 279.6 266.8 245.7
4 Compensatory City Allowance 100 163.9 243.0 234.2 230.9 215.2
5 Over Time Allowance 100 185.0 282.1 247.1 226.9 228.4
(viii)
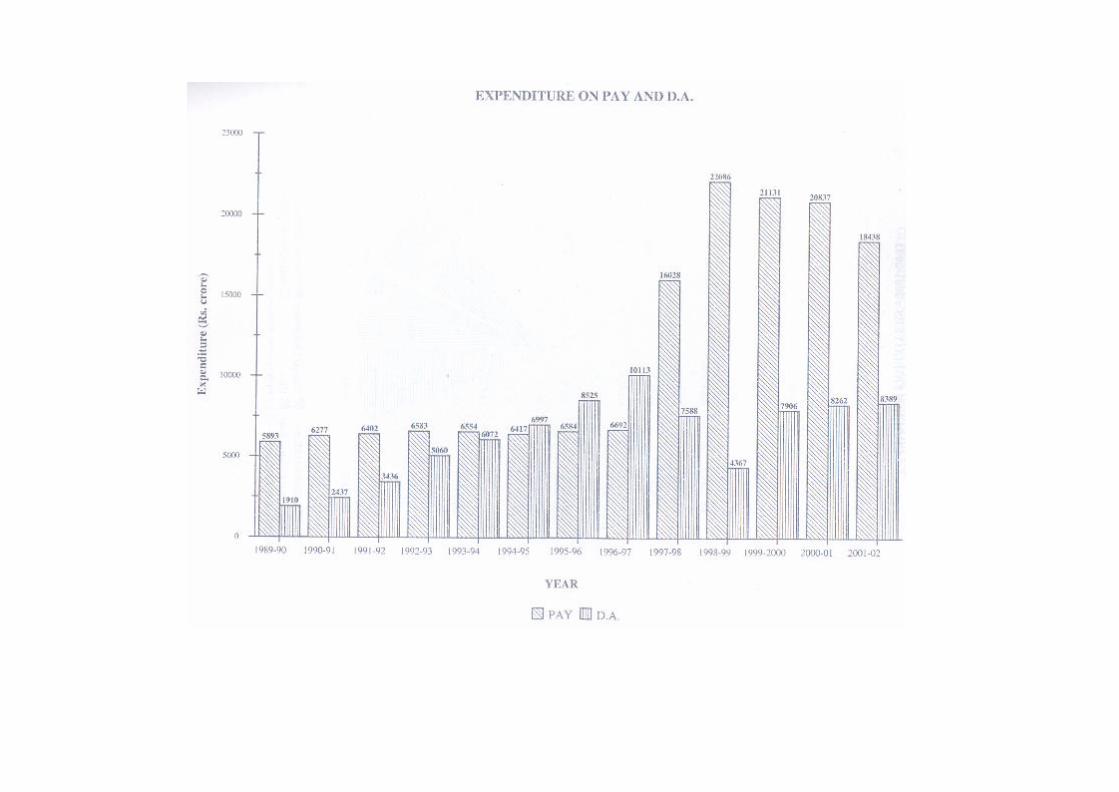
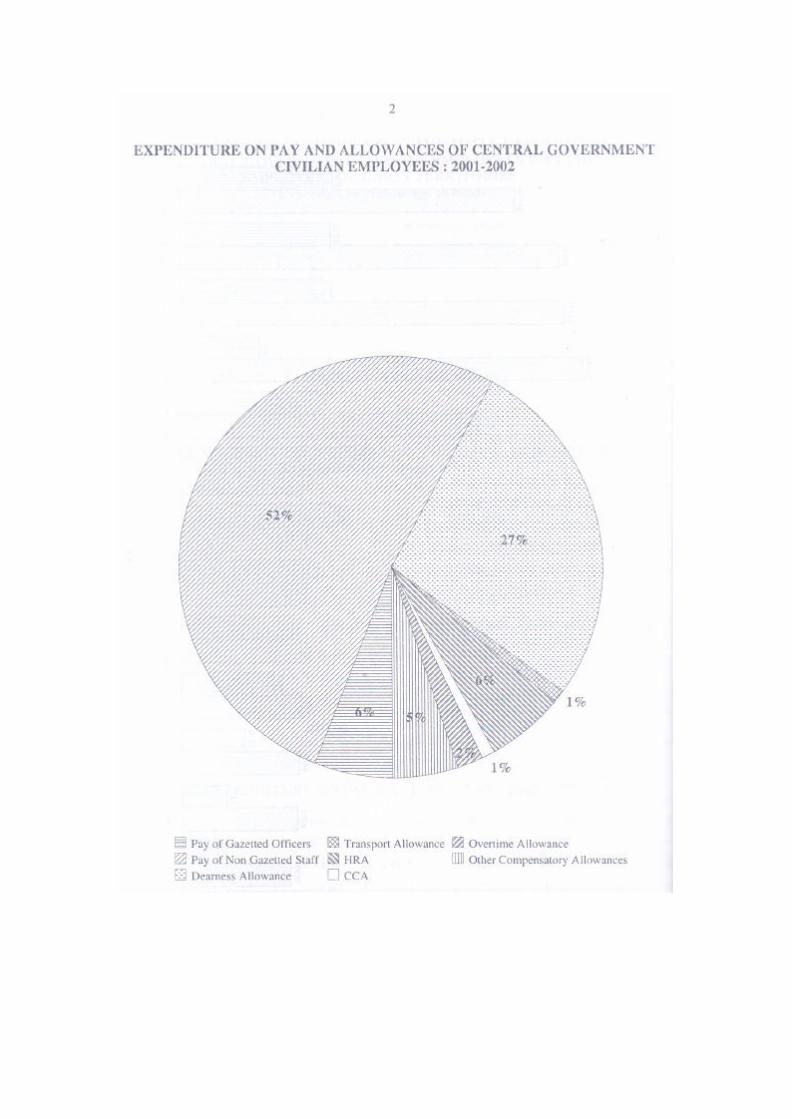
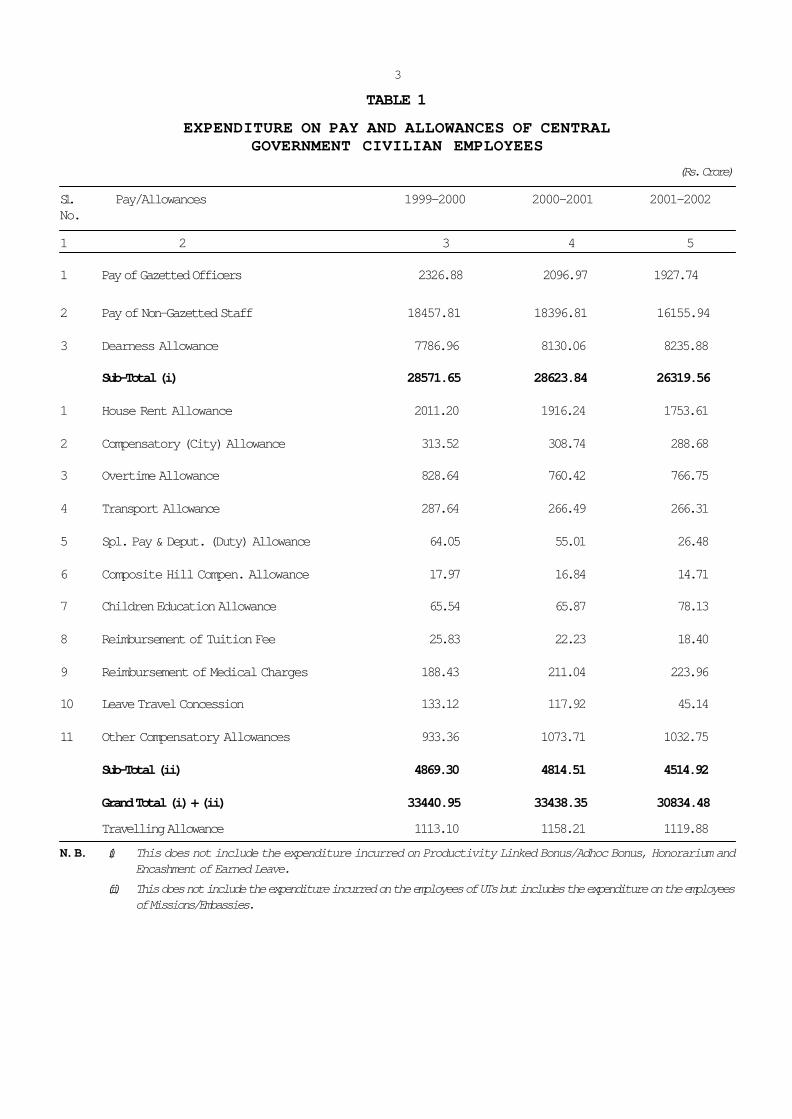
TABLE 1
EXPENDITURE ON PAY AND ALLOWANCES OF CENTRALGOVERNMENT CIVILIAN EMPLOYEES
(Rs. Crore)
Sl. Pay/Allowances 1999-2000 2000-2001 2001-2002No.
1 2 3 4 5
1 Pay of Gazetted Officers 2326.88 2096.97 1927.74
2 Pay of Non-Gazetted Staff 18457.81 18396.81 16155.94
3 Dearness Allowance 7786.96 8130.06 8235.88
Sub-Total (i) 28571.65 28623.84 26319.56
1 House Rent Allowance 2011.20 1916.24 1753.61
2 Compensatory (City) Allowance 313.52 308.74 288.68
3 Overtime Allowance 828.64 760.42 766.75
4 Transport Allowance 287.64 266.49 266.31
5 Spl. Pay & Deput. (Duty) Allowance 64.05 55.01 26.48
6 Composite Hill Compen. Allowance 17.97 16.84 14.71
7 Children Education Allowance 65.54 65.87 78.13
8 Reimbursement of Tuition Fee 25.83 22.23 18.40
9 Reimbursement of Medical Charges 188.43 211.04 223.96
10 Leave Travel Concession 133.12 117.92 45.14
11 Other Compensatory Allowances 933.36 1073.71 1032.75
Sub-Total (ii) 4869.30 4814.51 4514.92
Grand Total (i) + (ii) 33440.95 33438.35 30834.48
Travelling Allowance 1113.10 1158.21 1119.88
N. B. (i) This does not include the expenditure incurred on Productivity Linked Bonus/Adhoc Bonus, Honorarium andEncashment of Earned Leave.
(ii) This does not include the expenditure incurred on the employees of UTs but includes the expenditure on the employeesof Missions/Embassies.
3
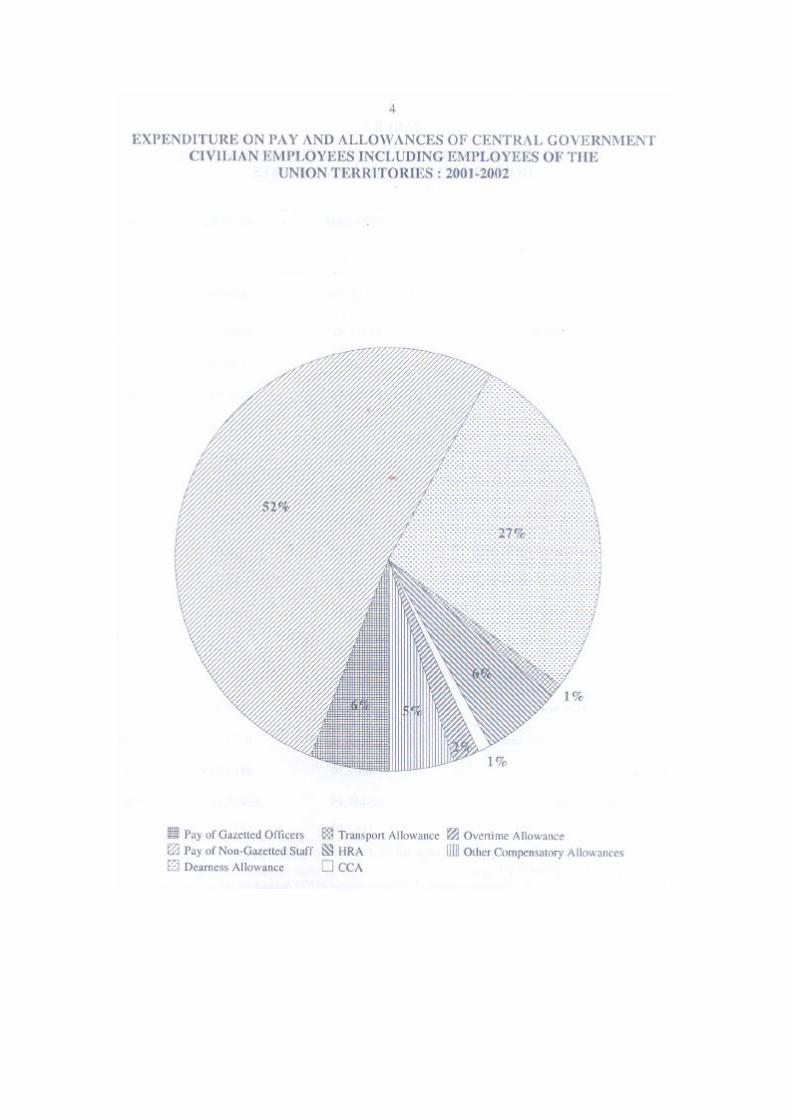
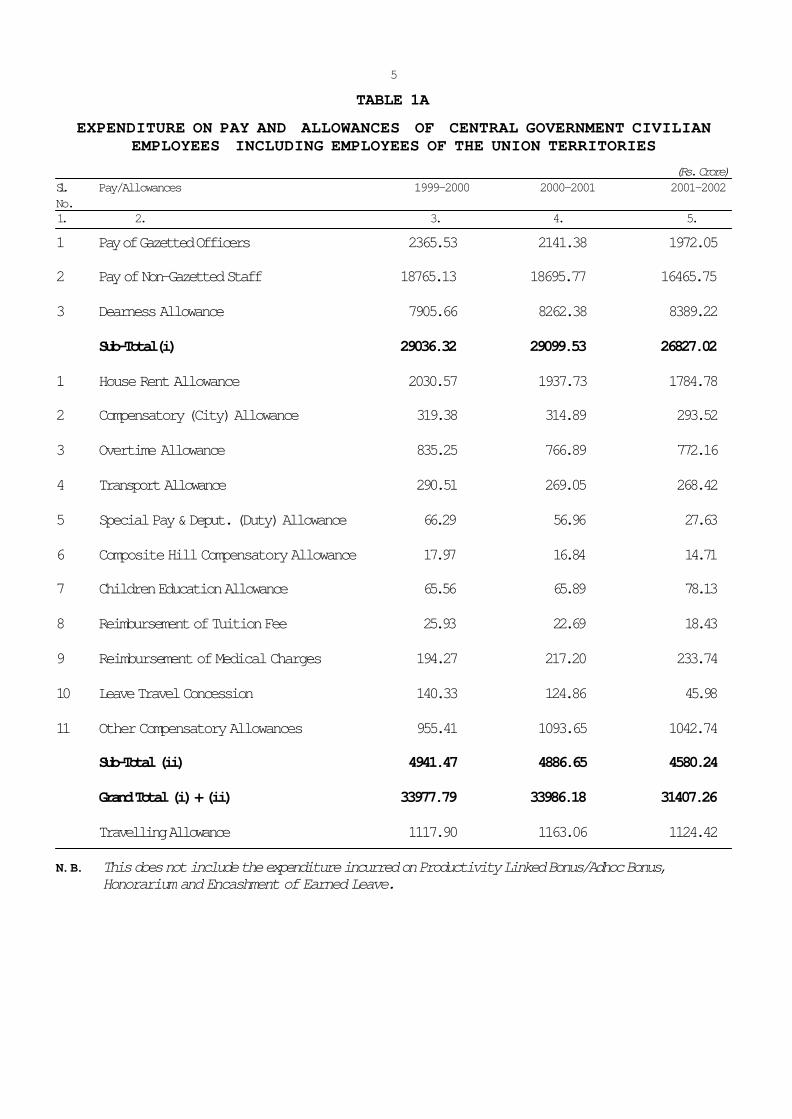
TABLE 1A
EXPENDITURE ON PAY AND ALLOWANCES OF CENTRAL GOVERNMENT CIVILIANEMPLOYEES INCLUDING EMPLOYEES OF THE UNION TERRITORIES
(Rs. Crore)Sl. Pay/Allowances 1999-2000 2000-2001 2001-2002No. 1. 2. 3. 4. 5.
1 Pay of Gazetted Officers 2365.53 2141.38 1972.05
2 Pay of Non-Gazetted Staff 18765.13 18695.77 16465.75
3 Dearness Allowance 7905.66 8262.38 8389.22
Sub-Total(i) 29036.32 29099.53 26827.02
1 House Rent Allowance 2030.57 1937.73 1784.78
2 Compensatory (City) Allowance 319.38 314.89 293.52
3 Overtime Allowance 835.25 766.89 772.16
4 Transport Allowance 290.51 269.05 268.42
5 Special Pay & Deput. (Duty) Allowance 66.29 56.96 27.63
6 Composite Hill Compensatory Allowance 17.97 16.84 14.71
7 Children Education Allowance 65.56 65.89 78.13
8 Reimbursement of Tuition Fee 25.93 22.69 18.43
9 Reimbursement of Medical Charges 194.27 217.20 233.74
10 Leave Travel Concession 140.33 124.86 45.98
11 Other Compensatory Allowances 955.41 1093.65 1042.74
Sub-Total (ii) 4941.47 4886.65 4580.24
Grand Total (i) + (ii) 33977.79 33986.18 31407.26
Travelling Allowance 1117.90 1163.06 1124.42
N. B. This does not include the expenditure incurred on Productivity Linked Bonus/Adhoc Bonus,Honorarium and Encashment of Earned Leave.
5
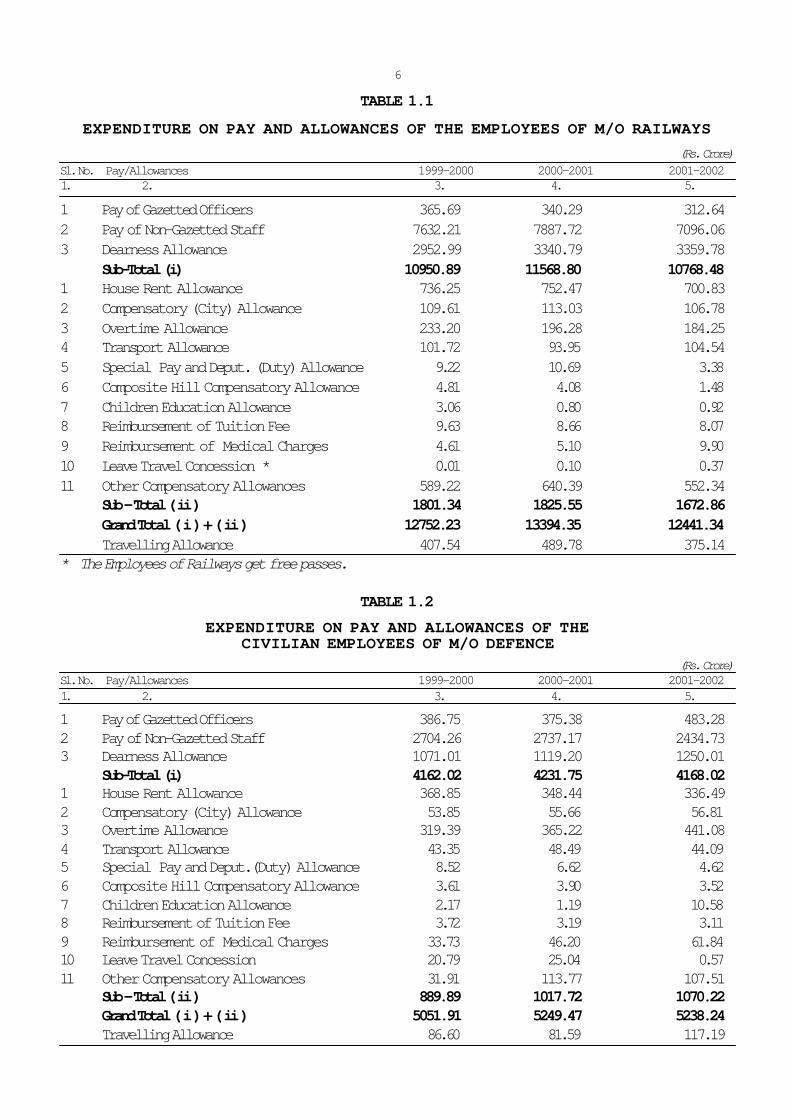
TABLE 1.1
EXPENDITURE ON PAY AND ALLOWANCES OF THE EMPLOYEES OF M/O RAILWAYS (Rs. Crore)
Sl. No. Pay/Allowances 1999-2000 2000-2001 2001-2002 1. 2. 3. 4. 5.
1 Pay of Gazetted Officers 365.69 340.29 312.642 Pay of Non-Gazetted Staff 7632.21 7887.72 7096.063 Dearness Allowance 2952.99 3340.79 3359.78
Sub-Total (i) 10950.89 11568.80 10768.481 House Rent Allowance 736.25 752.47 700.832 Compensatory (City) Allowance 109.61 113.03 106.783 Overtime Allowance 233.20 196.28 184.254 Transport Allowance 101.72 93.95 104.545 Special Pay and Deput. (Duty) Allowance 9.22 10.69 3.386 Composite Hill Compensatory Allowance 4.81 4.08 1.487 Children Education Allowance 3.06 0.80 0.928 Reimbursement of Tuition Fee 9.63 8.66 8.079 Reimbursement of Medical Charges 4.61 5.10 9.9010 Leave Travel Concession * 0.01 0.10 0.3711 Other Compensatory Allowances 589.22 640.39 552.34
Sub - Total ( ii ) 1801.34 1825.55 1672.86Grand Total ( i ) + ( ii ) 12752.23 13394.35 12441.34Travelling Allowance 407.54 489.78 375.14
* The Employees of Railways get free passes.
TABLE 1.2EXPENDITURE ON PAY AND ALLOWANCES OF THE
CIVILIAN EMPLOYEES OF M/O DEFENCE (Rs. Crore)
Sl. No. Pay/Allowances 1999-2000 2000-2001 2001-2002 1. 2. 3. 4. 5.
1 Pay of Gazetted Officers 386.75 375.38 483.282 Pay of Non-Gazetted Staff 2704.26 2737.17 2434.733 Dearness Allowance 1071.01 1119.20 1250.01
Sub-Total (i) 4162.02 4231.75 4168.021 House Rent Allowance 368.85 348.44 336.492 Compensatory (City) Allowance 53.85 55.66 56.813 Overtime Allowance 319.39 365.22 441.084 Transport Allowance 43.35 48.49 44.095 Special Pay and Deput.(Duty) Allowance 8.52 6.62 4.626 Composite Hill Compensatory Allowance 3.61 3.90 3.527 Children Education Allowance 2.17 1.19 10.588 Reimbursement of Tuition Fee 3.72 3.19 3.119 Reimbursement of Medical Charges 33.73 46.20 61.8410 Leave Travel Concession 20.79 25.04 0.5711 Other Compensatory Allowances 31.91 113.77 107.51
Sub - Total ( ii ) 889.89 1017.72 1070.22Grand Total ( i ) + ( ii ) 5051.91 5249.47 5238.24Travelling Allowance 86.60 81.59 117.19
6
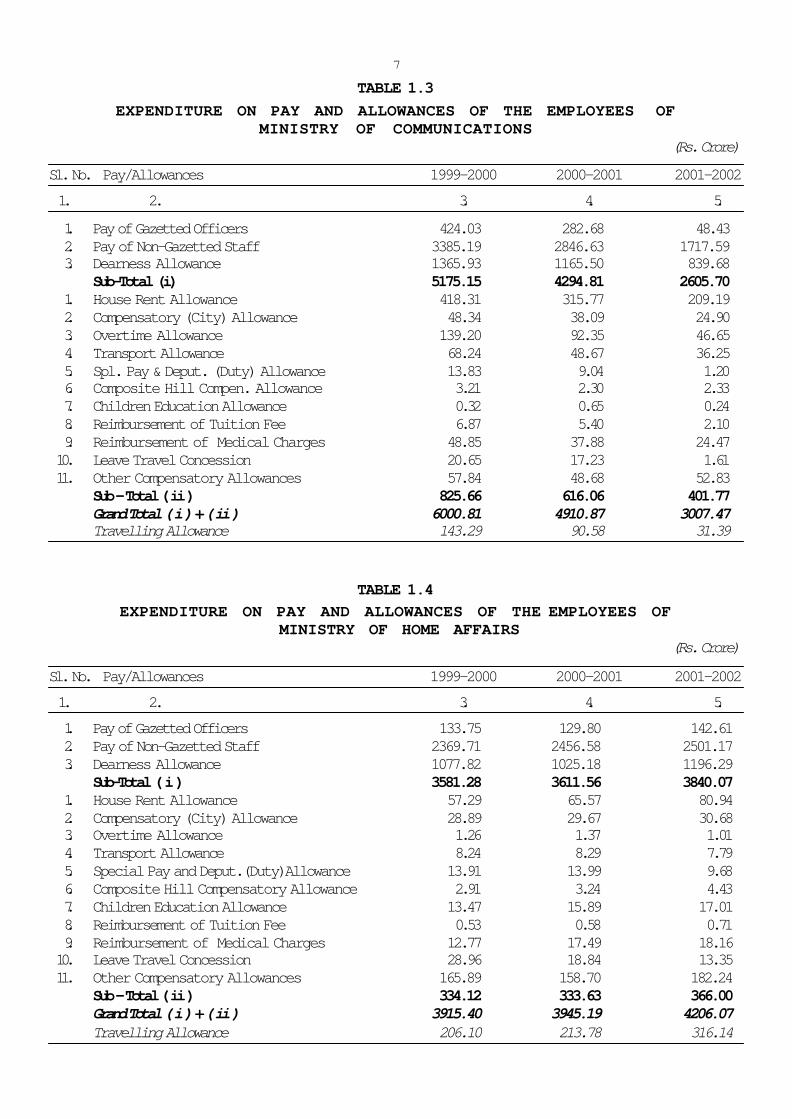
TABLE 1.3EXPENDITURE ON PAY AND ALLOWANCES OF THE EMPLOYEES OF
MINISTRY OF COMMUNICATIONS(Rs. Crore)
Sl. No. Pay/Allowances 1999-2000 2000-2001 2001-2002 1. 2. 3. 4. 5.
1. Pay of Gazetted Officers 424.03 282.68 48.432. Pay of Non-Gazetted Staff 3385.19 2846.63 1717.593. Dearness Allowance 1365.93 1165.50 839.68
Sub-Total (i) 5175.15 4294.81 2605.701. House Rent Allowance 418.31 315.77 209.192. Compensatory (City) Allowance 48.34 38.09 24.903. Overtime Allowance 139.20 92.35 46.654. Transport Allowance 68.24 48.67 36.255. Spl. Pay & Deput. (Duty) Allowance 13.83 9.04 1.206. Composite Hill Compen. Allowance 3.21 2.30 2.337. Children Education Allowance 0.32 0.65 0.248. Reimbursement of Tuition Fee 6.87 5.40 2.109. Reimbursement of Medical Charges 48.85 37.88 24.4710. Leave Travel Concession 20.65 17.23 1.6111. Other Compensatory Allowances 57.84 48.68 52.83
Sub - Total ( ii ) 825.66 616.06 401.77Grand Total ( i ) + ( ii ) 6000.81 4910.87 3007.47Travelling Allowance 143.29 90.58 31.39
TABLE 1.4EXPENDITURE ON PAY AND ALLOWANCES OF THE EMPLOYEES OF
MINISTRY OF HOME AFFAIRS(Rs. Crore)
Sl. No. Pay/Allowances 1999-2000 2000-2001 2001-2002 1. 2. 3. 4. 5.1. Pay of Gazetted Officers 133.75 129.80 142.612. Pay of Non-Gazetted Staff 2369.71 2456.58 2501.173. Dearness Allowance 1077.82 1025.18 1196.29
Sub-Total ( i ) 3581.28 3611.56 3840.071. House Rent Allowance 57.29 65.57 80.942. Compensatory (City) Allowance 28.89 29.67 30.683. Overtime Allowance 1.26 1.37 1.014. Transport Allowance 8.24 8.29 7.795. Special Pay and Deput.(Duty)Allowance 13.91 13.99 9.686. Composite Hill Compensatory Allowance 2.91 3.24 4.437. Children Education Allowance 13.47 15.89 17.018. Reimbursement of Tuition Fee 0.53 0.58 0.719. Reimbursement of Medical Charges 12.77 17.49 18.1610. Leave Travel Concession 28.96 18.84 13.3511. Other Compensatory Allowances 165.89 158.70 182.24
Sub - Total ( ii ) 334.12 333.63 366.00Grand Total ( i ) + ( ii ) 3915.40 3945.19 4206.07Travelling Allowance 206.10 213.78 316.14
7
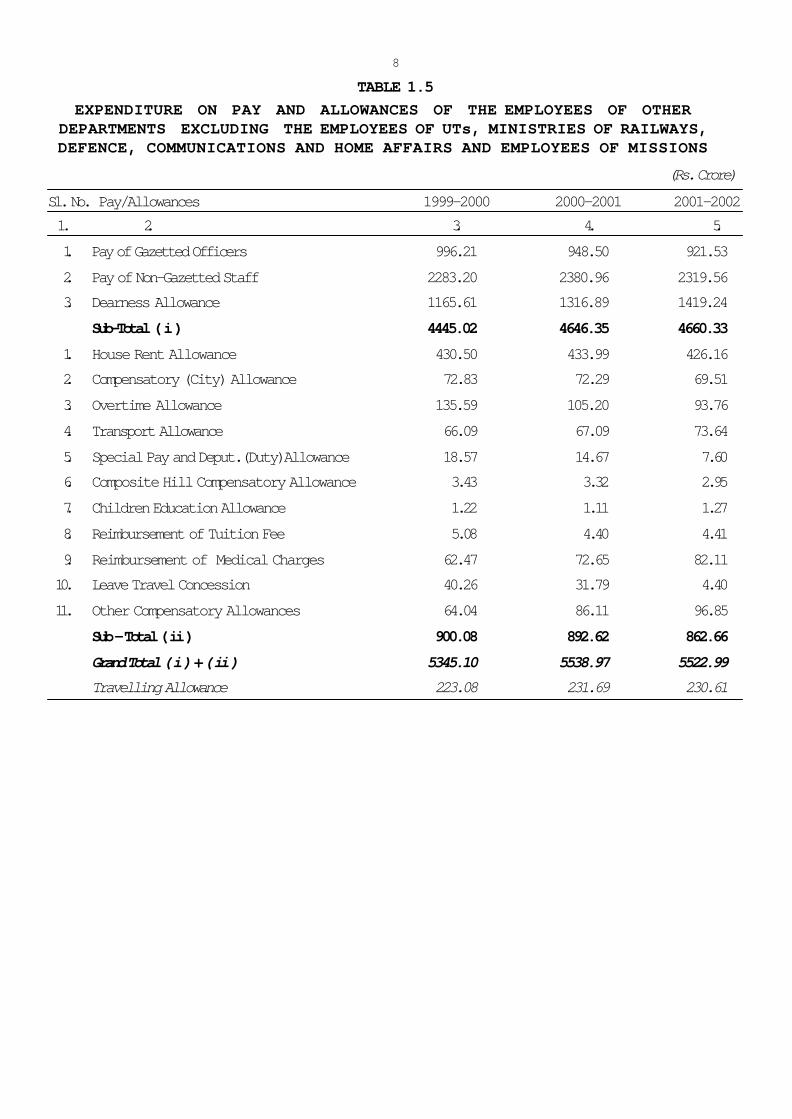
TABLE 1.5EXPENDITURE ON PAY AND ALLOWANCES OF THE EMPLOYEES OF OTHER
DEPARTMENTS EXCLUDING THE EMPLOYEES OF UTs, MINISTRIES OF RAILWAYS,DEFENCE, COMMUNICATIONS AND HOME AFFAIRS AND EMPLOYEES OF MISSIONS
(Rs. Crore)
Sl. No. Pay/Allowances 1999-2000 2000-2001 2001-2002 1. 2. 3. 4. 5.1. Pay of Gazetted Officers 996.21 948.50 921.532. Pay of Non-Gazetted Staff 2283.20 2380.96 2319.563. Dearness Allowance 1165.61 1316.89 1419.24
Sub-Total ( i ) 4445.02 4646.35 4660.331. House Rent Allowance 430.50 433.99 426.162. Compensatory (City) Allowance 72.83 72.29 69.513. Overtime Allowance 135.59 105.20 93.764. Transport Allowance 66.09 67.09 73.645. Special Pay and Deput.(Duty)Allowance 18.57 14.67 7.606. Composite Hill Compensatory Allowance 3.43 3.32 2.957. Children Education Allowance 1.22 1.11 1.278. Reimbursement of Tuition Fee 5.08 4.40 4.419. Reimbursement of Medical Charges 62.47 72.65 82.1110. Leave Travel Concession 40.26 31.79 4.4011. Other Compensatory Allowances 64.04 86.11 96.85
Sub - Total ( ii ) 900.08 892.62 862.66Grand Total ( i ) + ( ii ) 5345.10 5538.97 5522.99Travelling Allowance 223.08 231.69 230.61
8
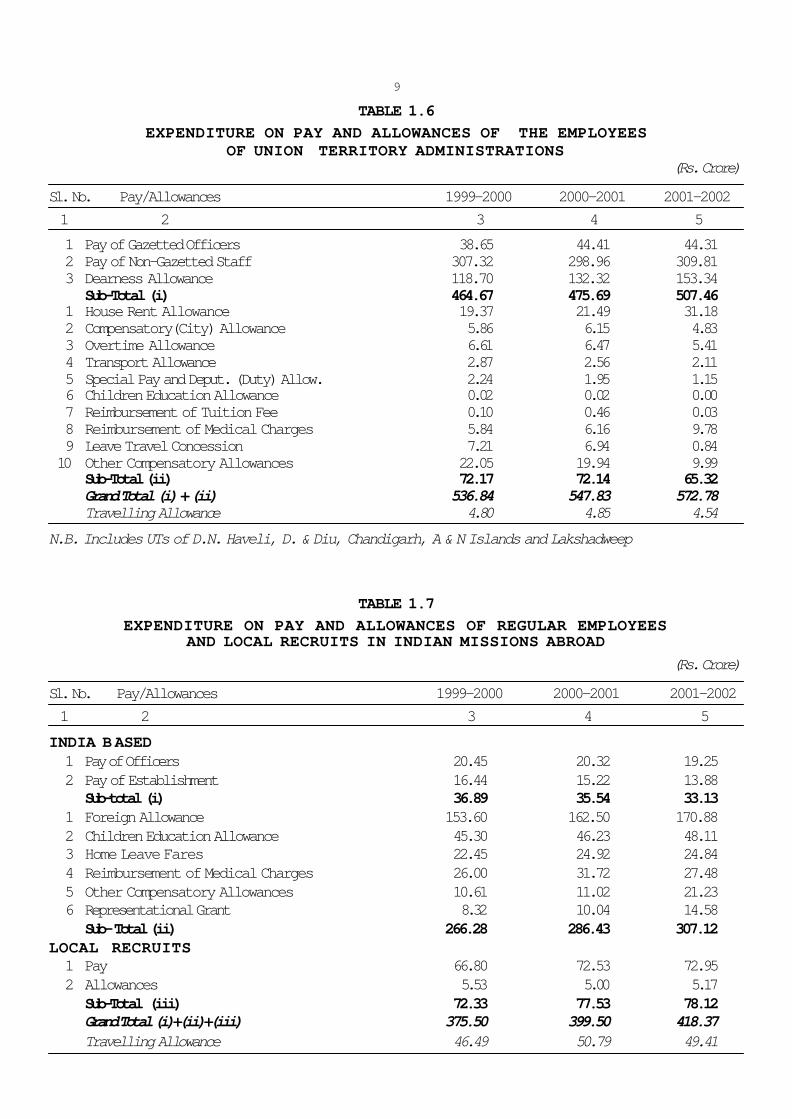
TABLE 1.6EXPENDITURE ON PAY AND ALLOWANCES OF THE EMPLOYEES
OF UNION TERRITORY ADMINISTRATIONS (Rs. Crore)
Sl. No. Pay/Allowances 1999-2000 2000-2001 2001-2002 1 2 3 4 51 Pay of Gazetted Officers 38.65 44.41 44.312 Pay of Non-Gazetted Staff 307.32 298.96 309.813 Dearness Allowance 118.70 132.32 153.34
Sub-Total (i) 464.67 475.69 507.461 House Rent Allowance 19.37 21.49 31.182 Compensatory(City) Allowance 5.86 6.15 4.833 Overtime Allowance 6.61 6.47 5.414 Transport Allowance 2.87 2.56 2.115 Special Pay and Deput. (Duty) Allow. 2.24 1.95 1.156 Children Education Allowance 0.02 0.02 0.007 Reimbursement of Tuition Fee 0.10 0.46 0.038 Reimbursement of Medical Charges 5.84 6.16 9.789 Leave Travel Concession 7.21 6.94 0.8410 Other Compensatory Allowances 22.05 19.94 9.99
Sub-Total (ii) 72.17 72.14 65.32Grand Total (i) + (ii) 536.84 547.83 572.78Travelling Allowance 4.80 4.85 4.54
N.B. Includes UTs of D.N. Haveli, D. & Diu, Chandigarh, A & N Islands and Lakshadweep
TABLE 1.7EXPENDITURE ON PAY AND ALLOWANCES OF REGULAR EMPLOYEES
AND LOCAL RECRUITS IN INDIAN MISSIONS ABROAD (Rs. Crore)
Sl. No. Pay/Allowances 1999-2000 2000-2001 2001-2002 1 2 3 4 5INDIA BASED1 Pay of Officers 20.45 20.32 19.252 Pay of Establishment 16.44 15.22 13.88
Sub-total (i) 36.89 35.54 33.131 Foreign Allowance 153.60 162.50 170.882 Children Education Allowance 45.30 46.23 48.113 Home Leave Fares 22.45 24.92 24.844 Reimbursement of Medical Charges 26.00 31.72 27.485 Other Compensatory Allowances 10.61 11.02 21.236 Representational Grant 8.32 10.04 14.58
Sub- Total (ii) 266.28 286.43 307.12LOCAL RECRUITS1 Pay 66.80 72.53 72.952 Allowances 5.53 5.00 5.17
Sub-Total (iii) 72.33 77.53 78.12Grand Total (i)+(ii)+(iii) 375.50 399.50 418.37Travelling Allowance 46.49 50.79 49.41
9
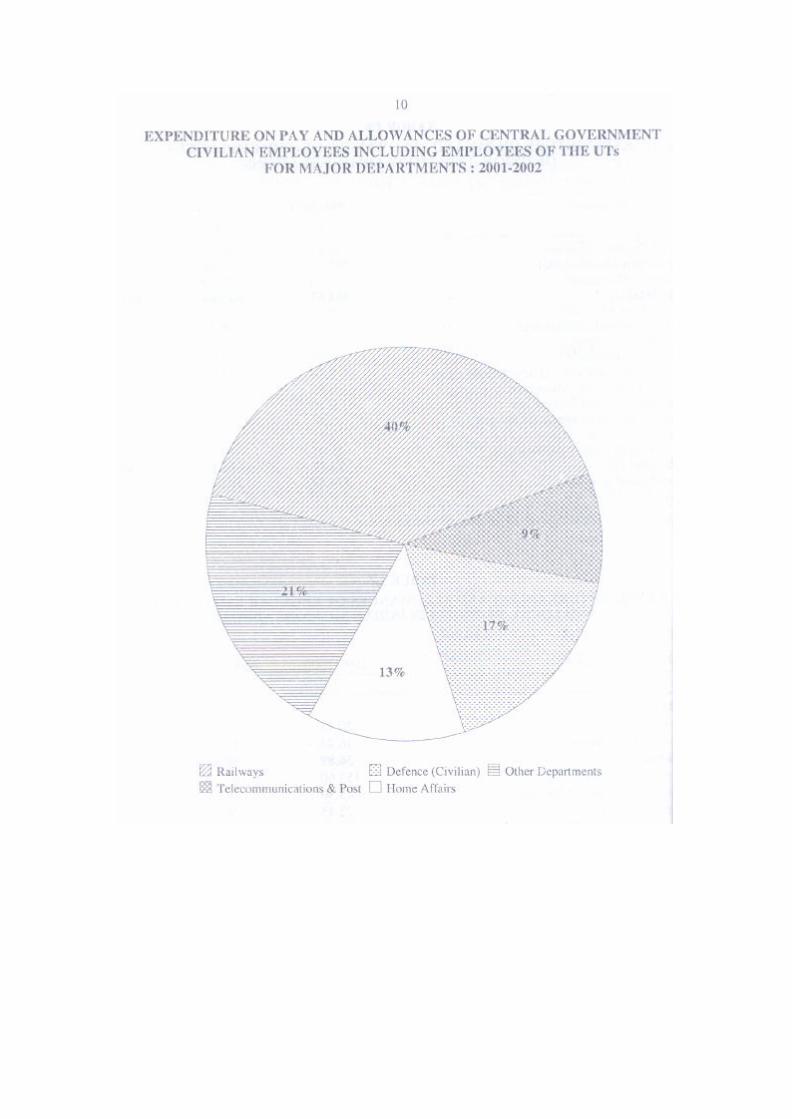
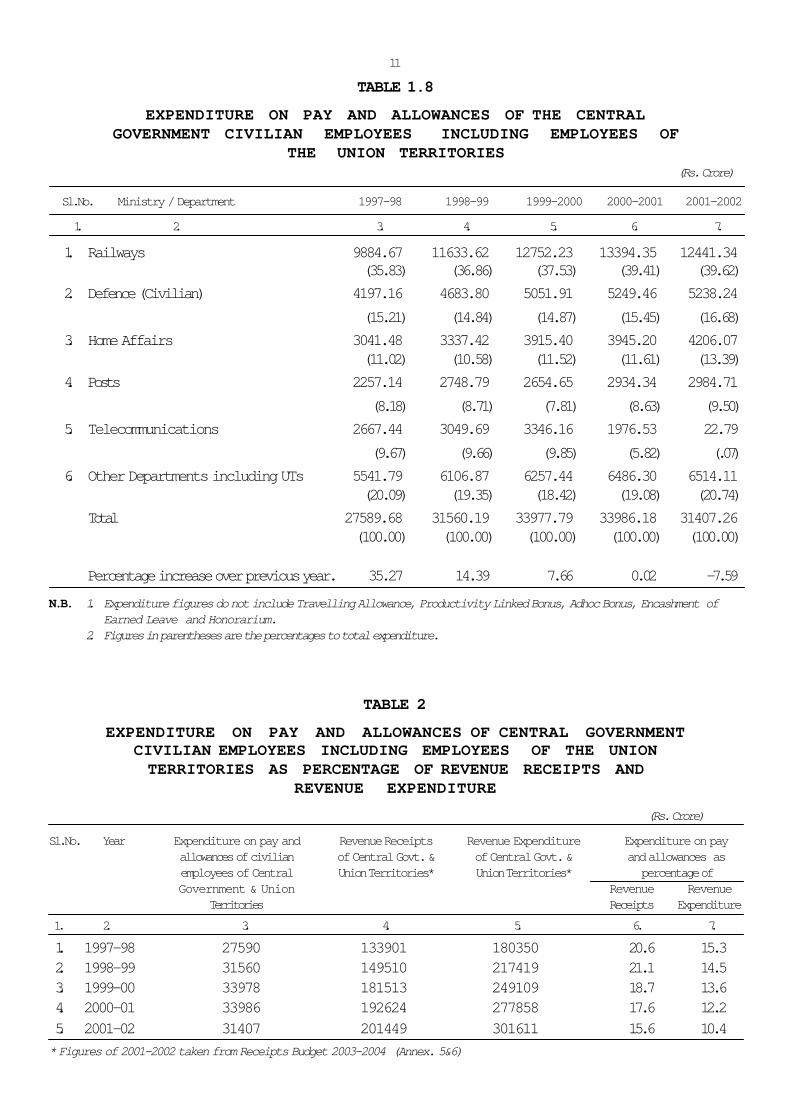
TABLE 1.8
EXPENDITURE ON PAY AND ALLOWANCES OF THE CENTRALGOVERNMENT CIVILIAN EMPLOYEES INCLUDING EMPLOYEES OF
THE UNION TERRITORIES(Rs. Crore)
Sl.No. Ministry / Department 1997-98 1998-99 1999-2000 2000-2001 2001-2002
1. 2. 3. 4. 5. 6. 7.
1. Railways 9884.67 11633.62 12752.23 13394.35 12441.34(35.83) (36.86) (37.53) (39.41) (39.62)
2. Defence (Civilian) 4197.16 4683.80 5051.91 5249.46 5238.24(15.21) (14.84) (14.87) (15.45) (16.68)
3. Home Affairs 3041.48 3337.42 3915.40 3945.20 4206.07(11.02) (10.58) (11.52) (11.61) (13.39)
4. Posts 2257.14 2748.79 2654.65 2934.34 2984.71(8.18) (8.71) (7.81) (8.63) (9.50)
5. Telecommunications 2667.44 3049.69 3346.16 1976.53 22.79(9.67) (9.66) (9.85) (5.82) (.07)
6. Other Departments including UTs 5541.79 6106.87 6257.44 6486.30 6514.11(20.09) (19.35) (18.42) (19.08) (20.74)
Total 27589.68 31560.19 33977.79 33986.18 31407.26(100.00) (100.00) (100.00) (100.00) (100.00)
Percentage increase over previous year. 35.27 14.39 7.66 0.02 -7.59
N.B. 1. Expenditure figures do not include Travelling Allowance, Productivity Linked Bonus, Adhoc Bonus, Encashment ofEarned Leave and Honorarium.
2. Figures in parentheses are the percentages to total expenditure.
TABLE 2
EXPENDITURE ON PAY AND ALLOWANCES OF CENTRAL GOVERNMENTCIVILIAN EMPLOYEES INCLUDING EMPLOYEES OF THE UNIONTERRITORIES AS PERCENTAGE OF REVENUE RECEIPTS AND
REVENUE EXPENDITURE
(Rs. Crore)
Sl.No. Year Expenditure on pay and Revenue Receipts Revenue Expenditure Expenditure on payallowances of civilian of Central Govt. & of Central Govt. & and allowances asemployees of Central Union Territories* Union Territories* percentage ofGovernment & Union Revenue Revenue
Territories Receipts Expenditure 1. 2. 3. 4. 5. 6. 7.
1. 1997-98 27590 133901 180350 20.6 15.32. 1998-99 31560 149510 217419 21.1 14.53. 1999-00 33978 181513 249109 18.7 13.64. 2000-01 33986 192624 277858 17.6 12.25. 2001-02 31407 201449 301611 15.6 10.4* Figures of 2001-2002 taken from Receipts Budget 2003-2004 (Annex. 5&6)
11
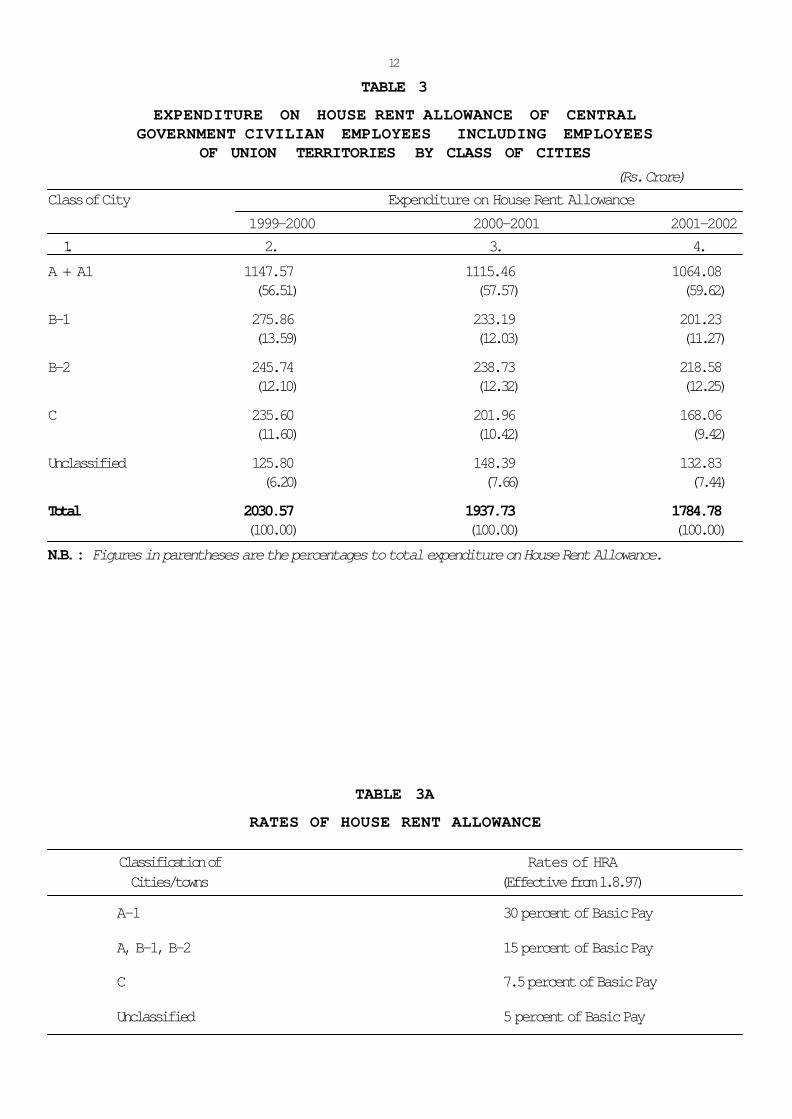
TABLE 3
EXPENDITURE ON HOUSE RENT ALLOWANCE OF CENTRALGOVERNMENT CIVILIAN EMPLOYEES INCLUDING EMPLOYEES
OF UNION TERRITORIES BY CLASS OF CITIES (Rs. Crore)
Class of City Expenditure on House Rent Allowance1999-2000 2000-2001 2001-2002
1. 2. 3. 4.A + A1 1147.57 1115.46 1064.08
(56.51) (57.57) (59.62)
B-1 275.86 233.19 201.23(13.59) (12.03) (11.27)
B-2 245.74 238.73 218.58(12.10) (12.32) (12.25)
C 235.60 201.96 168.06 (11.60) (10.42) (9.42)
Unclassified 125.80 148.39 132.83(6.20) (7.66) (7.44)
Total 2030.57 1937.73 1784.78 (100.00) (100.00) (100.00)
N.B. : Figures in parentheses are the percentages to total expenditure on House Rent Allowance.
TABLE 3A
RATES OF HOUSE RENT ALLOWANCE
Classification of Rates of HRACities/towns (Effective from 1.8.97)
A-1 30 percent of Basic Pay
A, B-1, B-2 15 percent of Basic Pay
C 7.5 percent of Basic Pay
Unclassified 5 percent of Basic Pay
12
13
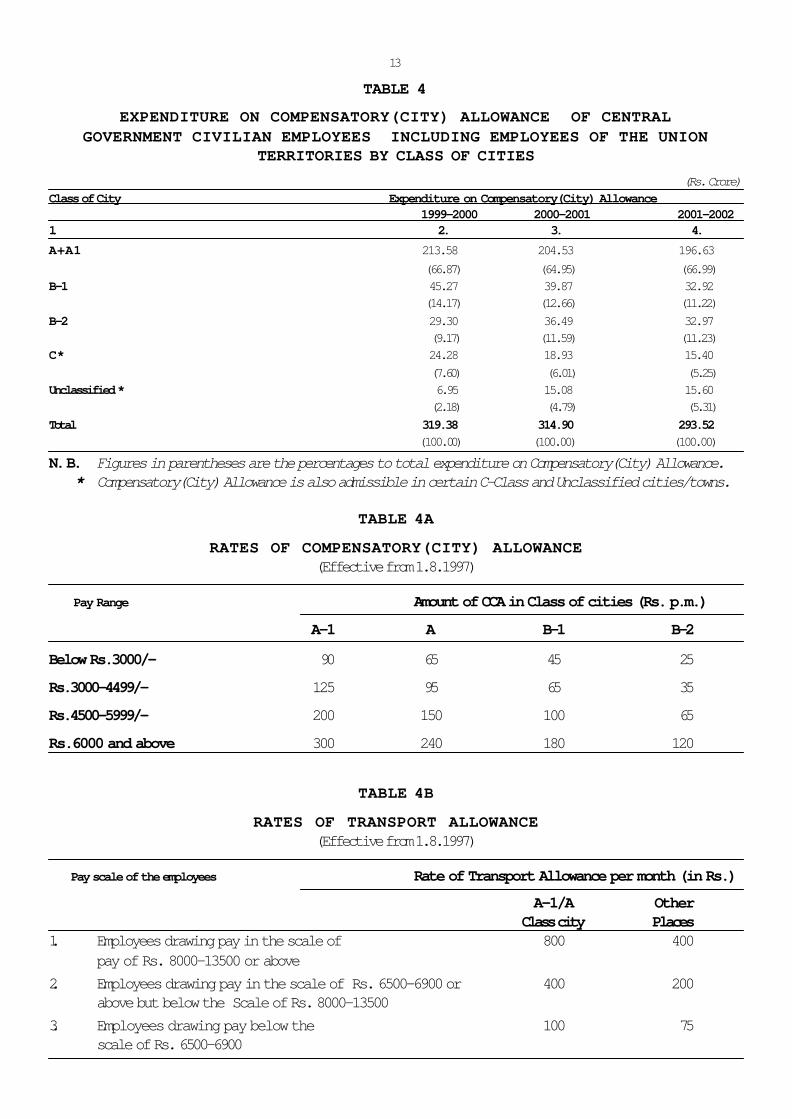
TABLE 4
EXPENDITURE ON COMPENSATORY(CITY) ALLOWANCE OF CENTRALGOVERNMENT CIVILIAN EMPLOYEES INCLUDING EMPLOYEES OF THE UNION
TERRITORIES BY CLASS OF CITIES (Rs. Crore)
Class of City Expenditure on Compensatory(City) Allowance1999-2000 2000-2001 2001-2002
1. 2. 3. 4.A+A1 213.58 204.53 196.63
(66.87) (64.95) (66.99)B-1 45.27 39.87 32.92
(14.17) (12.66) (11.22)B-2 29.30 36.49 32.97
(9.17) (11.59) (11.23)C* 24.28 18.93 15.40
(7.60) (6.01) (5.25)Unclassified * 6.95 15.08 15.60
(2.18) (4.79) (5.31)Total 319.38 314.90 293.52
(100.00) (100.00) (100.00)
N. B. Figures in parentheses are the percentages to total expenditure on Compensatory(City) Allowance. * Compensatory(City) Allowance is also admissible in certain C-Class and Unclassified cities/towns.
TABLE 4A
RATES OF COMPENSATORY(CITY) ALLOWANCE(Effective from 1.8.1997)
Pay Range Amount of CCA in Class of cities (Rs. p.m.)
A-1 A B-1 B-2
Below Rs.3000/- 90 65 45 25
Rs.3000-4499/- 125 95 65 35
Rs.4500-5999/- 200 150 100 65
Rs.6000 and above 300 240 180 120
TABLE 4B
RATES OF TRANSPORT ALLOWANCE(Effective from 1.8.1997)
Pay scale of the employees Rate of Transport Allowance per month (in Rs.)
A-1/A OtherClass city Places
1. Employees drawing pay in the scale of 800 400pay of Rs. 8000-13500 or above
2. Employees drawing pay in the scale of Rs. 6500-6900 or 400 200above but below the Scale of Rs. 8000-13500
3. Employees drawing pay below the 100 75scale of Rs. 6500-6900
1 4
TABLE 5.1
GROUP-WISE AND STATUS (G/NG) WISE ESTIMATED NUMBER OF CENTRALGOVERNMENT CIVILIAN REGULAR EMPLOYEES AS ON 1.3.2002
Number of Sanctioned Posts Number in PositionSl. Ministry/Deptt.No. A(G)* B(G) B(NG) C(NG) D(NG) Uncl- Total A(G)* B(G) B(NG) C(NG) D(NG) Uncl- Total
assi- assi-fied fied
1 2 3 4 5 6 7 8 9 10 11 12 13 14 15 16
1. Agriculture & 1228 1121 1174 5878 2924 - 12325 1224 1120 1163 5867 2900 - 12274Cooperationand AnimalHusbandry& Dairying
2. Agri. Research 13 3 8 14 6 - 44 13 2 7 14 6 - 42and Education
3. Atomic Energy 8967 859 6972 13880 4612 - 35290 8538 840 6700 12536 4129 - 327434. Bio-Technology 42 22 30 82 43 - 219 51 8 29 62 43 - 1935. Cabinet Secretariat 45 10 53 102 72 - 282 41 9 52 94 64 - 2606. Chemicals and 70 30 44 89 67 - 300 60 30 42 76 62 - 270
Petrochemicals7. Civil Aviation 345 101 149 788 310 - 1693 267 78 145 661 278 - 14298. Consumer Affairs 174 62 189 421 287 - 1133 136 62 141 309 260 - 9089. Coal 33 25 54 252 113 - 477 28 23 43 187 90 - 37110. Commerce & 649 776 638 4698 1819 - 8580 499 652 542 3778 1541 - 7012
Supply11. Company Affairs 313 112 375 1347 363 - 2510 230 70 266 1123 341 - 203012. Culture 447 465 799 3450 8639 - 13800 332 405 630 2730 8411 - 1250813. Defence 1367514913 17729 246079 180837 - 473233 12196 14188 13382 185641 128334 - 353741
(Civilian)14. Economic Affairs 558 467 676 4042 1678 17958 25379 428 415 620 3588 1311 12597 1895915. Education 257 172 361 735 372 - 1897 200 161 317 610 354 - 164216. Election
Commission 34 44 77 148 87 - 390 30 37 77 113 79 - 33617. Information Tech. 1358 1241 343 2226 548 - 5716 2432 750 740 848 441 - 521118. Environment &
Forests 577 299 444 1835 1758 - 4913 414 165 272 1694 1641 - 418619. Expenditure 257 154 156 486 270 - 1323 205 147 142 395 253 - 114220. External Affairs 952 698 1440 2780 1165 - 7035 866 680 1386 2324 1120 - 637621. Fertilizers 45 45 70 120 70 - 350 43 44 70 105 69 - 33122. Food & Public
Distn. 150 90 233 742 515 - 1730 133 90 222 600 468 - 151324. Food Processing 56 37 24 90 35 - 242 48 33 27 71 33 - 212
Industries25. Health & Family 3105 779 1556 10898 9340 260 25938 2566 700 1168 9807 8872 236 23349
Welfare26. Heavy Industries 21 28 39 74 45 - 207 21 28 39 70 45 - 20327. Home Affairs 12735 5953 18335 637101 52164 - 726288 9656 5563 15738 611328 50528 - 69281328. Indian Audit & 70713951 3117 46760 6147 - 70682 552 12202 4046 36604 5169 - 58573
Accounts29. Industrial Policy 468 250 318 1654 1071 - 3761 343 226 283 1475 1005 - 3332
& Promotion
1 5
1 2 3 4 5 6 7 8 9 10 11 12 13 14 15 16
30. Information & 483 810 440 3964 1908 - 7605 362 717 400 3375 1677 - 6531Broadcasting
31. Labour 1295 1121 400 5007 2321 - 10144 984 825 348 4312 2136 - 860532. Law & Justice 449 279 193 800 519 - 2240 364 230 150 708 483 - 193533. Mines 2709 912 1176 9432 4237 - 18466 2083 720 841 7630 3638 - 14912
34. Non Conventional 97 30 50 150 84 - 411 99 30 48 141 82 - 400Energy Sources
35. Ocean Development 43 12 30 63 33 - 181 34 12 27 54 32 - 15936. Parliamentary Affairs17 19 31 55 34 - 156 15 18 31 55 34 - 15337. Personnel, Public 819 526 512 5565 1017 - 8439 624 460 455 4850 947 - 7336
Grievances &Pensions
38. Petroleum and 39 45 63 110 82 - 339 48 32 60 100 75 - 315Natural Gas
39. Planning Comm. 359 92 236 489 385 - 1561 249 90 204 385 361 - 128940. Posts 855 1149 866 231182 52196 - 286248 815 1096 826 220448 49773 - 27295841. Power 626 251 331 772 355 - 2335 539 231 306 638 334 - 204842. President Sectt. 23 34 61 99 94 - 311 18 33 57 93 73 - 27443. Prime Minister’s 43 55 109 169 157 - 533 39 52 102 158 142 - 493
Office44. Public Enterprises 20 8 19 41 33 - 121 19 8 17 38 32 - 11445. Railways 7926 7051 -982398 627131 -1624506 7751 6682 - 892890 607493 -151481646. Revenue 5016 10688 29970 50945 30087 - 126706 4327 10136 28275 46597 28872 - 11820747. Rural Development 98 42 173 229 117 - 659 85 40 134 189 111 - 55948. Science & Tech. 1071 1944 1572 11198 10256 - 26041 445 1630 1409 8955 7385 - 1982449. Space 7276 449 2960 4341 1298 - 16324 6517 409 2638 3845 1100 - 1450950. SSI Agro & 476 156 525 1595 662 - 3414 332 109 450 1327 608 - 2826
Rural Industries51. Statistics & 660 686 1599 3533 921 - 7399 570 610 1490 3022 838 - 6530
Programme Imple.52. Steel 56 58 61 253 136 - 564 50 58 57 235 129 - 52953. M/o Road 265 71 139 358 202 - 1035 182 65 134 299 178 - 858
Transport,Highways
54. M/o Shipping 373 198 270 1482 893 - 3216 272 147 272 1201 785 - 267755. Telecommunications 572 668 555 786 534 - 3115 497 537 512 569 391 - 250656. Textile 215 84 347 4007 1408 - 6061 185 71 311 3393 1259 - 521957. Tourism 57 76 42 323 121 - 619 51 72 46 320 114 - 60358. U.P.S.C. 172 157 381 849 567 - 2126 164 153 369 758 438 - 188259. Urban Development 819 1610 362 16509 9195 - 28495 685 1434 332 13486 7943 - 2388060. Vice President’s 7 4 - 26 19 - 56 7 4 - 22 19 - 52
Secretariat61. Water Resources 1712 1067 1195 7209 4384 - 15567 1456 938 1030 5693 3654 - 1277162. Social Justice & 126 97 147 369 235 - 974 114 95 147 362 229 - 947
Empowerment63. Tribal Affairs 15 14 23 30 13 - 95 14 11 14 25 13 - 7764. Women & Child 73 33 115 277 240 - 738 70 23 96 264 220 - 673
Development65. Youth Affairs &
Sports 41 63 57 216 92 - 469 31 58 50 199 85 - 423Total 82184 73266 100413 2331602 1027323 18218 3633006 71649 66564 89927 2109346 939530 12833 3289849* includes some non-gazetted posts also
1 7
TABLE 5.4
DISTRIBUTION OF REGULAR CIVILIAN EMPLOYEES IN CENTRAL GOVT. &UNION TERRITORY ADMINISTRATIONS BY GROUP OF POSTS AS ON 01.03.2002
Sl. Central Govt./Union Territory Group of posts
A B C D* Total
1 2 3 4 5 6 71 Central Govt. 71649 156491 2109346 952363 3289849
(2.18) (4.75) (64.12) (28.95) (100.00)
2 Union Territory Administrations 1580 2782 44028 12874 61264(2.58) (4.54) (71.87) (21.01) (100.00)
Total 73229 159273 2153374 965237 3351113(2.19) (4.75) (64.26) (28.80) (100.00)
TABLE 6
ALL INDIA WORKING CLASS CONSUMER PRICE INDEX NUMBER FOR INDUSTRIALWORKERS (BASE 1982 = 100), 12 MONTHLY AVERAGE AND
PERCENTAGE INCREASE OVER 306.33 POINTSYear Jan. Feb. March April May June July Aug. Sept. Oct. Nov. Dec.1996 Index 315 316 319 324 328 333 339 343 344 346 349 350
12-Monthly average 308.50 310.58 312.75 315.17 317.50 319.75 321.92 324.25 326.50 328.75 331.08 333.83Percentage Increase 0.71 1.39 2.09 2.88 3.65 4.38 5.09 5.85 6.58 7.32 8.08 8.98
1997 Index 350 350 351 354 352 355 358 359 361 365 366 37212-Monthly average 336.75 339.58 342.25 344.75 346.75 348.58 350.17 351.50 352.92 354.50 355.92 357.75Percentage Increase 9.93 10.85 11.72 12.54 13.19 13.79 14.31 14.74 15.21 15.72 16.19 16.79
1998 Index 384 382 380 383 389 399 411 413 420 433 438 42912-Monthly average 360.58 363.25 365.67 368.08 371.17 374.83 379.25 383.74 388.67 394.33 400.33 405.08Percentage Increase 17.71 18.58 19.37 20.15 21.16 22.36 23.80 25.27 26.87 28.72 30.68 32.23
1999 Index 420 415 414 415 419 420 424 426 429 437 438 43112-Monthly average 408.08 410.83 413.67 416.33 418.83 420.58 421.67 422.75 423.50 423.83 423.83 424.00Percentage Increase 33.21 34.11 35.04 35.90 36.73 37.30 37.65 38.00 38.25 38.36 38.36 38.41
2000 Index 431 430 434 438 440 442 445 443 444 449 450 44612-Monthly average 424.92 426.17 427.83 429.75 431.50 433.33 435.08 436.50 437.75 438.75 439.75 441.00Percentage Increase 38.71 39.12 39.66 40.29 40.86 41.46 42.03 42.49 42.90 43.23 43.55 43.96
2001 Index 445 443 445 448 451 457 463 466 465 468 472 46912-Monthly average 442.17 443.25 444.17 445.00 445.92 447.17 448.67 450.58 452.33 453.92 455.75 457.67Percentage Increase 44.34 44.70 44.99 45.27 45.57 45.98 46.47 47.09 47.66 48.18 48.78 49.40
2002 Index 467 466 468 469 472 476 481 484 485 487 489 48412-Monthly average 459.50 461.42 463.33 465.08 466.83 468.42 469.92 471.42 473.08 474.67 476.08 477.33Percentage Increase 50.00 50.63 51.22 51.82 52.39 52.91 53.40 53.89 54.43 54.95 55.41 55.82
2003 Index 483 484 487 493 494 49712-Monthly average 478.67 480.17 481.75 483.75 485.58 487.33Percentage Increase 56.26 56.75 57.26 57.92 58.52 59.09
* includes unclassified posts also.N.B. (1) Figures in parentheses indicate the percentages to total.
No. Administrations
1 6
TABLE 5.2
GROUP-WISE & STATUS-WISE ESTIMATED NUMBER OFCENTRAL GOVT. CIVILIAN REGULAR EMPLOYEES AS ON 1.3.2002
IN MAJOR MINISTRIES/DEPARTMENTS (EXCLUDING UTs).Sl. Ministry/ Number of Sanctioned Posts Number in PositionNo. Department
A(G)* B(G) B(NG) C(NG) D(NG) Uncl- Total A(G)* B(G) B(NG) C(NG) D(NG) Uncl- Totalassi- assi-fied fied
1 2 3 4 5 6 7 8 9 10 11 12 13 14 15 16
TABLE 5.3
GROUPWISE NUMBER OF SANCTIONED POSTS & INCUMBENTSIN POSITION, VACANCIES AND THEIR PERCENTAGES TO
TOTAL SANCTIONED POSTS AS ON 1.03.2002
Group Number of Number of Number of Percentage of vacantsanctioned incumbents vacant posts to total sanctionedposts in position posts posts in the group
1 2 3 4 5
A (G)* 82184 71649 10535 12.82
B (G) 73266 66564 6702 9.15
B(NG) 100413 89927 10486 10.44
C(NG) 2331602 2109346 222256 9.53
D(NG) 1027323 939530 87793 8.55
Unclassified 18218 12833 5385 29.56
Total 3633006 3289849 343157 9.44
1. Railways 7926 7051 0 982398 627131 - 1624506 7751 6682 0 892890 607493 - 1514816
(9.64) (9.62) - (42.13) (61.05) - (44.72) (10.82) (10.04) - (42.33) (64.66) - (46.04)
2. Home Affairs 12735 5953 18335 637101 52164 - 726288 9656 5563 15738 611328 50528 - 692813(15.50) (8.13) (18.26) (27.33) (5.08) - (20.00) (13.48) (8.36) (17.50) (28.98) (5.38) - (21.06)
3. Defence 13675 14913 17729 246079 180837 - 473233 12196 14188 13382 185641 128334 - 353741(Civilian) (16.64) (20.35) (17.66) (10.56) (17.60) - (13.02) (17.02) (21.31) (14.88) (8.80) (13.66) - (10.75)
4. Posts 855 1149 866 231182 52196 - 286248 815 1096 826 220448 49773 - 272958(1.04) (1.57) (0.86) (9.92) (5.08) - (7.88) (1.14) (1.65) (0.92) (10.45) (5.30) - (8.30)
5. Telecommuni- 572 668 555 786 534 - 3115 497 537 512 569 391 - 2506cations (.70) (.91) (.55) (.03) (.05) - (.08) (.69) (.81) (.57) (.03) (.04) - (.08)
6. Revenue 5016 10688 29970 50945 30087 - 126706 4327 10136 28275 46597 28872 - 118207(6.10) (14.59) (29.85) (2.18) (2.93) - (3.49) (6.04) (15.23) (31.44) (2.21) (3.07) - (3.59)
7. Others 41405 32844 32958 183111 84374 18218 392910 36407 28362 31194 151873 74139 12833 334808
(50.38) (44.83) (32.82) (7.85) (8.21) (100.00) (10.81) (50.81) (42.61) (34.69) (7.20) (7.89) (100.00) (10.18)
Total 82184 73266 100413 2331602 1027323 18218 3633006 71649 66564 89927 2109346 939530 12833 3289849
* includes some Non-Gazetted posts also.
* includes some Non-Gazetted posts also.N.B. Figures in parentheses are the percentages to total.

1 7
TABLE 5.4
DISTRIBUTION OF REGULAR CIVILIAN EMPLOYEES IN CENTRAL GOVT. &UNION TERRITORY ADMINISTRATIONS BY GROUP OF POSTS AS ON 01.03.2002
Sl. Central Govt./Union Territory Group of posts
A B C D* Total
1 2 3 4 5 6 71 Central Govt. 71649 156491 2109346 952363 3289849
(2.18) (4.75) (64.12) (28.95) (100.00)
2 Union Territory Administrations 1580 2782 44028 12874 61264(2.58) (4.54) (71.87) (21.01) (100.00)
Total 73229 159273 2153374 965237 3351113(2.19) (4.75) (64.26) (28.80) (100.00)
TABLE 6
ALL INDIA WORKING CLASS CONSUMER PRICE INDEX NUMBER FOR INDUSTRIALWORKERS (BASE 1982 = 100), 12 MONTHLY AVERAGE AND
PERCENTAGE INCREASE OVER 306.33 POINTSYear Jan. Feb. March April May June July Aug. Sept. Oct. Nov. Dec.1996 Index 315 316 319 324 328 333 339 343 344 346 349 350
12-Monthly average 308.50 310.58 312.75 315.17 317.50 319.75 321.92 324.25 326.50 328.75 331.08 333.83Percentage Increase 0.71 1.39 2.09 2.88 3.65 4.38 5.09 5.85 6.58 7.32 8.08 8.98
1997 Index 350 350 351 354 352 355 358 359 361 365 366 37212-Monthly average 336.75 339.58 342.25 344.75 346.75 348.58 350.17 351.50 352.92 354.50 355.92 357.75Percentage Increase 9.93 10.85 11.72 12.54 13.19 13.79 14.31 14.74 15.21 15.72 16.19 16.79
1998 Index 384 382 380 383 389 399 411 413 420 433 438 42912-Monthly average 360.58 363.25 365.67 368.08 371.17 374.83 379.25 383.74 388.67 394.33 400.33 405.08Percentage Increase 17.71 18.58 19.37 20.15 21.16 22.36 23.80 25.27 26.87 28.72 30.68 32.23
1999 Index 420 415 414 415 419 420 424 426 429 437 438 43112-Monthly average 408.08 410.83 413.67 416.33 418.83 420.58 421.67 422.75 423.50 423.83 423.83 424.00Percentage Increase 33.21 34.11 35.04 35.90 36.73 37.30 37.65 38.00 38.25 38.36 38.36 38.41
2000 Index 431 430 434 438 440 442 445 443 444 449 450 44612-Monthly average 424.92 426.17 427.83 429.75 431.50 433.33 435.08 436.50 437.75 438.75 439.75 441.00Percentage Increase 38.71 39.12 39.66 40.29 40.86 41.46 42.03 42.49 42.90 43.23 43.55 43.96
2001 Index 445 443 445 448 451 457 463 466 465 468 472 46912-Monthly average 442.17 443.25 444.17 445.00 445.92 447.17 448.67 450.58 452.33 453.92 455.75 457.67Percentage Increase 44.34 44.70 44.99 45.27 45.57 45.98 46.47 47.09 47.66 48.18 48.78 49.40
2002 Index 467 466 468 469 472 476 481 484 485 487 489 48412-Monthly average 459.50 461.42 463.33 465.08 466.83 468.42 469.92 471.42 473.08 474.67 476.08 477.33Percentage Increase 50.00 50.63 51.22 51.82 52.39 52.91 53.40 53.89 54.43 54.95 55.41 55.82
2003 Index 483 484 487 493 494 49712-Monthly average 478.67 480.17 481.75 483.75 485.58 487.33Percentage Increase 56.26 56.75 57.26 57.92 58.52 59.09
* includes unclassified posts also.N.B. (1) Figures in parentheses indicate the percentages to total.
No. Administrations
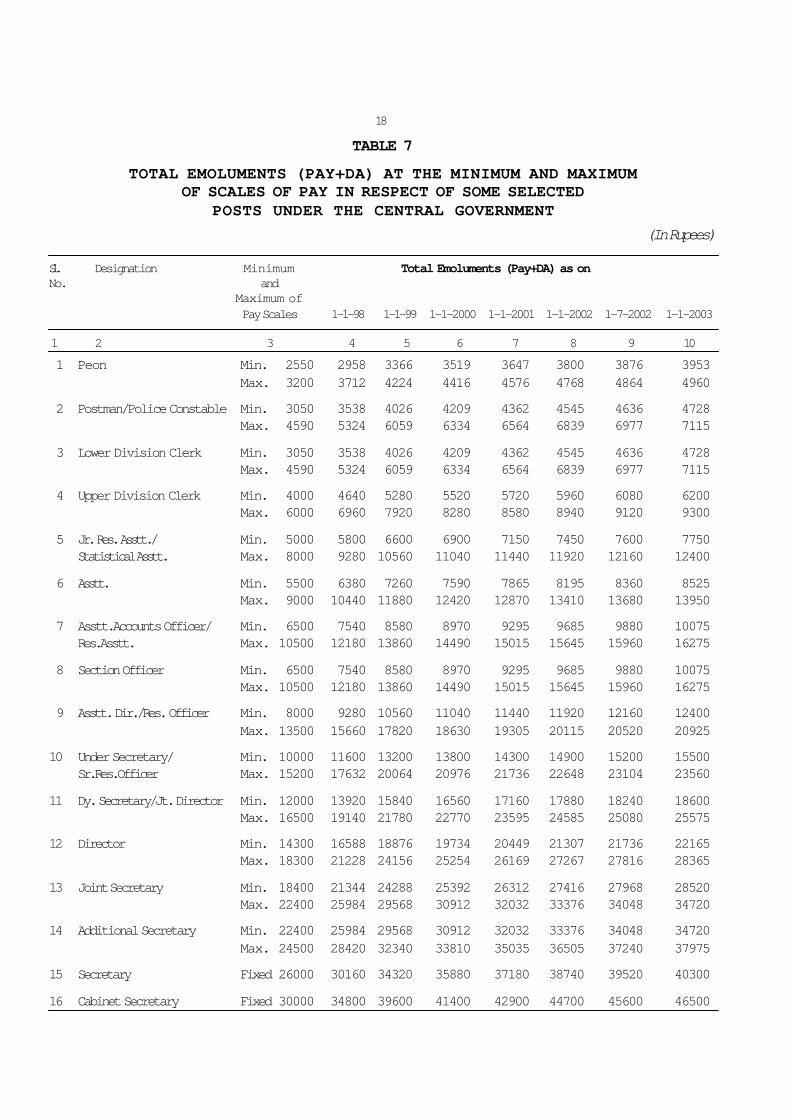
TABLE 7
TOTAL EMOLUMENTS (PAY+DA) AT THE MINIMUM AND MAXIMUMOF SCALES OF PAY IN RESPECT OF SOME SELECTED
POSTS UNDER THE CENTRAL GOVERNMENT (In Rupees)
Sl. Designation Minimum Total Emoluments (Pay+DA) as onNo. and
Maximum ofPay Scales 1-1-98 1-1-99 1-1-2000 1-1-2001 1-1-2002 1-7-2002 1-1-2003
1 2 3 4 5 6 7 8 9 10
1 Peon Min. 2550 2958 3366 3519 3647 3800 3876 3953Max. 3200 3712 4224 4416 4576 4768 4864 4960
2 Postman/Police Constable Min. 3050 3538 4026 4209 4362 4545 4636 4728Max. 4590 5324 6059 6334 6564 6839 6977 7115
3 Lower Division Clerk Min. 3050 3538 4026 4209 4362 4545 4636 4728Max. 4590 5324 6059 6334 6564 6839 6977 7115
4 Upper Division Clerk Min. 4000 4640 5280 5520 5720 5960 6080 6200Max. 6000 6960 7920 8280 8580 8940 9120 9300
5 Jr. Res. Asstt./ Min. 5000 5800 6600 6900 7150 7450 7600 7750Statistical Asstt. Max. 8000 9280 10560 11040 11440 11920 12160 12400
6 Asstt. Min. 5500 6380 7260 7590 7865 8195 8360 8525Max. 9000 10440 11880 12420 12870 13410 13680 13950
7 Asstt.Accounts Officer/ Min. 6500 7540 8580 8970 9295 9685 9880 10075Res.Asstt. Max. 10500 12180 13860 14490 15015 15645 15960 16275
8 Section Officer Min. 6500 7540 8580 8970 9295 9685 9880 10075Max. 10500 12180 13860 14490 15015 15645 15960 16275
9 Asstt. Dir./Res. Officer Min. 8000 9280 10560 11040 11440 11920 12160 12400Max. 13500 15660 17820 18630 19305 20115 20520 20925
10 Under Secretary/ Min. 10000 11600 13200 13800 14300 14900 15200 15500Sr.Res.Officer Max. 15200 17632 20064 20976 21736 22648 23104 23560
11 Dy. Secretary/Jt. Director Min. 12000 13920 15840 16560 17160 17880 18240 18600Max. 16500 19140 21780 22770 23595 24585 25080 25575
12 Director Min. 14300 16588 18876 19734 20449 21307 21736 22165Max. 18300 21228 24156 25254 26169 27267 27816 28365
13 Joint Secretary Min. 18400 21344 24288 25392 26312 27416 27968 28520Max. 22400 25984 29568 30912 32032 33376 34048 34720
14 Additional Secretary Min. 22400 25984 29568 30912 32032 33376 34048 34720Max. 24500 28420 32340 33810 35035 36505 37240 37975
15 Secretary Fixed 26000 30160 34320 35880 37180 38740 39520 40300
16 Cabinet Secretary Fixed 30000 34800 39600 41400 42900 44700 45600 46500
18
1 9
TABLE 8
NUMBER OF C.G.H.S. DISPENSARIES AS ON MARCH, 2001 ANDEXPENDITURE THEREON DURING 2000-2001
Sl. No. of Expenditure No. of No. of Cost per Cost perNo. Station Dispen- (Rs. Lakh) Card Benefi- Card Benefi-
saries @ Holders ciaries Holder ciary(Rs.) (Rs.)
1 2 3 4 5 6 7 81 Ahmedabad 9 261.56 9690 40222 2699 6502 Allahabad 12 620.19 29377 173618 2111 3573 Bangalore 18 1015.39 61265 236864 1657 4294 Mumbai 45 1882.83 113424 452776 1660 4165 Calcutta 26 1610.22 49733 162118 3238 9936 Delhi 159 14118.13 422625 1860806 3340 7597 Hyderabad 25 3609.26 82274 394547 4387 9158 Jabalpur 4 332.28 16018 79574 2074 4189 Jaipur 11 545.98 23550 109329 2318 499
10 Kanpur 17 896.44 24829 129834 3610 69011 Lucknow 13 585.67 16174 83228 3621 70412 Chennai 22 1670.86 45211 173705 3696 96213 Meerut 10 596.93 11330 61208 5269 97514 Nagpur 16 882.11 27220 112896 3241 78115 Pune 14 1282.76 37635 131813 3408 97316 Patna 12 440.08 16065 76768 2739 57317 Guwahati 3 228.90 7565 36716 3026 62318 Trivendrum 3 208.44 4789 16629 4352 1253
Total 419 30788.03 998774 4332651 3083 711@ Includes Allopathic, Ayurvedic, Homoeopathic, Unani, Yoga and Poly Clinic Dispensaries, CGHS Labs & Dental Units.
TABLE 9NUMBER OF C.G.H.S. DISPENSARIES AND COST PER BENEFICIARY
(Cost in Rs.)1997-98 1998-99 1999-2000 2000-2001
Sl. Station No. of Cost per No. of Cost per No. of Cost per No. of Cost perNo. Dispen- Benefi- Dispen- Benefi- Dispen- Benefi- Dispen- Benefi-
saries* ciary saries* ciary saries* ciary saries* ciary 1 2 3 4 5 6 7 8 9 10
1 Ahmedabad 9 471 9 576 9 622 9 6502 Allahabad 12 277 12 282 12 330 12 3573 Bangalore 18 332 18 369 18 733 18 4294 Calcutta 26 698 26 766 26 832 26 9935 Delhi 159 523 159 571 159 679 159 7596 Hyderabad 25 464 25 542 25 804 25 9157 Jabalpur 4 262 4 326 4 292 4 4188 Jaipur 11 336 11 476 11 454 11 4999 Kanpur 17 518 17 537 17 539 17 690
10 Lucknow 12 859 12 613 13 661 13 70411 Chennai 22 568 22 722 22 738 22 96212 Meerut 10 607 10 876 10 972 10 97513 Mumbai 55 281 55 366 44 377 45 41614 Nagpur 15 388 16 442 16 602 16 78115 Patna 11 255 11 292 12 528 12 57316 Pune 13 727 13 710 14 774 14 97317 Guwahati 3 387 3 462 3 491 3 62318 Trivendrum 3 706 3 918 3 969 3 1253
All India 425 493 426 528 418 640 419 711* Includes Allopathic, Ayurvedic, Homoeopathic, Unani, Yoga and Poly Clinic Dispensaries, Dental Units & CGHS Labs.Source of tables 8 and 9: Provisional data obtained from D.G.H.S.
2 0
TABLE 10
DISPARITY RATIO IN EMOLUMENTS UNDER DIFFERENT STATE GOVERNMENTS AS ON 1.1.2002 AND DATE OF EFFECT OF CURRENT PAY SCALES
S.No. State Designation $ Pay D A Total* Disparity Date of Central(Rs.) (Rs.) Emoluments Ratio effect of D.A.
(Pay+D.A.) current formula(Rs.) pay scales followed
1 2 3 4 5 6 7 8 9
1 Andhra Secy/Addl.Secy. to Max. 19675 4345 24020 7.72 1.7.98 NoPradesh Govt./Engineer in Chief,
Registrar High courtAttender, Sweeper etc. Min. 2550 563 3113
2 Arunachal Special Secretary to HCM Max. 20000 9800 29800 7.84 1.1.96 YesPradesh Peon Min. 2550 1250 3800
3 Assam Commissioner & Spl. Max. 17000 7310 24310 6.94 1.1.96 YesSecy. (PWD/Irrigation)Peon, Mali,Gr.IV, etc. Min. 2450 1053 3503
4 Bihar N O T A V A I L A B L E
5 Delhi Chief Justice, Delhi Max. 30000 14700 44700 11.76 1.1.96 YesHigh CourtClass IV (peon) Min. 2550 1250 3800
6 Goa Chief Engineer(PWD/ Max. 22400 10976 33376 8.78 1.1.96 YesIrrigation)Peon Min. 2550 1250 3800
7 Gujarat ACS(Narmada Devl. Max. 24500 12005 36505 9.61 1.1.96 YesDeptt.)Peon, etc. Min. 2550 1250 3800
8 Haryana Director Gen. of Health Max. 25900 12691 38591 10.16 1.1.96 YesServicesPeon Min. 2550 1250 3800
9 Himachal Eng. In chief/Chief Eng. Max. 23600 11564 35164 9.01 1.1.96 YesPradesh Director Gen. of Health
Peon etc. Min. 2620 1283 3903
10 Jammu & N O T A V A I L A B L EKashmir
11 Jharkhand Engineer-in-Chief,R.E.O. Max. 22400 9632 32032 8.78 1.1.96 YesRural DevelopmentPeon Min. 2550 1250 3800
12 Karnataka Engineer in Chief/ Max. 20720 10153 30873 8.29 1.4.98 YesSecy.PWD/IrrigationClass IV Min. 2500 1225 3725
13 Kerala Director of Health Max. 19900 7562 27462 7.62 1.3.97 YesServicesPeon/Class IV Min. 2610 992 3602
14 Maharashtra Secy.(Irr./PWD) Max. 22400 9296 31696 8.78 1.1.96 YesPeon Min. 2550 1058 3608
15 Madhya N O T A V A I L A B L EPradesh
16 Manipur N O T A V A I L A B L E
17 Meghalaya Secretary (PWD) Max. 17000 8500 25500 6.97 1.1.96 Yes(state cadre)Peon Min. 2440 1220 3660
2 1
18 Mizoram Principal chief Max. 26000 12740 38740 10.22 1.1.96 Yesconservation of ForestPeon, Group D Min. 2650 1140 3790
19 Nagaland Secy. (Non IAS) Max. 20900 10241 31141 8.20 1.6.98 YesPeon Min. 2550 1250 3800
20 Orissa Engr.-in-Chief cum Max. 20450 10021 30471 8.02 1.1.96 YesSecy. (Works Deptt.)Peon, sweeper, etc. Min. 2550 1250 3800
21 Punjab Head of Deptt. Max. 22100 10829 32929 8.43 1.1.96 YesGrade D employees Min. 2620 1284 3904
22 Rajasthan Secy. to Govt./Distt.& Max. 22400 10080 32480 8.78 1.9.96 YesSession Judge (S.Scale)Class IV Servant Min. 2550 1148 3698
23 Sikkim PCCF-cum-Secretary Max. 21700 10633 32333 7.61 1.1.96 YesOffice Peon Min. 2850 1397 4247
24 Tamil Nadu Non-I.A.S.(Secretaries) Max. 21900 9855 31755 8.59 1.1.96 YesOffice Assistant/LGGS Min. 2550 1148 3698
25 Tripura N O T A V A I L A B L E
26 U.P Chief Eng.Irrigation Max. 24500 12005 36505 9.61 1.1.96 YesPeon etc. Min. 2550 1250 3800
27 West Bengal Dir.of Medical Education Max. 22400 9184 31584 8.62 1.1.96 YesPeon etc. Min. 2600 1066 3666
28 Uttaranchal Chief Secretary Max. 24900 10535 35435 9.72 1.1.96 YesPeon Min. 2550 1097 3647
29 Chathisgarh Max. 22400 10080 32480 8.78 1.1.96 YesPeon Min. 2550 1148 3698
$ Excluding posts in All India Services i.e.IAS,IPS & IFS.* Pre-Tax
S.No. State Designation $ Pay D A Total* Disparity Date of Central(Rs.) (Rs.) Emoluments Ratio effect of D.A.
(Pay+D.A.) current formula(Rs.) pay scales followed
1 2 3 4 5 6 7 8 9
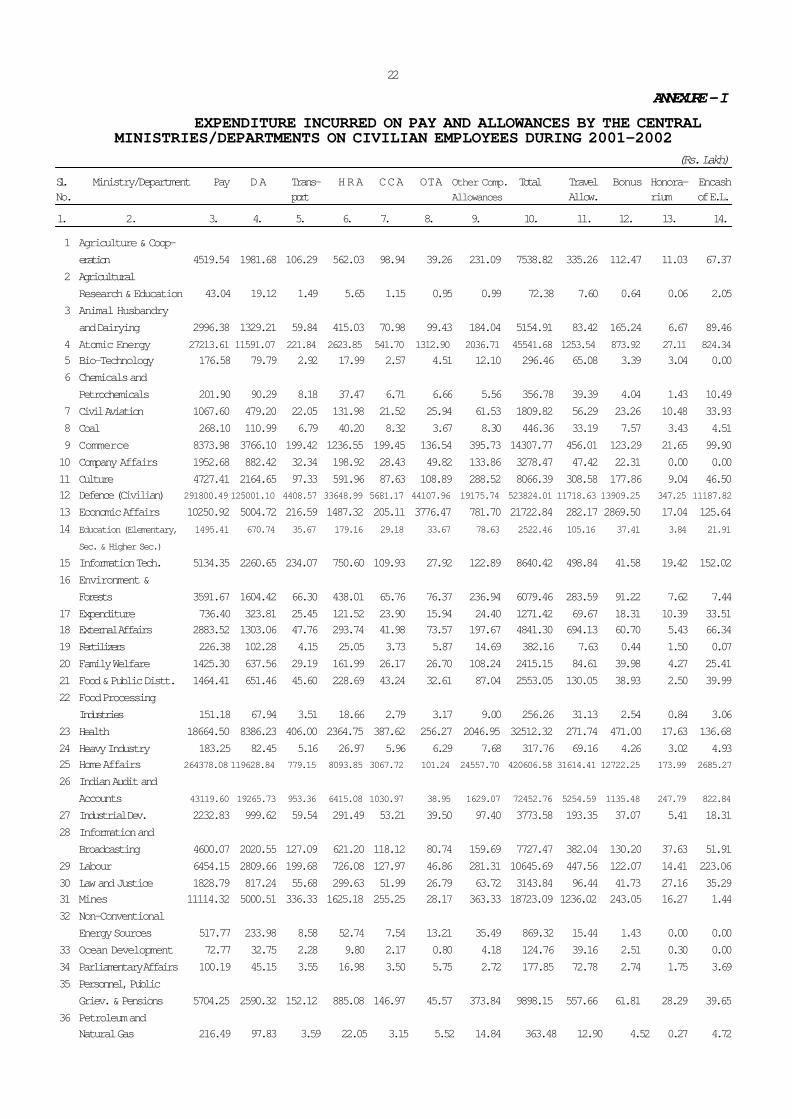
ANNEXURE - I EXPENDITURE INCURRED ON PAY AND ALLOWANCES BY THE CENTRAL
MINISTRIES/DEPARTMENTS ON CIVILIAN EMPLOYEES DURING 2001-2002 (Rs. Lakh)
Sl. Ministry/Department Pay DA Trans- HRA CCA OTA Other Comp. Total Travel Bonus Honora- EncashNo. port Allowances Allow. rium of E.L.
1. 2. 3. 4. 5. 6. 7. 8. 9. 10. 11. 12. 13. 14.
1 Agriculture & Coop-eration 4519.54 1981.68 106.29 562.03 98.94 39.26 231.09 7538.82 335.26 112.47 11.03 67.37
2 AgriculturalResearch & Education 43.04 19.12 1.49 5.65 1.15 0.95 0.99 72.38 7.60 0.64 0.06 2.05
3 Animal Husbandryand Dairying 2996.38 1329.21 59.84 415.03 70.98 99.43 184.04 5154.91 83.42 165.24 6.67 89.46
4 Atomic Energy 27213.61 11591.07 221.84 2623.85 541.70 1312.90 2036.71 45541.68 1253.54 873.92 27.11 824.345 Bio-Technology 176.58 79.79 2.92 17.99 2.57 4.51 12.10 296.46 65.08 3.39 3.04 0.006 Chemicals and
Petrochemicals 201.90 90.29 8.18 37.47 6.71 6.66 5.56 356.78 39.39 4.04 1.43 10.497 Civil Aviation 1067.60 479.20 22.05 131.98 21.52 25.94 61.53 1809.82 56.29 23.26 10.48 33.938 Coal 268.10 110.99 6.79 40.20 8.32 3.67 8.30 446.36 33.19 7.57 3.43 4.519 Commerce 8373.98 3766.10 199.42 1236.55 199.45 136.54 395.73 14307.77 456.01 123.29 21.65 99.9010 Company Affairs 1952.68 882.42 32.34 198.92 28.43 49.82 133.86 3278.47 47.42 22.31 0.00 0.0011 Culture 4727.41 2164.65 97.33 591.96 87.63 108.89 288.52 8066.39 308.58 177.86 9.04 46.5012 Defence (Civilian) 291800.49 125001.10 4408.57 33648.99 5681.17 44107.96 19175.74 523824.01 11718.63 13909.25 347.25 11187.82
13 Economic Affairs 10250.92 5004.72 216.59 1487.32 205.11 3776.47 781.70 21722.84 282.17 2869.50 17.04 125.6414 Education (Elementary, 1495.41 670.74 35.67 179.16 29.18 33.67 78.63 2522.46 105.16 37.41 3.84 21.91
Sec. & Higher Sec.)
15 Information Tech. 5134.35 2260.65 234.07 750.60 109.93 27.92 122.89 8640.42 498.84 41.58 19.42 152.0216 Environment &
Forests 3591.67 1604.42 66.30 438.01 65.76 76.37 236.94 6079.46 283.59 91.22 7.62 7.4417 Expenditure 736.40 323.81 25.45 121.52 23.90 15.94 24.40 1271.42 69.67 18.31 10.39 33.5118 External Affairs 2883.52 1303.06 47.76 293.74 41.98 73.57 197.67 4841.30 694.13 60.70 5.43 66.3419 Fertilizers 226.38 102.28 4.15 25.05 3.73 5.87 14.69 382.16 7.63 0.44 1.50 0.0720 Family Welfare 1425.30 637.56 29.19 161.99 26.17 26.70 108.24 2415.15 84.61 39.98 4.27 25.4121 Food & Public Distt. 1464.41 651.46 45.60 228.69 43.24 32.61 87.04 2553.05 130.05 38.93 2.50 39.9922 Food Processing
Industries 151.18 67.94 3.51 18.66 2.79 3.17 9.00 256.26 31.13 2.54 0.84 3.0623 Health 18664.50 8386.23 406.00 2364.75 387.62 256.27 2046.95 32512.32 271.74 471.00 17.63 136.6824 Heavy Industry 183.25 82.45 5.16 26.97 5.96 6.29 7.68 317.76 69.16 4.26 3.02 4.9325 Home Affairs 264378.08 119628.84 779.15 8093.85 3067.72 101.24 24557.70 420606.58 31614.41 12722.25 173.99 2685.27
26 Indian Audit andAccounts 43119.60 19265.73 953.36 6415.08 1030.97 38.95 1629.07 72452.76 5254.59 1135.48 247.79 822.84
27 Industrial Dev. 2232.83 999.62 59.54 291.49 53.21 39.50 97.40 3773.58 193.35 37.07 5.41 18.3128 Information and
Broadcasting 4600.07 2020.55 127.09 621.20 118.12 80.74 159.69 7727.47 382.04 130.20 37.63 51.9129 Labour 6454.15 2809.66 199.68 726.08 127.97 46.86 281.31 10645.69 447.56 122.07 14.41 223.0630 Law and Justice 1828.79 817.24 55.68 299.63 51.99 26.79 63.72 3143.84 96.44 41.73 27.16 35.2931 Mines 11114.32 5000.51 336.33 1625.18 255.25 28.17 363.33 18723.09 1236.02 243.05 16.27 1.4432 Non-Conventional
Energy Sources 517.77 233.98 8.58 52.74 7.54 13.21 35.49 869.32 15.44 1.43 0.00 0.0033 Ocean Development 72.77 32.75 2.28 9.80 2.17 0.80 4.18 124.76 39.16 2.51 0.30 0.0034 Parliamentary Affairs 100.19 45.15 3.55 16.98 3.50 5.75 2.72 177.85 72.78 2.74 1.75 3.6935 Personnel, Public
Griev. & Pensions 5704.25 2590.32 152.12 885.08 146.97 45.57 373.84 9898.15 557.66 61.81 28.29 39.6536 Petroleum and
Natural Gas 216.49 97.83 3.59 22.05 3.15 5.52 14.84 363.48 12.90 4.52 0.27 4.72
22
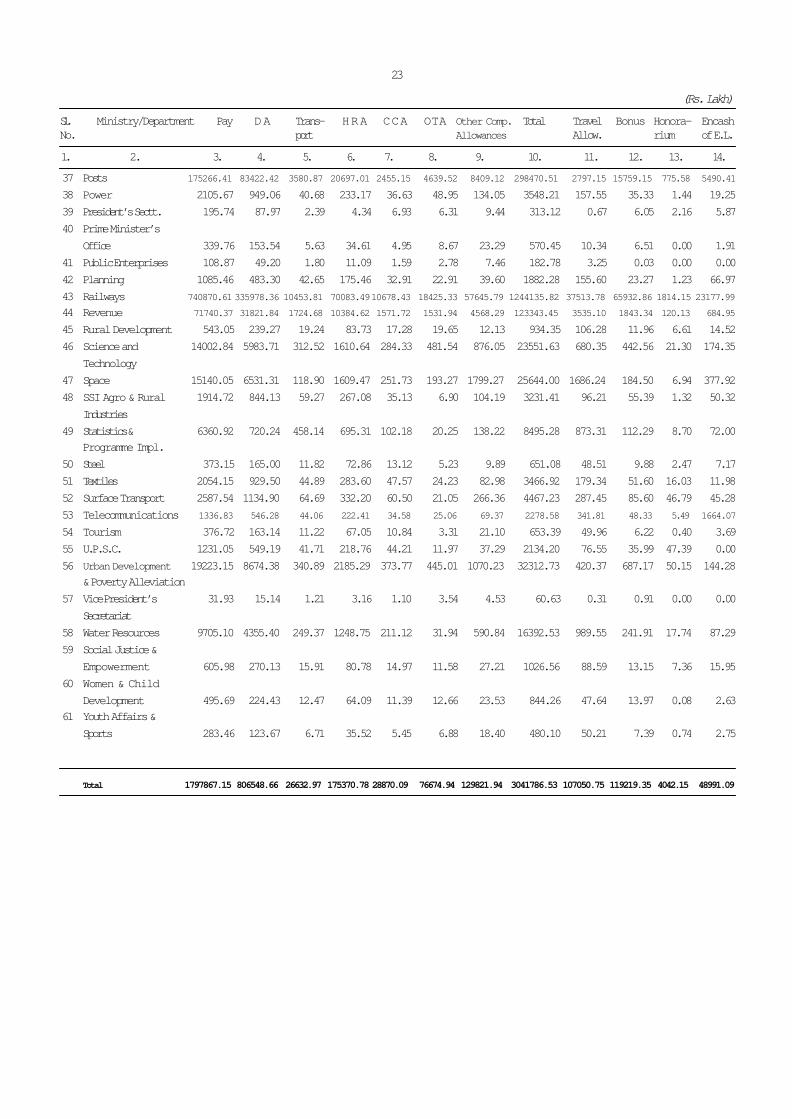
23
(Rs. Lakh)
Sl. Ministry/Department Pay DA Trans- HRA CCA OTA Other Comp. Total Travel Bonus Honora- EncashNo. port Allowances Allow. rium of E.L.
1. 2. 3. 4. 5. 6. 7. 8. 9. 10. 11. 12. 13. 14.
37 Posts 175266.41 83422.42 3580.87 20697.01 2455.15 4639.52 8409.12 298470.51 2797.15 15759.15 775.58 5490.41
38 Power 2105.67 949.06 40.68 233.17 36.63 48.95 134.05 3548.21 157.55 35.33 1.44 19.2539 President’s Sectt. 195.74 87.97 2.39 4.34 6.93 6.31 9.44 313.12 0.67 6.05 2.16 5.8740 Prime Minister’s
Office 339.76 153.54 5.63 34.61 4.95 8.67 23.29 570.45 10.34 6.51 0.00 1.9141 Public Enterprises 108.87 49.20 1.80 11.09 1.59 2.78 7.46 182.78 3.25 0.03 0.00 0.0042 Planning 1085.46 483.30 42.65 175.46 32.91 22.91 39.60 1882.28 155.60 23.27 1.23 66.9743 Railways 740870.61 335978.36 10453.81 70083.4910678.43 18425.33 57645.79 1244135.82 37513.78 65932.86 1814.15 23177.9944 Revenue 71740.37 31821.84 1724.68 10384.62 1571.72 1531.94 4568.29 123343.45 3535.10 1843.34 120.13 684.95
45 Rural Development 543.05 239.27 19.24 83.73 17.28 19.65 12.13 934.35 106.28 11.96 6.61 14.5246 Science and 14002.84 5983.71 312.52 1610.64 284.33 481.54 876.05 23551.63 680.35 442.56 21.30 174.35
Technology47 Space 15140.05 6531.31 118.90 1609.47 251.73 193.27 1799.27 25644.00 1686.24 184.50 6.94 377.9248 SSI Agro & Rural 1914.72 844.13 59.27 267.08 35.13 6.90 104.19 3231.41 96.21 55.39 1.32 50.32
Industries49 Statistics & 6360.92 720.24 458.14 695.31 102.18 20.25 138.22 8495.28 873.31 112.29 8.70 72.00
Programme Impl.50 Steel 373.15 165.00 11.82 72.86 13.12 5.23 9.89 651.08 48.51 9.88 2.47 7.1751 Textiles 2054.15 929.50 44.89 283.60 47.57 24.23 82.98 3466.92 179.34 51.60 16.03 11.9852 Surface Transport 2587.54 1134.90 64.69 332.20 60.50 21.05 266.36 4467.23 287.45 85.60 46.79 45.2853 Telecommunications 1336.83 546.28 44.06 222.41 34.58 25.06 69.37 2278.58 341.81 48.33 5.49 1664.07
54 Tourism 376.72 163.14 11.22 67.05 10.84 3.31 21.10 653.39 49.96 6.22 0.40 3.6955 U.P.S.C. 1231.05 549.19 41.71 218.76 44.21 11.97 37.29 2134.20 76.55 35.99 47.39 0.0056 Urban Development 19223.15 8674.38 340.89 2185.29 373.77 445.01 1070.23 32312.73 420.37 687.17 50.15 144.28
& Poverty Alleviation57 Vice President’s 31.93 15.14 1.21 3.16 1.10 3.54 4.53 60.63 0.31 0.91 0.00 0.00
Secretariat58 Water Resources 9705.10 4355.40 249.37 1248.75 211.12 31.94 590.84 16392.53 989.55 241.91 17.74 87.2959 Social Justice &
Empowerment 605.98 270.13 15.91 80.78 14.97 11.58 27.21 1026.56 88.59 13.15 7.36 15.9560 Women & Child
Development 495.69 224.43 12.47 64.09 11.39 12.66 23.53 844.26 47.64 13.97 0.08 2.6361 Youth Affairs &
Sports 283.46 123.67 6.71 35.52 5.45 6.88 18.40 480.10 50.21 7.39 0.74 2.75
Total 1797867.15 806548.66 26632.97 175370.78 28870.09 76674.94 129821.94 3041786.53 107050.75 119219.35 4042.15 48991.09