performing arts center feasibility study
TRANSCRIPT
Rancho Cordova
Performing Arts Center Feas ib i l i t y S tudyCity Council UpdateApril 30, 2019
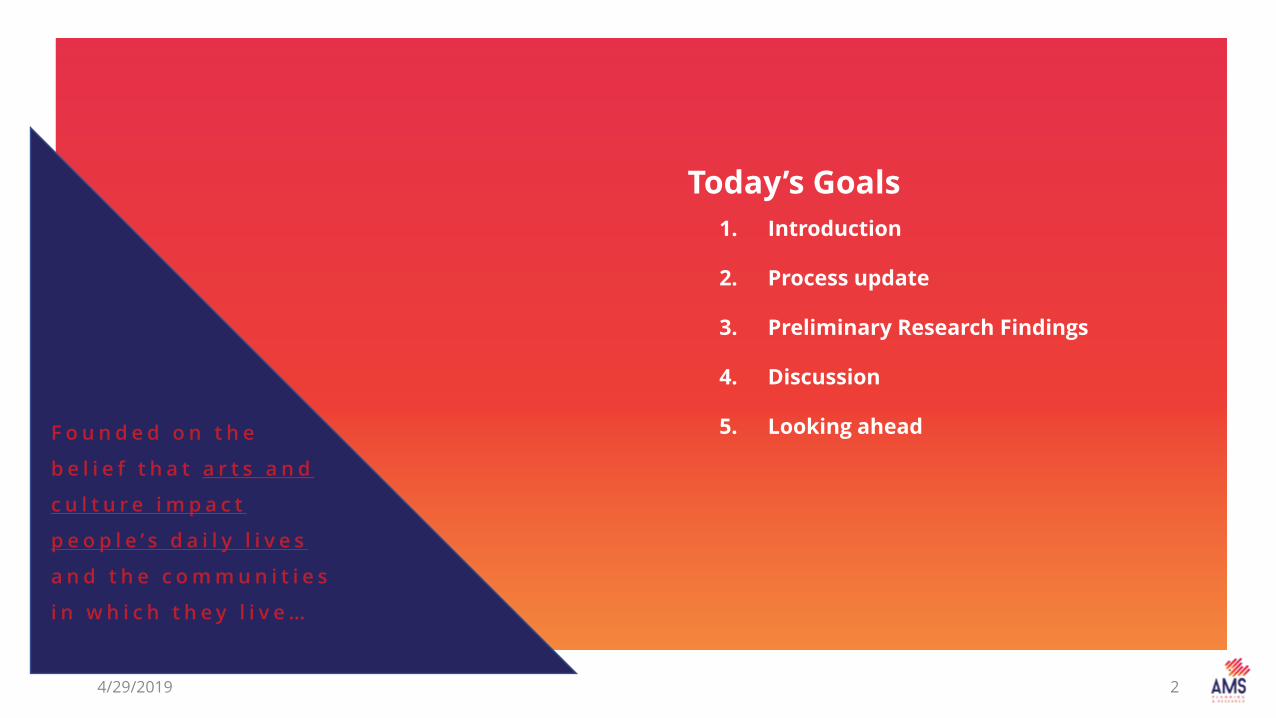
F o u n d e d o n t h e
b e l i e f t h a t a r t s a n d
c u l t u r e i m p a c t
p e o p l e ’ s d a i l y l i v e s
a n d t h e c o m m u n i t i e s
i n w h i c h t h e y l i v e …
Today’s Goals1. Introduction
2. Process update
3. Preliminary Research Findings
4. Discussion
5. Looking ahead
24/29/2019
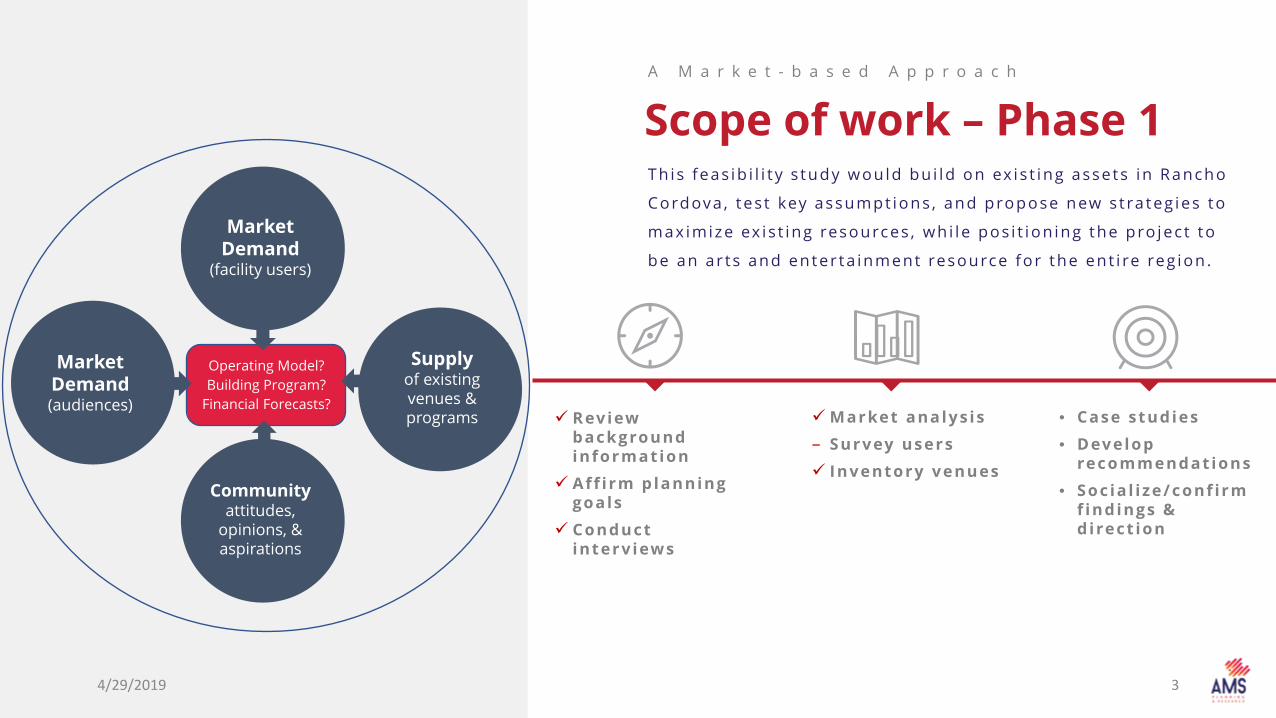
Scope of work – Phase 1A M a r k e t - b a s e d A p p r o a c h
Th is feas ib i l i t y s tudy would bu i ld on ex is t ing assets in Rancho
Cordova , tes t key assumpt ions , and propose new st rateg ies to
max imize ex is t ing resources , wh i le pos i t ion ing the pro ject to
be an ar ts and enter ta inment resource for the ent i re reg ion .
34/29/2019
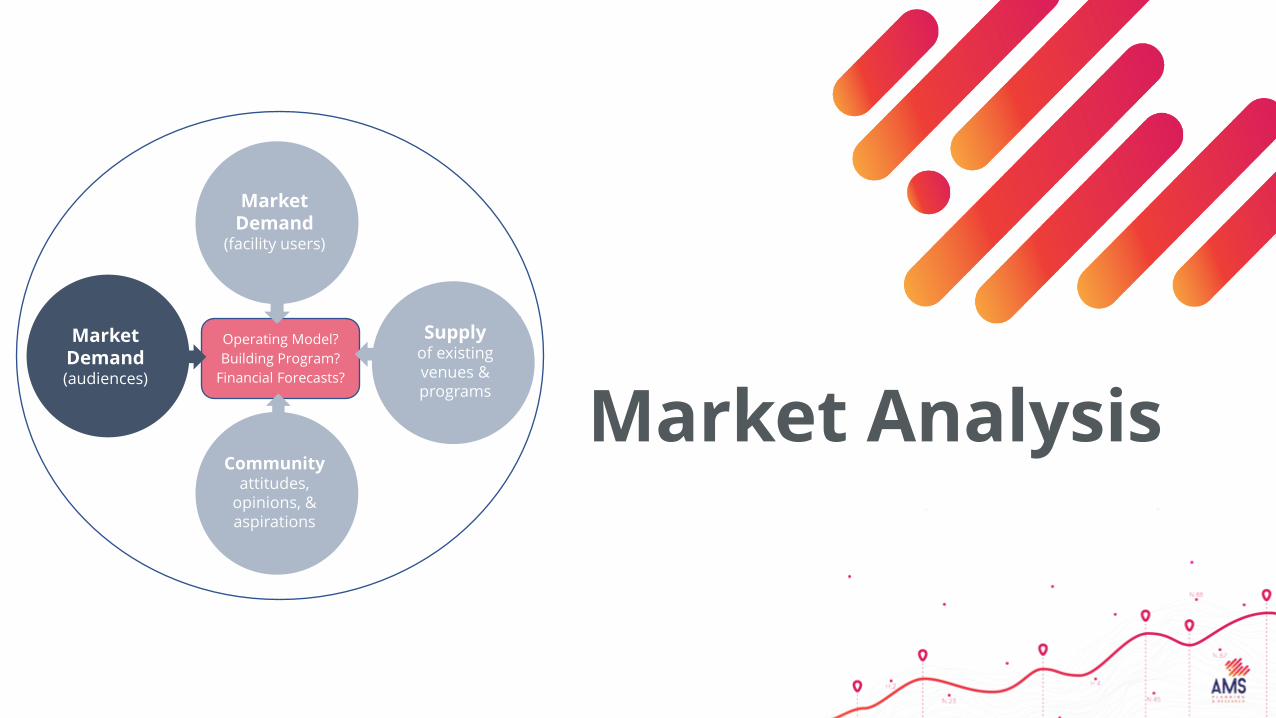
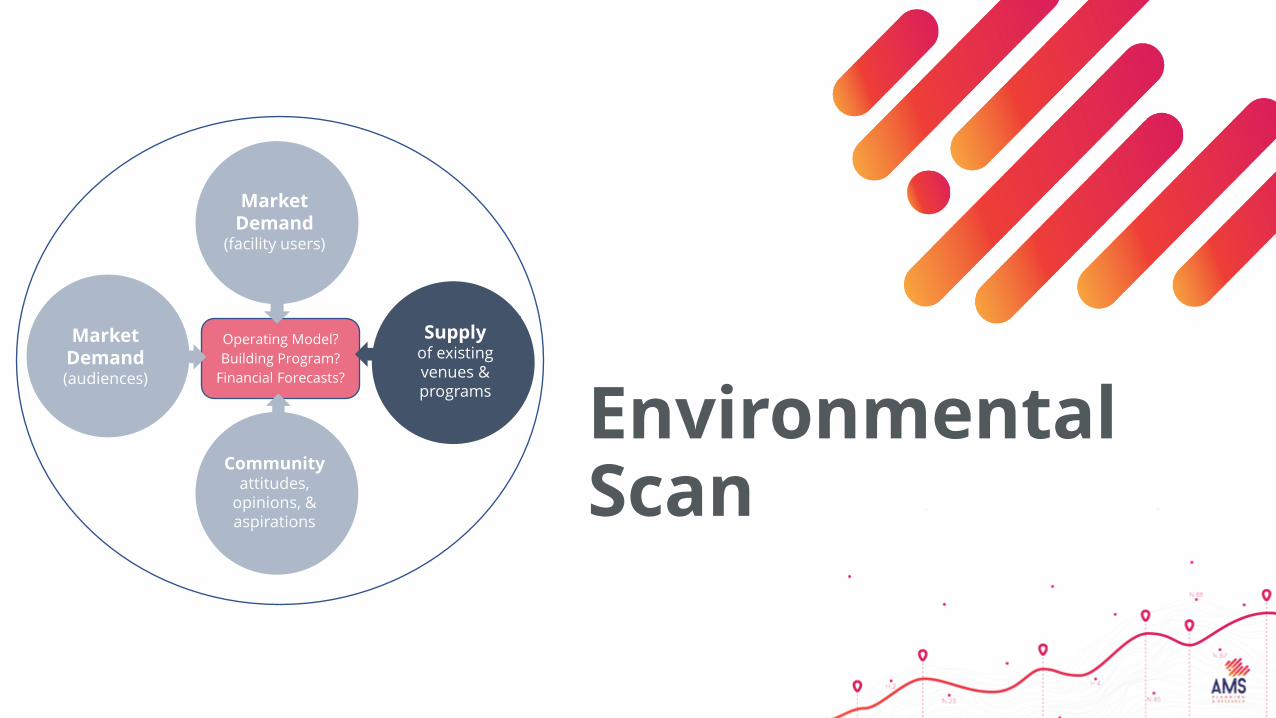
Operating Model?Building Program?
Financial Forecasts?
Market Demand (audiences)
Supply of existing venues & programs
Communityattitudes,
opinions, & aspirations
Market Demand
(facility users)
Review background information
Aff irm planning goals
Conduct interv iews
Market analys is– Survey users Inventory venues
• Case studies• Develop
recommendat ions• Socia l ize/conf irm
f indings & d irect ion

S i t e & S p a c e $ C o s t $A c t i v i t y P r o f i l e
• Interface with architects to def ine spaces and consider s i te factors
• Develop an order -of -magnitude capita l cost est imate
• Forecast the major act iv i t ies and programming of the hal l
• Consider design impl icat ions
Scope of work – Phase 2D e f i n i n g a S p a c e
Based on Phase 1 , AMS would out l ine the type of fac i l i t y, the space requ i rements for programs,
admin is t rat ion , and rehearsa l /c lassroom space , and the opt imal number o f seats to accommodate
expected aud iences .
Report out
Report back to work ing group and C i ty Counc i l .
Cons ider next s teps –deve lop ing a bus iness
p lan .
44/29/2019
Operating Model?Building Program?
Financial Forecasts?
Market Demand (audiences)
Supply of existing venues & programs
Communityattitudes,
opinions, & aspirations
Market Demand
(facility users)
Market Analysis

A m a r ke t a n a l y s i s wa s c o n d u c t e d t o u n d e rs ta n d t h e fo l l o w i n g t h re e c o m p o n e n t s o f t h e m a r ke t :
ProcessM a r k e t D e t e r m i n a t i o n
Dem
ogra
phic
s
Segm
enta
tion
Affin
ities
Look at the broader demographics of the population in the defined primary and secondary market areas and compare it to Regional and State data
Categorize households based on demographic data, consumption patterns, and primary consumer/ market research, to develop psychographic profiles
Use national consumer research data to identify households in the market area with above-average potential to attend events and activitiescompared to US averages
M A R K E T D E T E R M I N A T I O N
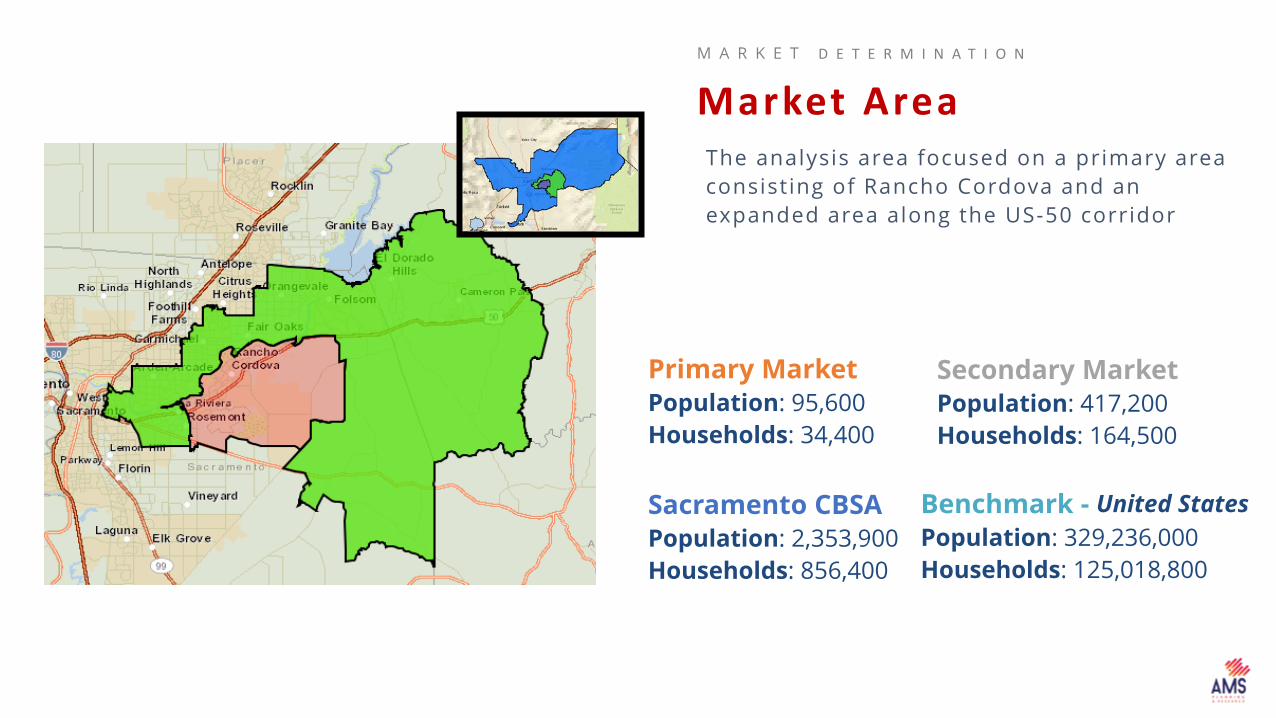
Market AreaThe analysis area focused on a primary area consisting of Rancho Cordova and an expanded area along the US-50 corridor
Primary MarketPopulation: 95,600Households: 34,400
Secondary MarketPopulation: 417,200Households: 164,500
Benchmark - United StatesPopulation: 329,236,000Households: 125,018,800
Sacramento CBSAPopulation: 2,353,900Households: 856,400

Same Stores n = 27
The Market ind icates support for ar ts and cu l tura l amenit ies
D e m o g r a p h i c s
Demographic Key Findings
• The population across the region is projected to grow significantly in the next five years, with Rancho Cordova growing at an even faster rate.
• Families with children live in the primary market , whereas the secondary market tends to be older with no children
• The secondary market area has significant means and good proximity to Rancho Cordova; this, combined with high levels of education, is indicative of a supportive patron base for arts and culture
• The primary market is significantly more racially diverse than the secondary market, and slightly more diverse than the greater Sacramento CBSA

T h e m o st re p re s e n t e d s e g m e n t s i n t h e t o ta l m a r ke t a re a h av e m e a n s a n d a p ro p e n s i t y t o wa rd a r t s a n d c u l t u ra l a c t i v i t i e s
Segmentation Key FindingsC o n s u m e r S e g m e n t a t i o n
The dominant primary market segments indicate a significant number of upper-middle
class families with children
The dominant secondary market segments are affluent and well-educated
C o n s u m e r S e g m e n t a t i o n
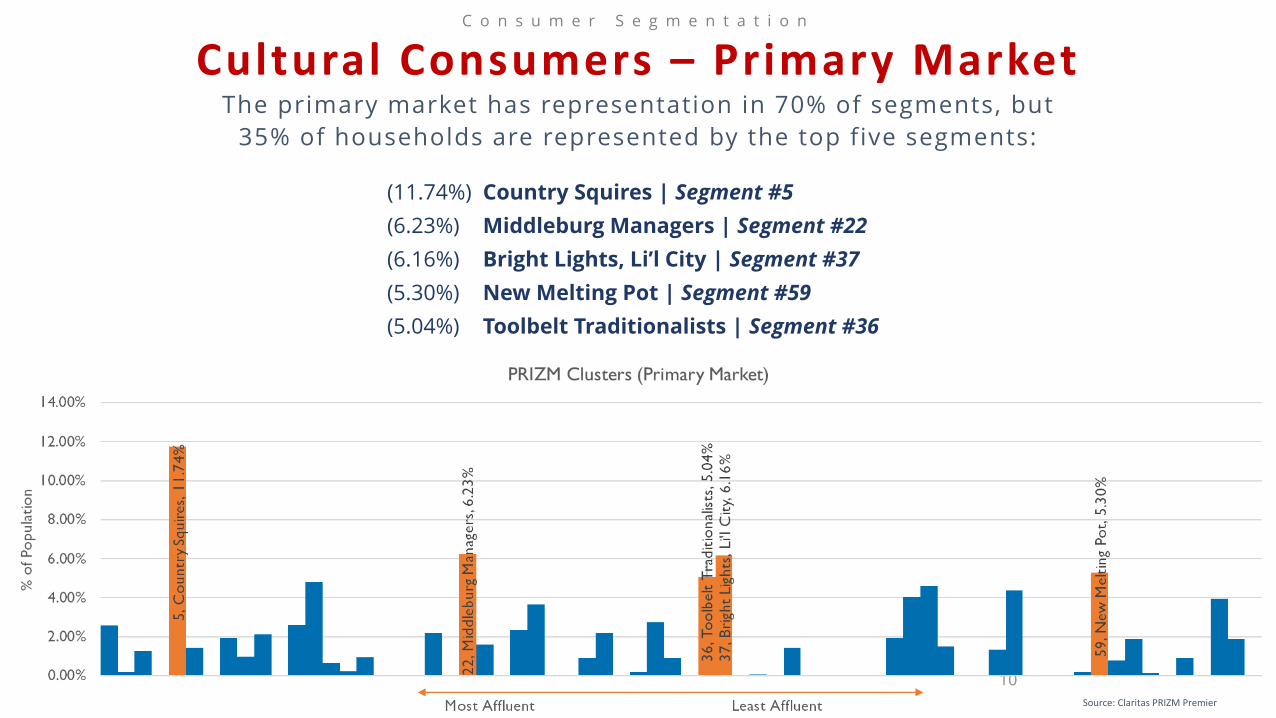
Cultural Consumers – Primary Market
10
The primary market has representation in 70% of segments, but 35% of households are represented by the top five segments:
(11.74%) Country Squires | Segment #5(6.23%) Middleburg Managers | Segment #22(6.16%) Bright Lights, Li’l City | Segment #37(5.30%) New Melting Pot | Segment #59(5.04%) Toolbelt Traditionalists | Segment #36
Source: Claritas PRIZM Premier
C o n s u m e r S e g m e n t a t i o n
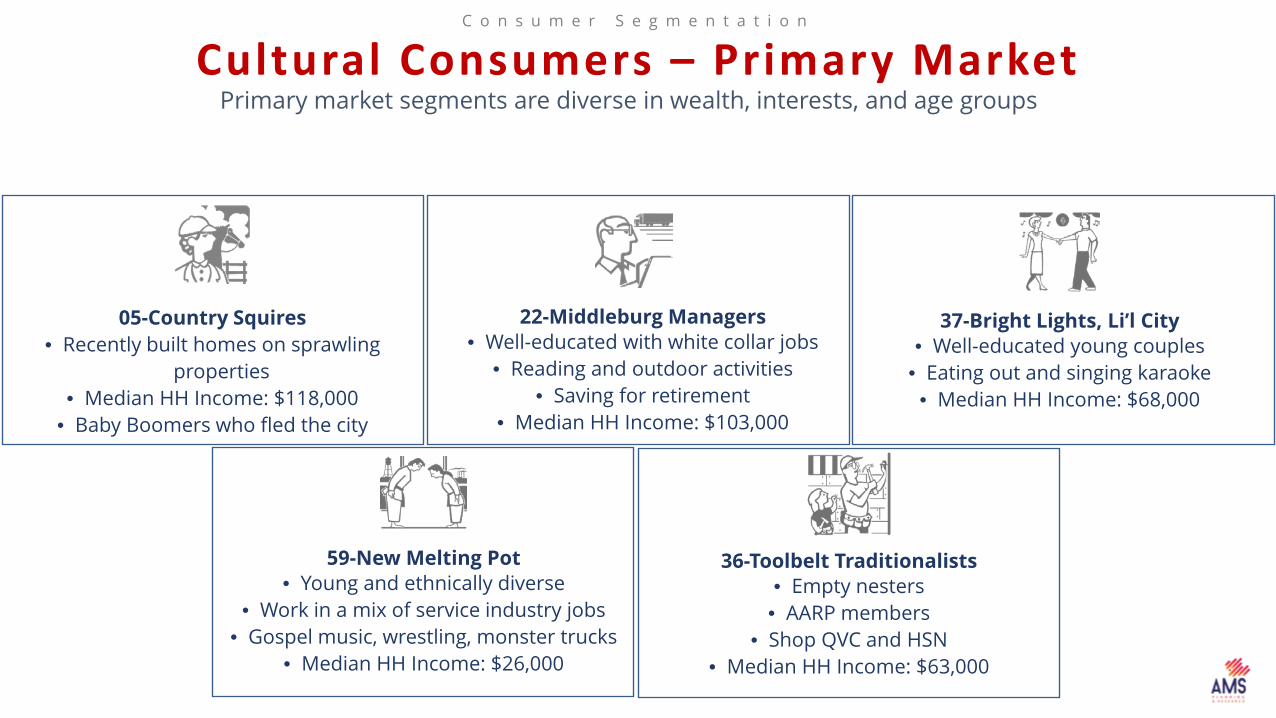
Cultural Consumers – Primary MarketPrimary market segments are diverse in wealth, interests, and age groups
05-Country Squires• Recently built homes on sprawling
properties• Median HH Income: $118,000
• Baby Boomers who fled the city
22-Middleburg Managers• Well-educated with white collar jobs
• Reading and outdoor activities• Saving for retirement
• Median HH Income: $103,000
37-Bright Lights, Li’l City• Well-educated young couples
• Eating out and singing karaoke• Median HH Income: $68,000
36-Toolbelt Traditionalists• Empty nesters
• AARP members• Shop QVC and HSN
• Median HH Income: $63,000
59-New Melting Pot• Young and ethnically diverse
• Work in a mix of service industry jobs• Gospel music, wrestling, monster trucks
• Median HH Income: $26,000

C o n s u m e r S e g m e n t a t i o n
Cultural Consumers – Secondary MarketSecondary market segments are somewhat less diverse but tend toward greater affluence
12-Cruisin’ to Retirement• Suburban, older couples with grown
children out of the house• Vacations, golf, talk radio
• Median HH Income: $95,000
03-Movers & Shakers• Suburban, dual-income
• Highly educated and business oriented• Age 45-64
• Median HH Income: $129,000
02-Networked Neighbors• Suburban, million dollar homes
• Expensive cars and exclusive clubs• Married with children, high education
• Median HH Income: $227,000
07-Money & Brains• High education, white-collar jobs
• City living, married with few children• Fashionable homes, expensive cars
• Median HH Income: $115,000
19-American Dreams• Upper-middle class
• Multilingual and urban• Grocery and convenience stores
• Median HH Income: $76,000
C o n s u m e r A f f i n i t i e s
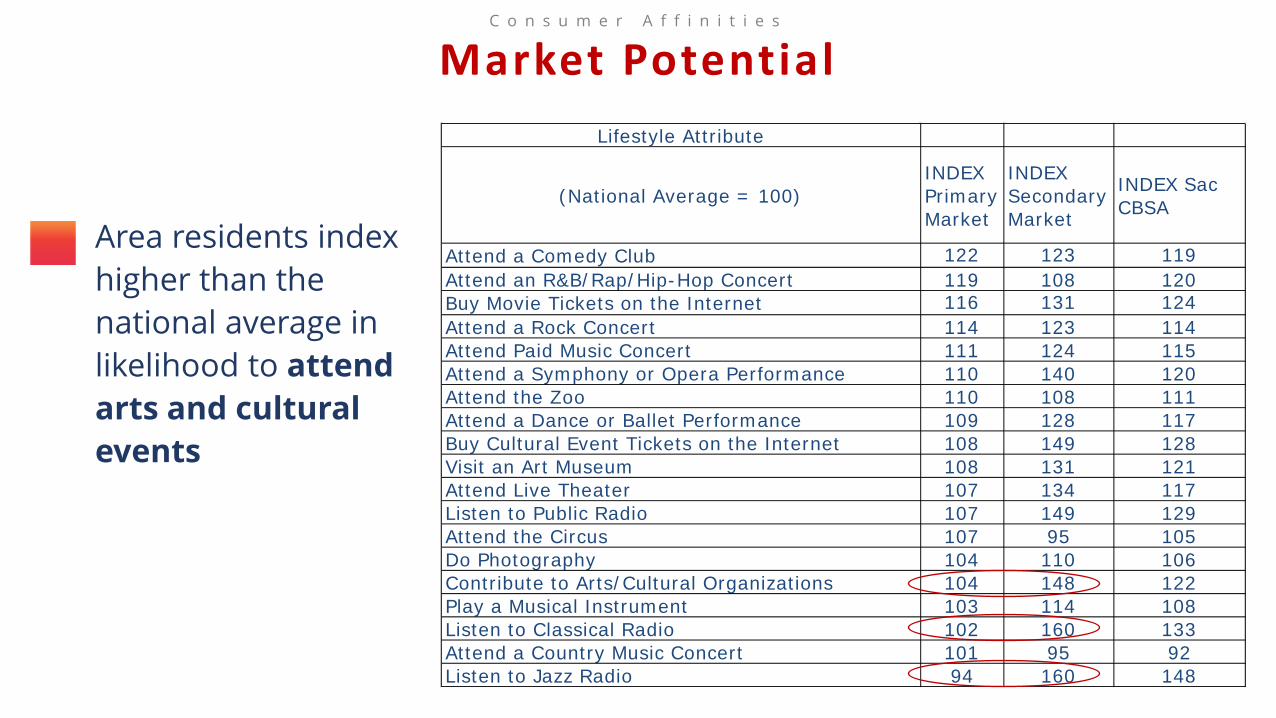
Market Potential
Area residents index higher than the national average in likelihood to attend arts and cultural events
Lifestyle Attribute
(National Average = 100)INDEX Primary Market
INDEX Secondary Market
INDEX Sac CBSA
Attend a Comedy Club 122 123 119Attend an R&B/Rap/Hip-Hop Concert 119 108 120Buy Movie Tickets on the Internet 116 131 124Attend a Rock Concert 114 123 114Attend Paid Music Concert 111 124 115Attend a Symphony or Opera Performance 110 140 120Attend the Zoo 110 108 111Attend a Dance or Ballet Performance 109 128 117Buy Cultural Event Tickets on the Internet 108 149 128Visit an Art Museum 108 131 121Attend Live Theater 107 134 117Listen to Public Radio 107 149 129Attend the Circus 107 95 105Do Photography 104 110 106Contribute to Arts/Cultural Organizations 104 148 122Play a Musical Instrument 103 114 108Listen to Classical Radio 102 160 133Attend a Country Music Concert 101 95 92Listen to Jazz Radio 94 160 148

C o n s u m e r A f f i n i t i e s
Cultural ConsumersIn a single year, an estimated:
% of primary
HH# of primary
HH
% of secondary
HH# of secondary
HH Lifestyle attribute
57% 54,500 56% 234,700 will go to the zoo
40% 38,200 50% 208,700 will attend live theater
32% 30,500 36% 148,400 will attend a paid music concert
31% 29,400 33% 137,900 Will attend a rock concert
30% 28,400 36% 150,700 will visit an art museum
20% 18,700 18% 77,000 Will attend a country music concert
18% 17,700 19% 77,700 Will attend a comedy club
16% 14,800 20% 82,500 Will attend the symphony or opera
14% 13,500 19% 81,300 Will buy cultural event tickets on the internet
14% 13,000 16% 66,500 Will attend a dance or ballet performance
9% 8,500 12% 52,100 Will contribute to arts/cultural organizations

Operating Model?Building Program?
Financial Forecasts?
Market Demand (audiences)
Supply of existing venues & programs
Communityattitudes,
opinions, & aspirations
Market Demand
(facility users)
Community Input

What we are hearing from stakeholdersC o m m u n i t y I n p u t
164/29/2019
There are many visionsRang ing f rom health and human
serv ices to art c lasses to basketbal l
The arts are active & supported by CityBut could be more so with more +
better fac i l i t ies
Visual and performing arts are envisioned @ civic centerMany interv iewees spoke of v isual art act iv i t ies
and spaces as wel l as performing arts
Economic development benefits soughtEnl ivening Folsom Blvd. with c iv ic center and
amenit ies seen as key e lement of success
4/29/2019 17
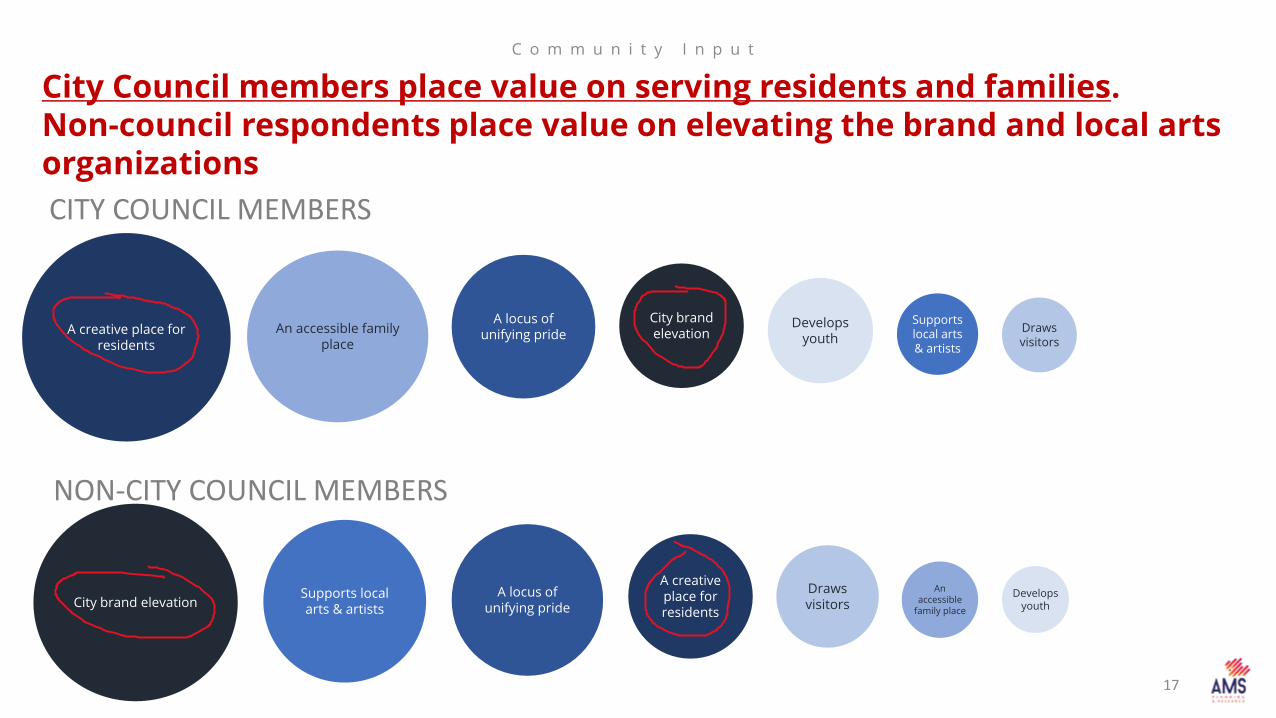
City Council members place value on serving residents and families.Non-council respondents place value on elevating the brand and local arts organizations
C o m m u n i t y I n p u t
Develops youth
An accessible family place
Draws visitors
Supports local arts & artists
A locus of unifying prideA creative place for
residents
City brand elevation
CITY COUNCIL MEMBERS
Develops youth
An accessible
family place
Draws visitors
Supports local arts & artists
A locus of unifying pride
A creative place for residents
City brand elevation
NON-CITY COUNCIL MEMBERS
Operating Model?Building Program?
Financial Forecasts?
Market Demand (audiences)
Supply of existing venues & programs
Communityattitudes,
opinions, & aspirations
Market Demand
(facility users)
Environmental Scan
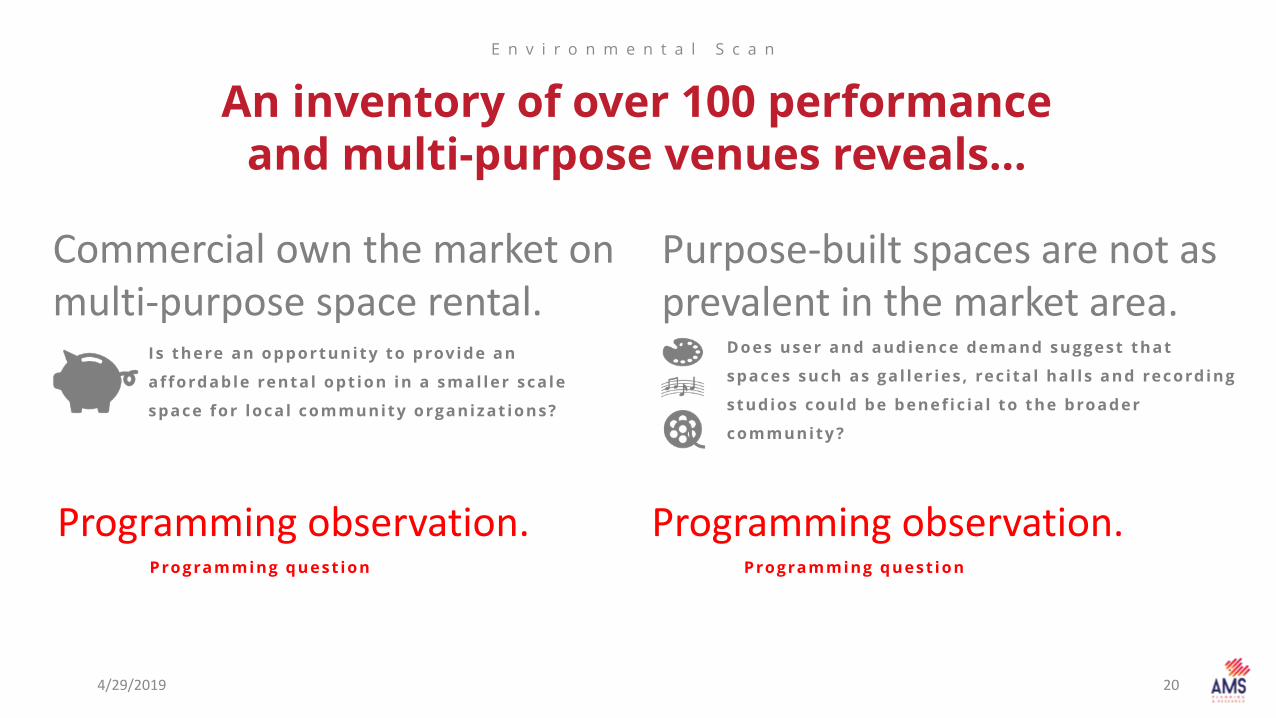
An inventory of over 100 performance and multi-purpose venues reveals…
E n v i r o n m e n t a l S c a n
204/29/2019
Commercial own the market on multi-purpose space rental.
Is there an opportunity to provide an
affordable rental opt ion in a smal ler scale
space for local community organizat ions?
Purpose-built spaces are not as prevalent in the market area.
Does user and audience demand suggest that
spaces such as gal ler ies , rec ita l hal ls and recording
studios could be benef ic ia l to the broader
community ?
Programming observation.Programming quest ion
Programming observation.Programming quest ion
4/29/2019 21
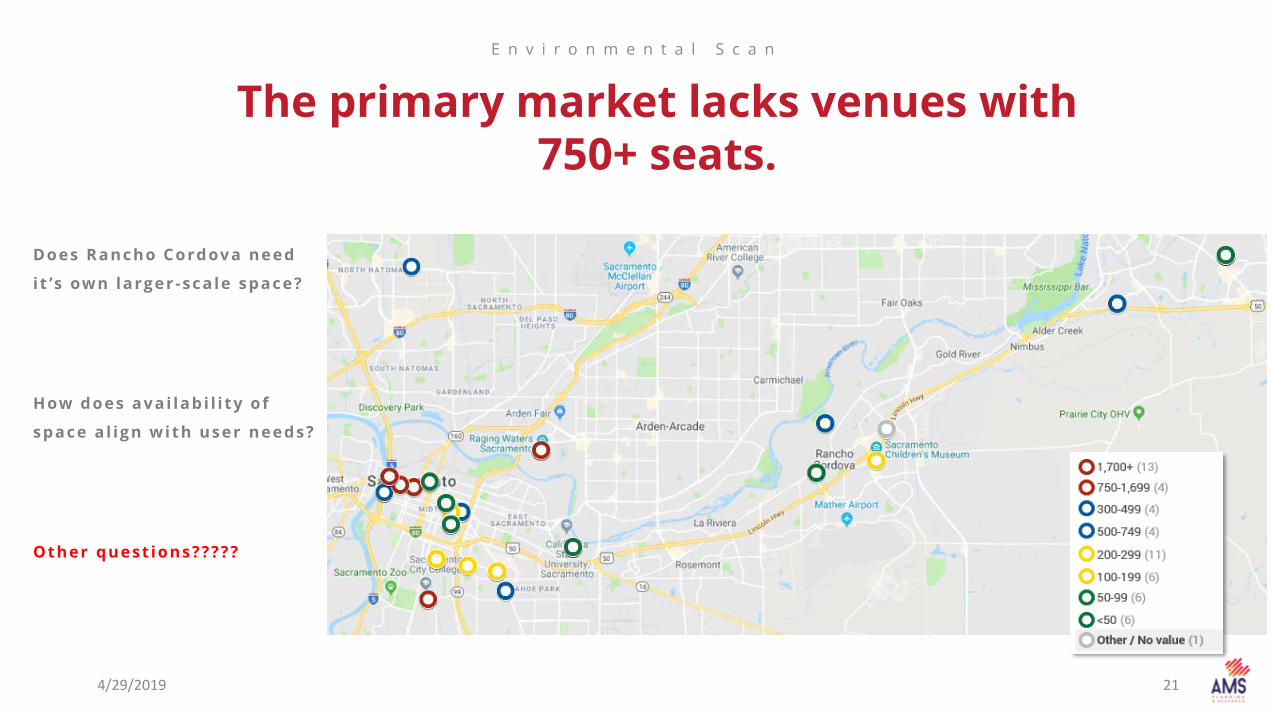
The primary market lacks venues with 750+ seats.
E n v i r o n m e n t a l S c a n
Does Rancho Cordova need
i t ’s own larger -scale space?
How does avai labi l i ty of
space a l ign with user needs?
Other quest ions?????

Operating Model?Building Program?
Financial Forecasts?
Market Demand (audiences)
Supply of existing venues & programs
Communityattitudes,
opinions, & aspirations
Market Demand
(facility users)
User Needs Survey

How much would your organization be willing to pay for use of a new/renovated facility that meets your needs?
Choral risers
Orchestra pit
MethodologyU s e r N e e d s S u r v e y
Information gathered includes: • Minimum, optimum, maximum seating capacity
• Theater configuration (proscenium, thrust, black box,
etc.)
• Equipment and space needs
• Estimated utilization
• Current and expected attendance
• Current spaces used and associated usage costs
• Background organization information
Distributed via emails and virally. • City’s own list
• SMAC & Creative Edge
• Clara Studios for the Performing Arts
• SARTA (regional theatre alliance)
234/29/2019

F A C I L I T Y N E E D S S U R V E Y
22 Survey Respondents916 Ink
Casa de Brazilian Folkloric Arts of Sacramento
CSz Sacramento - Home of ComedySportz
DDSO The Short Centers
Elk Grove Fine Arts Center
EMH Productions
Images Theatre Company
IMBA
Lenaea High School Theatre Festival
Rancho Cordova Arts
Rancho Cordova Chamber of Commerce
Rancho Cordova River City Concert Band
Sacramento Ballet Association
Sacramento Guitar Society
Sacramento Guitar Society
Sacramento Master Singers
Sacramento Taiko Dan
Sacramento Youth Symphony
Sinag-tala Filipino Theatre & Performing Arts Association
Skulltronix
Symphony d'Oro Rancho Crodova
TwoPoint4 Dance Theatre
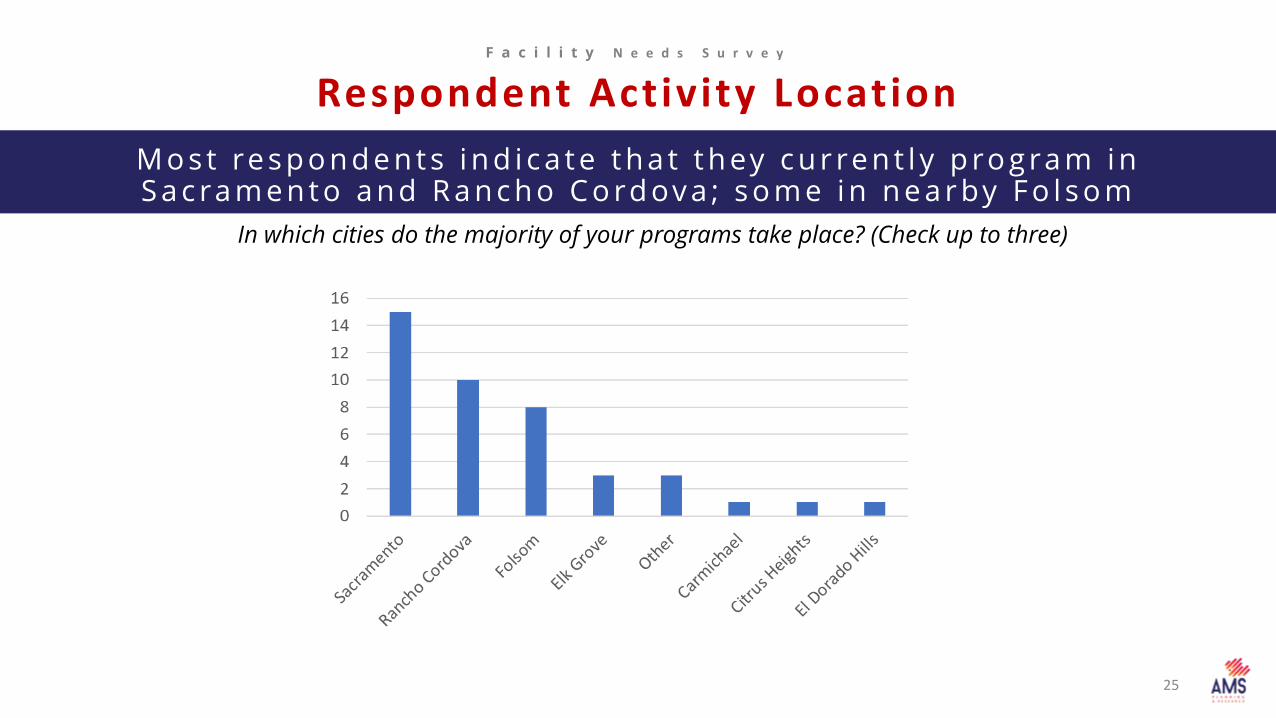
M o s t re s p o n d e n t s i n d i c a t e t h a t t h ey c u r re n t l y p ro g ra m i n S a c ra m e n t o a n d R a n c h o C o rd ov a ; s o m e i n n e a r by F o l s o m
F a c i l i t y N e e d s S u r v e y
Respondent Activity Location
In which cities do the majority of your programs take place? (Check up to three)
25
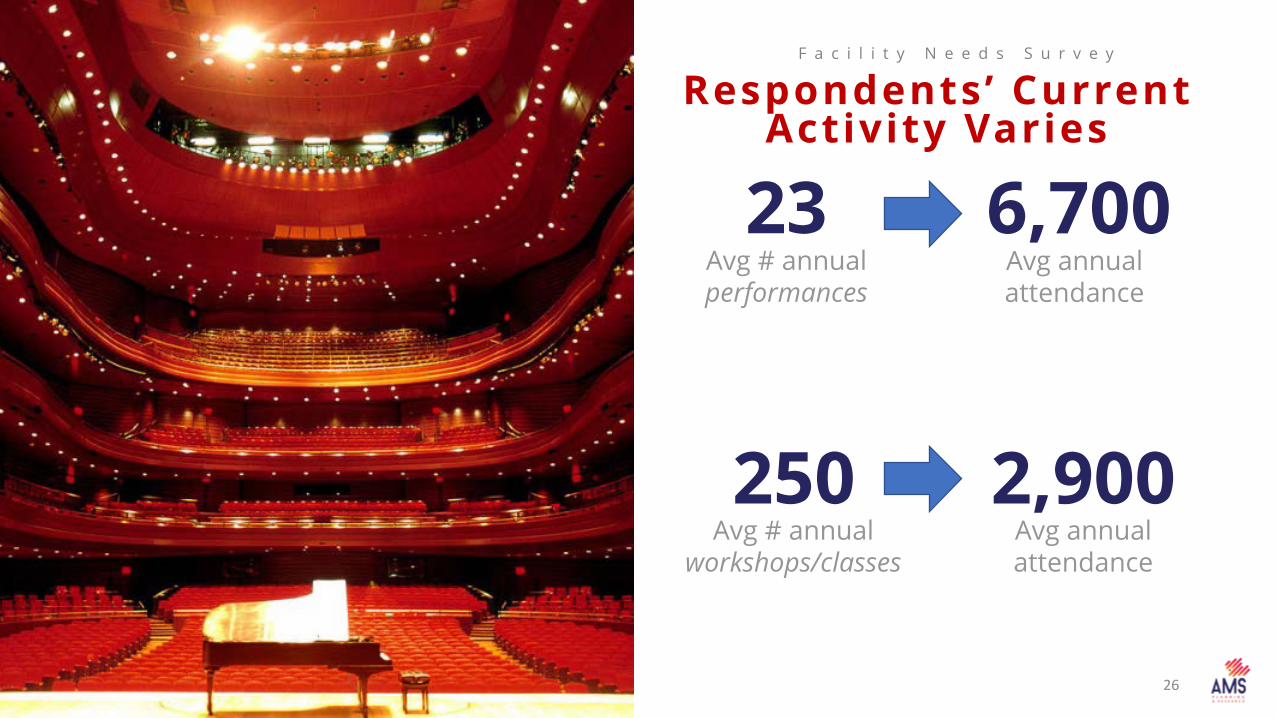
Avg # annual performances
23Avg annual attendance
6,700
F a c i l i t y N e e d s S u r v e y
Respondents’ Current Activity Varies
Avg # annual workshops/classes
250Avg annual attendance
2,900
26

F a c i l i t y N e e d s S u r v e y
Rancho Cordova Venue
How likely are you to use a new performance venue located in Rancho Cordova, assuming it meets your needs?
1 6 re s p o n d e n t s a re l i ke l y t o u s e a n ew v e n u e i n R a n c h o C o rd ov a
27

Classroom space14
F a c i l i t y N e e d s S u r v e y
Rancho Cordova VenueMost respondents need classroom space and a fixed proscenium
Proscenium stage with fixed seating
13Rehearsal room
9
Flexible black box8
Thrust stage4
28

F A C I L I T Y N E E D S S U R V E Y
Rancho Cordova VenueGreatest demand is between 500 – 850 seats
91 uses

Operating Model?Building Program?
Financial Forecasts?
Market Demand (audiences)
Supply of existing venues & programs
Communityattitudes,
opinions, & aspirations
Market Demand
(facility users)
Potential DirectionDiscussion

D i r e c t i o n s
Performance Space
31
D i r e c t i o n s
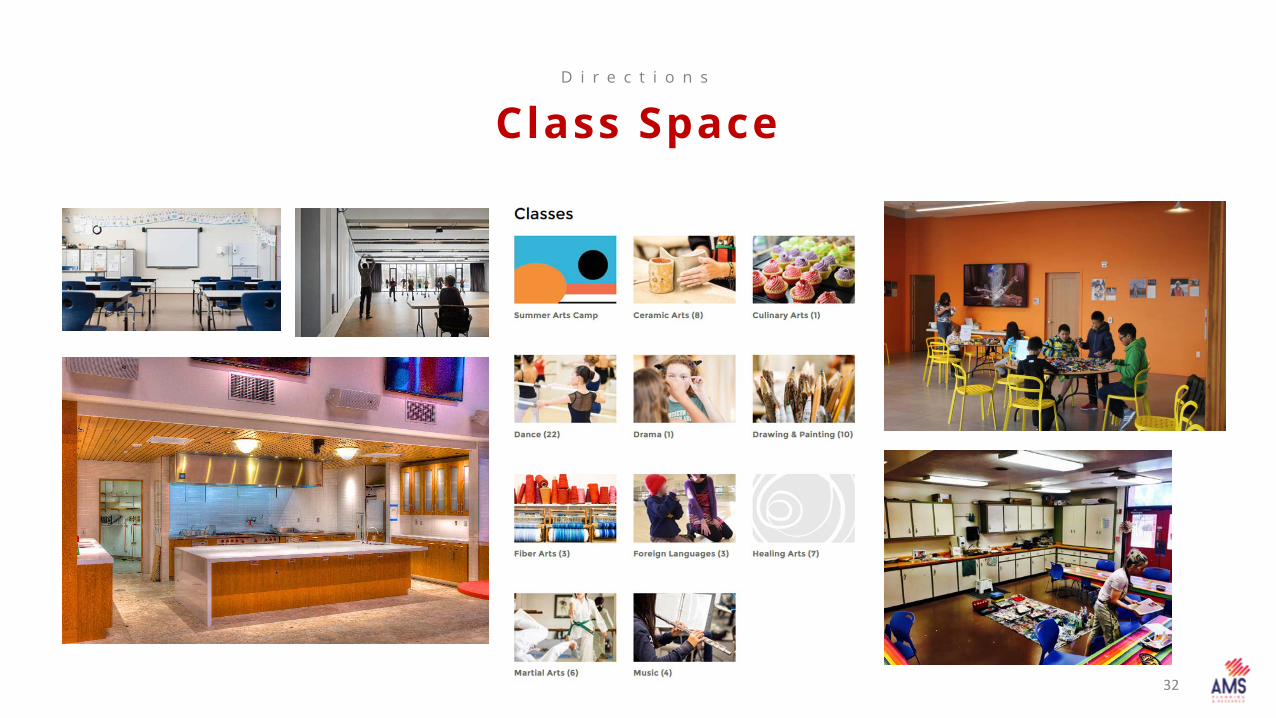
Class Space
32
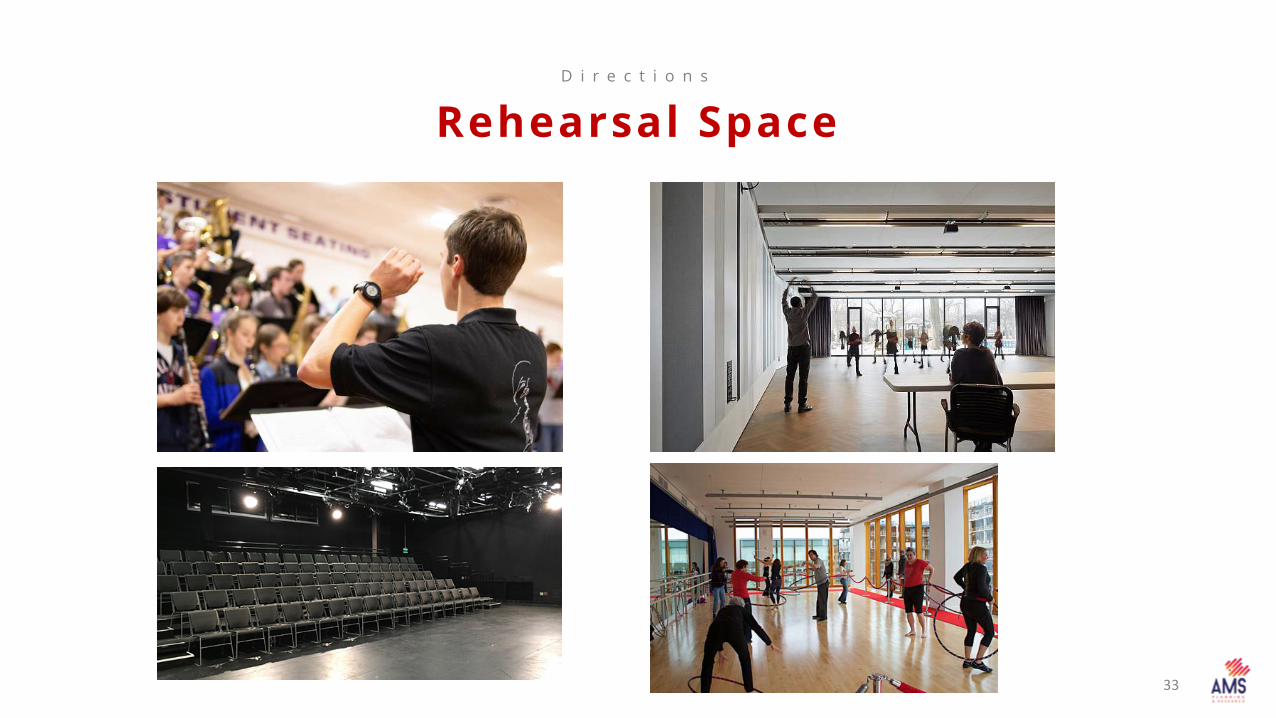
D i r e c t i o n s
Rehearsal Space
33

D i r e c t i o n s
Meeting Space
34
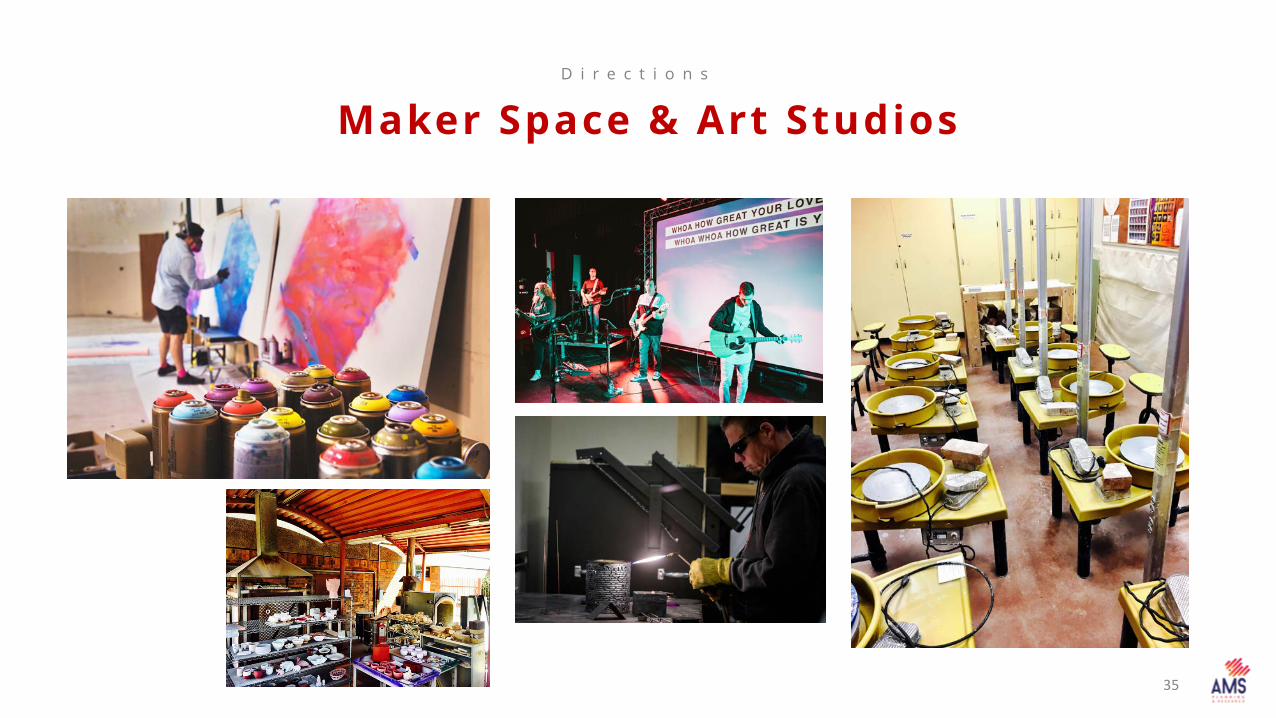
D i r e c t i o n s
Maker Space & Art Studios
35
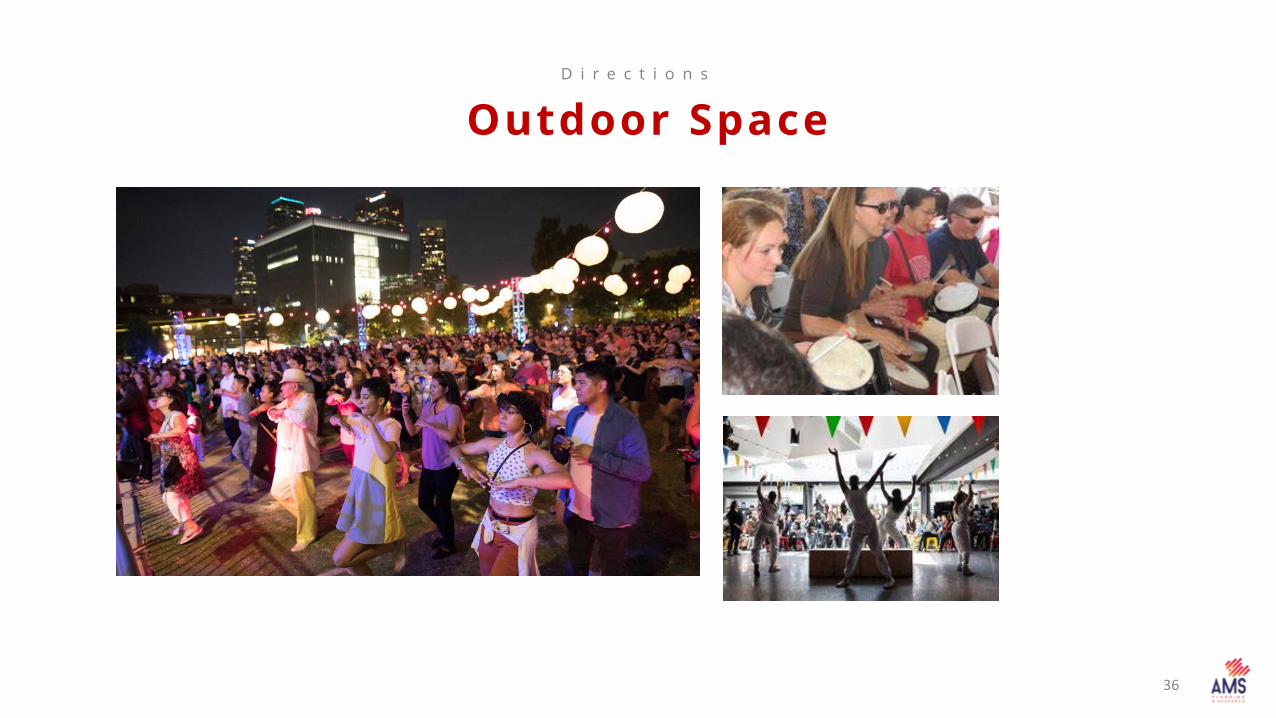
D i r e c t i o n s
Outdoor Space
36

Thank you