petrochemical industry - dedee-lib.dede.go.th/mm-data/bib11162.pdf1.2 types of petrochemical...
TRANSCRIPT
Disseminated Document
A Study on Energy Efficiency Index in
Petrochemical Industry
LOGO
A St d E Effi i I d i
Disseminated Document
A Study on Energy Efficiency Index in
Petrochemical Industry
Department of Alternative Energy Development and Efficiency (DEDE)
A Study on Energy Efficiency Index in Petrochemical Industry
Petrochemical Industry is one of the most important primary industries to
Thailand’s economic development. It is the foundation of wide variety of industrial production
processes such as plastic and container industry, textile industry, rubber industry, agricultural
and fertilizer industry. These industries help create tremendous value added to Thailand
exporting sector. In 2006, the exporting values of upstream, intermediate and downstream
petrochemical products are 27,694, 41,729 and 15,1468 million Baht, respectively. In addition,
the country also saves millions of bath per year on importing goods. The utilization of natural
gas in the process is also a right direction on increase the value of locally available raw material
which, in turn, benefit to Thai’s economy and society as a whole. Continued expansion of this
industrial sector is foreseeable in the future.
Production process of petrochemical industry is considered one of the most energy
intensive operations. Due to increase energy consumption trend of this industry and to correctly
accommodate the future economic expansion, it is important to facilitate this industry to
efficient energy management initiatives in order to optimize the whole process while maximize
the benefit. In addition to the gain from energy conservation and higher energy efficiency, this
will enhance the capability of the industry to compete on the global scale. From these reasons,
the Department of Alternative Energy Development and Efficiency (DEDE), a responsible governmental body who oversee the industrial energy management, considers this important
strategy and duty to promote the increase in energy efficiency of petrochemical industry. The
activities will be carried out under the Energy Conservation and Promotion Acts of 1992.
One strategy which the Department of Alternative Energy Development and Efficiency has been executed to urge the industry about the energy efficiency is the analysis of energy
usage per production unit (Energy Index, EI). Hence it is DEDE’s initiative to develop Energy
Consumption of Petrochemical Industry in Thailand project to use the energy consumption
data of this industry as a step to develop energy benchmarking standard. Moreover, the
acquired information may be evaluated for preparation of energy efficiency index and energy
conservation of each manufacturer. Finally, the outcome of this project may lead to the right
direction on defining the appropriate future plan for energy conservation plan of petrochemical
industry.
This report is to distribute the result of this project which includes the analysis of energy consumption index of petrochemical industry, approach on promotional plan for energy
conservation, and techniques for efficient energy usages. Authors hope that this report will
further be more or less useful to stake holders and any involved parties.
PREFACE
Department of Alternative Energy Development and Efficiency (DEDE)
A Study on Energy Efficiency Index in Petrochemical Industry
CONTENT
PREFACE
CHAPTER 1 : OVERVIEW OF THAILAND PETROCHEMICAL INDUSTRY 1
1.1 The Petrochemical Industry Structure 1
1.2 Types of Petrochemical Industry 4
1.3 Petrochemical Feedstock 6
1.4 How Petrochemical Industry Affects Economic System 7
1.5 Energy Consumption of Petrochemical Industry in Thailand 12
CHAPTER 2 : ENERGY CLASSIFICATION OF PETROCHEMICAL INDUSTRY 14
2.1 Classification of Petrochemical Industry 14
2.2 Production Processes 15
CHAPTER 3 : ENERGY CONSUMPTION IN PETROCHEMICAL INDUSTRY 22
3.1 Energy Consumption Index 22
3.2 Specific Energy Consumption (SEC) 23
3.3 Evaluation of Energy Intensity (EI) 29
CHAPTER 4 : THE PROMOTION OF ENERGY CONSERVATION 31
4.1 Problems in Petrochemical Industry 31
4.2 SWOT Analysis 32
4.3 Promotional Plan for Energy Conservation In The Petrochemical 33
CHAPTER5 : TECHNOLOGY AND MEASURES FOR ENERGY CONSERVATION IN PETROCHEMICAL INDUSTRY
36
5.1 Development and Improvement of Production Technology 36
5.2 Energy Efficiency Improvement for Processes and Equipments 40
SUMMARY 48
REFERENCES 50
LIST OF ABBREVIATION 52
prod
1.1
refin
chem
oil
adm
purp
petr
prod
petr
Petroch
ducts such as
The Petr
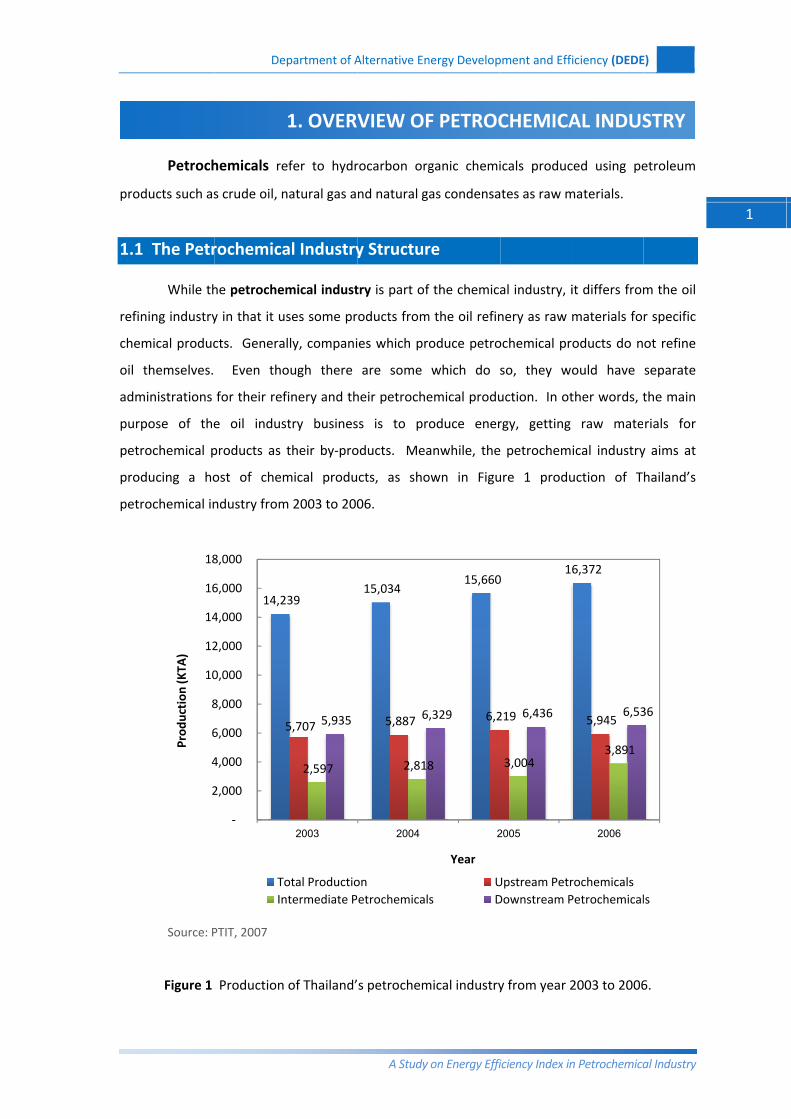
While th
ning industry
mical produc
themselves.
ministrations
pose of the
rochemical p
ducing a ho
rochemical in
Source: P
Figure 1
2
4
6
8
10
12
14
16
18
Prod
uction
(KTA
)
De
hemicals re
s crude oil, n
rochemica
he petrochem
y in that it u
cts. Genera
Even tho
for their ref
e oil indus
products as
ost of chem
ndustry from
PTIT, 2007
Production
14,2
5
‐
2,000
4,000
6,000
8,000
0,000
2,000
4,000
6,000
8,000
ToIn
partment of A
efer to hydr
natural gas a
al Industry
mical indust
ses some pr
lly, compani
ough there
finery and th
stry busines
their by‐pro
mical produ
m 2003 to 200
of Thailand’
39
5,707
2,597
5,935
2003
otal Productiontermediate P
1. OVERV
Alternative En
A Study
rocarbon org
nd natural g
y Structur
try is part of
oducts from
es which pr
are some
heir petroche
ss is to pr
oducts. Mea
cts, as sho
06.
s petrochem
15,034
5,887
2,818
6,
2004
onetrochemical
VIEW OF
nergy Develop
on Energy Effi
ganic chemi
as condensa
re
f the chemica
m the oil refin
oduce petro
which do s
emical produ
oduce ener
anwhile, the
own in Figu
mical industry
15,660
6,2
8
,329
2
Year
Us D
F PETROC
pment and Effi
iciency Index in
icals produc
tes as raw m
al industry, i
nery as raw
ochemical pr
so, they wo
uction. In ot
rgy, getting
petrochem
ure 1 produ
y from year 2
0 1
219
3,004
6,436
2005
Upstream PetrDownstream P
CHEMICA
iciency (DEDE
n Petrochemica
ced using pe
materials.
it differs from
materials fo
oducts do n
ould have
ther words, t
raw mate
ical industry
uction of T
2003 to 2006
6,372
5,945
3,891
6,53
2006
rochemicalsPetrochemical
AL INDUS
E)
al Industry
etroleum
m the oil
r specific
ot refine
separate
the main
rials for
y aims at
hailand’s
6.
36
ls
STRY
1
Department of Alternative Energy Development and Efficiency (DEDE)
A Study on Energy Efficiency Index in Petrochemical Industry
2
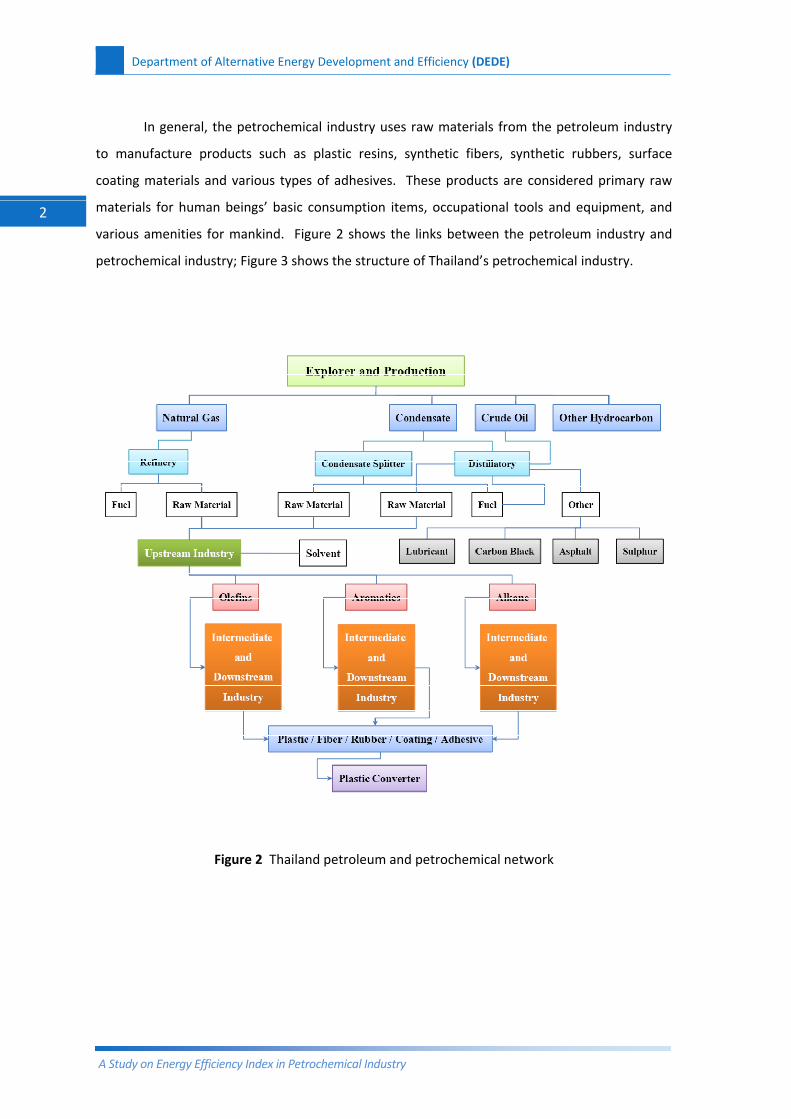
In general, the petrochemical industry uses raw materials from the petroleum industry
to manufacture products such as plastic resins, synthetic fibers, synthetic rubbers, surface
coating materials and various types of adhesives. These products are considered primary raw
materials for human beings’ basic consumption items, occupational tools and equipment, and
various amenities for mankind. Figure 2 shows the links between the petroleum industry and
petrochemical industry; Figure 3 shows the structure of Thailand’s petrochemical industry.
Figure 2 Thailand petroleum and petrochemical network

Soource: PTIT, 20
De
006
partment of A
Figure 3 Th
Alternative En
A Study
ailand petroch
nergy Develop
on Energy Effi
hemical comp
pment and Effi
iciency Index in
plex flows
iciency (DEDE
n Petrochemica
E)
al Industry
3

Department of Alternative Energy Development and Efficiency (DEDE)
A Study on Energy Efficiency Index in Petrochemical Industry
4
1.2 Types of Petrochemical Industry
The petrochemical industry is classified into 3 main groups, on the basis of their
products (as shown in Figure 4).
Upstream Petrochemical Industry
Intermediate Petrochemical Industry
Downstream Petrochemical Industry
Figure 4 Overview of Thailand petrochemical industry
1.2.1 Upstream Petrochemical Industry
Upstream petrochemical industry is the production of petrochemical products which are
feedstock for further production of other petrochemical products (intermediate and
downstream). It consists of 7 kinds of products, or “the Seven Sisters”, which are divided into
the following 3 groups on the basis of their molecular structure:
Alkane group, which is methane‐based
Olefin group, which is ethylene‐based, propylene‐based and Mixed C4‐based
Aromatic group, which is benzene‐based, toluene‐based and xylene‐based
Supporting: Infrastructure, Logistic, HR, Finance, Rules& Regulations
Value chain component
Key activities • E&P
• Oil Refinery
• Gas separation
• Olefins
- Ethylene - Propylene
• Aromatics
- Benzene
- Para-Xylene
• Plastic Resins Commodity (PE, PP, PVC, PS, EPS,
PET) Engineering (PC, POM, PBT*, Nylon
6,6*, PMMA) Synthetic Fibre - Polyester - Nylon 6 - Polypropylene - Acrylic Syn. Rubber/ Elastomers
- BR, SBR, EPDM* Syn. Coating/ Adhesives - PVA*, Silicone
• Compounding
• Olefins - EDC/VCM - EO**/EG** - Oxo Alcohol* - Acrylonitrile* • Aromatics - Ethylbenzene** - Styrene - Cyclohexane** - Caprolactam - Cumene/Phenol** - PTA -PA
Conversion Industries
Downstream
Intermediate
Upstream
Oil & Gas
Note: * No local production, ** Investment in progress
Department of Alternative Energy Development and Efficiency (DEDE)
A Study on Energy Efficiency Index in Petrochemical Industry
5
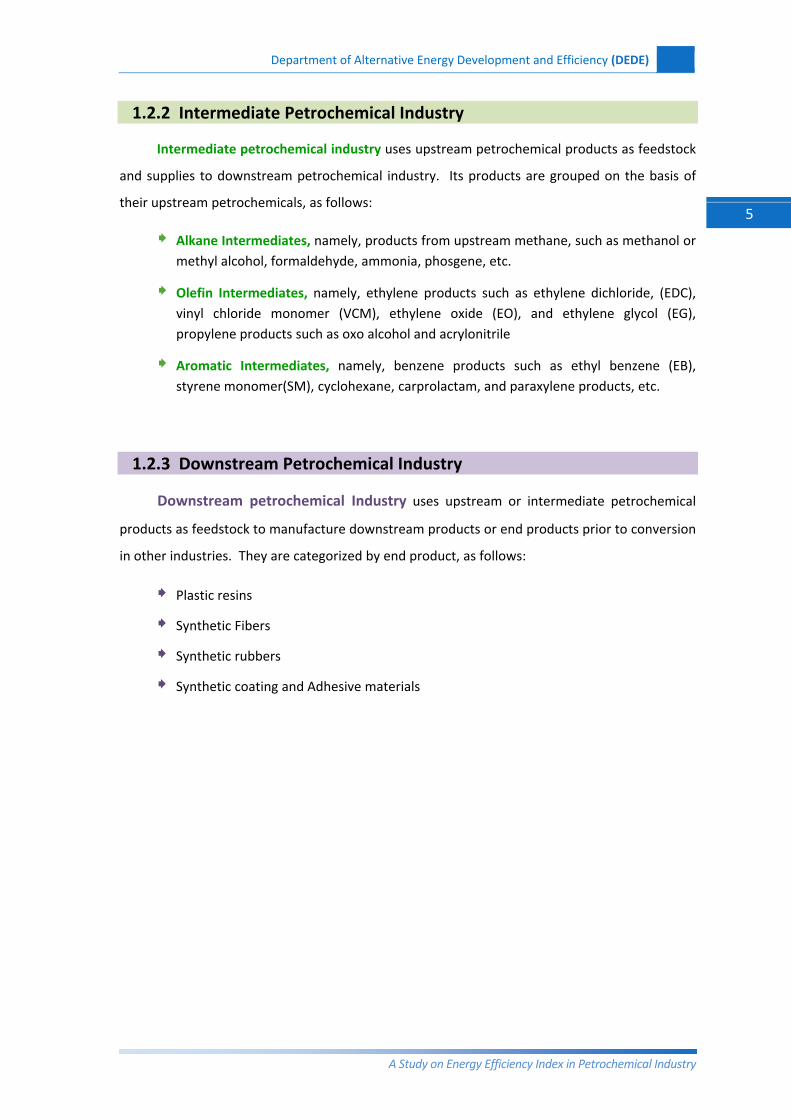
1.2.2 Intermediate Petrochemical Industry
Intermediate petrochemical industry uses upstream petrochemical products as feedstock
and supplies to downstream petrochemical industry. Its products are grouped on the basis of
their upstream petrochemicals, as follows:
Alkane Intermediates, namely, products from upstream methane, such as methanol or methyl alcohol, formaldehyde, ammonia, phosgene, etc.
Olefin Intermediates, namely, ethylene products such as ethylene dichloride, (EDC), vinyl chloride monomer (VCM), ethylene oxide (EO), and ethylene glycol (EG), propylene products such as oxo alcohol and acrylonitrile
Aromatic Intermediates, namely, benzene products such as ethyl benzene (EB), styrene monomer(SM), cyclohexane, carprolactam, and paraxylene products, etc.
1.2.3 Downstream Petrochemical Industry
Downstream petrochemical Industry uses upstream or intermediate petrochemical
products as feedstock to manufacture downstream products or end products prior to conversion
in other industries. They are categorized by end product, as follows:
Plastic resins Synthetic Fibers Synthetic rubbers Synthetic coating and Adhesive materials
ดิบสําหรับการผลิตอุตสาหกรรมปโตรเคมี
Department of Alternative Energy Development and Efficiency (DEDE)
A Study on Energy Efficiency Index in Petrochemical Industry
6
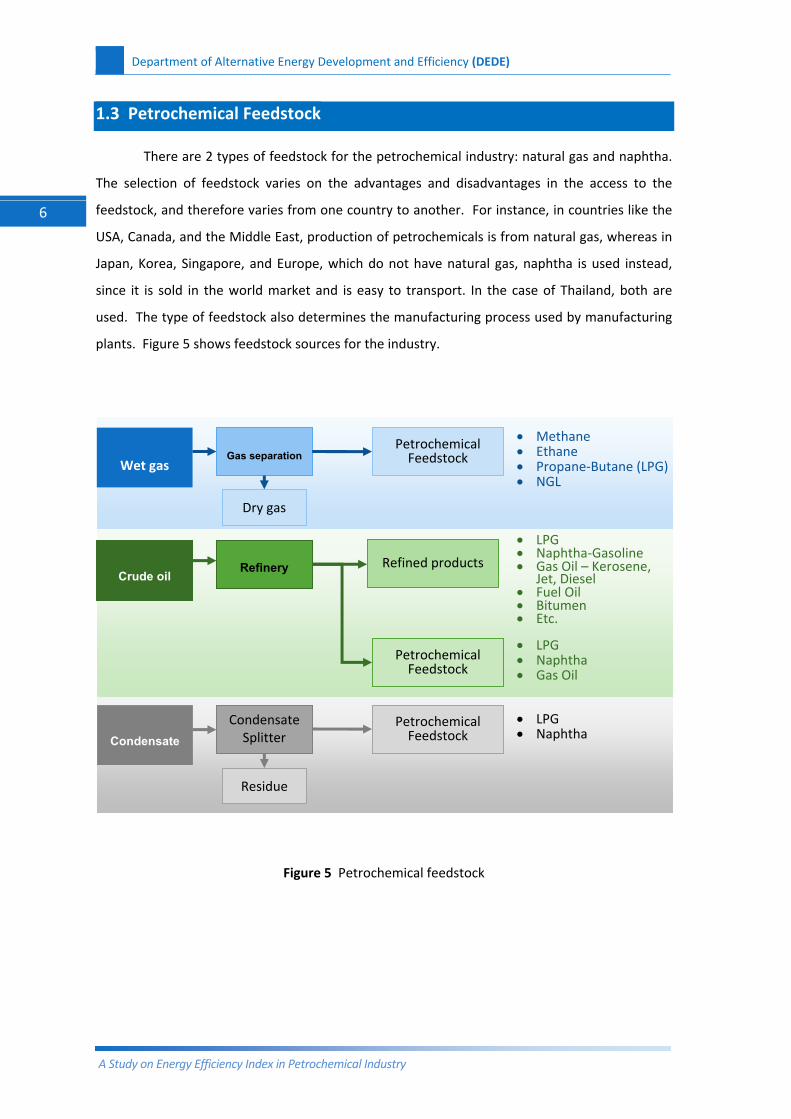
1.3 Petrochemical Feedstock
There are 2 types of feedstock for the petrochemical industry: natural gas and naphtha.
The selection of feedstock varies on the advantages and disadvantages in the access to the
feedstock, and therefore varies from one country to another. For instance, in countries like the
USA, Canada, and the Middle East, production of petrochemicals is from natural gas, whereas in
Japan, Korea, Singapore, and Europe, which do not have natural gas, naphtha is used instead,
since it is sold in the world market and is easy to transport. In the case of Thailand, both are
used. The type of feedstock also determines the manufacturing process used by manufacturing
plants. Figure 5 shows feedstock sources for the industry.
Figure 5 Petrochemical feedstock
Gas separation Wet gas
Refinery
Crude oil
Condensate Splitter
Condensate
Petrochemical Feedstock
Refined products
Petrochemical Feedstock
Petrochemical Feedstock
• Methane • Ethane • Propane‐Butane (LPG) • NGL
• LPG • Naphtha‐Gasoline • Gas Oil – Kerosene,
Jet, Diesel • Fuel Oil • Bitumen • Etc.
• LPG• Naphtha • Gas Oil
• LPG• Naphtha
Dry gas
Residue
Department of Alternative Energy Development and Efficiency (DEDE)
A Study on Energy Efficiency Index in Petrochemical Industry
7
1.4 How Petrochemical Industry Affects Economic System
1.4.1 The Role of Petrochemical Industry in Thailand
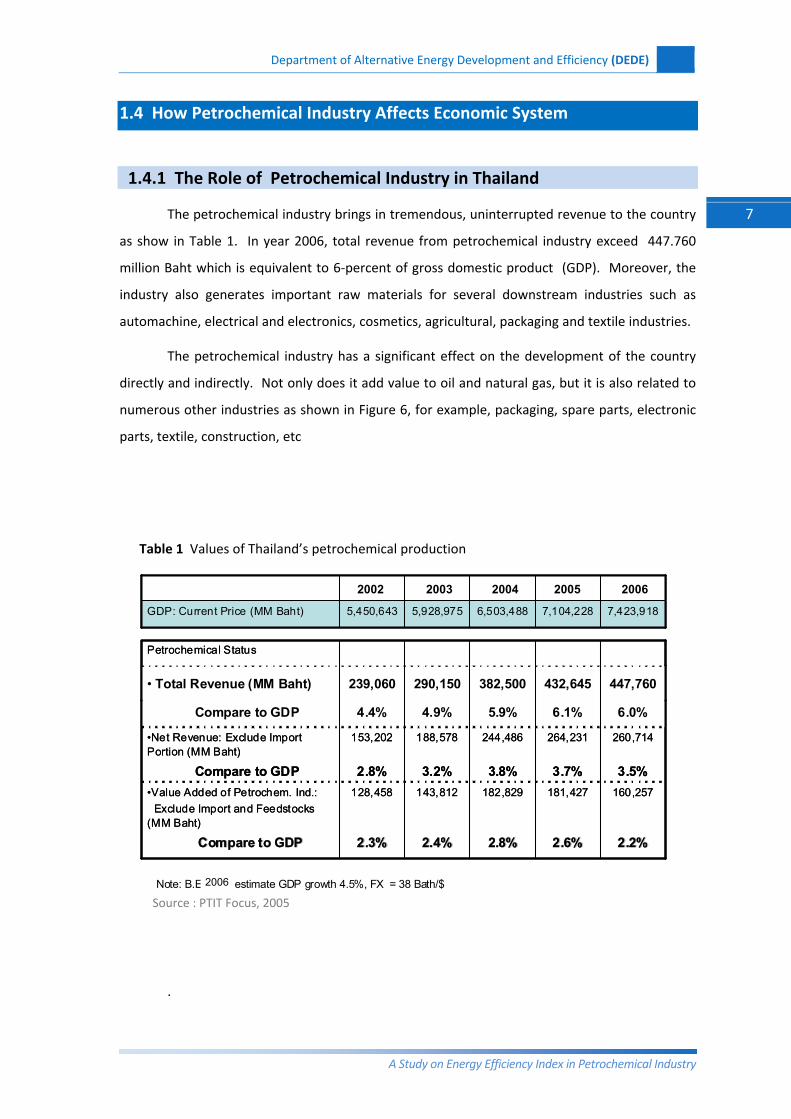
The petrochemical industry brings in tremendous, uninterrupted revenue to the country
as show in Table 1. In year 2006, total revenue from petrochemical industry exceed 447.760
million Baht which is equivalent to 6‐percent of gross domestic product (GDP). Moreover, the
industry also generates important raw materials for several downstream industries such as
automachine, electrical and electronics, cosmetics, agricultural, packaging and textile industries.
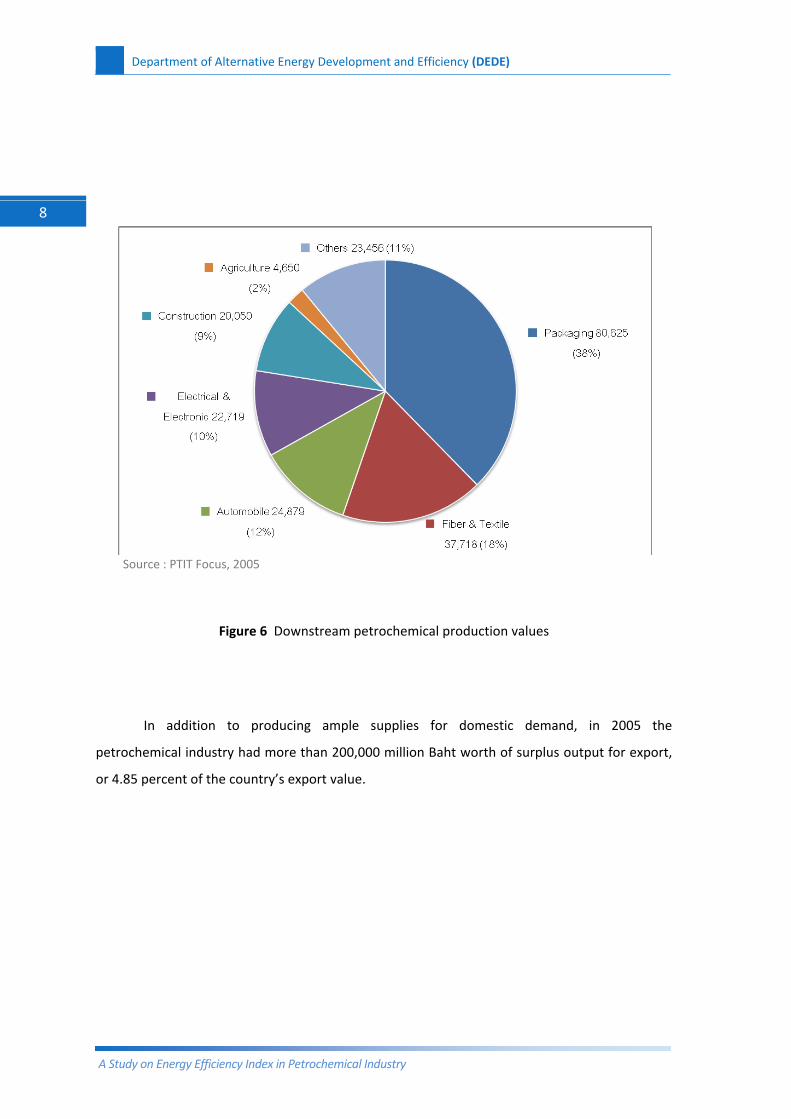
The petrochemical industry has a significant effect on the development of the country
directly and indirectly. Not only does it add value to oil and natural gas, but it is also related to
numerous other industries as shown in Figure 6, for example, packaging, spare parts, electronic
parts, textile, construction, etc
Table 1 Values of Thailand’s petrochemical production
Source : PTIT Focus, 2005
.
6.0%6.1%5.9%4.9%4.4%Compare to GDP
2.2%2.2%2.6%2.6%2.8%2.8%2.4%2.4%2.3%2.3%Compare to GDPCompare to GDP
160,257181,427182,829143,812128,458•Value Added of Petrochem. Ind.: Exclude Import and Feedstocks
(MM Baht)
3.5%3.7%3.8%3.2%2.8%Compare to GDP
260,714264,231244,486188,578153,202•Net Revenue: Exclude Import Portion (MM Baht)
447,760432,645382,500290,150239,060• Total Revenue (MM Baht)
Petrochemical Status
7,423,918 7,104,2286,503,4885,928,9755,450,643GDP: Current Price (MM Baht)
25492548254725462545
Note: B.E. 2549 estimate GDP growth 4.5%, FX = 38 Bath/$
2002 2003 2004 2005 2006
2006
Department of Alternative Energy Development and Efficiency (DEDE)
A Study on Energy Efficiency Index in Petrochemical Industry
8
Source : PTIT Focus, 2005
Figure 6 Downstream petrochemical production values
In addition to producing ample supplies for domestic demand, in 2005 the
petrochemical industry had more than 200,000 million Baht worth of surplus output for export,
or 4.85 percent of the country’s export value.
Department of Alternative Energy Development and Efficiency (DEDE)
A Study on Energy Efficiency Index in Petrochemical Industry
9
Source : PTIT Focus, 2005
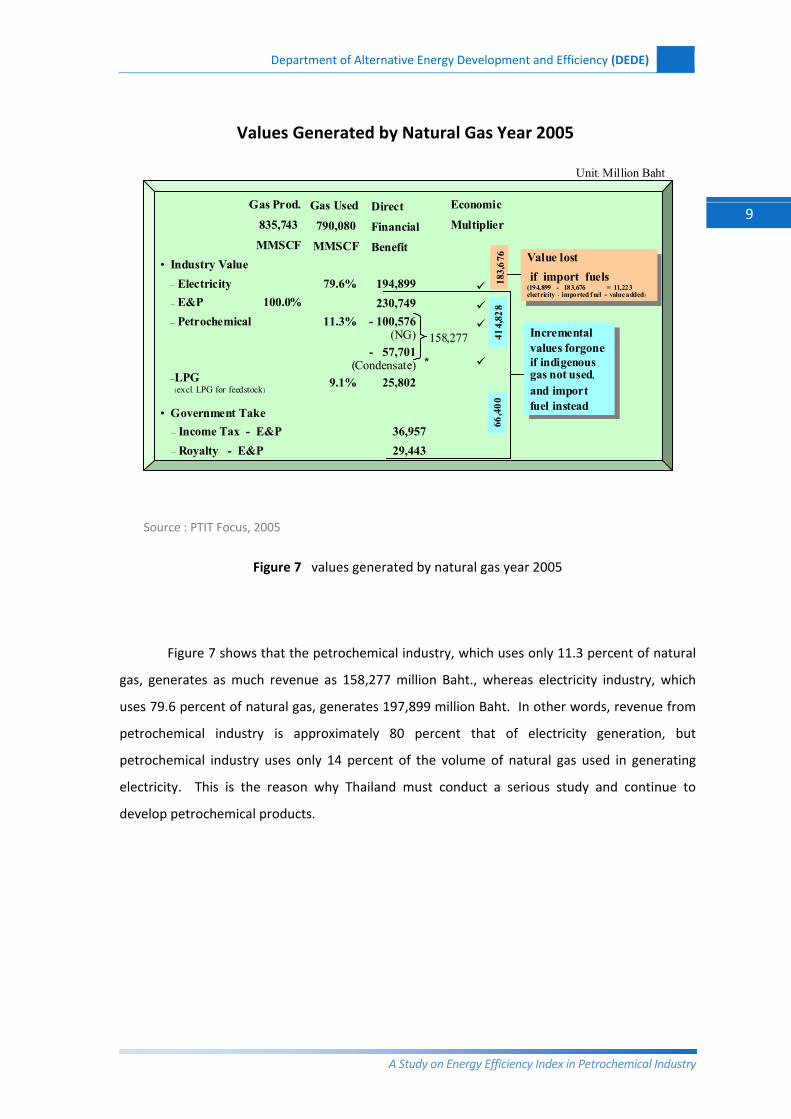
Figure 7 values generated by natural gas year 2005
Figure 7 shows that the petrochemical industry, which uses only 11.3 percent of natural
gas, generates as much revenue as 158,277 million Baht., whereas electricity industry, which
uses 79.6 percent of natural gas, generates 197,899 million Baht. In other words, revenue from
petrochemical industry is approximately 80 percent that of electricity generation, but
petrochemical industry uses only 14 percent of the volume of natural gas used in generating
electricity. This is the reason why Thailand must conduct a serious study and continue to
develop petrochemical products.
Values Generated by Natural Gas – B.E. 2548
Incremental values forgone if indigenous gas not used,and import fuel instead
Incremental values forgone if indigenous gas not used,and import fuel instead
414,
828
66,4
0018
3 ,6 7
6
Value lostif import fuels
(194,899 - 183,676 = 11,223electricity - imported fuel = value added)
Value lostif import fuels
(194,899 - 183,676 = 11,223electricity - imported fuel = value added)
Gas Used
790,080
MMSCF
(excl. LPG for feedstock)
Unit: Million Baht
• Industry Value– Electricity– E&P– Petrochemical
–LPG
Gas Prod.
835,743
MMSCF
79.6%100.0%
11.3%
9.1%
Direct
Financial
Benefit
Economic
Multiplier
194,899230,749
- 100,576(NG)
- 57,701 (Condensate)
25,802
• Government Take– Income Tax - E&P 36,957– Royalty - E&P 29,443
*
158,277
Values Generated by Natural Gas Year 2005
Department of Alternative Energy Development and Efficiency (DEDE)
A Study on Energy Efficiency Index in Petrochemical Industry
10
1.4.2 Petrochemical Production
1) Production
• Production Capacity
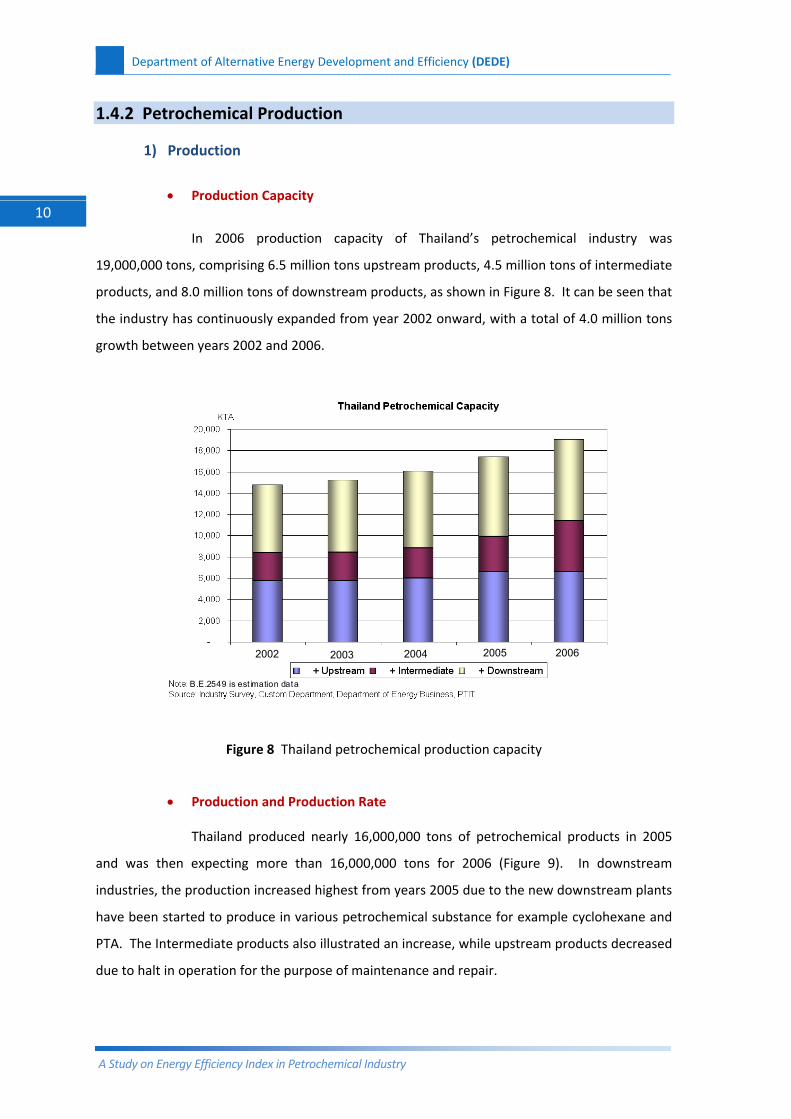
In 2006 production capacity of Thailand’s petrochemical industry was
19,000,000 tons, comprising 6.5 million tons upstream products, 4.5 million tons of intermediate
products, and 8.0 million tons of downstream products, as shown in Figure 8. It can be seen that
the industry has continuously expanded from year 2002 onward, with a total of 4.0 million tons
growth between years 2002 and 2006.
Figure 8 Thailand petrochemical production capacity
• Production and Production Rate
Thailand produced nearly 16,000,000 tons of petrochemical products in 2005
and was then expecting more than 16,000,000 tons for 2006 (Figure 9). In downstream
industries, the production increased highest from years 2005 due to the new downstream plants
have been started to produce in various petrochemical substance for example cyclohexane and
PTA. The Intermediate products also illustrated an increase, while upstream products decreased
due to halt in operation for the purpose of maintenance and repair.
B.E.2549 is est imation data
2545 2546 2547 2548 25492002 2003 2004 2005 2006
Department of Alternative Energy Development and Efficiency (DEDE)
A Study on Energy Efficiency Index in Petrochemical Industry
11
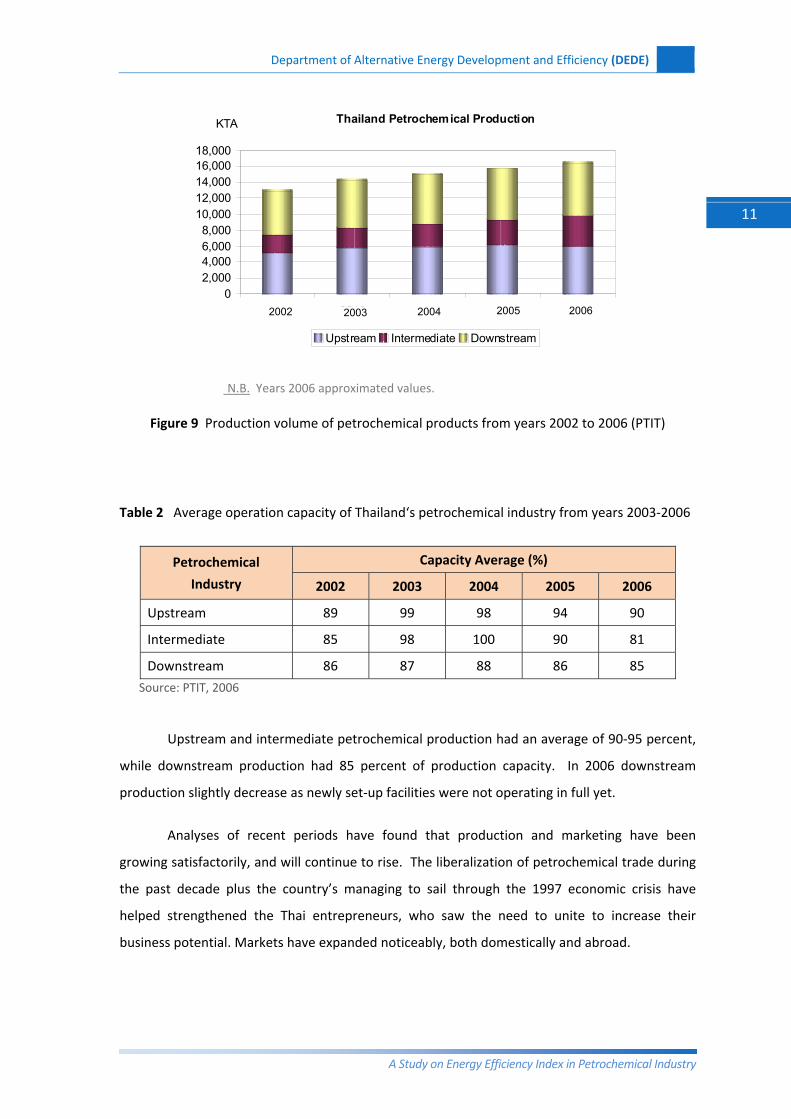
N.B. Years 2006 approximated values.
Figure 9 Production volume of petrochemical products from years 2002 to 2006 (PTIT)
Table 2 Average operation capacity of Thailand‘s petrochemical industry from years 2003‐2006
Petrochemical
Industry
Capacity Average (%)
2002 2003 2004 2005 2006
Upstream 89 99 98 94 90
Intermediate 85 98 100 90 81
Downstream 86 87 88 86 85
Source: PTIT, 2006
Upstream and intermediate petrochemical production had an average of 90‐95 percent,
while downstream production had 85 percent of production capacity. In 2006 downstream
production slightly decrease as newly set‐up facilities were not operating in full yet.
Analyses of recent periods have found that production and marketing have been
growing satisfactorily, and will continue to rise. The liberalization of petrochemical trade during
the past decade plus the country’s managing to sail through the 1997 economic crisis have
helped strengthened the Thai entrepreneurs, who saw the need to unite to increase their
business potential. Markets have expanded noticeably, both domestically and abroad.
Thailand Petrochemical Production
02,0004,0006,0008,000
10,00012,00014,00016,00018,000
2545 2546 2547 2548 2549
KTA
Upstream Intermediate Downstream
2002 2003 2004 2005 2006
Department of Alternative Energy Development and Efficiency (DEDE)
A Study on Energy Efficiency Index in Petrochemical Industry
12
1.5 Energy Consumption of Petrochemical Industry in Thailand
The petrochemical industry relies heavily on energy. With its present growth rate, and
as companies are also constantly trying to expand their production, consumption of electricity,
gas and fuels will increase unavoidably, no matter how much emphasis is given to energy
conservation.
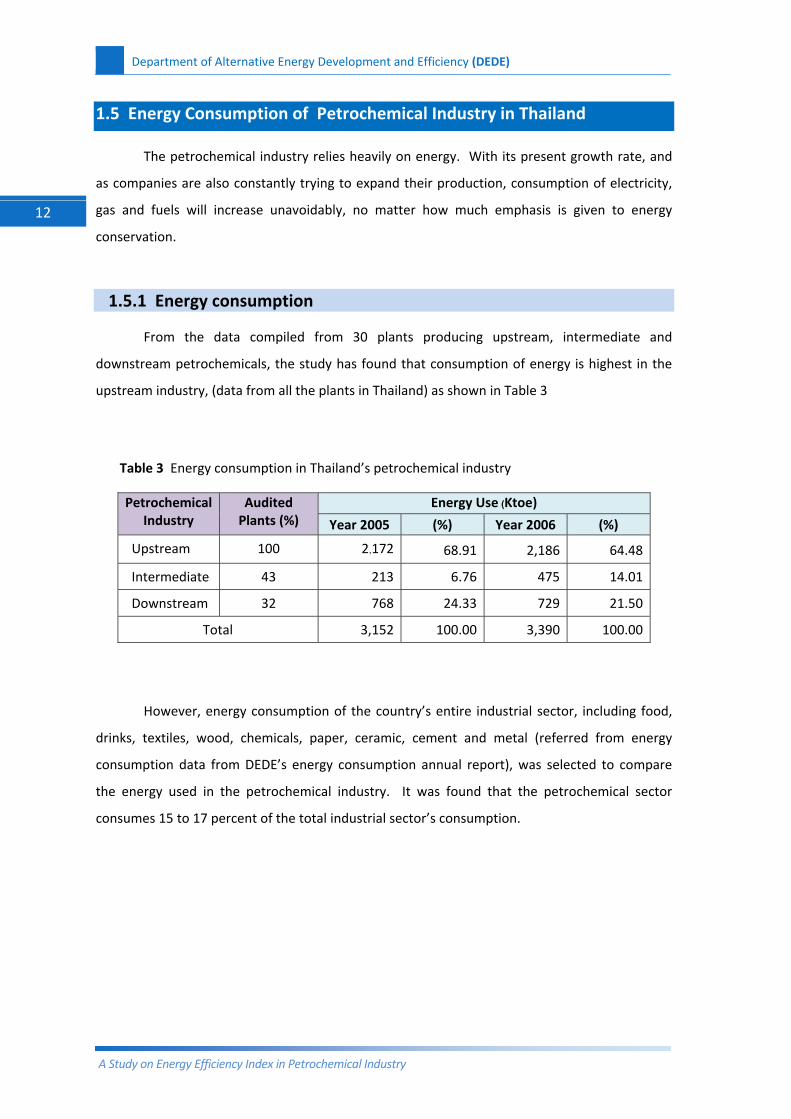
1.5.1 Energy consumption
From the data compiled from 30 plants producing upstream, intermediate and
downstream petrochemicals, the study has found that consumption of energy is highest in the
upstream industry, (data from all the plants in Thailand) as shown in Table 3
Table 3 Energy consumption in Thailand’s petrochemical industry
Petrochemical Industry
Audited Plants (%)
Energy Use (Ktoe)
Year 2005 (%) Year 2006 (%)
Upstream 100 2,172 68.91 2,186 64.48
Intermediate 43 213 6.76 475 14.01
Downstream 32 768 24.33 729 21.50
Total 3,152 100.00 3,390 100.00
However, energy consumption of the country’s entire industrial sector, including food,
drinks, textiles, wood, chemicals, paper, ceramic, cement and metal (referred from energy
consumption data from DEDE’s energy consumption annual report), was selected to compare
the energy used in the petrochemical industry. It was found that the petrochemical sector
consumes 15 to 17 percent of the total industrial sector’s consumption.
Department of Alternative Energy Development and Efficiency (DEDE)
A Study on Energy Efficiency Index in Petrochemical Industry
13
Electricity6%
Steam38%
Natural Gas42%
LPG 0.6%
Diesel0.6%
Fuel Oil1.7% Others
11.1%
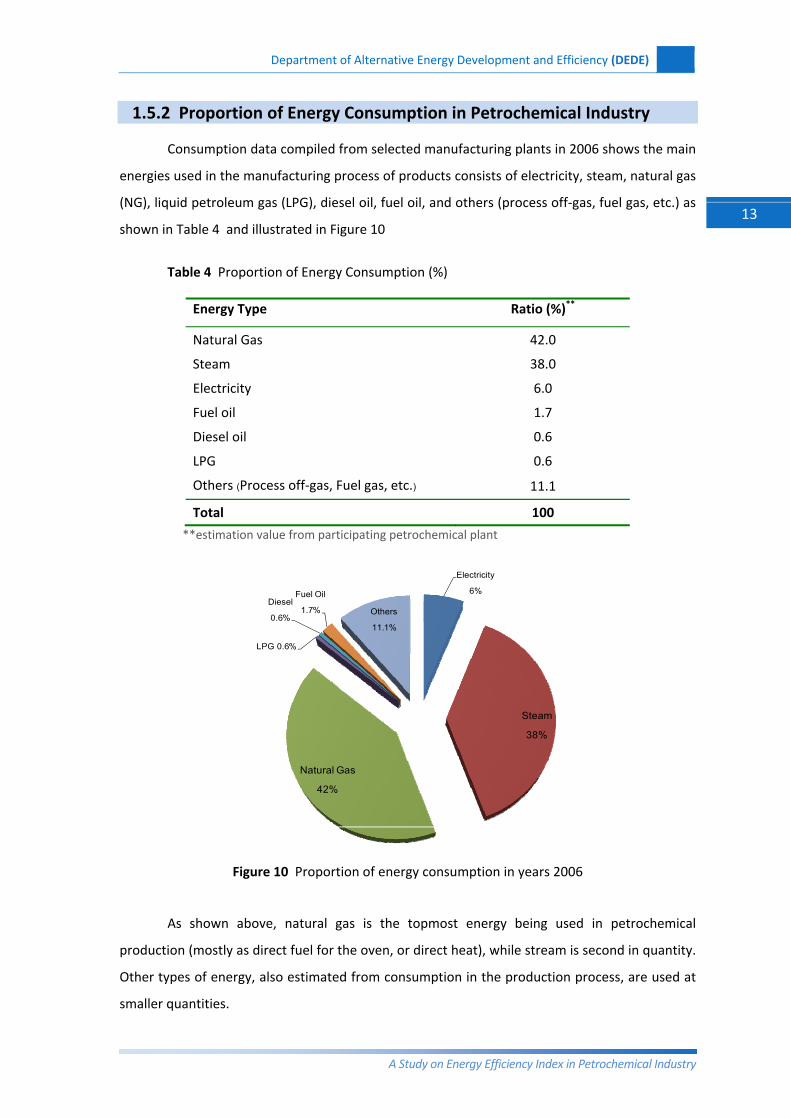
1.5.2 Proportion of Energy Consumption in Petrochemical Industry
Consumption data compiled from selected manufacturing plants in 2006 shows the main
energies used in the manufacturing process of products consists of electricity, steam, natural gas
(NG), liquid petroleum gas (LPG), diesel oil, fuel oil, and others (process off‐gas, fuel gas, etc.) as
shown in Table 4 and illustrated in Figure 10
Table 4 Proportion of Energy Consumption (%)
Energy Type Ratio (%)**
Natural Gas 42.0
Steam 38.0
Electricity 6.0
Fuel oil 1.7
Diesel oil 0.6
LPG 0.6
Others (Process off‐gas, Fuel gas, etc.) 11.1
Total 100
**estimation value from participating petrochemical plant
Figure 10 Proportion of energy consumption in years 2006
As shown above, natural gas is the topmost energy being used in petrochemical
production (mostly as direct fuel for the oven, or direct heat), while stream is second in quantity.
Other types of energy, also estimated from consumption in the production process, are used at
smaller quantities.
Department of Alternative Energy Development and Efficiency (DEDE)
A Study on Energy Efficiency Index in Petrochemical Industry
14
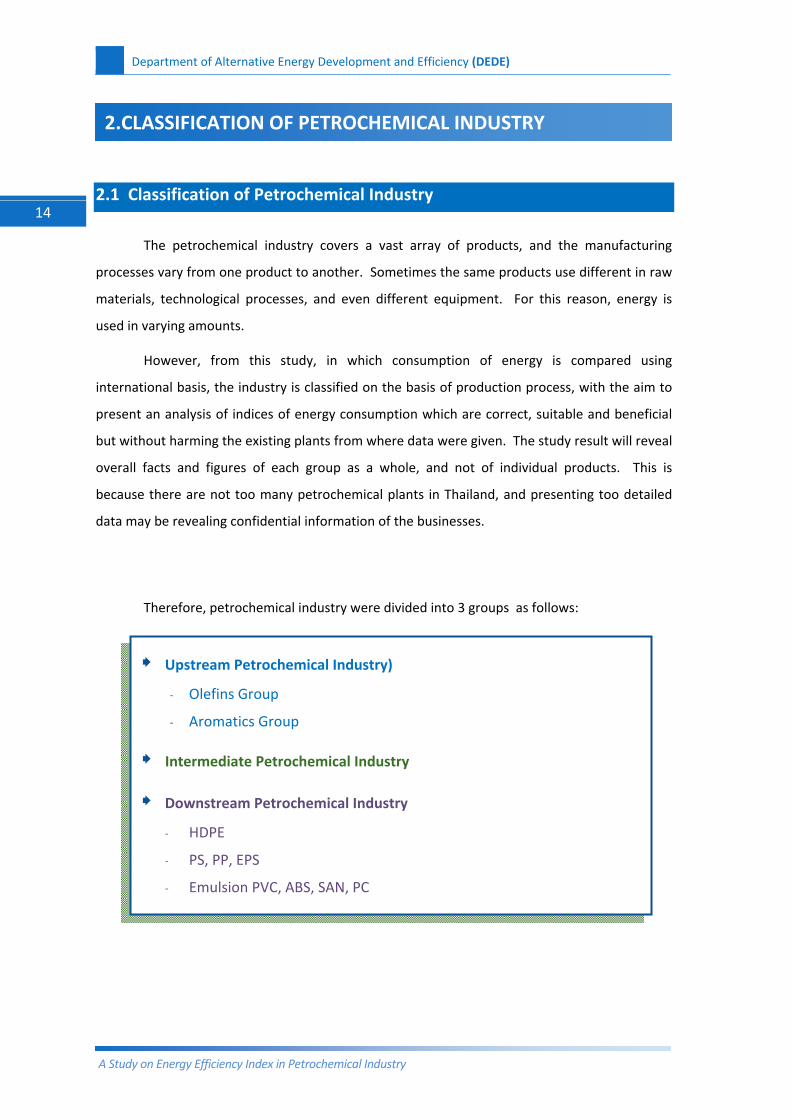
2.1 Classification of Petrochemical Industry
The petrochemical industry covers a vast array of products, and the manufacturing
processes vary from one product to another. Sometimes the same products use different in raw
materials, technological processes, and even different equipment. For this reason, energy is
used in varying amounts.
However, from this study, in which consumption of energy is compared using
international basis, the industry is classified on the basis of production process, with the aim to
present an analysis of indices of energy consumption which are correct, suitable and beneficial
but without harming the existing plants from where data were given. The study result will reveal
overall facts and figures of each group as a whole, and not of individual products. This is
because there are not too many petrochemical plants in Thailand, and presenting too detailed
data may be revealing confidential information of the businesses.
Therefore, petrochemical industry were divided into 3 groups as follows:
Upstream Petrochemical Industry)
- Olefins Group
- Aromatics Group
Intermediate Petrochemical Industry
Downstream Petrochemical Industry
- HDPE
- PS, PP, EPS
- Emulsion PVC, ABS, SAN, PC
2.CLASSIFICATION OF PETROCHEMICAL INDUSTRY
Department of Alternative Energy Development and Efficiency (DEDE)
A Study on Energy Efficiency Index in Petrochemical Industry
15
1) Cracking Process Cracking is a process in which molecules of raw material are dissociated into smaller
ones. There are two types of cracking process, thermal steam cracking and catalytic cracking.
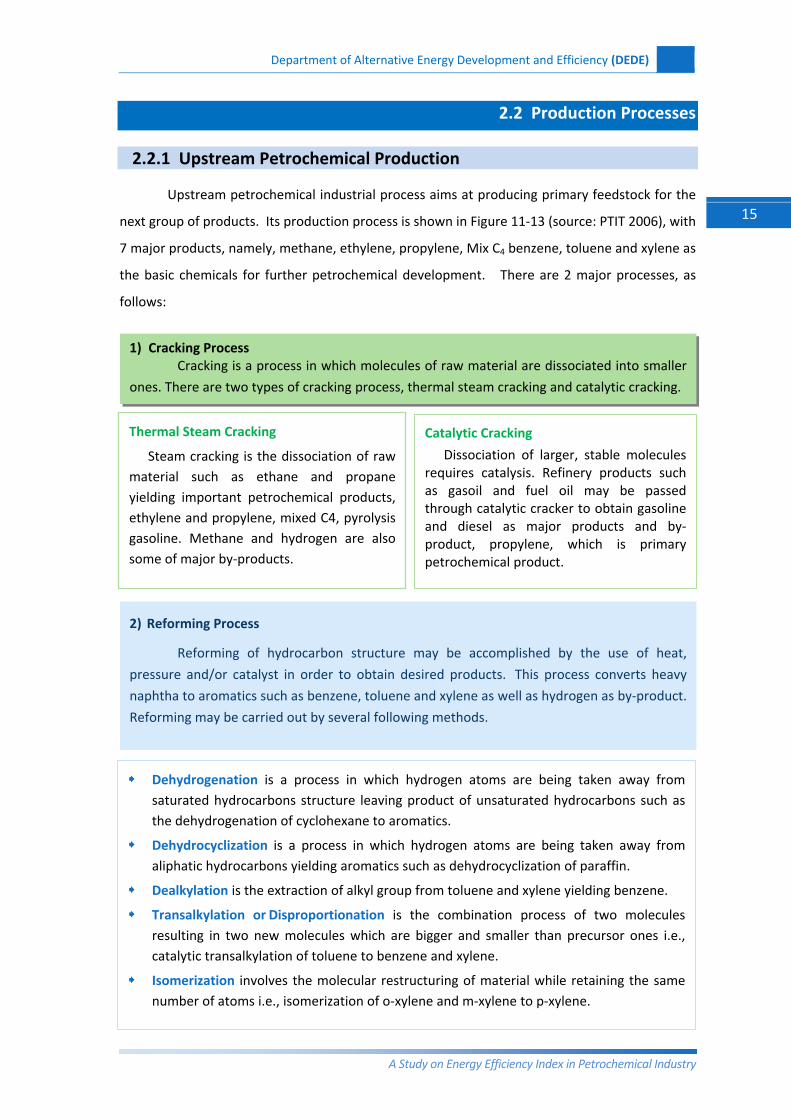
2.2 Production Processes
2.2.1 Upstream Petrochemical Production
Upstream petrochemical industrial process aims at producing primary feedstock for the
next group of products. Its production process is shown in Figure 11‐13 (source: PTIT 2006), with
7 major products, namely, methane, ethylene, propylene, Mix C4 benzene, toluene and xylene as
the basic chemicals for further petrochemical development. There are 2 major processes, as
follows:
Thermal Steam Cracking
Steam cracking is the dissociation of raw material such as ethane and propane yielding important petrochemical products, ethylene and propylene, mixed C4, pyrolysis gasoline. Methane and hydrogen are also some of major by‐products.
Catalytic Cracking
Dissociation of larger, stable molecules requires catalysis. Refinery products such as gasoil and fuel oil may be passed through catalytic cracker to obtain gasoline and diesel as major products and by‐product, propylene, which is primary petrochemical product.
2) Reforming Process
Reforming of hydrocarbon structure may be accomplished by the use of heat,
pressure and/or catalyst in order to obtain desired products. This process converts heavy
naphtha to aromatics such as benzene, toluene and xylene as well as hydrogen as by‐product.
Reforming may be carried out by several following methods.
Dehydrogenation is a process in which hydrogen atoms are being taken away from saturated hydrocarbons structure leaving product of unsaturated hydrocarbons such as the dehydrogenation of cyclohexane to aromatics.
Dehydrocyclization is a process in which hydrogen atoms are being taken away from aliphatic hydrocarbons yielding aromatics such as dehydrocyclization of paraffin.
Dealkylation is the extraction of alkyl group from toluene and xylene yielding benzene.
Transalkylation or Disproportionation is the combination process of two molecules resulting in two new molecules which are bigger and smaller than precursor ones i.e., catalytic transalkylation of toluene to benzene and xylene.
Isomerization involves the molecular restructuring of material while retaining the same number of atoms i.e., isomerization of o‐xylene and m‐xylene to p‐xylene.
Department of Alternative Energy Development and Efficiency (DEDE)
A Study on Energy Efficiency Index in Petrochemical Industry
16
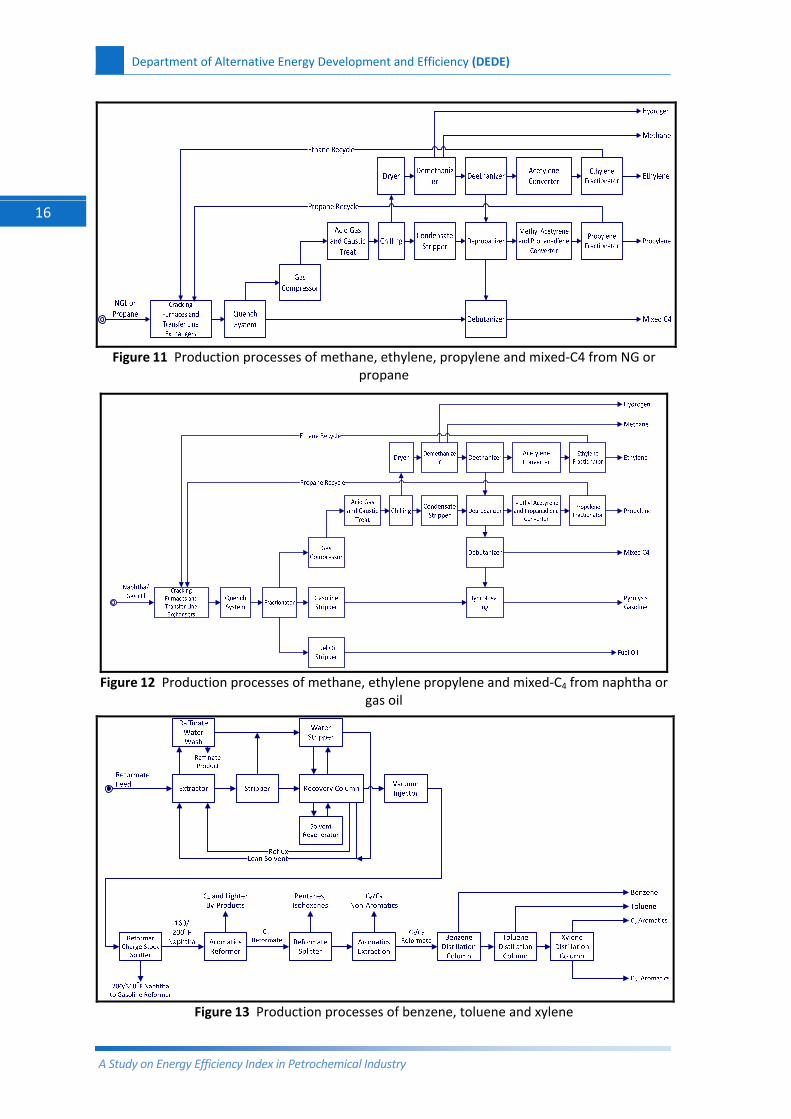
Figure 11 Production processes of methane, ethylene, propylene and mixed‐C4 from NG or propane
Figure 12 Production processes of methane, ethylene propylene and mixed‐C4 from naphtha or gas oil
Figure 13 Production processes of benzene, toluene and xylene
Department of Alternative Energy Development and Efficiency (DEDE)
A Study on Energy Efficiency Index in Petrochemical Industry
17
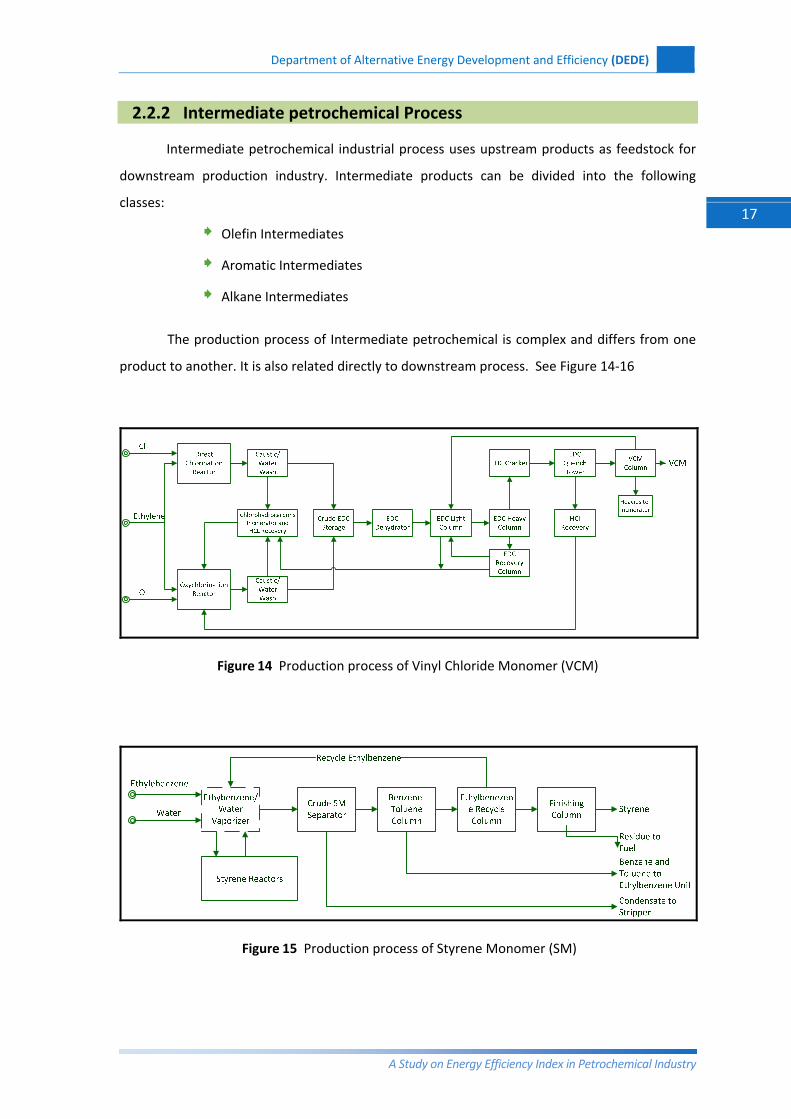
2.2.2 Intermediate petrochemical Process
Intermediate petrochemical industrial process uses upstream products as feedstock for
downstream production industry. Intermediate products can be divided into the following
classes:
Olefin Intermediates
Aromatic Intermediates
Alkane Intermediates
The production process of Intermediate petrochemical is complex and differs from one
product to another. It is also related directly to downstream process. See Figure 14‐16
Figure 14 Production process of Vinyl Chloride Monomer (VCM)
Figure 15 Production process of Styrene Monomer (SM)
Department of Alternative Energy Development and Efficiency (DEDE)
A Study on Energy Efficiency Index in Petrochemical Industry
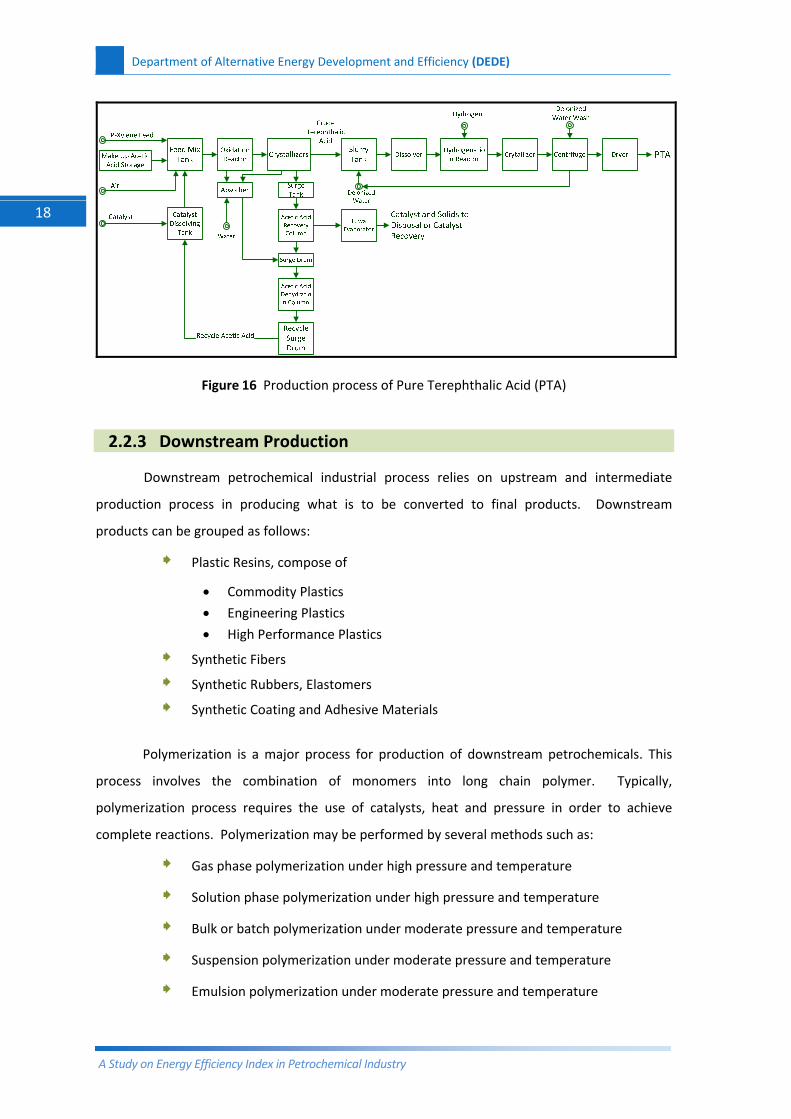
18
Figure 16 Production process of Pure Terephthalic Acid (PTA)
2.2.3 Downstream Production
Downstream petrochemical industrial process relies on upstream and intermediate
production process in producing what is to be converted to final products. Downstream
products can be grouped as follows:
Plastic Resins, compose of
• Commodity Plastics
• Engineering Plastics
• High Performance Plastics
Synthetic Fibers
Synthetic Rubbers, Elastomers
Synthetic Coating and Adhesive Materials
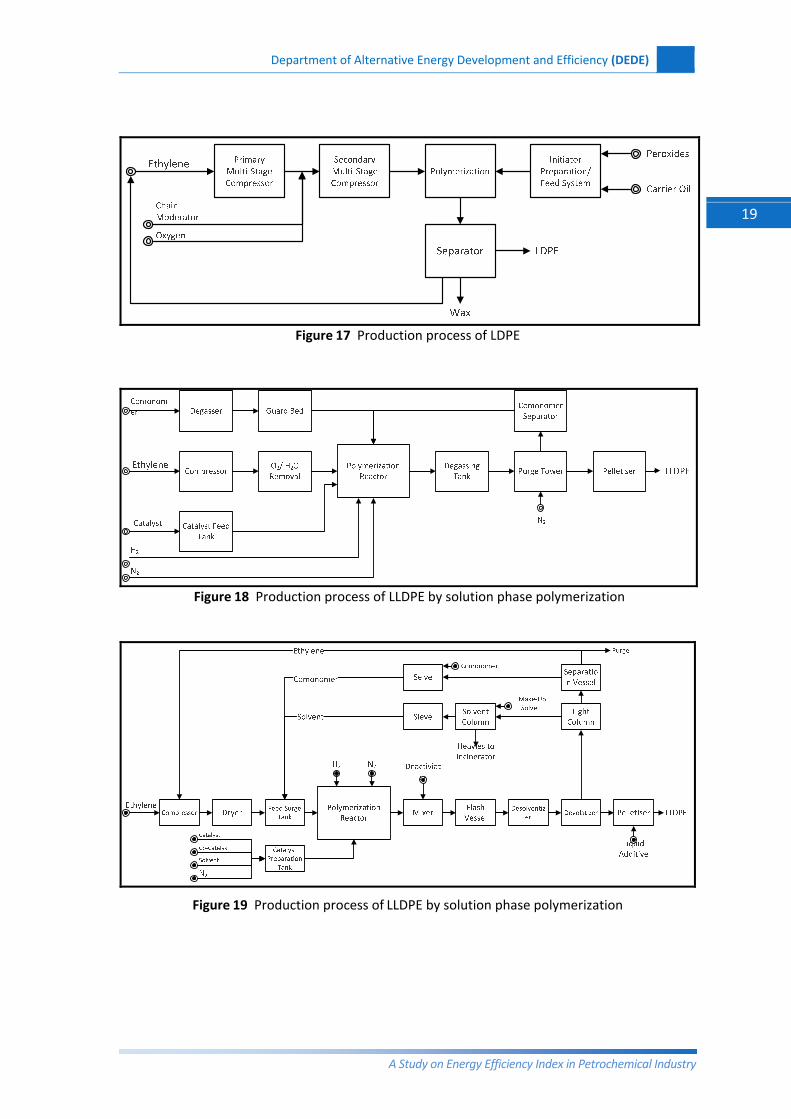
Polymerization is a major process for production of downstream petrochemicals. This
process involves the combination of monomers into long chain polymer. Typically,
polymerization process requires the use of catalysts, heat and pressure in order to achieve
complete reactions. Polymerization may be performed by several methods such as:
Gas phase polymerization under high pressure and temperature
Solution phase polymerization under high pressure and temperature
Bulk or batch polymerization under moderate pressure and temperature
Suspension polymerization under moderate pressure and temperature
Emulsion polymerization under moderate pressure and temperature
Department of Alternative Energy Development and Efficiency (DEDE)
A Study on Energy Efficiency Index in Petrochemical Industry
19
Figure 17 Production process of LDPE
Figure 18 Production process of LLDPE by solution phase polymerization
Figure 19 Production process of LLDPE by solution phase polymerization
Department of Alternative Energy Development and Efficiency (DEDE)
A Study on Energy Efficiency Index in Petrochemical Industry
20
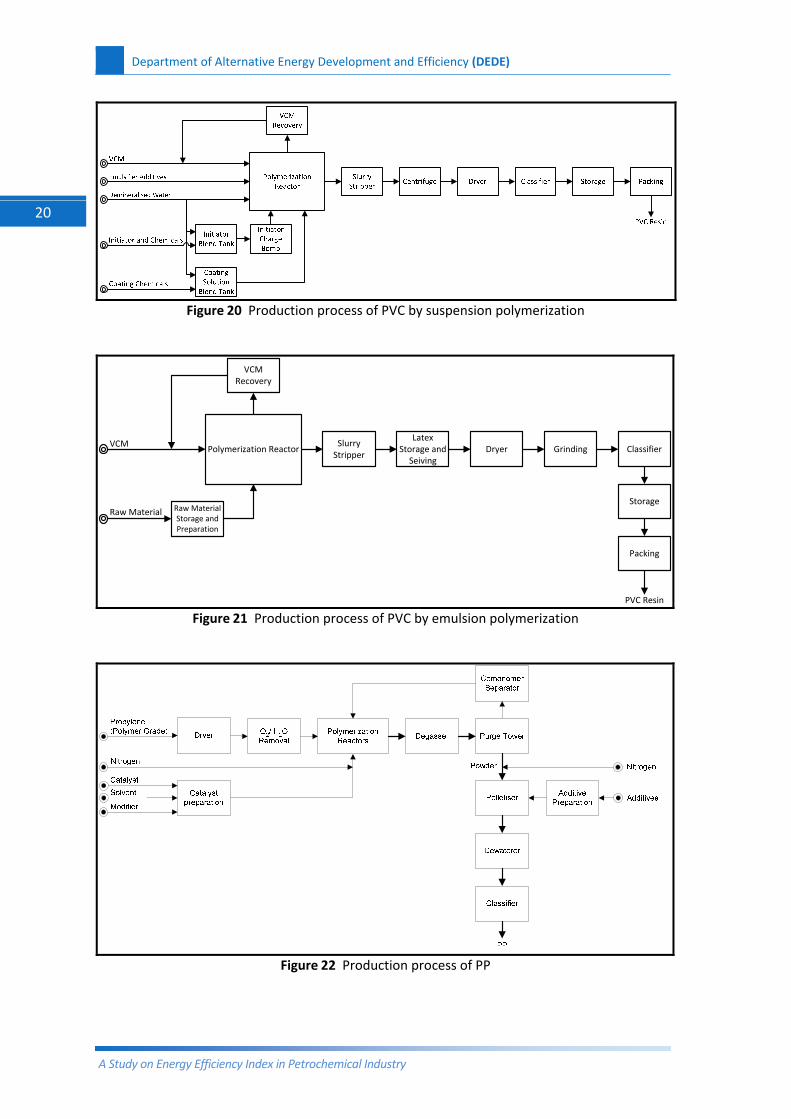
Figure 20 Production process of PVC by suspension polymerization
VCM
Raw Material
Polymerization ReactorSlurry Stripper
Latex Storage and Seiving
Dryer Classifier
Storage
Packing
PVC Resin
Raw Material Storage and Preparation
VCM Recovery
Grinding
Figure 21 Production process of PVC by emulsion polymerization
Figure 22 Production process of PP
Department of Alternative Energy Development and Efficiency (DEDE)
A Study on Energy Efficiency Index in Petrochemical Industry
21
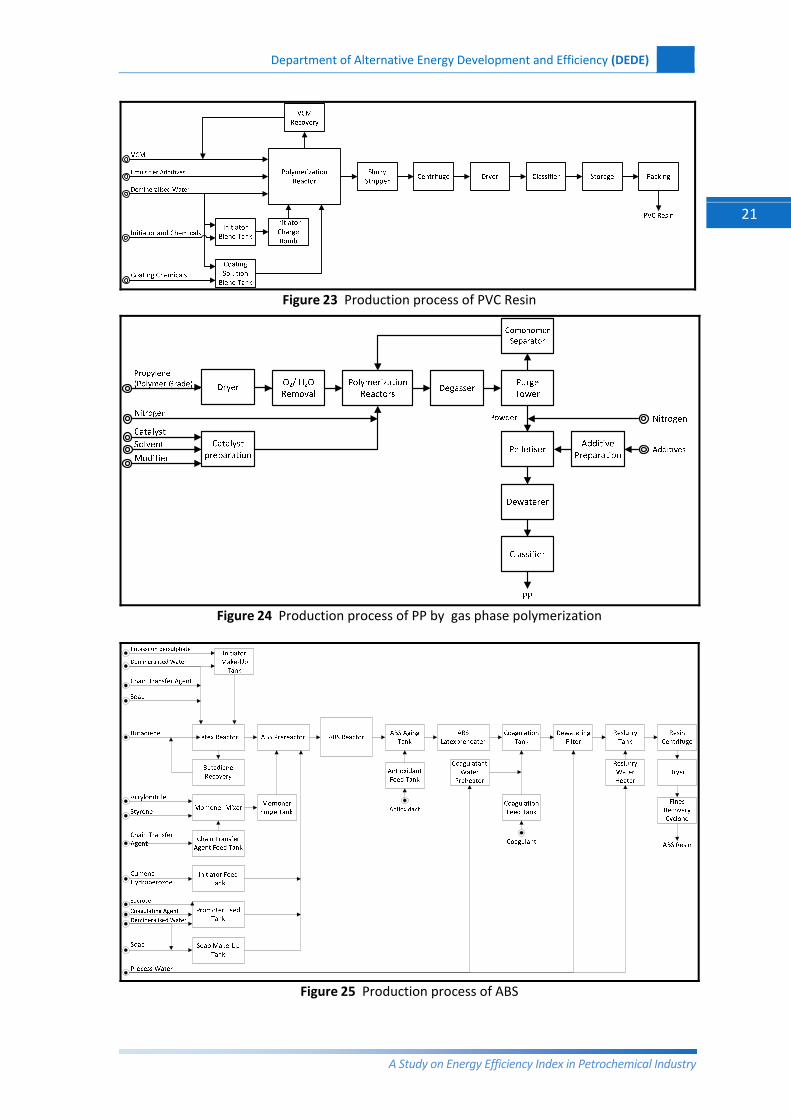
Figure 23 Production process of PVC Resin
Figure 24 Production process of PP by gas phase polymerization
Figure 25 Production process of ABS
Department of Alternative Energy Development and Efficiency (DEDE)
A Study on Energy Efficiency Index in Petrochemical Industry
22
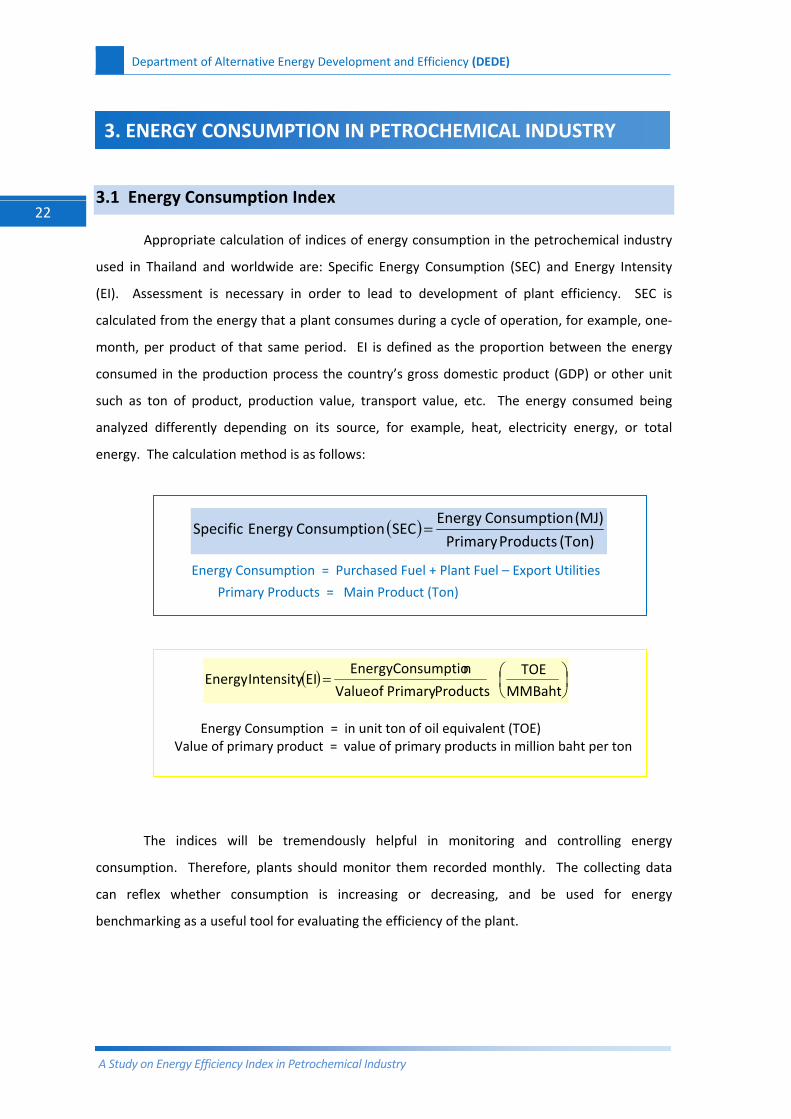
3.1 Energy Consumption Index
Appropriate calculation of indices of energy consumption in the petrochemical industry
used in Thailand and worldwide are: Specific Energy Consumption (SEC) and Energy Intensity
(EI). Assessment is necessary in order to lead to development of plant efficiency. SEC is
calculated from the energy that a plant consumes during a cycle of operation, for example, one‐
month, per product of that same period. EI is defined as the proportion between the energy
consumed in the production process the country’s gross domestic product (GDP) or other unit
such as ton of product, production value, transport value, etc. The energy consumed being
analyzed differently depending on its source, for example, heat, electricity energy, or total
energy. The calculation method is as follows:
( )(Ton) ProductsPrimary
(MJ) nConsumptioEnergySECnConsumptioEnergySpecific =
Energy Consumption = Purchased Fuel + Plant Fuel – Export Utilities
Primary Products = Main Product (Ton)
( ) ⎟⎠⎞
⎜⎝⎛=MMBahtTOE
ProductsPrimaryof Value
nConsumptioEnergyEIIntensity Energy
Energy Consumption = in unit ton of oil equivalent (TOE) Value of primary product = value of primary products in million baht per ton
The indices will be tremendously helpful in monitoring and controlling energy
consumption. Therefore, plants should monitor them recorded monthly. The collecting data
can reflex whether consumption is increasing or decreasing, and be used for energy
benchmarking as a useful tool for evaluating the efficiency of the plant.
3. ENERGY CONSUMPTION IN PETROCHEMICAL INDUSTRY
Department of Alternative Energy Development and Efficiency (DEDE)
A Study on Energy Efficiency Index in Petrochemical Industry
23
The scope of this study focuses only petrochemical plants; it does not include gas
separation plants and oil refineries. It assesses plants according to their products, from
upstream products ‐‐ olefins plants and aromatic plants ‐‐ to downstream, stopping at plastic
resin plants, and excluding plastic compounding and other industries.
The energy consumption figures used are drawn from the main production process; it
does not cover utilities, transportation, and offices units. The analysis takes into account all
factors that affect operation efficiency. For example, in the case of olefins plants, where other
products are manufactured in addition to the main products, only the olefins being ethylene and
propylene will be considered, not mixed C4 or other olefins, which are in much smaller
quantities, of unstable prices, and not the main target products of the plants.
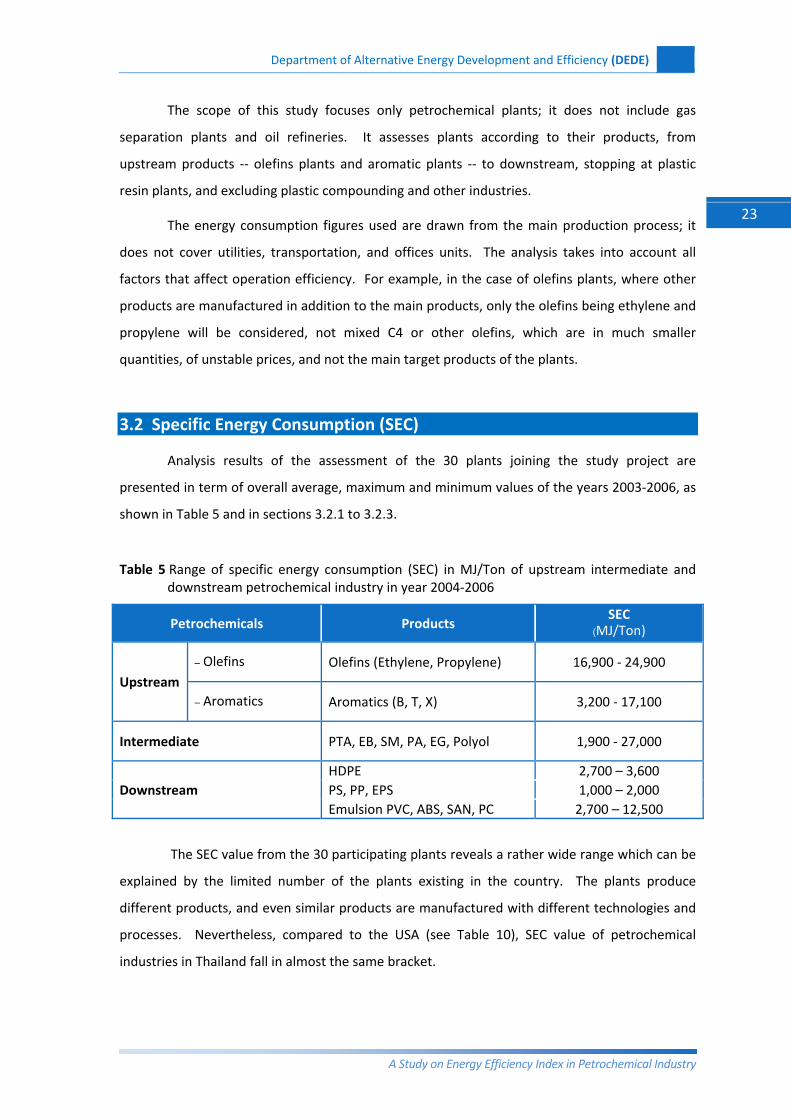
3.2 Specific Energy Consumption (SEC)
Analysis results of the assessment of the 30 plants joining the study project are
presented in term of overall average, maximum and minimum values of the years 2003‐2006, as
shown in Table 5 and in sections 3.2.1 to 3.2.3.
Table 5 Range of specific energy consumption (SEC) in MJ/Ton of upstream intermediate and downstream petrochemical industry in year 2004‐2006
Petrochemicals Products SEC
(MJ/Ton)
Upstream
– Olefins Olefins (Ethylene, Propylene) 16,900 ‐ 24,900
– Aromatics Aromatics (B, T, X) 3,200 ‐ 17,100
Intermediate PTA, EB, SM, PA, EG, Polyol 1,900 ‐ 27,000
Downstream HDPE 2,700 – 3,600 PS, PP, EPS 1,000 – 2,000 Emulsion PVC, ABS, SAN, PC 2,700 – 12,500
The SEC value from the 30 participating plants reveals a rather wide range which can be
explained by the limited number of the plants existing in the country. The plants produce
different products, and even similar products are manufactured with different technologies and
processes. Nevertheless, compared to the USA (see Table 10), SEC value of petrochemical
industries in Thailand fall in almost the same bracket.
24
De
A Study o
kind of p
product
3.2.1
F
Ol
Table 6
2
16,00
av19
Tabl
because
5
10
15
20
25
Specific En
ergy Con
sumption (M
J/To
n)
epartment of
on Energy Effic
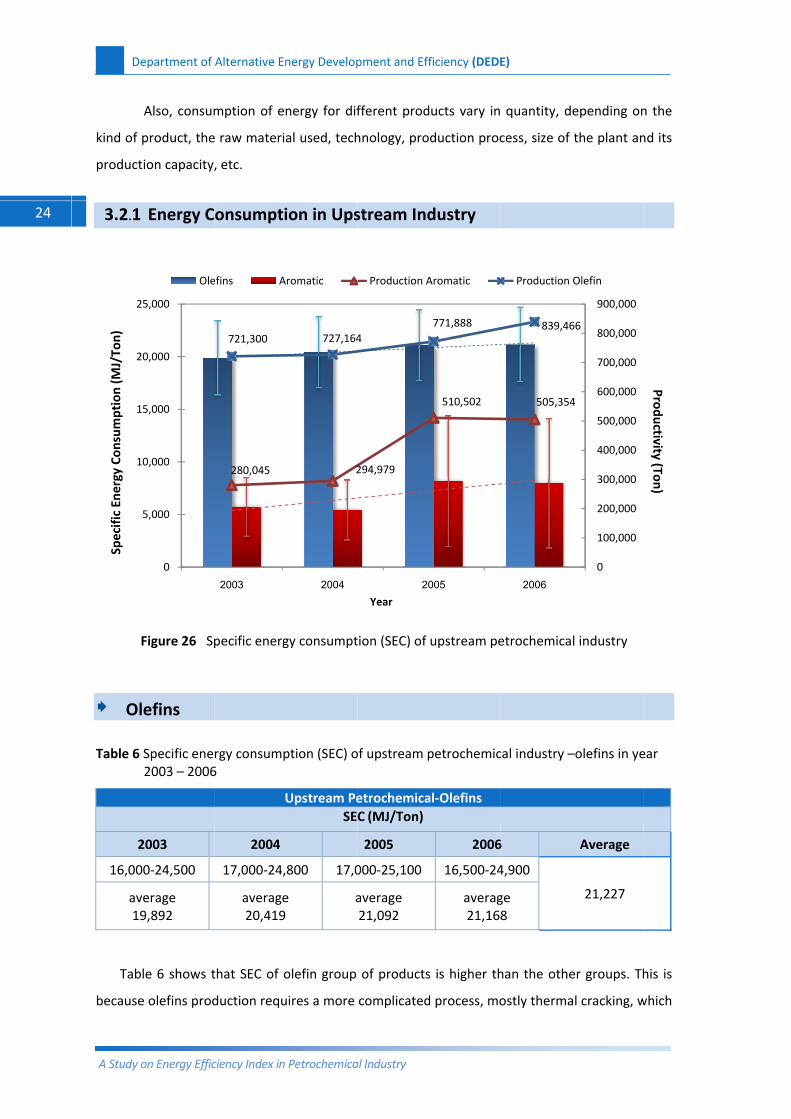
Also, consum
product, the
ion capacity,
Energy C
Figure 26 Sp
efins
Specific ene2003 – 2006
2003
0‐24,500
erage 9,892
le 6 shows t
e olefins prod
0
5,000
0,000
5,000
0,000
5,000
Ole
Alternative En
ciency Index in
mption of en
e raw materia
, etc.
onsumpti
pecific energ
rgy consump6
U
2004
17,000‐24,
average20,419
that SEC of o
duction requ
280,045
721,300
2003
efins A
nergy Develop
Petrochemica
nergy for dif
al used, tech
ion in Ups
gy consumpt
ption (SEC) o
Upstream PeSE
800 17,0
e a
olefin group
uires a more
2
727,164
2004
romatic
pment and Eff
al Industry
fferent prod
hnology, pro
stream Ind
tion (SEC) of
of upstream p
etrochemicaC (MJ/Ton)
2005
000‐25,100
average 21,092
of products
complicated
294,979
4
20Year
Production A
ficiency (DEDE
ducts vary in
duction proc
dustry
upstream pe
petrochemic
al‐Olefins
2006
16,500‐24
averag21,16
s is higher th
d process, mo
510,502
771,888
005
Aromatic
E)
quantity, d
cess, size of
etrochemica
cal industry –
6
4,900
ge 8
han the othe
ostly therma
505,354
839,46
2006
Production
epending on
the plant an
l industry
–olefins in ye
Average
21,227
er groups. Th
al cracking, w
4
66
0
100,000
200,000
300,000
400,000
500,000
600,000
700,000
800,000
900,000
Olefin
n the
nd its
ear
his is
which
Productivity (Ton)
Department of Alternative Energy Development and Efficiency (DEDE)
A Study on Energy Efficiency Index in Petrochemical Industry
25
consumes a lot more energy than intermediate and upstream industries. However, most of
these olefins producing plants use steam produced during the production process itself. They
even have surplus steam to sell to nearby plants. But in the data cited here, the sold amount is
excluded, and only energy consumed in the manufacturing of the products is taken into account.
This study finds that the SEC value from all olefins plants in Thailand does not differ
much from that of the same industry in other countries (as shown in Table 10). But the wide can
be explained by the fact that there are only 4 olefins plants in all of Thailand, each with a
markedly different production technology. In addition, only 2 main types of feedstock are used,
that is, ethane and naphtha. In producing olefins (ethylene and propylene) alone, the plants
using ethane as feedstock naturally consume less energy than those using naphtha, because
ethane is of smaller molecules, which can be cracked easily. But this does not mean that plants
using naphtha are of a disadvantage. In fact they do have valuable by‐products which they can
sell to compensate for the cost of energy.
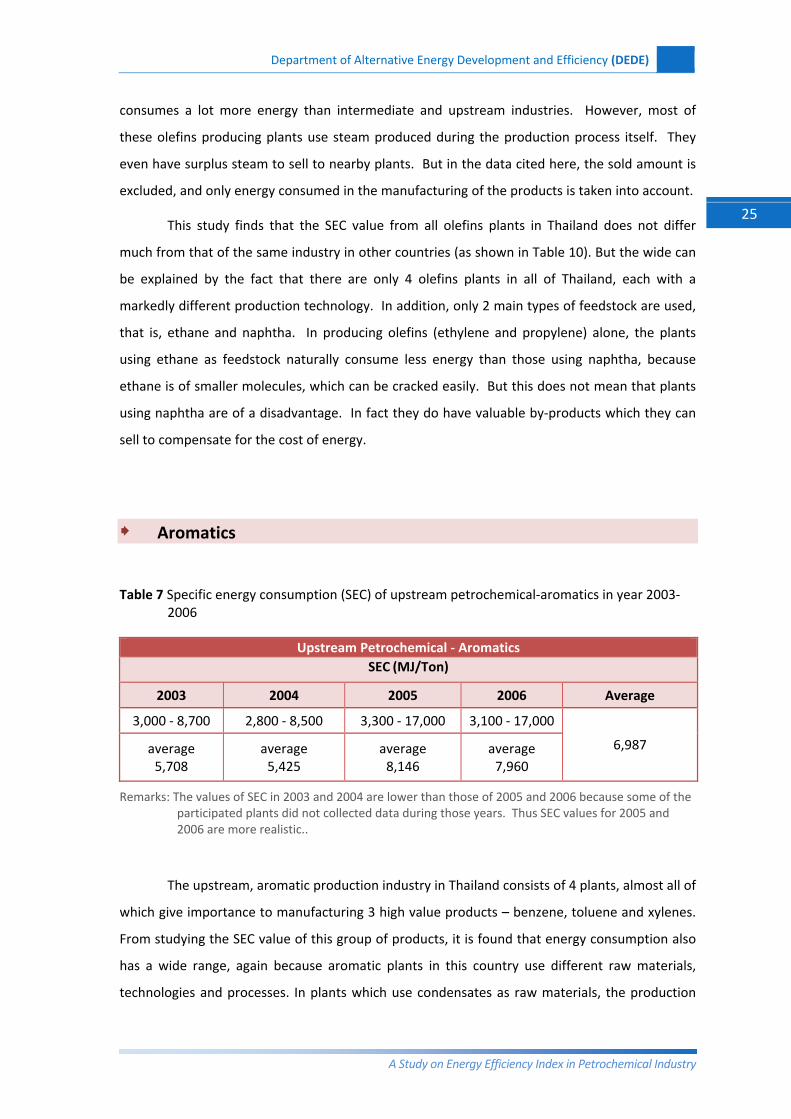
Aromatics
Table 7 Specific energy consumption (SEC) of upstream petrochemical‐aromatics in year 2003‐2006
Upstream Petrochemical ‐ Aromatics SEC (MJ/Ton)
2003 2004 2005 2006 Average
3,000 ‐ 8,700 2,800 ‐ 8,500 3,300 ‐ 17,000 3,100 ‐ 17,000
6,987 average 5,708
average 5,425
average 8,146
average 7,960
Remarks: The values of SEC in 2003 and 2004 are lower than those of 2005 and 2006 because some of the participated plants did not collected data during those years. Thus SEC values for 2005 and 2006 are more realistic..
The upstream, aromatic production industry in Thailand consists of 4 plants, almost all of
which give importance to manufacturing 3 high value products – benzene, toluene and xylenes.
From studying the SEC value of this group of products, it is found that energy consumption also
has a wide range, again because aromatic plants in this country use different raw materials,
technologies and processes. In plants which use condensates as raw materials, the production
26
De
A Study o
process
xylene, a
product
3.2
Fig
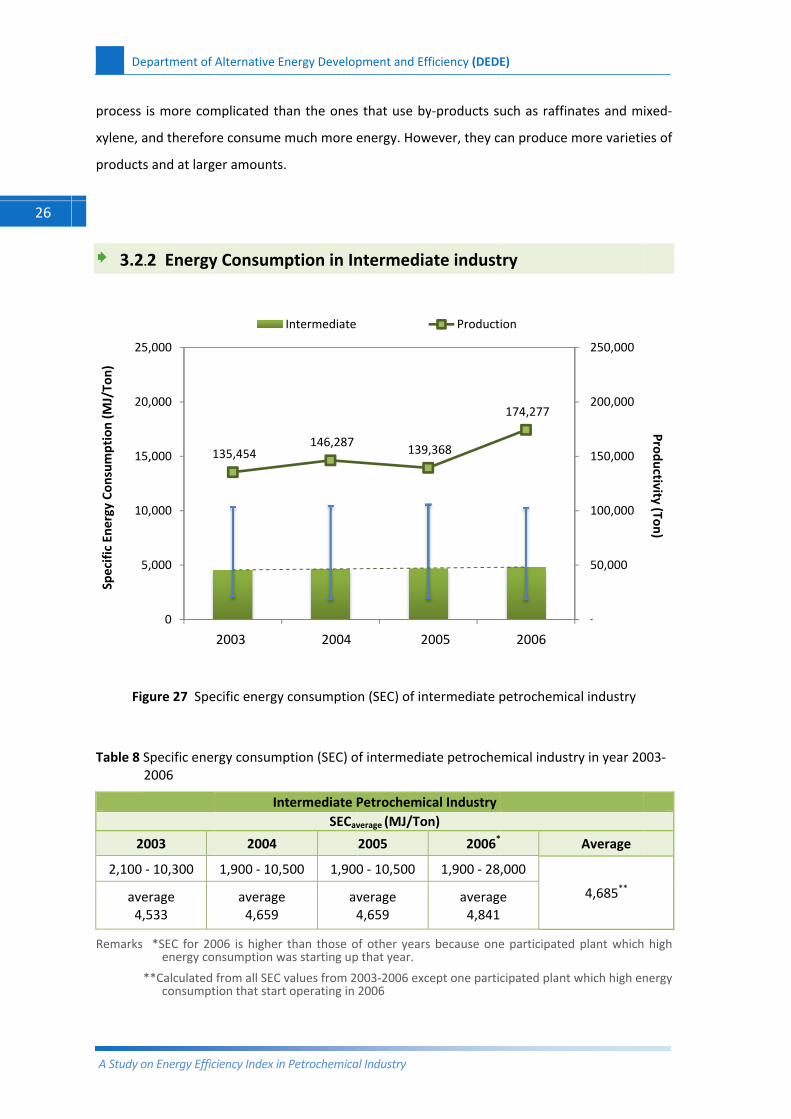
Table 8
2
2,100
ave4,
Remarks
5
10
15
20
25
Specific En
ergy Con
sumption (M
J/To
n)
epartment of
on Energy Effic
is more com
and therefor
s and at larg
.2 Energy
gure 27 Spe
Specific ene2006
2003
‐ 10,300
erage ,533
*SEC for 20energy co
**Calculated consumpt
1
0
5,000
0,000
5,000
0,000
5,000
Alternative En
ciency Index in
mplicated th
re consume m
ger amounts.
y Consump
ecific energy
rgy consump
Int
2004
1,900 ‐ 10,5
average 4,659
006 is higher nsumption w
from all SEC vtion that start
135,454
ป 25462003
nergy Develop
Petrochemica
an the ones
much more e
ption in In
consumptio
ption (SEC) o
termediate PSECav
500 1,900
av4
than those oas starting up
values from 2 operating in
146,287
ป 2547
Intermediate
2004
pment and Eff
al Industry
s that use by
energy. How
ntermedia
n (SEC) of int
of intermedia
Petrochemic
verage (MJ/Ton
2005
0 ‐ 10,500
verage 4,659
of other yearsp that year.
003‐2006 exc2006
139,
ป 25 20
ficiency (DEDE
y‐products su
wever, they c
ate indust
termediate p
ate petroche
cal Industry n)
2006*
1,900 ‐ 28,
average4,841
s because one
ept one partic
,368
548
Producti
005
E)
uch as raffin
an produce
try
petrochemic
mical indust
,000
e
e participated
cipated plant
174,277
ป 2549
ion
2006
nates and m
more varieti
cal industry
try in year 20
Average
4,685**
d plant which
which high en
-
50,000
100,000
150,000
200,000
250,000
ixed‐
es of
003‐
high
nergy
Productivity (Ton)
PA,
stag
adju
the
raw
norm
Tabl
9
SpecificEn
ergy
Consum
ption(M
J/To
n)
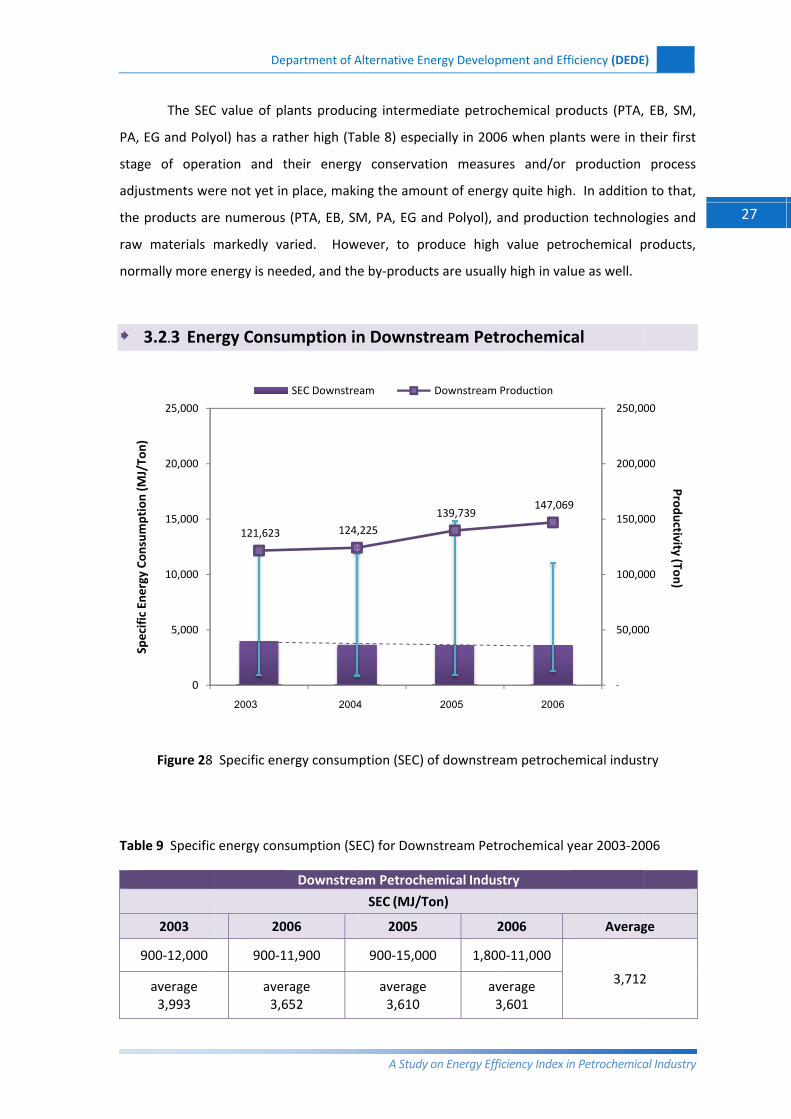
The SEC
EG and Poly
ge of opera
ustments we
products are
materials m
mally more e
3.2.3 Ene
Figure 28
le 9 Specific
2003
900‐12,000
average 3,993
0
5,000
10,000
15,000
20,000
25,000
Specific En
ergy Con
sumption (M
J/To
n)
De
C value of pl
yol) has a rat
ation and t
re not yet in
e numerous
markedly va
energy is nee
ergy Consu
Specific ene
c energy cons
20
900‐1
aver3,6
121,623
ป 25462003
partment of A
ants produc
ther high (Ta
their energy
n place, maki
(PTA, EB, SM
aried. How
eded, and th
umption in
ergy consum
sumption (SE
Downstrea
006
11,900
rage 652
124,
ป 25
SEC Downstre
2004
Alternative En
A Study
cing interme
able 8) espe
y conservat
ing the amou
M, PA, EG a
wever, to pr
e by‐product
n Downst
mption (SEC) o
EC) for Down
am Petroche
SEC (MJ/T
2005
900‐15,00
average3,610
,225
547
eam
4
nergy Develop
on Energy Effi
diate petroc
cially in 200
ion measur
unt of energ
nd Polyol), a
roduce high
ts are usually
ream Pet
of downstrea
nstream Petr
emical Indus
on)
2
0 1,800
av3
139,739
ป 2548
Downstream
2005
pment and Effi
iciency Index in
chemical pro
6 when plan
res and/or
gy quite high
and producti
value petr
y high in valu
rochemica
am petroche
rochemical y
stry
2006
0‐11,000
verage 3,601
147,069
ป 2549
Production
2006
iciency (DEDE
n Petrochemica
oducts (PTA,
nts were in t
production
. In addition
ion technolo
ochemical p
ue as well.
al
emical indust
year 2003‐20
Averag
3,712
9
-
50,00
100,0
150,0
200,0
250,0
E)
al Industry
EB, SM,
their first
process
n to that,
ogies and
products,
try
006
ge
2
0
00
00
00
00
Productivity (Ton)
27
Department of Alternative Energy Development and Efficiency (DEDE)
A Study on Energy Efficiency Index in Petrochemical Industry
28
The SEC value of plants producing downstream products (HDPF, PS, PP, EPS, PVC, ABS, SAN and
PC) averaged out during 2003 and 2006 also has a rather high discrepancy (Table 9). This is
because most of the industry (the participating plants in this study project) produces mainly
plastic resins ‐‐commodity plastics and specialty plastics. Usually specialty plastics such as
thermosetting plastics consume more energy, because the process is more complicated. Even
among commodity plastic production plants, the amount of energy consumed varies. Special
grade plastics such as the medical‐grade consume higher energy than lower‐grade plastics.
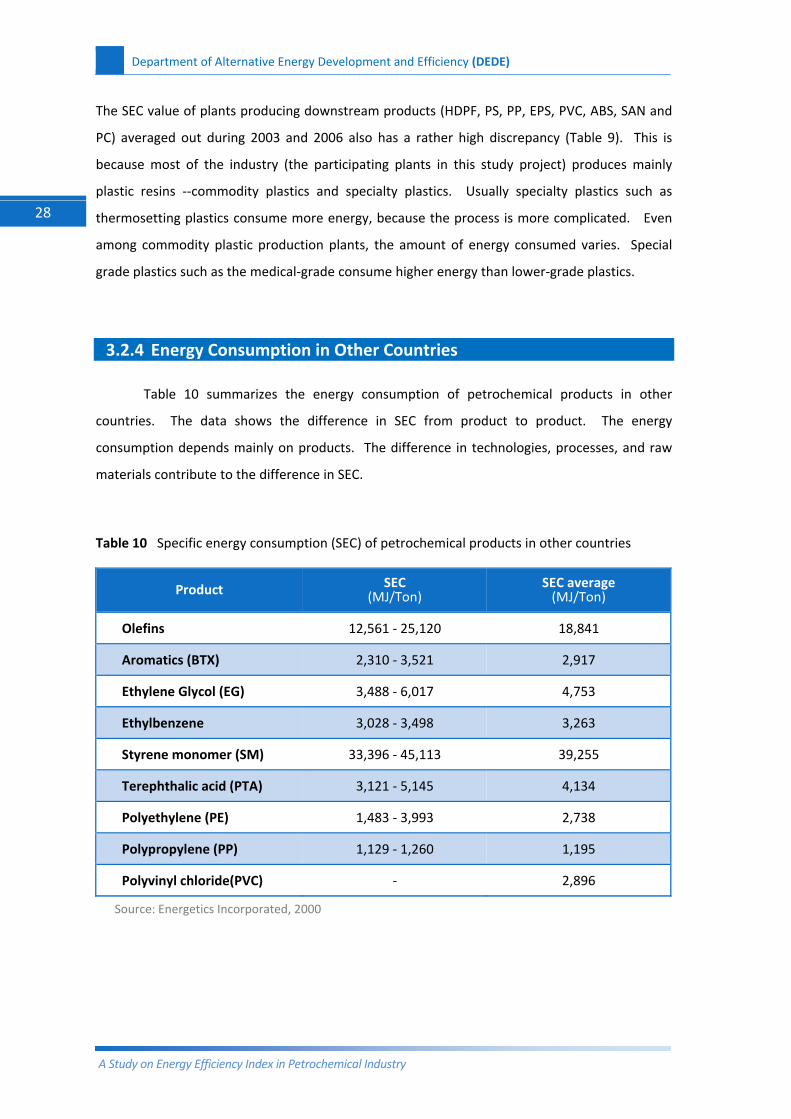
3.2.4 Energy Consumption in Other Countries
Table 10 summarizes the energy consumption of petrochemical products in other
countries. The data shows the difference in SEC from product to product. The energy
consumption depends mainly on products. The difference in technologies, processes, and raw
materials contribute to the difference in SEC.
Table 10 Specific energy consumption (SEC) of petrochemical products in other countries
Product SEC (MJ/Ton)
SEC average (MJ/Ton)
Olefins 12,561 ‐ 25,120 18,841
Aromatics (BTX) 2,310 ‐ 3,521 2,917
Ethylene Glycol (EG) 3,488 ‐ 6,017 4,753
Ethylbenzene 3,028 ‐ 3,498 3,263
Styrene monomer (SM) 33,396 ‐ 45,113 39,255
Terephthalic acid (PTA) 3,121 ‐ 5,145 4,134
Polyethylene (PE) 1,483 ‐ 3,993 2,738
Polypropylene (PP) 1,129 ‐ 1,260 1,195
Polyvinyl chloride(PVC) ‐ 2,896
Source: Energetics Incorporated, 2000
Department of Alternative Energy Development and Efficiency (DEDE)
A Study on Energy Efficiency Index in Petrochemical Industry
29
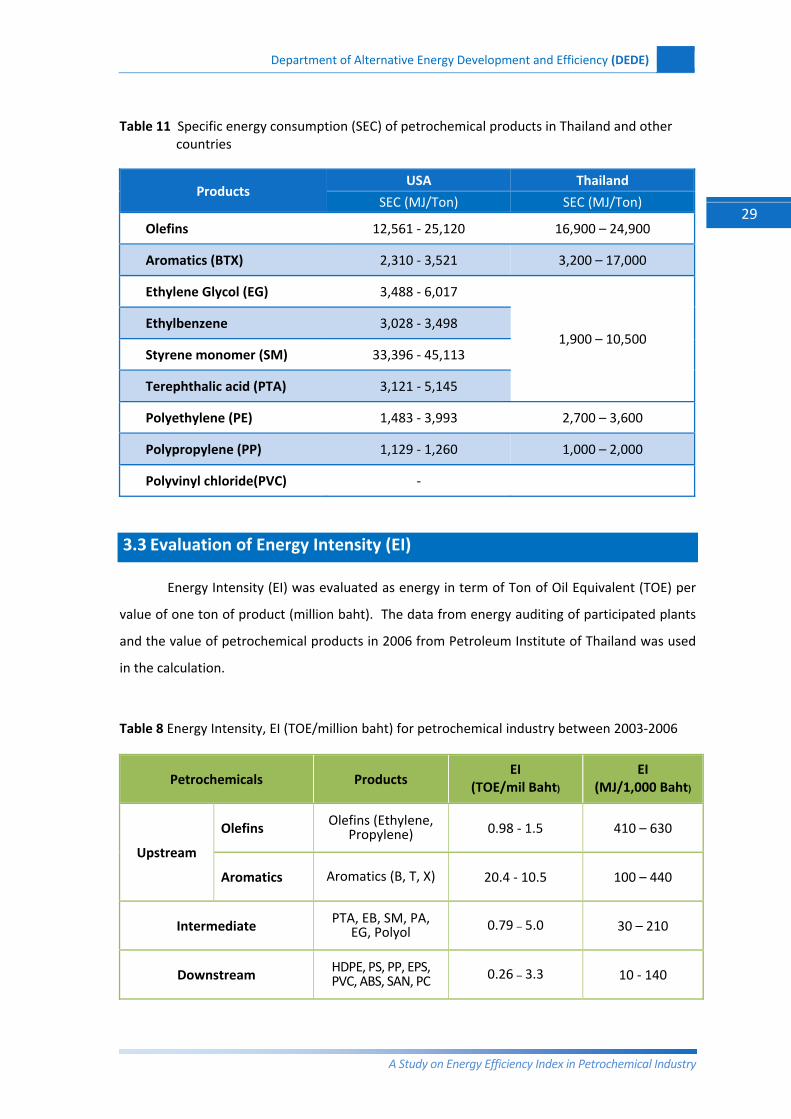
Table 11 Specific energy consumption (SEC) of petrochemical products in Thailand and other countries
Products USA Thailand
SEC (MJ/Ton) SEC (MJ/Ton)
Olefins 12,561 ‐ 25,120 16,900 – 24,900
Aromatics (BTX) 2,310 ‐ 3,521 3,200 – 17,000
Ethylene Glycol (EG) 3,488 ‐ 6,017
1,900 – 10,500 Ethylbenzene 3,028 ‐ 3,498
Styrene monomer (SM) 33,396 ‐ 45,113
Terephthalic acid (PTA) 3,121 ‐ 5,145
Polyethylene (PE) 1,483 ‐ 3,993 2,700 – 3,600
Polypropylene (PP) 1,129 ‐ 1,260 1,000 – 2,000
Polyvinyl chloride(PVC) ‐
3.3 Evaluation of Energy Intensity (EI)
Energy Intensity (EI) was evaluated as energy in term of Ton of Oil Equivalent (TOE) per
value of one ton of product (million baht). The data from energy auditing of participated plants
and the value of petrochemical products in 2006 from Petroleum Institute of Thailand was used
in the calculation.
Table 8 Energy Intensity, EI (TOE/million baht) for petrochemical industry between 2003‐2006
Petrochemicals Products EI
(TOE/mil Baht) EI
(MJ/1,000 Baht)
Upstream
Olefins Olefins (Ethylene, Propylene) 0.98 ‐ 1.5 410 – 630
Aromatics Aromatics (B, T, X) 20.4 ‐ 10.5 100 – 440
Intermediate PTA, EB, SM, PA, EG, Polyol 0.79 – 5.0 30 – 210
Downstream HDPE, PS, PP, EPS, PVC, ABS, SAN, PC 0.26 – 3.3 10 ‐ 140
30
De
A Study o
Figur
aromati
petroche
product
product
intensity
product
the ener
epartment of
on Energy Effic
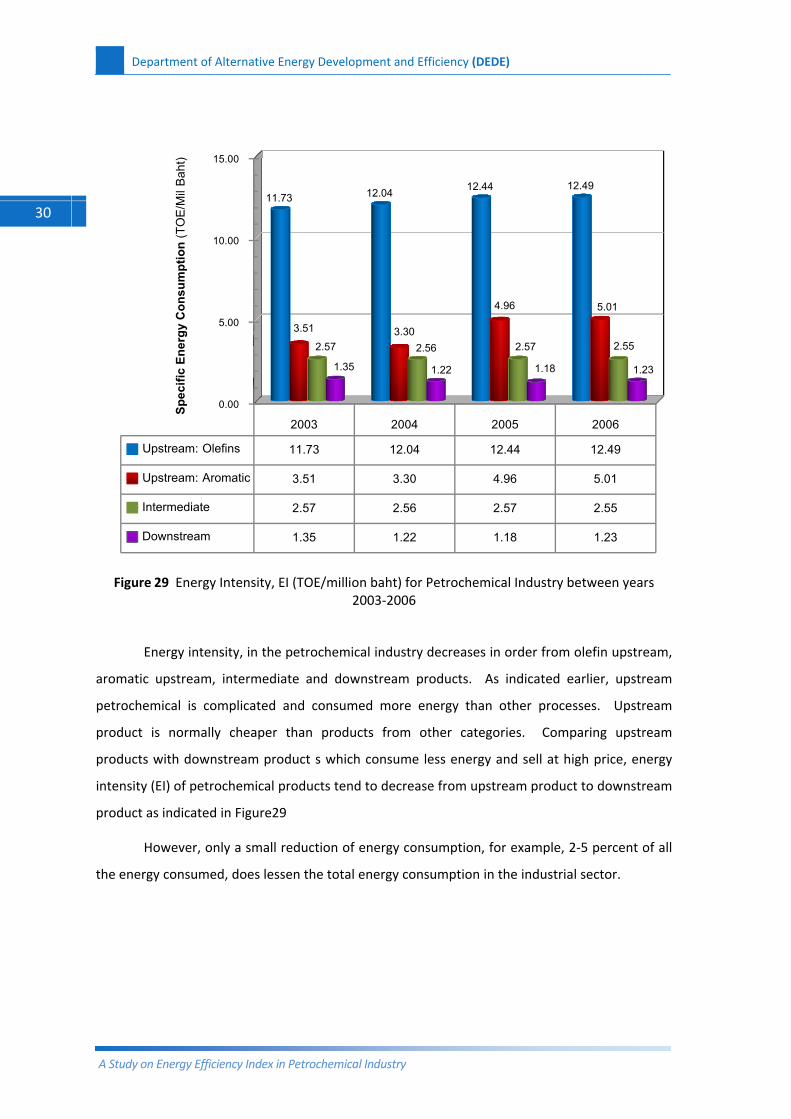
re 29 Energy
Energy inten
c upstream,
emical is co
is normall
s with down
y (EI) of petr
as indicated
However, on
rgy consume
1
1
Upstream: Ol
Upstream: Ar
Intermediate
Downstream
Spec
ific
Ener
gy C
onsu
mpt
ion
(TOE
/Mil B
aht)
Alternative En
ciency Index in
y Intensity, E
nsity, in the
, intermedia
omplicated a
y cheaper t
nstream prod
ochemical p
d in Figure29
nly a small r
ed, does less
0.00
5.00
10.00
15.00
efins
romatic
11.7
nergy Develop
Petrochemica
I (TOE/millio2
petrochemic
ate and dow
and consum
than produ
duct s which
roducts tend
eduction of
en the total
2003
11.73
3.51
2.57
1.35
3
3.51
2.57
1.35
pment and Eff
al Industry
on baht) for P2003‐2006
cal industry d
wnstream pr
ed more en
cts from ot
h consume le
d to decrease
energy cons
energy cons
2004
12.04
3.30
2.56
1.22
12.04
3.30 2.5
ficiency (DEDE
Petrochemic
decreases in
oducts. As
nergy than o
ther catego
ess energy a
e from upstr
sumption, fo
umption in t
20
12
4
2
1
12.44
4
56
1.22
E)
al Industry b
order from
indicated e
other proce
ries. Comp
and sell at h
ream produc
or example, 2
the industria
005
2.44
.96
.57
.18
1
.96
2.57
1.18
between yea
olefin upstre
earlier, upstr
sses. Upstr
paring upstr
igh price, en
ct to downstr
2‐5 percent o
al sector.
2006
12.49
5.01
2.55
1.23
2.49
5.01
2.55
1.2
rs
eam,
ream
ream
ream
nergy
ream
of all
23
Department of Alternative Energy Development and Efficiency (DEDE)
A Study on Energy Efficiency Index in Petrochemical Industry
31
The petrochemical industry requires high energy consumption. Therefore energy is a
vital factor in the business competition, because it has a direct effect on the production cost.
And for this reason, the state sector and the private businesses involved are turning their
attention to the conservation of energy, from organizing activities in the organization,
advertising and promoting awareness, to setting measures to conserve energy in both the
production sector and the service sector. But since the petrochemical industry depends greatly
on technology and highly specific expertise, very much unlike most other industries, it is
therefore capital intensive. This study project which compiles all related information, facts and
figures, analyzes the strength, weaknesses, opportunities and threats (SWOT), assesses and
recommends directions for the promotion of energy conservation, which can lead to adoption of
plans for effective conservation of energy.
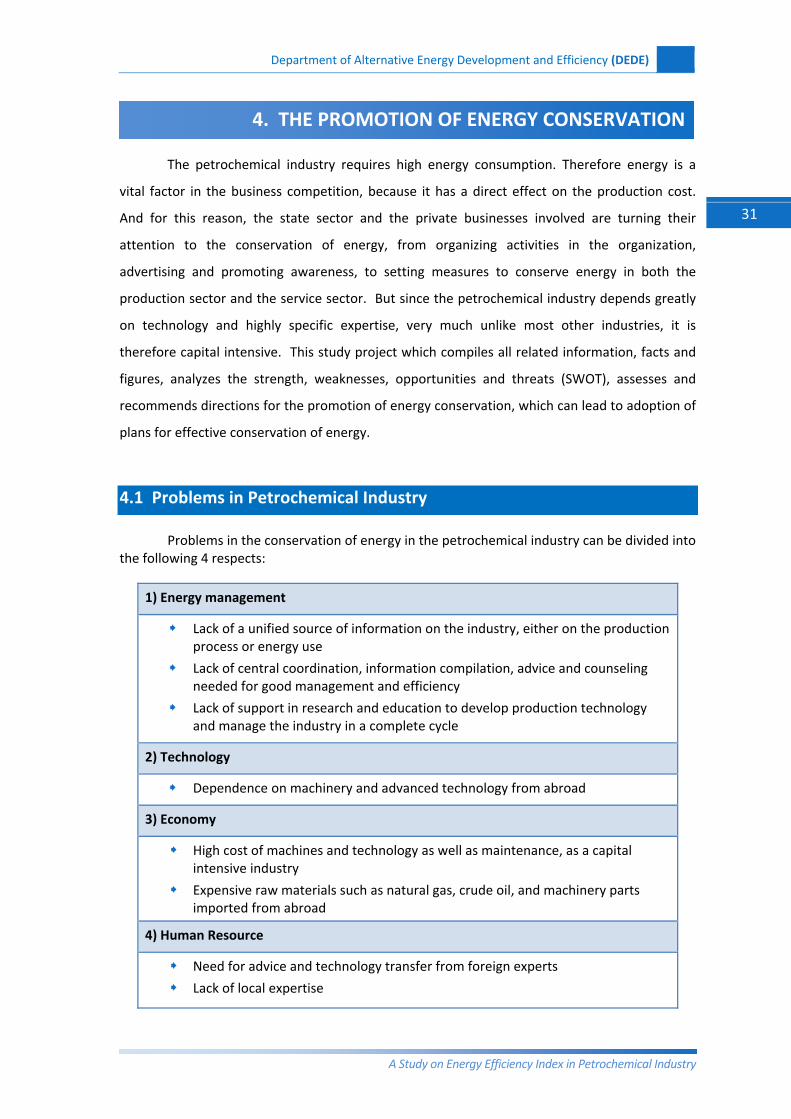
4.1 Problems in Petrochemical Industry
Problems in the conservation of energy in the petrochemical industry can be divided into the following 4 respects:
1) Energy management
Lack of a unified source of information on the industry, either on the production process or energy use
Lack of central coordination, information compilation, advice and counseling needed for good management and efficiency
Lack of support in research and education to develop production technology and manage the industry in a complete cycle
2) Technology
Dependence on machinery and advanced technology from abroad
3) Economy
High cost of machines and technology as well as maintenance, as a capital intensive industry
Expensive raw materials such as natural gas, crude oil, and machinery parts imported from abroad
4) Human Resource
Need for advice and technology transfer from foreign experts
Lack of local expertise
4. THE PROMOTION OF ENERGY CONSERVATION
32
De
A Study o
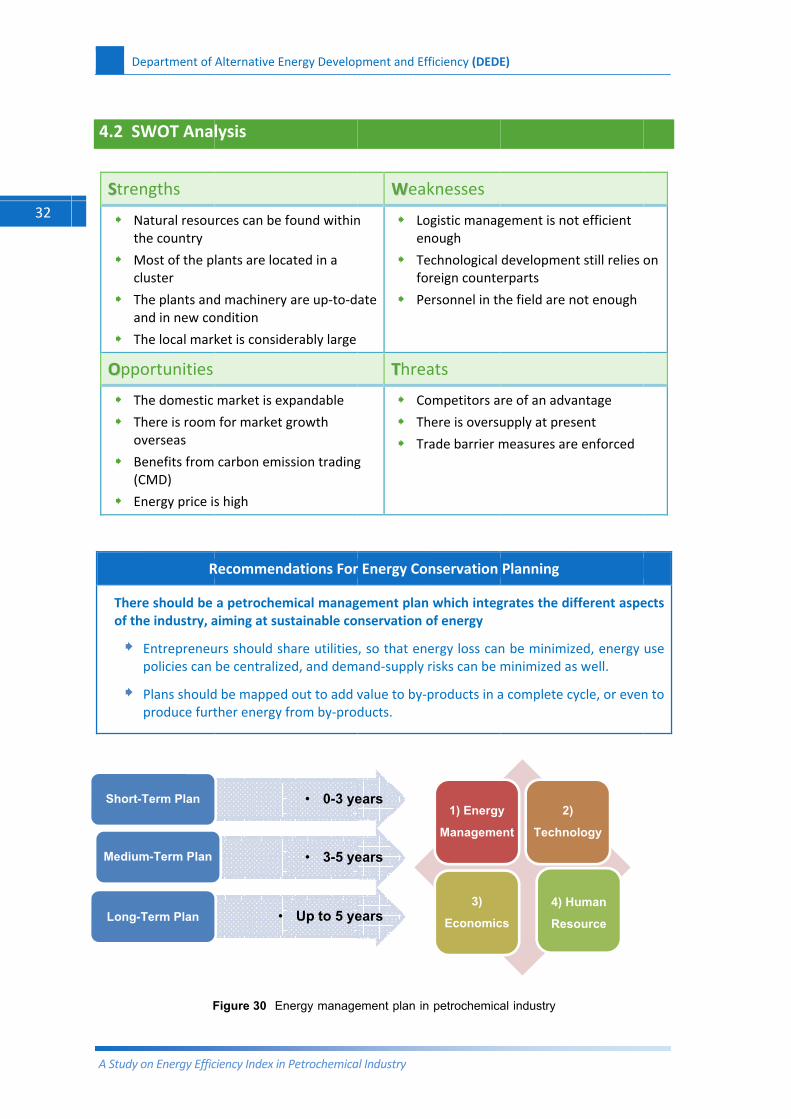
4.2 SW
SStren
Nth
Mcl
Than
Th
OOppo
Th
Thov
Be(C
En
Thereof th
Short-T
Medium
Long-T
epartment of
on Energy Effic
WOT Ana
ngths
atural resouhe country
Most of the puster
he plants andnd in new co
he local mar
ortunities
he domestic
here is roomverseas
enefits from CMD)
nergy price is
R
e should be e industry, a
Entrepreneupolicies can
Plans shouldproduce furt
F
Term Plan
m-Term Plan
Term Plan
Alternative En
ciency Index in
lysis
rces can be f
lants are loc
d machineryondition
ket is consid
market is ex
m for market
carbon emis
s high
Recommend
a petrochemaiming at sus
urs should shbe centralize
d be mappedther energy f
Figure 30 En
•
nergy Develop
Petrochemica
found within
ated in a
y are up‐to‐d
erably large
xpandable
growth
ssion trading
dations For
mical managstainable co
hare utilitiesed, and dem
d out to add vfrom by‐prod
nergy manage
• 0-3 ye
• 3-5 ye
Up to 5 ye
pment and Eff
al Industry
WWeak
n
ate
Loen
Tefo
Pe
TThrea
g
Co
Th
Tr
r Energy Con
gement plan nservation o
, so that eneand‐supply r
value to by‐pducts.
ement plan in
ears
ears
ears
ficiency (DEDE
knesses
ogistic managnough
echnological reign counte
ersonnel in th
ats
ompetitors a
here is oversu
ade barrier m
nservation
which integof energy
ergy loss canrisks can be
products in a
petrochemica
1) EnergyManageme
3) Economic
E)
gement is no
developmenerparts
he field are n
re of an adva
upply at pres
measures are
Planning
grates the di
n be minimizminimized a
a complete c
al industry
y ent
2)Techno
cs4) HRes
ot efficient
nt still relies
not enough
antage
sent
e enforced
ifferent aspe
zed, energy s well.
cycle, or even
) ology
Human source
on
ects
use
n to
Department of Alternative Energy Development and Efficiency (DEDE)
A Study on Energy Efficiency Index in Petrochemical Industry
33
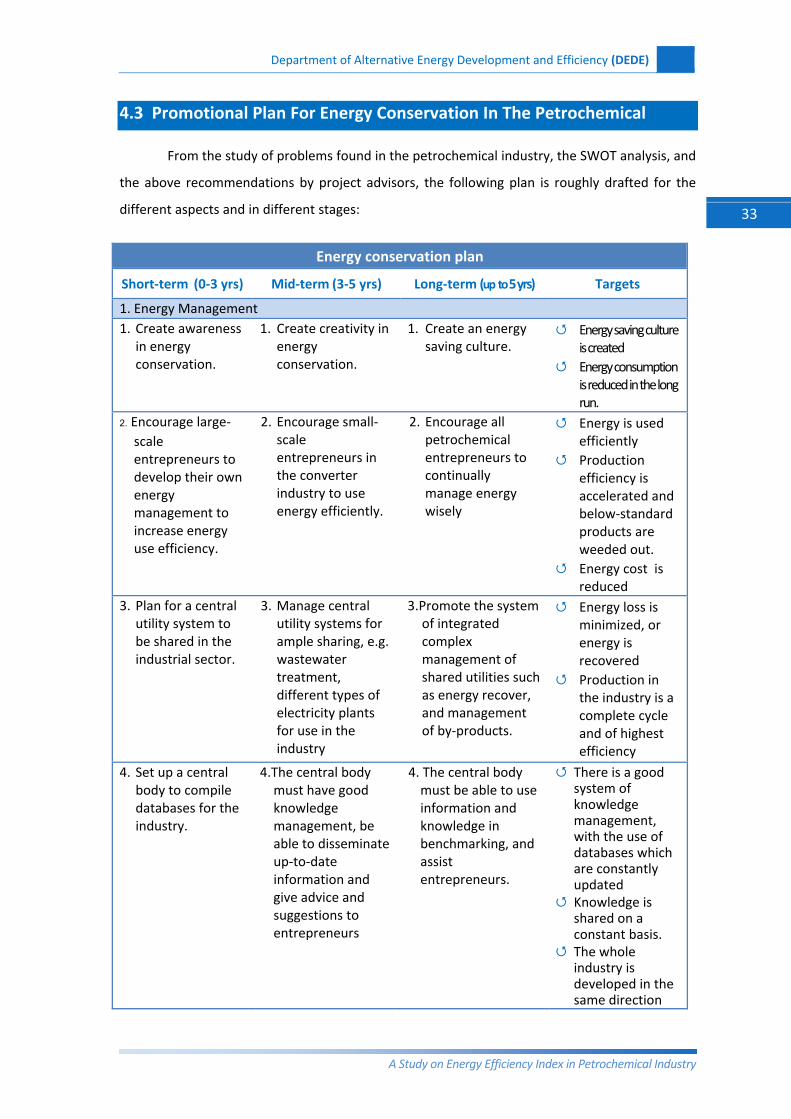
4.3 Promotional Plan For Energy Conservation In The Petrochemical
From the study of problems found in the petrochemical industry, the SWOT analysis, and
the above recommendations by project advisors, the following plan is roughly drafted for the
different aspects and in different stages:
Energy conservation plan
Short‐term (0‐3 yrs) Mid‐term (3‐5 yrs) Long‐term (up to 5 yrs) Targets
1. Energy Management 1. Create awareness
in energy conservation.
1. Create creativity in energy conservation.
1. Create an energy saving culture.
Energy saving culture is created
Energy consumption is reduced in the long run.
2. Encourage large‐scale entrepreneurs to develop their own energy management to increase energy use efficiency.
2. Encourage small‐scale entrepreneurs in the converter industry to use energy efficiently.
2. Encourage all petrochemical entrepreneurs to continually manage energy wisely
Energy is used efficiently
Production efficiency is accelerated and below‐standard products are weeded out.
Energy cost is reduced
3. Plan for a central utility system to be shared in the industrial sector.
3. Manage central utility systems for ample sharing, e.g. wastewater treatment, different types of electricity plants for use in the industry
3.Promote the system of integrated complex management of shared utilities such as energy recover, and management of by‐products.
Energy loss is minimized, or energy is recovered
Production in the industry is a complete cycle and of highest efficiency
4. Set up a central body to compile databases for the industry.
4.The central body must have good knowledge management, be able to disseminate up‐to‐date information and give advice and suggestions to entrepreneurs
4. The central body must be able to use information and knowledge in benchmarking, and assist entrepreneurs.
There is a good system of knowledge management, with the use of databases which are constantly updated
Knowledge is shared on a constant basis.
The whole industry is developed in the same direction
Department of Alternative Energy Development and Efficiency (DEDE)
A Study on Energy Efficiency Index in Petrochemical Industry
34
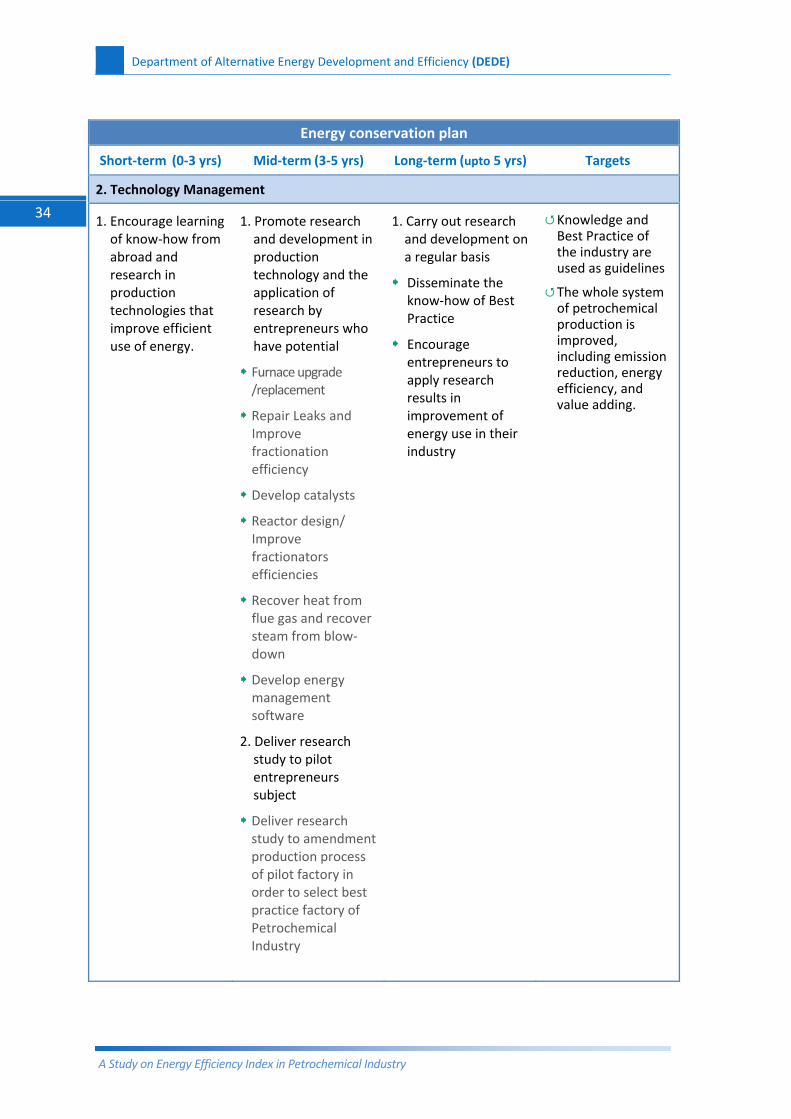
Energy conservation plan
Short‐term (0‐3 yrs) Mid‐term (3‐5 yrs) Long‐term (upto 5 yrs) Targets
2. Technology Management
1. Encourage learning of know‐how from abroad and research in production technologies that improve efficient use of energy.
1. Promote research and development in production technology and the application of research by entrepreneurs who have potential
Furnace upgrade /replacement
Repair Leaks and Improve fractionation efficiency
Develop catalysts
Reactor design/ Improve fractionators efficiencies
Recover heat from flue gas and recover steam from blow‐down
Develop energy management software
2. Deliver research study to pilot entrepreneurs subject
Deliver research study to amendment production process of pilot factory in order to select best practice factory of Petrochemical Industry
1. Carry out research and development on a regular basis
Disseminate the know‐how of Best Practice
Encourage entrepreneurs to apply research results in improvement of energy use in their industry
Knowledge and Best Practice of the industry are used as guidelines
The whole system of petrochemical production is improved, including emission reduction, energy efficiency, and value adding.
Department of Alternative Energy Development and Efficiency (DEDE)
A Study on Energy Efficiency Index in Petrochemical Industry
35
Energy conservation plan
Short‐term (0‐3 yrs) Mid‐term (3‐5 yrs) Long‐term (upto 5 yrs) Targets
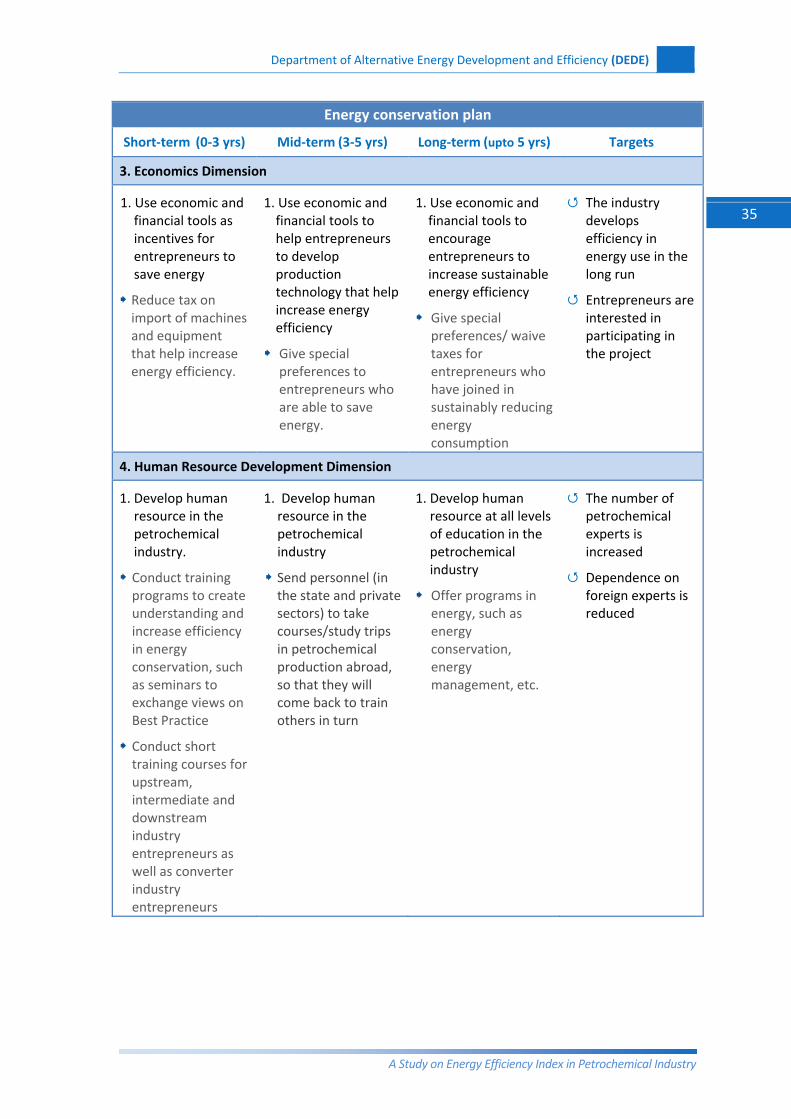
3. Economics Dimension
1. Use economic and financial tools as incentives for entrepreneurs to save energy
Reduce tax on import of machines and equipment that help increase energy efficiency.
1. Use economic and financial tools to help entrepreneurs to develop production technology that help increase energy efficiency
Give special preferences to entrepreneurs who are able to save energy.
1. Use economic and financial tools to encourage entrepreneurs to increase sustainable energy efficiency
Give special preferences/ waive taxes for entrepreneurs who have joined in sustainably reducing energy consumption
The industry develops efficiency in energy use in the long run
Entrepreneurs are interested in participating in the project
4. Human Resource Development Dimension
1. Develop human resource in the petrochemical industry.
Conduct training programs to create understanding and increase efficiency in energy conservation, such as seminars to exchange views on Best Practice
Conduct short training courses for upstream, intermediate and downstream industry entrepreneurs as well as converter industry entrepreneurs
1. Develop human resource in the petrochemical industry
Send personnel (in the state and private sectors) to take courses/study trips in petrochemical production abroad, so that they will come back to train others in turn
1. Develop human resource at all levels of education in the petrochemical industry
Offer programs in energy, such as energy conservation, energy management, etc.
The number of petrochemical experts is increased
Dependence on foreign experts is reduced
Department of Alternative Energy Development and Efficiency (DEDE)
A Study on Energy Efficiency Index in Petrochemical Industry
36
Energy conservation measures in the petrochemical industry can be divided into two levels:
1) Development and improvement of production technology
2) Energy efficiency improvement for processes and equipments
5.1 Development and Improvement of Production Technology
There are 2 major types of energy that have been used in the production processes of
petrochemical industries; thermal and mechanical energies. Mechanical energy is used to
control the working conditions of the equipments, i.e. control the system pressure, mixing the
chemicals. Mechanical energy mostly generated from electrical energy. Thermal energy is used
in many activities, such as preheat raw materials before entering reactors, heat for chemical
reactions, and energy for chemicals separation.
Energy conservation is achieved by changing and improving production process
technologies to facilitate less energy consumption, i.e. reduce the production temperature
and/or reduce the production pressure. The following section provides few developed
technologies that have been applied to petrochemical industries.
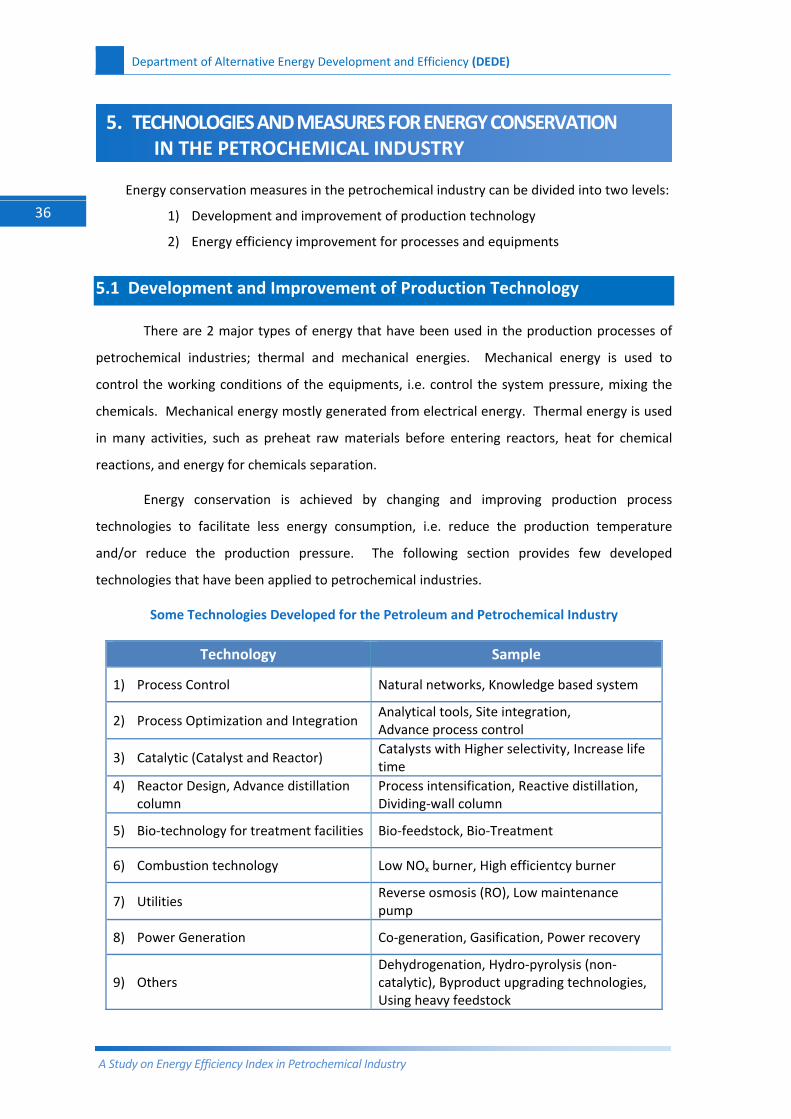
Some Technologies Developed for the Petroleum and Petrochemical Industry
Technology Sample
1) Process Control Natural networks, Knowledge based system
2) Process Optimization and Integration Analytical tools, Site integration, Advance process control
3) Catalytic (Catalyst and Reactor) Catalysts with Higher selectivity, Increase life time
4) Reactor Design, Advance distillation column
Process intensification, Reactive distillation, Dividing‐wall column
5) Bio‐technology for treatment facilities Bio‐feedstock, Bio‐Treatment
6) Combustion technology Low NOx burner, High efficientcy burner
7) Utilities Reverse osmosis (RO), Low maintenance pump
8) Power Generation Co‐generation, Gasification, Power recovery
9) Others Dehydrogenation, Hydro‐pyrolysis (non‐catalytic), Byproduct upgrading technologies, Using heavy feedstock
5. TECHNOLOGIES AND MEASURES FOR ENERGY CONSERVATION IN THE PETROCHEMICAL INDUSTRY
Department of Alternative Energy Development and Efficiency (DEDE)
A Study on Energy Efficiency Index in Petrochemical Industry
37
5.1.1 Catalysts
For all petrochemical production processes, catalysts are vital basis for chemical reaction
and process efficiency in the refinery. Catalysts are used in the main refining processes such as
hydroheating, reforming, hydrocracking, alkylation, and isomerization. Catalysts can improve
the production efficiency and reduce the energy consumption by increasing the conversion rate
of chemical reactions, increasing the selectivity of chemical reactions, reducing the rate of side‐
reactions, and/or improving the reaction condition by reducing the process pressure and/or
temperature.
The main directions for research and development of catalyst is on improving the
production process efficiency by higher activity, longer life, lower cost catalysts that can
optimized process conditions. In general, each catalyst is specific to each production process,
i.e. it cannot be applied to all production plants with similar products but different production
processes. The selection of appropriate catalyst for each specific process requires proper study
and research.
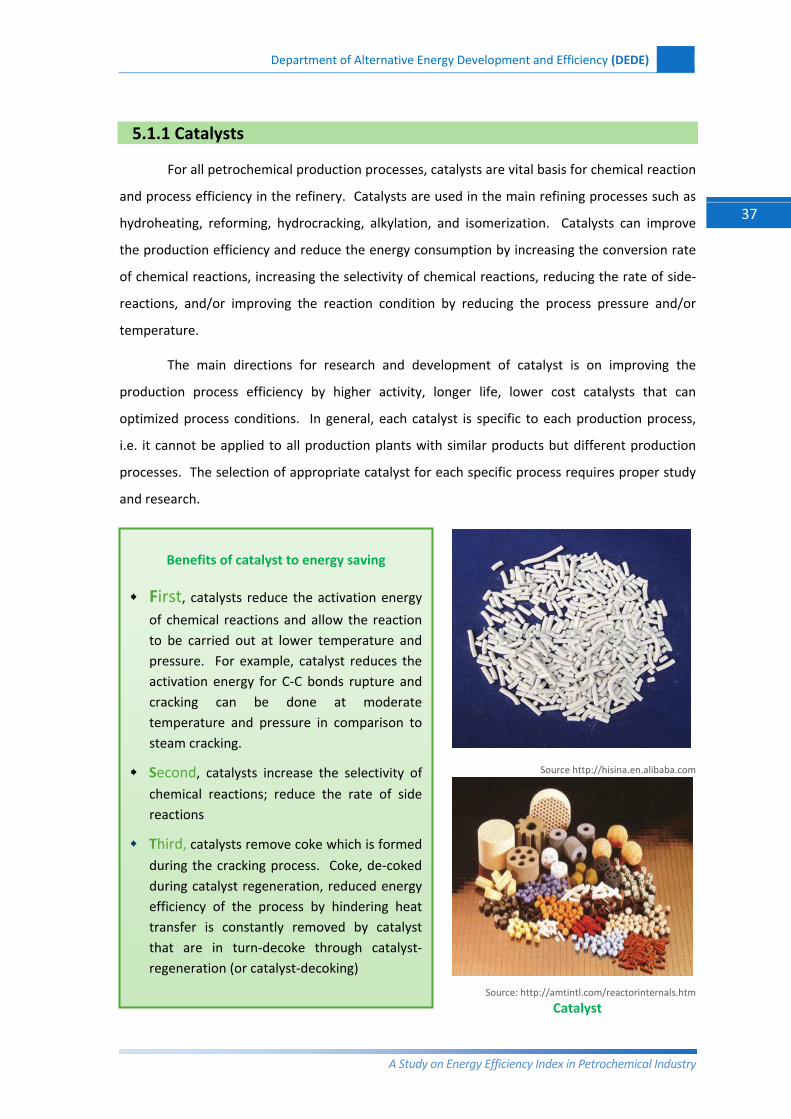
Source http://hisina.en.alibaba.com
Source: http://amtintl.com/reactorinternals.htm
Catalyst
Benefits of catalyst to energy saving
First, catalysts reduce the activation energy of chemical reactions and allow the reaction to be carried out at lower temperature and pressure. For example, catalyst reduces the activation energy for C‐C bonds rupture and cracking can be done at moderate temperature and pressure in comparison to steam cracking.
Second, catalysts increase the selectivity of chemical reactions; reduce the rate of side reactions
Third, catalysts remove coke which is formed
during the cracking process. Coke, de‐coked during catalyst regeneration, reduced energy efficiency of the process by hindering heat transfer is constantly removed by catalyst that are in turn‐decoke through catalyst‐regeneration (or catalyst‐decoking)
Department of Alternative Energy Development and Efficiency (DEDE)
A Study on Energy Efficiency Index in Petrochemical Industry
38
5.1.2 Distillation and Separation
The example of technologies for separation processes improvement are Vacuum Swing
Adsorption Process (VSA), Mechanical Vapor Recompression (MVR), advanced distillation
columns, membrane and combined refrigeration systems. In VSA process, solid sorbents with
high selectivity for light olefin, such as ethylene and propylene, over paraffin (such as ethane and
propane) is used to improve energy efficiency. MVR can be used in conventional
propane/propylene splitter. These techniques can reduce energy consumption by 5 percent in
comparison to steam cracking.
5.1.3 Membrane Technology
Membrane is one of the well established technologies for many production processes.
However, its application in steam cracking is quite limited. Membranes are usually made from
polymer such as polypropylene or inorganic materials. Membrane technologies can be applied
in the separation processes of olefin and paraffin, gasses in hydrogen recovery unit, and coke
and water in water purification process. In general, the application of membrane technologies
in petrochemical industries is still in the developing stage. The major drawbacks of the
technology are the inability of membrane to withstand severe operating conditions. It also
requires regular replacement and maintenance.
Advanced Distillation Column
Advanced distillation column technology has been developed since 1930s. One type of such column is divided‐wall distillation. Divided‐wall column integrates two conventional distillation columns into one column in order to increase heat transfer efficiency. Divided‐wall columns for butadiene extraction can save 15 percent of specific energy consumption in comparison to conventional butadiene distillation. Other advanced distillation column
technologies are Extractive distillation, Reactive distillation, and Azeotropic distillation.
Department of Alternative Energy Development and Efficiency (DEDE)
A Study on Energy Efficiency Index in Petrochemical Industry
39
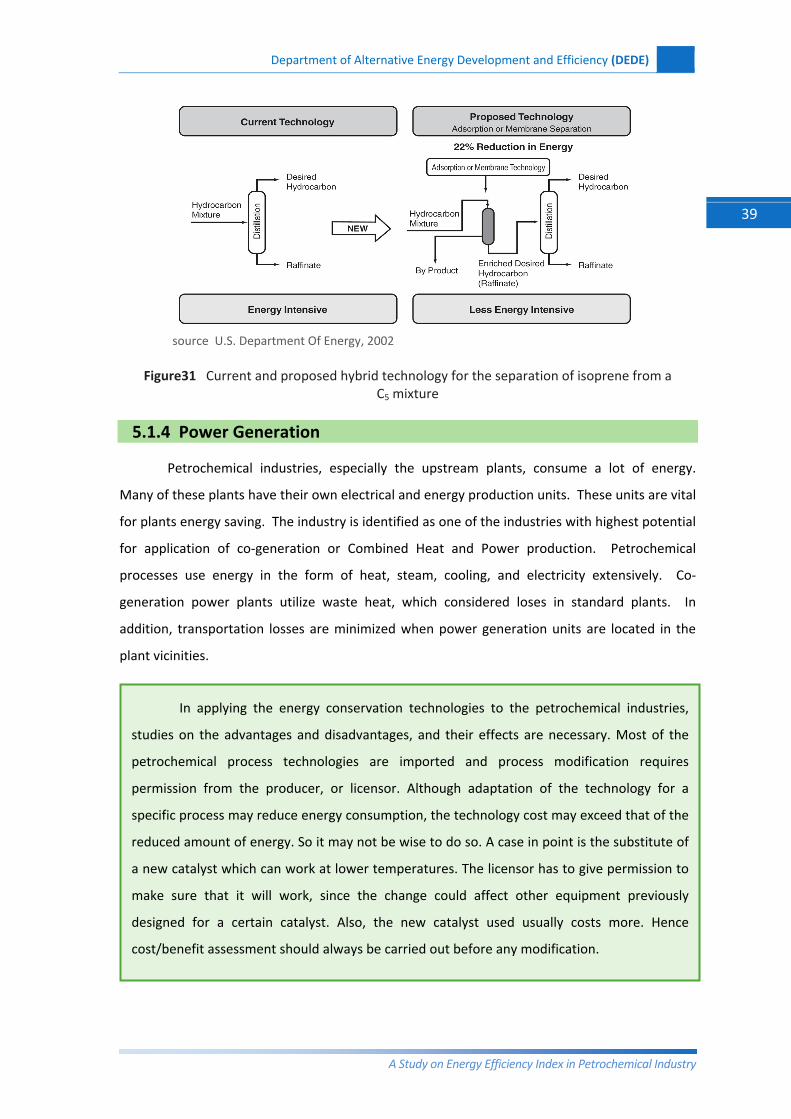
source U.S. Department Of Energy, 2002
Figure31 Current and proposed hybrid technology for the separation of isoprene from a
C5 mixture
5.1.4 Power Generation
Petrochemical industries, especially the upstream plants, consume a lot of energy.
Many of these plants have their own electrical and energy production units. These units are vital
for plants energy saving. The industry is identified as one of the industries with highest potential
for application of co‐generation or Combined Heat and Power production. Petrochemical
processes use energy in the form of heat, steam, cooling, and electricity extensively. Co‐
generation power plants utilize waste heat, which considered loses in standard plants. In
addition, transportation losses are minimized when power generation units are located in the
plant vicinities.
In applying the energy conservation technologies to the petrochemical industries,
studies on the advantages and disadvantages, and their effects are necessary. Most of the
petrochemical process technologies are imported and process modification requires
permission from the producer, or licensor. Although adaptation of the technology for a
specific process may reduce energy consumption, the technology cost may exceed that of the
reduced amount of energy. So it may not be wise to do so. A case in point is the substitute of
a new catalyst which can work at lower temperatures. The licensor has to give permission to
make sure that it will work, since the change could affect other equipment previously
designed for a certain catalyst. Also, the new catalyst used usually costs more. Hence
cost/benefit assessment should always be carried out before any modification.
Department of Alternative Energy Development and Efficiency (DEDE)
A Study on Energy Efficiency Index in Petrochemical Industry
40
5.2 Energy Efficiency Improvement for Processes and Equipments และปรับปรุงที่ใชในกระบวนการผลิต
5.2.1 Energy Management
A systematical management is another important approach for efficient use of energy.
An organization‐wide energy management program creates a foundation and provides guidance
for energy management throughout the organization. Most petrochemical plants have a
responsible unit for energy management. Smaller plants may not have this designated unit and
opportunities for improvement may not be promoted due to some limitations such as the lack of
coordination between internal units, misunderstood support given to efficient energy use
projects, financial limitations, or lack of good financial management, etc.
.
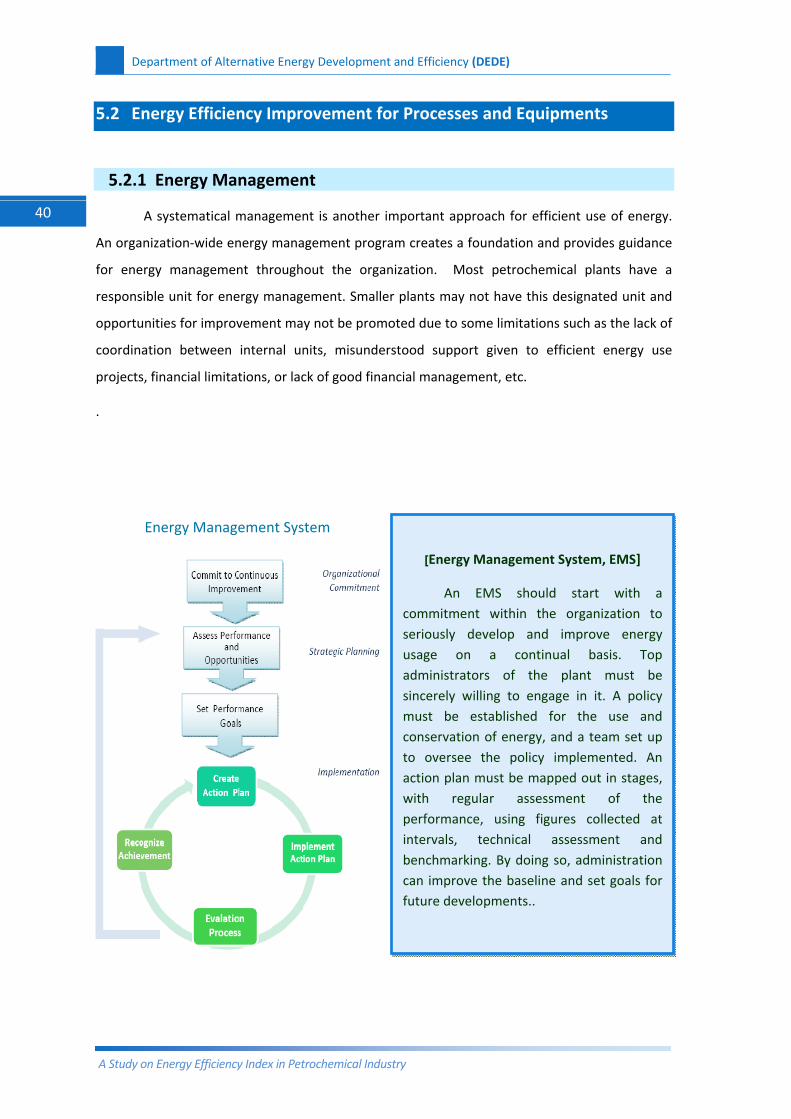
[Energy Management System, EMS]
An EMS should start with a commitment within the organization to seriously develop and improve energy usage on a continual basis. Top administrators of the plant must be sincerely willing to engage in it. A policy must be established for the use and conservation of energy, and a team set up to oversee the policy implemented. An action plan must be mapped out in stages, with regular assessment of the performance, using figures collected at intervals, technical assessment and benchmarking. By doing so, administration can improve the baseline and set goals for future developments..
Energy Management System
Department of Alternative Energy Development and Efficiency (DEDE)
A Study on Energy Efficiency Index in Petrochemical Industry
41
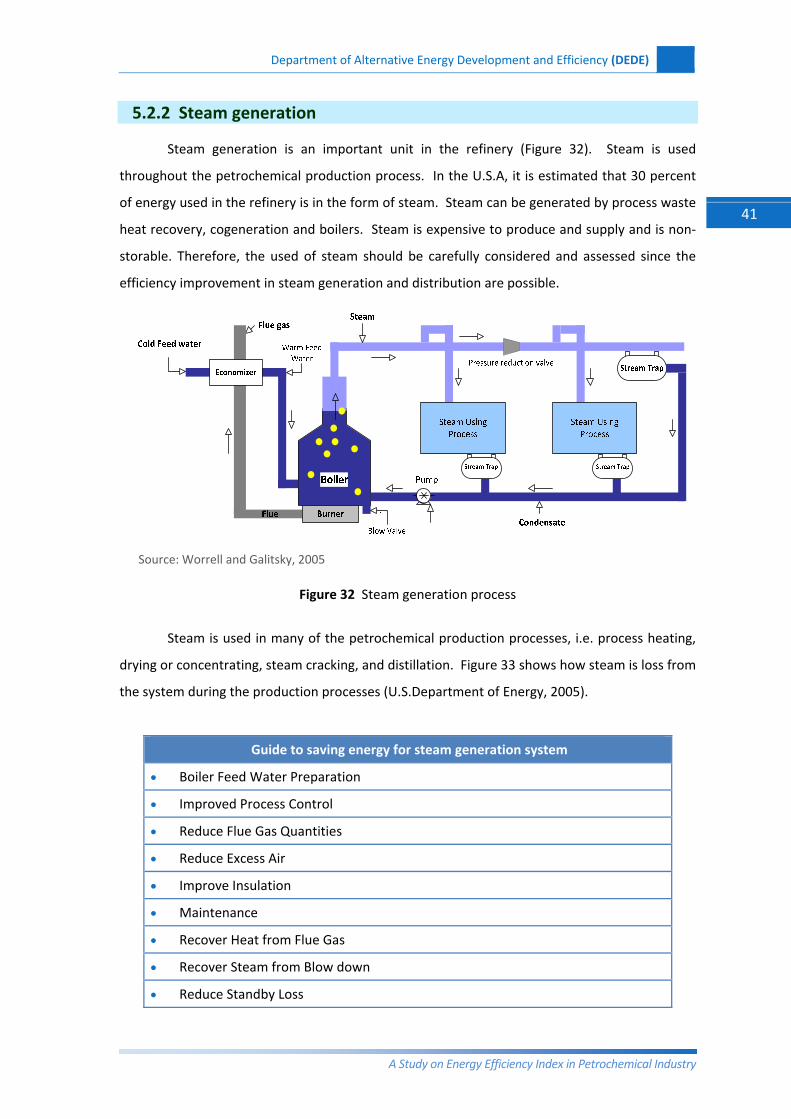
5.2.2 Steam generation
Steam generation is an important unit in the refinery (Figure 32). Steam is used
throughout the petrochemical production process. In the U.S.A, it is estimated that 30 percent
of energy used in the refinery is in the form of steam. Steam can be generated by process waste
heat recovery, cogeneration and boilers. Steam is expensive to produce and supply and is non‐
storable. Therefore, the used of steam should be carefully considered and assessed since the
efficiency improvement in steam generation and distribution are possible.
Source: Worrell and Galitsky, 2005
Figure 32 Steam generation process
Steam is used in many of the petrochemical production processes, i.e. process heating,
drying or concentrating, steam cracking, and distillation. Figure 33 shows how steam is loss from
the system during the production processes (U.S.Department of Energy, 2005).
Guide to saving energy for steam generation system
• Boiler Feed Water Preparation
• Improved Process Control
• Reduce Flue Gas Quantities
• Reduce Excess Air
• Improve Insulation
• Maintenance
• Recover Heat from Flue Gas
• Recover Steam from Blow down
• Reduce Standby Loss
Department of Alternative Energy Development and Efficiency (DEDE)
A Study on Energy Efficiency Index in Petrochemical Industry
42
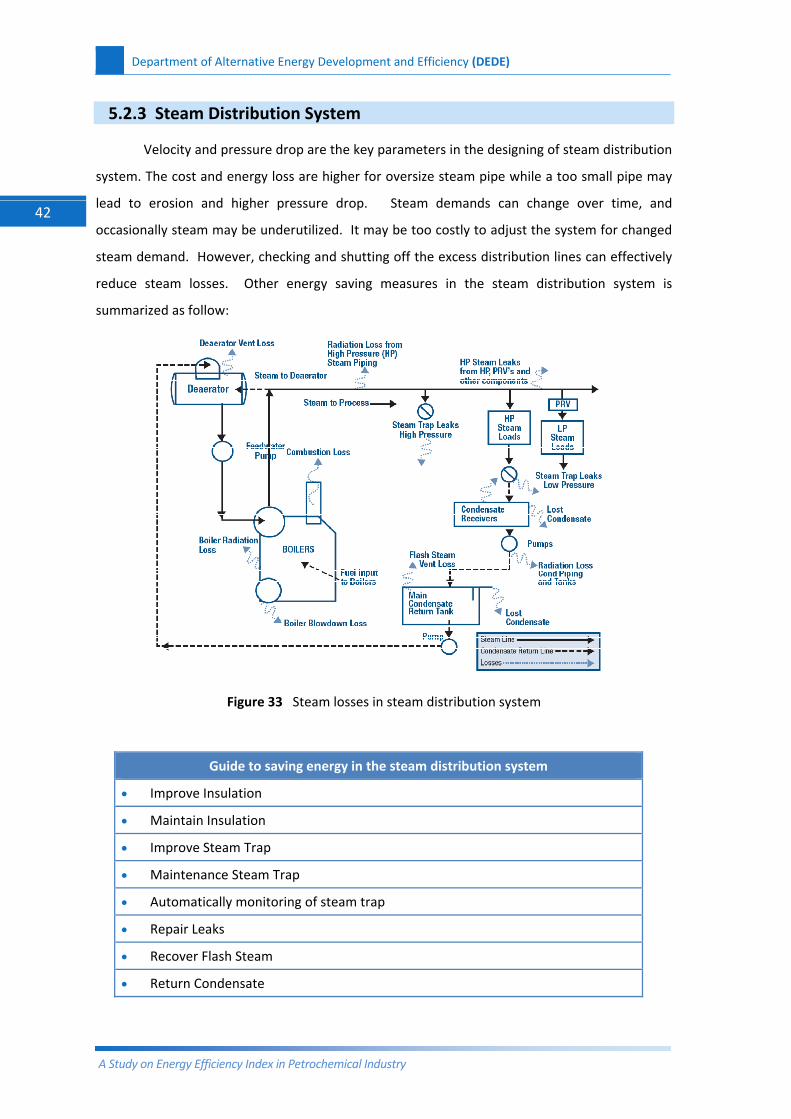
5.2.3 Steam Distribution System
Velocity and pressure drop are the key parameters in the designing of steam distribution
system. The cost and energy loss are higher for oversize steam pipe while a too small pipe may
lead to erosion and higher pressure drop. Steam demands can change over time, and
occasionally steam may be underutilized. It may be too costly to adjust the system for changed
steam demand. However, checking and shutting off the excess distribution lines can effectively
reduce steam losses. Other energy saving measures in the steam distribution system is
summarized as follow:
Figure 33 Steam losses in steam distribution system
Guide to saving energy in the steam distribution system
• Improve Insulation
• Maintain Insulation
• Improve Steam Trap
• Maintenance Steam Trap
• Automatically monitoring of steam trap
• Repair Leaks
• Recover Flash Steam
• Return Condensate
Department of Alternative Energy Development and Efficiency (DEDE)
A Study on Energy Efficiency Index in Petrochemical Industry
43
5.2.4 Heat exchangers
Heat exchangers are common operations in refinery process. Steam is heated and
cooled many times during the process. The optimum design and control of the equipment can
significantly affect energy consumption efficiency.
Most processes in a complex refinery occur under high temperature and pressure,
therefore managing and optimizing heat transfer among processes is very important to energy
saving. A deposit in heat exchanger units and piping, fouling, hinders heat transfer and increases
energy consumption
5.2.5 Process heater
The furnaces and boilers in a petrochemical plant consume over 60 percent of the total
fuel. The efficiency of heater can be improved by improving heat transfer characteristics and
flame luminosity, installing of recuperators or air‐preheaters, and improving the control system.
New burners have been designed to improve air and fuel mixing and to be more efficient heat
transfer. Other burners such as lean‐premix burners, swirl burners, pulsating burners and rotary
burners are also improved. Safety and environmental issues, such as reduction of NOx, has to be
addressed in selecting these new burners.
Guide to energy saving in heat transfer system
• Maintenance : Regular maintenance of burners, draft control and heat exchangers is essential to maintain safe and energy efficient operation of a process heater
• Air‐preheating:
• New Burner: New burner technology reduces cost for operation and emissions treatment
Fouling in Heat exchangers
Operation and design can be the causes of fouling. There are several methods that attempt to reduce fouling including using sensors for early warning, physical and chemical methods to create high temperature coatings, using ultrasound, as well as improving the design and operation of facilities. Current researches are focusing on principle of fouling and redesign of heat exchangers and reactors. Methods for fouling reduction are focusing on process and temperature control, regular maintenance and cleaning of heat exchanger and, retrofit of reactor tubes
Department of Alternative Energy Development and Efficiency (DEDE)
A Study on Energy Efficiency Index in Petrochemical Industry
44
5.2.6 Distillation
Distillation is a process which uses energy to separate products on the basis of boiling
points. Heat comes from process heaters and/or steam. Energy saving in this process can be
achieved by optimizing distillation column.
Energy saving opportunity in distillation column
• Operation Procedure: The optimization of the reflux ratio of the distillation column can make significant energy savings.
• Check Product Purity: The reflux rate should be decreased in small increments until the desired purity is obtained.
• Reducing Re‐boiler Duty
• Upgrade Column Internals: New tray designs can result in enhanced separation efficiency and decrease pressure drop
• Stripper Optimization: Optimization of these parameters can reduce energy use considerably
5.2.7 Motors
Petrochemical facilities use electric motors in many stages of production, consuming
over 80percent of total electricity. Equipments with electric motors include pumps (60% of all
motor use), compressors (15%), fans (9%), and other equipments (16%). Systematic approach
for optimizing the demand and supply of motor system instead of focusing on individual
components often provides the most energy savings.
Guide to energy saving in motor system (Motor optimization)
• Sizing of Motors: Motors and pumps that are sized inappropriately result in unnecessary energy losses
• High Efficiency Motors: High efficiency motors reduce energy losses through improved design, better materials, tighter tolerances, and improved manufacturing techniques
• Power Factor: The power factor can be corrected by minimizing idling of electric motors
• Voltage Unbalance
• Adjustable Speed Drive (ASDs) Variable Speed Drives (VSDs) : ASDs better match speed to load requirements for motor operations
Department of Alternative Energy Development and Efficiency (DEDE)
A Study on Energy Efficiency Index in Petrochemical Industry
45
5.2.8 Pumps
Pumps use 60 percent of electricity use for motors which is approximately 50 percent of
the total electrical energy in refineries. It is estimated that over 20 percent of energy use for
pumps can be saved by optimizing equipment and/or control system. In fact, priority should be
given to cost in this investment, since the lifetime of pumps can be up to 20 years.
Pumping systems include a pump, a driver, pipe, control systems such as adjustable
speed drives, and a part of the overall motor system. Systematic approach for optimizing the
motor system also includes pumping system. The main approaches for optimizing the pumps
operation are reducing friction, or adjusting the system to the best efficiency point (BEP)
indicated in the pump curve. Friction can be reduced by correcting the pipe size, using surface
coating and polishing, and adjusting the pump speed drives.
Guide to energy saving in pumping system (Pumps)
1) Operation and Maintenance: Better maintenance will reduce these problems and save energy
• Replacement of worn impellers, especially in caustic or semi‐solid applications.
• Bearing inspection and repair.
• Bearing lubrication replacement, once annually or semiannually.
• Inspection and replacement of packing seals. Allowable leakage from packing seals is usually between two and sixty drops per minute.
• Inspection and replacement of mechanical seals. Allowable leakage is typically one to four drops per minute.
• Wear ring and impeller replacement. Pump efficiency degrades from 1 to 6 points for impellers less than the maximum diameter and with increased wear ring clearances
• Pump/motor alignment check.
2) Monitoring
• Wear monitoring
• Vibration analyses
• Pressure and flow monitoring
• Current or power monitoring
• Differential head and temperature rise across the pump (also known as thermodynamic monitoring)
• Distribution system inspection for scaling or contaminant build‐up
3) Reduce need
4) More Efficient Pumps
5) Correct Sizing of Pump and Matching Pump to Intended Duty
6) Use Multiple Pump: using multiple pumps is the most cost‐effective and most energy efficient solution for varying loads
Department of Alternative Energy Development and Efficiency (DEDE)
A Study on Energy Efficiency Index in Petrochemical Industry
46
Guide to energy saving in pumping system (Pumps) cont’d
7) Trimming Impeller or Shaving Shaves
8) Controls: shut off unneeded pumps or reduce the load of individual pumps until needed.
9) Adjustable Speed Drive (ASDs) or Variable Speed Drives (VSDs)
10) Avoid Throttling Valve : Extensive use of throttling valves or bypass loops may be an indication of an oversized pump
11) Correct Size of Pipes : Correct sizing of pipes should be done at the design or system retrofit stages where costs may not be restrictive
12) Replace Belt Drives
13) Precision Castings, Surface Coatings and Polishing: The use of castings, coatings, or polishing reduces surface roughness that in turn, increases energy efficiency.
14) Sealing
5.2.9 Air Compressors
Air compressor is equipment that consumes a lot of energy in the burner. Large‐sized air
compressors may use electric motors, steam turbines or gas turbines
Guide to energy saving in compressor
1) Compress air maintenance
• Blocked pipeline filters increase pressure drop. Keep the compressor and intercooling surfaces clean and foul‐free by inspecting and periodically cleaning filters. Keep motors and compressors properly lubricated and cleaned.
• Inspect fans and water pumps for peak performance.
• Inspect drain traps periodically to ensure they are not stuck in either the open or
• closed position and are clean
2) Proper monitoring and maintenance
3) Reduce leaks in pipes and equipment
4) Reducing the Inlet Air Temperature.
5) Maximize Allowable Pressure Dew Point at Air Intake.
6) Properly Sized Regulators.
7) Sizing Pipe Diameter Correctly.
8) Adjustable Speed Drives (ASDs).
9) High Efficient Motors
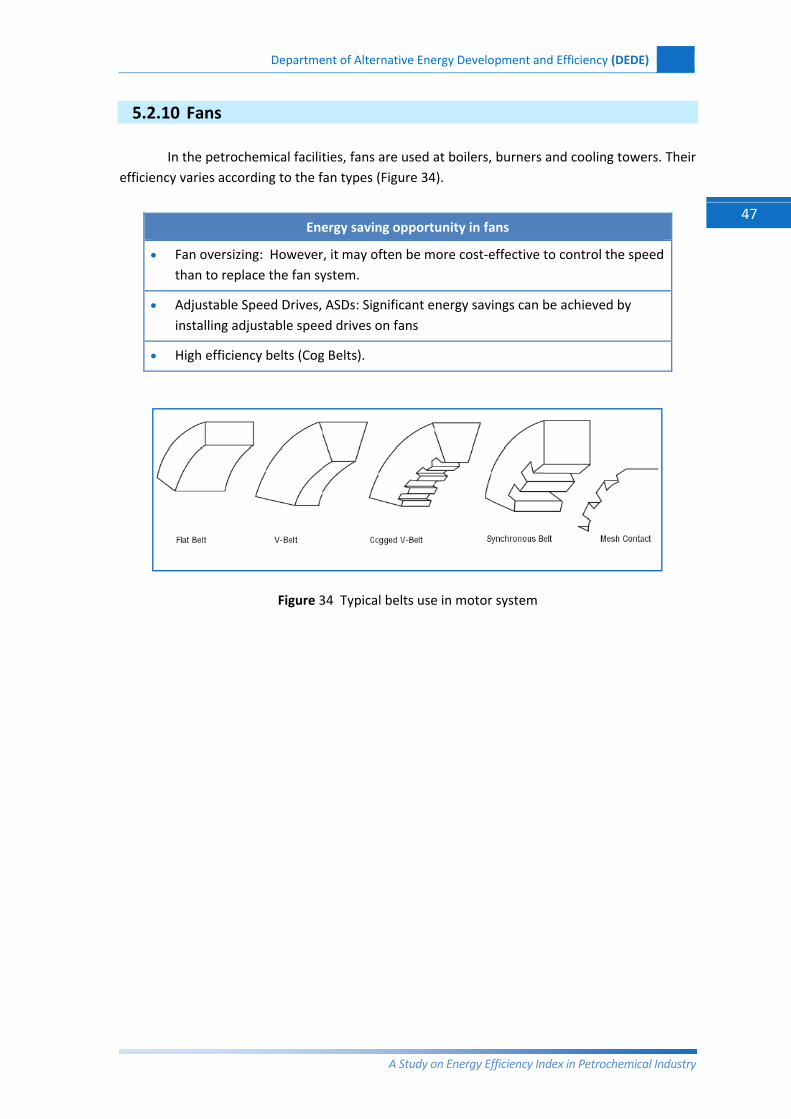
Department of Alternative Energy Development and Efficiency (DEDE)
A Study on Energy Efficiency Index in Petrochemical Industry
47
5.2.10 Fans
In the petrochemical facilities, fans are used at boilers, burners and cooling towers. Their efficiency varies according to the fan types (Figure 34).
Energy saving opportunity in fans
• Fan oversizing: However, it may often be more cost‐effective to control the speed than to replace the fan system.
• Adjustable Speed Drives, ASDs: Significant energy savings can be achieved by installing adjustable speed drives on fans
• High efficiency belts (Cog Belts).
Figure 34 Typical belts use in motor system
Department of Alternative Energy Development and Efficiency (DEDE)
A Study on Energy Efficiency Index in Petrochemical Industry
48
This study classify the petrochemical industries and assesses the energy consumption
index of each group, for the purpose of assessing the potential and basedline of energy
conservation and giving recommendations for systematical and efficient energy conservation in
upstream, intermediate and downstream industries. Data concerning the technologies and
energy conservation measures used by plants are compiled and evaluated for the benefit of the
overall industry.
Petrochemical plants are grouped on the basis of the product, into upstream,
intermediate and downstream plants, and information is collected of the years 2003‐2006, from
30 sample plants participating in the project. The indices used for the study are Specific Energy
Consumption (SEC) and Energy Intensity (EI). It is found that in general the plants have good
monitoring of their production, with the exception of some producing under capacity or
temporary shutdown for repair. Comparison of energy use at the plants finds that energy
consumption indices have a wide range, even between plants producing the same products. This
can be explained by the use of different raw materials and/or production technologies, as well as
the small number of entrepreneurs there are. However, analysis results reveal data not much
different from other countries, and that Thailand’s petrochemical industry is consuming less
energy.
There are 2 levels of energy conservation: in the development and improvement of the
production technology, and in management and improvement of the efficiency of equipment in
energy consumption. Catalyst technology has a very significant role in the manufacturing of
products due to reduce operating condition i.e., pressure and temperature, particularly catalysts
in the reforming, hydrocracking, alkylation and isomorization processes. Also effective in the
production system are reactor design and advanced distillation and separation process. For
example, membrane technology can increase equipment efficiency markedly. So does
improvement of power generation by combine heat and steam or co‐generation. Development
of the system must go hand in hand with management and improvement for efficient use of
existing equipment. In addition to this, there should be a monitoring and quality control system
in place.
Unlike other industries, the petrochemical industry requires advanced and specific
technology and expertise. This study finds that the main problems and obstacles in energy
conservation lie in the lack of a centralized/coordinated database needed for good and efficient
SUMMARY

Department of Alternative Energy Development and Efficiency (DEDE)
A Study on Energy Efficiency Index in Petrochemical Industry
49
management, support of research and development in the production technologies, complete
cycle of management of the industry, as well as expert consultants. Added to this, this is an
industry which relies heavily on advanced technological machinery entirely from abroad, making
the cost very high and dependent on the global market and the fluctuation of the Baht currency.
Therefore, in promoting energy conservation, the problems should be solved in short, medium
and long terms, respectively, using a concrete success energy index.
In addition to recommendations given here, training programs are designed to support
further conservation of energy by giving basic knowledge concerning conservation of energy and
acceleration in efficiency of its use, enhancing the potential of participants as experts in the
field, particularly in petrochemical management standards, testing and analysis of energy
consumption, and energy saving projects. A website is also designed, with the purpose of being a
channel for coordination and follow‐up of trainees and organizations concerned. Also being
developed are database software for the recording and processing of related data such as
energy consumption data, production data, energy use indices, technologies/standards of
energy saving, etc. which can link up with the Department of Alternative Energy Development
and Efficiency.
Fruitfully, this study project is carried out with the objective of presenting feasible ways
to promote efficient energy conservation, in both production technology and energy
management. It includes in‐depth measures for efficient energy conservation and sustainable
human resource development. The ultimate goal is for the petrochemical industry to make the
most of the energy used, thus increasing Thailand’s competitive edge and its ability to tackle the
present and future global energy crisis.
****************************
Department of Alternative Energy Development and Efficiency (DEDE)
A Study on Energy Efficiency Index in Petrochemical Industry
50
1. Boon‐Long. S., PTIT Focus Special Annual Issue 2005, Rungsiri Publishing: Bangkok, 2005.
2. California Energy Commission. (2004), Energy Efficiency Roadmap for Petroleum Refineries in California (DRAFT Final Report)
3. Gielen, D. J., Vos, D. And Drill, Van A.W.N. The Petrochemical Industry and Its Energy Use: Prospects for the Dutch Energy Intensive Industry (1996). (ECN‐C‐96‐029). The Energy research Centre of the Netherlands (ECN). Retrieved from http://www.ecn.nl/publications/default.aspx?nr=ECN‐C‐‐96‐029 on September, 2006.
4. Guidelines for Energy Management Overview. Retrieved from http://www.energystar.gov on September, 2006.
5. Kruesarn, R. and Rachabungsa, K. Who’s Who in the Petroleum and Petrochemical Industries of Thailand, 5th Ed; The Petroleum Institute of Thailand (PTIT), 2005.
6. Margaret, W. G. Handbook of Petrochemicals and Process, Brookfield, VT: Gower, 1991.
7. Phylipsen, D., Blok, K., Worrell, E., and Beer, J. D. Benchmarking the energy efficiency of Dutch industry: an assessment of the expected effect on energy consumption and CO2 emissions, Energy Policy, 30, 663‐679. 2002.
8. Phylipsen, D., Worrell, E. and Blok, K. (1995). Parameters Affecting Energy Consumption in the Petrochemical Industry, Proceedings ECEEE 1995 Summer Study, June 2‐6,1995, Manlieu, France
9. Ren, T., Patel. M. and Blok, K. (2004), Energy Efficiency And Innovative Emerging Technologies For Olefin Production, Parallel Session Innovative Energy Efficiency Examples Of Different Industrial Sectors ‐Energy Efficiency In The Cement, Metal And Petrochemical Industry.
10. Robert , A. M., Handbook of Petrochemicals Production Processes, McGraw‐Hill, USA., 2005.
11. The Office of Energy Efficiency and Renewable Energy (2004), Separation Of Olefin/Paraffin Mixtures With Carrier‐Facilitated Transport Membranes Use of Membranes Could Significantly Reduce Energy Costs, Industrial Technologies Program, The U.S. Department Of Energy.
12. U.S. Department of Energy (2002), Novel Modified Zeolites for Energy‐Efficient Hydrocarbon Separations, Industrial Materials for the Future. Office of Industrial Technologies Energy Efficiency and Renewable Energy — U.S. Department Of Energy Project Fact Sheet.
13. U.S. Department of Energy (2002), Olefin Recovery From Chemical Industry, Waste Steams Membrane Separation Recovers Olefins From Gaseous Waste Steams For Use As Chemical Feedstocks. Office of Industrial Technologies Energy Efficiency and Renewable Energy — U.S. Department Of Energy Project Fact Sheet.
14. U.S. Department of Energy Office of Industrial Technologies (2000). Energy and Environmental Profile of the U.S. Chemical Industry, prepared by Energentic Incorporated, Columbia, Maryland.
15. Worrell, E. and Galitsky, C. (2004). Profile of the Petroleum Refining Industry in California, California Industries of the Future Program, Ernest Orlando Lawrence Berkeley National Laboratory.
16. Worrell, E. and Galitsky, C. (2005). Energy Efficiency Improvement and Cost Saving Opportunities for Petroleum Refineries. An ENERGY STAR® Guide for Energy and Plant Managers.
17. Worrell, E., De Beer, J. G., Faaij, A. P. C. and Blok, K. (1994). Potential Energy Savings in the Production Route for Plastics, Energy Convers. Mgmt 35, p 1073‐1085.
18. Worrell, E., Phylipsen, D., Einstein, D. and Martin, N. (2002). Energy Use and Energy Intensity of the U.S. Chemical Industry (LBNL‐44314), Lawrence Berkeley National Laboratory, Berkeley, CA.
19. ความรูเบื้องตนปโตรเคมี. จุลสาร บริษัทอุตสาหกรรมปโตรเคมีกัลไทย จํากัด. 2536.
REFERENCES
Department of Alternative Energy Development and Efficiency (DEDE)
A Study on Energy Efficiency Index in Petrochemical Industry
51
20. โครงการฐานขอมูลดานการผลิต และการซ้ือขายผลิตภัณฑปโตรเคมี. เอกสารการวิจัย วิทยาลัยปโตรเลียมและปโตรเคมี. จุฬาลงกรณมหาวิทยาลัย. 2531.
21. ภาวะอุตสาหกรรมปโตรเคมี. สํานักงานเศรษฐกิจและอุตสาหกรรม. จาก
http://www.oie.go.th/industrystatus2_th.asp. ตุลาคม 2549.
22. วีรพจน ลือประสิทธิ์สกุล. ความรูเกี่ยวกับอุตสาหกรรมปโตรเคมีและการพัฒนาอุตสาหกรรมปโตรเคมีในประเทศไทย.
บริษัท เดียรบุค จํากัด: กรุงเทพ ฯ. 2535.
23. วีรพล จีรประดิษฐกุล. สถานการณและนโยบายพลังงานไทย. เอกสารสรุปผลการประชุมกลุมยอยทางวิชาการครั้งที่ 2. สํานักงานนโยบายและแผนพลังงาน. 2548.
24. อํานาจ สิทธัตตระกูล. อุตสาหกรรมปโตรเคมี. ภาควิชาวิทยาการและวิศวกรรมวัสดุ คณะวิศวกรรมศาสตรและเทคโนโลยีอุตสาหกรรม มหาวิทยาลัยศิลปากร. 2533.
REFERENCES (CONT’D)
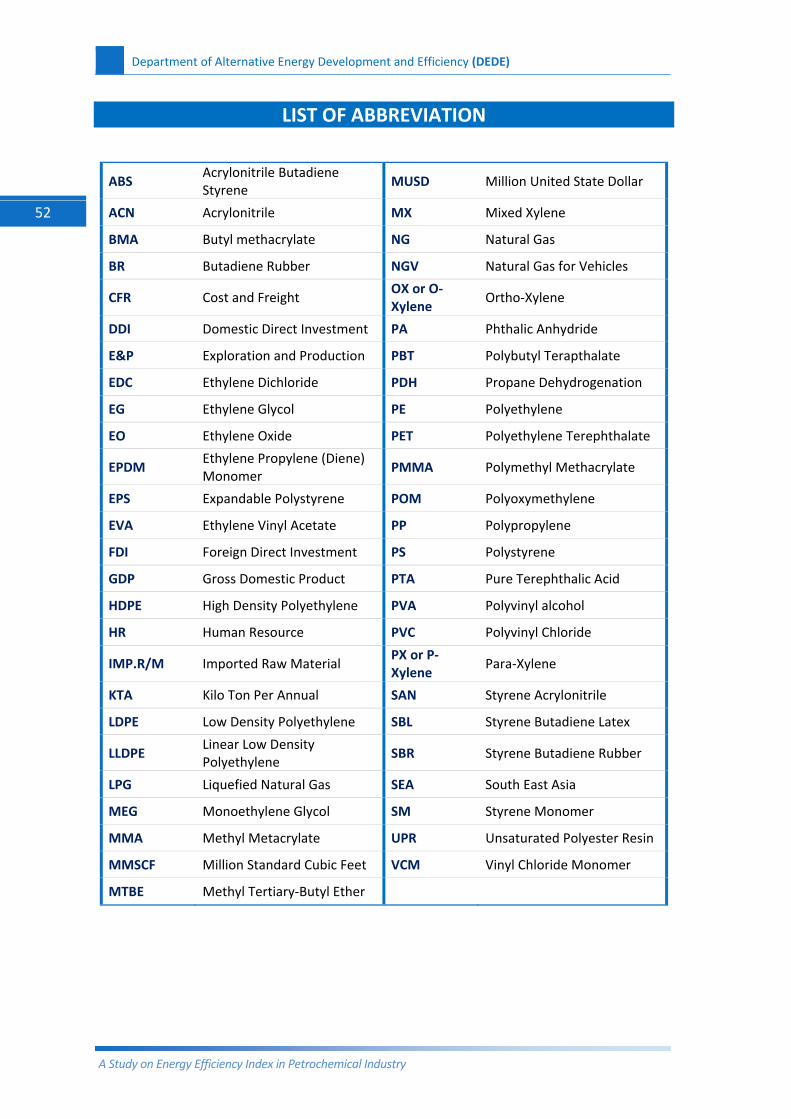
Department of Alternative Energy Development and Efficiency (DEDE)
A Study on Energy Efficiency Index in Petrochemical Industry
52
LIST OF ABBREVIATION
ABS Acrylonitrile Butadiene Styrene
MUSD Million United State Dollar
ACN Acrylonitrile MX Mixed Xylene
BMA Butyl methacrylate NG Natural Gas
BR Butadiene Rubber NGV Natural Gas for Vehicles
CFR Cost and Freight OX or O‐Xylene
Ortho‐Xylene
DDI Domestic Direct Investment PA Phthalic Anhydride
E&P Exploration and Production PBT Polybutyl Terapthalate
EDC Ethylene Dichloride PDH Propane Dehydrogenation
EG Ethylene Glycol PE Polyethylene
EO Ethylene Oxide PET Polyethylene Terephthalate
EPDM Ethylene Propylene (Diene) Monomer
PMMA Polymethyl Methacrylate
EPS Expandable Polystyrene POM Polyoxymethylene
EVA Ethylene Vinyl Acetate PP Polypropylene
FDI Foreign Direct Investment PS Polystyrene
GDP Gross Domestic Product PTA Pure Terephthalic Acid
HDPE High Density Polyethylene PVA Polyvinyl alcohol
HR Human Resource PVC Polyvinyl Chloride
IMP.R/M Imported Raw Material PX or P‐Xylene
Para‐Xylene
KTA Kilo Ton Per Annual SAN Styrene Acrylonitrile
LDPE Low Density Polyethylene SBL Styrene Butadiene Latex
LLDPE Linear Low Density Polyethylene
SBR Styrene Butadiene Rubber
LPG Liquefied Natural Gas SEA South East Asia
MEG Monoethylene Glycol SM Styrene Monomer
MMA Methyl Metacrylate UPR Unsaturated Polyester Resin
MMSCF Million Standard Cubic Feet VCM Vinyl Chloride Monomer
MTBE Methyl Tertiary‐Butyl Ether

The Department of Alternative Energy Development and Efficiency (DEDE)
LOGOwww.themegallery.com
The Department of Alternative Energy Development and Efficiency (DEDE)
Ministry of Energy
17 Rama I rd.Pathumwan BKK. 10330Tel 0-2223-2311 Fax 0-2226-3943