plant barry co2 capture project - cslf · pdf file10/17/2016 · plant barry co 2...
TRANSCRIPT

Plant Barry CO2 Capture Project
Confidential
October 2015
© 2016 MITSUBISHI HEAVY INDUSTRIES, LTD. All Rights Reserved.
2
1. MHI’s CO2 Capture Technologies & Experience
© 2016 MITSUBISHI HEAVY INDUSTRIES, LTD. All Rights Reserved.

1.1 History of Development of MHI’s CO2 Capture Technology 1990 Started R&D activities with Kansai Electric Power Company (KEPCO)
1991 Started a 2 ton per day pilot plant at KEPCO’s Nanko Power station
1994 Development of proprietary hindered amine solvent “KS-1®” and “KM CDR Process®” with KEPCO
1999 First commercial plant in Malaysia ( 200 ton per day, to enhance urea synthesis from the CO2 recovered from a reformer flue gas)
2002 Started a pilot test for coal-fired power plant at MHI’s Hiroshima R&D center
2003 High energy efficiency - Development of proprietary energy efficient process “Improved KM CDR Process“
2008 First commercial plant in Middle east ( 400 ton per day) which “Improved KM CDR Process” applied
2011 World’s First - Started 500 ton per day fully integrated CCS demonstration plant with Southern Company for a coal-fired power plant at Alabama Power's James M. Barry Electric Generating Plant
2014 World’s Largest - Received an order for a PCC plant of 4,776 ton per day for EOR mainly promoted by NRG Energy Inc. and JX Nippon Oil & Gas Exploration Corporation
© 2016 MITSUBISHI HEAVY INDUSTRIES, LTD. All Rights Reserved.
1.2 MHI - R&D Strength & Experience
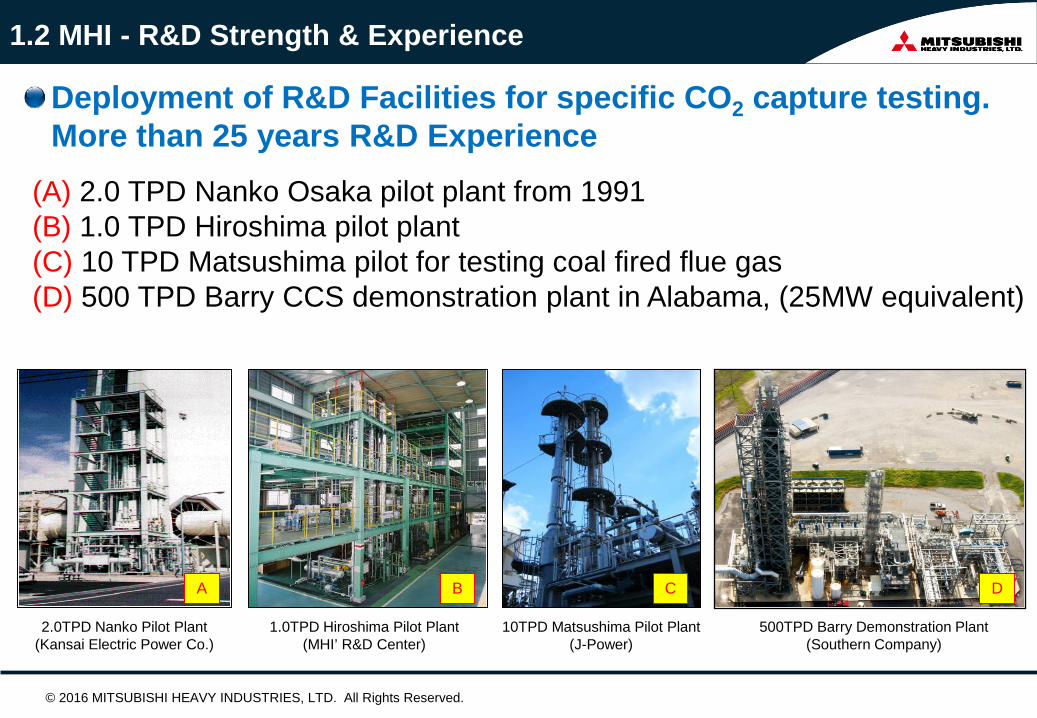
Deployment of R&D Facilities for specific CO2 capture testing. More than 25 years R&D Experience
(A) 2.0 TPD Nanko Osaka pilot plant from 1991 (B) 1.0 TPD Hiroshima pilot plant (C) 10 TPD Matsushima pilot for testing coal fired flue gas (D) 500 TPD Barry CCS demonstration plant in Alabama, (25MW equivalent)
A B C D
2.0TPD Nanko Pilot Plant (Kansai Electric Power Co.)
1.0TPD Hiroshima Pilot Plant (MHI’ R&D Center)
10TPD Matsushima Pilot Plant (J-Power)
500TPD Barry Demonstration Plant (Southern Company)
© 2016 MITSUBISHI HEAVY INDUSTRIES, LTD. All Rights Reserved.

1.3 MHI CO2 Capture Plants Commercial Experience
World leading large scale post combustion CO2 capture technology licensor, with 11 commercial plants in operation from a variety of natural gas or heavy oil flue gas sources World’s largest CCS plant is under construction in Texas.
2005 330 t/d Japan
2009 450 t/d India
2006 450 t/d India
1999 200 t/d Malaysia
CO2 Recovery (CDR) Plant – IFFCO Phulpur Unit (India)
2006 450 t/d India
CO2 Recovery (CDR) Plant – IFFCO AonlaUnit (India)
2010 400 t/d UAE
2009 450 t/d Bahrain
2010 240 t/d Vietnam
2011 340 t/d Pakistan
2012 450 t/d India
2014 500 t/d Qatar
1999 210 t/d Malaysia
© 2016 MITSUBISHI HEAVY INDUSTRIES, LTD. All Rights Reserved.
2016 283 Mt/d Japan

1.4 Petra Nova CO2 Capture Plant for CO2-EOR
Absorber
Regenerator
CO2 Compressor Cooling Tower
Flue Gas Quencher
The world’s largest CO2 capture and compression plant from coal-fired power plant Project owner: Petra Nova, a partnership between NRG Energy, Inc. and JX Nippon Oil & Gas Exploration Corporation Location:NRG WA Parish Power Plant in Thompsons, TX. Flue gas source: Slipstream off of 650MW coal- fired boiler CO2 concentration: 11.5% CO2 capture capacity:4,776 TPD (240MW equivalent) CO2 capture ratio:90% CO2 Use : CO2 EOR Pipeline : Approximately 81miles Injection Site: West Ranch oil field in Jackson County, TX Operation Start:4th Quarter, 2016
© 2016 MITSUBISHI HEAVY INDUSTRIES, LTD. All Rights Reserved.
© 2016 MITSUBISHI HEAVY INDUSTRIES, LTD. All Rights Reserved.
2. 500 TPD Barry Demonstration Plant
Item Description
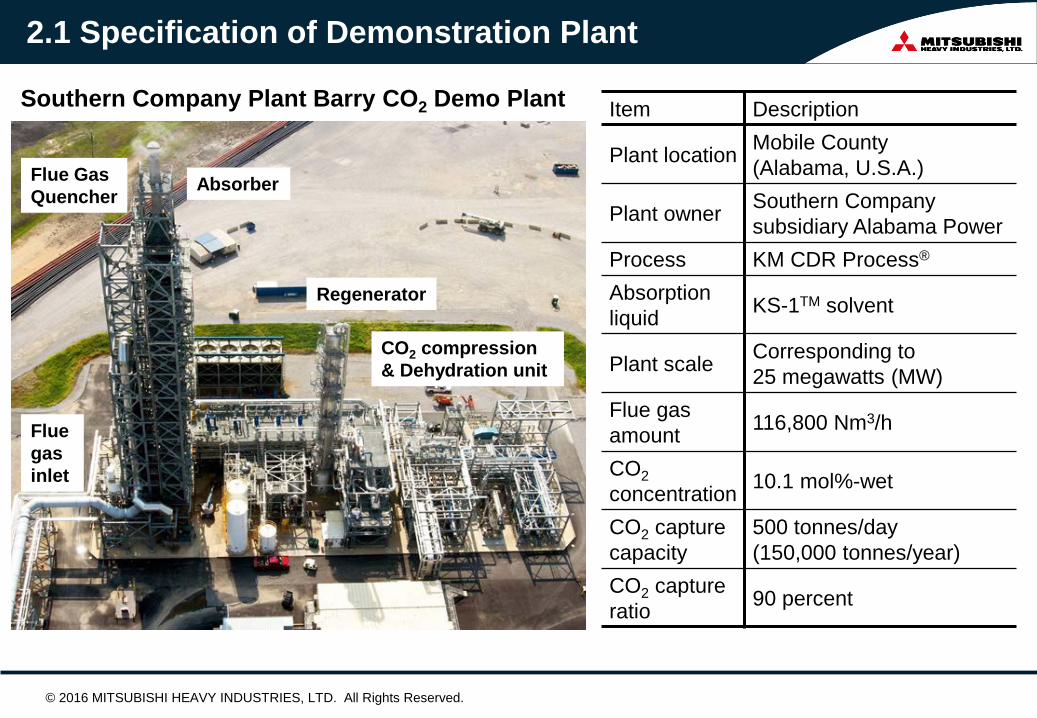
Plant location Mobile County (Alabama, U.S.A.)
Plant owner Southern Company subsidiary Alabama Power
Process KM CDR Process® Absorption liquid KS-1TM solvent
Plant scale Corresponding to 25 megawatts (MW)
Flue gas amount 116,800 Nm3/h
CO2 concentration 10.1 mol%-wet
CO2 capture capacity
500 tonnes/day (150,000 tonnes/year)
CO2 capture ratio 90 percent
2.1 Specification of Demonstration Plant
Southern Company Plant Barry CO2 Demo Plant
Absorber
Regenerator
CO2 compression & Dehydration unit
Flue gas inlet
Flue Gas Quencher
© 2016 MITSUBISHI HEAVY INDUSTRIES, LTD. All Rights Reserved.

2.2 Test Items – Focusing from 2011 to 2013
Test Item Main Results Performance optimization
Achieved 0.95 ton-steam/ton-CO2 by optimizing steam consumption
Emissions & waste streams monitoring
Successfully demonstrated amine emission reduction technologies under the various SO3 concentration condition
Dynamic response test
Successfully demonstrated Automatic Load Adjustment & Optimized Operation Control System
Long term test validating equipment reliability and life
Achieved more than 100,000 metric tons of CO2 injection without any operational issues.
© 2016 MITSUBISHI HEAVY INDUSTRIES, LTD. All Rights Reserved.
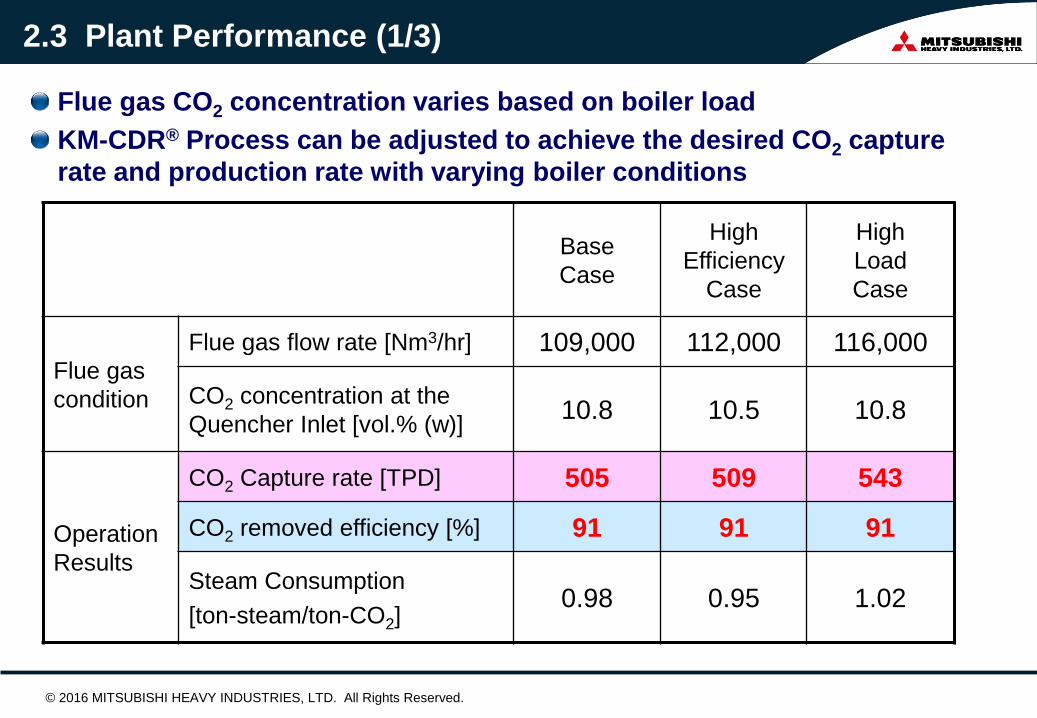
2.3 Plant Performance (1/3)
Base Case
High Efficiency
Case
High Load Case
Flue gas condition
Flue gas flow rate [Nm3/hr] 109,000 112,000 116,000
CO2 concentration at the Quencher Inlet [vol.% (w)] 10.8 10.5 10.8
Operation Results
CO2 Capture rate [TPD] 505 509 543
CO2 removed efficiency [%] 91 91 91
Steam Consumption [ton-steam/ton-CO2]
0.98 0.95 1.02
Flue gas CO2 concentration varies based on boiler load KM-CDR® Process can be adjusted to achieve the desired CO2 capture rate and production rate with varying boiler conditions
© 2016 MITSUBISHI HEAVY INDUSTRIES, LTD. All Rights Reserved.
020406080
100
CO2 R
emov
alEf
ficie
ncy
[%]
0100200300400500600
CO2 C
aptu
re ra
te[tp
d]
00.20.40.60.8
11.2
0 hr 12 hr 24 hr 36 hr 48 hr 60 hr 72 hrTime
Stea
m C
onsu
mpt
ion
[ton-
Stea
m /t
on-C
O2]
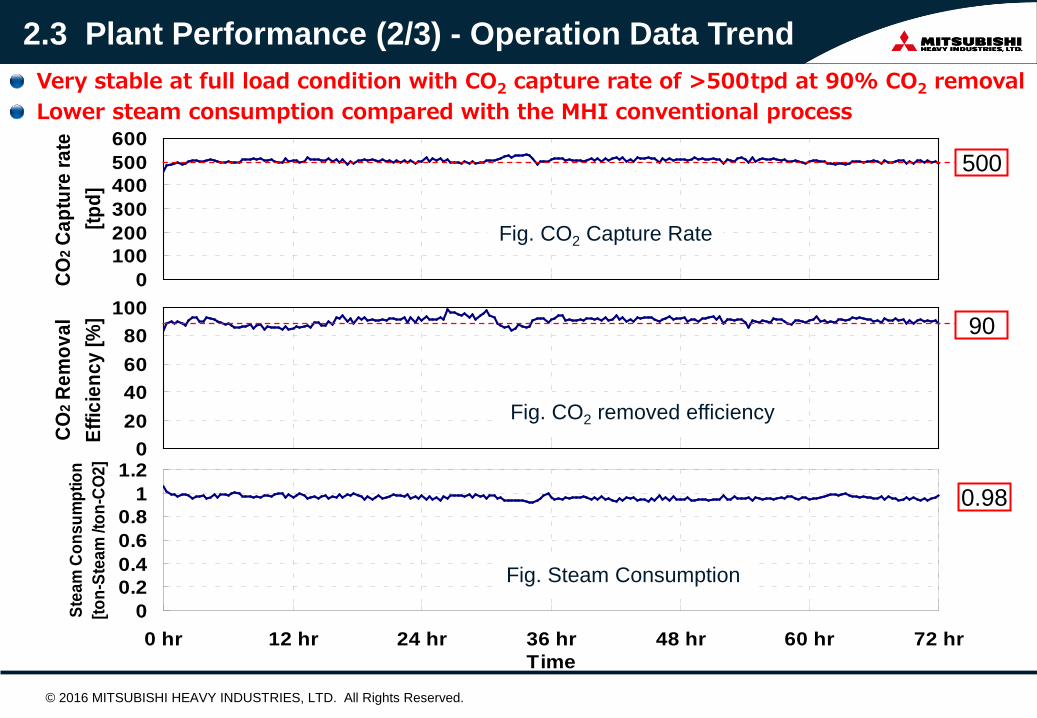
Fig. CO2 Capture Rate
Fig. CO2 removed efficiency
Fig. Steam Consumption
500
90
2.3 Plant Performance (2/3) - Operation Data Trend Very stable at full load condition with CO2 capture rate of >500tpd at 90% CO2 removal Lower steam consumption compared with the MHI conventional process
0.98
© 2016 MITSUBISHI HEAVY INDUSTRIES, LTD. All Rights Reserved.
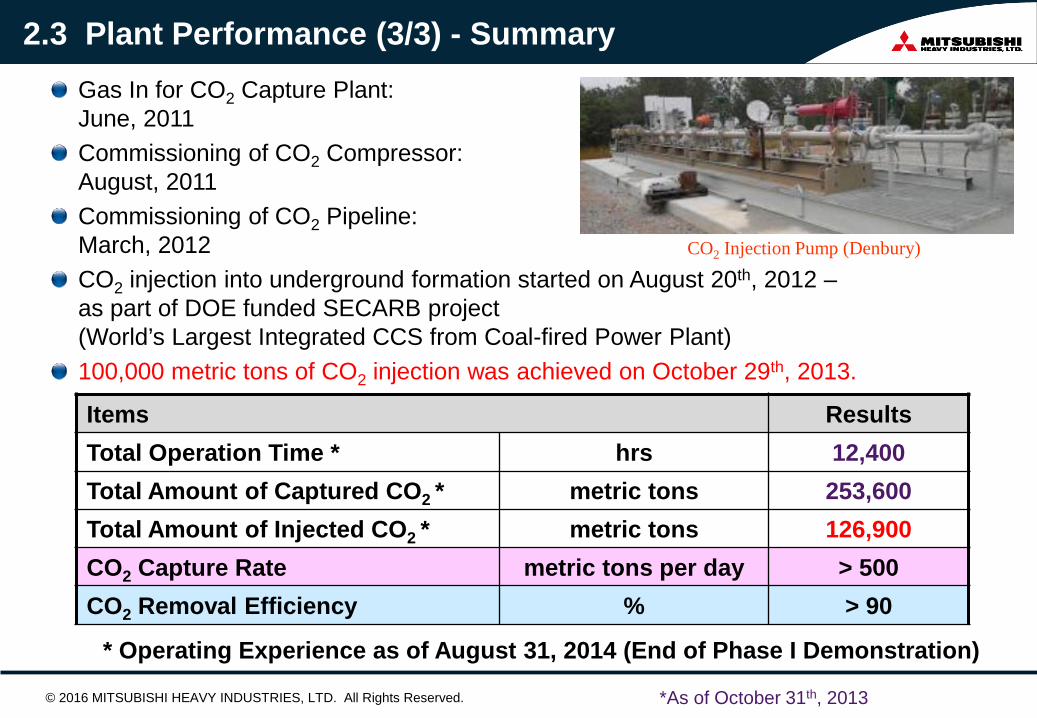
Items Results Total Operation Time * hrs 12,400 Total Amount of Captured CO2 * metric tons 253,600 Total Amount of Injected CO2 * metric tons 126,900 CO2 Capture Rate metric tons per day > 500 CO2 Removal Efficiency % > 90
*As of October 31th, 2013
Gas In for CO2 Capture Plant: June, 2011 Commissioning of CO2 Compressor: August, 2011 Commissioning of CO2 Pipeline: March, 2012 CO2 injection into underground formation started on August 20th, 2012 – as part of DOE funded SECARB project (World’s Largest Integrated CCS from Coal-fired Power Plant) 100,000 metric tons of CO2 injection was achieved on October 29th, 2013.
CO2 Injection Pump (Denbury)
* Operating Experience as of August 31, 2014 (End of Phase I Demonstration)
© 2016 MITSUBISHI HEAVY INDUSTRIES, LTD. All Rights Reserved.
2.3 Plant Performance (3/3) - Summary

2.4 Amine Emission Test Results
© 2016 MITSUBISHI HEAVY INDUSTRIES, LTD. All Rights Reserved.
More than 90% Reduction
Demonstrated MHI’s advanced amine emission reduction system Amine emission was reduced by more than 90% in comparison with the conventional system under the presence of SO3 in flue gas
Fig. Relationship between SO3 conc. and solvent emission
High SO3 in the gas
Low SO3 in the gas
Fig. Absorber top

Coal fired power plant changes the operation load frequently and the flue gas condition fluctuates Demonstrate Automatic Load Adjustment Control (ALAC) & Optimized Operation Condition Control (OOCC)
2.5 Dynamic Response Testing (1/3)
Automatic Load Adjustment Control (ALAC)
Optimized Operation Condition Control (OOCC)
Load following operation for; 1) CO2 production demand 2) Flue gas flow rate change
(Simulated boiler-load change)
Continuous optimization of the operation condition for; 1) CO2 production demand 2) CO2 recovery rate
requirement (Simulated boiler-load change)
© 2016 MITSUBISHI HEAVY INDUSTRIES, LTD. All Rights Reserved.
0
20
40
60
80
100
120
0 5 10 15 20 25 30 35Time [min]
Gas
Loa
d [%
]
0
20
40
60
80
100
120
CO
2 Rem
oval
Effi
cien
cy [%
]
Flue Gas Flow Rate
CO2 Production
Load Up (60% to 100%)
0
20
40
60
80
100
120
0 5 10 15 20 25Time [min]
Gas
Loa
d [%
]
0
20
40
60
80
100
120
CO
2 Rem
oval
Effi
cien
cy [%
]
Flue Gas Flow Rate
CO2 Recovery rate
CO2 Production
Load Up (60% to 100%)
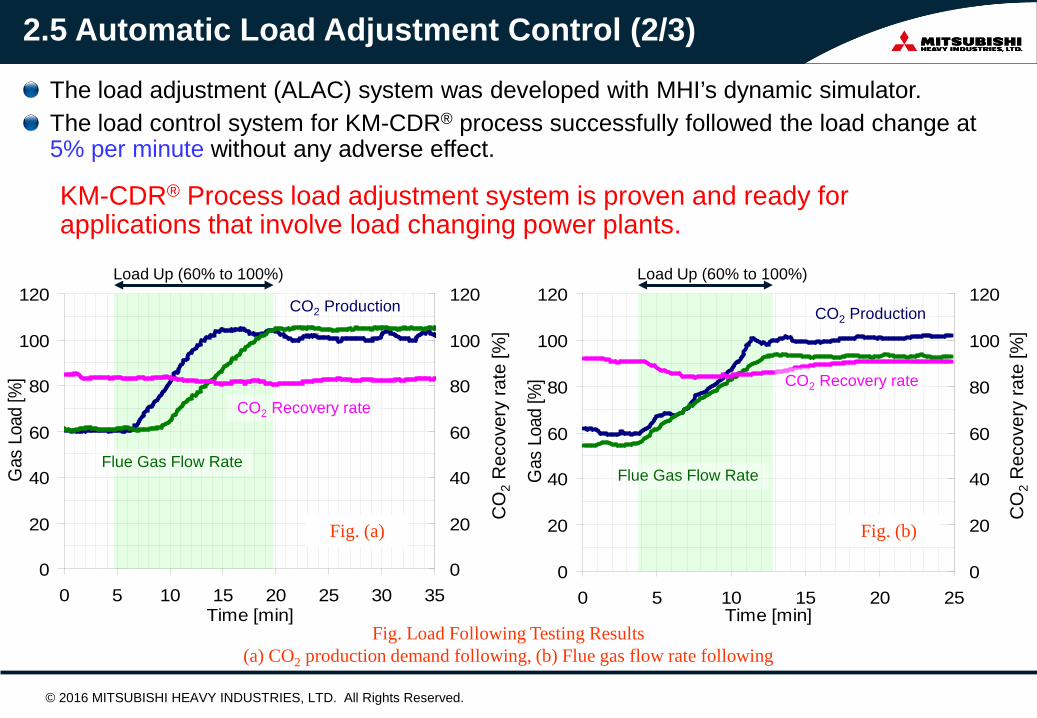
Fig. Load Following Testing Results (a) CO2 production demand following, (b) Flue gas flow rate following
The load adjustment (ALAC) system was developed with MHI’s dynamic simulator. The load control system for KM-CDR® process successfully followed the load change at 5% per minute without any adverse effect.
KM-CDR® Process load adjustment system is proven and ready for applications that involve load changing power plants.
Fig. (a) Fig. (b)
2.5 Automatic Load Adjustment Control (2/3)
CO2 Recovery rate
CO
2 Rec
over
y ra
te [%
]
CO
2 Rec
over
y ra
te [%
]
© 2016 MITSUBISHI HEAVY INDUSTRIES, LTD. All Rights Reserved.

Fig. Comparison between manual operation and optimized operation control (a) Manual operation, (b) Optimized operation control system (CO2 Production Control Mode)
The Optimized operation control (OOCC) system was added to the ALAC system. The system for KM-CDR® process automatically and continuously optimized the plant operation following to CO2 production Demand or CO2 recovery rate requirement.
KM-CDR® Process operation control system is also proven and ready for the integration with upstream and downstream facility.
(a) (b)
Flue Gas Load
CO2 Recovery Rate
CO2 Production
CO2 Conc.
CO
2 Pro
duct
ion
[sto
n/d]
CO
2 Cap
ture
Rat
e [s
ton/
d]
CO
2 Rem
oval
Effi
cien
cy [%
]
CO
2 Rem
oval
Effi
cien
cy [%
]
CO
2 Con
c. [v
ol.%
]
CO
2 Con
c. [v
ol.%
]
Flue
Gas
Loa
d [%
]
Flue
Gas
Loa
d [%
]
CO2 Production
CO2 Conc.
Flue Gas Load
30hrs Trend 30hrs Trend
CO
2 Rec
over
y ra
te [%
]
CO
2 Rec
over
y ra
te [%
]
CO
2 Pro
duct
ion
[sto
n/d]
CO2 Recovery Rate
© 2016 MITSUBISHI HEAVY INDUSTRIES, LTD. All Rights Reserved.
2.5 Automatic Load Adjustment Control (3/3)

© 2016 MITSUBISHI HEAVY INDUSTRIES, LTD. All Rights Reserved.
3. HES Demonstration Project

3. HES Demonstration Project
© 2016 MITSUBISHI HEAVY INDUSTRIES, LTD. All Rights Reserved.
Outline of Project - DOE funded 25 MW pilot demonstration project for heat integration system
with CCS plant - Integrated with MHPS’s HES and MHI’s 500 TPD CCS Plant at
Plant Barry circulating BFW between host site steam cycle, CCS and HES
- Energy efficiency improvement and tangential benefits (removal improvement of PM, SO3, Hg, Se, etc.) were evaluated
Flue Gas Cooler (Heat Extractor) on 25 MW Pilot 25 MW Pilot Test Facilities

3.1 Test Result - Performance
© 2016 MITSUBISHI HEAVY INDUSTRIES, LTD. All Rights Reserved.
Source Data collected Units w/o HES heat
integration
w/ HES heat
integration
w/ HES heat
integration 12/16/2015 9/9/2015 9/1/2015
FGC
Flue gas flow rate scfm 49,998 60,640 60,631 Flue gas temp FGC inlet degF 288 323 314 Flue gas temp FGC outlet degF NA 200 186 Recovered heat MMBtu/h NA** 8.66 9.09
CO2
Flue gas flow rate* scfm 73,800 73,800 73,800 CO2 removal performance* % > 90 > 90 > 90 BC flow rate stph 0 38 50 BC temp CO2 cooler inlet degF NA 128 123 BC temp CO2 cooler outlet degF NA 167 167 Recovered heat MMBtu/h NA 2.9 4.4
Plant
Boiler Load net MW 721 783 680 BC flow rate stph 0 38 50 BC feed temp degF NA 128 123 BC return temp degF NA 280 264 Recovered heat MMBtu/h NA 11.1 13.6 Recovered heat for 550 MW base plant MMBtu/h NA 244 300
Confirmed heat integration performance – 240-300 MMBTU/hr heat recovery for 550 MW base plant – Up to 65% reduction of FGD makeup water

3.2 Test Result - Durability
© 2016 MITSUBISHI HEAVY INDUSTRIES, LTD. All Rights Reserved.
Confirmed no significant corrosion on tube bundles - 4 wks w/o SO3 injection, 3 wks w/ SO3 injection - Detailed analysis is in progress
(c) January, 2016*
*The remaining fly ash can be easily removed by soot-blowers.
(a) Before operation (b) October, 2015

© 2016 MITSUBISHI HEAVY INDUSTRIES, LTD. All Rights Reserved.
4. Environmental Monitoring
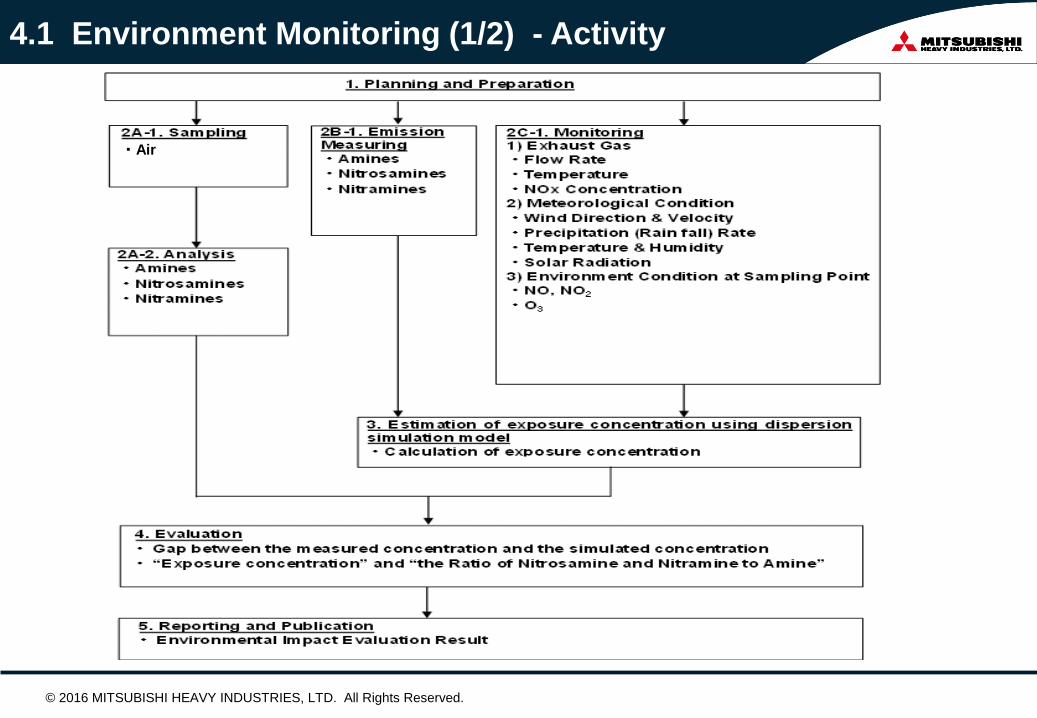
4.1 Environment Monitoring (1/2) - Activity
© 2016 MITSUBISHI HEAVY INDUSTRIES, LTD. All Rights Reserved.
・ Air

4.1 Environment Monitoring (2/2) - Sampling Points
500 m from CO2 Absorber
(B) (C)
Sampling Point
(A)
Air
© 2016 MITSUBISHI HEAVY INDUSTRIES, LTD. All Rights Reserved.

4.2 Monitoring Result
1)NA & NT were also measured in the air near the CO2
Capture plant inside Barry Power Plant. Confirmed that Concentration of NA & NT is less than 0.3 ng/Nm3 that NIPH recommends as allowable figures.
2)Carry out dispersion model calculation and compared the actual result. MHI consider that the dispersion model considering chemical reaction rate is appropriate to evaluate the environmental impact by amine emission.
© 2016 MITSUBISHI HEAVY INDUSTRIES, LTD. All Rights Reserved.

• Phase 1 DOE NETL Carbon Capture Program, Large-Pilot Scale Post-Combustion: Completed
• Phase 2: Planned
5. Next Path
Program Built-in Reboiler
Replace regenerator reboiler & stripper with integrated unit Particulate Matter (PM) Management
Determine maximum allowable particulate matter concentration
New Solvent A Testing Replace KS-1TM solvent with improved amine-based New Solvent A
=> Reduce capital & operating cost of CCS

© 2016 MITSUBISHI HEAVY INDUSTRIES, LTD. All Rights Reserved.
6. Summary

Summary Plant Barry captured Total 253,600 metric tons of CO2, and total 126,900 metric tons of CO2 were injected to underground as of August 31, 2014
Demonstrated stable performance at full load condition with CO2 capture rate of 500 TPD at 90% CO2 removal.
The following successful demonstration results were obtained. New amine emission reduction technologies achieved significant reduction (More than 90% reduction). Automatic Load Adjustment (ALAC) System stably controlled load changing at a rate of 5%/min. Optimized Operation Control (OOCC) System continuously optimized the operation following the changing of flue gas condition or CO2 production demand.
Southern Company and MHI completed DOE funded heat integration project to further improve net plant efficiency.
Southern Company and MHI completed Phase 1 DOE NETL Carbon Capture Program, Large-Pilot Scale Post-Combustion. Phase 2 is being planned.
© 2016 MITSUBISHI HEAVY INDUSTRIES, LTD. All Rights Reserved.

© 2016 MITSUBISHI HEAVY INDUSTRIES, LTD. All Rights Reserved.