political corruption and corporate cash...
TRANSCRIPT
Political Corruption and Corporate Cash Holdings Dong Wook Seo*, Seung Hun Han**
JEL classification: G30; G32; F50 Keywords: Cash holdings; Financial Policy; Political Corruption
* E-mail: [email protected] ** Corresponding author / E-mail: [email protected] Address: 22 #2122, 335 Gwahangno, Yuseong-gu, Daejeon 305-701, S. Korea Tell: +82-42-350-6309 Fax: +82-46-350-6334
1
Political Corruption and Corporate Cash Holdings
Abstract
This study empirically analyzes the effects of political corruption on corporate cash holdings policy and the impact of cash holdings on firm performance using 97 multinational data. We find that there is a nonlinear cubic function relationship between the political corruption and corporate cash holdings with a negative coefficient of cubic term of political corruption. Specifically, in developed countries with low levels of political corruption, there is a U-shape relationship between political corruption and cash holdings; however, in frontier and emerging countries, there is an Inverted-U-shape relationship. These results show that two hypothesis ‘Expropriation Shielding hypothesis’ and ‘Preoccupancy hypothesis’ on previous literature are not conflicting, but can be explained differently according to the level of development of countries and the level of political corruption. In addition, we find that the effects of political corruption on firm performance when firms use cash are different in developed and developing countries. From these results, we suggest that political corruption is an important variable in corporate financial policy and firm performance.
2
1. Introduction
Political corruption is prevalent all over the world and especially cohesion between
politicians and firms has received much attention both in the literature and media (Tanzi,
1998). For example, recently it has been hot issue in media that presidential impeachments of
former president Park in Korea and former president Rouseff in Brazil have been mainly due
to their cohesion with private companies. Therefore, academic literatures document the
impact of political connection or environment not only on the performance of firms but also
the financial policy of firms. For example, Fisman (2001) shows that the value of Indonesian
firms are directly affected by the political connection with the former president Suharto who
has dominated the political structure of Indonesia for 31 years (1967-1998). In addition,
previous studies show that the degree of political corruption in the economy affects the
financial policy of the firms such as cash holding policy, earnings management, or capital
structures. Among those financial policies, the most important financial policy is cash
holdings policy for both corrupt politicians and politically-connected firms, because cash
guarantees anonymity and can be used autonomously with low level of surveillance (because
of its liquidity and flexibility). Therefore, political environment will affect the cash holdings
policy of the firms because cash will be the target of expropriation by the corrupt politicians
while companies want to take advantage of corrupt politicians by lobbying through cash.
Therefore, this study examines the impact of corruption level of countries on the cash
holdings policy of firms belong to the country using the samples from 97 countries.
Corruption level of the country is one of the most important national characteristics
variables that evaluate the economic, political and social status of the country in various
dimensions, because it influences the overall economic activities of individuals and financial
policy of firms in the nation. Such dynamic impacts of corruption not only influence the
overall economy but also various aspects of society, because it is affected by the institutions
(La Porta et al., 1999; Lederman et al., 2005) and perceived culture of the country. Acemoglu
and Johnson (2005) argue that institutions of society – the social, economic, legal and
political organizations – significantly affect the economic performance and Chen et al. (2015)
and Doidge et al. (2007) show that significant portion of the firms’ financial policy is
explained by country level cultural variables while firm-specific characteristics explain only
small portion of it. Therefore, we argue that national level of corruption, that has considerable
3
impact from institutions and culture, has a significant impact on firms’ financial policy
similar to culture. Karolyi (2016) suggests that studying the role of culture and institutions is
important in finance. Consequently, we argue that investigating the impact of corruption on
the financial policy and firm performance is meaningful contribution to the finance literature,
because corruption is significantly affected by institutions and culture. Chen, Dou, Rhee, and
Veeraraghavan (2015) identify the cultural influence on financial policy of the firms as
‘cultural motive’, but the influence by institutions on financial policy is not yet clarified.
Specifically, there is no study directly examines the impact of national corruption level on the
financial policy focusing on cash holdings policy using multinational data, and there is no
study how the corruption and cash holdings affect the performance of the firm even if
corruption is heavily influenced by institutions of the country. Therefore, we suggest that this
motive of cash holdings by institutions as ‘institutional motive (or motive by institutions)’.
Furthermore, this study subcategorize the sample into frontier, emerging, and developed
countries, and show that the level of economic development has moderating effect to the
relation between corruption and cash holdings policy. More specifically, literatures show that
variations in national political corruption affects macroeconomic growth, market structure,
corporate decision makings and financial policy except for cash holding policy and its impact
on firm performance even though cash is an important asset especially in corrupt economy.
Therefore, this study contributes to the literature by testing the impact of national corruption
level on firms’ cash holdings policy and further its impact on the firms’ performance.
In previous studies, there are two controversial hypotheses on the relation between
political corruption and cash holdings policy. The first hypothesis is the 'Expropriation
Shielding Hypothesis' that the higher level of political corruption, firms will hold the smaller
amount of cash to prevent the expropriation by the corrupt politicians (Shleifer and Vishny,
1993). The second hypothesis is the ‘Preoccupancy Hypothesis’ that the higher level of
political corruption, the firm will hold the more amount of cash to take an advantage from
corrupt politicians by bribing or lobbying using the cash (Leff, 1964; Huntington, 1968).
However, the previous studies are limited to the national or regional level to test these two
hypotheses and thus they show controversial results. However, by expanding the dataset to
multinational levels of corruption and corporate cash holdings, we can test and explain the
contradicting two hypotheses of preoccupancy and expropriation hypotheses by taking into
4
account additional dimension of economic development status of country such as frontier,
emerging, and developed economies.
In this study, we find that there is a nonlinear cubic function relationship with a
negative coefficient of cubic term of political corruption between the political corruption and
cash holdings in the firm year observations sample about 600,000 in 97 countries 1995 to
2015. Among those sample firms, we find that there is a difference in the effect of political
corruption on cash holdings policy among frontier, emerging, and developed countries. In
developed countries, we find the U-shape relation between political corruption and cash
holdings. Specifically, in developed countries with very low levels of corruption, there is a
negative correlation between political corruption and firm cash reserves. However, in some
developed countries where the level of corruption is moderate, there is a positive correlation
between political corruption and firm cash reserves. In addition, we find the inverse U-shape
relation between political corruption and cash holdings. Specifically, in some emerging
countries where corruption is moderate, there is a positive correlation between political
corruption and firm cash reserves. In contrast, in some emerging and frontier economies
where corruption is extremely high, negative correlations exist between political corruption
and firm cash holdings. From our result, different levels of economic development and
degree of corruption show variations in cash holding policy of firms supporting either
expropriation shielding hypothesis or preoccupancy hypothesis. In developed countries with
low level of political corruption, there is less advantage from corruption, so only risk of
expropriation exists. In this sample, expropriation shielding hypothesis explains the negative
relation between political corruption and cash holdings. In sample with moderate level of
corruption in some developed and emerging countries, there is huge advantage from corrupt
politicians, so preoccupancy hypothesis well explain the positive relation between political
corruption and cash holdings. In the last sample with extremely high level of corruption in
some emerging and frontier countries, the risk of expropriation is severe, so firms want to
avoid expropriation by reducing cash holdings. In this case, expropriation shielding
hypothesis explain the positive relation between political corruption and cash holdings again.
These results are robust to the endogeneity issues in the analysis using 2 Stage Least Square
(2SLS) using an instrument variable of the largest city population density and Propensity
Score Matching (PSM), and thus we find the consistent results after controlling for the
5
endogeneity problems.
Moreover, we analyze the effect of political corruption on operating performance
when using cash held by the firms. In developed countries with low levels of corruption,
reducing cash holdings is beneficial to operating performance. However, in some developed
and emerging countries with a medium level of corruption, raising cash reserves is favorable
to operating performance. In some frontier and emerging economies, where the levels of
corruption are high, it is advantageous to raise cash holdings, but firms have shown to reduce
their cash holdings in reality to avoid an expropriation by corrupt politicians.
In this study, we find that both hypotheses can be explained according to the level of
economic development and the level of corruption, rather than two hypotheses from the
previous studies are opposing. This study extends the research on cash holdings among the
studies on political corruption and financial policies of the firm from a country level to
international level. We identify a nonlinear cubic function relationship between political
corruption and cash holdings that has not been found in previous studies of multinational
countries and find that companies in frontier, emerging, and developed countries respond
differently to political corruption in cash holding policy.
The following parts of this study are as follows. In Part 2, we describe the previous
research and hypothesis. Part 3 describes the data and key variables. Part 4 describes the
research model, and Part 5 describes the results of the empirical analysis derived from these
research models. Part 6 presents conclusions and implications of this study.
2. Literature Review and Hypothesis Development
2.1. Previous studies on institutions, culture and the financial policies of firms.
Previous studies have shown that national culture affects the formation of corporate
governance and that corporate governance changes can affect corporate financial policies.
According to LLSV (1998), shareholder rights protection is estimated to be influenced by
cultural factors of the country. After the suggestion of LLSV(1998), other studies empirically
find that cultural factors significantly affect the formation of corporate governance, especially
shareholder rights protection (Dittmar et al. 2003; Pinkowitz et al. 2006; Kalcheva and Lins
2007; Li and Harrison, 2008). 6
In particular, Doidge, Karolyi, and Stulz (2007) show that while corporate
governance variables are accounted for only 3% of firms' characteristics variables, 70% are
accounted for by country dummy variables. In addition, Griffin et al. (2017) find that 90% of
the country fixed effect in a firm-level corporate governance regression is explained by
cultural factors such as the uncertainty avoidance and individualism. Meanwhile, recent
studies have attempted to clarify the ways in which corporate financial policies are changed
beyond the effects of cultural variables on corporate governance.
Recently, previous studies focus on finding the link that explains the effect of culture
and institutions on financial policy. Karolyi (2016) noted that both culture and institutions
play a role in guiding financial decisions. Chen, Dou, Rhee, and Veeraraghavan (2015)
identify the cultural influence on financial policy of the firms as ‘cultural motive’ and find
that cultural factors have a statistically significant influence on financial policy.
However, the role of institutions on financial policy is not clearly stated on the
previous finance literature even if institutions are primary determinant of economic
performance and financial policy of the firms. In the study of Karolyi (2016), institutions
mean a social, economic, legal, and political organization of a society, and made up of
components that are aspects of individuals and societies. Therefore, finding the link between
role of institutions and financial policy of the firms is a challenge in Finance.
Some cultural factors have been established by Hofstede, but the definition and
measure of institutional factors are not clearly identified. Therefore, we mainly focus on the
‘political institutions’ to find the link between institutions and financial policy by adopting
political corruption as the measure of political institutions of each country, and we identify
institutional influence on financial policy of the firms as ‘institutional motive’ (or ‘motive by
institutions’).
From the variables determined by financial policies of firms, we mainly focus on the
cash holding policies. Cash is the most unrestricted asset that can be used autonomously by
financial policies (Pinkowitz et al. 2006). Therefore, cash is an asset that is greatly influenced
by the agency problem (Jensen, 1986), and in the previous study, there was a significant
correlation between cash and corporate governance (Pinkowitz et al., 2006; Dittmar et al.,
2007). From this reason, cash is suitable for studying how cultural factors or institutional
factors determine corporate governance and how corporate governance affects financial
7
policies.
Based on this logic, previous studies have carried out until recently that the cultural
factors at the national level affect the cash holdings of firms. Ramirez, A. & Tadesse, S.
(2009) find that risk aversion among Hofstede's cultural variables has an effect on firm's cash
holdings. In addition, Chen, Dou, and Rhee (2015) find that Hofstede's 'individualism' and
'risk aversion' have an impact on firm cash holdings. According to Chang, & Noorbakhsh
(2009), even after controlling the effect of corporate governance and financial market
development, 'risk aversion', 'masculinity' and 'long-term orientation' have an impact on firm
cash holdings. Fernandes and Gonenc (2016) also find that the higher the cultural diversity,
the lower the cash holdings. According to Dudley, and Zhang (2016), the higher the level of
social trust, the more cash holdings the firm has. Those studies mainly focus on the relation
between cultural factors and cash holdings. However, the link between factors by institutions
and cash holdings is not much examined, so we contribute the literature on influence of
institutions and cash holdings policy.
2.2. Previous studies on corruption and financial policies
Meanwhile, there have been some studies that political corruption, which is mainly
dealt with in this study, affects corporate financial policies. However, the results of the study
on the effect of political corruption on corporate cash retention policies were not intensively
investigated. In politics and economics, there have been many empirical studies that political
corruption has influenced macroeconomic growth, market structure, and corporate decision
making. Bliss and Di Tella (1997) and Ades and Di Tella (1999) find that corruption affects
the national market structure. In addition, Shleifer and Vishny (1994) and Hellman et al.
(2003) demonstrate that the political environment has a significant influence on the corporate
operating activities. Mauro (1995) and Mo (2001) studied corruption and economic growth,
and Friedman et al. (2000), Johnson et al. (2000), Choi and Thum (2005) investigated
corruption and the size of underground economy in the country. As such, political corruption
has a large macroeconomic impact and has a significant impact on the corporate operating
activities.
Because political corruption has gained attention in politics and economics, many
studies are continuing to find a macro-micro link between political and economic variables in
8
macro view and corporate activities in micro view. Therefore, this study examines the effect
of 'political corruption level,' on 'cash holding policy' of corporate financial policy. According
to Myers and Rajan (1998), cash, bearer bonds, and commodities are easier to be the target of
expropriation than fixed assets because those assets are guaranteed anonymity, do not have
specific owners, and are easy to transport. In particular, cash can be the easiest target for a
politician to expropriate, and on the contrary, it is the most advantageous asset to be used to
take advantage of political corruption on the view of the firms. Therefore, cash can be
directly affected by the impact of political corruption on corporate financial policies
compared to other assets.
From the previous literature, there exist two controversial hypotheses on the
corruption in Economics and politics. Aidt (2009) separate the scholarly articles into two
groups. Shleifer and Vishny (1993) and Blackburn et al. (2006) view corruption as an
obstacle to development, but Jeff (1964) and Huntington (1968) argue that the corruption
foster economic development and growth in some cases. Similar with the effect of corruption
on the economic development, we expect that the effect of corruption on financial policy can
be different. Therefore, we suggest two controversial hypotheses about the effect of political
corruption on corporate cash holdings policies. ‘Expropriation shielding hypothesis’ suggests
that firms reduce their cash holdings to prevent expropriation of corrupt politicians, and from
this hypothesis, it is expected to have a negative correlation between political corruption and
cash holding policies. The contradictory "preoccupancy hypothesis" is that firms are actively
using political corruption to facilitate government projects and loans, so firms tend to have
more cash because cash is the fastest and least monitored asset for lobbying. From
preoccupancy hypothesis, we expect that there is a negative relationship between political
corruption and cash holdings.
2.3. Previous studies on Expropriation Shielding Hypothesis
First, in the previous studies, theoretical studies and empirical studies have been
conducted in support of the expropriation shielding hypothesis that corporations tend to
protect their assets by changing financial policies in order to prevent threats from political
corruption. In theoretical research, research has been conducted on how companies behave
when politically corrupt politicians exist outside. Shleifer and Vishny (1993) pointed out that
9
corruption acts as a kind of informal tax, causing inefficiencies and lowering firms'
performance. Stulz (2005) presented a model with three participants: politicians, corporate
insiders such as managers, and external minor shareholders. In this model, a corporate insider
may choose a project with a negative NPV to prevent expropriation if the cost of takeover by
corrupt politicians is large. In addition, Bai, Jayachandran, Malesky, and Olken (2014)
developed a model when a politician want bribes from a firm and how a firm choose which of
two options that the firm would pay for bribes or transfer headquarters to another region.
Firms have taken into account the cost of bribery and the cost of moving the headquarters,
and they select an option with lower cost. Therefore, political corruption acts as a cost to a
firm.
In the empirical study, there were not many studies that examine direct relationship
between the financial policies of the political corruption. Some similar studies has been
conducted in which firms actively change financial policies for rent-seeking when there is a
power game between specific entities such as labor unions and firms. According to Klasa,
Maxwell, and Ortiz-Molina (2009), firms tend to reduce cash holdings if they are in industry
where the power of labor union is strong. In addition, Matsa (2010) find that as unions
become more influential, firms strategically raise more debt, increase cash flow volatility and
net income volatility, and increase the risk of bankruptcy. This result is based on the theory of
Bronars and Deere (1991) and Perotti and Spier (1993), and in this theory, firm strategically
take favorable position by showing an unstable state when a company is in a power game.
Therefore, we expect that fleeing assets to avoid union demands is likely to be similar in
situations where corrupt politicians demand bribery. In this study, we predict that firms will
reduce cash and increase leverage by actively utilizing financial policies to maximize firm
value and reduce bribery in power games with corrupt politicians.
Some empirical studies that examine more direct relationships between political
corruption and cash holding policies have been conducted using data from the United States.
Smith, J. D. (2016) find that firms with headquarters in corrupt state reduce cash holdings and
boost leverage to avoid expropriation. In addition, according to Liu (2016), CEOs from
corrupt cultures are more likely to engage in earnings management, accounting fraud, and
opportunistic internal transactions.
Based on these empirical studies and theoretical studies, we conduct empirical
10
analysis to verify the expropriation shielding hypothesis by adding two more assumptions.
The first assumption is that politicians will demand more bribes as the firm's ability to pay.
This assumption is a common sense, but it is supported by empirical results that "companies
that can pay more, should pay more" in the Svensson (2003) Uganda survey. The second
assumption is that there is an optimal level of cash ratios for firms to operate and the threats
by corrupt politicians may deviate from optimal levels of cash holdings. The second
assumption is theoretically supported by the model of Miller and Orr (1966) that firms have
optimal levels of cash holdings, and empirically supported by the studies of Opler et al.
(1999), Dittmar et al. (2003), and Kalcheva and Lins (2007).
2.4. Previous studies on Preoccupancy Hypothesis
In the presence of political corruption, firms can take advantage of lobbying and
bribery to affect direction of the policy to favorable conditions, and firms can preoccupy
government project selections and loans by government. In theoretical research, Leff (1964)
find that corrupt CEOs avoid tax better and lead cash transfers (e.g. subsidies) from the
government to individual firms. In addition, Huntington (1968) find that corrupt CEOs
receive more business projects from the government and improve firm performance by
appropriately removing the disturbing factors by giving politicians bribes. They also
preoccupy strategically advantageous positions over other firms because they are skilled in
using the loopholes of law and bad laws. Therefore, in case of severe political corruption,
firms may be more advantageous to exclude competitors in the competitive market if they
actively use the cozy relation between politics and business.
Meanwhile, in empirical studies, political corruption can lead to better firm
performance when firms actively use the political corruption through bribes and lobbying in
the emerging countries. According to Debacker, Heim, and Tran (2015), US companies with
owners from corrupt countries are more skillful in avoiding taxes, and it increase firm
performance. Mironov (2015) also find that the corrupt CEOs in Russia can increase the
company's sales growth even more. Even if the politically corrupt environment raises
additional costs and threats to expropriation by politicians, paying bribes in the face of
corruption can be optimal for operating performance from an individual company's
perspective. For example, in competition for government-sponsored projects, firms can
11
quickly give bribe and benefit from it, and they can get a good loan from the government.
(Fisman, 2001; Faccio et al., 2006; Claessens et al., 2008; Goldman et al., 2009; Duchin and
Sosyura, 2012; Tahoun, 2014)
2.5. Hypothesis Development
The previous studies show that there is a confrontation between expropriation
shielding hypothesis and preoccupancy hypothesis about the relations between political
corruption and corporate cash holdings policy. In the empirical studies, the results of
supporting the expropriation shielding hypothesis are mostly found in developed countries,
and the results supporting the preoccupancy hypothesis are found in emerging countries. If
the level of economic and political development of the country is low, then there will be a
large number of firms seeking to take an advantage in political corruption. However, after the
economic and political development of the country has been fully achieved, the negative
impact of political corruption such as expropriation by corrupt politicians may become even
greater. Therefore, in this study, we assume that political corruption will affect the corporate
cash holdings policy according to the level of economic and political development of the
country, and we establish hypothesis for empirical analysis as follows.
Hypothesis-1a. In countries with high levels of corruption, firms are likely to have less cash because of the risk of expropriation by corrupt politicians. (Expropriation Shielding hypothesis) Hypothesis 1b. In countries with high levels of corruption, firms are likely to have more cash because it is important to take advantage of opportunities quickly by corrupt politicians through lobbying. (Preoccupancy hypothesis) Hypothesis 1c. According to the level of economic development, the Expropriation Shielding hypothesis and the Preoccupancy hypothesis will be compatible. Hypothesis 2a. In countries with high level of corruption, corporate operating performance will be worsened by high cost of the threats by corrupt politicians. Hypothesis 2b. In countries with high level of corruption, corporate operating performance will be improved by preoccupancy of opportunities by bribe and lobbying. 3. Data and Variable descriptions
12
3.1. Financial variable data
The corporate financial data used in this study is collected from Compustat Capital
IQ provided by Whaton Research Data Services and the data of Compustat North America
and Compustat Global are merged to collect worldwide data. Firms in the financial industry
and banking industry are excluded because those samples are not suitable for this study.
Unlike firms in other industries, financial institutions and banks have restrictions on cash
holdings, so the motive of holding cash is different. Therefore, in this study, data on
individual firms in 97 countries are collected from 1995 to 2015, and the number of firm year
observations is 688,789.
From the collected sample, we excluded missing values in financial variables. We
also confirmed that some outliers exist in our sample because our data is international, and
we excluded the upper 1% and lower 1% of the financial variables to prevent these values
from causing bias in the results. In addition, for some firms with missing value in research
and development expenses, we assumed that those firms have a value of 0 in research and
development expenses1. From this process, we obtained 600,961 firm year observations.
Meanwhile, in some countries, stock price data is inaccurate and is not able to be collected
for market capitalization variables. The number of firm year observations in our sample that
can obtain stock price and market cap is 253,072, and this sample is mainly used in our
empirical analysis by adding the market capitalization variable to the normal cash regression
to examine the effect of political corruption on the cash holdings of firms2. Table 1 shows the
number of firm year observations by country, industry, and year.
[Insert Table 1: Sample Distribution]
3.2. Proxy of Political corruption.
1 In the study of Dittmar et al. (2007), it was treated as 0 if the R & D cost could not be obtained. The sample size decreased when we treat R & D cost was not zero and discard those data, but the main analysis of this study show no significant difference.
2 The results of the empirical analysis with 253,072 samples after inserting the market capitalization variables and the results of using 600,961 samples excluding the market capitalization variables are not significantly different.
13
The Corruption Index of the International Transparency Organization is used as
proxy for the level of political corruption at the national level. The index is provided from
1995 to 2015. In the case of the cultural variables used in the previous studies, the reliability
of the data has been pointed out because the survey is not continuous and has only one survey
(Karolyi, 2016). However, since the corruption index of the International Transparency
Organization is annually published, and it is continuous data. Moreover, it is an index derived
by integrating the results of five rational surveys, so it can overcome the vulnerability of
existing cultural variables. Therefore, we think that corruption index is suitable to measure
the difference of political insitutions of each country and to examine the ‘institutional motive’
of corporate cash holdings. As the corruption index is higher, it means that there is less
political corruption. For convenience on interpretations in this study, we made an adjustment
by subtracting the maximum value of 10 for the convenience of explanation, so that the
higher the index, the higher the level of political corruption.
3.3. National level variables
Meanwhile, the macroeconomic factors such as the legal system, the level of
economic development, and the opportunity cost of the bond market, which affect the
corporate governance of the country, may change the corporate cash holding policy.
Therefore, in this study, macro variables were collected and used as control variables. First,
the legal origin of the country is used as a proxy of corporate governance, and the three
dummy variables of the English, the Continental, and Nordic laws are added as control
variables. According to a previous study of LLSV (1999) on the legal system and corporate
governance, the protection of shareholder rights is more important in the case of the Anglo-
American law than other legal systems. Therefore, we expected that there would be a
difference between the countries that follow Anglo-American law and those that do not.
In addition, since the level of economic development of the country is closely related
to political corruption, we added the per capita GDP variable to control it. As the stock
market is active, it is easier for companies to raise funds through the stock market, so we
have added stock trading volume to GDP to control these effects. In addition, the real interest
rate variable of the Treasury bond by country is used as the control variable because the
opportunity cost of holding more cash increases as the real interest rate of the bond market
14
increases. Macroeconomic variables were collected through the World bank database and the
OECD Factbook.
Table 2 shows the statistics of the variables used in the regression model of this study.
Table 3 shows the correlation coefficient between each variable.
[Insert Table 2: Descriptive Statistics]
[Insert Table 3: Pearson’s Correlation Coefficient] 4. Research Model 4.1. Normal cash regression
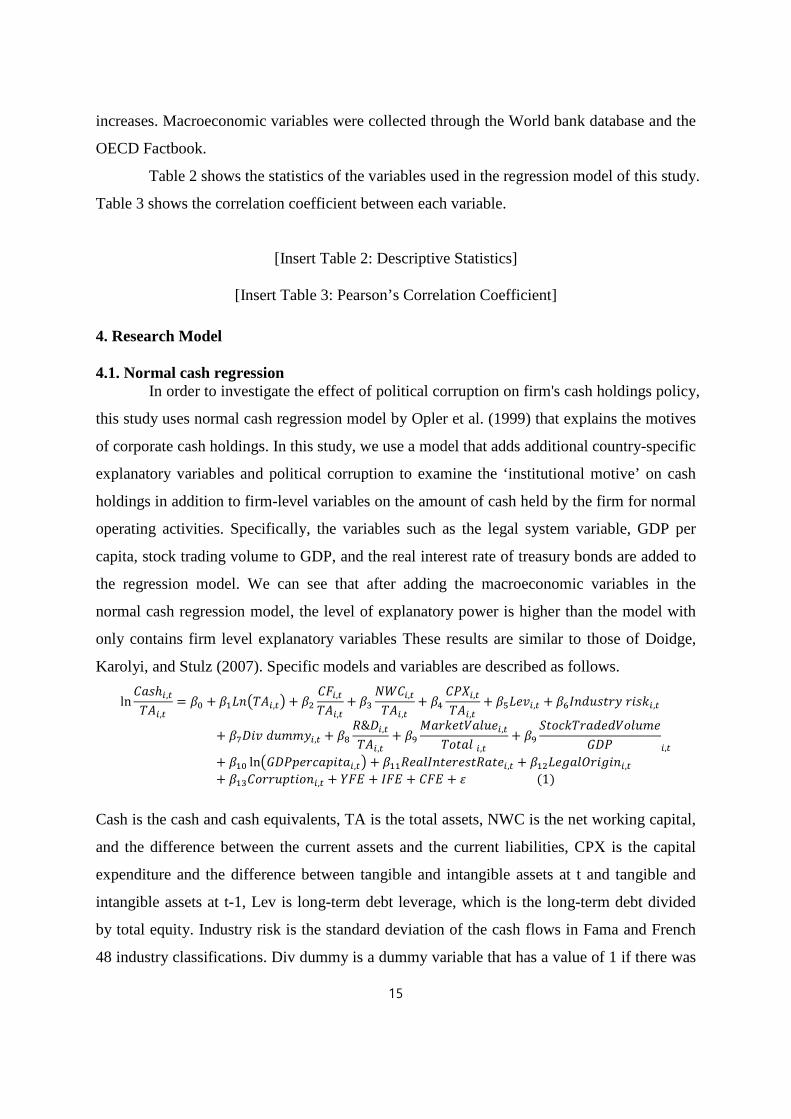
In order to investigate the effect of political corruption on firm's cash holdings policy,
this study uses normal cash regression model by Opler et al. (1999) that explains the motives
of corporate cash holdings. In this study, we use a model that adds additional country-specific
explanatory variables and political corruption to examine the ‘institutional motive’ on cash
holdings in addition to firm-level variables on the amount of cash held by the firm for normal
operating activities. Specifically, the variables such as the legal system variable, GDP per
capita, stock trading volume to GDP, and the real interest rate of treasury bonds are added to
the regression model. We can see that after adding the macroeconomic variables in the
normal cash regression model, the level of explanatory power is higher than the model with
only contains firm level explanatory variables These results are similar to those of Doidge,
Karolyi, and Stulz (2007). Specific models and variables are described as follows.
ln𝐶𝐶𝐶𝐶𝐶𝐶ℎ𝑖𝑖 ,𝑡𝑡𝑇𝑇𝑇𝑇𝑖𝑖,𝑡𝑡
= 𝛽𝛽0 + 𝛽𝛽1𝐿𝐿𝐿𝐿�𝑇𝑇𝑇𝑇𝑖𝑖,𝑡𝑡� + 𝛽𝛽2𝐶𝐶𝐶𝐶𝑖𝑖,𝑡𝑡𝑇𝑇𝑇𝑇𝑖𝑖,𝑡𝑡
+ 𝛽𝛽3𝑁𝑁𝑁𝑁𝐶𝐶𝑖𝑖,𝑡𝑡𝑇𝑇𝑇𝑇𝑖𝑖,𝑡𝑡
+ 𝛽𝛽4𝐶𝐶𝐶𝐶𝐶𝐶𝑖𝑖,𝑡𝑡𝑇𝑇𝑇𝑇𝑖𝑖,𝑡𝑡
+ 𝛽𝛽5𝐿𝐿𝐿𝐿𝐿𝐿𝑖𝑖,𝑡𝑡 + 𝛽𝛽6𝐼𝐼𝐿𝐿𝐼𝐼𝐼𝐼𝐶𝐶𝐼𝐼𝐼𝐼𝐼𝐼 𝐼𝐼𝑟𝑟𝐶𝐶𝑟𝑟𝑖𝑖 ,𝑡𝑡
+ 𝛽𝛽7𝐷𝐷𝑟𝑟𝐿𝐿 𝐼𝐼𝐼𝐼𝑑𝑑𝑑𝑑𝐼𝐼𝑖𝑖,𝑡𝑡 + 𝛽𝛽8𝑅𝑅&𝐷𝐷𝑖𝑖,𝑡𝑡𝑇𝑇𝑇𝑇𝑖𝑖,𝑡𝑡
+ 𝛽𝛽9𝑀𝑀𝐶𝐶𝐼𝐼𝑟𝑟𝐿𝐿𝐼𝐼𝑀𝑀𝐶𝐶𝑀𝑀𝐼𝐼𝐿𝐿𝑖𝑖,𝑡𝑡
𝑇𝑇𝑇𝑇𝐼𝐼𝐶𝐶𝑀𝑀 𝑖𝑖,𝑡𝑡+ 𝛽𝛽9
𝑆𝑆𝐼𝐼𝑇𝑇𝑆𝑆𝑟𝑟𝑇𝑇𝐼𝐼𝐶𝐶𝐼𝐼𝐿𝐿𝐼𝐼𝑀𝑀𝑇𝑇𝑀𝑀𝐼𝐼𝑑𝑑𝐿𝐿𝐺𝐺𝐷𝐷𝐶𝐶 𝑖𝑖,𝑡𝑡
+ 𝛽𝛽10 ln�𝐺𝐺𝐷𝐷𝐶𝐶𝐺𝐺𝐿𝐿𝐼𝐼𝑆𝑆𝐶𝐶𝐺𝐺𝑟𝑟𝐼𝐼𝐶𝐶𝑖𝑖,𝑡𝑡� + 𝛽𝛽11𝑅𝑅𝐿𝐿𝐶𝐶𝑀𝑀𝐼𝐼𝐿𝐿𝐼𝐼𝐿𝐿𝐼𝐼𝐿𝐿𝐶𝐶𝐼𝐼𝑅𝑅𝐶𝐶𝐼𝐼𝐿𝐿𝑖𝑖,𝑡𝑡 + 𝛽𝛽12𝐿𝐿𝐿𝐿𝐿𝐿𝐶𝐶𝑀𝑀𝐿𝐿𝐼𝐼𝑟𝑟𝐿𝐿𝑟𝑟𝐿𝐿𝑖𝑖,𝑡𝑡+ 𝛽𝛽13𝐶𝐶𝑇𝑇𝐼𝐼𝐼𝐼𝐼𝐼𝐺𝐺𝐼𝐼𝑟𝑟𝑇𝑇𝐿𝐿𝑖𝑖,𝑡𝑡 + 𝑌𝑌𝐶𝐶𝑌𝑌 + 𝐼𝐼𝐶𝐶𝑌𝑌 + 𝐶𝐶𝐶𝐶𝑌𝑌 + 𝜀𝜀 (1)
Cash is the cash and cash equivalents, TA is the total assets, NWC is the net working capital,
and the difference between the current assets and the current liabilities, CPX is the capital
expenditure and the difference between tangible and intangible assets at t and tangible and
intangible assets at t-1, Lev is long-term debt leverage, which is the long-term debt divided
by total equity. Industry risk is the standard deviation of the cash flows in Fama and French
48 industry classifications. Div dummy is a dummy variable that has a value of 1 if there was
15
a dividend at time t and a value of 0 otherwise. R & D means research and development
expenses. Market value is the market capitalization, StockTradedVolume/GDP is the value of
each country's stock trading volume divided by GDP, and GDP per capita means GDP over
population in country. Real Interest Rate means the real interest rate of treasury bonds. Legal
Origin consists of three dummy variables, and we add English, the Continental, and Nordic
laws variables. Corruption refers to the level of political corruption in the country, and we use
the proxy of corruption described in the preceding part.
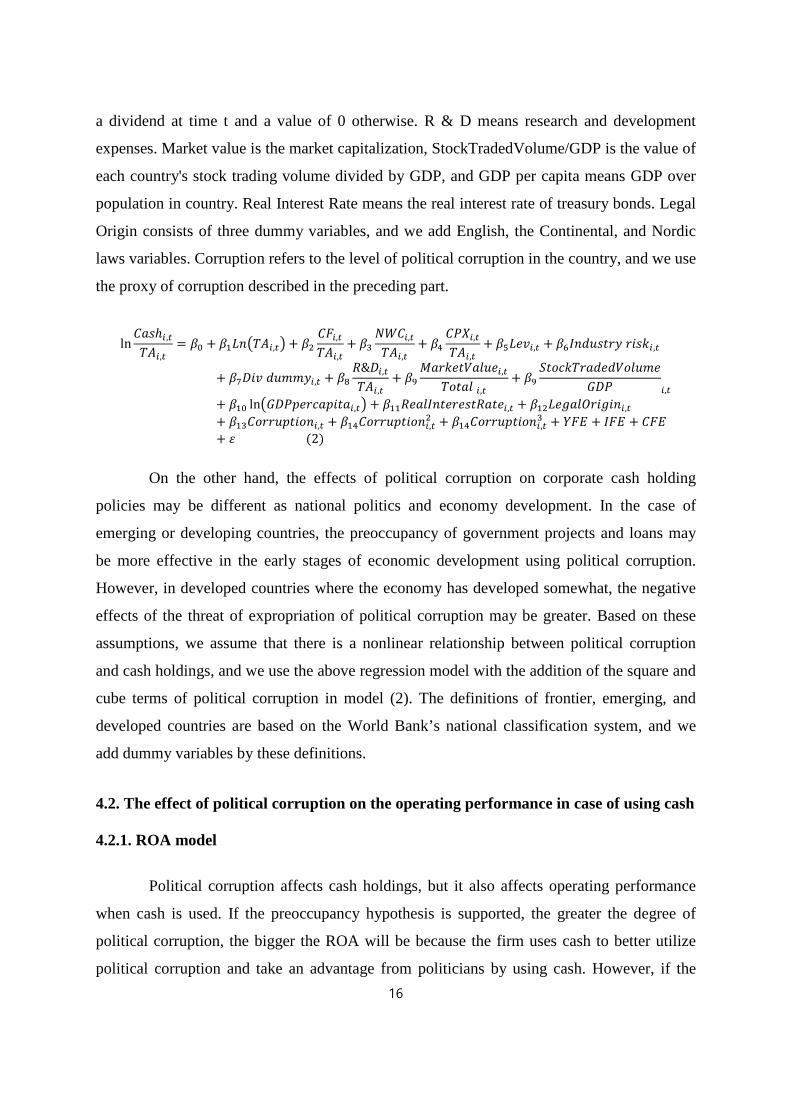
ln𝐶𝐶𝐶𝐶𝐶𝐶ℎ𝑖𝑖 ,𝑡𝑡𝑇𝑇𝑇𝑇𝑖𝑖,𝑡𝑡
= 𝛽𝛽0 + 𝛽𝛽1𝐿𝐿𝐿𝐿�𝑇𝑇𝑇𝑇𝑖𝑖,𝑡𝑡� + 𝛽𝛽2𝐶𝐶𝐶𝐶𝑖𝑖,𝑡𝑡𝑇𝑇𝑇𝑇𝑖𝑖,𝑡𝑡
+ 𝛽𝛽3𝑁𝑁𝑁𝑁𝐶𝐶𝑖𝑖,𝑡𝑡𝑇𝑇𝑇𝑇𝑖𝑖,𝑡𝑡
+ 𝛽𝛽4𝐶𝐶𝐶𝐶𝐶𝐶𝑖𝑖,𝑡𝑡𝑇𝑇𝑇𝑇𝑖𝑖,𝑡𝑡
+ 𝛽𝛽5𝐿𝐿𝐿𝐿𝐿𝐿𝑖𝑖,𝑡𝑡 + 𝛽𝛽6𝐼𝐼𝐿𝐿𝐼𝐼𝐼𝐼𝐶𝐶𝐼𝐼𝐼𝐼𝐼𝐼 𝐼𝐼𝑟𝑟𝐶𝐶𝑟𝑟𝑖𝑖 ,𝑡𝑡
+ 𝛽𝛽7𝐷𝐷𝑟𝑟𝐿𝐿 𝐼𝐼𝐼𝐼𝑑𝑑𝑑𝑑𝐼𝐼𝑖𝑖,𝑡𝑡 + 𝛽𝛽8𝑅𝑅&𝐷𝐷𝑖𝑖,𝑡𝑡𝑇𝑇𝑇𝑇𝑖𝑖,𝑡𝑡
+ 𝛽𝛽9𝑀𝑀𝐶𝐶𝐼𝐼𝑟𝑟𝐿𝐿𝐼𝐼𝑀𝑀𝐶𝐶𝑀𝑀𝐼𝐼𝐿𝐿𝑖𝑖,𝑡𝑡
𝑇𝑇𝑇𝑇𝐼𝐼𝐶𝐶𝑀𝑀 𝑖𝑖,𝑡𝑡+ 𝛽𝛽9
𝑆𝑆𝐼𝐼𝑇𝑇𝑆𝑆𝑟𝑟𝑇𝑇𝐼𝐼𝐶𝐶𝐼𝐼𝐿𝐿𝐼𝐼𝑀𝑀𝑇𝑇𝑀𝑀𝐼𝐼𝑑𝑑𝐿𝐿𝐺𝐺𝐷𝐷𝐶𝐶 𝑖𝑖,𝑡𝑡
+ 𝛽𝛽10 ln�𝐺𝐺𝐷𝐷𝐶𝐶𝐺𝐺𝐿𝐿𝐼𝐼𝑆𝑆𝐶𝐶𝐺𝐺𝑟𝑟𝐼𝐼𝐶𝐶𝑖𝑖,𝑡𝑡� + 𝛽𝛽11𝑅𝑅𝐿𝐿𝐶𝐶𝑀𝑀𝐼𝐼𝐿𝐿𝐼𝐼𝐿𝐿𝐼𝐼𝐿𝐿𝐶𝐶𝐼𝐼𝑅𝑅𝐶𝐶𝐼𝐼𝐿𝐿𝑖𝑖,𝑡𝑡 + 𝛽𝛽12𝐿𝐿𝐿𝐿𝐿𝐿𝐶𝐶𝑀𝑀𝐿𝐿𝐼𝐼𝑟𝑟𝐿𝐿𝑟𝑟𝐿𝐿𝑖𝑖,𝑡𝑡+ 𝛽𝛽13𝐶𝐶𝑇𝑇𝐼𝐼𝐼𝐼𝐼𝐼𝐺𝐺𝐼𝐼𝑟𝑟𝑇𝑇𝐿𝐿𝑖𝑖,𝑡𝑡 + 𝛽𝛽14𝐶𝐶𝑇𝑇𝐼𝐼𝐼𝐼𝐼𝐼𝐺𝐺𝐼𝐼𝑟𝑟𝑇𝑇𝐿𝐿𝑖𝑖,𝑡𝑡2 + 𝛽𝛽14𝐶𝐶𝑇𝑇𝐼𝐼𝐼𝐼𝐼𝐼𝐺𝐺𝐼𝐼𝑟𝑟𝑇𝑇𝐿𝐿𝑖𝑖 ,𝑡𝑡3 + 𝑌𝑌𝐶𝐶𝑌𝑌 + 𝐼𝐼𝐶𝐶𝑌𝑌 + 𝐶𝐶𝐶𝐶𝑌𝑌+ 𝜀𝜀 (2)
On the other hand, the effects of political corruption on corporate cash holding
policies may be different as national politics and economy development. In the case of
emerging or developing countries, the preoccupancy of government projects and loans may
be more effective in the early stages of economic development using political corruption.
However, in developed countries where the economy has developed somewhat, the negative
effects of the threat of expropriation of political corruption may be greater. Based on these
assumptions, we assume that there is a nonlinear relationship between political corruption
and cash holdings, and we use the above regression model with the addition of the square and
cube terms of political corruption in model (2). The definitions of frontier, emerging, and
developed countries are based on the World Bank’s national classification system, and we
add dummy variables by these definitions.
4.2. The effect of political corruption on the operating performance in case of using cash 4.2.1. ROA model
Political corruption affects cash holdings, but it also affects operating performance
when cash is used. If the preoccupancy hypothesis is supported, the greater the degree of
political corruption, the bigger the ROA will be because the firm uses cash to better utilize
political corruption and take an advantage from politicians by using cash. However, if the 16
expropriation shielding hypothesis is supported, the ROA of the next period will be
significantly lower because firms are more likely to choose a project with a negative NPV to
avoid the more severe political corruption. In particular, Mironov(2015) find that corrupt
CEOs perform better and they achieve higher sales growth. Thus, rather than the market's
assessment of cash holdings, it can be important how political corruption affects the use of
cash and operating performance.
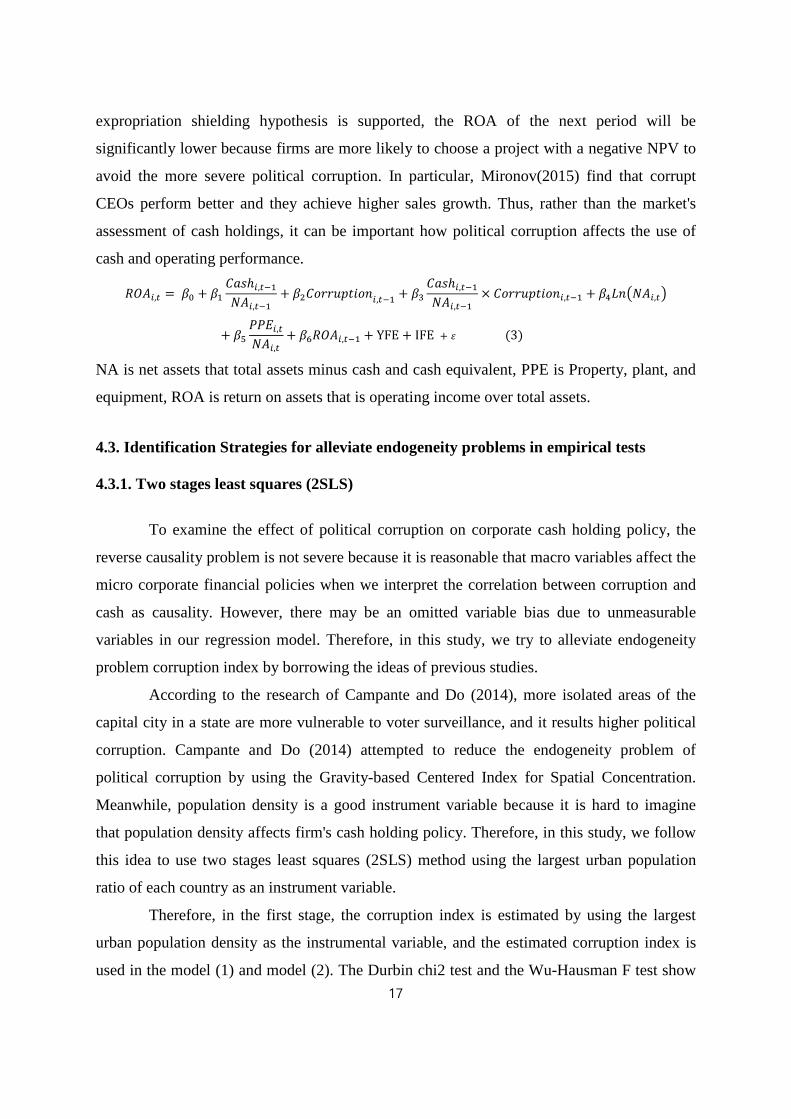
𝑅𝑅𝐿𝐿𝑇𝑇𝑖𝑖,𝑡𝑡 = 𝛽𝛽0 + 𝛽𝛽1𝐶𝐶𝐶𝐶𝐶𝐶ℎ𝑖𝑖,𝑡𝑡−1𝑁𝑁𝑇𝑇𝑖𝑖,𝑡𝑡−1
+ 𝛽𝛽2𝐶𝐶𝑇𝑇𝐼𝐼𝐼𝐼𝐼𝐼𝐺𝐺𝐼𝐼𝑟𝑟𝑇𝑇𝐿𝐿𝑖𝑖,𝑡𝑡−1 + 𝛽𝛽3𝐶𝐶𝐶𝐶𝐶𝐶ℎ𝑖𝑖,𝑡𝑡−1𝑁𝑁𝑇𝑇𝑖𝑖,𝑡𝑡−1
× 𝐶𝐶𝑇𝑇𝐼𝐼𝐼𝐼𝐼𝐼𝐺𝐺𝐼𝐼𝑟𝑟𝑇𝑇𝐿𝐿𝑖𝑖,𝑡𝑡−1 + 𝛽𝛽4𝐿𝐿𝐿𝐿�𝑁𝑁𝑇𝑇𝑖𝑖,𝑡𝑡�
+ 𝛽𝛽5𝐶𝐶𝐶𝐶𝑌𝑌𝑖𝑖,𝑡𝑡𝑁𝑁𝑇𝑇𝑖𝑖,𝑡𝑡
+ 𝛽𝛽6𝑅𝑅𝐿𝐿𝑇𝑇𝑖𝑖,𝑡𝑡−1 + YFE + IFE + 𝜀𝜀 (3)
NA is net assets that total assets minus cash and cash equivalent, PPE is Property, plant, and
equipment, ROA is return on assets that is operating income over total assets.
4.3. Identification Strategies for alleviate endogeneity problems in empirical tests 4.3.1. Two stages least squares (2SLS)
To examine the effect of political corruption on corporate cash holding policy, the
reverse causality problem is not severe because it is reasonable that macro variables affect the
micro corporate financial policies when we interpret the correlation between corruption and
cash as causality. However, there may be an omitted variable bias due to unmeasurable
variables in our regression model. Therefore, in this study, we try to alleviate endogeneity
problem corruption index by borrowing the ideas of previous studies.
According to the research of Campante and Do (2014), more isolated areas of the
capital city in a state are more vulnerable to voter surveillance, and it results higher political
corruption. Campante and Do (2014) attempted to reduce the endogeneity problem of
political corruption by using the Gravity-based Centered Index for Spatial Concentration.
Meanwhile, population density is a good instrument variable because it is hard to imagine
that population density affects firm's cash holding policy. Therefore, in this study, we follow
this idea to use two stages least squares (2SLS) method using the largest urban population
ratio of each country as an instrument variable.
Therefore, in the first stage, the corruption index is estimated by using the largest
urban population density as the instrumental variable, and the estimated corruption index is
used in the model (1) and model (2). The Durbin chi2 test and the Wu-Hausman F test show 17
that the p-value is significant at 1% level, so that the null hypothesis that all variables in the
model are exogenous can be rejected. In other words, in the case of the model used in this
study, it is more appropriate to use the instrument variable because there is an endogeneity
problem of the corruption index.
4.3.2. Propensity Score Matching (PSM)
The sample is collected from many countries, there might exist selection bias. In
order to examine the different treatment effect of political corruption on corporate cash
holdings in emerging and developed countries, we calculate propensity score based on the
firm size (total assets). We separate our sample by propensity score that has value from 0 to 1,
and we matched the most similar observation in same year and same industry. We use 4
dependent variables to examine the non-linear treatment effect of political corruption on
corporate cash holdings. (1) Dummy variable that has value 1 if corruption index is higher
than the median of total sample, otherwise 0. (2) Dummy variable that has value 1 if
corruption index is higher than 25%, but has 0 when corruption index is lower than 75%. (3)
Dummy variable that has value 1 if corruption index is higher than 25% in developed
countries sample, but has 0 when corruption index is lower than 75% in developed countries
sample. (4) Dummy variable that has value 1 if corruption index is higher than 25% in
frontier/emerging countries sample, but has 0 when corruption index is lower than 75% in
frontier/emerging countries sample.
After matching by propensity score, we analyze the difference between treatment
group and control group on the effect of political corruption on corporate cash holdings, and
check the significance level by using t-statistics. By using matching, we can see more robust
result in case of alleviating the endogeneity problems.
5. Empirical Results 5.1. Empirical Results in Normal Cash Regression 5.1.1. Cubic function relationship between political corruption and cash holdings
As a result of previous studies, it can be a plausible explanation in the case of some
developed countries for expropriation shielding hypothesis that the political corruption
18
increases only the threat of expropriation by corrupt politician. However, in an empirical
study of emerging countries, it can be seen that the preoccupancy hypothesis can be a
plausible explanation because there is more advantages of political corruption, and firm may
hold more cash to preoccupy those advantages. Therefore, in this study, we assume that the
effects of political corruption on corporate cash holdings would be different between
developed and frontier/emerging countries. Specifically, we expect that the relation between
political corruption and cash holdings in our sample would take the form of a non-linear
function rather than a simple linear relationship.
The results of Model 1 in Table 4 are the univariate results between the corruption
index and the cash holdings. As a result of adding the square term and the cubic term of the
corruption index, we find that the coefficient of the cubic term is negative, and there is a
cubic function (decrease in first, then increase, and decrease again) relationship existed in our
sample. In Model 2 and 3, we add firm level control variables that explain the motives of
holdings cash by the research of Oppler et al. (1999). Some firm in our sample in this study
did not disclose research and development(R&D) expenses, so we treated as a value of 0 in
this case by following the same method of Dittmar et al. (2007). In Model 2, we exclude
samples that have missing value in R&D expenses, and in Model 3, we treat R&D expenses
as a value of 0 in case of missing value. In both models, we find that the cubic relation
between political corruption and cash holdings are consistent.
Meanwhile, we add the ratio of market value to total assets (MTB) in model 4, and
the number of firm year observations has been reduced from 535,392 to 296,557 due to lack
of stock price disclosure in many countries. MTB is added in other models in our analysis
because it is an important explanatory variable as proxy variable of growth opportunity in
normal cash regression. Even if the number of samples is decreased, the cubic relation
function between the corruption index and the cash holdings are also consistent.
In Model 5, we added country-level variables that were not considered in previous
studies as control variables. By adding country-level variables in our models, and the sample
was reduced to 253,072, and we mainly use this sample in other analysis. Stock traded / GDP
is stock trading volume / GDP. This variable is used as proxy for the degree of development
of the stock market. The coefficient is negative at 1% significance level, and it means that the
more the stock market develops, firm can easily raise fund through the stock market, so firms
19
holds less cash. Ln (GDP per capita) is the natural logarithm of GDP per capita, and indicates
the level of economic development of the country. We find that the coefficient of Ln(GDP
per capita) is positive and significant at 1% level. It means that the level of economic
development in the country becomes higher; firm can generate more cash from its operating
activities, so firms hold more cash. The Real Interest rate is the inflation adjusted interest rate
of treasury bonds and can be viewed as the opportunity cost when a firm hold cash in it. From
our results, the coefficient is negative and significant at 1% level, so firms have less cash
because of high opportunity costs.
From Model 6 to 8, we fixed the year effects, industry effects, and country effects to
see the cubic relation is consistent in case of fixed effect models. In Model 6, we use random
effect model by assuming that there is no correlation between control variables and error term,
and we find that the cubic relation between corruption index and cash holdings is consistent.
Moreover, in Model 7, we fixed year effects and Fama and French 48 industry effects. In
Model 7, we find that the cubic relation between corruption and cash holdings is consistent.
Moreover, we add legal origin dummy variables in Model 7. Same as our expectations, firms
in countries with UK legal origin hold less cash, but firms in other legal origin more cash.
Generally, countries with UK legal follow the shareholder theory that emphasizes the profit
maximization of shareholders, so firms reduce the cash holdings. However, countries with
German legal origin follow the stakeholder theory that emphasizes the wealth maximization
of stakeholders, so firms hold more cash. Therefore, we think that those legal origin variables
can be control variables for the proxy of difference in corporate governance system.
In Model 8, we fixed year effects, Fama and French 48 industry effects, and country
effects. Even though the differences between countries were partially controlled by the
national dummy variables, the effects of political corruption continue to appear in Model 8.
These results show that there are effects of change in corruption within the country as well as
effects between countries.
5.1.2. Difference between frontier/emerging countries and developed countries, and identification of inflection points
To examine the different effect of political corruption on cash holdings between
developed and frontier/emerging countries, we divided the sample into developed and
20
frontier/emerging countries according to the World Bank classification. Table 5 shows that
the coefficients of the cubic term are not significant, only the coefficient of the square term is
significant and positive, so there is a U-shape relation between political corruption and cash
holdings. A sample of developed countries with very low levels of corruption such as Finland
and Canada shows that companies reduce cash holdings to avoid expropriation in the face of
political corruption. However, in countries such as Italy and Spain where are developed
countries but somewhat corrupt, we find that firms have more cash to take an advantage from
political corruption for preoccupancy. Specifically, the inflection point of the corruption
index estimated by the coefficient of model 1 is about 2.94, and the expropriation shielding
hypothesis is supported in the countries with the corruption index of less than 2.94 among
developed countries, and the preoccupancy hypothesis is supported in the countries above
2.94.
On the other hand, in Model 3 and Model 4, we analyze only for frontier and
emerging countries. Again, unlike the whole sample, the coefficient of the cubic term is not
significant and only the coefficient of the square term is significant. However, we find there
is an Inverted-U-shape relation between political corruption and cash holdings unlike the
developed countries. In the sample of frontier/emerging countries such as Korea with
relatively low corruption level (but, with more corruption than developed countries), firms
hold more cash to preoccupy opportunities from corrupt politicians. However, in the sample
of frontier/emerging countries such as Pakistan and Mexico with extremely severe corruption,
we find that firms reduce cash holdings to avoid the risk of expropriation by politicians. The
inflection point estimated by the coefficient of model 3 is about 5.17, and we find that
preoccupancy hypothesis is supported in countries with frontier/emerging countries'
corruption index less than 5.17, and the expropriation shielding hypothesis is supported in
countries above 5.17.
We find two inflection points in the cubic function between corruption index and
cash holdings, but these points are not perfectly correct because of the econometric
limitations of our model. However, these points give us some implications that there are three
intervals in the relation between corruption and cash holdings, and two hypothesizes can be
explained by the level of corruption and economic development. To the convenience of
analysis, we use 2.94 and 5.17 in other analysis.
21
Specifically, in the interval of corruption index below 2.94, developed countries with
considerably low levels of corruption are included. In these countries, there is no motive to
preoccupy loans and projects from corrupt politicians, and only the motive to avoid the risk
of expropriation exists. Therefore, the expropriation shielding hypothesis is supported in
developed countries with corruption index below 2.94.
In the interval with corruption index greater than 2.94 and below 5.17, some
developed countries and emerging countries are included. These countries are more corrupt
than countries in the first interval, and firms in these countries have motives to preoccupy
opportunities actively from corrupt politicians. Therefore, firms hold more cash, and this
result supports the preoccupancy hypothesis.
In the interval with a corruption index of 5.17 or higher, frontier/emerging countries
with extremely high levels of corruption are included. In these countries, the cost of
corruption is so high because of extreme level of expropriation by corrupt politicians.
Therefore, firms hold less cash to avoid the risk of expropriation, and this result supports the
expropriation shielding hypothesis again.
In order to confirm that there are three intervals and what hypothesis is supported in
each interval, we empirically analyze the relation between political corruption and cash
holdings in each interval from the models 5 to 7.
In Model 5, we only analyze the first interval that contains developed countries
sample with corruption index lower than 2.94. The coefficient of corruption index is -0.108 at
1% significance level, so there is a negative association between corruption and cash holdings
that supports the expropriation shielding hypothesis. Model 6 only contains some emerging
countries and developed countries with corruption index greater than 2.94 and below 5.17.
The coefficient of corruption index is 0.0437 at 1% significance level, so it means that there
is a positive association between corruption and cash holdings that supports the preoccupancy
hypothesis. Model 7 contains the last interval, and we analyze only frontier/emerging
countries with corruption index 5.17 or higher. The coefficient is -0.0214 at 1% significance
level, so there is a negative association between corruption and cash holdings. The
expropriation shielding hypothesis is supported in the sample of the last interval again.
5.1.3. Mitigation of endogeneity problem and robustness test
22
In our analysis, we borrow the idea and method of Campante and Do (2014). We use
the urban population density in the largest city from the Worldbank Database as the
instrument variable of corruption index in 2 stages least square (2SLS) model. The more
crowded the population in the city, the more political interest and surveillance of the voters,
so the level of the political corruption is deceased. However, we think that the urban
population density in the largest city may not have an association with corporate cash holding
policies, so we expect this instrument variable is effective to control the endogeneity problem
in our model.
Model 1 in Table 6 is the first stage of 2SLS, and the dependent variable is
corruption index. As expected, there is a significant negative association between the urban
population density in the largest city and corruption index. This result is consistent with the
idea of Campante and Do (2014). In next, we predict the corruption index in the first stage of
Model (1), and we replace the corruption index to estimated corruption index
‘TI_Corruption(Estimated)’ in Model 2. In Model 2 where mitigates the endogeneity problem
from the omitted variable bias by using instrument variable, we find that the cubic relation
between political corruption and cash holdings is consistent.
However, in the results not reported in the table, unlike our expectation, there is a
significant association between the urban population density in the largest city and corporate
cash holdings (coefficient: 0.0032, and significant at 1% level). We find that the Spearman’s
Rho between the error term in the first stage in Model (1) and the error term in the second
stage in Model (2) is 0.0589 at 5% significance level. It means that the correlation between
the instrument variable and the dependent variable in second stage exists, so the omitted
variable bias is not perfectly controlled unlike our expectation.
In spite of this result, it is not conceptually clear that there exists association between
the urban population density in the largest city and corporate cash holdings. Moreover, the
effect of omitted variables on the cash holdings is remarkably low because the coefficient of
Spearman’s Rho is low. Therefore, we partially control the endogeneity problem caused by
omitted variable bias, and the effect of omitted variable bias is not that much.
In Model 3, we add estimated corruption index from the first stage, and we fix the
year effects and industry effects. In Model 4, we also add year effects, industry effects, and
country effects. In both models, we find the consistent results that there exist the cubic
23
function relation between political corruption and cash holdings. Meanwhile, we find that the
coefficient of Spearman’s Rho is not significant in Model 4, so we presume that the omitted
variable bias is controlled by fixing the country effects.
In Table 7, we conduct propensity score matching (PSM) to mitigate the endogeneity
problem. We generate the propensity score by using dummy variables generated by
corruption index as dependent variable through logit regression. We matched samples in
treatment groups and samples in control groups by the size of firm (Ln(total assets)). Panel A
show the results of logit regression by each dummy variables, and the coefficient of Ln(total
assets). We predict propensity score from the logit regression result, and matched samples in
0.01 level.
In the first result of Panel B, we make a dummy variable that has value 1 if the
corruption index is higher than median, and 0 if the corruption index is lower than median.
The difference is 0.0929 and significant at 1% level. It means that treatment group holds
more cash than control group in the whole sample. In the previous empirical analysis, there
exists the cubic relation between corruption index and cash holdings, so this results supports
that samples (mostly, developed countries) with relatively high level of corruption hold more
cash holdings than the samples (frontier/emerging countries) with low level of corruption.
In the second result, we make a dummy variable that has value 1 if the corruption
index is higher than 25%, and 0 if the corruption index is lower than 75%. We find that there
is no significant difference between the treatment group and control group after matching.
This result shows that expropriation shielding hypothesis is supported in both top 25%
sample and bottom 25% sample of corruption index, so there is no difference between the
two samples.
Meanwhile, in the third result, we made a dummy variable only in
frontier/emerging countries. The dummy variable has value 1 if the corruption index is higher
than 25%, and 0 if the corruption index is lower than 75% in frontier/emerging countries
sample. We find that the difference between treatment group and control group is significant
at 1% level, it means treatment group hold less than control group after matching. In
frontier/emerging countries, firms hold less cash in case of extremely severe corruption even
if we control the endogeneity problem by matching. Therefore, this result support that there
exists inverted-U-shape relation between political corruption and cash holdings in
24
frontier/emerging countries.
In the last and forth result, we made a dummy variable only in developed countries.
The dummy variable has value 1 if the corruption index is higher than 25%, and 0 if the
corruption index is lower than 75% in developed countries sample. There is a empirically
significant difference at 1% level between treatment group and control group, and we find
that treatment group holds more cash than control group. This result means that firms with
relative higher level of corruption in developed countries hold more cash, so there exists U-
shape relation between political corruption and cash holdings in developed countries.
After mitigating the endogeneity problems by using 2SLS and PSM, we consistently
find that there exists the cubic function relation between political corruption and cash
holdings (Decrease in first, increase, and then decrease again) in the whole sample.
5.1.4. The effect of political corruption on operating performance in using cash
In Table 8, we examine the effect of political corruption on operating performance at
t period in using cash holdings at t-1 period. From the expropriation shielding hypothesis,
political corruption has a negative effect on the operating performance, so it is beneficial for
firms to reduce cash holdings to reduce the effect of political corruption. In contrast, from the
preoccupancy hypothesis, political corruption has a positive effect on the operating
performance, so firm hold more cash to take an advantage from politicians.
Specifically, we divide our sample to three intervals by using the two inflection
points from the previous result in Table 5. First interval contains samples with corruption
index lower than 2.94, second interval contains samples with corruption index from 2.94 to
5.17, and third interval contains samples with corruption index more than 5.17. We examine
the operating performance at t period in using cash holdings at t-1 period in each interval, and
we measure the operating performance by operating income over total assets (ROA).
In Model 1 and Model 2, we use the developed countries samples with corruption
index lower than 2.94. We find that the coefficient of corruption index is not statistically
significant, so there is no association between political corruption and operating performance
in developed countries with low level of corruption. In addition, we find that the coefficient
of interaction term between corruption index and cash holdings at time t-1 is 0.0116 at 1%
significance level. This means that firms can increase the operating performance by reducing
25
cash holdings to avoid expropriation when there exists the political corruption in this sample.
This result supports the expropriation shielding hypothesis.
Model 3 and Model 4 contains developed countries samples with corruption index
from 2.94 to 5.17. The coefficient of corruption index is -0.00226 at 10% significance level,
and it means that corruption has a negative effect on the operating performance in the sample
of developed countries with moderate level of corruption. Additionally, we find that the
coefficient of interaction term between corruption index and cash holdings at time t-1 is
0.0174 at 1% significance level. Therefore, it is beneficial in operating performance for firms
to increase cash holdings in these developed countries with moderate level of corruption. This
result means that corruption itself is not positive for the operating performance, but there
exists advantages of preoccupancy of opportunities from politicians. This result supports the
preoccupancy hypothesis.
Model 5 and Model 6 contains frontier/emerging countries samples with corruption
index from 2.94 to 5.17. The coefficient of corruption index is 0.00246 at 1% significance
level, so there is a positive association between political corruption and operating
performance unlike the result of developed countries in Model 3 and 4. The coefficient of
interaction term between political corruption and cash holdings at time t-1 is 0.00301 at 1%
significance level. This result means that holding more cash is beneficial to operating
performance in frontier/emerging countries with moderate level of corruption. Therefore, in
this sample, we find that political corruption itself has positive association with operating
performance, and holding more cash is also beneficial to firm by enhancing the preoccupancy
of opportunities. This result supports the preoccupancy hypothesis strongly.
In Model 7 and Model 8, we examine the frontier/emerging countries with corruption
index more than 5.17, that is severe level of political corruption. The coefficient of political
corruption is not statistically significant, so there is no significant effect of political
corruption on operating performance unlike our expectation. The coefficient of interaction
term between political corruption and cash holdings at time t-1 is 0.0103 at 1% significance
level. Therefore, holding more cash is beneficial for firms to increase operating performance
in frontier/emerging countries with extreme level of corruption, but from the previous
analysis, firms in this interval reduce cash holdings to avoid risk of expropriation by corrupt
politicians. In the view of firms, we think that firms want to avoid the expropriation even
26
though it suffered a decline in operating performance.
6. Conclusion
Institutional factors have a significant impact on the firm's financial policies and
operations, and are necessary to account for explaining firm behavior and performance that
are not explained by firm-level variables. This study investigated political corruption, which
has a more direct impact among institutional factors, especially corporate financial policies
and operating activities. Specifically, we empirically examines the two confront hypothesis.
First hypothesis is expropriation shielding hypothesis, which is proposed by Stulz (2005) and
several empirical studies. This hypothesis suggests that firms reduce their cash holdings to
prevent the risk of expropriation from political corruption. Second hypothesis is
preoccupancy hypothesis, which is proposed by Huntington(1968). This hypothesis suggest
that firm hold more cash to have an advantages by preoccupancy of government projects and
loans easily by corrupt politician.
This paper expands the empirically studies that examine the effect political
corruption on corporate cash holdings from a country level analysis to international study,
and we suggest a new motive of cash holdings as ‘institutional motive’ by adopting
corruption that is significantly influenced by institutions. Moreover, we find a cubic function
relation between political corruption and corporate cash holdings that is not found in previous
studies. Specifically, we find that there exists U-shape in developed countries and inverted-U-
shape in frontier/emerging countries even if we partially control the endogeneity problems.
This suggests that the two hypotheses that were confronted in previous researches
are not actually confronted but can be explained by both the level of economic development
and the level of corruption in the country. This study use multinational data from 97 countries
and find that the two hypotheses of the previous studies are supported differently by the level
of economic development and level of corruption that is caused by different institutions. In
this way, our study contributes to the literature on institutional factors and corporate financial
policies.
There are some limitations of this paper from these reasons. The corruption index
used as proxy of political corruption is based on the survey data even if the index is
27

continuously collected and integrated 5 surveys to reduce perception bias. Although we
partially control the endogeneity problem through 2SLS by using instrument variable, we are
not able to control the endogeneity problem perfectly because of the limitation of our model.
Moreover, our sample data is an unbalanced panel because firm level data such as stock price
is not perfectly announced, so the sample of our analysis is decreased from 600,961 to
253,072 when we exclude observations with missing values.
28
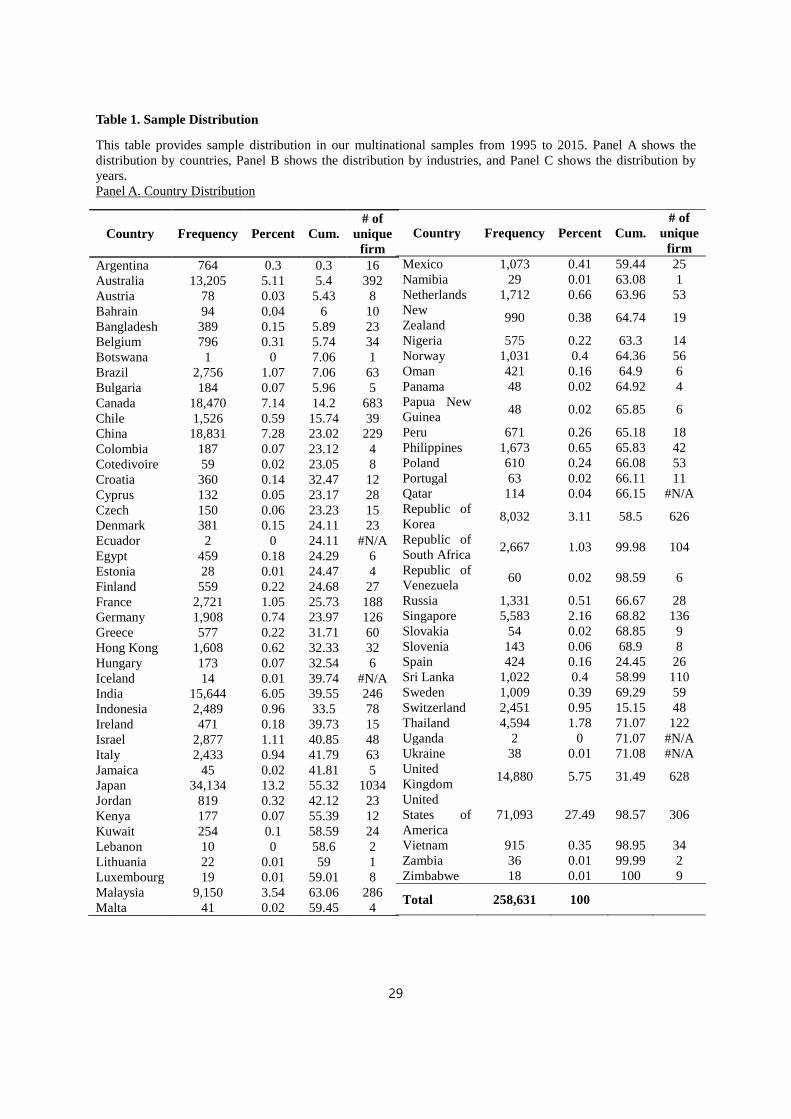
Table 1. Sample Distribution
This table provides sample distribution in our multinational samples from 1995 to 2015. Panel A shows the distribution by countries, Panel B shows the distribution by industries, and Panel C shows the distribution by years. Panel A. Country Distribution
Country Frequency Percent Cum. # of
unique firm
Argentina 764 0.3 0.3 16 Australia 13,205 5.11 5.4 392 Austria 78 0.03 5.43 8 Bahrain 94 0.04 6 10 Bangladesh 389 0.15 5.89 23 Belgium 796 0.31 5.74 34 Botswana 1 0 7.06 1 Brazil 2,756 1.07 7.06 63 Bulgaria 184 0.07 5.96 5 Canada 18,470 7.14 14.2 683 Chile 1,526 0.59 15.74 39 China 18,831 7.28 23.02 229 Colombia 187 0.07 23.12 4 Cotedivoire 59 0.02 23.05 8 Croatia 360 0.14 32.47 12 Cyprus 132 0.05 23.17 28 Czech 150 0.06 23.23 15 Denmark 381 0.15 24.11 23 Ecuador 2 0 24.11 #N/A Egypt 459 0.18 24.29 6 Estonia 28 0.01 24.47 4 Finland 559 0.22 24.68 27 France 2,721 1.05 25.73 188 Germany 1,908 0.74 23.97 126 Greece 577 0.22 31.71 60 Hong Kong 1,608 0.62 32.33 32 Hungary 173 0.07 32.54 6 Iceland 14 0.01 39.74 #N/A India 15,644 6.05 39.55 246 Indonesia 2,489 0.96 33.5 78 Ireland 471 0.18 39.73 15 Israel 2,877 1.11 40.85 48 Italy 2,433 0.94 41.79 63 Jamaica 45 0.02 41.81 5 Japan 34,134 13.2 55.32 1034 Jordan 819 0.32 42.12 23 Kenya 177 0.07 55.39 12 Kuwait 254 0.1 58.59 24 Lebanon 10 0 58.6 2 Lithuania 22 0.01 59 1 Luxembourg 19 0.01 59.01 8 Malaysia 9,150 3.54 63.06 286 Malta 41 0.02 59.45 4
Country Frequency Percent Cum. # of
unique firm
Mexico 1,073 0.41 59.44 25 Namibia 29 0.01 63.08 1 Netherlands 1,712 0.66 63.96 53 New Zealand 990 0.38 64.74 19
Nigeria 575 0.22 63.3 14 Norway 1,031 0.4 64.36 56 Oman 421 0.16 64.9 6 Panama 48 0.02 64.92 4 Papua New Guinea 48 0.02 65.85 6
Peru 671 0.26 65.18 18 Philippines 1,673 0.65 65.83 42 Poland 610 0.24 66.08 53 Portugal 63 0.02 66.11 11 Qatar 114 0.04 66.15 #N/A Republic of Korea 8,032 3.11 58.5 626
Republic of South Africa 2,667 1.03 99.98 104
Republic of Venezuela 60 0.02 98.59 6
Russia 1,331 0.51 66.67 28 Singapore 5,583 2.16 68.82 136 Slovakia 54 0.02 68.85 9 Slovenia 143 0.06 68.9 8 Spain 424 0.16 24.45 26 Sri Lanka 1,022 0.4 58.99 110 Sweden 1,009 0.39 69.29 59 Switzerland 2,451 0.95 15.15 48 Thailand 4,594 1.78 71.07 122 Uganda 2 0 71.07 #N/A Ukraine 38 0.01 71.08 #N/A United Kingdom 14,880 5.75 31.49 628
United States of America
71,093 27.49 98.57 306
Vietnam 915 0.35 98.95 34 Zambia 36 0.01 99.99 2 Zimbabwe 18 0.01 100 9
Total 258,631 100
29

Panel B. Industry Distribution
Industry Freq. Percent Cum. # of
unique firm
Agriculture 1,609 0.62 0.62 36 Aircraft 852 0.33 0.95 13 Alcoholic Beverages 2,015 0.78 1.73 62
Apparel 4,496 1.74 3.47 129 Automobiles and Trucks 5,550 2.15 5.61 146
Banking 450 0.17 5.79 4 Business Services
26,682 10.32 16.11 641
Business Supplies 2,742 1.06 17.17 84
Candy and Soda 721 0.28 17.44 16
Chemicals 9,730 3.76 21.21 256 Coal 1,113 0.43 21.64 25 Computers 7,752 3 24.63 173 Construction 7,391 2.86 27.49 236
Construction Materials 9,921 3.84 31.33 292
Consumer Goods 5,453 2.11 33.44 153
Defense 246 0.1 33.53 #N/A Electronical Equipment
17,911 6.93 40.46 447
Entertainment 4,502 1.74 42.2 110
Fabricated Products 806 0.31 42.51 17
Food Products 9,304 3.6 46.11 242
Healthcare 2,916 1.13 47.23 53 Insurance 772 0.3 47.53 14
Machinery 10,636 4.11 51.65 231
Measuring and Control Equip
3,098 1.2 52.84 46
Medical Equipment 4,801 1.86 54.7 79
Industry Freq. Percent Cum. # of
unique firm
Personal Services 1,948 0.75 58.46 32
Petroleum and Natural Gas
10,108 3.91 62.37 248
Pharmaceutical Products
10,405 4.02 66.39 217
Precious Metals 4,010 1.55 67.94 173
Printing and Publishing 2,272 0.88 68.82 62
Real Estate 898 0.35 69.17 11 Recreational Products 2,462 0.95 70.12 66
Restaurant, Hotel, Motel 5,327 2.06 72.18 143
Retail 12,115 4.68 76.87 248
Rubber and Plastic Products
3,415 1.32 78.19 112
Shipbuilding, Railroad Eq
659 0.25 78.44 21
Shipping Containers 693 0.27 78.71 26
Steel Works, Etc. 7,685 2.97 81.68 221
Telecommunications 5,985 2.31 83.99 118
Textiles 4,042 1.56 85.56 98 Tobacco Products 363 0.14 85.7 13
Trading 2,303 0.89 86.59 30 Transportation 9,728 3.76 90.35 255
Utilities 9,372 3.62 93.97 201
Wholesale 12,567 4.86 98.83 289
miscellaneous 3,020 1.17 100 100
Total 258,631 100
30
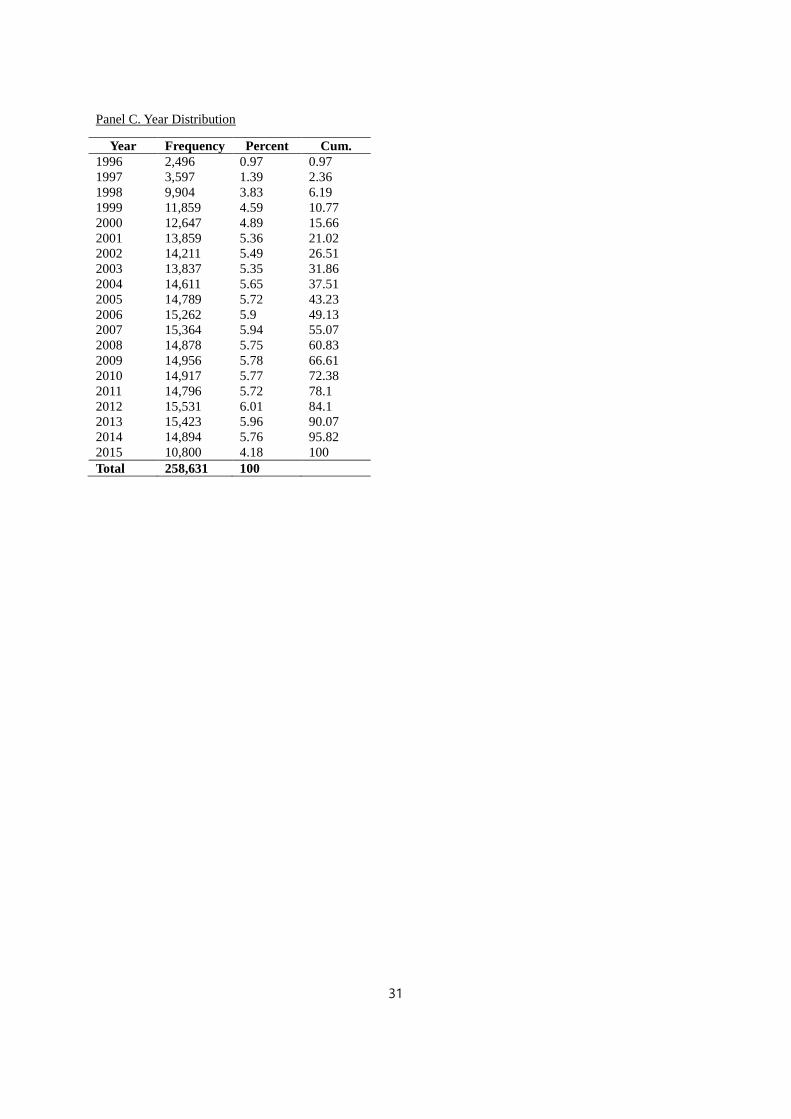
Panel C. Year Distribution
Year Frequency Percent Cum. 1996 2,496 0.97 0.97 1997 3,597 1.39 2.36 1998 9,904 3.83 6.19 1999 11,859 4.59 10.77 2000 12,647 4.89 15.66 2001 13,859 5.36 21.02 2002 14,211 5.49 26.51 2003 13,837 5.35 31.86 2004 14,611 5.65 37.51 2005 14,789 5.72 43.23 2006 15,262 5.9 49.13 2007 15,364 5.94 55.07 2008 14,878 5.75 60.83 2009 14,956 5.78 66.61 2010 14,917 5.77 72.38 2011 14,796 5.72 78.1 2012 15,531 6.01 84.1 2013 15,423 5.96 90.07 2014 14,894 5.76 95.82 2015 10,800 4.18 100 Total 258,631 100
31
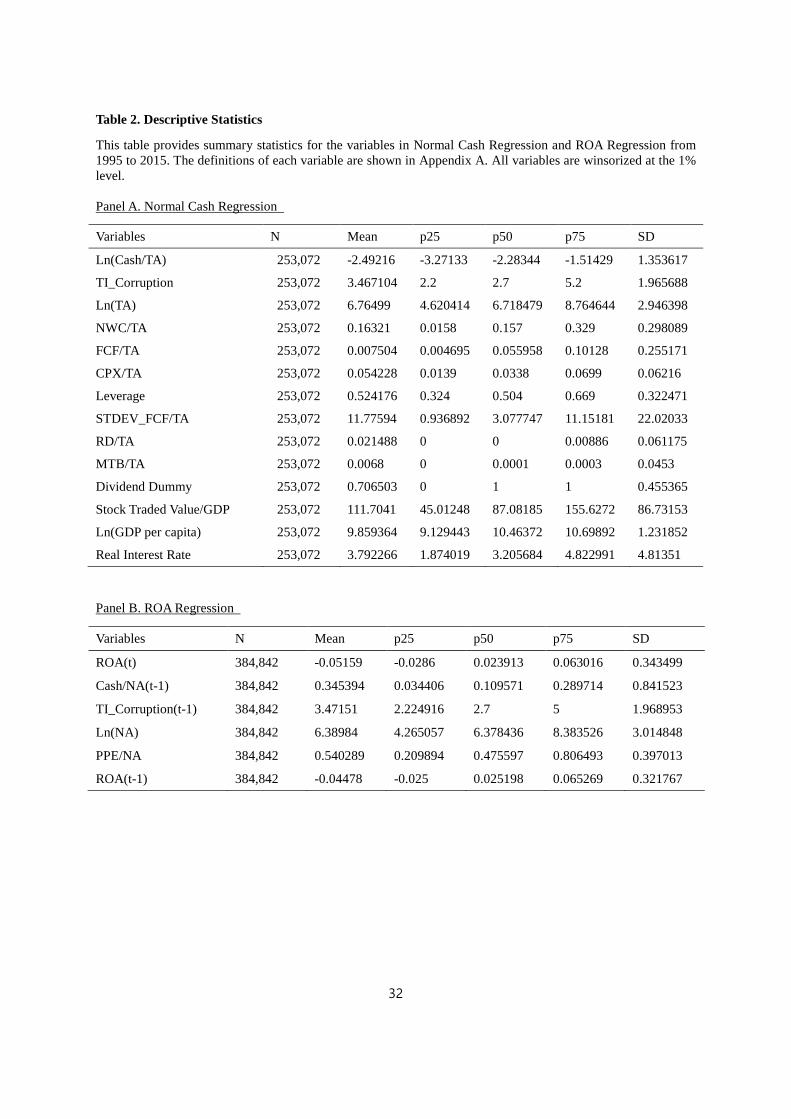
Table 2. Descriptive Statistics
This table provides summary statistics for the variables in Normal Cash Regression and ROA Regression from 1995 to 2015. The definitions of each variable are shown in Appendix A. All variables are winsorized at the 1% level. Panel A. Normal Cash Regression
Variables N Mean p25 p50 p75 SD
Ln(Cash/TA) 253,072 -2.49216 -3.27133 -2.28344 -1.51429 1.353617
TI_Corruption 253,072 3.467104 2.2 2.7 5.2 1.965688
Ln(TA) 253,072 6.76499 4.620414 6.718479 8.764644 2.946398
NWC/TA 253,072 0.16321 0.0158 0.157 0.329 0.298089
FCF/TA 253,072 0.007504 0.004695 0.055958 0.10128 0.255171
CPX/TA 253,072 0.054228 0.0139 0.0338 0.0699 0.06216
Leverage 253,072 0.524176 0.324 0.504 0.669 0.322471
STDEV_FCF/TA 253,072 11.77594 0.936892 3.077747 11.15181 22.02033
RD/TA 253,072 0.021488 0 0 0.00886 0.061175
MTB/TA 253,072 0.0068 0 0.0001 0.0003 0.0453
Dividend Dummy 253,072 0.706503 0 1 1 0.455365
Stock Traded Value/GDP 253,072 111.7041 45.01248 87.08185 155.6272 86.73153
Ln(GDP per capita) 253,072 9.859364 9.129443 10.46372 10.69892 1.231852
Real Interest Rate 253,072 3.792266 1.874019 3.205684 4.822991 4.81351
Panel B. ROA Regression
Variables N Mean p25 p50 p75 SD
ROA(t) 384,842 -0.05159 -0.0286 0.023913 0.063016 0.343499
Cash/NA(t-1) 384,842 0.345394 0.034406 0.109571 0.289714 0.841523
TI_Corruption(t-1) 384,842 3.47151 2.224916 2.7 5 1.968953
Ln(NA) 384,842 6.38984 4.265057 6.378436 8.383526 3.014848
PPE/NA 384,842 0.540289 0.209894 0.475597 0.806493 0.397013
ROA(t-1) 384,842 -0.04478 -0.025 0.025198 0.065269 0.321767
32
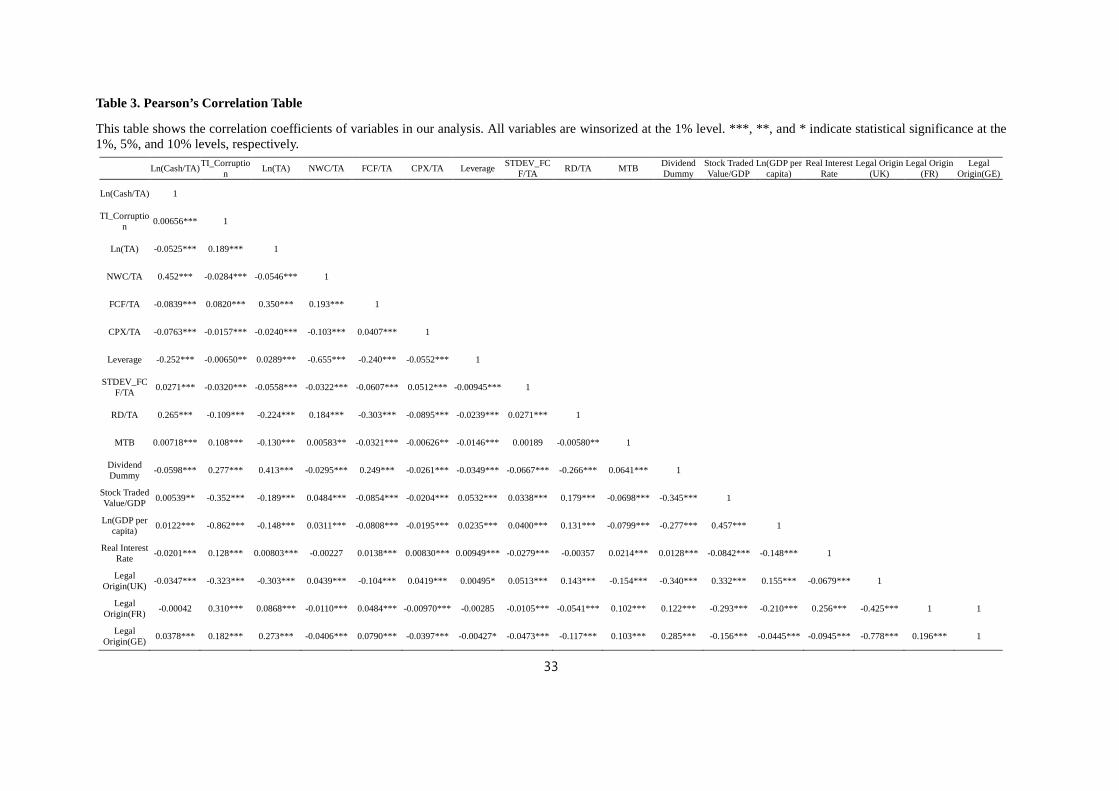
Table 3. Pearson’s Correlation Table
This table shows the correlation coefficients of variables in our analysis. All variables are winsorized at the 1% level. ***, **, and * indicate statistical significance at the 1%, 5%, and 10% levels, respectively.
Ln(Cash/TA) TI_Corruption Ln(TA) NWC/TA FCF/TA CPX/TA Leverage STDEV_FC
F/TA RD/TA MTB Dividend Dummy
Stock Traded Value/GDP
Ln(GDP per capita)
Real Interest Rate
Legal Origin (UK)
Legal Origin (FR)
Legal Origin(GE)
Ln(Cash/TA) 1
TI_Corruption 0.00656*** 1
Ln(TA) -0.0525*** 0.189*** 1
NWC/TA 0.452*** -0.0284*** -0.0546*** 1
FCF/TA -0.0839*** 0.0820*** 0.350*** 0.193*** 1
CPX/TA -0.0763*** -0.0157*** -0.0240*** -0.103*** 0.0407*** 1
Leverage -0.252*** -0.00650** 0.0289*** -0.655*** -0.240*** -0.0552*** 1
STDEV_FCF/TA 0.0271*** -0.0320*** -0.0558*** -0.0322*** -0.0607*** 0.0512*** -0.00945*** 1
RD/TA 0.265*** -0.109*** -0.224*** 0.184*** -0.303*** -0.0895*** -0.0239*** 0.0271*** 1
MTB 0.00718*** 0.108*** -0.130*** 0.00583** -0.0321*** -0.00626** -0.0146*** 0.00189 -0.00580** 1
Dividend Dummy -0.0598*** 0.277*** 0.413*** -0.0295*** 0.249*** -0.0261*** -0.0349*** -0.0667*** -0.266*** 0.0641*** 1
Stock Traded Value/GDP 0.00539** -0.352*** -0.189*** 0.0484*** -0.0854*** -0.0204*** 0.0532*** 0.0338*** 0.179*** -0.0698*** -0.345*** 1
Ln(GDP per capita) 0.0122*** -0.862*** -0.148*** 0.0311*** -0.0808*** -0.0195*** 0.0235*** 0.0400*** 0.131*** -0.0799*** -0.277*** 0.457*** 1
Real Interest Rate -0.0201*** 0.128*** 0.00803*** -0.00227 0.0138*** 0.00830*** 0.00949*** -0.0279*** -0.00357 0.0214*** 0.0128*** -0.0842*** -0.148*** 1
Legal Origin(UK) -0.0347*** -0.323*** -0.303*** 0.0439*** -0.104*** 0.0419*** 0.00495* 0.0513*** 0.143*** -0.154*** -0.340*** 0.332*** 0.155*** -0.0679*** 1
Legal Origin(FR) -0.00042 0.310*** 0.0868*** -0.0110*** 0.0484*** -0.00970*** -0.00285 -0.0105*** -0.0541*** 0.102*** 0.122*** -0.293*** -0.210*** 0.256*** -0.425*** 1 1
Legal Origin(GE) 0.0378*** 0.182*** 0.273*** -0.0406*** 0.0790*** -0.0397*** -0.00427* -0.0473*** -0.117*** 0.103*** 0.285*** -0.156*** -0.0445*** -0.0945*** -0.778*** 0.196*** 1
33
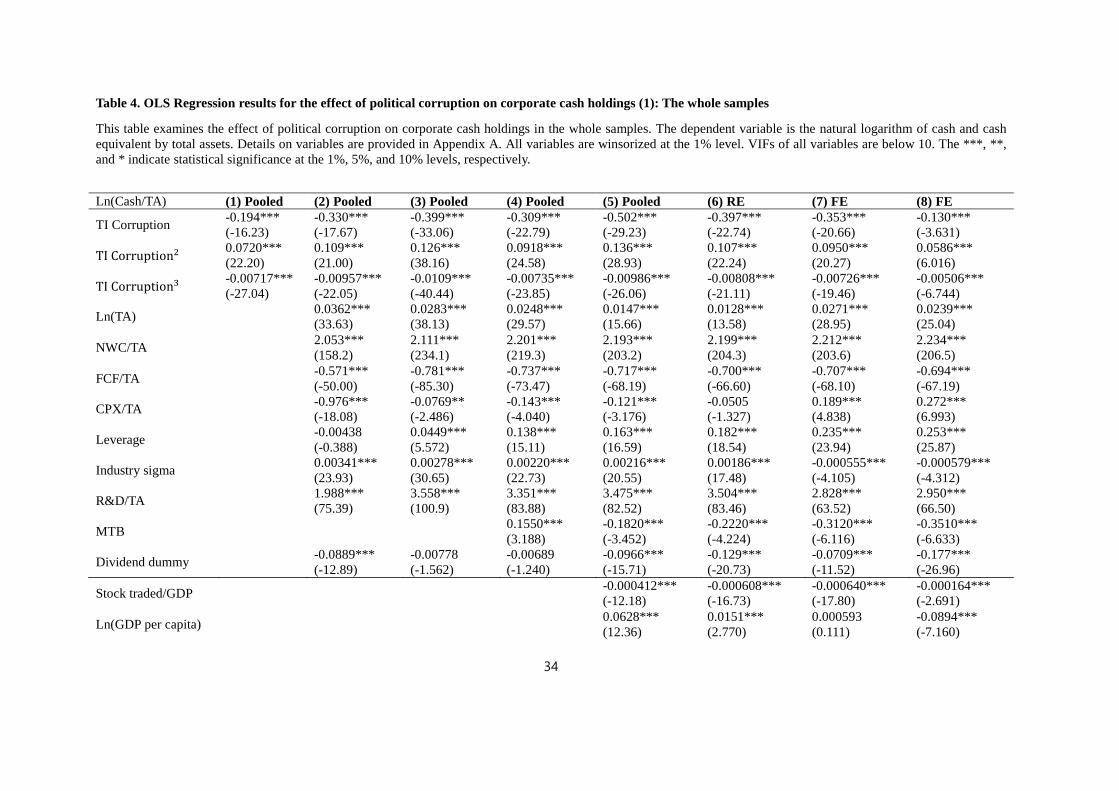
Table 4. OLS Regression results for the effect of political corruption on corporate cash holdings (1): The whole samples
This table examines the effect of political corruption on corporate cash holdings in the whole samples. The dependent variable is the natural logarithm of cash and cash equivalent by total assets. Details on variables are provided in Appendix A. All variables are winsorized at the 1% level. VIFs of all variables are below 10. The ***, **, and * indicate statistical significance at the 1%, 5%, and 10% levels, respectively.
Ln(Cash/TA) (1) Pooled (2) Pooled (3) Pooled (4) Pooled (5) Pooled (6) RE (7) FE (8) FE
TI Corruption -0.194*** (-16.23)
-0.330*** (-17.67)
-0.399*** (-33.06)
-0.309*** (-22.79)
-0.502*** (-29.23)
-0.397*** (-22.74)
-0.353*** (-20.66)
-0.130*** (-3.631)
TI Corruption2 0.0720*** (22.20)
0.109*** (21.00)
0.126*** (38.16)
0.0918*** (24.58)
0.136*** (28.93)
0.107*** (22.24)
0.0950*** (20.27)
0.0586*** (6.016)
TI Corruption3 -0.00717*** (-27.04)
-0.00957*** (-22.05)
-0.0109*** (-40.44)
-0.00735*** (-23.85)
-0.00986*** (-26.06)
-0.00808*** (-21.11)
-0.00726*** (-19.46)
-0.00506*** (-6.744)
Ln(TA) 0.0362*** (33.63)
0.0283*** (38.13)
0.0248*** (29.57)
0.0147*** (15.66)
0.0128*** (13.58)
0.0271*** (28.95)
0.0239*** (25.04)
NWC/TA 2.053*** (158.2)
2.111*** (234.1)
2.201*** (219.3)
2.193*** (203.2)
2.199*** (204.3)
2.212*** (203.6)
2.234*** (206.5)
FCF/TA -0.571*** (-50.00)
-0.781*** (-85.30)
-0.737*** (-73.47)
-0.717*** (-68.19)
-0.700*** (-66.60)
-0.707*** (-68.10)
-0.694*** (-67.19)
CPX/TA -0.976*** (-18.08)
-0.0769** (-2.486)
-0.143*** (-4.040)
-0.121*** (-3.176)
-0.0505 (-1.327)
0.189*** (4.838)
0.272*** (6.993)
Leverage -0.00438 (-0.388)
0.0449*** (5.572)
0.138*** (15.11)
0.163*** (16.59)
0.182*** (18.54)
0.235*** (23.94)
0.253*** (25.87)
Industry sigma 0.00341*** (23.93)
0.00278*** (30.65)
0.00220*** (22.73)
0.00216*** (20.55)
0.00186*** (17.48)
-0.000555*** (-4.105)
-0.000579*** (-4.312)
R&D/TA 1.988*** (75.39)
3.558*** (100.9)
3.351*** (83.88)
3.475*** (82.52)
3.504*** (83.46)
2.828*** (63.52)
2.950*** (66.50)
MTB 0.1550*** (3.188)
-0.1820*** (-3.452)
-0.2220*** (-4.224)
-0.3120*** (-6.116)
-0.3510*** (-6.633)
Dividend dummy -0.0889*** (-12.89)
-0.00778 (-1.562)
-0.00689 (-1.240)
-0.0966*** (-15.71)
-0.129*** (-20.73)
-0.0709*** (-11.52)
-0.177*** (-26.96)
Stock traded/GDP -0.000412*** (-12.18)
-0.000608*** (-16.73)
-0.000640*** (-17.80)
-0.000164*** (-2.691)
Ln(GDP per capita) 0.0628*** (12.36)
0.0151*** (2.770)
0.000593 (0.111)
-0.0894*** (-7.160)
34
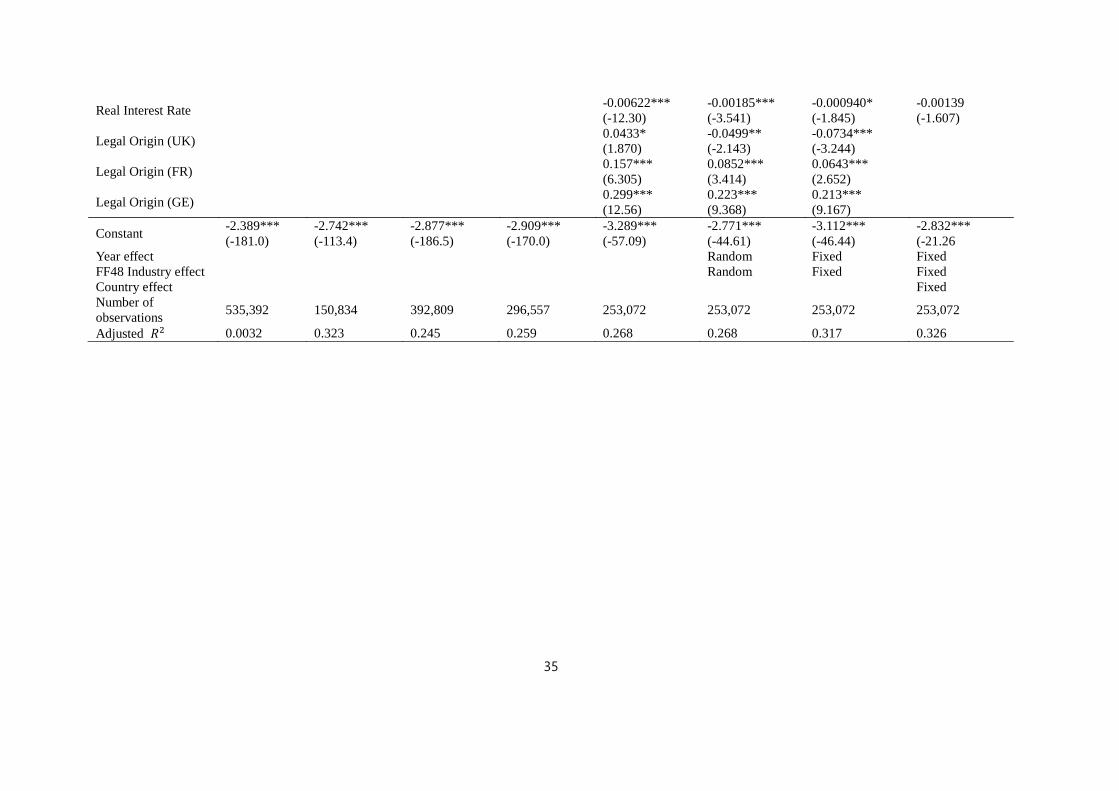
Real Interest Rate -0.00622*** (-12.30)
-0.00185*** (-3.541)
-0.000940* (-1.845)
-0.00139 (-1.607)
Legal Origin (UK) 0.0433* (1.870)
-0.0499** (-2.143)
-0.0734*** (-3.244)
Legal Origin (FR) 0.157*** (6.305)
0.0852*** (3.414)
0.0643*** (2.652)
Legal Origin (GE) 0.299*** (12.56)
0.223*** (9.368)
0.213*** (9.167)
Constant -2.389*** (-181.0)
-2.742*** (-113.4)
-2.877*** (-186.5)
-2.909*** (-170.0)
-3.289*** (-57.09)
-2.771*** (-44.61)
-3.112*** (-46.44)
-2.832*** (-21.26
Year effect Random Fixed Fixed FF48 Industry effect Random Fixed Fixed Country effect Fixed Number of observations 535,392 150,834 392,809 296,557 253,072 253,072 253,072 253,072
Adjusted 𝑅𝑅2 0.0032 0.323 0.245 0.259 0.268 0.268 0.317 0.326
35
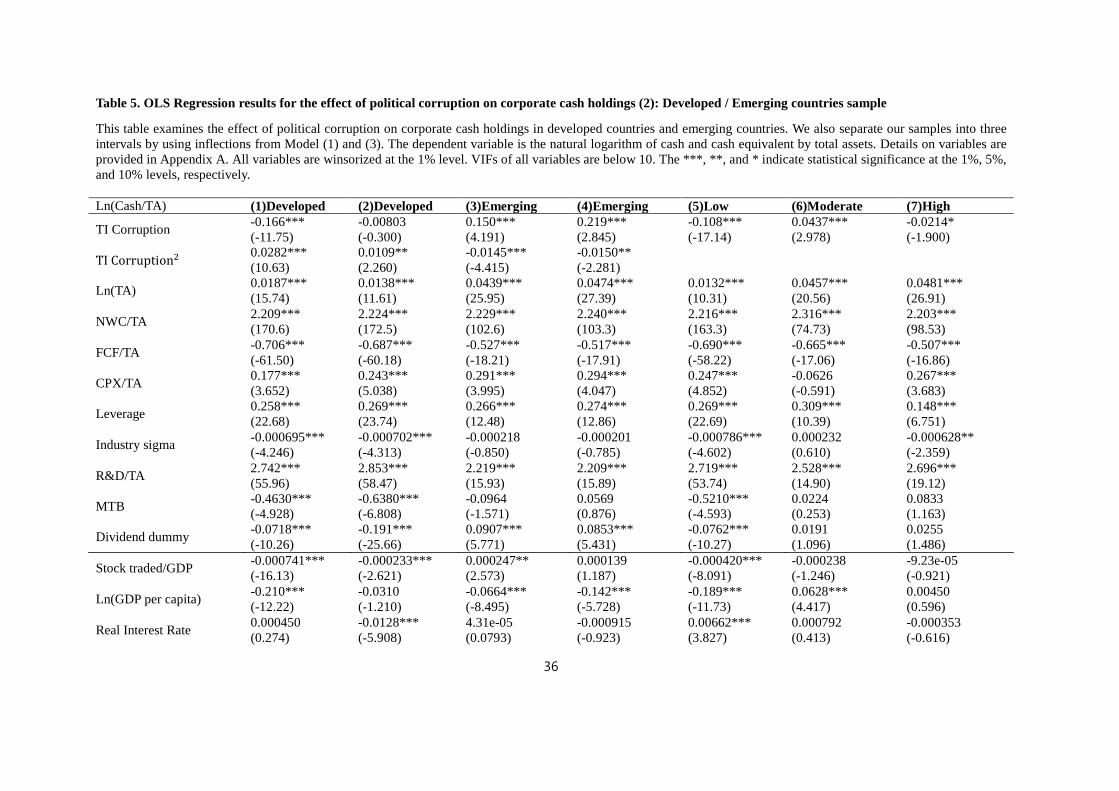
Table 5. OLS Regression results for the effect of political corruption on corporate cash holdings (2): Developed / Emerging countries sample
This table examines the effect of political corruption on corporate cash holdings in developed countries and emerging countries. We also separate our samples into three intervals by using inflections from Model (1) and (3). The dependent variable is the natural logarithm of cash and cash equivalent by total assets. Details on variables are provided in Appendix A. All variables are winsorized at the 1% level. VIFs of all variables are below 10. The ***, **, and * indicate statistical significance at the 1%, 5%, and 10% levels, respectively. Ln(Cash/TA) (1)Developed (2)Developed (3)Emerging (4)Emerging (5)Low (6)Moderate (7)High
TI Corruption -0.166*** (-11.75)
-0.00803 (-0.300)
0.150*** (4.191)
0.219*** (2.845)
-0.108*** (-17.14)
0.0437*** (2.978)
-0.0214* (-1.900)
TI Corruption2 0.0282*** (10.63)
0.0109** (2.260)
-0.0145*** (-4.415)
-0.0150** (-2.281)
Ln(TA) 0.0187*** (15.74)
0.0138*** (11.61)
0.0439*** (25.95)
0.0474*** (27.39)
0.0132*** (10.31)
0.0457*** (20.56)
0.0481*** (26.91)
NWC/TA 2.209*** (170.6)
2.224*** (172.5)
2.229*** (102.6)
2.240*** (103.3)
2.216*** (163.3)
2.316*** (74.73)
2.203*** (98.53)
FCF/TA -0.706*** (-61.50)
-0.687*** (-60.18)
-0.527*** (-18.21)
-0.517*** (-17.91)
-0.690*** (-58.22)
-0.665*** (-17.06)
-0.507*** (-16.86)
CPX/TA 0.177*** (3.652)
0.243*** (5.038)
0.291*** (3.995)
0.294*** (4.047)
0.247*** (4.852)
-0.0626 (-0.591)
0.267*** (3.683)
Leverage 0.258*** (22.68)
0.269*** (23.74)
0.266*** (12.48)
0.274*** (12.86)
0.269*** (22.69)
0.309*** (10.39)
0.148*** (6.751)
Industry sigma -0.000695*** (-4.246)
-0.000702*** (-4.313)
-0.000218 (-0.850)
-0.000201 (-0.785)
-0.000786*** (-4.602)
0.000232 (0.610)
-0.000628** (-2.359)
R&D/TA 2.742*** (55.96)
2.853*** (58.47)
2.219*** (15.93)
2.209*** (15.89)
2.719*** (53.74)
2.528*** (14.90)
2.696*** (19.12)
MTB -0.4630*** (-4.928)
-0.6380*** (-6.808)
-0.0964 (-1.571)
0.0569 (0.876)
-0.5210*** (-4.593)
0.0224 (0.253)
0.0833 (1.163)
Dividend dummy -0.0718*** (-10.26)
-0.191*** (-25.66)
0.0907*** (5.771)
0.0853*** (5.431)
-0.0762*** (-10.27)
0.0191 (1.096)
0.0255 (1.486)
Stock traded/GDP -0.000741*** (-16.13)
-0.000233*** (-2.621)
0.000247** (2.573)
0.000139 (1.187)
-0.000420*** (-8.091)
-0.000238 (-1.246)
-9.23e-05 (-0.921)
Ln(GDP per capita) -0.210*** (-12.22)
-0.0310 (-1.210)
-0.0664*** (-8.495)
-0.142*** (-5.728)
-0.189*** (-11.73)
0.0628*** (4.417)
0.00450 (0.596)
Real Interest Rate 0.000450 (0.274)
-0.0128*** (-5.908)
4.31e-05 (0.0793)
-0.000915 (-0.923)
0.00662*** (3.827)
0.000792 (0.413)
-0.000353 (-0.616)
36
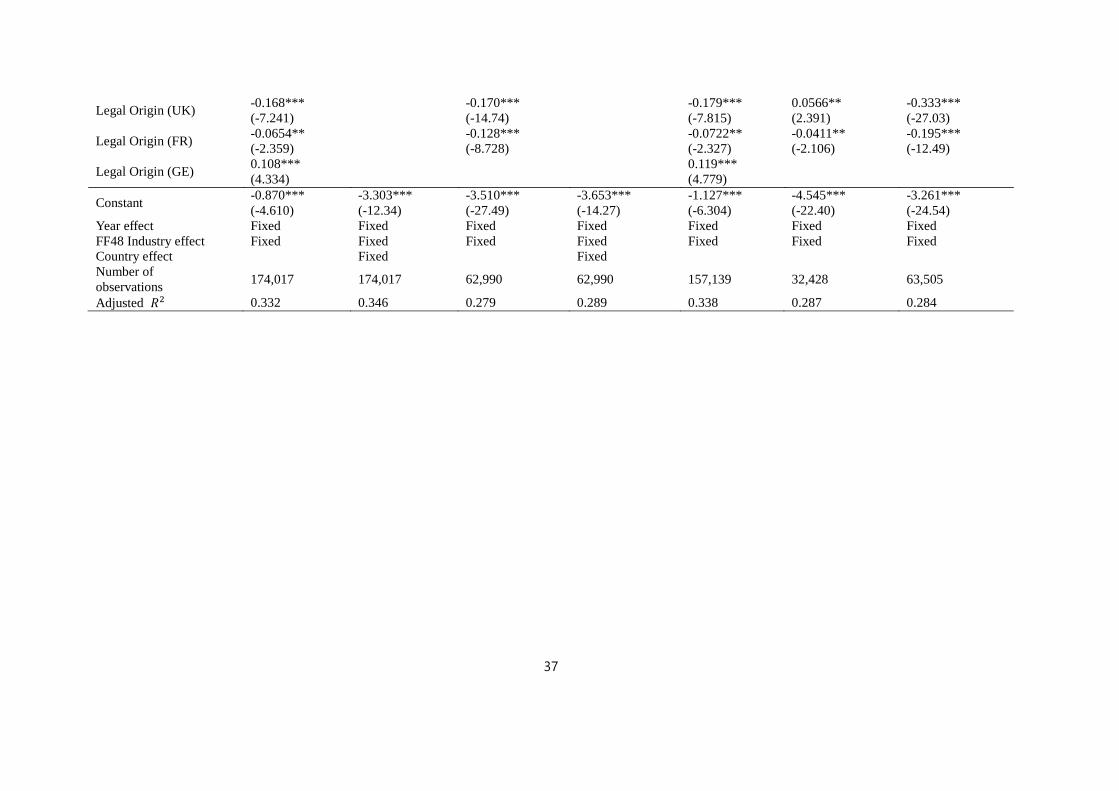
Legal Origin (UK) -0.168*** (-7.241) -0.170***
(-14.74) -0.179*** (-7.815)
0.0566** (2.391)
-0.333*** (-27.03)
Legal Origin (FR) -0.0654** (-2.359) -0.128***
(-8.728) -0.0722** (-2.327)
-0.0411** (-2.106)
-0.195*** (-12.49)
Legal Origin (GE) 0.108*** (4.334) 0.119***
(4.779)
Constant -0.870*** (-4.610)
-3.303*** (-12.34)
-3.510*** (-27.49)
-3.653*** (-14.27)
-1.127*** (-6.304)
-4.545*** (-22.40)
-3.261*** (-24.54)
Year effect Fixed Fixed Fixed Fixed Fixed Fixed Fixed FF48 Industry effect Fixed Fixed Fixed Fixed Fixed Fixed Fixed Country effect Fixed Fixed Number of observations 174,017 174,017 62,990 62,990 157,139 32,428 63,505
Adjusted 𝑅𝑅2 0.332 0.346 0.279 0.289 0.338 0.287 0.284
37
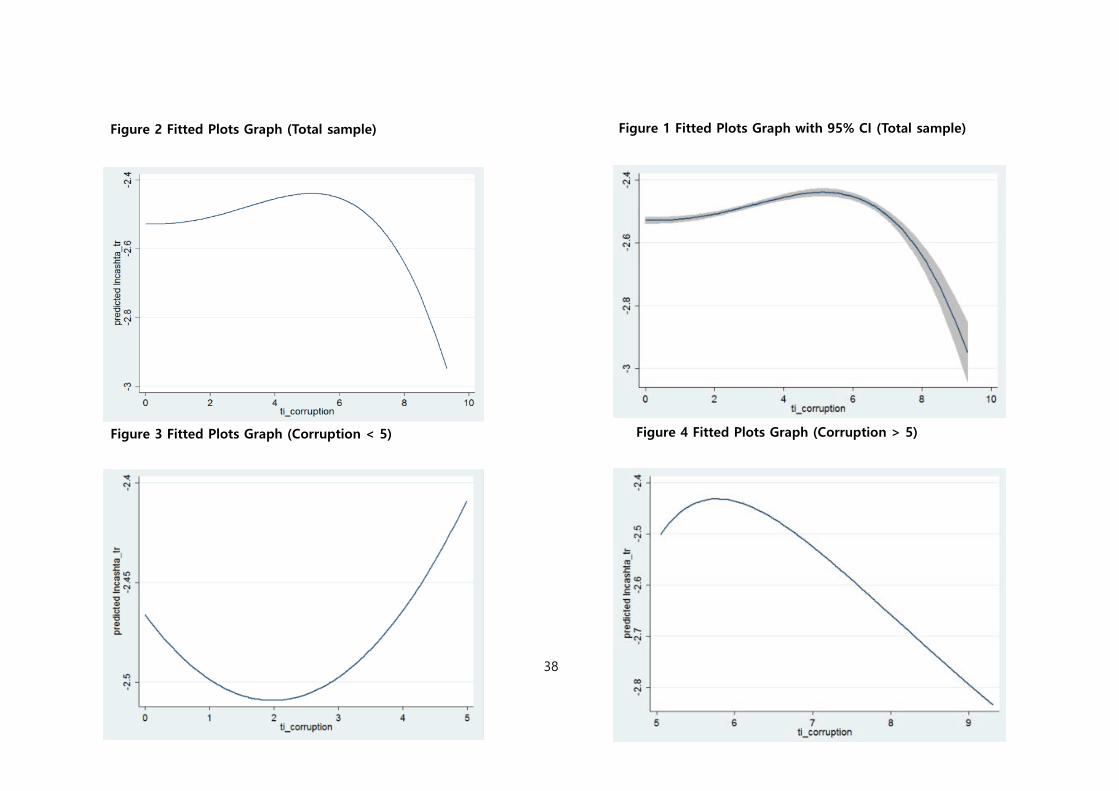
Figure 2 Fitted Plots Graph (Total sample) Figure 1 Fitted Plots Graph with 95% CI (Total sample)
Figure 3 Fitted Plots Graph (Corruption < 5) Figure 4 Fitted Plots Graph (Corruption > 5)
38
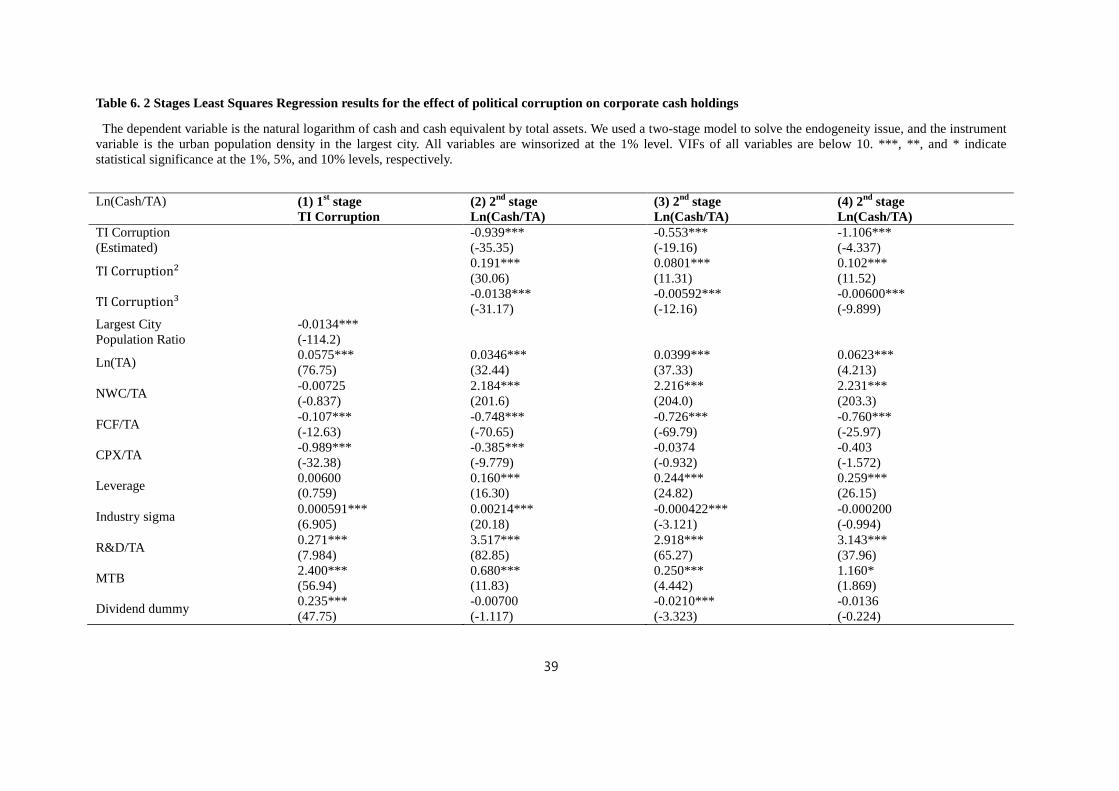
Table 6. 2 Stages Least Squares Regression results for the effect of political corruption on corporate cash holdings
The dependent variable is the natural logarithm of cash and cash equivalent by total assets. We used a two-stage model to solve the endogeneity issue, and the instrument variable is the urban population density in the largest city. All variables are winsorized at the 1% level. VIFs of all variables are below 10. ***, **, and * indicate statistical significance at the 1%, 5%, and 10% levels, respectively.
Ln(Cash/TA) (1) 1st stage TI Corruption
(2) 2nd stage Ln(Cash/TA)
(3) 2nd stage Ln(Cash/TA)
(4) 2nd stage Ln(Cash/TA)
TI Corruption (Estimated) -0.939***
(-35.35) -0.553*** (-19.16)
-1.106*** (-4.337)
TI Corruption2 0.191*** (30.06)
0.0801*** (11.31)
0.102*** (11.52)
TI Corruption3 -0.0138*** (-31.17)
-0.00592*** (-12.16)
-0.00600*** (-9.899)
Largest City Population Ratio
-0.0134*** (-114.2)
Ln(TA) 0.0575*** (76.75)
0.0346*** (32.44)
0.0399*** (37.33)
0.0623*** (4.213)
NWC/TA -0.00725 (-0.837)
2.184*** (201.6)
2.216*** (204.0)
2.231*** (203.3)
FCF/TA -0.107*** (-12.63)
-0.748*** (-70.65)
-0.726*** (-69.79)
-0.760*** (-25.97)
CPX/TA -0.989*** (-32.38)
-0.385*** (-9.779)
-0.0374 (-0.932)
-0.403 (-1.572)
Leverage 0.00600 (0.759)
0.160*** (16.30)
0.244*** (24.82)
0.259*** (26.15)
Industry sigma 0.000591*** (6.905)
0.00214*** (20.18)
-0.000422*** (-3.121)
-0.000200 (-0.994)
R&D/TA 0.271*** (7.984)
3.517*** (82.85)
2.918*** (65.27)
3.143*** (37.96)
MTB 2.400*** (56.94)
0.680*** (11.83)
0.250*** (4.442)
1.160* (1.869)
Dividend dummy 0.235*** (47.75)
-0.00700 (-1.117)
-0.0210*** (-3.323)
-0.0136 (-0.224)
39
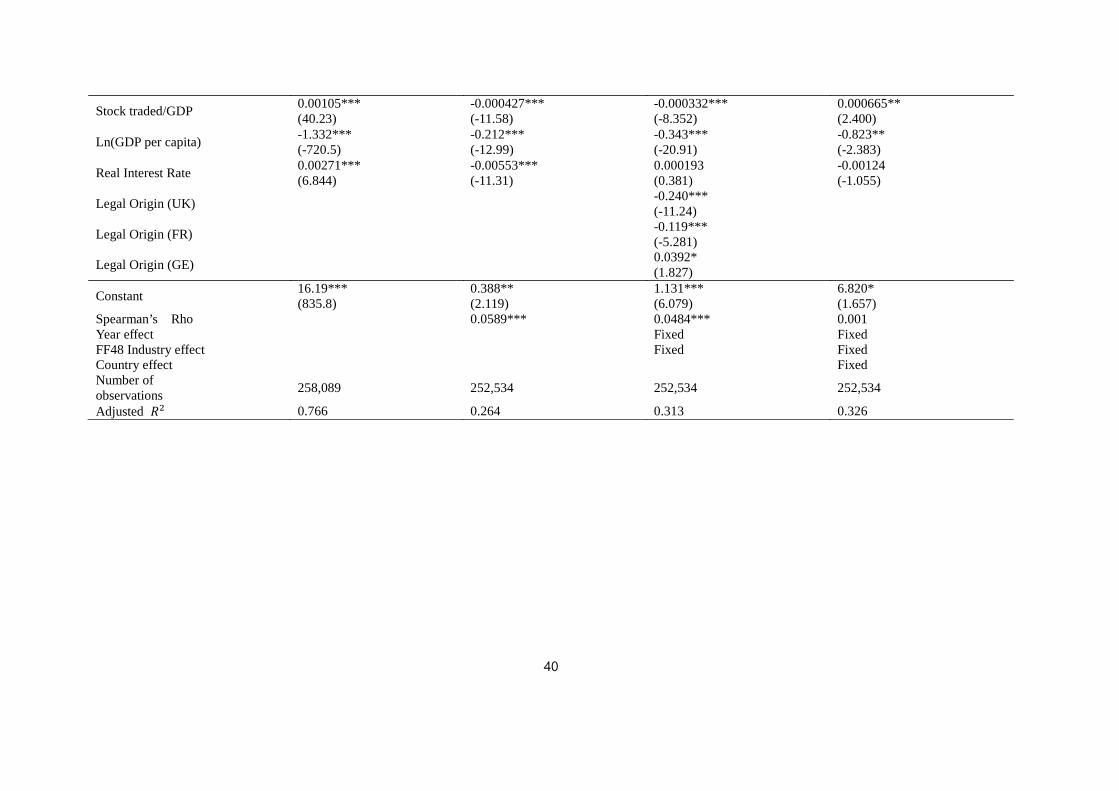
Stock traded/GDP 0.00105*** (40.23)
-0.000427*** (-11.58)
-0.000332*** (-8.352)
0.000665** (2.400)
Ln(GDP per capita) -1.332*** (-720.5)
-0.212*** (-12.99)
-0.343*** (-20.91)
-0.823** (-2.383)
Real Interest Rate 0.00271*** (6.844)
-0.00553*** (-11.31)
0.000193 (0.381)
-0.00124 (-1.055)
Legal Origin (UK) -0.240*** (-11.24)
Legal Origin (FR) -0.119*** (-5.281)
Legal Origin (GE) 0.0392* (1.827)
Constant 16.19*** (835.8)
0.388** (2.119)
1.131*** (6.079)
6.820* (1.657)
Spearman’s Rho 0.0589*** 0.0484*** 0.001 Year effect Fixed Fixed FF48 Industry effect Fixed Fixed Country effect Fixed Number of observations 258,089 252,534 252,534 252,534
Adjusted 𝑅𝑅2 0.766 0.264 0.313 0.326
40
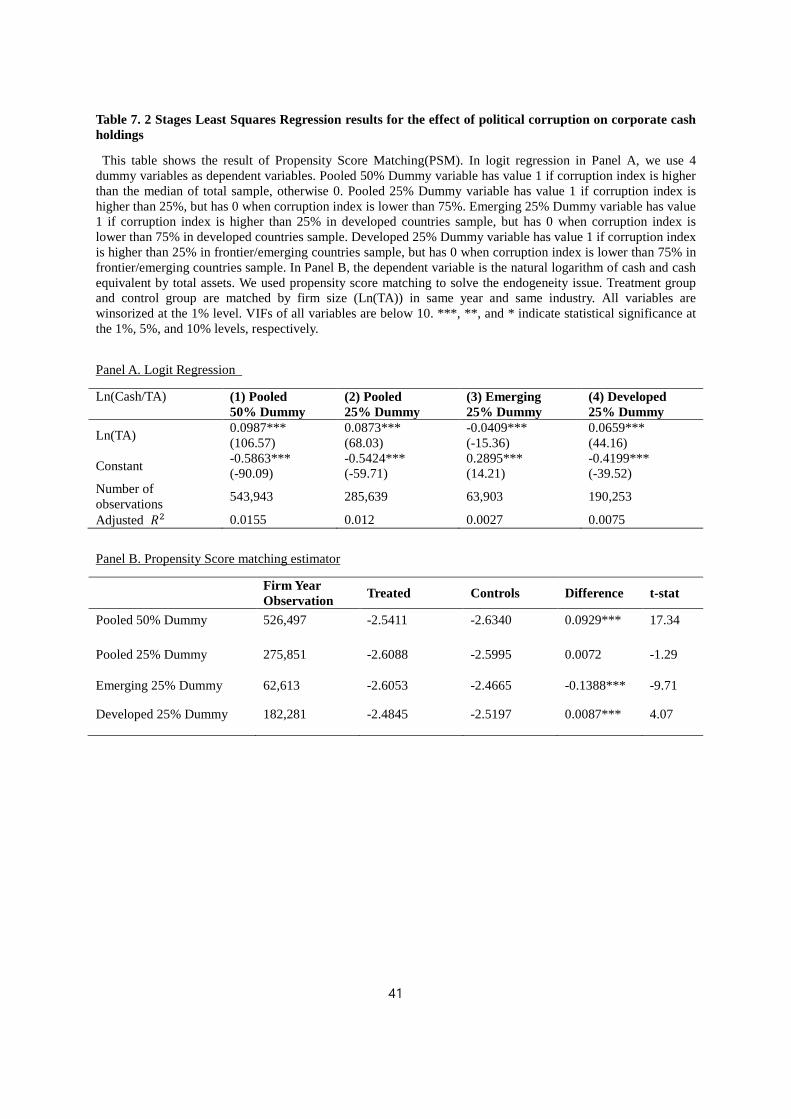
Table 7. 2 Stages Least Squares Regression results for the effect of political corruption on corporate cash holdings
This table shows the result of Propensity Score Matching(PSM). In logit regression in Panel A, we use 4 dummy variables as dependent variables. Pooled 50% Dummy variable has value 1 if corruption index is higher than the median of total sample, otherwise 0. Pooled 25% Dummy variable has value 1 if corruption index is higher than 25%, but has 0 when corruption index is lower than 75%. Emerging 25% Dummy variable has value 1 if corruption index is higher than 25% in developed countries sample, but has 0 when corruption index is lower than 75% in developed countries sample. Developed 25% Dummy variable has value 1 if corruption index is higher than 25% in frontier/emerging countries sample, but has 0 when corruption index is lower than 75% in frontier/emerging countries sample. In Panel B, the dependent variable is the natural logarithm of cash and cash equivalent by total assets. We used propensity score matching to solve the endogeneity issue. Treatment group and control group are matched by firm size (Ln(TA)) in same year and same industry. All variables are winsorized at the 1% level. VIFs of all variables are below 10. ***, **, and * indicate statistical significance at the 1%, 5%, and 10% levels, respectively.
Panel A. Logit Regression
Ln(Cash/TA) (1) Pooled 50% Dummy
(2) Pooled 25% Dummy
(3) Emerging 25% Dummy
(4) Developed 25% Dummy
Ln(TA) 0.0987*** (106.57)
0.0873*** (68.03)
-0.0409*** (-15.36)
0.0659*** (44.16)
Constant -0.5863*** (-90.09)
-0.5424*** (-59.71)
0.2895*** (14.21)
-0.4199*** (-39.52)
Number of observations 543,943 285,639 63,903 190,253
Adjusted 𝑅𝑅2 0.0155 0.012 0.0027 0.0075 Panel B. Propensity Score matching estimator
Firm Year Observation Treated Controls Difference t-stat
Pooled 50% Dummy 526,497 -2.5411 -2.6340 0.0929*** 17.34
Pooled 25% Dummy 275,851 -2.6088 -2.5995 0.0072 -1.29
Emerging 25% Dummy 62,613 -2.6053 -2.4665 -0.1388*** -9.71
Developed 25% Dummy 182,281 -2.4845 -2.5197 0.0087*** 4.07
41
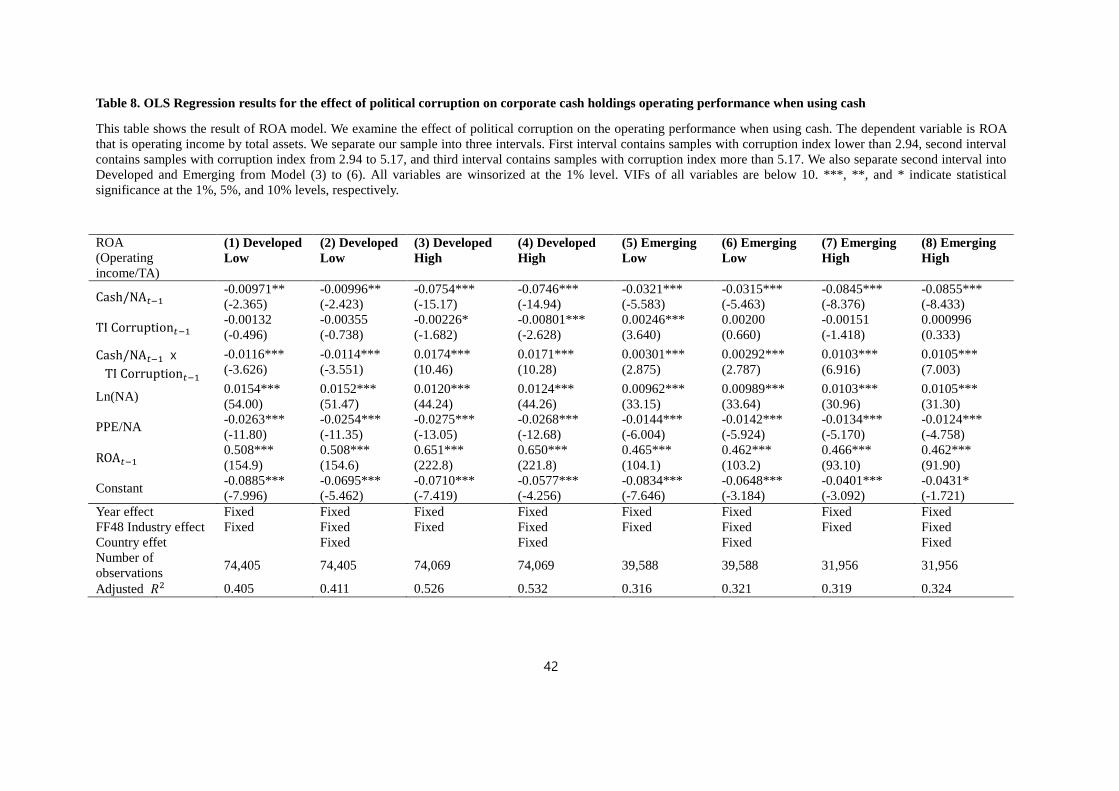
Table 8. OLS Regression results for the effect of political corruption on corporate cash holdings operating performance when using cash
This table shows the result of ROA model. We examine the effect of political corruption on the operating performance when using cash. The dependent variable is ROA that is operating income by total assets. We separate our sample into three intervals. First interval contains samples with corruption index lower than 2.94, second interval contains samples with corruption index from 2.94 to 5.17, and third interval contains samples with corruption index more than 5.17. We also separate second interval into Developed and Emerging from Model (3) to (6). All variables are winsorized at the 1% level. VIFs of all variables are below 10. ***, **, and * indicate statistical significance at the 1%, 5%, and 10% levels, respectively.
ROA (Operating income/TA)
(1) Developed Low
(2) Developed Low
(3) Developed High
(4) Developed High
(5) Emerging Low
(6) Emerging Low
(7) Emerging High
(8) Emerging High
Cash/NA𝑡𝑡−1 -0.00971** (-2.365)
-0.00996** (-2.423)
-0.0754*** (-15.17)
-0.0746*** (-14.94)
-0.0321*** (-5.583)
-0.0315*** (-5.463)
-0.0845*** (-8.376)
-0.0855*** (-8.433)
TI Corruption𝑡𝑡−1 -0.00132 (-0.496)
-0.00355 (-0.738)
-0.00226* (-1.682)
-0.00801*** (-2.628)
0.00246*** (3.640)
0.00200 (0.660)
-0.00151 (-1.418)
0.000996 (0.333)
Cash/NA𝑡𝑡−1 x TI Corruption𝑡𝑡−1
-0.0116*** (-3.626)
-0.0114*** (-3.551)
0.0174*** (10.46)
0.0171*** (10.28)
0.00301*** (2.875)
0.00292*** (2.787)
0.0103*** (6.916)
0.0105*** (7.003)
Ln(NA) 0.0154*** (54.00)
0.0152*** (51.47)
0.0120*** (44.24)
0.0124*** (44.26)
0.00962*** (33.15)
0.00989*** (33.64)
0.0103*** (30.96)
0.0105*** (31.30)
PPE/NA -0.0263*** (-11.80)
-0.0254*** (-11.35)
-0.0275*** (-13.05)
-0.0268*** (-12.68)
-0.0144*** (-6.004)
-0.0142*** (-5.924)
-0.0134*** (-5.170)
-0.0124*** (-4.758)
ROA𝑡𝑡−1 0.508*** (154.9)
0.508*** (154.6)
0.651*** (222.8)
0.650*** (221.8)
0.465*** (104.1)
0.462*** (103.2)
0.466*** (93.10)
0.462*** (91.90)
Constant -0.0885*** (-7.996)
-0.0695*** (-5.462)
-0.0710*** (-7.419)
-0.0577*** (-4.256)
-0.0834*** (-7.646)
-0.0648*** (-3.184)
-0.0401*** (-3.092)
-0.0431* (-1.721)
Year effect Fixed Fixed Fixed Fixed Fixed Fixed Fixed Fixed FF48 Industry effect Fixed Fixed Fixed Fixed Fixed Fixed Fixed Fixed Country effet Fixed Fixed Fixed Fixed Number of observations 74,405 74,405 74,069 74,069 39,588 39,588 31,956 31,956
Adjusted 𝑅𝑅2 0.405 0.411 0.526 0.532 0.316 0.321 0.319 0.324
42
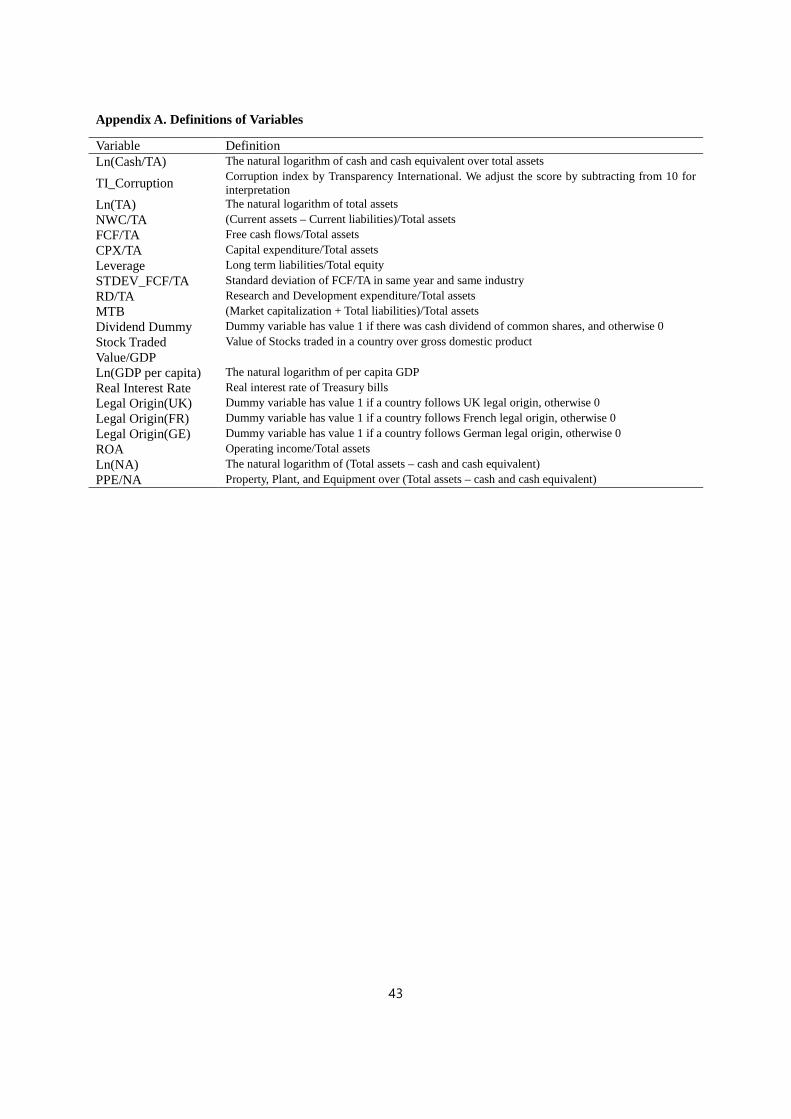
Appendix A. Definitions of Variables
Variable Definition Ln(Cash/TA) The natural logarithm of cash and cash equivalent over total assets
TI_Corruption Corruption index by Transparency International. We adjust the score by subtracting from 10 for interpretation
Ln(TA) The natural logarithm of total assets NWC/TA (Current assets – Current liabilities)/Total assets FCF/TA Free cash flows/Total assets CPX/TA Capital expenditure/Total assets Leverage Long term liabilities/Total equity STDEV_FCF/TA Standard deviation of FCF/TA in same year and same industry RD/TA Research and Development expenditure/Total assets MTB (Market capitalization + Total liabilities)/Total assets Dividend Dummy Dummy variable has value 1 if there was cash dividend of common shares, and otherwise 0 Stock Traded Value/GDP
Value of Stocks traded in a country over gross domestic product
Ln(GDP per capita) The natural logarithm of per capita GDP Real Interest Rate Real interest rate of Treasury bills Legal Origin(UK) Dummy variable has value 1 if a country follows UK legal origin, otherwise 0 Legal Origin(FR) Dummy variable has value 1 if a country follows French legal origin, otherwise 0 Legal Origin(GE) Dummy variable has value 1 if a country follows German legal origin, otherwise 0 ROA Operating income/Total assets Ln(NA) The natural logarithm of (Total assets – cash and cash equivalent) PPE/NA Property, Plant, and Equipment over (Total assets – cash and cash equivalent)
43
Reference
Acemoglu, D., Johnson, S., & Robinson, J. A. (2005). Institutions as a fundamental cause of long-run growth. Handbook of economic growth, 1, 385-472.
Ades, A. and R. Di Tella (1999). "Rents, competition, and corruption." The American Economic Review 89(4): 982-993.
Bai, J., et al. "The impact of corruption on taxation and growth: Evidence from the US."
Blackburn, K., Bose, N., and Haque, E.M. (2006), ‘The Incidence and Persistence of Corruption in Economic Development’, Journal of Economic Dynamics and Control, 30, 2447–67.
Bliss, C. and R. D. Tella (1997). "Does competition kill corruption?" Journal of political economy 105(5): 1001-1023.
Boubakri, N., et al. (2016). "National culture and privatization: The relationship between collectivism and residual state ownership." Journal of International Business Studies 47(2): 170-190.
Bronars, S. G. and D. R. Deere (1991). "The threat of unionization, the use of debt, and the preservation of shareholder wealth." The quarterly journal of economics 106(1): 231-254.
Campante, F. R. (2014). "Isolated capital cities, accountability, and corruption: Evidence from US states." The American Economic Review 104(8): 2456-2481.
Chang, K. and A. Noorbakhsh (2009). "Does national culture affect international corporate cash holdings?" Journal of Multinational Financial Management 19(5): 323-342.
Chen, Y., et al. (2015). "National culture and corporate cash holdings around the world." Journal of Banking & Finance 50: 1-18.
Choi, J. P. and M. Thum (2005). "Corruption and the shadow economy." International Economic Review 46(3): 817-836.
Chui, A. C., et al. (2002). "The determination of capital structure: is national culture a missing piece to the puzzle?" Journal of International Business Studies 33(1): 99-127.
Chui, A. C., et al. (2010). "Individualism and momentum around the world." The journal of Finance 65(1): 361-392.
Claessens, S., et al. (2008). "Political connections and preferential access to finance: The role of campaign contributions." Journal of Financial Economics 88(3): 554-580.
DeBacker, J., et al. (2015). "Importing corruption culture from overseas: Evidence from corporate tax evasion in the United States." Journal of Financial Economics 117(1): 122-138.
Dittmar, A. and J. Mahrt-Smith (2007). "Corporate governance and the value of cash holdings." Journal of Financial Economics 83(3): 599-634.
Dittmar, A., et al. (2003). "International corporate governance and corporate cash holdings." Journal of Financial and Quantitative analysis 38(1): 111-133.
Doidge, C., et al. (2007). "Why do countries matter so much for corporate governance?" Journal of Financial Economics 86(1): 1-39.
Duchin, R. and D. Sosyura (2012). "The politics of government investment." Journal of Financial Economics 106(1): 24-48.
44
Dudley, E. and N. Zhang (2016). "Trust and corporate cash holdings." Journal of Corporate Finance 41: 363-387.
Eun, C. S., et al. (2015). "Culture and R 2." Journal of Financial Economics 115(2): 283-303.
Faccio, M., et al. (2006). "Political connections and corporate bailouts." The journal of Finance 61(6): 2597-2635.
Fernandes, N. and H. Gonenc (2016). "Multinationals and cash holdings." Journal of Corporate Finance 39: 139-154.
Fisman, R. (2001). "Estimating the value of political connections." The American Economic Review 91(4): 1095-1102.
Friedman, E., et al. (2000). "Dodging the grabbing hand: the determinants of unofficial activity in 69 countries." Journal of public economics 76(3): 459-493.
Goldman, E., et al. (2009). Fraudulent earnings manipulation and its impact on rivals, Working paper, Indiana University and INSEAD.
Griffin, D., et al. (2017). "National culture: The missing country-level determinant of corporate governance." Journal of International Business Studies: 1-23.
Grinblatt, M. and M. Keloharju (2001). "How distance, language, and culture influence stockholdings and trades." The journal of Finance 56(3): 1053-1073.
Guiso, L., et al. (2008). "Social capital as good culture." Journal of the European Economic Association 6(2-3): 295-320.
Hellman, J. S., et al. (2003). "Seize the state, seize the day: state capture and influence in transition economies." Journal of Comparative Economics 31(4): 751-773.
Hofstede, G. (2003). Culture's consequences: Comparing values, behaviors, institutions and organizations across nations, Sage publications.
Huntington, S. P. (1968). "The bases of accommodation." Foreign Affairs 46(4): 642-656.
Johnson, S., et al. (2000). "Why do firms hide? Bribes and unofficial activity after communism." Journal of public economics 76(3): 495-520.
Kalcheva, I. and K. V. Lins (2007). "International evidence on cash holdings and expected managerial agency problems." The Review of Financial Studies 20(4): 1087-1112.
Karolyi, G. A. (2016). "The gravity of culture for finance." Journal of Corporate Finance 41: 610-625.
Klasa, S., et al. (2009). "The strategic use of corporate cash holdings in collective bargaining with labor unions." Journal of Financial Economics 92(3): 421-442.
La Porta, R., Lopez-de-Silanes, F., Shleifer, A., & Vishny, R. (1999). The quality of government. The Journal of Law, Economics, and Organization, 15(1), 222-279.
Lederman, D., Loayza, N. V., & Soares, R. R. (2005). Accountability and corruption: Political institutions matter. Economics & Politics, 17(1), 1-35.
Leff, N. H. (1964). "Economic development through bureaucratic corruption." American behavioral scientist 8(3): 8-14.
Li, J. and J. R. Harrison (2008). "Corporate governance and national culture: a multi-country study." Corporate Governance: The international journal of business in society 8(5): 607-621.
45
Liu, X. (2016). "Corruption culture and corporate misconduct." Journal of Financial Economics 122(2): 307-327.
Matsa, D. A. (2010). "Capital structure as a strategic variable: Evidence from collective bargaining." The journal of Finance 65(3): 1197-1232.
Mauro, P. (1995). "Corruption and growth." The quarterly journal of economics 110(3): 681-712.
Mironov, M. (2015). "Should one hire a corrupt CEO in a corrupt country?" Journal of Financial Economics 117(1): 29-42.
Mo, P. H. (2001). "Corruption and economic growth." Journal of Comparative Economics 29(1): 66-79.
Myers, S. C. and R. G. Rajan (1998). "The paradox of liquidity." The quarterly journal of economics 113(3): 733-771.
Opler, T., et al. (1999). "The determinants and implications of corporate cash holdings." Journal of Financial Economics 52(1): 3-46.
Perotti, E. C. and K. E. Spier (1993). "Capital structure as a bargaining tool: The role of leverage in contract renegotiation." The American Economic Review: 1131-1141.
Pinkowitz, L., et al. (2006). "Does the contribution of corporate cash holdings and dividends to firm value depend on governance? A cross‐ country analysis." The journal of Finance 61(6): 2725-2751.
Porta, R. L., et al. (1998). "Law and finance." Journal of political economy 106(6): 1113-1155.
Ramirez, A. and S. Tadesse (2009). "Corporate cash holdings, uncertainty avoidance, and the multinationality of firms." International Business Review 18(4): 387-403.
Shao, L., et al. (2010). "National culture and dividend policy." Journal of International Business Studies 41(8): 1391-1414.
Shao, L., et al. (2013). "National culture and corporate investment." Journal of International Business Studies 44(7): 745-763.
Shleifer, A. and R. W. Vishny (1993). "Corruption." The quarterly journal of economics 108(3): 599-617.
Shleifer, A. and R. W. Vishny (1994). "Politicians and firms." The quarterly journal of economics 109(4): 995-1025.
Smith, J. D. (2016). "US political corruption and firm financial policies." Journal of Financial Economics 121(2): 350-367.
Stulz, R. M. (2005). "The limits of financial globalization." The journal of Finance 60(4): 1595-1638.
Svensson, J. (2003). "Who must pay bribes and how much? Evidence from a cross section of firms." The quarterly journal of economics 118(1): 207-230.
Tanzi, V. (1998). Corruption around the world: Causes, consequences, scope, and cures. Staff Papers, 45(4), 559-594.
Tahoun, A. (2014). "The role of stock ownership by US members of Congress on the market for political favors." Journal of Financial Economics 111(1): 86-110.
46

Zheng, X., et al. (2013). "Collectivism and corruption in bank lending." Journal of International Business Studies 44(4): 363-390.Toke S. Aidt; Corruption, institutions, and economic development, Oxford Review of Economic Policy, Volume 25, Issue 2, 1 July 2009, Pages 271–291, https://doi.org/10.1093/oxrep/grp012
47