potential use of real-time information for flood … use of real-time information for flood...
TRANSCRIPT

i
Potential Use of Real-time Information for Flood Operation Rules for Folsom Reservoir
By
Katherine M. Maher B.S. (University of California, Davis) 2008
THESIS
Submitted in partial satisfaction of the
Requirements for the degree of
MASTER OF SCIENCE
In
Civil Engineering
in the
OFFICE OF GRADUATE STUDIES
of the
UNIVERSITY OF CALIFORNIA, DAVIS
Approved:
________________________________
Jay Lund, Chair
________________________________
Fabian Bombardelli
________________________________ Beth Faber
Committee in Charge
2011

ii
Abstract
This study evaluates the potential benefits of variable index rule curves that incorporate current precipitation, snowpack and climate data into the operation of Folsom Reservoir in the American River watershed. Over 100 synthetic flood hydrographs generated from seven historic flood events are used to assess each rule curve’s flood management performance, and water supply performance is evaluated over 53 water years in the period of record. Trade-offs between flood control and water supply are analyzed using the probability of levee failure and resulting downstream flooding, and estimated water supply loss (spill) and the probability of refill. Three types of variable rule curves were evaluated. The first type of alternative rule curve used a precipitation-based index (Type P curves); the second type used a precipitation index and a snowpack index (Type S curves); and the third type combined precipitation, snowpack and ENSO indices (Type N curves). In general, Type P curves were found to improve water supply benefits while maintaining or reducing flood risk. Type P curves with lower precipitation index ranges performed better for flood management while those with higher ranges performed better for water supply. Larger flood pool sizes functioned best in balancing water supply and flood management performance (variable rule curves with size ranges of 400-600 TAF, 450-650 TAF, or 300-700 TAF, and fixed curves of 400 TAF to 600 TAF). Adjusting the precipitation index during the refill period using normalized snowpack data to produce Type S curves generated small but noticeable improvements in refill, and minor improvements in expected annual spill. Adjusting Type S curves using an ENSO index provided no clear flood management or water supply benefit. Type N curves did not change the probability of a devastating flood, or at most slightly reduced flood risk, while providing at most only slight water supply benefits.
iii
Table of Contents 1.0 Introduction ........................................................................................................................................... 1
2.0 Background ............................................................................................................................................ 2
2.1 Basin Hydrology .................................................................................................................................. 7
2.2 Reservoir Operation Literature Review ............................................................................................ 10
3. 0 Data and Methods ............................................................................................................................... 12
3.1 Developing Rule Curve Indices .......................................................................................................... 13
3.1.1 Precipitation Index ..................................................................................................................... 13
3.1.2 Snowpack Index .......................................................................................................................... 14
3.1.3 ENSO Index ................................................................................................................................. 15
3.2 Developing Sets of Rule Curves......................................................................................................... 16
3.2.1 Fixed rule curves ........................................................................................................................ 16
3.2.2 Index-based rule curves ............................................................................................................. 16
3.3 Representative Floods for Folsom Reservoir .................................................................................... 18
3.3.1 Historical flood hydrographs ..................................................................................................... 18
3.3.2 Synthetic flood hydrographs ..................................................................................................... 18
3.4 ResSim Model ................................................................................................................................... 19
3.5 Rule Curve Evaluation ...................................................................................................................... 20
3.5.1 Flood performance .................................................................................................................... 21
3.5.2 Water supply performance ....................................................................................................... 22
4.0 Results .................................................................................................................................................. 24
4.1 Fixed Rule Curve Evaluation ............................................................................................................. 24
4.2 Type P Curve Assessment................................................................................................................. 26
4.2.1 Flood evaluation ......................................................................................................................... 26
4.2.2 Water supply performance ....................................................................................................... 31
4.3 Type S Curve Assessment ................................................................................................................. 38
4.4 Type N Curve Assessment ................................................................................................................ 41
4.5 Combined Flood and Water Supply Performance ........................................................................... 42
5.0 Discussion ............................................................................................................................................ 47
6.0 Conclusions .......................................................................................................................................... 49
7.0 Future Studies ...................................................................................................................................... 51
8.0 References ........................................................................................................................................... 53

iv
APPENDIX A. Historical Floods .................................................................................................................. 56
APPENDIX B. Synthetic Floods .................................................................................................................. 60
APPENDIX C. Summary of Rule Curve Characteristics and Results .......................................................... 63
APPENDIX D. Late Season Flood Analysis ................................................................................................. 71
List of Figures Figure 1. Folsom Dam 1956 flood control diagram. (USACE 1956) ............................................................. 4
Figure 2. Folsom Dam 1977 flood control diagram. (USACE 1977) ............................................................. 5
Figure 3. Folsom Dam 1986 flood control diagram. (USACE 1986) .............................................................. 6
Figure 4. SAFCA flood control diagram. (USACE 2004) ................................................................................. 6
Figure 5. Total Folsom Reservoir release capacity for existing conditions and with new spillway. ............ 7
Figure 6. Map of America River watershed. ................................................................................................ 8
Figure 7. One-day and three-day peak annual Folsom Inflow and their ENSO conditions measured by the
Oceanic Niño Index (ONI). ............................................................................................................................. 9
Figure 8. Precipitation index. ..................................................................................................................... 13
Figure 9. NINO 3.4 region sea surface temperature anomalies. ................................................................ 15
Figure 10. Example of index-based flood rule curve. ................................................................................. 17
Figure 11. General form of an index based flood rule curve. .................................................................... 17
Figure 12. Folsom Reservoir one-day, three-day and seven-day inflow frequency curve. ....................... 20
Figure 13. The probability that levees will fail and a devastating flood will occur. ................................... 21
Figure 14. Probability of spill. ..................................................................................................................... 22
Figure 15. Folsom Reservoir storage elevations for fixed, Type P, Type S and Type N rule curves. .......... 26
Figure 16. Reservoir elevation, inflow and outflow for precipitation index rule curve P65 as the rule
curve responds to changes in the precipitation index. ............................................................................... 29
Figure 17. Precipitation index rule curve shapes, P34 and P39, for 300-700 TAF variable flood pool. ..... 30
Figure 18. Releases from Folsom Reservoir for fixed, Type P, Type S and Type N rule curves. ................. 31
Figure 19. Comparison of All Flood Pool and No Flood Pool reservoir outflow over 10-Year period. ...... 32
Figure 20. Refill of Folsom Reservoir based on fixed, Type P, Type S, and Type N rule curves. ................ 33
Figure 21. Refill of Folsom Reservoir based on variations of same precipitation index rule curve (P5) with
different refill dates. ................................................................................................................................... 35
Figure 22. Expanded view of Figure 21 showing detail of refill performance for variations of precipitation
index rule curve P5. .................................................................................................................................... 35
Figure 23. March 15th and April 15th late season flood reservoir inflows, elevations and outflows (P65).36
Figure 24. Type S curve variations using base precipitation index curve P65. ........................................... 40
Figure 25. Expanded view of Type S curve variations using base precipitation index curve P65. ............. 40
Figure 26. Folsom Reservoir refill risk compared to probability of devastating flood............................... 43
Figure 27. Expanded view of lower right quadrant, Folsom Reservoir refill risk compared to probability
of devastating flood. ................................................................................................................................... 43
Figure 28. Annual expected spill for Folsom Reservoir compared to probability of devastating flood. .... 45

v
Figure 29. Expanded view of lower left quadrant, annual expected spill for Folsom Reservoir compared
to probability of devastating flood. ............................................................................................................ 45
Figure 30. Comparisons of annual expected spill and probability of devastating flood for current size of
Folsom Reservoir and for reservoir enlarged by 200,000 AF...................................................................... 46
Figure 31. Overall least-cost operating rule for different ranges of flood damage consequence and
economic loss from spilled water. .............................................................................................................. 49
List of Tables Table 1. Precipitation and snow gage data. ................................................................................................ 14
Table 2. Examples of snowpack index assignment based on ranges of normalized snowpack. ................ 15
Table 3. ENSO index assignment based on ENSO classification. ................................................................ 16
Table 4. List of historical flood event shapes used to create synthetic flood events. ................................ 18
Table 5. Summary of results for fixed rule curves. .................................................................................... 25
Table 6. Selected precipitation index (Type P) rule curves, 400-600 TAF variable flood pool. ................. 27
Table 7. Selected precipitation index (Type P) rule curves, 300-700 TAF variable flood pool. .................. 28
Table 8. Precipitation index rule curves using similar refill criteria and different ranges of flood pool size.
.................................................................................................................................................................... 37
Table 9. Selected precipitation-snow index (Type S) curves. ..................................................................... 39
Table 10. Selected precipitation-snow-ENSO index (Type N) curves. ........................................................ 41

1
1.0 Introduction
Reservoir rule curves guide reservoir operations by setting target reservoir elevations throughout the year. In multipurpose reservoirs, the rule curve represents the compromise between different objectives such as flood control and water supply. A reservoir flood pool is traditionally sized based on the record of peak flows that occurred during the historical record. The record of annual peak flows is used to create a flood frequency curve and to estimate the flood magnitude that occurs with a specified frequency (e.g. once in 100 years, or the flood magnitude with a 1% chance of exceedance) (USACE 2002). A flood pool can then be designed to safely pass a certain size flood through the reservoir without downstream flooding, providing a target level of flood protection. This fixed rule curve method does not account for current conditions in the watershed, and the effects of basin and climate conditions on the near-term flood frequency curve. A storm occurring on a dry basin will cause a smaller flood than the same storm falling on a saturated basin. Thus, a dry basin will reduce the likelihood of large flows and shift the flood frequency curve lower (assuming inflows are plotted on the vertical axis), while a wet basin will shift the flood frequency curve higher. As basin conditions change, a fixed flood pool size does not necessarily provide the same level of protection in every year or for the entire flood season. Flood protection can potentially be improved by incorporating seasonal data into flood operations. This may also increase the probability of refill without a corresponding increase in flood risk, allowing the reservoir to have a smaller flood pool and refill earlier in dry years when flood potential is low and a larger flood pool and later refill when flood potential is high. In addition to using rule curves which change with basin conditions, adaptive reservoir operations can be carried one step further by making advance releases in response to short-term weather forecasts, such as a 3-day or 5-day storm forecast. Advance releases can be considered only if the reservoir and downstream channels have sufficient capacity to accommodate the increased flow, and making advance releases involves additional refill risk if the forecasted weather does not occur (USACE 2002). Reservoir operation consists of a series of decisions on whether to hold or release water. Decisions made in advance of the flood season include the flood pool size, which determines readiness, and during a flood, real-time time decisions are made about whether to store or release water. Water supply and flood control are, to some extent, conflicting goals. For water supply, operations should keep the reservoir as full as possible and for flood control, operations should keep the reservoir empty to be available to capture flood peaks floods (USACE, 2002). A rule curve can be established to optimize tradeoffs and balance risks in operational decisions. For example, in most years, snow melt begins before the end of the flood season, and a rule curve can help balance refill risk with the risk of a large late season flood. Folsom Dam and Reservoir in the American River watershed provides an opportunity to analyze the potential flood control and water supply benefits of using field condition-based rule curves. Construction is currently being completed to increase the release capacity of the reservoir. This increased outlet capacity improves the potential for flexible releases to respond to real-time conditions in the watershed and climate conditions as well as greater potential for advance releases in response to flood forecasts. This study focuses specifically on development and comparison of alternative rule curves that incorporate current precipitation, snowpack and climate data to determine if flood management performance can be improved while maintaining water supply benefits.

2
Background is provided on the history of Folsom Dam rule curves, American River basin hydrology, and current reservoir operations literature. Data and methods are presented for developing and analyzing three types of index-based rule curves: (1) a precipitation-based index curve (Type P curve); (2) a precipitation-based index curve modified by a snowpack index (Type S curve); and (3) a rule curve modified by combined precipitation, snowpack and ENSO indices (Type N curve). To include more severe and rare storms than are available in the WY1956-WY2008 historical record, a set of 100 synthetic flood hydrographs with recurrence intervals ranging from 50 years to 5,000 years was developed from seven historic flood hydrographs. For Type P curves, the effects of precipitation index range and refill criteria are explored, including a late season flood analysis. Through this sensitivity testing, promising Type P curves are selected and further modified to include a snowpack index (Type S curves); the most promising Type S curves are further modified to include an ENSO index (Type N curves).
For each curve, flood control performance is analyzed by calculating the probability of a devastating flood, including the probability of downstream flows exceeding 115,000 cfs (the historical maximum channel flow) and exceeding 160,000 cfs (the design channel flow). Water supply performance is analyzed by calculating the expected annual spill and the probability of refill. Trade-offs between flood control and water supply performance are presented by comparing the probability of devastating flood to expected annual spill and to probability of refill. These results support conclusions about the value of Type P, Type S and Type N index curves compared to fixed curves and the incremental benefit of enhancing a precipitation index curve with real-time snowpack and ENSO data.

3
2.0 Background Folsom Dam was built by the U. S. Army Corps of Engineers (USACE) and completed in 1956. It is operated by the U.S. Bureau of Reclamation (USBR) as part of the Central Valley Project. The dam is on the American River, approximately 26 miles upstream of its confluence with the Sacramento River. Folsom Lake, with a 966,000 acre-foot (AF) capacity, is the main storage and flood control reservoir on the American River. In addition to providing flood protection to the Sacramento area, Folsom Lake is operated for water supply, hydropower, and environmental mitigation. At the time of construction, Folsom Dam was thought to provide more than 100-year flood protection. However, additional years of hydrologic record, including the record floods of 1955, 1964, 1986 and 1997, have changed the 100-year flood estimate over time (USACE 1986). The original 1956 flood control rule curve for Folsom Dam called for a flood space of 200-400 thousand acre-feet (TAF) based on precipitation and floods in the basin over the preceding 60 days (Figure 1). Drawdown was initiated on October 1 and completed by November 1. Refill was initiated on April 1, and the required flood pool was decreased at a constant rate of 180 TAF per month. For example, if the reservoir had been drawn down during the flood season to a maximum storage level of 340 TAF (parameter value = 15) based on antecedent precipitation in the watershed, the rule curve allowed refill to begin on April 1 and to proceed at a constant rate until the reservoir was full by June 1, if runoff was sufficient. In 1977, the USACE updated the Folsom flood control rule curve to increase flood space to a fixed 400 TAF during the flood season, beginning drawdown on October 1 and completing drawdown by November 15 (Figure 2). The new rule curve allowed spring refill to begin as early as January 1, based on an antecedent precipitation parameter, with the initial refill rate between January 1 and March 20 depending on the value of the parameter. For example, in a dry year, if the parameter had a value of 8 or less, refill was allowed to increase at a rate of 80 TAF per month until March 20. In a wetter year, if the parameter had a value of 14, refill was initiated at a slower rate of 20 TAF per month prior until March 20. After March 20, regardless of precipitation conditions during the flood season, refill was allowed at a constant rate of 160 TAF per month to the end of the refill period. This rule curve resulted in refill being completed sometime between May 1 and June 7, depending on the type of precipitation year prior to January 1. The record flood of February 1986 emphasized the need for maximum flood space later in the season, and a new, more conservative rule curve was developed to extend the time during which the flood pool was kept at full 400 TAF drawdown (Figure 3). Instead of refill beginning as early as January 1, a more conservative refill date of February 15 was selected. The initial refill rate still ranged up to 80 TAF per month based on the antecedent precipitation parameter, but depending on this parameter value, the initial refill rate could extend as late as April 20 before transitioning to the higher rate of 160 TAF per month. Regardless of parameter value, the refill period concluded by June 1. In 1994, USBR agreed to adopt a new Folsom rule curve developed by the Sacramento Area Flood Control Agency, (SAFCA) which increased flood control space up to 670 TAF based on available storage space in three upstream reservoirs (Figure 4). The drawdown period for Folsom Reservoir has been lengthened to two full months (October 1 to December 1), and refill is initiated on March 1, regardless of the depth of flood pool developed during the flood season. Refill proceeds at a constant rate, with all curves targeting flood pool storage of 225 TAF on April 22. Thereafter, refill proceeds at a rate of approximately 175 TAF per month until the refill period ends on June 1.

4
A major concern for flood protection has been Folsom’s limited release capacity and downstream channel capacity. Folsom Dam has a release capacity of approximately 33,000 cubic feet per second (cfs) until the reservoir fills to the level of the spillway. The current spillway isn’t reached until the flood pool is about 45% filled, so the downstream channel capacity of 115,000 cfs cannot be fully used until the flood storage space has been half expended. Work is currently underway for a new spillway 49 feet lower than the existing spillway, which would allow operators to increase releases earlier during larger floods (Figure 5). Downstream levees also have been raised and reinforced to increase channel capacity to 160,000 cfs. With greater capability to empty the flood pool quickly, the upstream storage parameters used in the existing rule curves may become less significant as the reservoir is more capable of passing the initial flood hydrograph. A range of potential parameters should be explored to develop the most effective rule curves and optimize Folsom Reservoir operation.
Figure 1. Folsom Dam 1956 flood control diagram. (USACE 1956)

5
Figure 2. Folsom Dam 1977 flood control diagram. (USACE 1977)

6
Figure 3. Folsom Dam 1986 flood control diagram. (USACE 1986)
Figure 4. SAFCA flood control diagram. (USACE 2004)

7
Figure 5. Total Folsom Reservoir release capacity for existing conditions and with new spillway. 2.1 Basin Hydrology The American River basin above Folsom Dam drains approximately 1,872 square miles, with elevations ranging from 200 to 10,400 feet (Figure 6). The annual weather pattern has distinct wet and dry seasons, with about 90% of precipitation falling between November and April. Annual precipitation throughout the basin ranges from roughly 20 to 70 inches, with an average of about 53 inches for the drainage area above Folsom dam. Precipitation generally falls as rain up to the 5,000 foot elevation, and falls mostly as snow above that elevation (USACE 1986). Based on the General Circulation Model of the Canadian Center for Climate Modeling and Analysis, future increases in green house gas (CO2) emissions will lead to a wetter and more variable climate in Central California (Yao and Georgakakos, 2001). Climate change is likely to significantly affect the basin’s hydrology as warming trends decreases the fraction of precipitation falling as snow, reducing snowpack storage and increasing winter runoff volume (Knowles et al. 2006, Regonda et al. 2005).
200
250
300
350
400
450
500
0 200,000 400,000 600,000 800,000 1,000,000
Re
serv
oir
Ele
vati
on
(ft
)
Total Folsom Release Capacity (cfs)
Release Capacity with New Spillway
Existing Release Capacity

8
Figure 6. Map of America River watershed. Climate variability from El Niño-Southern Oscillation (ENSO) events affect temperature, precipitation, and streamflow patterns in the western United States (Mo and Higgins 1997, Cayan et al., 1999). In California, heavier rainfall is more likely in ENSO years characterized by significantly warmer water in the Pacific Ocean extending to about 150oE to 160oE (i.e. warm ENSO phase or “El Niño” years). More precipitation and slightly warmer temperatures during El Niño years contribute to increased runoff from winter to early spring in the Sacramento-San Joaquin basin (Leung et al., 2002). However, the influence of warm ENSO phase was found to vary by region of the State, and was weakest in northern California (Schonher and Nicholson, 1989). On the windward side of the Sierra in northern California, anomalies of temperature and precipitation are amplified under both El Niño (warm ENSO) and La Niña (cold ENSO) conditions (Leung et al., 2002). In the foothills of the American River watershed, nearly all extremely wet years and 60% of years classified as wet have occurred in warm ENSO years. However, rainfall in the higher elevations of the American River watershed (central Sierra Nevada) did not appear to be tied to warm ENSO conditions (Schonher and Nicholson, 1989). The relationship between ENSO signals and streamflows is not fully reliable, and may be influenced by a wide range of atmospheric, oceanic, and hydrometeorological factors (Wernstedt and Hersh, 2002). The relationship between ENSO signals and Folsom Reservoir flood events was further analyzed by plotting the Oceanic Niño Index (ONI) against Folsom Reservoir flood inflows. The ONI is the 3-month running mean of sea surface temperature anomalies within the NINO 3.4 area of the Pacific Ocean. ONI values of -0.5 to +0.5 are considered to be ENSO-neutral, while values above +0.5 are considered to reflect warm ENSO (El Niño), and values below -0.5 are considered to reflect cold ENSO (La Niña). To meet the National Oceanic and Atmospheric Association’s definition of an El Niño episode, the ONI must remain above the 0.5 threshold for at least five consecutive months. To meet the definition of a La Niña episode, the ONI must remain below the -0.5 threshold for at least five months. For example, beginning in August 2010 the ONI decreased from -0.6 to -1.4 through early 2011, resulting in current climate

9
conditions being classified as La Niña. A plot of ONI compared to historical peak 1-day and 3-day inflows to Folsom Reservoir shows that the largest flood events have occurred under La Niña or neutral conditions (Figure 7). The American River high flow events of 1986 and 1997 are consistent with work showing that heavy precipitation has occurred during many non-ENSO (neutral) winters (Mo and Higgins, 1997). The largest fraction of extreme events over the West Coast as a whole occurred in neutral winters just prior to the onset of El Niño, and both the 1986 and 1997 events fit this pattern. These neutral winters showed different sea surface temperatures (SST), circulation and precipitation anomaly patterns than other neutral winters (Higgins et al., 1999).
Figure 7. One-day and three-day peak annual Folsom Inflow and their ENSO conditions measured by the Oceanic Niño Index (ONI). [Data for figure from National Weather Service, Climate Prediction Center, http://www.cpc.ncep.noaa.gov] Apart from ENSO considerations, extreme events in the American River watershed may be influenced by intra-seasonal patterns of mid-latitude cyclones in the tropical Pacific that draw water vapor and warm air into a low-level atmospheric jet headed to the West Coast, a pattern often referred to as the “pineapple express” (Higgins et al., 2000; Dettinger et al., 2011). If adequate linkage can be demonstrated, then long-lead forecasts may be a useful tool in predicting precipitation seasons that are likely to produce large flood events. Above-normal rainfall in California was shown to be closely linked to a pattern of suppressed precipitation in the subtropical eastern Pacific Ocean along with enhanced convection in the central Pacific by Mo and Higgins (1997). The location of extreme events in various regions of the West Coast was also tied to specific locations of enhanced tropical convection in the western Pacific Ocean, with enhanced tropical convection at 120oE corresponding to extreme events in the Pacific Northwest, and enhanced tropical convection at 170oE corresponding to extreme events in Southern California (Mo and Higgins, 1997). The frequency of extreme precipitation events was also shown to increase when tropical activity associated with the Madden-Julian oscillation, a measure of large-scale tropical seasonal variability, is high (Jones, 2000).
10
In recent years, improvements in satellite technology have allowed closer observation and analysis of the low-level atmospheric jets that drive warm, moist air from the tropics near Hawaii northeastward into California (Dettinger et al., 2011). It has become apparent that “pineapple express” storms are a subset of a general phenomenon called atmospheric rivers, and that storms produced by this phenomenon are the source of California’s largest floods (Dettinger, 2011). When the narrow low-level jets of moist air, sometimes only a few kilometers wide, reach the Sierra mountain range, orographic uplift causes intense precipitation. These warmer storms of tropical origin result in higher snowlines and more precipitation in the basin falling as rain. The January 1997 storm that produced record high flows on the American River and record inflows to Folsom Reservoir is an example of a storm produced by an atmospheric river (Dettinger, 2011). Dettinger et al. (2011) showed that the landfall of atmospheric rivers anywhere on the West Coast contributed between 30% and 45% of all precipitation in central and northern California for water years 1998 through 2008. Thus, the intra-seasonal occurrence of atmospheric rivers is significant for both water supply and flood control. Dettinger (2011) further showed that with future climate change, the number of years with extreme atmospheric river storm seasons (outside the historical range) is projected to increase. Analysis of precipitation produced by “pineapple express” storms and ENSO by Dettinger et al. (2011) showed no statistically significant correlation in northern California, which may be because this area is a transition zone between the Pacific Northwest and Southern California ENSO regions. However, correlation studies indicate that precipitation produced by these storms in central and northern California may be connected to cooler-than-normal sea surface temperatures in the western Pacific and Indian Oceans at the beginning of the water year (Dettinger, 2011). This suggests the possibility of being able to use long-lead forecasts to predict a precipitation season in the American River watershed that is likely to be influenced by atmospheric rivers, and particularly by “pineapple express” storms. 2.2 Reservoir Operation Literature Review Reservoir operation is typically a complex water management problem due to (1) the stochastic nature of streamflows, (2) multiple reservoir purposes, and (3) the dynamic nature of operational decision-making as facility conditions, hydrologic forecasts and demand forecasts change (Liu et al., 2011). In California, the stakes in reservoir operation are high because California has a large variation in annual precipitation and streamflow totals. Most of California’s annual precipitation occurs in an unusually small average number of wet days (5 to 15 days) (Dettinger et al., 2011). Foregoing opportunities to store inflows in northern and central California reservoirs to minimize downstream flood control risks can have serious water supply consequences for the entire State, as well as impacts to hydropower generation, recreation, environmental flows and other purposes. Long-term reservoir operation rules specify target storage levels and releases during the pre-flood or drawdown season, the main flood season, and the post-flood or refill season, with seasons generally defined by the historical occurrence of peak flows in the watershed (Liu et al., 2011). Operational studies use the historical record, including major historical droughts and floods, and synthetic floods to establish operating rules (Lund and Guzman, 1996). The rules for multipurpose reservoirs strive to optimize multiple objectives. For example, water supply shortages may be minimized by developing rule curves that minimizes uncontrolled or unproductive spills and maximize likelihood for reservoir refill. Other objectives may include minimizing flood damages by allowing sufficient flood storage space before, during and after the flood season, and maximizing hydropower production by minimizing releases that do not flow through turbines (energy “spill”).

11
A simulation-based approach for developing reservoir operating rules is used because it takes into account the detailed characteristics of watershed hydrology, facilities, regulatory requirements, downstream conditions and demands and other factors (Liu et al, 2011). Currently, most large reservoir systems use one or more simulation models for addressing long-term, seasonal, and real-time operating problems (Lund and Guzman, 1996). However, deterministic optimization models using linear or non-linear programming or other methods can also help identify promising operating rules and improve effective use of simulation models (Lund and Ferreira, 1996; Lund and Guzman, 1996). Modern simulation models may employ intelligent algorithms, including genetic algorithms, to improve the efficiency of intensive simulation techniques necessary to derive rule curves (Chang et al., 2005; Field 2007; Liu et al., 2011). In practice, many rules are based on empirical or experimental successes from a combination of simulation and optimization modeling, as well as from actual operational performance (Lund and Guzman, 1999). Reservoir operating rules are developed to provide general guidance for long-term operations, but may incorporate short-term seasonal or real-time conditions to improve operational performance. Several large flood control reservoirs in northern California are currently using seasonal parameter-based flood rule curves. The flood rule curve for Oroville Reservoir on the Feather River relies on an antecedent precipitation index (API), which is calculated by adding the current day’s average basin precipitation to 97% of the previous day’s index value. Shasta Reservoir, on the Sacramento River, uses a rule curve dependent on an antecedent inflow index. Similar to API used for Oroville, this index is calculated by adding the average of the current day’s inflow to 95% of the previous day’s index value. Willis et al. (2011) compared the performance of the dynamic flood control rule curves used for Shasta Reservoir and Oroville Reservoir with the static flood rule curve at New Bullards Bar Reservoir under various climate change scenarios. The dynamic flood rule curves performed better than static flood rule curves, as the dynamic rule curves allowed for flexible drawdown and refill requirements in response to changes in hydrologic conditions and inflow timing. While basin wetness indicators provide information about how basin runoff would respond to a large storm, climate indicators can provide an indication of the likelihood of large storms. Several studies have found that incorporating climate information improved seasonal inflow forecasts over forecasts without climate data (Carpenter and Georgakakos 2001, Graham et al. 2006). Reservoir operation models that quantify inflow forecast uncertainty using forecast ensembles are particularly useful. A study of Folsom reservoir operations by Yao and Georgakakos (2001) found that incorporating such ensembles into dynamic flood control operations greatly improved reservoir management. The adaptive management enabled by using this information was found to be effective in mitigating the effects of climate change. This result was confirmed by a generalized analysis of multipurpose reservoir operation using inflow forecast ensembles for a hypothetical climate system with somewhat predictable low-frequency variability, and taking into account climatic and demand changes (Graham and Georgakakos, 2010). Based on this analysis, tolerance for low forecast reliability may be greater in operating larger reservoirs compared to smaller reservoirs. As reservoir capacity increases relative to mean annual inflows, fluctuations in volume are less constrained, and releases can be optimized to meet downstream demand with reduced spill (Hazen 1914). Reliable inflow forecasts are most useful for mid-range reservoir capacities such as Folsom Reservoir. A study of reservoir operations in the Philippines compared the use of beginning-of-season forecasts to monthly flood forecasts in making forecast-based allocations, and showed that updating forecasts monthly can improve reservoir operation (Sankarasubramanian et al. 2009). In wet years, updating

12
forecasts monthly reduced the risk of spill and in dry years, reduced the risk of not meeting end of season (refill) targets. Work by Georgakakos and Graham (2008) on Folsom Reservoir in the American River watershed found that the highest expected deviations from the target volume are for a seasonal inflow uncertainty range that is about equal to the reservoir capacity, or for target volumes near zero or near the reservoir capacity. Based on typical ensemble monthly inflow forecasts for Folsom Reservoir, in months with a higher-than-average range of ensemble inflows, the prediction uncertainty may be too high to be useful for monthly management involving target volumes, and a shorter time interval for management may be necessary. Lee et al. (2009) examined incorporating the effects of systematic warming in the design of flood rule curves for multi-objective reservoirs in the Columbia River System. The analysis used an optimization model that incorporated only flood control and refill penalty function conditions to optimize flood curves. The study found that system storage deficits could be decreased without increasing flood risks using the optimized rule curve compared to the existing rule curve. A subsequent study by Lee et al. (2010) also focused on the Columbia River system, developed ENSO-conditioned flood rule curves by examining the optimized rule curves for different ENSO classifications. The penalty functions developed in Lee et al. (2009) were calibrated using flood frequency curves for each ENSO state. The ENSO-conditioned flood control curves were found to reduce system-wide storage deficits by 55%, 40% and 52% in warm, neutral, and cool ENSO years without corresponding increases in flood risk. As noted earlier, the effect of ENSO on American River basin hydrology appears to be more variable and less pronounced than its effect on hydrology in the Pacific Northwest.

13
3. 0 Data and Methods The goal of this study is to develop and compare alternative rule curves incorporating current climate and watershed data for Folsom Reservoir and to analyze their performance for flood control and water supply. Three types of alternative rule curves were developed using different types of current data. The first type of alternative rule curve used a precipitation-based index (Type P curves); the second type used a precipitation index and a snowpack index (Type S curves); and the third type combined precipitation, snowpack and ENSO indices (Type N curves). Each of these index components of seasonal data could influence the shape of the reservoir rule curve. The precipitation and the ENSO index components could influence the shape and extent of reservoir drawdown during the winter season, while any of the three indices could influence refill. 3.1 Developing Rule Curve Indices 3.1.1 Precipitation Index To incorporate current watershed conditions into the rule curve, a precipitation index was developed using antecedent precipitation (Figure 8). The precipitation-based wetness index consists of a daily computation that sums up the current day’s precipitation plus some percentage of the previous day’s index value: Index(t) = Index(t-1)*97% + Today’s Precipitation The precipitation index value gives an indication of how the basin would respond if a large rainfall were to occur. High index values represent a wet, or saturated, basin while low index values represent a dry basin. Precipitation data from gages located at Blue Canyon, Georgetown and Pacific House was provided by the USACE and used to derive the precipitation index (Table 1).
Figure 8. Precipitation index. The precipitation index was incorporated into reservoir operation rules by shifting to a lower target reservoir storage (larger flood pool) if the index value was higher (indicating a wetter basin with greater
0
5
10
15
20
25
30
35
Pre
cip
itat
ion
Ind
ex

14
potential for high peak inflows), or shifting to a higher target storage if the index value was lower (indicating a drier basin with less potential for high peak inflows), as described in Section 3.2. If a calculated precipitation index value fell between the indices assigned to the higher and lower curves, then a target storage level was linearly interpolated. Table 1. Precipitation and snow gage data.
Station Name Data Type ID Elev (ft)
Lat (°N)
Long (°W)
Operator
Blue Canyon Precipitation BLC 5280 39.276 120.708 US Bureau of Reclamation
Georgetown Precipitation GTW 3250 38.925 120.789 US Bureau of Reclamation
Pacific House Precipitation PFH 3440 38.760 120.500 US Bureau of Reclamation
Lost Corner Mountain Snow Course LCR 7500 39.017 120.215 Sacramento Municipal Utility District
Onion Creek Snow Course ONN 6100 39.275 120.358 Central Sierra Snow Lab
Wabena Meadows Snow Course WBM 6300 39.227 120.402 Placer County Water Agency
Caples Lake Snow Course CAP 8000 38.710 120.042 El Dorado Irrigation District
Huysink Snow Course HYS 6600 39.282 120.527 Tahoe National Forest Headquarters
Lower Carson Pass Snow Course LCP 8400 38.693 119.998 El Dorado Irrigation District
Lyons Creek Snow Course LYN 6700 38.812 120.243 CA Dept of Water Resources
Phillips Snow Course PHL 6800 38.818 120.072 CA Dept of Water Resources
Tamarack Flat Snow Course TMF 6550 38.807 120.103 CA Dept of Water Resources
Upper Carson Pass Snow Course UCP 8500 38.695 119.983 El Dorado Irrigation District
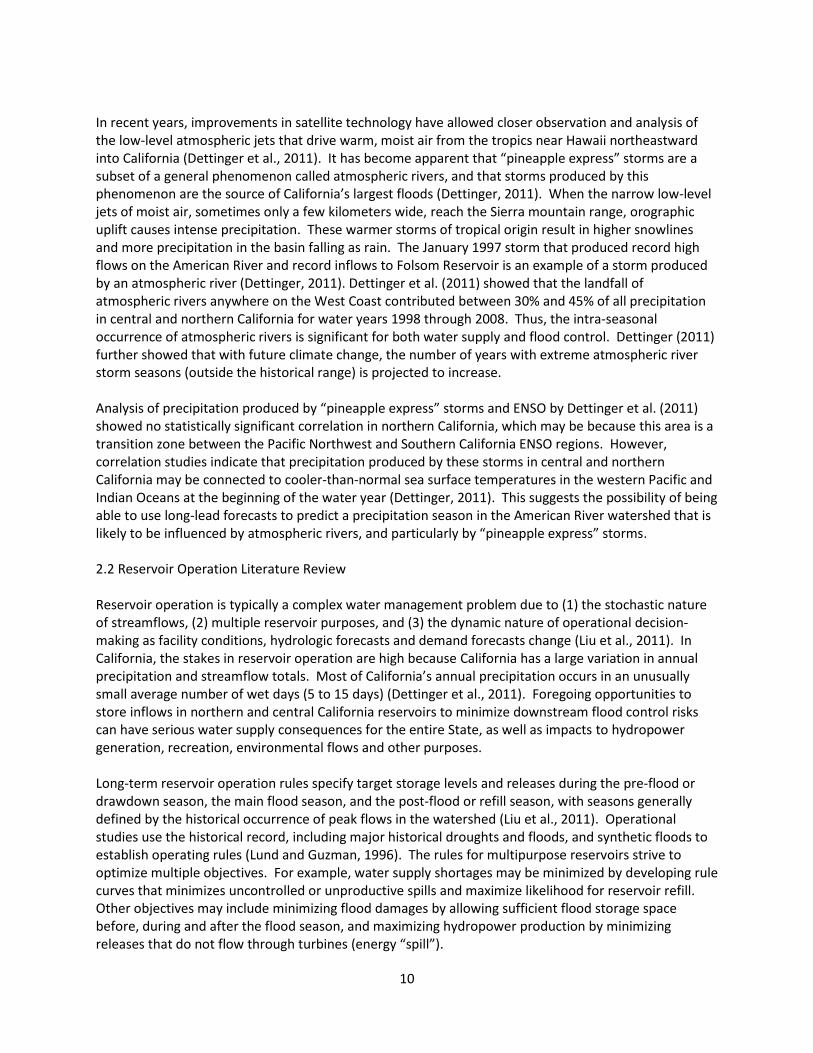
3.1.2 Snowpack Index A snowpack index was created using monthly data from ten snow courses in the basin (Table 1). The snow water content data were normalized for each gage by dividing the monthly value by the mean snow water content for each month. Normalizing the data gives each gage equal weight in developing the index, regardless of the gage’s elevation in the watershed. The normalized data for all gages were then averaged for each month from February through May. Snowpack indices were incorporated into reservoir operation rules by using them to adjust values of precipitation indices during the refill period. When snowpack conditions are below normal, the rule curve is shifted to a higher elevation (lower index value) to allow the reservoir to store more runoff earlier in the refill season. When snowpack is above normal, no changes are made to the rule curve since snowmelt runoff has historically not produced significant flooding in the American River basin. Several different methods of using normalized snowpack data to make this adjustment were evaluated. One method assigned snowpack indices to ranges of snowpack conditions, and then decreased the precipitation index by a whole number depending on the value of the snowpack index (Table 2). Another type of adjustment decreased the precipitation index by a percentage instead of a whole number.
15
Table 2. Examples of snowpack index assignment based on ranges of normalized snowpack.
Normalized Snowpack
(% of average)
Precipitation Index Decreased By Snowpack Index Value:
Whole number,
Alt. Range 1
Whole number,
Alt. Range 2
Percentage, Alt. Range 3
Percentage, Alt. Range 4
0 to 25 4 8 20% 50%
>25 to 50 3 6 15% 40%
>50 to 75 2 4 10% 30%
>75 to 100 1 2 0 20%
>100 0 0 0 0
A third method multiplied the precipitation index by the same percentage as the normalized snowpack index (i.e. a “1:1” proportional adjustment). For example, if snowpack was 96% of normal, then the precipitation index was multiplied by 96%. 3.1.3 ENSO Index El Niño conditions are characterized by five consecutive periods of a three-month running mean of sea surface temperature anomalies (SSTA) greater than 0.5 °C within an area of the Pacific known as the NINO 3.4 region. Similarly, La Niña conditions are characterized by five consecutive three-month running averages of SSTA less than - 0.5 °C within the NINO 3.4 region. The NINO 3.4 SSTA value was used in this study to represent ENSO conditions (Figure 9). While the precipitation and snowpack indices point to how the basin would respond if a large flood were to occur, the ENSO index gives an indication of the likelihood of a large flood occurring.
Figure 9. NINO 3.4 region sea surface temperature anomalies. The ENSO index was incorporated into reservoir operations by using it to adjust precipitation indices over the entire year. Any subsequent snowpack index adjustments were then applied during the refill period as described in Section 3.1.2. Four methods of using ENSO classification to assign ENSO indices were evaluated (Table 3). Similar to snowpack indices, two methods were based on using whole numbers to adjust the precipitation index, and two methods were based on using a percentage to adjust the precipitation index.
-3
-2
-1
0
1
2
3
1/1
/19
50
1/1
/19
52
1/1
/19
54
1/1
/19
56
1/1
/19
58
1/1
/19
60
1/1
/19
62
1/1
/19
64
1/1
/19
66
1/1
/19
68
1/1
/19
70
1/1
/19
72
1/1
/19
74
1/1
/19
76
1/1
/19
78
1/1
/19
80
1/1
/19
82
1/1
/19
84
1/1
/19
86
1/1
/19
88
1/1
/19
90
1/1
/19
92
1/1
/19
94
1/1
/19
96
1/1
/19
98
1/1
/20
00
1/1
/20
02
1/1
/20
04
1/1
/20
06
1/1
/20
08
1/1
/20
10
NIN
O 3
.4 S
STA
(de
g C
)
El N
iño
La N
iña

16
Table 3. ENSO index assignment based on ENSO classification.
ENSO Year Classification
Precipitation Index Increased By ENSO Index Value:
Whole number, Range 1
Whole number, Range 2
Percentage, Range 3
Percentage, Range 4
La Niña 1.5 0 10% 25%
Neutral 3 3 20% 50%
El Niño 0 -3 0 0
3.2 Developing Sets of Rule Curves Flood rule curves define the target storage levels in a reservoir at different times during the year based on specific operational capabilities of the reservoir, water resource management objectives, and hydrologic conditions in the watershed. Traditional rule curves based on historical hydrology typically draw down to one target elevation during the winter months. However, index-based rule curves that apply current data have different target reservoir elevations based on the index value. As the index value increases, higher flood potential exists, and the drawdown target elevation decreases (Figure 10). Further research might use the parameters and weights for combinations of precipitation, snowpack, and ENSO indices as decision variables in a genetic algorithm to develop promising optimal combinations of these three indices. 3.2.1 Fixed rule curves Traditional fixed rule curves were evaluated for drawdown targets of 100 TAF to 800 TAF, in 100 TAF increments (total of eight fixed curves). The extreme bookends of reservoir operations were also evaluated, including a drawdown target of zero (keeping the reservoir full during the flood season), and a drawdown target equal to the Inactive Pool (keeping the reservoir empty during the flood season). All rule curves evaluated had fixed seasonal drawdown dates, with seasonal drawdown beginning on October 1st and reaching full drawdown on November 1st. The refill period was also set to begin on March 1st and end on June 1st. 3.2.2 Index-based rule curves Three types of index-based rule curves were examined: a rule curve based on the precipitation index (Type P); a rule curve based on both a precipitation index and a snowpack index (Type S); and a rule curve based on combined precipitation, snowpack and NINO 3.4 SSTA indices (Type N). In Type S and Type N rule curves, the snowpack index was only incorporated during the refill period. For each curve type, variations of index-based rule curves were developed by varying the flood pool size, refill dates and the index value assigned to each curve (Figure 11). All rule curves evaluated had fixed seasonal drawdown dates, with a one-month seasonal drawdown beginning on October 1st and reaching full drawdown on November 1st. A three-month refill period was also set in the initial analyses of all rule curves, beginning on March 1st and ending by June 1st. For rule curves that performed well for flood management, the initial refill period was then varied to explore potential improvements in refill performance.

17
Figure 10. Example of index-based flood rule curve.
Figure 11. General form of an index based flood rule curve.
390
400
410
420
430
440
450
460
470
10/1/2010 12/31/2010 4/1/2011 7/1/2011 9/30/2011
Re
serv
oir
Ele
vati
on
(ft
)
8
12
16
20
6
0
200
400
600
800
1000
1200
10/1/2010 12/1/2010 2/1/2011 4/1/2011 6/1/2011 8/1/2011 10/1/2011
Res
ervo
ir S
tora
ge (T
AF)
End of Refill
Beginning of Refill
Flood Pool Storage

18
3.3 Representative Floods for Folsom Reservoir 3.3.1 Historical flood hydrographs Seven historical flood inflow hydrographs were used to create a set of 100 synthetic flood hydrographs with recurrence intervals ranging from 50 years to 5,000 years. The dates and peak flows of the historical flood hydrographs are listed in Table 4, along with ENSO year classification and the precipitation index three days prior as an indication of antecedent conditions in the watershed. For reference, the flood hydrographs are included in Appendix A. Comparison of these hydrographs with the summary data in Table 4 shows that the January 1997 storm was characterized by a sharp rise in reservoir inflow resulting from an intense storm on a relatively wet basin. The flood inflow hydrograph for the February 1986 storm was relatively wider and lower. Table 4. List of historical flood event shapes used to create synthetic flood events.
Folsom Reservoir Historical Flood Inflow Hydrographs
Date
Instan-taneous
Peak Flow (cfs)
1-Day Peak Flow (cfs)
3-Day Peak Flow (cfs)
ENSO Year Classification
Antecedent Conditions
(precipitation index 3 days prior)
December 23, 1955 219,005 189,600 127,896 La Niña 14.15
February 1, 1963 240,188 182,123 91,017 La Niña 2.91
December 23, 1964 238,300 193,745 124,967 La Niña 9.63
January 13, 1980 111,860 96,971 76,383 Neutral 10.71
February 16, 1982 115,700 98,185 62,744 Neutral 9.88
February 18, 1986 209,964 196,063 150,588 La Niña 19.9
January 2, 1997 254,634 218,286 143,072 La Niña 20.18
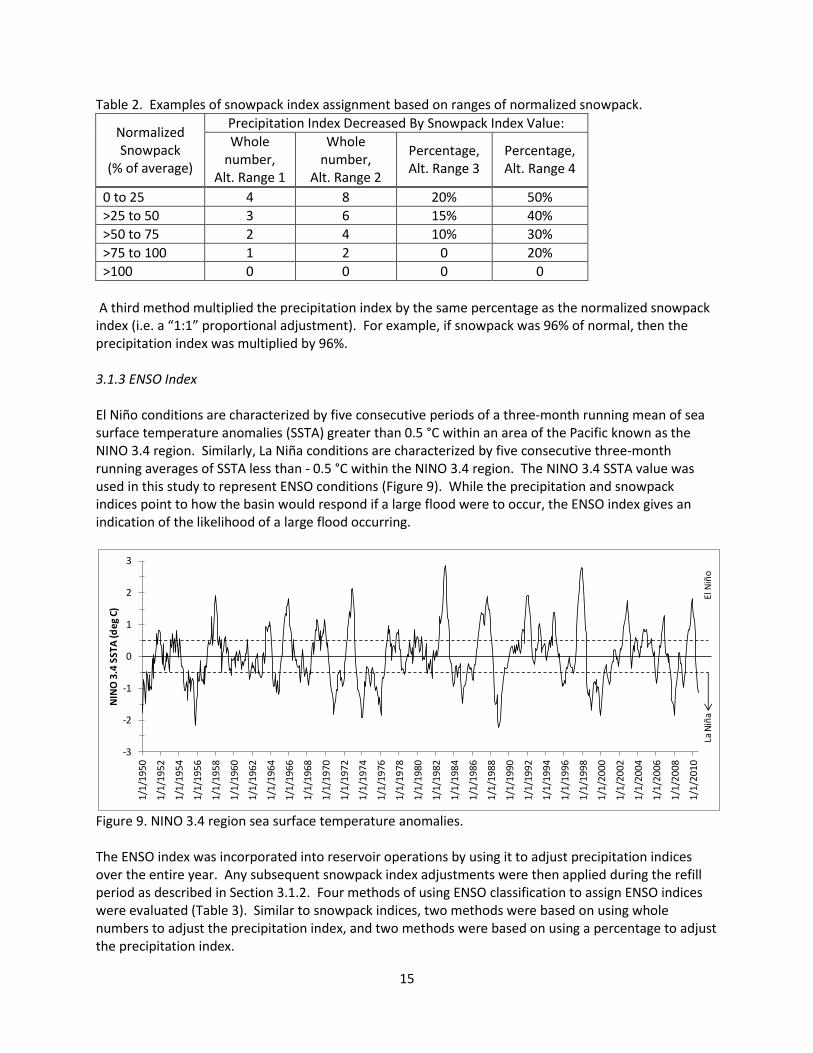
3.3.2 Synthetic flood hydrographs To include more severe and rare storms than are available in the historical record, 100 synthetic flood hydrographs were created. These events were created based on the estimated probability distribution of both one-day annual maximum Folsom Reservoir inflows and the precipitation index value three days prior to those maximums, as well as the estimated linear correlation between these two variables. A flow frequency curve of one-day annual maximum Folsom Reservoir inflows was created by fitting a log-Pearson type III distribution to the WY1905-WY2004 record (Figure 12). A Pearson type III distribution was also fit to the historical precipitation index values three days prior. These distributions were fit by computing sample estimates of mean, standard deviation and skew for both data sets. Finally, a linear correlation coefficient between these variables was estimated. The flood events were created by correlated sampling of random values from the two probability distributions. Two sets of 5,000 uniformly distributed U[0,1] random numbers were generated, and converted to two sets of 5,000 numbers with standard normal distributions. The estimated correlation coefficient was then applied to transform the values to joint standard normal with the specified correlation. These correlated values were then used to sample one-day peak inflows and associated precipitation indices three days prior from the estimated probability distributions. The result was the creation of 5,000 flood events. The largest 100 peak inflows were selected, along with their paired

19
precipitation indices, as the flood events having exceedance probabilities between 0.02 and 0.0002 (50-year to 5,000-year return periods). Next, one of the seven historical hydrographs was randomly assigned to provide a shape for each of the 100 peak inflows, subject to one condition. If the instantaneous peak flow of the synthetic hydrograph exceeded 300,000 cfs, then one of the four largest historical hydrographs was chosen (i.e. Dec 1955, Jan 1963, Dec 1964 or Jan 1997). Each assigned historical hydrograph was then scaled to match the sampled one-day peak inflow, resulting in 100 synthetic flood hydrographs. For reference, the seven historical hydrographs used to shape the synthetic floods are contained in Appendix A, and the 100 synthetic events generated through this process are contained in Appendix B. The historical precipitation indices were also scaled up using the associated sampled index value, and this scaled index was used until three days prior to the peak flow. At that point, a newly computed time series of the precipitation index was used, based on historical precipitation from the specified event that was scaled up using the square root of the value used to scale the peak flow. The new precipitation index was used to better reflect the increased precipitation of the synthetic floods. The assumption that historical precipitation data related to a historical hydrograph can be scaled up by the square root of the value used to scale the historical peak flow is a simplification. This simplified approach could affect to some extent both the timing and depth of flood pool for a flexible rule curve. Another significant assumption in this approach is that, for very large synthetic floods, the general shape of the hydrograph will be similar to the shape of one of the historic floods. However, if produced by storms of longer duration, the shape could instead have a lower peak but larger volume. If produced by a series of storms, the shape of the large flood hydrograph could have more than one peak. Finally, this method of producing synthetic floods assumes that large scale floods will have the same relationship (linear correlation coefficient) between the peak flow and the precipitation index three days prior as observed in historic floods, but this may not be true. The shapes and probability distributions of extreme flood hydrographs is a subject for further research (Ji, 2011). Each synthetic hydrograph was also assigned an ENSO value corresponding to the ENSO value of the base historical flood hydrograph. 3.4 ResSim Model The Hydrologic Engineering Center Reservoir System Simulation (HEC-ResSim) model developed by the U.S. Army Corps of Engineers (USACE) was used to model Folsom Reservoir operations and the routing of inflow hydrographs through the reservoir. The model uses the most recent proposed flood control operations set developed by the USACE for the new auxiliary spillway. Inflows for the period of record (WY1956-WY2008) were obtained from the USACE. These computed average historical daily inflows were used as the daily values each day for input to HEC-ResSim.
20
Figure 12. Folsom Reservoir one-day, three-day and seven-day inflow frequency curve. 3.5 Rule Curve Evaluation The three types of variable rule curves were analyzed using a systematic approach. Starting with Type P precipitation-based curves, flood control performance was evaluated for all rule curves using the full set of synthetic floods. Both expected annual spill and refill performance were evaluated for all rule curves using historical periods of record for reservoir inflow. Type P curves were selected with ranges of flood pool size that performed well for flood control. For these selected curves, the refill period was varied from the initial March 1st to June 1st period to assess if refill performance could be improved without worsening floods. Through this process, a set of Type P candidate rule curves was identified. A snowpack index was added to each Type P candidate rule curve to convert it to a Type S rule curve. The snowpack index is only referenced in managing reservoir operations during the refill period. When snowpack conditions are below normal, the rule curve is shifted to a higher elevation (lower index value) to allow the reservoir to store more runoff earlier in the refill season. When snowpack exceeds normal, no changes are made to the rule curve since snowmelt runoff has historically not produced significant flooding in the American River basin. Several methods of using normalized snowpack data to adjust the precipitation index were evaluated. The initial March 1st to June 1st refill period was also varied to explore if refill performance could be improved. Through this process, the best Type S candidate rule curves were found.
.0002.0010.010.050.10.20.50.80.90.950.99
1000
10000
100000
1000000M
axim
um
Str
eam
flo
w (c
fs)
Percent Chance Exceedance
peak
1-day
3-day
7-day
1/200
PMF - peakPMF - 1-day
21
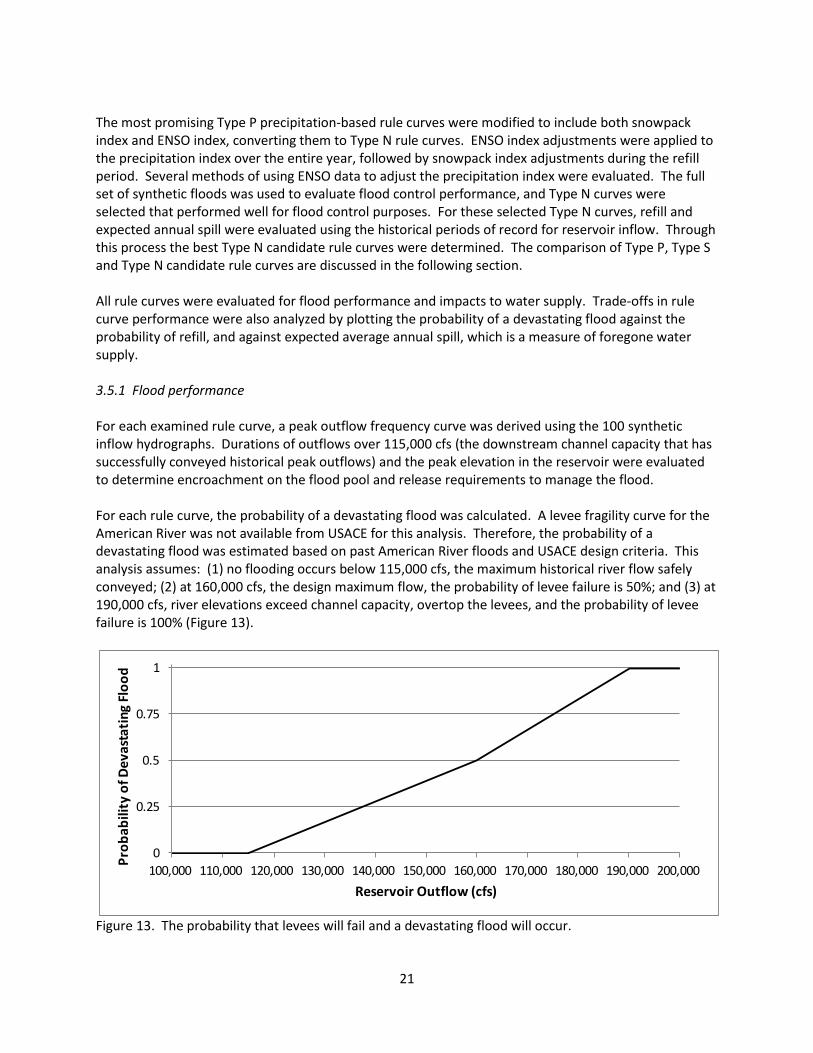
The most promising Type P precipitation-based rule curves were modified to include both snowpack index and ENSO index, converting them to Type N rule curves. ENSO index adjustments were applied to the precipitation index over the entire year, followed by snowpack index adjustments during the refill period. Several methods of using ENSO data to adjust the precipitation index were evaluated. The full set of synthetic floods was used to evaluate flood control performance, and Type N curves were selected that performed well for flood control purposes. For these selected Type N curves, refill and expected annual spill were evaluated using the historical periods of record for reservoir inflow. Through this process the best Type N candidate rule curves were determined. The comparison of Type P, Type S and Type N candidate rule curves are discussed in the following section. All rule curves were evaluated for flood performance and impacts to water supply. Trade-offs in rule curve performance were also analyzed by plotting the probability of a devastating flood against the probability of refill, and against expected average annual spill, which is a measure of foregone water supply. 3.5.1 Flood performance For each examined rule curve, a peak outflow frequency curve was derived using the 100 synthetic inflow hydrographs. Durations of outflows over 115,000 cfs (the downstream channel capacity that has successfully conveyed historical peak outflows) and the peak elevation in the reservoir were evaluated to determine encroachment on the flood pool and release requirements to manage the flood. For each rule curve, the probability of a devastating flood was calculated. A levee fragility curve for the American River was not available from USACE for this analysis. Therefore, the probability of a devastating flood was estimated based on past American River floods and USACE design criteria. This analysis assumes: (1) no flooding occurs below 115,000 cfs, the maximum historical river flow safely conveyed; (2) at 160,000 cfs, the design maximum flow, the probability of levee failure is 50%; and (3) at 190,000 cfs, river elevations exceed channel capacity, overtop the levees, and the probability of levee failure is 100% (Figure 13).
Figure 13. The probability that levees will fail and a devastating flood will occur.
0
0.25
0.5
0.75
1
100,000 110,000 120,000 130,000 140,000 150,000 160,000 170,000 180,000 190,000 200,000
Pro
bab
ility
of D
eva
stat
ing
Flo
od
Reservoir Outflow (cfs)

22
3.5.2 Water supply performance The water supply impact of each proposed rule curve was assessed by (1) evaluating the expected releases from Folsom Reservoir during the flood season that are unusable for downstream water supply needs and therefore become part of outflow from the Delta to San Francisco Bay (i.e. the expected annual spill) and (2) the probability of refill at the end of flood season. For refill, reservoir storage was examined over the modeled period of record (WY1956-WY2008) to see if the reservoir refilled, or how close it came to being refilled during the water year (prior to October 1). For expected average annual spill, controlled and uncontrolled reservoir releases to manage the flood pool were examined over the same modeled period of record. Accurate estimation of “spill” or the portion of Folsom Reservoir outflow that cannot be diverted for water supply is complex. Folsom Reservoir is part of the larger coordinated operations of the federal Central Valley Project (CVP) and State Water Project (SWP), and releases to the American River are part of broader controlled and uncontrolled flows from the Sacramento River, Mokelumne River, and other tributaries to the Delta. Regulatory requirements for water supply diversions by the SWP and CVP at south Delta pumping plants include limitations imposed under the federal Endangered Species Act to protect Delta smelt and Chinook salmon, as well as State Water Resources Control Board water quality standards, and some of these criteria vary dynamically within a range or are subject to specific triggers.
Figure 14. Probability of spill. For purposes of estimating spill or lost water supply opportunity for each rule curve, a simplifying assumption was made that all minimum releases to the American River can be diverted (flows up to 2,000 cfs) and that the probability of spill increases linearly from 2,000 cfs up to 15,000 cfs (Figure 14). At 15,000 cfs or above, it was assumed that 100% of Folsom Reservoir releases will spill and contribute to Delta outflow, because in all likelihood the combined flows into the Delta have exceeded Delta pumping and storage capacity. The expected annual spill was then calculated by multiplying the average daily flows in excess of 2,000 cfs by the probability of spill (Figure 14), summing these flows for the year and converting the total to acre-feet.
0
0.25
0.5
0.75
1
0 2000 4000 6000 8000 10000 12000 14000 16000 18000
Pro
bab
ility
of
Spill
Reservoir Outflow (cfs)

23
For perspective on the assumed spill flow rates, during wet years, the average monthly total Delta inflow from all sources combined ranges from 50,000 cfs to 110,000 cfs during the winter and spring months of December through May. During above normal years, the average monthly total Delta inflow ranges from 50,000 cfs to 70,000 cfs during the winter months of December through March. Flood frequency analysis of the Fair Oaks gauge on the American River, which measures flows almost entirely from Folsom and Nimbus releases, shows that, on average, 50,000 cfs is exceeded about once every five years or, in about 20% of years (USBR 2008).

24
4.0 Results Results of analyses are presented first for fixed curves, and then for Type P, Type S and Type N variable index curves. Overall, 162 variable index curves were analyzed (Appendix C). These included 91 Type P, 55 Type S and 16 Type N curves. Flood control and water supply performance was evaluated for each rule curve. For flood control, the probability of a devastating flood was analyzed, including the probability of downstream flows exceeding 115,000 cfs (the maximum historical reservoir outflow) and exceeding 160,000 cfs (the design channel flow). For water supply, the expected annual spill and the probability of refill were calculated. For Type P curves, sensitivity analyses are presented to explore effects of precipitation index range and refill criteria. A late season flood analysis provides insight into the effect of refill criteria on flood control performance. For selected precipitation index ranges and refill criteria, a sensitivity analysis of flood pool size range is also presented. For five selected Type P curves, groups of Type S curves are generated using five different methods of calculating and applying a snowpack index. Results are compared to identify the most promising snowpack index method. For four selected Type S curves, groups of Type N curves are generated using four different methods of calculating and applying an ENSO index. These results are compared to identify the most promising ENSO index method. Finally, trade-offs between flood control and water supply performance are presented by comparing the probability of devastating flood to expected annual spill and to probability of refill. These results support conclusions about the value of Type P, Type S and Type N index curves compared to fixed curves and the incremental benefit of enhancing a precipitation index curve with real-time snowpack and ENSO data. 4.1 Fixed Rule Curve Evaluation Evaluation of rule curves included, as a start, “all flood pool” and “no flood pool” scenarios, as well as fixed rule curves with flood pools from 100TAF through 800TAF, in 100TAF increments (Table 5). The non-dominated or Pareto-optimal fixed curves identified in Section 4.5, Combined Flood and Water Supply Performance, are marked.

25
Table 5. Summary of results for fixed rule curves.
Flood Pool Size
Synthetic Events Period of Record
Annual Prob. Of
Devastating Flood (%)
Prob. of outflow (%) greater than Annual
Prob. Of Refill (%)
Annual Expected Spill (AF)
115,000 cfs
160,000 cfs
Average Ratio to No Flood Pool Spill
No Flood Pool
c 2.000 2.00 2.00 64.2 546,726 1.000
100 TAF 1.977 2.00 2.00 43.4 561,096 1.026
200 TAFb
1.577 1.90 1.60 41.5 570,783 1.044
300 TAFb
1.162 1.32 1.14 41.5 582,149 1.065
400 TAF 0.873 1.14 0.78 37.7 597,058 1.092
500 TAF 0.689 0.94 0.60 37.7 618,621 1.132
600 TAFb
0.515 0.80 0.32 34.0 653,044 1.194
700 TAFc 0.469 0.74 0.28 30.2 709,438 1.298
800 TAFc
0.466 0.70 0.28 28.3 782,053 1.430
All Flood Pool 0.475 0.76 0.24 24.5 840,543 1.537
Refill Criteria: Begin Refill 3/1, End Refill 6/1
a Non-dominated or Pareto-optimal rule curve for flood risk and refill (Figure 26).
b Non-dominated or Pareto-optimal rule curve for flood risk and expected annual spill
(Figure 28).
c Non-dominated or Pareto-optimal rule curve on both Figure 26 and Figure 28.
As expected, rule curves with larger flood pool sizes provide better flood protection but more expected annual spill and lower probability of refill than curves with smaller flood pool sizes. The All Flood Pool alternative produced 53.7% more spill compared to the No Flood Pool alternative. The All Flood Pool option produced the apparently inconsistent result of a slightly higher probability of devastating flood (0.48%) than the 700 TAF or 800 TAF fixed curves (both at 0.47%). This was due to the limited release capacity at low elevations. Initial flood inflows in the All Flood Pool alternative are stored in the reservoir until the spillway is reached, due to limited reservoir release capacity at low elevations. By the time the spillway is reached, the flood has typically progressed to higher inflows. However, release rate of change rules limit how quickly releases can be increased to deal with these higher inflows, forcing the reservoir elevation higher. When the reservoir reaches the surcharge zone, the Emergency Spillway Release Diagram goes into effect triggering larger releases to save the dam. In the All Flood Pool alternative, therefore, there is a slightly higher probability of devastating flood compared to 700 TAF or 800 TAF fixed curves that allow more releases before encroachment into the surcharge zone.

26
4.2 Type P Curve Assessment Selected Type P curves are summarized to show flood and water supply results for the 400 TAF to 600 TAF variable flood pool size (Table 6) and for a larger range of flood pool size, 300 TAF to 700 TAF (Table 7). Rule curves for a range of flood pool sizes and similar refill criteria are listed in Table 8, including all of the Type P non-dominated or Pareto-optimal rule curves identified in Section 4.5, Combined Flood and Water Supply Performance. 4.2.1 Flood performance With Folsom Dam’s new spillway, all synthetic floods pass safely through Folsom Reservoir without overtopping the dam regardless of the rule curve (Figure 15). Reservoir elevation exceedance curves in Figure 15 show that, even with no flood pool, the maximum elevation in the reservoir does not exceed the maximum crest of the dam at elevation 480.5 feet. The synthetic flood events have return periods ranging from 50 years to 5,000 years, and therefore the exceedance probabilities range from 0.002% to 2%. The necessary releases for the most extreme events, however, exceed 160,000 cfs and cause downstream flooding.
Figure 15. Folsom Reservoir storage elevations for fixed, Type P, Type S and Type N rule curves.
400
410
420
430
440
450
460
470
480
0.00.20.40.60.81.01.21.41.61.82.0
Pe
ak R
ese
rvo
ir E
leva
tio
n (f
t)
Percent chance of exceeding indicated elevation (%)
Top of DamTop of SurchargeTop of Flood PoolAll Flood PoolNo Flood Pool300 TAF400 TAF700 TAFVariable Rule Curve
Top of Dam
Top of Flood Pool
Top of Surcharge
All Flood Pool
No Flood Pool

27
Table 6. Selected precipitation index (Type P) rule curves, 400-600 TAF variable flood pool.
Begin End
115,000
cfs
160,000
cfsAverage Ratio to No
Flood Pool Spill
All Flood
Pool 3/1 6/10.48 0.76 0.24 24.5 840,543 1.537
No Flood
Pool 3/1 6/12.00 2.00 2.00 64.2 546,726 1.000
P3 3/1 6/1 0.51 0.80 0.32 35.8 722,158 1.321
P41 3/1-3/20 4/20-5/30 0.51 0.80 0.32 35.8 722,158 1.321
P42 3/1 4/30-6/9 0.51 0.80 0.32 35.8 700,703 1.282
P43 3/1-3/25 4/25-5/19 0.51 0.80 0.32 35.8 719,165 1.315
P44 3/1-4/30 5/1-6/1 0.51 0.80 0.32 20.8 797,330 1.458
P50 3/1-4/1 4/10-6/1 0.51 0.80 0.32 22.6 775,464 1.418
P22 3/1 6/1 0.63 0.88 0.46 37.7 689,870 1.262
P45 3/1-3/20 4/20-5/30 0.63 0.88 0.46 45.3 713,069 1.304
P46 3/1 4/30-6/9 0.63 0.88 0.46 49.1 701,614 1.283
P47 3/1-3/25 4/25-5/19 0.63 0.88 0.46 45.3 706,579 1.292
P48 3/1-4/30 5/1-6/1 0.63 0.88 0.46 45.3 735,142 1.345
P49 3/1-4/15 4/10-6/1 0.63 0.88 0.46 41.5 739,454 1.353
P5 3/1 6/1 0.65 0.90 0.48 37.7 697,519 1.276
P2 3/1-3/20 4/20-5/30 0.65 0.90 0.48 45.3 701,718 1.283
P7 3/1 5/1 0.65 0.90 0.48 50.9 650,983 1.191
P8 3/31 5/31 0.65 0.90 0.48 32.1 743,782 1.360
P9 3/1-4/15 4/10-6/1 0.65 0.90 0.48 41.5 721,015 1.319
P10 3/1-4/21 4/15-6/10 0.65 0.90 0.48 41.5 744,607 1.362
P62 3/1-3/25 4/25-5/19 0.65 0.90 0.48 45.3 693,350 1.268
P63 3/1-4/30 5/1-6/1 0.65 0.90 0.48 45.3 718,340 1.314
P64 3/15 5/15 0.65 0.90 0.48 39.6 696,059 1.273
P65 3/1 4/30-6/9 0.65 0.90 0.48 49.1 690,829 1.264
P116 3/1 6/1 0.70 0.92 0.56 37.7 659,996 1.207
P115 3/1 4/30-6/9 0.70 0.92 0.56 50.9 641,364 1.173
P4 3/1-3/20 4/20-5/30 0.70 0.92 0.56 50.9 650,272 1.189
P140 3/1-3/25 4/25-5/19 0.70 0.92 0.56 50.9 644,026 1.178
P141 3/1-4/30 5/1-6/1 0.70 0.92 0.56 50.9 652,676 1.194
P142 3/1-4/15 4/10-6/1 0.70 0.92 0.56 49.1 657,662 1.203
P40 3/1 6/1 0.70 0.98 0.58 37.7 630,888 1.154
P145 3/1 4/30-6/9 0.70 0.98 0.58 50.9 604,011 1.105
P146 3/1-3/20 4/20-5/30 0.70 0.98 0.58 50.9 613,075 1.121
Precip Index Range 10-30
Precip Index Range 8-24
Precip Index Range 6-20
Precip Index Range 6-18
Precip Index Range 2 - 10
Period of Record
Annual
Prob.
Of Refill
(%)
Annual Expected Spill (AF)Refill Dates
Rule
Curve
Number
Annual
Prob. Of
Devastating
Flood (%)
Prob. of outflow
(%) greater than
Synthetic Events

28
Table 7. Selected precipitation index (Type P) rule curves, 300-700 TAF variable flood pool.
Rule Curve
Number
Refill Dates
Synthetic Events Period of Record
Annual Prob. Of
Devastating Flood (%)
Prob. of outflow (%) greater than Annual
Prob. Of Refill (%)
Annual Expected Spill (AF)
Begin End 115,000
cfs 160,000
cfs Average
Ratio to No Flood Pool Spill
All Flood Pool
3/1 6/1 0.48 0.76 0.24 24.5 840,543 1.537
No Flood Pool
3/1 6/1 2.00 2.00 2.00 64.2 546,726 1.000
Precip Index Range 4-20
P34 3/1 6/1 0.56 0.82 0.34 37.7 744,980 1.363
P75 3/1-4/30 5/1-6/1 0.56 0.82 0.34 37.7 777,965 1.423
P76 3/1-3/25 4/25-5/19 0.56 0.82 0.34 39.6 744,423 1.362
P77 3/1-3/20 4/20-5/30 0.56 0.82 0.34 37.7 755,929 1.383
P78 3/1 4/30-6/9 0.56 0.82 0.34 43.4 739,840 1.353
P79 3/1-4/15 4/10-6/1 0.56 0.82 0.34 37.7 786,354 1.438
Precip Index Range 4-21
P39 3/1 6/1 0.63 0.88 0.46 37.7 745,077 1.363
P51 3/1-3/25 4/25-5/19 0.63 0.88 0.46 49.1 735,568 1.345
P52 3/1-3/20 4/20-5/30 0.63 0.88 0.46 47.2 742,033 1.357
P53 3/1 4/30-6/9 0.63 0.88 0.46 50.9 734,239 1.343
P54 3/1-4/15 4/10-6/1 0.63 0.88 0.46 47.2 757,245 1.385
P74 3/1-4/30 5/1-6/1 0.63 0.88 0.46 47.2 758,611 1.388
Rule curves using a lower range of precipitation index values generally performed better for flood control purposes than curves that used a higher range of index values (Table 6). This is due to the rule curve reaching a deeper flood pool sooner with a lower range of index values, and maintaining a deeper flood pool longer through the flood season. A rule curve with an index range of 2 through 10 means that precipitation indices with values of 2 or less are assigned to the minimum value of the flood pool, and precipitation indices with values of 10 or more are assigned to the maximum value of the flood pool. As the winter progresses and precipitation falls, the required flood pool will deepen sooner if the threshold precipitation indices are lower, resulting in a larger flood pool over the flood season (Figure 16). The effect of precipitation index range can be seen in the analysis of the 400-600 TAF index curves (Table 6). As expected, the curves with the lowest index value range (2-10) performed best, essentially matching the peak outflow exceedances of the 600 TAF fixed rule curve, because the lower index values caused the flood pool to deepen quickly in response to precipitation. Also as expected, the index curves with the highest index value range (10-30) still performed better than the 400 TAF fixed rule curve.

29
Figure 16. Reservoir elevation, inflow and outflow for precipitation index rule curve P65 as the rule curve responds to changes in the precipitation index. Using a broader range of flood pool size, 300-700 TAF, and an index range of 4-21 (Table 7) produced the about the same probability of a devastating flood (0.63%) as the 400-600 TAF flood pool size and index range of 6-18, including the same outflow exceedance values for flows equal to or greater than 115,000 cfs (0.88%), and the same outflow exceedance values for flows equal to or greater than 160,000 cfs (0.46%). The flood control performance of a slightly concave index rule curve (P34) was found to be somewhat better than a relatively straight rule curve (P39) because the flood pool gets deeper more quickly (Figure 17).
400
410
420
430
440
450
460
470
1-Oct-82 1-Dec-82 1-Feb-83 1-Apr-83 1-Jun-83 1-Aug-83 1-Oct-83
Res
ervo
ir E
leva
tio
n (f
t)
Rule Curve
Elevation
0
10,000
20,000
30,000
40,000
50,000
60,000
70,000
1-Oct-82 1-Dec-82 1-Feb-83 1-Apr-83 1-Jun-83 1-Aug-83 1-Oct-83
Flo
w (c
fs)
Outflow
Inflow
0
5
10
15
20
25
1-Oct-82 1-Dec-82 1-Feb-83 1-Apr-83 1-Jun-83 1-Aug-83 1-Oct-83
Pre
cip
ita
tio
n In
de
x
Precipitation Index

30
Figure 17. Precipitation index rule curve shapes, P34 and P39, for 300-700 TAF variable flood pool. Over the full range of peak outflows, most variable index rule curves perform better than the 400 TAF fixed rule curve (Figure 18). All the index rule curves produce very similar results for the largest synthetic events (exceedances at or above 0.1%) and for the smallest synthetic events (exceedances at or below 1.3%). All the index rule curves result in releases leveling off at 115,000 cfs, the channel capacity, for smaller events as reservoir operations try to minimize the risk of devastating floods that could be caused by higher flows.
0
5
10
15
20
25
200 300 400 500 600 700 800
Pre
cip
itat
ion
In
de
x
Flood Pool Range (TAF)
P34
P39

31
Figure 18. Releases from Folsom Reservoir for fixed, Type P, Type S and Type N rule curves. 4.2.2 Water supply performance The water supply impact of each proposed rule curve was assessed by evaluating both the expected releases from Folsom Reservoir during the flood season that are unusable for downstream water supply needs (i.e. the expected annual spill) and the probability of refill at the end of the flood season. 4.2.2.1 Expected annual spill The relationship between annual spill and the size of the flood pool can be seen by looking at the extreme rule curve cases of All Flood Pool and No Flood Pool. The average annual expected spill is significantly higher if the rule curve is trying to maintain All Flood Pool (840,543 AF) because it empties the reservoir each year before the flood season and then releases all inflow during the flood season in an attempt to keep the reservoir empty. If the rule curve is trying to maintain No Flood Pool, then only minimum required releases are made unless the reservoir elevation encroaches into the surcharge zone, in which case large releases are made just until the flood event passes (Figure 19). Even though the No Flood Pool curve requires all flood inflows to pass through the reservoir, it still results in the lowest average annual expected spill (546,726 AF).
100,000
1,000,000
0.00.20.40.60.81.01.21.41.61.82.0
Pe
ak R
ese
rvo
ir O
utf
low
(cfs
)
Percent chance of exceeding indicated outflow (%)
All Flood PoolNo Flood Pool300 TAF400 TAF600 TAF700 TAFVariable Rule Curves
900,000
800,000
700,000
600,000
500,000
400,000
300,000
200,000
160,000
115,000
No Flood Pool
All Flood Pool
300 TAF
400 TAF
700 TAF

32
Figure 19. Comparison of All Flood Pool and No Flood Pool reservoir outflow over 10-Year period. The best-performing Type P index curves in the 400-600 TAF flood pool range had average annual expected spill of approximately 604,011 to 613,075 AF (Table 6, curves P145 and P146). A comparison of P5 and P7 index curves (Table 6) shows that, all other parameters being equal, extending the refill date from May 1 to June 1 increased the average annual expected spill from 650,983 AF to 697,519 AF (7.1%), as additional releases had to be made to maintain the rule curve for an additional month. Although expected water supply losses increased with later refill, maintaining the rule curve longer into the refill period also reduces risk of late-season flooding. For the 300-700 TAF flood pool range, the best-performing curve had an average annual expected spill of about 734,239 AF (Table 7, curve P53). 4.2.2.2 Probability of refill Variable precipitation index rule curves can significantly improve the probability of refill over fixed rule curves with similarly sized flood pools (Table 6). For the 400-600 TAF flood pool size range, many Type P curves (P4, P7, P115, P140, P141, P145, P146) had probability of refill close to 51%, compared to 34% for the fixed 600 TAF and 37.7% for the fixed 400 TAF rule curves. Overall, refill probability ranges from zero for the All Flood Pool case to 64% for the No Flood Pool case. From exceedance curves (Figure 20), about 30% of the time, there is so much precipitation and runoff in the basin that Folsom Reservoir will fill regardless of what type of rule curve is applied. Also, about 5% of the time, the hydrology is so dry that there is not enough water for the flood rule curve to be very relevant to the operation of the reservoir. In the remaining years, as expected, flood rule curves with smaller flood pools are more likely to refill.
0
10,000
20,000
30,000
40,000
50,000R
ese
rvo
ir O
utf
low
(cfs
)All Flood Pool
No Flood Pool

33
Figure 20. Refill of Folsom Reservoir based on fixed, Type P, Type S, and Type N rule curves. Figure 21 and Figure 22 show more closely the effect of refill criteria. A Type P curve (P5) is plotted with variations that use different dates for initiation and completion of refill. Refill start dates varied from March 1 to March 31, and end dates varied from May 1 to June 10. The shape of the refill curve also varied. For some rule curve variations, the start date and end date of refill was kept the same, regardless of how deep the flood pool had gotten during the winter season in response to the precipitation index. For other rule curves, the rate of refill was kept constant, and the deeper flood pools were allowed to remain longer and take longer to refill than smaller flood pools. Other curves began refill on the same date regardless of flood pool size, but allowed the deeper flood pools to take longer to refill. Initial analysis suggested that the refill start date may be more important than the slope of refill, and that an earlier start date such as March 1 allows capture of early snowmelt runoff. However, there is a trade-off between the water supply edge of an early refill date and late season flood risk. A late season flood analysis of 67 fixed and Type P rule curves was performed to evaluate refill criteria (Appendix D). A repeat of the 1986 flood hydrograph was routed through Folsom Reservoir beginning on three different dates: March 15th, April 1st and April 15th. Sample results of reservoir elevations and outflows are shown for March 15th and April 15th for P65 (Figure 23). Of the 67 rule curves analyzed, 12 curves were able to handle the late season flood without exceeding releases downstream greater than 115,000 cfs, and 25 curves were able to handle these events without exceeding 160,000 cfs downstream. Five curves performed very poorly, exceeding 115,000 cfs for all three start dates of late
220
240
260
280
300
320
340
360
380
400
420
440
460
480
0102030405060708090100
Peak
Res
ervo
ir E
leva
tio
n b
etw
een
Mar
ch 1
an
d O
cto
ber
1 (f
t)
Percent chance of exceeding indicated elevation (%)
Top of Conservation
All Flood Pool
No Flood Pool
Variable Rule Curve
Top of Conservation
All Flood Pool
No Flood Pool

34
season floods, and exceeding 160,000 cfs for the two later flood dates (April 1st and April 15th). Eight curves did only slightly better, exceeding 160,000 cfs only for the latest April 15th flood. Of the curves that did not have downstream releases exceeding 115,000 cfs, those that performed best had larger flood pool sizes, including 400-600 TAF, 300-700 TAF, 550-750 TAF, and 600-800 TAF; and precipitation index ranges no more than 6-20. Higher index ranges (e.g. 8-24 and 10-30) tended to follow the most shallow rule curve during the refill period, because precipitation index values during this period were frequently less than or equal to the minimum value of 8 or 10. These 12 curves also had start and end dates of: (1) March 1-April 15 to April 10-June 1; (2) March 1-April 30 to May 10-June 1; and (3) March 1 to April 30-June 9. The probability of refill for these curves ranged from 20.8% to 47.2%, and expected annual spill ranged from 718,340 AF to 797,330 AF/year, or 31% to 46% more than the annual spill expected for No Flood Pool. The 25 curves that did not exceed downstream releases of 160,000 cfs had probabilities of refill ranging up to 50.9% (P110, P115), with expected annual spills as low as 641,364 AF (P115), or 17% more than the annual spill expected for No Flood Pool. Curve P110 had close to the same expected annual spill, at 652,421 AF, or 19% more than the annual spill expected for No Flood Pool. Curves P110 and P115 both used refill dates of March 1 to April 30-June9, and had larger flood pool size ranges of 450-650 TAF and 400-600 TAF, respectively, with an index range of 8-24.

35
Figure 21. Refill of Folsom Reservoir based on variations of same precipitation index rule curve (P5) with different refill dates.
Figure 22. Expanded view of Figure 21 showing detail of refill performance for variations of precipitation index rule curve P5.
220
240
260
280
300
320
340
360
380
400
420
440
460
480
0102030405060708090100
Peak
Res
ervo
ir E
leva
tio
n b
etw
een
Mar
ch 1
an
d O
cto
ber
1
(ft)
Percent chance of exceeding indicated elevation (%)
Top of ConservationAll Flood PoolNo Flood Pool400 TAF600 TAFBase CurveVariable Refill Dates
Top of Conservation Pool
All Flood Pool
No Flood Pool
600 TAF
380
390
400
410
420
430
440
450
460
470
0102030405060708090100
Pe
ak R
ese
rvo
ir E
leva
tio
n b
etw
een
Ma
rch
1 a
nd
Oct
ob
er 1
(f
t)
Percent chance of exceeding indicated elevation (%)
Top of ConservationAll Flood PoolNo Flood Pool400 TAF600 TAFBase CurveVariable Refill Dates
Top of Conservation Pool
All Flood Pool
No Flood Pool
600 TAF
400 TAF

36
Figure 23. March 15th and April 15th late season flood reservoir inflows, elevations and outflows (P65). For all ranges of precipitation index for the 400-600 TAF flood pool curves, some refill beginning and end dates performed better than others (Table 6). Specifically, beginning refill on March 1 and, depending on the index value, ending refill during the period April 30 to June 9 consistently provided higher probabilities of refill up to 50.9%. Examination of the 300-700 TAF flood pool curves confirmed these favorable refill dates (Table 7). Using the identified best refill dates of March 1 through April 30-June 9, a range of flood pool sizes was analyzed for precipitation index ranges 6-20, 8-24, and 10-30 (Table 8). The curves with the best refill probabilities (up to 52.8%) and least expected annual spills used lower flood pool sizes (300-500 TAF and 350-550 TAF) and higher precipitation index values (8-24, 10-30). These curves (P138, P167, P168) produced about the same probability of flooding as a fixed 400 TAF rule curve (0.87%) while improving probability of refill from 37.7% to 52.8%.
445
450
455
460
465
470
475
4/8 4/10 4/12 4/14 4/16 4/18 4/20 4/22
Re
serv
oir
Ele
vati
on
(ft)
Top of Flood Pool
Elevation
Rule Curve
0
50,000
100,000
150,000
200,000
250,000
4/8 4/10 4/12 4/14 4/16 4/18 4/20 4/22
Flo
w (c
fs)
Outflow
Inflow
400
410
420
430
440
450
460
470
3/8 3/10 3/12 3/14 3/16 3/18 3/20 3/22
Re
serv
oir
Ele
va
tio
n (f
t)Top of Flood PoolElevationRule Curve
0
50,000
100,000
150,000
200,000
250,000
3/8 3/10 3/12 3/14 3/16 3/18 3/20 3/22
Flo
w (c
fs)
Outflow
Inflow

37
Table 8. Precipitation index rule curves using similar refill criteria and different ranges of flood pool size.
Rule Curve
Number
Flood Pool Size
(TAF)
Synthetic Events Period of Record
Annual Prob. Of
Devastating Flood (%)
Prob. of outflow (%) greater than
Annual Prob.
Of Refill (%)
Annual Expected Spill (AF)
115,000 cfs
160,000 cfs
Average Ratio to No
Flood Pool Spill
Precip Index Range 4-20*
P97a
0-400 4-20 1.52 1.14 35.8 653,384 1.195
Precip Index Range 6-20**
P121 300-500 0.784 1.00 0.66 50.9 664,045 1.215
P122 350-550 0.720 0.92 0.58 50.9 676,883 1.238
P65 400-600 0.653 0.90 0.48 49.1 690,829 1.264
P123a 450-650 0.570 0.86 0.34 47.2 701,836 1.284
P124a 500-700 0.527 0.84 0.30 41.5 722,508 1.322
P127 550-750 0.526 0.84 0.28 37.7 747,205 1.367
P128 600-800 0.514 0.82 0.28 37.7 777,247 1.422
Precip Index Range 8-24**
P138 300-500 0.882 1.04 0.82 52.8 620,500 1.135
P139 350-550 0.786 0.98 0.72 50.9 629,498 1.151
P115 400-600 0.699 0.92 0.56 50.9 641,364 1.173
P110 450-650 0.640 0.88 0.48 50.9 652,421 1.193
P130 500-700 0.584 0.86 0.36 45.3 681,513 1.247
P131a 500-700 0.584 0.86 0.36 50.9 666,635 1.219
P143a 550-750 0.550 0.84 0.32 43.4 686,388 1.255
P144 600-800 0.521 0.82 0.28 41.5 711,739 1.302
Precip Index Range 10-30**
P167b 300-500 0.967 1.06 0.90 52.8 588,062 1.076
P168c 350-550 0.832 1.04 0.76 52.8 594,837 1.088
P145 400-600 0.701 0.98 0.58 50.9 604,011 1.105
P169 450-650 0.666 0.88 0.50 50.9 613,577 1.122
P170b 500-700 0.619 0.86 0.42 50.9 625,899 1.145
* Refill Criteria: Begin Refill 3/1, End Refill 6/1 **Refill Criteria: Begin Refill 3/1, End Refill 4/30-6/9 a Non-dominated or Pareto-optimal rule curve for flood risk and refill (Figure 26). b Non-dominated or Pareto-optimal rule curve for flood risk and expected annual spill (Figure 28). c Non-dominated or Pareto-optimal rule curve on both Figure 26 and Figure 28.

38
4.3 Type S Curve Assessment Three Type P curves were selected with flood pool size ranging from 400-600 TAF, and precipitation indices ranging from 2-10, 6-20, and 10-30 (P42, P65 and P145, respectively). One Type P curve was selected with a flood pool size ranging from 300-500 TAF (P78, index range 4-20) and another Type P curve was selected with a flood pool size ranging from 300-700 TAF (P138, index range 8-24). For each of these five Type P curves, Type S curves were developed based on different methods of using snowpack indices to adjust precipitation indices, as described in Section 3.1.2. The resulting Groups 1-5 of Type P curves and corresponding Type S curve variations are shown in Table 9. The non-dominated or Pareto-optimal Type S curves identified in Section 4.5, Combined Flood and Water Supply Performance, are also marked in Table 9. For all groups, two methods of applying the snowpack index adjustment produced the best results in terms of reducing annual expected spill. These methods were (1) reducing the precipitation index by the same percentage as the normalized snowpack (i.e. a “1:1” proportional reduction); and (2) reducing the precipitation index by percentages ranging from 20% to 50%, depending on the range of normalized snowpack. However, improvements in spill were small, at best reducing spill by about 1.0%. The probability of refill was essentially unchanged in comparing Type P and Type S curves in each group, although in one group (Group 1), a slight improvement in refill was achieved (35.8% for P42, compared to 39.6% for S151-S153). Type P and corresponding Type S rule curves evaluated number of years in which the snowpack index noticeably modified the Type P curve. For rule curves using lower precipitation indices, the snowpack index modified the Type P curve in a greater number of years. For example, in Group 1 with precipitation index ranging from 2-10, the snowpack index noticeably modified the Type P curve in 70% of years (37 out of 53), while in Group 5 with precipitation index ranging from 10-30, the snowpack index noticeably modified the Type P curve (P145) in 17% of years (9 out of 53). This difference is because during the refill period, the precipitation index is more likely to be below 10 than below 2. Therefore, if the range is 10-30, reservoir operations would already be tracking the most shallow rule curve. With a lower index range of 2-10, the snowpack index will more frequently make a difference and cause adjustment to a shallower curve during the refill period. To examine the potential water supply benefits of Type S curves a little more closely, exceedance curves were plotted for P65 and for Type S curves variations (S171 through S175) that used different methods of applying the snowpack index (Figure 24 and Figure 25). The expanded view in Figure 25 shows that in several areas Type S curves provide small but noticeable improvements in refill over P65.

39
Table 9. Selected precipitation-snow index (Type S) curves.
Rule Curve
Number Snow Index
Synthetic Events Period of Record
Annual Prob. Of
Devastating Flood (%)
Prob. of outflow (%) greater than Annual
Prob. Of Refill (%)
Annual Expected Spill (AF)
115,000 cfs
160,000 cfs
Average Ratio to No Flood
Pool Spill
All Flood Pool
n/a 0.48 0.76 0.24 24.5 840,543 1.537
No Flood Pool
n/a 2.00 2.00 2.00 64.2 546,726 1.000
Precip Index Range 2-10, Flood Pool Range 400 - 600 TAF
P42 na 0.51 0.80 0.32 35.8 700,703 1.282
S157 2 -8 0.51 0.80 0.32 39.6 697,237 1.275
S158 1 - 4 0.51 0.80 0.32 39.6 698,275 1.277
S107a 10-50% 0.51 0.80 0.32 39.6 697,854 1.276
S159 20-50% 0.51 0.80 0.32 39.6 697,253 1.275
S160 0-20% 0.51 0.80 0.32 37.7 698,192 1.277
S161 1:1 0.51 0.80 0.32 39.6 694,781 1.271
Precip Index Range 4-20, Flood Pool Range 300 - 700 TAF
P78 na 0.56 0.82 0.34 43.4 739,840 1.353
S166 2 -8 0.56 0.82 0.34 43.4 737,661 1.349
S165 1 - 4 0.56 0.82 0.34 43.4 740,179 1.354
S164 20-50% 0.56 0.82 0.34 43.4 737,284 1.349
S163 0-20% 0.56 0.82 0.34 43.4 739,088 1.352
S162 1:1 0.56 0.82 0.34 43.4 735,391 1.345
Precip Index Range 6-20, Flood Pool Range 400 - 600 TAF
P65 na 0.65 0.90 0.48 49.1 690,829 1.264
S171 2 -8 0.65 0.90 0.48 50.9 685,007 1.253
S172 1 - 4 0.65 0.90 0.48 50.9 687,531 1.258
S173 20-50% 0.65 0.90 0.48 50.9 684,931 1.253
S174 0-20% 0.65 0.90 0.48 50.9 688,146 1.259
S175 1:1 0.65 0.90 0.48 50.9 684,321 1.252
Precip Index Range 8-24, Flood Pool Range 300 - 500 TAF
P138 na 0.88 1.04 0.82 52.8 620,500 1.135
S156 2 -8 0.88 1.04 0.82 52.8 618,206 1.131
S155 1 - 4 0.88 1.04 0.82 52.8 620,082 1.134
S154 20-50% 0.88 1.04 0.82 52.8 617,593 1.130
S153 0-20% 0.88 1.04 0.82 52.8 620,151 1.134
S152 1:1 0.88 1.04 0.82 52.8 618,830 1.132
Precip Index Range 10-30, Flood Pool Range 400 - 600 TAF
P145 na 0.70 0.98 0.58 50.9 604,011 1.105
S147 2 -8 0.70 0.98 0.58 50.9 601,317 1.100
S148 1 - 4 0.70 0.98 0.58 50.9 602,795 1.103
S149b 20-50% 0.70 0.98 0.58 50.9 600,762 1.099
S150 0-20% 0.70 0.98 0.58 50.9 603,577 1.104
S151 1:1 0.70 0.98 0.58 50.9 601,847 1.101
Refill dates: begin 3/1, end 4/30-6/9. a Non-dominated or Pareto-optimal rule curve for flood risk and refill (Figure 26).
b Non-dominated or Pareto-optimal rule curve for flood risk and expected annual spill (Figure 28).

40
Figure 24. Type S curve variations using base precipitation index curve P65.
Figure 25. Expanded view of Type S curve variations using base precipitation index curve P65.
220
240
260
280
300
320
340
360
380
400
420
440
460
480
020406080100
Peak
Res
ervo
ir E
leva
tio
n b
etw
een
Mar
ch 1
an
d O
ct 1
(ft)
Percent chance of exceeding indicated elevation (%)
Top of ConservationAll Flood PoolNo Flood Pool400 TAF500 TAFP65Type S Curves
No Flood Pool
Top of Conservation
500 TAF
All Flood Pool
380
390
400
410
420
430
440
450
460
470
020406080100
Peak
Res
ervo
ir E
leva
tio
n b
etw
een
Mar
ch 1
an
d O
ct 1
(ft)
Percent chance of exceeding indicated elevation (%)
Top of ConservationAll Flood PoolNo Flood Pool400 TAF500 TAFP65Type S Curves
No Flood Pool
Top of Conservation
500 TAF
All Flood Pool

41
4.4 Type N Curve Assessment Four Type S curves were selected with flood pool size ranging from 400-600 TAF, and precipitation indices ranging from 2-10, 6-20, 8-24 and 10-30 (S161, S175, S192 and S151, respectively). For each of these four Type S curves, Type N curves were developed based on different methods of using ENSO year classification to form ENSO indices and adjust precipitation indices, as described in Section 3.1.3. The resulting Groups 1-4 of Type S curves and corresponding Type N curve variations are shown in Table 10. Table 10. Selected precipitation-snow-ENSO index (Type N) curves.
Rule Curve
Number
ENSO Index (Neutral/ La Niña/ El Niño)
Synthetic Events Period of Record
Annual Prob. Of
Devastating Flood (%)
Prob. of outflow (%) greater than Annual
Prob. Of Refill (%)
Annual Expected Spill (AF)
115,000 cfs 160,000 cfs Average Ratio to No Flood
Pool Spill
All Flood Pool
n/a 0.48 0.76 0.24 24.5 840,543 1.54
No Flood Pool
n/a 2.00 2.00 2.00 64.2 546,726 1.00
Precip Index Range 2-10, Flood Pool Range 400 - 600 TAF
S161 n/a 0.51 0.80 0.32 39.6 694,781 1.27
N176 3/1.5/0 0.53 0.80 0.34 32.1 680,486 1.24
N177 3/0/-3 0.51 0.80 0.32 32.1 699,888 1.28
N178c
0.2/0.1/0 0.51 0.80 0.32 34.0 688,136 1.26
N179 0.5/0.25/0 0.53 0.80 0.34 32.1 679,163 1.24
Precip Index Range 6-20, Flood Pool Range 400 - 600 TAF
S175 na 0.65 0.90 0.48 50.9 684,321 1.25
N188 3/1.5/0 0.61 0.86 0.46 45.3 693,408 1.27
N189 3/0/-3 0.65 0.88 0.48 45.3 691,420 1.26
N190 0.2/0.1/0 0.63 0.86 0.48 49.1 693,154 1.27
N191 0.5/0.25/0 0.58 0.84 0.40 43.4 703,387 1.29
Precip Index Range 8-24, Flood Pool Range 400 - 600 TAF
S192 n/a 0.70 0.92 0.56 50.9 638,023 1.17
N184 3/1.5/0 0.67 0.90 0.50 50.9 654,674 1.20
N185 3/0/-3 0.69 0.92 0.54 50.9 639,863 1.17
N186 0.2/0.1/0 0.66 0.90 0.52 50.9 654,690 1.20
N187 0.5/0.25/0 0.63 0.88 0.48 50.9 678,648 1.24
Precip Index Range 10-30, Flood Pool Range 400 - 600 TAF
S151 n/a 0.70 0.98 0.58 50.9 601,847 1.10
N183 3/1.5/0 0.70 0.94 0.54 50.9 615,917 1.13
N182 3/0/-3 0.71 0.94 0.56 50.9 603,396 1.10
N181 0.2/0.1/0 0.70 0.94 0.56 50.9 616,920 1.13
N180 0.5/0.25/0 0.69 0.92 0.54 50.9 637,922 1.17
Refill dates: begin 3/1, end 4/30-6/9; Snow index: 1:1
c Non-dominated or Pareto-optimal rule curve on both Figure 26 and Figure 28.

42
For most Type N curves, the probability of a devastating flood stayed the same or was at most slightly reduced in Groups 2 and 3. In Groups 2, 3 and 4, the probabilities of exceeding 115,000 cfs or 160,000 cfs in downstream releases were also improved slightly compared to the base Type S curves. The rule curves in these groups have higher ranges of precipitation index (6-20, 8-24 and 10-30). Applying an ENSO index adjustment would tend to have more effect on these curves, causing more conservative operation with slightly deeper flood pools, compared to adjustment of a curve with a lower precipitation index range that might already be at a deeper flood pool. Several methods of applying an ENSO index adjustment were tried, but the 0.2/0.1/0 form of ENSO index was the only one that did not produce worse flood control results for any group compared to its related unadjusted Type S curve, and that minimized impacts to refill compared to its unadjusted Type S curve. Overall, there appears to be little improvement in water supply performance from incorporating an ENSO index into the rule curve. The probability of refill is up to 19% worse in Group 1, 15% worse in Group 2, and unchanged in Groups 3 and 4 compared to the corresponding Type S curves. Applying any ENSO index method significantly reduced the probability of refill for curves based on a lower precipitation index range (2-10 or 6-20) compared to curves based on higher precipitation index ranges (8-24 or 10-30). The probability of refill for those with higher ranges was not affected by the ENSO index because these were already on the shallowest flood pool during the refill season. Although it appears that a slight improvement could be achieved in expected annual spill in Group 1 (2.4%), expected annual spill is not improved in the other groups. In evaluating trade-offs between probability of devastating flood and expected annual spill, one Type N rule curve from Group 1 (N178) was on the non-dominated curve. The characteristics of N178 include a 400-600TAF flood pool, a precipitation index range of 2-10, and an ENSO index that increases the precipitation index by 20% in neutral years, 10% in La Niña years, and makes no adjustment in El Niño years (0.20/0.10/0). The factor edging this curve into its non-dominated position appears to be the slight (1.0%) improvement in expected annual spill compared to its related unadjusted Type S curve. 4.5 Combined Flood and Water Supply Performance Trade-offs between flood performance and water supply impacts were evaluated by plotting the probability of refill and the expected annual spill against the probability of a devastating flood (Figure 26 and Figure 28). For the refill analysis, the more desirable rule curves plot closer to the lower right quadrant, and an expanded view of these points is provided in Figure 27. The No Flood Pool point plots in the upper right of Figure 26, (high flood risk, but high refill probability); and the All Flood Pool point plots in the lower left (low flood risk, but also low refill probability). The optimal curve for refill and flood risk is defined by the following points: P97; P168; P131; P123; P143; P124; S107; N178 and the 600 TAF fixed curve (overlapping); and the 700 TAF and 800 TAF fixed curves (Appendix C). A cluster of curves was located closest to the lower right quadrant, including P131, N187, P170, P110, P53, S90, S91 and P129. All of these produced 51% probabilities of refill, and probabilities of flooding ranging from 0.58% to 0.65%. All of the Type P curves have larger flood pool sizes (450-650 TAF, 500-700 TAF), higher precipitation index ranges (8-24, 10-30), and the same refill dates (March 1 to April 30-June 9). The Type N curve (N187) is based on P115 and a snowpack index applied with a 1:1 proportional adjustment (S192). P115 uses a 400-600 TAF flood pool size, 8-24 precipitation index range, and refill dates of March 1 to April 30-June 9.

43
Figure 26. Folsom Reservoir refill risk compared to probability of devastating flood.
Figure 27. Expanded view of lower right quadrant, Folsom Reservoir refill risk compared to probability of devastating flood.
0.00
0.25
0.50
0.75
1.00
1.25
1.50
1.75
2.00
0 10 20 30 40 50 60 70
Pro
bab
ilit
y o
f De
vast
atin
g Fl
oo
d (%
)
Probability of Refill (%)
Fixed Rule Curves
Type P Rule Curves
Type S Rule Curves
Type N Rule Curves
No Flood Pool
300 TAF
400 TAF500 TAF
600 TAF
700 TAF
All Flood Pool
200 TAF
100 TAF
800 TAF
P97
P131
P168
Non-dominated Solutions
S107 P143P123
P124
0.50
0.55
0.60
0.65
0.70
0.75
0.80
0.85
0.90
0.95
1.00
45 46 47 48 49 50 51 52 53 54 55
Pro
bab
ilit
y o
f De
vast
atin
g Fl
oo
d (%
)
Probability of Refill (%)
Fixed Rule Curves
Type P Rule Curves
Type S Rule Curves
Type N Rule Curves
P7, S111, S171-S175N186
N184, P169
P170
P131,
P168
P53, S90, S91, N187P110
P123
Non-dominated Solutions
P129

44
Tradeoffs between flood control performance and water supply impacts were also assessed by comparing expected annual spills, or releases from Folsom Reservoir that cannot be used for water supply, to the probability of a devastating flood. In this graph (Figure 28) the most desirable rule curves plot in the lower left quadrant. The No Flood Pool point plots in the upper left, (high flood risk, but low expected spill); and the All Flood Pool point plots in the lower right (low flood risk, but also high expected spill). The best performing rule curves for expected annual spill and flood risk are : No Flood Pool, 200 TAF and 300 TAF fixed curves; P168; P167; S149; P169; P170; the 600 TAF fixed curve; N178; and the 700 TAF and 800 TAF fixed curves (Appendix C). A cluster of curves (P145 and S147-S151) was closest to the lower left quadrant around S149 (Figure 29). Common characteristics of these curves included a flood pool size range of 400-600 TAF, precipitation index range of 10-30, and refill dates beginning March 1 and ending April 30-June 9. Of the several methods of applying a snowpack index adjustment to P145, it appears that the 20% to 50% index range was most effective (S149).

45
Figure 28. Annual expected spill for Folsom Reservoir compared to probability of devastating flood.
Figure 29. Expanded view of lower left quadrant, annual expected spill for Folsom Reservoir compared to probability of devastating flood.
0.4
0.6
0.8
1.0
1.2
1.4
1.6
1.8
2.0
525,000 575,000 625,000 675,000 725,000 775,000 825,000
Pro
bab
ilit
y o
f De
vast
atin
g Fl
oo
d (%
)
Expected Annual Spill (AF)
Fixed Rule Curves
Type P Rule Curves
Type S Rule Curves
Type N Rule Curves
No Flood Pool
300 TAF
400 TAF
500 TAF
600 TAF 700 TAF
All Flood Pool
100 TAF
200 TAF
800 TAF
S149
P168
P167
P169P170
Non-dominated Solutions
N178
0.50
0.55
0.60
0.65
0.70
0.75
0.80
0.85
0.90
0.95
1.00
585,000 590,000 595,000 600,000 605,000 610,000 615,000
Pro
bab
ilit
y o
f De
vast
atin
g Fl
oo
d (%
)
Expected Annual Spill (AF)
Fixed Rule Curves
Type P Rule Curves
Type S Rule Curves
Type N Rule Curves
400 TAF
S149
P168
P167
P169
S151 S150
S147 S148
P145
Non-dominated Solutions
N182

46
Tradeoffs of flood risk and expected annual spill were also analyzed for a larger sized reservoir, assuming an increase of 200,000 AF over Folsom Reservoir’s current size of 966,000 AF (Figure 30). All fixed curve rule points shifted to the left, indicating a decrease in expected annual spill by 29 TAF to 50 TAF for the same size flood pool. Assuming a value of $100 per AF for lost water supply, the estimated annual benefit of the enlargement would be $2.9 M to $5.0 M per year. Alternatively, if the flood pool size was increased and the expected annual spill was held constant, flood risk could be decreased by approximately 0.10% to 0.40%. Assuming a total flood damage cost of $10 billion, this would produce an average annual benefit of $10 million to $40 million a year.
Figure 30. Comparisons of annual expected spill and probability of devastating flood for current size of Folsom Reservoir and for reservoir enlarged by 200,000 AF.
0.2
0.4
0.6
0.8
1.0
1.2
1.4
1.6
1.8
2.0
500,000 550,000 600,000 650,000 700,000 750,000 800,000 850,000 900,000
Pro
bab
ilit
y o
f D
eva
stat
ing
Flo
od
(%)
Expected Annual Spill (AF)
Current Size
Current Size+200 TAF

47
5.0 Discussion Variable precipitation index curves (Type P curves) were often useful in improving water supply benefits while maintaining or reducing flood risk. Type P curves using variable 400-600 TAF flood pools had refill probabilities up to 51% compared to fixed 400 TAF to 600 TAF rule curves that had refill probabilities ranging from 34% to 38%. At the same time, the Type P curves reduced or held constant flood risk, with Type P curve flood risk ranging from 0.51% to 0.70%, and fixed curve flood risk ranging from 0.51% to 0.87%. Adjusting the precipitation index during the refill period using normalized snowpack data produced Type S curves generating small but noticeable improvements in refill, and minor improvements in expected annual spill. For Type S curves, the snowpack index method that consistently gave best refill results was a 1:1 proportional adjustment in which the precipitation index was multiplied by the same percentage as the normalized snowpack data. Another snowpack index method that also produced useful results reduced precipitation indices by 20% to 50% depending on the range of normalized snowpack data. For most Type N curves, the probability of a devastating flood stayed the same or was at most slightly reduced. Any slight improvement in flood control performance should be interpreted cautiously because the synthetic floods forming the basis of this analysis were assigned the same ENSO classification as the seven historic floods that generated them. Five of the seven historic floods In the American River watershed occurred in La Niña years, and two occurred in neutral years. This is not a typical pattern for other watersheds in northern California, as shown in the literature review, and there is no guarantee that future floods in the American River basin will occur in La Niña or neutral years. Applying any ENSO index method significantly reduced the probability of refill for Type N curves based on lower precipitation index ranges (2-10 or 6-20). For Type N curves based on higher precipitation index ranges, the probability of refill was not affected because these were already on the shallowest flood pool during the refill season. In evaluating trade-offs between probability of devastating flood and expected annual spill, one non-dominated rule was Type N (N178), which has a 400-600 TAF flood pool, a precipitation index range of 2-10, and an ENSO index that increases the precipitation index by 20% in neutral years, 10% in La Niña years, and makes no adjustment in El Niño years (0.20/0.10/0). Several methods of applying an ENSO index adjustment were tried, but the 0.2/0.1/0 form of ENSO index was the only one that did not produce worse flood control results for any group compared to its related unadjusted Type S curve, and minimized impacts to refill compared to its unadjusted Type S curve. Fixed curves performed better for minimizing expected annual spill because a variable curve responds to increased basin wetness by releasing additional water in order to draw down to a deeper flood pool. This results in a higher potential for releases that are greater than downstream needs. Excluding the No Flood Pool and All Flood Pool alternatives, for all 162 variable rule curves evaluated there were 10 years that refilled regardless of the rule curve (generally, wet years such as 1982-1983), while there were 22 years that did not refill regardless of the rule curve (including the droughts years of 1976-1977, 1987-1992, and 2007-2008). For the 21 remaining years in the period of record, refill varies depending on the rule curve. Holding other rule curve parameters constant, Type P curves with lower precipitation index ranges do better for flood control while those with higher ranges do better for water supply. A range of 10-30 does the best for minimizing expected annual spill because it behaves most like a fixed curve.

48
Precipitation index values exceeded 30 only during the 1986 flood, and in many years, this puts the rule curve on the highest curve (smallest flood pool), which promotes frequent refill as well. Type P curves with a lower range (2-10) perform best for flood control because they cause the flood pool to deepen quickly in response to precipitation, but spill may be increased to maintain the deeper pool, and probability of refill may be reduced. The optimal flood pool range depends on desired trade-offs between reducing flood risk and providing water supply benefits. Generally, fixed rule curves from 400 TAF to 600 TAF, and variable rule curves with larger flood pool size ranges (400-600 TAF, 450-650 TAF, or 300-700 TAF) performed best in balancing these purposes. Extending the refill period increased average annual expected spill as additional releases must be made to follow the rule curve. A comparison of P5 and P7 index curves (Table 6) showed that, all other parameters being equal, extending the refill date from May 1 to June 1 increased the average annual expected spill from 650,983 AF to 697,519 AF (7.1%). These water supply losses must be balanced against late season flood risk if the reservoir is filled earlier. Analysis of 67 Type P curves in handling three late season flood events (March 15th, April 1st and April 15th) found that the best performing curves had in common the following start and end dates: (1) March 1-April 15 to April 10-June 1; (2) March 1-April 30 to May 10-June 1; and (3) March 1 to April 30-June 9. Overall, refill criteria of March 1 to April 30-June 9 appeared to provide a good balance of flood risk and water supply benefit. In optimizing trade-offs between probability of flooding and water supply, late season flood risk is important. The comparison of refill risk to probability of flooding (Figure 26) shows a cluster of curves that performed as well with respect to refill as the non-dominated curve P131. Yet, several of these curves did not perform well in the evaluation of late season flood risk, meaning that they resulted in releases greater than 160,000 cfs for a late season flood beginning April 15th (P131, P169, P170). The P170 rule curve also resulted in releases exceeding 160,000 cfs for a late season flood beginning April 1st. Only one rule curve, P110, performed well in the late season flood analysis, with releases less than 160,000 cfs for any of the flood dates. The comparison of expected annual spill and probability of flooding (Figure 28) also shows a cluster of Type S curves based on P145 that appear to be close to optimal. However, P145 did not perform well in the evaluation of late season flood risk (i.e. releases exceeded 160,000 cfs for the late season flood beginning April 15th). The application of a snowpack index to P145 would only tend to exacerbate the late season flood risk, as the flood pool would be even smaller in some years if potential refill from snowpack is taken into account. Other nearby points (P167 and P169) likewise did not perform well in the analysis of late season flood risk, with P167 exceeding releases of 160,000 cfs in both the April 1st and April 15th late season floods. In evaluating trade-offs in rule curve performance, economic costs of flood damages and lost water supply can quantified and considered. For example, the economic costs of a catastrophic flood are likely to be in a range of $8 billion to $15 billion, for purposes of illustration. The economic cost of “spilled” water is likely to range from $50/af to perhaps as high as $250/af for purposes of illustration. With estimates of the cost of a catastrophic flood and the unit economic loss from water supply spill, total expected value costs can be estimated for each rule curve. When the total costs are estimated for each rule curve, the least-cost rule curve can be identified. Figure 31 identifies the least-cost rule curve over a wide range of flood damage and water supply loss

49
costs. Where the cost of flooding is large, relative to the unit cost of lost water supply, larger flood pools are desired. When flood costs are small relative to unit water supply costs, if may be optimal to eliminate the flood control pool. In between, several non-dominated precipitation and precipitation-snowpack rules appear to be the most promising of the rules examined. For the likely range of flood damage and water loss costs, large flood pools seem to be the least-cost solutions, sometimes with precipitation indices.
Figure 31. Overall least-cost operating rule for different ranges of flood damage consequence and economic loss from spilled water.
0
5,000
10,000
15,000
20,000
25,000
30,000
35,000
40,000
0 200 400 600 800 1000
Dam
age
fro
m f
loo
d (
$ m
illi
on
s)
Loss from "spill" ($/af)
No flood pool
S149 rule
700 taf fixed
P170 rule
P167 rule
Likely range
50
6.0 Conclusions Real-time operation of Folsom Dam and Reservoir often can be improved by incorporating more information about watershed conditions into the rule curve. Variable precipitation index curves (Type P curves) were often useful compared to fixed curves in improving water supply benefits while maintaining or reducing flood risk. Type P curves with lower precipitation index ranges do better for flood control while those with higher ranges do better for water supply. Larger flood pool sizes performed best in balancing water supply and flood control performance (variable rule curves with size ranges of 400-600 TAF, 450-650 TAF, or 300-700 TAF, and fixed curves of 400 TAF to 600 TAF). Overall, refill criteria of March 1 to April 30-June 9 appeared to provide a good balance of flood risk and water supply benefit. Type S curves generated small but noticeable improvements in refill, and minor improvements in expected annual spill. For Type S curves, the snowpack index method that consistently gave best refill results was a 1:1 proportional adjustment in which the precipitation index was multiplied by the same percentage as the normalized snowpack data. Type N curves did not change the probability of a devastating flood, or at most slightly reduced this risk, while providing no water supply benefits. Incorporating an ENSO index significantly reduced the probability of refill for rule curves using lower precipitation index ranges (2-10, 6-20). Of the four ENSO index methods tried, increasing the precipitation index by 20% in neutral years, 10% in La Niña years, and making no adjustment in El Niño years (0.20/0.10/0) was the only one that did not worsen flood probability compared to related unadjusted Type S curves, and that minimized impacts to refill compared to the unadjusted Type S curves. In considering rule curve trade-offs between the probability of a devastating flood and the probability of refill or expected annual spill, a late season flood analysis showed that many of the non-dominated rule curves that might otherwise be preferred did not perform well in handling a March 15th, April 1st, or April 15th repeat of the February 1986 flood event. One Type P curve (P110) safely passed all of the late storms without exceeding downstream flows of 160,000 cfs, and retained reasonably good refill and spill performance compared to nearby non-dominated rule curves. P110 is has a 450-650 TAF flood pool size range, a precipitation index range of 8-24, and refill criteria of March 1 to April 30-June 9. Trade-offs in economic impacts can also be used to select an appropriate rule curve. For example, applying the probability of a devastating flood to estimated maximum flood damages of $10 billion and using an average value of $100 per AF for water supply, the non-dominated curve P170 produced equivalent economic losses for expected flood damages and annual spill. Compared to P110, P170 has a slightly larger flood pool range (500-700 TAF) and slightly higher precipitation index range (10-30), and the same refill criteria (March 1 to April 30-June 9). From an overall flood control perspective, P170 outperformed P110, except that P170 resulted in American River flows substantially exceeding 160,000 cfs in the late season flood analysis (generated April 15th storm outflow of 239,197 cfs). This late season flood risk would have to be weighed against the overall flood control performance of P170 (0.619%) compared to P110 (0.640%), and the reduction in expected annual spill for P170 (625,899 AF) compared to P110 (652,421 AF). The probabilities of refill for both curves are equal (50.9%). Thus, selecting a “best” rule curve depends on the policy considerations and priorities. Overall, this thesis demonstrates an approach to developing and evaluating a variety of flood rule curves. Despite the simplifications made, this approach appears to provide significant insights for

51
developing and selecting flood rule curves and provides economic and performance trade-off information for policy-makers. Further refinements are likely to be desirable to test and refine the results and conclusions of this work.

52
7.0 Future Studies Several improvements or refinements to this study seem promising. The value of short-term forecasts should be explored. Variable index rule curves (Type P and Type S) incorporate watershed conditions to how the basin would respond if a storm occurs. Type N curves potentially incorporate the likelihood of a storm occurring on a seasonal basis (month by month). The next step is incorporating short-term storm forecasts into flood control operations and possibly making advanced releases in anticipation of flood inflows. Future studies could incorporate short-term storm forecasts (5-day precipitation forecasts) as well as long-term forecasts (spring snowmelt runoff forecasts). Available upstream storage might be added to upstream wetness indices and variable index rule curves. The rule curve developed by the Sacramento Area Flood Control Agency (SAFCA) and currently adopted by the USBR considers available storage space in three reservoirs upstream of Folsom Reservoir. Improvements to the snowpack index might be explored. For this analysis, the snowpack index was applied only during the refill period because snowmelt has not historically driven flood hydrographs in the period of record. Precipitation index values were adjusted only if snowpack was less than average. With future climate change, snowpack in the watershed is expected to decrease, which might suggest increasing importance of taking snowpack index into account for refill purposes. Rain-on-snow events could also become more common under climate change conditions. Therefore, follow-up work could be done to incorporate a snowpack index more generally throughout the winter season, and to track the potential for runoff from both precipitation and snowmelt.
53
8.0 References
Carpenter, T., and Georgakakos, K. (2001) Assessment of Folsom Lake Response to Historical and Potential Future Climate Scenarios: 1. Forecasting. Journal of Hydrology, 249(1-4), 148-175.
Cayan, D., Redmond, K., and Riddle, L. (1999) ENSO and Hydrologic Extremes in the Western United
States. Journal of Climate, 12(12), 3516-3516.
Chang, F., Chen, L., and Chang, L. (2005) Optimizing the Reservoir Operating Rule Curves by Genetic Algorithms. Hydrological Processes, 19, 2277-2289.
Dettinger, M. (2011) Climate Change, Atmospheric Rivers, and Floods in California—A Multimodel
Analysis of Storm Frequency and Magnitude Changes. Journal of the American Water Resources Association, 47(3), 514-523.
Dettinger, M., Ralph, F.M., Das, T., Neiman P.J., and Cayan, D. (2011) Atmospheric Rivers, Floods and
the Water Resources of California. Water, 3, 445-478. Field, R.C. (2007), “Multi-Objective Optimization of Folsom Reservoir Operation,” Masters thesis,
Department of Civil and Environmental Engineering, University of California, Davis. Georgakakos, K., and Graham, N. (2008) Potential Benefits of Seasonal Inflow Prediction Uncertainty
for Reservoir Release Decisions. Journal of Applied Meteorology and Climatology, 47(5),
1297-1321.
Graham, N., and Georgakakos, K. (2010) Toward Understanding the Value of Climate Information for Multiobjective Reservoir Management under Present and Future Climate and Demand Scenarios. Journal of Applied Meteorology and Climatology, 49(4), 557-573.
Hazen, A. (1914) “Storage to be Provided in Impounding Reservoirs for Municipal Water Supply,"
Transactions of the American Society of Civil Engineers, Vol. 77, December, 1542-1669.
Higgins, R., Chen, Y., and Douglas, A. (1999) Interannual Variability of the North American Warm
Season Precipitation Regime. Journal of Climate, 12(3), 653-680.
Higgins, R.W., Schemm, J.-K. E., Shi, W. and Leetmaa, A. (2000) Extreme Precipitation Events in the Western United States Related to Tropical Forcing. Journal of Climate, 13, 793-820.
Ji, P. (2011) Reservoir Re-operation, Risk, and Levee Failure Analysis: Mokelumne River Case. PhD
dissertation, University of California, Davis. Jones, C. (2000). Occurrence of Extreme Precipitation Events in California and Relationships with the
Madden-Julian Oscillation. Journal of Climate, 13(20), 3576-3587.
Knowles, N., Dettinger, M., and Cayan, D. (2006) Trends in Snowfall Versus Rainfall in the Western
United States. Journal of Climate, 19(18), 4545-4559.

54
Lee, S., Hamlet, A., Fitzgerald, C., and Burges, S. (2009) Optimized Flood Control in the Columbia River Basin for a Global Warming Scenario. Journal of Water Resources Planning and Management, 135(6), 440-450.
Lee, S., Hamlet, A., Fitzgerald, C., and Burges, S. (2010) Methodology for Developing Flood Rule
Curves Conditioned on El Nino-Southern Oscillation Classification1. Journal of the American Water Resources Association, 47(1), 81-92.
Leung, L., Qian, Y., Bian, X., and Hunt, A. (2003) Hydroclimate of the Western United States Based on
Observations and Regional Climate Simulation of 1981-2000. Part II: Mesoscale ENSO anomalies. Journal of Climate, 16(12), 1912-1928.
Liu, X., Guo, S., Liu, P., et al. (2011) Deriving Optimal Refill Rules for Multi-Purpose Reservoir
Operations. Water Resources Management, 25, 431-448. Lund, J. R. and Ferreira, I. (1996) Operating Rule Optimization for the Missouri River Reservoir
System. Journal of Water Resources Planning and Management, ASCE, 12(4), 287-295. Lund, J. R. and Guzman, J. (1996) Developing Seasonal and Long-Term Reservoir System Operation
Plans Using HEC-PRM. Technical Report No. RD-40. Hydrologic Engineering Center, U.S. Army Corps of Engineers, Davis, California.
Lund, J. R. and Guzman, J. (1999) Derived Operating Rules for Reservoirs in Series or in Parallel.
Journal of Water Resources Planning and Management, 125(3), 143-153. Mo, K., and Higgins, R. (1997) Tropical Influences on California Precipitation. Journal of Climate,
11(3), 412-430. Regonda, S. K., Rajagopalan, B., Clark, M., Pitlick, J.( 2005) Seasonal Cycle Shifts in Hydroclimatology
over the Western United States. Journal of Climate, 18: 372-284. Sankarasubramanian, A., Lall, U., Devineni, N., Espinueva, S. (2009) The Role of Monthly Updated
Climate Forecasts in Improving Intraseasonal Water Allocation. Journal of Applied Meteorology and Climatology, 48(7), 1464-1482.
Schoner, T., and Nicholson, S. (1989) The Relationship Between California Rainfall and ENSO Events.
Journal of Climate, 2(11), 1258-1269.
Simonovic, S. (1992) Reservoir Systems Analysis: Closing Gap Between Theory and Practice. Journal of Water Resources Planning and Management, 118(3).
U.S. Army Corps of Engineers (1956) Folsom Dam and Lake, American River, California, Water
Control Manual. U.S. Army Corps of Engineers (1977) Folsom Dam and Lake, American River, California,Water Control
Manual.
55
U.S. Army Corps of Engineers. (1986) Folsom Dam and Lake, American River, California, Water Control Manual.
U.S. Army Corps of Engineers (2004) Folsom Dam and Lake, American River, California, Water Control
Manual Update. U.S. Army Corps of Engineers. 2002. Forecast-based Advance Release at Folsom Dam: Effectiveness
and Risks – Phase 1 (PR-48).
U.S. Bureau of Reclamation. 2008. Biological Assessment on the Continued Long-term Operations of
the Central Valley Project and State Water Project. pp. 6-12 – 6-13, 12-2 – 12-32.
[http://www.usbr.gov/mp/cvo/ocap_page.html]
Wernstedt, K, and Hersh, R. (2002) Climate Forecasts in Flood Planning: Promise and Ambiguity.
Journal of the American Water Resources Association, 38(6), 1703-1713.
Willis, A., Lund, J.R., Townsley, E. (2011) Climate Change and Flood Operations in the Sacramento Basin, California. San Francisco Estuary and Watershed Science, 9(2) 2-18.
Yao, H., and Georgakakos, A. (2001) Assessment of Folsom Lake Response to Historical and Potential
Future Climate Scenarios: 2. Reservoir Management. Journal of Hydrology, 249(1-4), 176-196.

56
APPENDIX A. Historical Floods
Figure A1. December 1955 flood.
0
50000
100000
150000
200000
250000
12/16/1955 12/18/1955 12/20/1955 12/22/1955 12/24/1955 12/26/1955 12/28/1955 12/30/1955
Flo
w (
cfs)

57
Figure A2. January 1963 flood.
Figure A3. December 1964 flood.
0
50,000
100,000
150,000
200,000
250,000
300,000
1/25/1963 1/27/1963 1/29/1963 1/31/1963 2/2/1963 2/4/1963 2/6/1963 2/8/1963
Flo
w (
cfs)
0
50000
100000
150000
200000
250000
300000
12/16/1964 12/18/1964 12/20/1964 12/22/1964 12/24/1964 12/26/1964 12/28/1964 12/30/1964
Flo
w (
cfs)

58
Figure A4. January 1980 flood.
Figure A5. February 1982 flood.
0
20,000
40,000
60,000
80,000
100,000
120,000
1/7/1980 1/9/1980 1/11/1980 1/13/1980 1/15/1980 1/17/1980 1/19/1980 1/21/1980
Flo
w (
cfs)
0
20,000
40,000
60,000
80,000
100,000
120,000
140,000
2/9/1982 2/11/1982 2/13/1982 2/15/1982 2/17/1982 2/19/1982 2/21/1982 2/23/1982
Flo
w (
cfs)

59
Figure A6. February 1986 flood.
Figure A7. January 1997 flood.
0
50000
100000
150000
200000
250000
2/11/1986 2/13/1986 2/15/1986 2/17/1986 2/19/1986 2/21/1986 2/23/1986 2/25/1986
Flo
w (
cfs)
0
50000
100000
150000
200000
250000
300000
12/26/1996 12/28/1996 12/30/1996 1/1/1997 1/3/1997 1/5/1997 1/7/1997 1/9/1997
Flo
w (
cfs)

60
APPENDIX B. Synthetic Floods Table B1. Summary of Synthetic Floods
Event Number Event Shape
Instantaneous Peak Flow (cfs)
One-day Average Flow
(cfs)
Three-day Average Flow
(cfs)
1 Jan 1997 771,561 661,423 433,519
2 Dec 1964 751,334 610,856 394,007
3 Dec 1964 709,772 577,065 372,212
4 Jan 1997 676,889 580,265 380,325
5 Jan 1963 677,909 514,027 256,887
6 Jan 1997 531,793 455,881 298,800
7 Dec 1955 517,192 447,751 302,033
8 Jan 1963 572,240 433,902 216,844
9 Jan 1963 568,136 430,791 215,289
10 Jan 1963 544,950 413,210 206,503
11 Dec 1955 474,469 410,764 277,084
12 Jan 1997 479,007 410,631 269,141
13 Dec 1964 487,854 396,639 255,836
14 Feb 1986 414,470 387,031 297,263
15 Jan 1997 445,061 381,530 250,067
16 Jan 1997 438,867 376,220 246,587
17 Jan 1997 438,238 375,681 246,234
18 Dec 1964 453,646 368,827 237,897
19 Jan 1997 428,256 367,124 240,625
20 Jan 1963 473,179 358,790 179,307
21 Feb 1986 377,576 352,580 270,802
22 Feb 1986 376,136 351,235 269,770
23 Jan 1997 407,341 349,195 228,874
24 Dec 1964 409,267 332,746 214,624
25 Dec 1964 408,450 332,081 214,195
26 Dec 1955 374,730 324,417 218,838
27 Jan 1963 421,641 319,711 159,777
28 Dec 1964 396,002 321,961 207,668
29 Jan 1963 420,853 319,113 159,478
30 Dec 1955 367,121 317,830 214,394
31 Feb 1986 338,953 316,514 243,101
32 Dec 1964 385,163 313,149 201,984
33 Dec 1955 360,911 312,453 210,768
34 Dec 1964 383,314 311,645 201,014
35 Jan 1963 403,083 305,639 152,744
36 Feb 1986 331,132 309,210 237,492

61
37 Dec 1964 371,229 301,820 194,676
38 Jan 1963 390,307 295,951 147,903
39 Feb 1982 349,017 296,183 189,273
40 Feb 1986 314,781 293,942 225,765
41 Feb 1982 341,460 289,770 185,175
42 Jan 1963 371,667 281,818 140,839
43 Jan 1997 328,399 281,521 184,519
44 Jan 1963 364,099 276,079 137,972
45 Feb 1986 292,404 273,046 209,716
46 Jan 1963 353,185 267,804 133,836
47 Feb 1982 318,836 270,571 172,906
48 Jan 1963 351,841 266,785 133,327
49 Feb 1982 315,815 268,007 171,267
50 Dec 1955 308,542 267,116 180,185
51 Feb 1986 286,038 267,101 205,150
52 Jan 1963 345,691 262,121 130,996
53 Feb 1982 304,092 258,059 164,910
54 Dec 1955 293,226 253,856 171,240
55 Jan 1980 287,259 249,024 196,152
56 Dec 1955 284,145 245,994 165,937
57 Feb 1982 284,247 241,218 154,148
58 Feb 1986 256,162 239,204 183,722
59 Feb 1982 280,831 238,319 152,296
60 Jan 1997 279,497 239,600 157,042
61 Jan 1997 273,815 234,729 153,849
62 Jan 1997 271,506 232,750 152,552
63 Dec 1964 282,775 229,904 148,290
64 Jan 1997 270,441 231,837 151,954
65 Dec 1964 281,761 229,080 147,758
66 Feb 1982 270,293 229,376 146,580
67 Feb 1986 245,261 229,024 175,904
68 Jan 1980 264,052 228,905 180,305
69 Feb 1982 267,658 227,140 145,152
70 Dec 1964 277,332 225,479 145,436
71 Dec 1964 270,196 219,677 141,694
72 Jan 1963 285,066 216,152 108,023
73 Feb 1982 256,742 217,877 139,232
74 Jan 1997 254,919 218,530 143,232
75 Jan 1963 282,312 214,064 106,979
76 Dec 1964 264,081 214,705 138,487
77 Jan 1980 247,641 214,679 169,100

62
78 Dec 1955 246,617 213,505 144,021
79 Feb 1982 250,618 212,679 135,911
80 Feb 1986 227,055 212,023 162,847
81 Jan 1963 275,867 209,177 104,537
82 Jan 1963 275,405 208,827 104,362
83 Jan 1963 274,387 208,054 103,976
84 Dec 1964 257,086 209,018 134,819
85 Dec 1955 241,545 209,114 141,059
86 Dec 1955 239,869 207,663 140,081
87 Dec 1964 254,802 207,161 133,621
88 Dec 1955 239,335 207,200 139,768
89 Jan 1997 243,460 208,707 136,793
90 Dec 1964 253,195 205,855 132,778
91 Feb 1986 220,913 206,288 158,442
92 Jan 1963 267,506 202,837 101,369
93 Dec 1964 250,867 203,962 131,557
94 Feb 1982 240,991 204,510 130,690
95 Dec 1964 249,290 202,680 130,730
96 Feb 1986 217,637 203,228 156,092
97 Jan 1980 231,745 200,899 158,245
98 Dec 1964 244,474 198,765 128,205
99 Jan 1980 230,124 199,493 157,138
100 Feb 1986 213,140 199,030 152,867

63
APPENDIX C. Summary of Rule Curve Characteristics and Results Table C1. Summary of Rule Curve Characteristics and Results
Synthetic Events Period of Record
Rule Curve
Refill Dates
Flood Pool Size
(TAF) Precip Index
Snow Index
ENSO Index
Annual Prob.
Of Dev. Flood
(%)
Prob. of outflow (%) greater than
Prob. > 466 ft. (Top of Flood
Pool) (%)
Annual Prob.
Of Refill (%)
Annual Expected Spill (AF)
Begin End 115,000
cfs 160,000
cfs Median Average
Ratio to No Flood Pool Spill
All Flood Pool
3/1 6/1 All Flood
Pool na na na 0.475 0.76 0.24 0.42 24.5 465,771 840,543 1.537
No Flood Pool
3/1 6/1 No Flood
Pool na na na 2.000 2.00 2.00 2.00 64.2 47,179 546,726 1.000
100 TAF 3/1 6/1 100 TAF na na na 1.977 2.00 2.00 2.00 43.4 110,590 561,096 1.026
200 TAF 3/1 6/1 200 TAF na na na 1.577 1.90 1.60 1.98 41.5 151,179 570,783 1.044
300 TAF 3/1 6/1 300 TAF na na na 1.162 1.32 1.14 1.48 41.5 163,610 582,149 1.065
400 TAF 3/1 6/1 400 TAF na na na 0.873 1.14 0.78 1.24 37.7 173,442 597,058 1.092
500 TAF 3/1 6/1 500 TAF na na na 0.689 0.94 0.60 0.88 37.7 157,907 618,621 1.132
600 TAF 3/1 6/1 600 TAF na na na 0.515 0.80 0.32 0.64 34.0 234,727 653,044 1.194
700 TAF 3/1 6/1 700 TAF na na na 0.469 0.74 0.28 0.44 30.2 319,301 709,438 1.298
800 TAF 3/1 6/1 800 TAF na na na 0.466 0.70 0.28 0.44 28.3 412,162 782,053 1.430
P2 3/1-3/20 4/20-5/30 400-600 6 - 20 na na 0.653 0.90 0.48 0.70 45.3 273,503 701,718 1.283
P3 3/1-3/20 4/20-5/30 400-600 2 - 10 na na 0.514 0.80 0.32 0.64 35.8 310,989 722,158 1.321
P4 3/1-3/20 4/20-5/30 400-600 8 - 24 na na 0.699 0.92 0.56 0.78 50.9 180,683 650,272 1.189
P5 3/1 6/1 400-600 6 - 20 na na 0.653 0.90 0.48 0.70 37.7 251,527 697,519 1.276
P6 3/31 5/31 400-600 8 - 20 na na 0.690 0.92 0.54 0.80 34.0 257,740 704,449 1.288
P7 3/1 5/1 400-600 6 - 20 na na 0.653 0.90 0.48 0.70 50.9 243,427 650,983 1.191
P8 3/31 5/31 400-600 6 - 20 na na 0.653 0.90 0.48 0.70 32.1 362,055 743,782 1.360
P9 3/1-4/15 4/10-6/1 400-600 6 - 20 na na 0.653 0.90 0.48 0.70 41.5 360,833 721,015 1.319
P10 3/2-4/21 4/15-6/10 400-600 6 - 20 na na 0.653 0.90 0.48 0.70 41.5 389,914 744,607 1.362
P11 3/1 6/1 200-600 6 - 20 na na 0.764 1.02 0.62 0.92 41.5 323,187 727,907 1.331

64
Synthetic Events Period of Record
Rule Curve
Refill Dates
Flood Pool Size
(TAF) Precip Index
Snow Index
ENSO Index
Annual Prob.
Of Dev. Flood
(%)
Prob. of outflow (%) greater than
Prob. > 466 ft. (Top of Flood
Pool) (%)
Annual Prob.
Of Refill (%)
Annual Expected Spill (AF)
Begin End 115,000
cfs 160,000
cfs Median Average
Ratio to No Flood Pool Spill
P12 3/1 6/1 300-600 6 - 20 na na 0.715 1.00 0.56 0.90 41.5 301,094 723,916 1.324
P13 3/1 6/1 200-600 6 - 20 na na 0.799 1.06 0.68 0.94 41.5 333,016 731,269 1.338
P14 3/1 6/1 300-700 6 - 20 na na 0.621 0.86 0.44 0.62 39.6 315,229 754,285 1.380
P15 3/1 6/1 300-700 5 - 22 na na 0.621 0.86 0.44 0.62 39.6 270,736 723,483 1.323
P21 3/1 6/1 400-600 4 - 18 na na 0.613 0.86 0.42 0.66 37.7 257,620 676,006 1.236
P22 3/1 6/1 400-600 6 - 18 na na 0.629 0.88 0.46 0.70 37.7 240,112 689,870 1.262
P23 3/1 6/1 400-600 6 - 22 na na 0.656 0.90 0.48 0.70 37.7 237,888 675,762 1.236
P24 3/1 6/1 400-600 4 - 20 na na 0.652 0.86 0.48 0.68 37.7 221,245 675,215 1.235
P25 3/1 6/1 400-600 6 - 24 na na 0.677 0.90 0.52 0.78 37.7 198,464 649,173 1.187
P26 3/1 6/1 300-700 4 - 18 na na 0.555 0.82 0.34 0.52 37.7 325,495 737,013 1.348
P27 3/1 6/1 300-700 6 - 22 na na 0.706 0.98 0.52 0.82 41.5 262,676 714,264 1.306
P28 3/1 6/1 300-700 4 - 20 na na 0.634 0.88 0.46 0.72 41.5 262,676 714,264 1.306
P29 3/1 6/1 300-700 6 - 20 na na 0.659 0.94 0.48 0.76 41.5 291,145 731,347 1.338
P30 3/1 6/1 300-700 4 - 21 na na 0.599 0.86 0.40 0.62 37.7 269,663 723,454 1.323
P31 3/1 6/1 300-700 5 - 25 na na 0.689 0.96 0.52 0.80 41.5 230,656 691,468 1.265
P32 3/1 6/1 300-700 8 - 24 na na 0.801 1.00 0.66 0.82 41.5 231,599 691,144 1.264
P33 3/1 6/1 300-700 6 - 24 na na 0.656 0.88 0.52 0.72 41.5 282,941 700,868 1.282
P34 3/1 6/1 300-700 4 - 20 na na 0.557 0.82 0.34 0.54 37.7 296,141 744,980 1.363
P35 3/1 6/1 400-600 4 - 20 na na 0.645 0.86 0.50 0.70 37.7 202,080 667,248 1.220
P36 3/1 6/1 400-600 8 - 20 na na 0.687 0.90 0.54 0.78 37.7 209,035 668,733 1.223
P37 3/1 6/1 400-600 3 - 18 na na 0.629 0.86 0.48 0.68 37.7 221,000 676,815 1.238
P38 3/1 6/1 400-600 10 - 22 na na 0.661 0.94 0.50 0.82 37.7 202,576 659,403 1.206
P39 3/1 6/1 300-700 4 - 21 na na 0.634 0.88 0.46 0.72 37.7 274,753 745,077 1.363
P40 3/1 6/1 400-600 10 - 30 na na 0.701 0.98 0.58 0.90 37.7 183,571 630,888 1.154
P41 3/1-3/20 4/20-5/30 400-600 2 - 10 na na 0.514 0.80 0.32 0.64 35.8 310,989 722,158 1.321

65
Synthetic Events Period of Record
Rule Curve
Refill Dates
Flood Pool Size
(TAF) Precip Index
Snow Index
ENSO Index
Annual Prob.
Of Dev. Flood
(%)
Prob. of outflow (%) greater than
Prob. > 466 ft. (Top of Flood
Pool) (%)
Annual Prob.
Of Refill (%)
Annual Expected Spill (AF)
Begin End 115,000
cfs 160,000
cfs Median Average
Ratio to No Flood Pool Spill
P42 3/1 4/30-6/9 400-600 2 - 10 na na 0.514 0.80 0.32 0.64 35.8 304,037 700,703 1.282
P43 3/1-3/25 4/25-5/19 400-600 2 - 10 na na 0.514 0.80 0.32 0.64 35.8 334,598 719,165 1.315
P44 3/1-4/30 5/1-6/1 400-600 2 - 10 na na 0.514 0.80 0.32 0.64 20.8 445,148 797,330 1.458
P45 3/1-3/20 4/20-5/30 400-600 6 - 18 na na 0.629 0.88 0.46 0.70 45.3 290,433 713,069 1.304
P46 3/1 4/30-6/9 400-600 6 - 18 na na 0.629 0.88 0.46 0.70 49.1 253,448 701,614 1.283
P47 3/1-3/25 4/25-5/19 400-600 6 - 18 na na 0.629 0.88 0.46 0.70 45.3 262,117 706,579 1.292
P48 3/1-4/30 5/1-6/1 400-600 6 - 18 na na 0.629 0.88 0.46 0.70 45.3 312,346 735,142 1.345
P49 3/1-4/15 4/10-6/1 400-600 6 - 18 na na 0.629 0.88 0.46 0.70 41.5 378,037 739,454 1.353
P50 3/1-4/15 4/10-6/1 400-600 2 - 10 na na 0.514 0.80 0.32 0.64 22.6 445,353 775,464 1.418
P51 3/1-3/25 4/25-5/19 300-700 4 - 21 na na 0.634 0.88 0.46 0.72 49.1 250,406 735,568 1.345
P52 3/1-3/20 4/20-5/30 300-700 4 - 21 na na 0.634 0.88 0.46 0.72 47.2 275,093 742,033 1.357
P53 3/1 4/30-6/9 300-700 4 - 21 na na 0.634 0.88 0.46 0.72 50.9 257,669 734,239 1.343
P54 3/1-4/15 4/10-6/1 300-700 4 - 21 na na 0.634 0.88 0.46 0.72 47.2 318,649 757,245 1.385
P62 3/1-3/25 4/25-5/19 400-600 6 - 20 na na 0.653 0.90 0.48 0.70 45.3 249,868 693,350 1.268
P63 3/1-4/30 5/1-6/1 400-600 6 - 20 na na 0.653 0.90 0.48 0.70 45.3 298,539 718,340 1.314
P64 3/15 5/15 400-600 6 - 20 na na 0.653 0.90 0.48 0.70 39.6 259,114 696,059 1.273
P65 3/1 4/30-6/9 400-600 6 - 20 na na 0.653 0.90 0.48 0.70 49.1 243,963 690,829 1.264
S66 3/1-3/20 4/20-5/30 400-600 6 - 20 1-3 na 0.653 0.90 0.48 0.70 37.7 257,101 689,314 1.261
S67 3/1-3/20 4/20-5/30 400-600 6 - 20 1-1 na 0.653 0.90 0.48 0.70 37.7 262,868 690,366 1.263
S68 3/1-3/20 4/20-5/30 400-600 6 - 20 0-2 na 0.653 0.90 0.48 0.70 37.7 257,101 690,479 1.263
S69 3/1-3/20 4/20-5/30 400-600 6 - 20 1-5 na 0.653 0.90 0.48 0.70 37.7 257,101 689,481 1.261
S70 3/1-3/20 4/20-5/30 400-600 6 - 20 2-10 na 0.653 0.90 0.48 0.70 37.7 257,101 687,829 1.258
P74 3/1-4/30 5/1-6/1 300-700 4 - 21 na na 0.634 0.88 0.46 0.72 47.2 316,540 758,611 1.388
P75 3/1-4/30 5/1-6/1 300-700 4 - 20 na na 0.557 0.82 0.34 0.54 37.7 341,168 777,965 1.423
P76 3/1-3/25 4/25-5/19 300-700 4 - 20 na na 0.557 0.82 0.34 0.54 39.6 312,844 744,423 1.362

66
Synthetic Events Period of Record
Rule Curve
Refill Dates
Flood Pool Size
(TAF) Precip Index
Snow Index
ENSO Index
Annual Prob.
Of Dev. Flood
(%)
Prob. of outflow (%) greater than
Prob. > 466 ft. (Top of Flood
Pool) (%)
Annual Prob.
Of Refill (%)
Annual Expected Spill (AF)
Begin End 115,000
cfs 160,000
cfs Median Average
Ratio to No Flood Pool Spill
P77 3/1-3/20 4/20-5/30 300-700 4 - 20 na na 0.557 0.82 0.34 0.54 37.7 335,621 755,929 1.383
P78 3/1 4/30-6/9 300-700 4 - 20 na na 0.557 0.82 0.34 0.54 43.4 294,905 739,840 1.353
P79 3/1-4/15 4/10-6/1 300-700 4 - 20 na na 0.557 0.82 0.34 0.54 37.7 429,330 786,354 1.438
S80 3/1 4/30-6/9 300-700 4 - 20 2-10 na 0.557 0.82 0.34 0.54 41.5 326,487 726,390 1.329
S81 3/1 4/30-6/9 300-700 4 - 20 1-4 na 0.557 0.82 0.34 0.54 41.5 326,487 730,205 1.336
S82 3/1 6/1 300-700 4 - 20 2-10 na 0.557 0.82 0.34 0.54 37.7 321,905 736,868 1.348
S83 3/1 6/1 300-700 4 - 20 1-4 na 0.557 0.82 0.34 0.54 37.7 321,905 740,572 1.355
S84 3/1-3/25 4/25-5/19 300-700 4 - 20 2-10 na 0.557 0.82 0.34 0.54 39.6 332,169 728,498 1.332
S85 3/1-3/25 4/25-5/19 300-700 4 - 20 1-4 na 0.557 0.82 0.34 0.54 39.6 332,169 732,205 1.339
S86 3/1-3/25 4/25-5/19 300-700 4 - 21 1-4 na 0.634 0.88 0.46 0.72 49.1 227,587 717,257 1.312
S87 3/1-3/25 4/25-5/19 300-700 4 - 21 2-10 na 0.634 0.88 0.46 0.72 49.1 227,587 713,955 1.306
S88 3/1 6/1 300-700 4 - 21 1-4 na 0.634 0.88 0.46 0.72 39.6 284,372 733,772 1.342
S89 3/1 6/1 300-700 4 - 21 2-10 na 0.634 0.88 0.46 0.72 39.6 284,372 730,410 1.336
S90 3/1 4/30-6/9 300-700 4 - 21 2-10 na 0.634 0.88 0.46 0.72 50.9 252,586 713,841 1.306
S91 3/1 4/30-6/9 300-700 4 - 21 1-4 na 0.634 0.88 0.46 0.72 50.9 252,586 717,624 1.313
P92 3/1 6/1 400-800 5 - 25 na na 0.597 0.84 0.40 0.58 37.7 269,764 738,585 1.351
P93 3/1 6/1 200-400 4 - 20 na na 0.984 1.16 0.92 1.20 41.5 230,735 629,718 1.152
P94 3/1 6/1 200-400 6 - 20 na na 1.003 1.16 0.96 1.12 41.5 247,422 640,748 1.172
P95 3/1 6/1 600-800 6 - 20 na na 0.514 0.82 0.28 0.44 34.0 396,548 781,356 1.429
P96 3/1 6/1 500-800 10 - 28 na na 0.619 0.86 0.42 0.60 37.7 167,624 662,905 1.212
P97 3/1 6/1 0-400 4 - 20 na na 1.205 1.52 1.14 1.54 54.7 209,531 653,384 1.195
S105 3/1-3/20 4/20-5/30 400-600 2 - 10 0-0.5 na 0.514 0.80 0.32 0.64 35.8 326,256 717,494 1.312
S106 3/1-3/20 4/20-5/30 400-600 2 - 10 0-0.2 na 0.514 0.80 0.32 0.64 35.8 308,804 719,122 1.315
S107 3/1 4/30-6/9 400-600 2 - 10 0.1-0.5 na 0.514 0.80 0.32 0.64 39.6 303,508 697,854 1.276
S108 3/1 4/30-6/9 400-600 2 - 10 0-0.2 na 0.514 0.80 0.32 0.64 37.7 303,508 698,192 1.277

67
Synthetic Events Period of Record
Rule Curve
Refill Dates
Flood Pool Size
(TAF) Precip Index
Snow Index
ENSO Index
Annual Prob.
Of Dev. Flood
(%)
Prob. of outflow (%) greater than
Prob. > 466 ft. (Top of Flood
Pool) (%)
Annual Prob.
Of Refill (%)
Annual Expected Spill (AF)
Begin End 115,000
cfs 160,000
cfs Median Average
Ratio to No Flood Pool Spill
P109 3/1 4/30-6/9 450-600 2 - 10 na na 0.571 0.84 0.36 0.60 37.7 283,834 693,840 1.269
P110 3/1 4/30-6/9 450-650 8 - 24 na na 0.640 0.88 0.48 0.68 50.9 169,276 652,421 1.193
S111 3/1 4/30-6/9 400-600 6 - 20 0.1-0.5 na 0.653 0.82 0.34 0.54 50.9 243,583 685,790 1.254
S112 3/1 4/30-6/9 300-700 4 - 20 1:1 na 0.557 0.82 0.34 0.54 43.4 294,905 735,391 1.345
S113 3/1-3/20 4/20-5/30 300-700 4 - 20 1:1 na 0.557 0.82 0.34 0.54 37.7 335,621 749,311 1.371
S114 3/1-3/20 4/20-5/30 300-700 4 - 20 0.1-0.5 na 0.557 0.82 0.34 0.54 37.7 335,621 753,339 1.378
P115 3/1 4/30-6/9 400-600 8 - 24 na na 0.699 0.92 0.56 0.78 50.9 184,686 641,364 1.173
P116 3/1 6/1 400-600 8 - 24 na na 0.699 0.92 0.56 0.78 37.7 200,637 659,996 1.207
S118 3/1-3/20 4/20-5/30 400-600 8 - 24 0.1-0.5 na 0.699 0.92 0.56 0.78 0.0 439,955 783,311 1.433
S119 3/1 4/30-6/9 400-600 8 - 24 0.1-0.5 na 0.699 0.92 0.56 0.78 50.9 184,686 638,096 1.167
S120 3/1 6/1 400-600 8 - 24 0.1-0.5 na 0.699 0.92 0.56 0.78 37.7 200,637 657,916 1.203
P121 3/1 4/30-6/9 300-500 6 - 20 na na 0.784 1.00 0.66 0.94 50.9 240,328 664,045 1.215
P122 3/1 4/30-6/9 350-550 6 - 20 na na 0.720 0.92 0.58 0.76 50.9 247,992 676,883 1.238
P123 3/1 4/30-6/9 450-650 6 - 20 na na 0.570 0.86 0.34 0.58 47.2 275,341 701,836 1.284
P124 3/1 4/30-6/9 500-700 6 - 20 na na 0.527 0.84 0.30 0.52 41.5 313,418 722,508 1.322
S125 3/1 4/30-6/9 400-600 8 - 24 1-4 na 0.699 0.92 0.56 0.78 50.9 184,686 639,553 1.170
S126 3/1 4/30-6/9 400-600 8 - 24 2-8 na 0.699 0.92 0.56 0.78 50.9 184,686 637,064 1.165
P127 3/1 4/30-6/9 550-750 6 - 20 na na 0.526 0.84 0.28 0.46 37.7 358,684 747,205 1.367
P128 3/1 4/30-6/9 600-800 6 - 20 na na 0.514 0.82 0.28 0.44 37.7 404,277 777,247 1.422
P129 3/1-3/20 4/30-6/9 450-650 8 - 24 na na 0.643 0.88 0.48 0.68 50.9 180,714 666,173 1.218
P130 3/1-3/20 4/30-6/9 500-700 8 - 24 na na 0.584 0.86 0.36 0.58 45.3 205,455 681,513 1.247
P131 3/1 4/30-6/9 500-700 8 - 24 na na 0.584 0.86 0.36 0.58 50.9 205,455 666,635 1.219
P138 3/1 4/30-6/9 300-500 8 - 24 na na 0.882 1.04 0.82 0.98 52.8 194,667 620,500 1.135
P139 3/1 4/30-6/9 350-550 8 - 24 na na 0.786 0.98 0.72 0.92 50.9 195,143 629,498 1.151
P140 3/1-3/25 4/25-5/19 400-600 8 - 24 na na 0.699 0.92 0.56 0.78 50.9 172,493 644,026 1.178

68
Synthetic Events Period of Record
Rule Curve
Refill Dates
Flood Pool Size
(TAF) Precip Index
Snow Index
ENSO Index
Annual Prob.
Of Dev. Flood
(%)
Prob. of outflow (%) greater than
Prob. > 466 ft. (Top of Flood
Pool) (%)
Annual Prob.
Of Refill (%)
Annual Expected Spill (AF)
Begin End 115,000
cfs 160,000
cfs Median Average
Ratio to No Flood Pool Spill
P141 3/1-4/30 5/1-6/1 400-600 8 - 24 na na 0.699 0.92 0.56 0.78 50.9 181,117 652,676 1.194
P142 3/1-4/15 4/10-6/1 400-600 8 - 24 na na 0.699 0.92 0.56 0.78 49.1 180,443 657,662 1.203
P143 3/1 4/30-6/9 550-750 8 - 24 na na 0.550 0.84 0.32 0.50 43.4 249,424 686,388 1.255
P144 3/1 4/30-6/9 600-800 8 - 24 na na 0.521 0.82 0.28 0.46 41.5 294,491 711,739 1.302
P145 3/1 4/30-6/9 400-600 10-30 na na 0.701 0.98 0.58 0.90 50.9 147,634 604,011 1.105
P146 3/1-3/20 4/20-5/30 400-600 10-30 na na 0.701 0.98 0.58 0.90 50.9 142,325 613,075 1.121
S147 3/1 4/30-6/9 400-600 10-30 2 -8 na 0.701 0.98 0.58 0.90 50.9 147,634 601,317 1.100
S148 3/1 4/30-6/9 400-600 10-30 1 - 4 na 0.701 0.98 0.58 0.90 50.9 147,634 602,795 1.103
S149 3/1 4/30-6/9 400-600 10-30 0.2 - 0.5 na 0.701 0.98 0.58 0.90 50.9 147,634 600,762 1.099
S150 3/1 4/30-6/9 400-600 10-30 0 - 0.2 na 0.701 0.98 0.58 0.90 50.9 147,634 603,577 1.104
S151 3/1 4/30-6/9 400-600 10-30 1:1 na 0.701 0.98 0.58 0.90 50.9 147,634 601,847 1.101
S152 3/1 4/30-6/9 300-500 8 - 24 1:1 na 0.882 1.04 0.82 0.98 52.8 194,376 618,830 1.132
S153 3/1 4/30-6/9 300-500 8 - 24 0 - 0.2 na 0.882 1.04 0.82 0.98 52.8 194,376 620,151 1.134
S154 3/1 4/30-6/9 300-500 8 - 24 0.2 - 0.5 na 0.882 1.04 0.82 0.98 52.8 194,376 617,593 1.130
S155 3/1 4/30-6/9 300-500 8 - 24 1 - 4 na 0.882 1.04 0.82 0.98 52.8 194,376 620,082 1.134
S156 3/1 4/30-6/9 300-500 8 - 24 2 -8 na 0.882 1.04 0.82 0.98 52.8 194,376 618,206 1.131
S157 3/1 4/30-6/9 400-600 2 - 10 2 -8 na 0.514 0.80 0.32 0.64 39.6 303,508 697,237 1.275
S158 3/1 4/30-6/9 400-600 2 - 10 1 - 4 na 0.514 0.80 0.32 0.64 39.6 303,508 698,275 1.277
S159 3/1 4/30-6/9 400-600 2 - 10 0.2 - 0.5 na 0.514 0.80 0.32 0.64 39.6 303,508 697,253 1.275
S160 3/1 4/30-6/9 400-600 2 - 10 0 - 0.2 na 0.514 0.80 0.32 0.64 37.7 303,508 698,192 1.277
S161 3/1 4/30-6/9 400-600 2 - 10 1:1 na 0.514 0.80 0.32 0.64 39.6 303,508 694,781 1.271
S162 3/1 4/30-6/9 300-700 4 - 20 1:1 na 0.557 0.82 0.34 0.54 43.4 294,905 735,391 1.345
S163 3/1 4/30-6/9 300-700 4 - 20 0 - 0.2 na 0.557 0.82 0.34 0.54 43.4 294,905 739,088 1.352
S164 3/1 4/30-6/9 300-700 4 - 20 0.2 - 0.5 na 0.557 0.82 0.34 0.54 43.4 294,905 737,284 1.349
S165 3/1 4/30-6/9 300-700 4 - 20 1 - 4 na 0.557 0.82 0.34 0.54 43.4 294,905 740,179 1.354
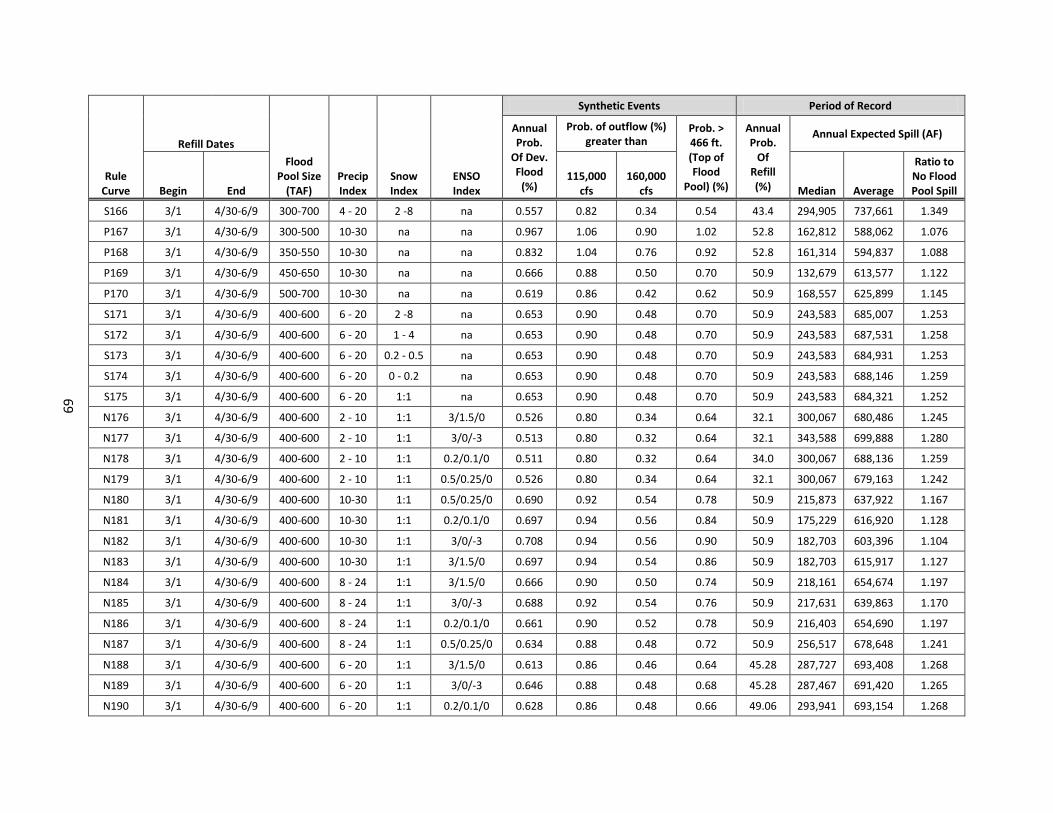
69
Synthetic Events Period of Record
Rule Curve
Refill Dates
Flood Pool Size
(TAF) Precip Index
Snow Index
ENSO Index
Annual Prob.
Of Dev. Flood
(%)
Prob. of outflow (%) greater than
Prob. > 466 ft. (Top of Flood
Pool) (%)
Annual Prob.
Of Refill (%)
Annual Expected Spill (AF)
Begin End 115,000
cfs 160,000
cfs Median Average
Ratio to No Flood Pool Spill
S166 3/1 4/30-6/9 300-700 4 - 20 2 -8 na 0.557 0.82 0.34 0.54 43.4 294,905 737,661 1.349
P167 3/1 4/30-6/9 300-500 10-30 na na 0.967 1.06 0.90 1.02 52.8 162,812 588,062 1.076
P168 3/1 4/30-6/9 350-550 10-30 na na 0.832 1.04 0.76 0.92 52.8 161,314 594,837 1.088
P169 3/1 4/30-6/9 450-650 10-30 na na 0.666 0.88 0.50 0.70 50.9 132,679 613,577 1.122
P170 3/1 4/30-6/9 500-700 10-30 na na 0.619 0.86 0.42 0.62 50.9 168,557 625,899 1.145
S171 3/1 4/30-6/9 400-600 6 - 20 2 -8 na 0.653 0.90 0.48 0.70 50.9 243,583 685,007 1.253
S172 3/1 4/30-6/9 400-600 6 - 20 1 - 4 na 0.653 0.90 0.48 0.70 50.9 243,583 687,531 1.258
S173 3/1 4/30-6/9 400-600 6 - 20 0.2 - 0.5 na 0.653 0.90 0.48 0.70 50.9 243,583 684,931 1.253
S174 3/1 4/30-6/9 400-600 6 - 20 0 - 0.2 na 0.653 0.90 0.48 0.70 50.9 243,583 688,146 1.259
S175 3/1 4/30-6/9 400-600 6 - 20 1:1 na 0.653 0.90 0.48 0.70 50.9 243,583 684,321 1.252
N176 3/1 4/30-6/9 400-600 2 - 10 1:1 3/1.5/0 0.526 0.80 0.34 0.64 32.1 300,067 680,486 1.245
N177 3/1 4/30-6/9 400-600 2 - 10 1:1 3/0/-3 0.513 0.80 0.32 0.64 32.1 343,588 699,888 1.280
N178 3/1 4/30-6/9 400-600 2 - 10 1:1 0.2/0.1/0 0.511 0.80 0.32 0.64 34.0 300,067 688,136 1.259
N179 3/1 4/30-6/9 400-600 2 - 10 1:1 0.5/0.25/0 0.526 0.80 0.34 0.64 32.1 300,067 679,163 1.242
N180 3/1 4/30-6/9 400-600 10-30 1:1 0.5/0.25/0 0.690 0.92 0.54 0.78 50.9 215,873 637,922 1.167
N181 3/1 4/30-6/9 400-600 10-30 1:1 0.2/0.1/0 0.697 0.94 0.56 0.84 50.9 175,229 616,920 1.128
N182 3/1 4/30-6/9 400-600 10-30 1:1 3/0/-3 0.708 0.94 0.56 0.90 50.9 182,703 603,396 1.104
N183 3/1 4/30-6/9 400-600 10-30 1:1 3/1.5/0 0.697 0.94 0.54 0.86 50.9 182,703 615,917 1.127
N184 3/1 4/30-6/9 400-600 8 - 24 1:1 3/1.5/0 0.666 0.90 0.50 0.74 50.9 218,161 654,674 1.197
N185 3/1 4/30-6/9 400-600 8 - 24 1:1 3/0/-3 0.688 0.92 0.54 0.76 50.9 217,631 639,863 1.170
N186 3/1 4/30-6/9 400-600 8 - 24 1:1 0.2/0.1/0 0.661 0.90 0.52 0.78 50.9 216,403 654,690 1.197
N187 3/1 4/30-6/9 400-600 8 - 24 1:1 0.5/0.25/0 0.634 0.88 0.48 0.72 50.9 256,517 678,648 1.241
N188 3/1 4/30-6/9 400-600 6 - 20 1:1 3/1.5/0 0.613 0.86 0.46 0.64 45.28 287,727 693,408 1.268
N189 3/1 4/30-6/9 400-600 6 - 20 1:1 3/0/-3 0.646 0.88 0.48 0.68 45.28 287,467 691,420 1.265
N190 3/1 4/30-6/9 400-600 6 - 20 1:1 0.2/0.1/0 0.628 0.86 0.48 0.66 49.06 293,941 693,154 1.268

70
Synthetic Events Period of Record
Rule Curve
Refill Dates
Flood Pool Size
(TAF) Precip Index
Snow Index
ENSO Index
Annual Prob.
Of Dev. Flood
(%)
Prob. of outflow (%) greater than
Prob. > 466 ft. (Top of Flood
Pool) (%)
Annual Prob.
Of Refill (%)
Annual Expected Spill (AF)
Begin End 115,000
cfs 160,000
cfs Median Average
Ratio to No Flood Pool Spill
N191 3/1 4/30-6/9 400-600 6 - 20 1:1 0.5/0.25/0 0.578 0.84 0.40 0.66 43.40 330,961 703,387 1.287
S192 3/1 4/30-6/9 400-600 8 - 24 1:1 na 0.699 0.92 0.56 0.78 50.94 184,686 638,023 1.167

71
APPENDIX D. Late Season Flood Analysis Table D1. Summary of Late Season Flood Analysis Results.
Rule Curve
Flood Date
March 15 April 1 April 15
Maximum Elevation
(ft)
Maximum Outflow
(cfs)
Maximum Elevation
(ft)
Maximum Outflow
(cfs)
Maximum Elevation
(ft)
Maximum Outflow
(cfs)
P9 437.40 115,000 431.71 115,000 466.55 115,000
P44 429.50 114,984 429.60 114,984 469.82 115,000
P48 443.10 115,000 429.60 114,984 469.82 115,000
P49 437.40 115,000 431.71 115,000 466.55 115,000
P50 429.50 114,984 431.71 115,000 466.55 115,000
P54 442.68 115,000 425.91 114,984 464.99 115,000
P63 443.10 115,000 429.60 114,984 469.82 115,000
P74 447.84 115,000 425.91 114,984 466.57 115,000
P75 432.06 115,000 425.91 114,984 466.57 115,000
P79 432.06 115,000 425.91 114,984 463.34 115,000
P127 430.57 114,984 449.72 115,000 469.70 115,000
P128 427.59 114,984 447.41 115,000 468.19 115,000
600 TAF 437.94 115,000 459.80 115,000 471.33 134,005
800 TAF 425.83 114,984 450.55 115,000 471.51 155,787
P3 437.89 115,000 459.80 115,000 471.33 134,005
P5 442.84 115,000 459.80 115,000 471.33 134,005
P6 443.02 115,000 446.30 115,000 471.35 129,943
P8 437.40 115,000 446.30 115,000 471.35 129,943
P22 442.84 115,000 459.80 115,000 471.33 134,005
P53 448.51 115,000 452.34 115,000 470.66 115,521
P77 432.06 115,000 447.18 115,000 471.52 159,862
P78 432.06 115,000 447.18 115,000 471.52 159,862
P110 446.52 115,000 458.41 115,000 471.45 137,592
P115 450.60 115,000 460.69 115,000 471.39 143,642
P116 448.72 115,000 461.00 115,000 471.39 143,108
P122 448.77 115,000 459.72 115,000 471.60 159,297
P123 439.34 115,000 455.48 115,000 471.26 125,089
P124 434.77 115,000 452.27 115,000 470.79 116,506
400 TAF 454.82 115,000 468.53 115,000 471.47 196,592
500 TAF 446.56 115,000 464.38 115,000 471.42 164,400
700 TAF 429.65 114,984 455.04 115,000 471.61 170,803
P2 441.25 115,000 453.04 115,000 471.61 170,812
P4 450.61 115,000 459.47 115,000 472.86 209,876
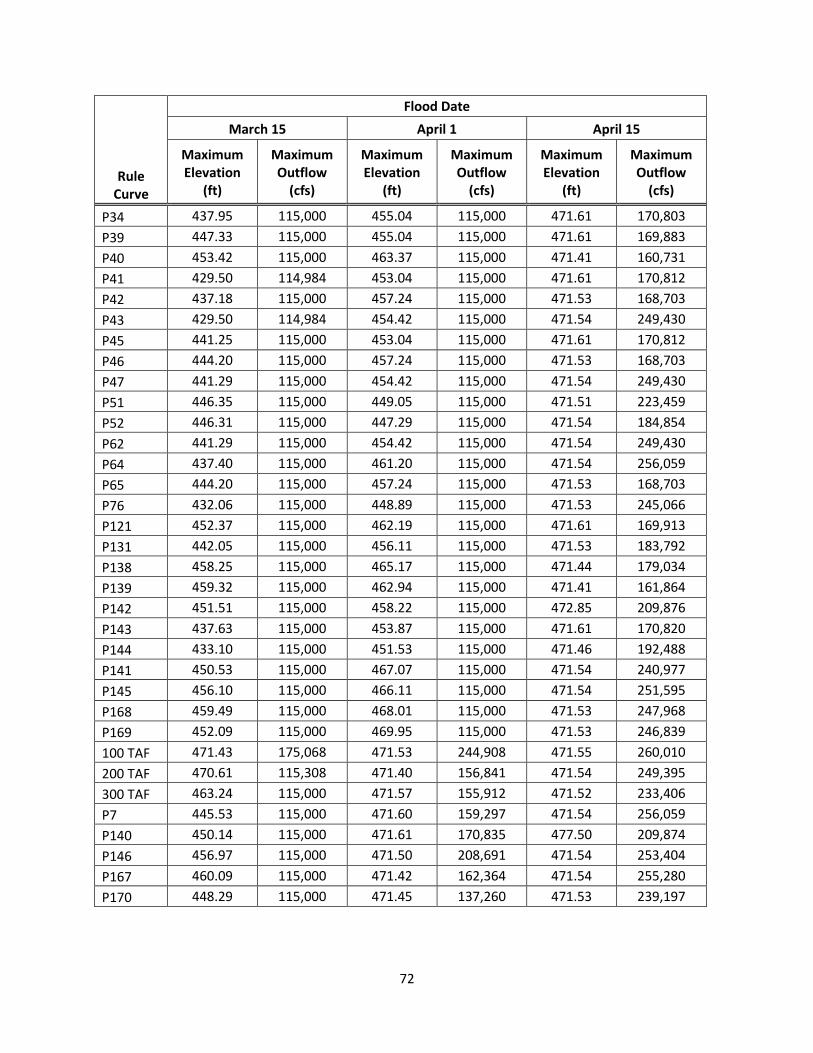
72
Rule Curve
Flood Date
March 15 April 1 April 15
Maximum Elevation
(ft)
Maximum Outflow
(cfs)
Maximum Elevation
(ft)
Maximum Outflow
(cfs)
Maximum Elevation
(ft)
Maximum Outflow
(cfs)
P34 437.95 115,000 455.04 115,000 471.61 170,803
P39 447.33 115,000 455.04 115,000 471.61 169,883
P40 453.42 115,000 463.37 115,000 471.41 160,731
P41 429.50 114,984 453.04 115,000 471.61 170,812
P42 437.18 115,000 457.24 115,000 471.53 168,703
P43 429.50 114,984 454.42 115,000 471.54 249,430
P45 441.25 115,000 453.04 115,000 471.61 170,812
P46 444.20 115,000 457.24 115,000 471.53 168,703
P47 441.29 115,000 454.42 115,000 471.54 249,430
P51 446.35 115,000 449.05 115,000 471.51 223,459
P52 446.31 115,000 447.29 115,000 471.54 184,854
P62 441.29 115,000 454.42 115,000 471.54 249,430
P64 437.40 115,000 461.20 115,000 471.54 256,059
P65 444.20 115,000 457.24 115,000 471.53 168,703
P76 432.06 115,000 448.89 115,000 471.53 245,066
P121 452.37 115,000 462.19 115,000 471.61 169,913
P131 442.05 115,000 456.11 115,000 471.53 183,792
P138 458.25 115,000 465.17 115,000 471.44 179,034
P139 459.32 115,000 462.94 115,000 471.41 161,864
P142 451.51 115,000 458.22 115,000 472.85 209,876
P143 437.63 115,000 453.87 115,000 471.61 170,820
P144 433.10 115,000 451.53 115,000 471.46 192,488
P141 450.53 115,000 467.07 115,000 471.54 240,977
P145 456.10 115,000 466.11 115,000 471.54 251,595
P168 459.49 115,000 468.01 115,000 471.53 247,968
P169 452.09 115,000 469.95 115,000 471.53 246,839
100 TAF 471.43 175,068 471.53 244,908 471.55 260,010
200 TAF 470.61 115,308 471.40 156,841 471.54 249,395
300 TAF 463.24 115,000 471.57 155,912 471.52 233,406
P7 445.53 115,000 471.60 159,297 471.54 256,059
P140 450.14 115,000 471.61 170,835 477.50 209,874
P146 456.97 115,000 471.50 208,691 471.54 253,404
P167 460.09 115,000 471.42 162,364 471.54 255,280
P170 448.29 115,000 471.45 137,260 471.53 239,197