(preprint) aas 18-408 transiting exoplanet survey ... · the transiting exoplanet survey satellite...
TRANSCRIPT
1
TRANSITING EXOPLANET SURVEY SATELLITE (TESS) FLIGHT DYNAMICS COMMISSIONING RESULTS AND EXPERIENCES
Joel J. K. Parker*, Ryan L. Lebois†, Stephen Lutz†, Craig Nickel†, Kevin Ferrant‡, and Adam Michaels‡
The Transiting Exoplanet Survey Satellite (TESS) will perform the first-ever spaceborne all-sky exoplanet transit survey and is the first primary-mission appli-cation of a lunar-resonant orbit. Launched on April 18, 2018, TESS completed a two-month commissioning phase consisting of three phasing loops followed by a lunar flyby and a final maneuver to achieve resonance. During the science orbit, no further station-keeping maneuvers are planned or required. NASA Goddard Space Flight Center is performing flight dynamics operations for the mission. This paper covers the design, implementation, and results from TESS commissioning, including the projected performance of the final science orbit.
INTRODUCTION
The Transiting Exoplanet Survey Satellite (TESS) is a NASA Astrophysics Explorer that will perform the first-ever spaceborne all-sky survey of exoplanets transiting bright stars. 1 TESS will expand on the suc-cesses of NASA’s Kepler mission2 by focusing on stars with brightness that allows for follow-up observa-tions and characterization. Carrying four identical cameras, the spacecraft will survey nearly the entire celes-tial sphere in 26 four-week increments over its two-year primary mission. In total, over 200,000 stars will be monitored for transits and more than 1,600 planets with sizes smaller than Neptune are expected to be found. Enabling these observations is the first-ever primary-mission use of a lunar-resonant orbit, which allows for long, quiescent observation periods while remaining stable long-term without the need for station-keeping maneuvers.
Launched April 18, 2018, TESS executed a two-month commissioning phase in which it completed a series of three and a half phasing loops, a lunar flyby, and a final Period Adjust Maneuver (PAM) to put the spacecraft successfully into its target mission orbit. The design of the TESS mission orbit and commissioning trajectory has been previously described by Gangestad, et al.3 in 2013; Dichmann, et al. in 2014;4 and Dichmann, et al.5 and Nickel, et al.6 in 2016. The foundational work establishing the feasibility of the chosen resonant mission orbit was performed by McGiffin, et al.7 for future medium-class Explorer missions and Carrico, et al.8 for the Interstellar Boundary Explorer (IBEX) extended mission.
This paper discusses the final TESS flight dynamics design, the as-executed flight dynamics performance during the commissioning phase, and the expected performance during the mission orbit. In addition, the use of novel processes for detailed final maneuver design is discussed.
*Aerospace Engineer, Navigation and Mission Design Branch, NASA Goddard Space Flight Center, Greenbelt, MD 20771. †Aerospace Engineer, L3 Applied Defense Solutions, 10440 Little Patuxent Pkwy, Suite 600, Columbia, MD 21044. ‡Aerospace Engineer, Omitron, Inc., 7051 Muirkirk Meadows Dr., Suite A, Beltsville, MD 20705.
(Preprint) AAS 18-408
https://ntrs.nasa.gov/search.jsp?R=20180006156 2020-01-09T22:08:57+00:00Z
2
TESS MISSION OVERVIEW
The TESS mission flight dynamics subsystem consists of the overall mission design from launch through the final mission (science) orbit, the spacecraft hardware and capabilities that enable that design, and the navigation and ground system infrastructure that supports its execution.
Mission Design
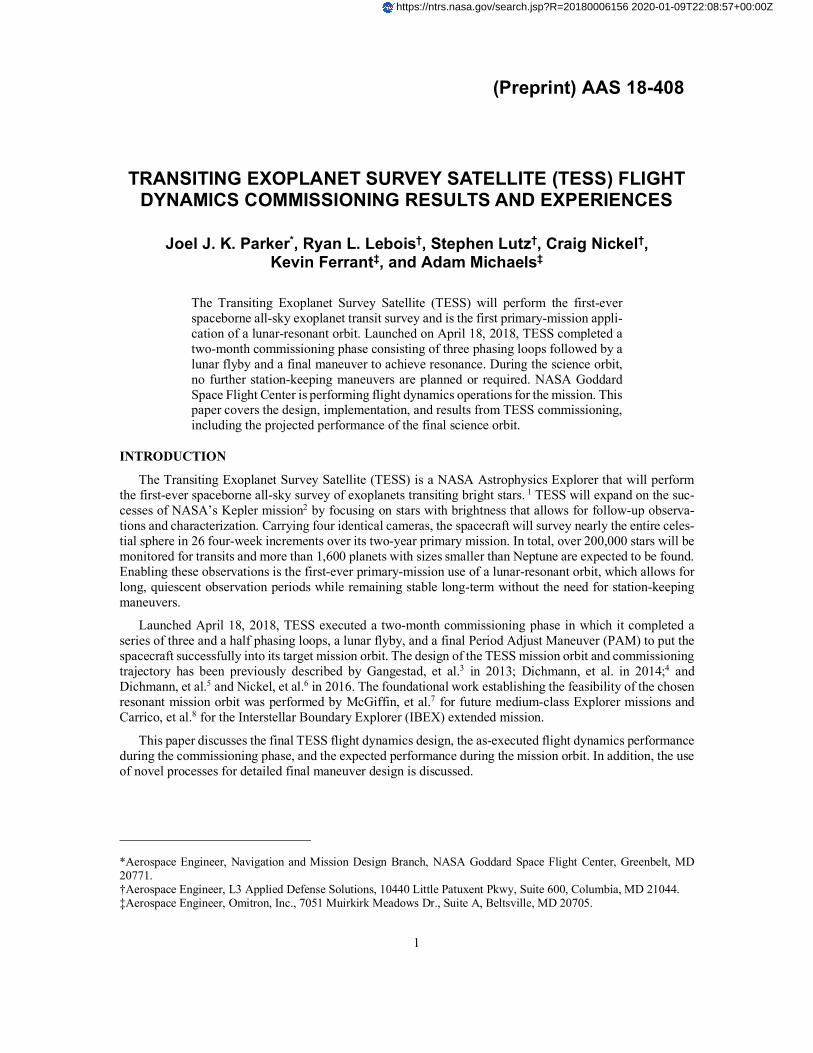
The TESS mission design was focused on achieving its 2:1 lunar-resonant mission orbit to support science observations. Stable resonance in the circular restricted three-body problem (CR3BP) refers to the tendency of a closed orbit to exhibit long-term stability without station-keeping maneuvers when its period is a ratio of that of a perturbing body, and proper phasing is established. It is an application of the Kozai-Lidov mech-anism9,10, which describes the long-term behavior of a highly-eccentric, highly-inclined orbit in the presence of a third-body perturbing force. The long-term use of resonance in mission design was first practiced by the IBEX mission in its extended-mission phase8. In the case of TESS, the target mission orbit was one in which the final period was half that of the lunar period, or 13.67 days, and which had a perigee of 17 Earth radii (RE) and initial ecliptic inclination of 37°. This orbit was achieved via the use of 3.5 phasing loops to raise apogee to lunar distance, a lunar flyby to increase perigee radius and inclination to their desired values, and a large transfer orbit leading to the final maneuver to establish resonance. The overall mission trajectory design is shown in Figure 1 and is described in more detail in References 3–7.
Figure 1. TESS Conceptual Mission Trajectory Design
The commissioning phase is shown in detail in Figure 2. The spacecraft was launched into the first phas-ing loop, with a perigee of 250 km and apogee of 275,000 km. The first maneuver, a 50-second fixed-duration calibration maneuver, was executed at the first apogee, referred to as A1. The burn itself is referred to by its intended location, in this case A1M. At the first post-launch perigee, the P1M burn was executed to raise apogee of the second loop to approximately lunar distance, or about 360,000 km. P1M was the largest-mag-nitude planned maneuver in the phasing loops phase, second only to PAM. At apogee of the second phasing loop, A2M was planned as a targeting maneuver to adjust apsis timing leading into the third loop and the flyby. P2M performed any final orbit-raising and timing adjustments necessary to achieve the flyby, and P3M performed final targeting on the lunar B-plane. The lunar flyby dramatically changed the size and orientation of the orbit, leading into the so-called transfer orbit with apogee of approximately 75 RE and perigee of 17 RE. At the post-lunar-encounter perigee (PLEP), PAM was executed to achieve the desired mission orbit period. There was one orbit (mission orbit zero) reserved for commissioning activities prior to the start of science operations. The entire commissioning phase was required to be completed within 60 days of launch.

3
Figure 2. TESS Commissioning Phase Schematic
The entire maneuver sequence was designed to minimize ΔV while maximizing resiliency to maneuver execution and orbit determination uncertainties. This need for resiliency resulted in several features that had operational implications during the commissioning phase. The largest two maneuvers were P1M and PAM, which performed the majority of the required apogee raising and lowering, respectively. The other maneuvers were chosen in the mission design process to be small, both to reduce total mission ΔV and to increase resiliency in the event that a maneuver was missed or aborted. In the case of A1M, a backup maneuver opportunity was available on the descending leg of the first loop, with a flexible delay before execution. P1M and A2M had no backup planned. In the case that P1M was executed off-nominal or missed, the remaining two phasing loops could be resized by adjusting the remaining perigee burns to absorb the required correc-tion. Before launch, A2M was chosen to be a very small, to increase the likelihood that it could be waived prior to execution. For P2M and P3M, optional trajectory correction maneuvers (TCMs) were planned 24 hours after the primary opportunity, either as backups or as adjustments for off-nominal execution. There were also optional TCMs planned at post-lunar-encounter apogee (PLEA) and at the perigee after PLEP to perform any necessary subsequent trajectory cleanup.
The overall mission trajectory was designed to meet the requirements shown in Table 1.
Table 1. Key Mission Design and Navigation Requirements
Requirement Value Achieved
Orbit Period 13.67 days (2:1 lunar resonance) Achieved (orbit period oscillates about 13.67 days)
Maximum Perigee Radius ≤ 23 RE 18.70 RE Maximum Apogee Radius < 90 RE 71.25 RE Maximum Total ΔV ≤ 215 m/s 91.19 m/s Maximum Single Maneuver ΔV ≤ 95 m/s 53.41 m/s Maximum Commissioning Duration ≤ 2 months 54.87 days
Eclipses ≤ 16 eclipses, ≤ 4 hours duration each (umbra + ½ penumbra)
10 eclipses in primary mission; long-est = 2.5 hr
Orbit Determination Position Accuracy ≤ 6 km per axis Achieved throughout commissioning Orbit Determination Velocity Accuracy ≤ 7% of maneuver magnitude Achieved throughout commissioning

4
Spacecraft The TESS spacecraft was manufactured by OrbitalATK (now Northrop Grumman Innovation Systems),
using their LEOStar-2/750 spacecraft platform. An understanding of the overall spacecraft design and capa-bilities was necessary for modeling various constraints within the operational flight dynamics processes. Figure 3 shows an annotated diagram of the TESS spacecraft.
Figure 3. TESS Annotated Spacecraft Diagram.
Propulsion. The TESS propulsion subsystem is a blowdown system comprised of: four on-pulsed 4.5 N reaction engine assemblies (REAs) for maintaining attitude control during ΔV maneuvers and unloading system momentum, and one 22 N REA for executing the ΔV maneuvers required to reach the science orbit.
The flight dynamics team (FDT) was responsible for accurately modeling the propulsion system to com-pute the finite burn durations (and spacecraft attitudes) required to execute each maneuver. As part of this process, hot fire data from pre-launch testing was used to fit 5th order polynomial curves of the thrust and specific impulse (Isp) of each thruster as functions of tank pressure. These curves, combined with the predicted on-pulsing of the 4.5 N REAs, determined the net thrust and burn duration expected during each maneuver. The alignments of the REAs determined the overall thrust direction. The net thrust direction is mostly along the spacecraft body +z-axis, in the vertical upward direction in Figure 3.
Attitude Control. The attitude control subsystem (ACS) consists of the previously mentioned REAs, as well as four reaction wheel assemblies (RWAs), two star tracker assemblies, and ten coarse sun sensors. While attitude control as a general topic is outside of the scope of this paper, there are several specific areas that directly impact flight dynamics.
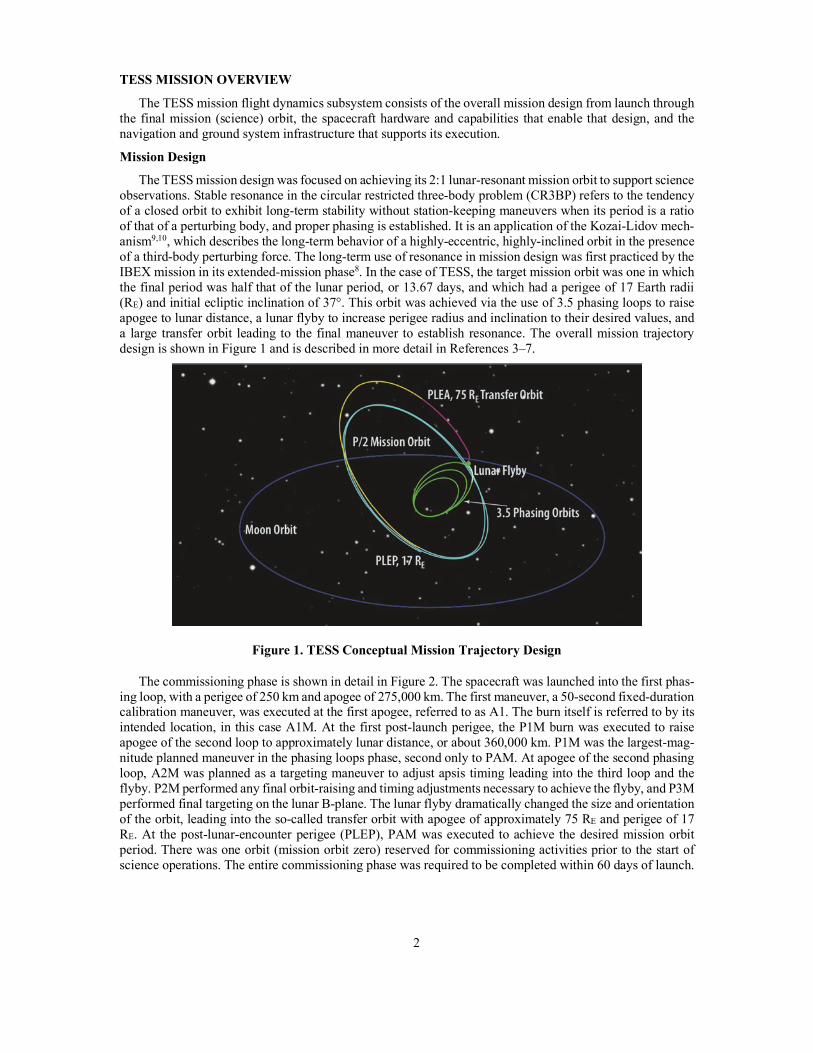
A soft constraint was levied on the FDT to ensure that a minimum of one star tracker remained un-oc-culted during maneuvers. This was not a requirement since the ACS could handle both star trackers being occulted for up to two hours and the maximum burn duration throughout the mission was just over 15 minutes. While a maneuver attitude that occulted both trackers did not pose a risk to the mission, the bright object exclusion zones for the Sun, Earth, and Moon were still modeled, and occultations were reported, prior to the approval of each maneuver. A visualization including relevant sensor keep-out zones (KOZs) was generated and used alongside a table of reported angles to quality check the maneuver attitude. An example of this output is provided in Figure 4, associated with start epoch of PAM. The axes shown are the spacecraft
5
body axes. The bright object star tracker exclusion zone for the Sun was the largest, followed by Earth, and then the Moon.
Figure 4. TESS Maneuver Planning Attitude Constraint Check Visualization
In addition to ΔV maneuvers, the FDT accounted for residual ΔV from momentum unloading. After ex-ecution of a momentum unload, the spacecraft attitude, REA duty cycles, and unload start and stop times were provided to the FDT for reconstruction of the resultant ΔV; this was on the order of 0.5–3 cm/s for each unload. Four momentum unloads were performed during commissioning, with the plan to perform one every orbit, immediately following the low-altitude housekeeping operations (LAHO) period near perigee.
Communications. The TESS communications subsystem features two omni-directional antennas on op-posite spacecraft faces for S-band communications and one high-gain antenna (HGA) for high-rate Ka-band downlink. Beyond the implications for coherent communications and collection of two-way tracking, a null region between the two omni-directional antennas added an additional attitude constraint during maneuver execution. The extra degree of freedom when planning the maneuver attitude was used to roll the spacecraft about the net thrust vector to ensure that line-of-sight to the Deep Space Network (DSN) antenna or Tracking and Data Relay Satellite (TDRS) vehicle providing primary support during the maneuver was outside of the antenna null region.
The HGA was the primary driver for the TESS orbit accuracy requirements. The Ka-band link budget developed for downlinking the TESS science data included a maximum allowable orbit determination (OD) error, since the antenna needs to be pointed to the ground station during each downlink pass. This requirement was derived as 6 km per-axis (3σ) predicted accuracy for every Ka-band support, since a state vector needed to be uploaded to the spacecraft in advance of the Ka-band activity.
Instrument. The TESS science instrument is a collection of four wide-field-of-view charge-coupled de-vice (CCD) cameras and their corresponding data handling unit. A requirement was placed on the spacecraft attitude to ensure that the Sun never dwelled within a KOZ around the instrument field of view defined as a ± 30° by ± 50° rectangle for greater than 15 minutes. This requirement applied to routine operations as well as during ΔV maneuvers.
Because maneuvers were used primarily to raise or lower apogee or perigee, most were performed in either the velocity or anti-velocity direction at an apsis. The instrument is mounted on the spacecraft face opposite the thrusters, so the desired thrust direction also fixes the instrument pointing direction. This con-figuration hindered how well the team could meet the Sun keep-out requirement; in response, the FDT added

6
a control in the trajectory design to allow maneuvers to shift off-apsis as-needed to keep the Sun out of the instrument KOZ.
Navigation Design Using knowledge of the spacecraft and mission, the navigation design for TESS was derived from the
unique characteristics of its phasing loop ascent and high-altitude science orbit. The design included the selection of ground networks for support, a detailed tracking schedule, and an operations concept that enabled the mission to meet requirements in a robust manner.
Deep Space Network (DSN). The use of NASA’s DSN was included early in mission formulation, driven by the science orbit design with perigee above Geosynchronous (GEO) orbit, and an apogee altitude near 60 RE. In addition to providing tracking for TESS throughout the mission orbit, each of the DSN 34-meter Beam Wave Guide antennas support the Ka-band downlink required for retrieval of the science data.
DSN is the primary network for TESS throughout all mission phases. The only required supplemental network support scheduled was immediately after spacecraft separation and at the three phasing-loop perigee passes (~800–1500 km altitude). Geometric visibility gaps between the DSN sites at perigee was an issue, and TESS executed a maneuver at each phasing-loop perigee, making additional coverage of those events desirable.
Space Network (SN). To fill low-altitude visibility gaps, the project utilized NASA’s SN to provide peri-gee support via the TDRS constellation. SN provided support from the initial transmitter on-time until hand-over to the first DSN station, as well as ± 2 hours surrounding each of the first three perigees. After initial checkout and testing, the TESS transponder allowed for coherent passes, enabling full telemetry, tracking, and command capability during these important events.
The timeline for the initial acquisition support provided by both networks is shown in detail in Figure 5. Initial acquisition was made via TDRS, and both telemetry and commanding were established prior to ac-quiring on DSN. As a critical (Level 1) support with DSN, the first contact after separation was scheduled on redundant antennas at the Canberra site. As shown, the DSS-34 antenna was the prime support, with DSS-36 as a hot backup. In this configuration, DSN was able to acquire the downlink from the spacecraft on both antennas while the MOC still maintained downlink and command capability on TDRS. Once the DSN down-link was established and telemetry data was flowing to the MOC, a coordinated handover occurred and TDRS was able to drop into shadow mode in case of a contingency on DSN. No contingencies occurred, and the handover was executed nominally during operations.
Figure 5. Ground Network Post-Separation Timeline
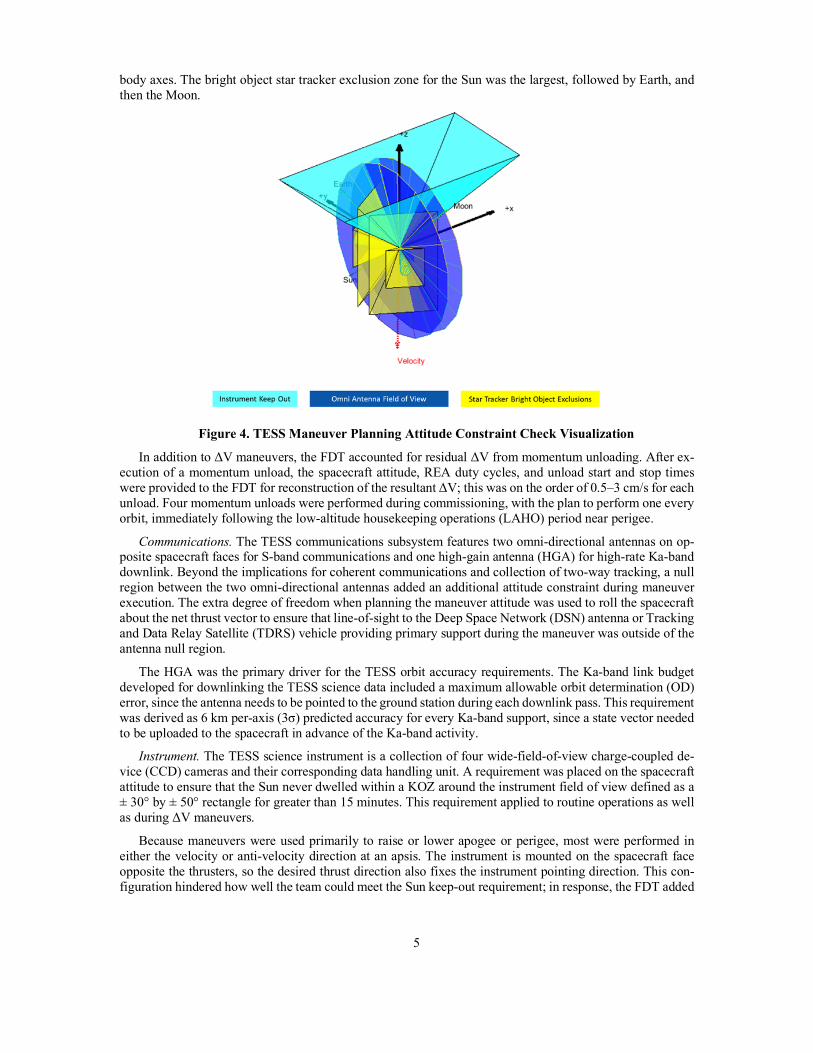
For the commissioning phase of the mission, the tracking schedule was developed to meet requirements (shown in Table 1) by supporting maneuver planning/calibration, spacecraft commissioning, and instrument commissioning activities. The full as-executed tracking schedule from separation through PAM is shown by
7
altitude in Figure 6. Aside from requiring near-continuous DSN coverage for the first half-orbit after launch, the mission was able to schedule only those passes needed for specific commissioning and planning activities.
Figure 6. TESS Commissioning Tracking Schedule
The TESS project utilized NASA’s Space Science Mission Operations (SSMO) office for the scheduling of all DSN contacts. This had two positive implications for the project: it greatly reduced the overhead asso-ciated with learning the scheduling practices of the DSN, and it forced the project to carefully consider each scheduled DSN contact pre-launch since these would need to be translated into scheduling “rules” for the SSMO. The set of developed rules specified where and when each contact would be scheduled, what ground network configuration would be used, and at what criticality the support would be scheduled. Similarly, SN tracking support was scheduled in direct coordination with the project’s Mission Commitment Engineer (MCE).
Once all commissioning activities were completed, the tracking schedule during the science phase of the mission became focused on OD, state-of-health monitoring, and downlink of the science data. Moving for-ward, this support consists of four equally-spaced 1-hour S-band contacts for tracking and state-of-health monitoring, and two 5-hour Ka-band contacts within a ±20-hour window around perigee (the LAHO period) for downlink of the collected science data.
FLIGHT DYNAMICS GROUND SYSTEM
The TESS flight dynamics ground system consisted of two main pieces: the Flight Dynamics Facility (FDF) and the Flight Dynamics System (FDS), which resides within the FDF. These two pieces worked together to generate and deliver all TESS flight dynamics products to the various consumers of those prod-ucts: TESS Mission Operations Center (MOC), TESS Payload Operations Center (POC), DSN, SN, and NASA Conjunction Assessment Risk Analysis (CARA). The overall TESS flight dynamics ground system architecture is shown in Figure 7.
The FDF11, managed by the NASA Goddard Space Flight Center (GSFC) Navigation and Mission Design Branch, provided the infrastructure to support flight dynamics activities for TESS, including all of the phys-ical space, hardware, and non-mission specific software required for the FDT to operate out of FDF’s Mission Operations Room. FDF’s infrastructure also provided an interface to its messaging architecture for data gen-eration and transfer both to and from TESS stakeholders. The interface between the FDF and FDS, called the Message Gateway, allowed FDS to leverage existing utilities in the FDF in order to reduce redundancy across
0
10
20
30
40
50
60
70
22 SunApr 2018
1 Tue 8 Tue 15 Tue 22 Tue 1 Fri
Measurement Summary by Altitude Separation through PAM
Altit
ude
(Re)
Time (UTCG)
Tess Tracking Tess No Tracking
8
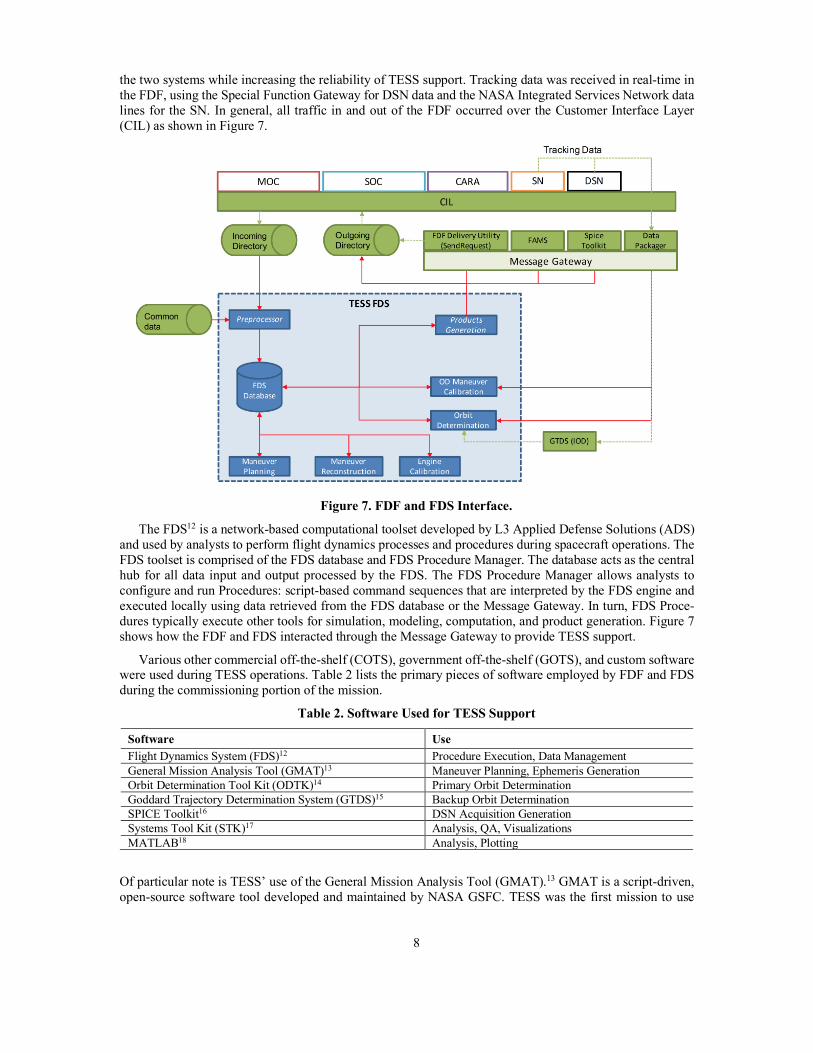
the two systems while increasing the reliability of TESS support. Tracking data was received in real-time in the FDF, using the Special Function Gateway for DSN data and the NASA Integrated Services Network data lines for the SN. In general, all traffic in and out of the FDF occurred over the Customer Interface Layer (CIL) as shown in Figure 7.
Figure 7. FDF and FDS Interface.
The FDS12 is a network-based computational toolset developed by L3 Applied Defense Solutions (ADS) and used by analysts to perform flight dynamics processes and procedures during spacecraft operations. The FDS toolset is comprised of the FDS database and FDS Procedure Manager. The database acts as the central hub for all data input and output processed by the FDS. The FDS Procedure Manager allows analysts to configure and run Procedures: script-based command sequences that are interpreted by the FDS engine and executed locally using data retrieved from the FDS database or the Message Gateway. In turn, FDS Proce-dures typically execute other tools for simulation, modeling, computation, and product generation. Figure 7 shows how the FDF and FDS interacted through the Message Gateway to provide TESS support.
Various other commercial off-the-shelf (COTS), government off-the-shelf (GOTS), and custom software were used during TESS operations. Table 2 lists the primary pieces of software employed by FDF and FDS during the commissioning portion of the mission.
Table 2. Software Used for TESS Support
Software Use Flight Dynamics System (FDS)12 Procedure Execution, Data Management General Mission Analysis Tool (GMAT)13 Maneuver Planning, Ephemeris Generation Orbit Determination Tool Kit (ODTK)14 Primary Orbit Determination Goddard Trajectory Determination System (GTDS)15 Backup Orbit Determination SPICE Toolkit16 DSN Acquisition Generation Systems Tool Kit (STK)17 Analysis, QA, Visualizations MATLAB18 Analysis, Plotting
Of particular note is TESS’ use of the General Mission Analysis Tool (GMAT).13 GMAT is a script-driven, open-source software tool developed and maintained by NASA GSFC. TESS was the first mission to use
9
GMAT as the primary flight dynamics engine for mission design. GMAT provided high-fidelity force mod-eling for maneuver planning, predictive ephemeris generation, and maneuver calibration. Force models in-cluded spherical harmonic gravity, third body gravity, atmospheric drag, and solar radiation pressure. De-pending on the mission phase, Earth-centered and Moon-centered force models were used. In addition to external force modeling, GMAT modeled finite maneuvers using a polynomial thrust and Isp, blow-down tank propulsion model.
LAUNCH PERFORMANCE
TESS launched aboard a SpaceX Falcon 9 from Cape Canaveral Air Force Station on April 18, 2018. Liftoff occurred at 22:51:30 UTC, at the beginning of its 30-second launch window. TESS separated nomi-nally from the second stage nearly 50 minutes later at an altitude of 248 km. The launch occurred on its second attempt—the first attempt, on April 16, was waived by SpaceX early in the countdown.
The launch performance requirements were stated in terms of osculating apogee and perigee altitudes, inclination, and argument of perigee. All elements were measured at the trajectory interface point (TIP), 10 minutes after the second-stage engine cutoff #2 (SECO-2). The 3σ requirements were intentionally conserva-tive—20,000 km in apogee altitude, 25 km in perigee altitude, and 0.1° and 0.3° in inclination and argument of perigee, respectively.
Initial evaluation of the achieved insertion was based on the Orbital Parameters Message (OPM) provided by SpaceX. This evaluation was revised based on OD solutions as tracking data was received. In all cases, the launch performance was found to be well within requirements, with the greatest individual error remain-ing under 0.5σ. Table 3 summarizes the launch performance based on the final definitive OD solution. All elements in the table are calculated as osculating at the TIP epoch: 18 Apr 2018 23:45:30.666 UTC.
Table 3. Launch Performance Based on Final Definitive OD Solution
Element Pre-Launch OD Delta 3σ Requirement Sigma Apogee Altitude (km) 268,622.397 269,330.228 707.831 ± 20,000 0.11 Perigee Altitude (km) 248.456 248.755 0.299 ± 25 0.04 Inclination (deg) 29.563 29.579 0.016 ± 0.1 0.48 Argument of Perigee (deg) 228.111 228.088 -0.023 ± 0.3 -0.23
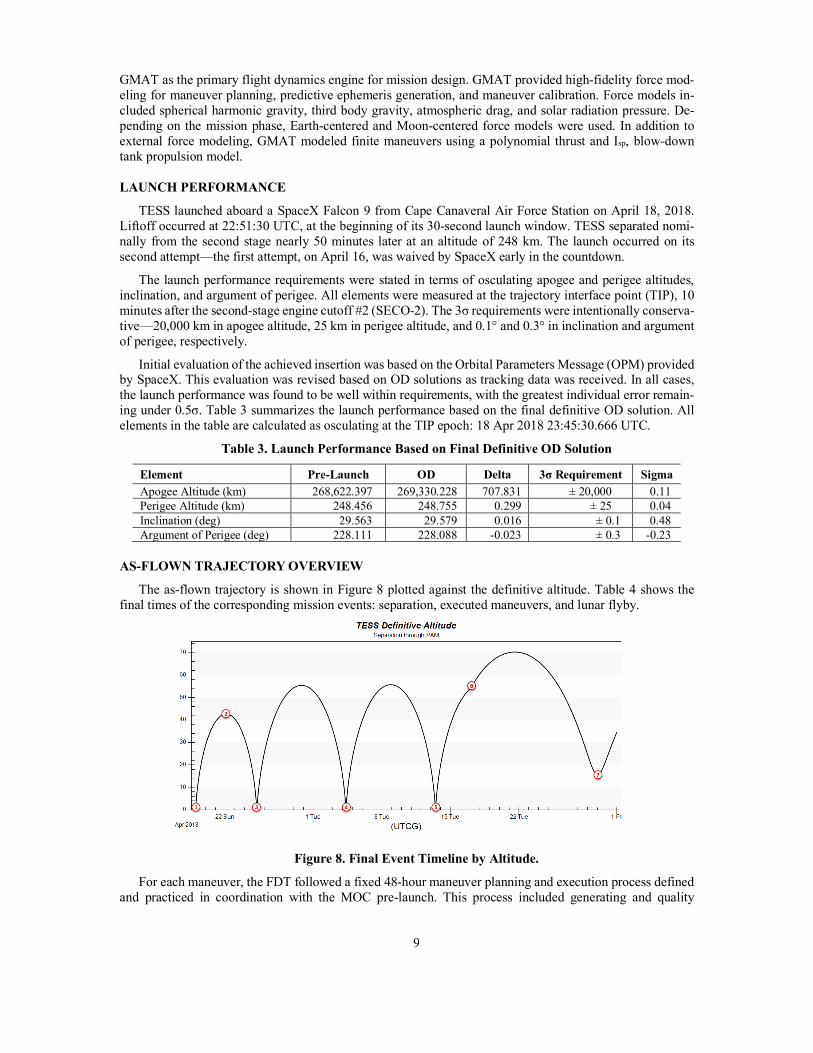
AS-FLOWN TRAJECTORY OVERVIEW
The as-flown trajectory is shown in Figure 8 plotted against the definitive altitude. Table 4 shows the final times of the corresponding mission events: separation, executed maneuvers, and lunar flyby.
Figure 8. Final Event Timeline by Altitude.
For each maneuver, the FDT followed a fixed 48-hour maneuver planning and execution process defined and practiced in coordination with the MOC pre-launch. This process included generating and quality

10
checking the maneuver plan and Automated Time Sequence of commands that would execute the maneuver on-board, formally approving the maneuver upload via a Command Authorization Meeting, and uploading the ATS to the spacecraft. Margin was built into the schedule for redundancy to ensure that the maneuver could be loaded in time. In general, backup maneuver plans were generated alongside the primary maneuvers to enable rapid approval and execution if necessary.
Table 4. Important Mission Events
Event ID Event Epoch (UTC) Altitude
(RE) Altitude (km)
1 Separation 18 Apr 2018 23:41:03.177 0.121 769.388 2 Apogee 1/Engineering Maneuver (A1M) 22 Apr 2018 01:59:06.628 42.670 272,158.032 3 Perigee 1 Maneuver (P1M) 25 Apr 2018 05:36:42.053 0.386 2,452.161 - Apogee 2 Maneuver (A2M) [waived] - - - 4 Perigee 2 Maneuver (P2M) 04 May 2018 08:05:46.650 0.129 824.339 5 Perigee 3 Maneuver (P3M) 13 May 2018 11:37:48.648 0.227 1,449.150 6 Lunar Flyby 17 May 2018 06:34:35.839 1.294* 8,253.249* 7 Period Adjust Maneuver (PAM) 30 May 2018 01:20:23.149 15.542 99,128.398 * Lunar Altitude
PHASING LOOPS
Planning of each phasing loop maneuver occurred nominally in accordance with the 48-hour pre-maneu-ver timeline, but each had unique features, discussed here. The overall maneuver results are summarized in Table 5. Maneuver performance was evaluated via maneuver reconstruction and engine calibration. Maneu-ver reconstruction is the process of recalculating the maneuver parameters based on observed telemetry, in-cluding observed duty cycles, tank properties, and definitive attitude pointing. That then enables the engine calibration process, which estimates the executed ΔV based on a post-maneuver OD solution, to more accu-rately determine the remaining ΔV error as engine performance. This observed engine performance can then be used to plan subsequent maneuvers with a more accurate thrust scale factor, which was exercised in the planning of P3M.
Apogee 1 Maneuver (A1M) A1M was planned with a fixed duration of 50 seconds. Planning occurred with approximately 1.5 days
of tracking data post-separation, including both DSN total count phase (TCP) and sequential range measure-ments from all three DSN sites. Execution of A1M was nominal. Reconstruction and calibration resulted in a ∆V estimate approximately 6% below the plan, half of which was resolved via the first post-launch correc-tion to the propellant tank pressure. Compared to the reconstructed maneuver, the calibrated maneuver was about 3% cold. Attitude telemetry showed a peak pointing error of 14°. This error is larger than the require-ment of ±5° for the remaining maneuvers, but it was expected as a characteristic of a calibration maneuver.
Perigee 1 Maneuver (P1M) At 449 seconds in duration, P1M was the largest of the phasing loop maneuvers, and was responsible for
raising apogee from the initial ~275,000 km radius to ~360,000 km. As P1M was the first substantial maneu-ver of the mission and the second-longest to be executed, there was extensive discussion by the spacecraft team about appropriate limits for attitude errors during maneuver execution. Peak errors were expected to be much lower than were seen during A1M, but the risk of prematurely aborting the maneuver due to a momen-tary limit violation was a serious concern. While not strictly a critical maneuver, a missed or aborted burn would have resulted in substantial changes to the remaining maneuver plans, scheduled contacts, and opera-tions. Ultimately, a limit of 5° of pointing error for a duration of 2 seconds was established; if the limit was exceeded, the burn was to be aborted.
Execution of P1M was nominal, with the final calibrated ∆V estimated to be less than 1% cold compared to the reconstruction. Peak total pointing error was 2.1°, well within the adopted limit. P1M succeeded at raising apogee to a radius of 353,400 km, within 2,000 km of the final flyby distance.

11
Apogee 2 Maneuver (A2M) A2M was planned to be a 14-second anti-velocity maneuver at the second phasing loop apogee. Its pur-
pose was to allow the maneuver planning targeting algorithm to correct timing of subsequent periapses prior to the lunar flyby. Minimizing the A2M maneuver duration was a consideration during launch opportunity selection, with the goal that it could be waived if it was deemed to be unnecessary given the commissioning progress at the time. The team planned cases both with and without the maneuver and evaluated impacts to the remaining maneuver plan, the contact schedule, mission requirements, and long-term Monte Carlo results. All results showed negligible impact to the mission if the maneuver was waived. As a result, the project approved the waiver of A2M, and the maneuver was not executed.
Perigee 2 Maneuver (P2M) P2M was intended to perform any residual apogee-raising for the third phasing loop, and to refine target-
ing for P3M leading into the lunar flyby. P2M was planned to be a 7-second burn and executed nominally, raising the third phasing loop apogee by about 1,800 km. Calibration showed an actual executed ΔV was about 6.6% cold compared to the reconstructed maneuver.
P2M was planned with an optional backup trajectory correction maneuver (TCM1). Post-burn analysis showed nominal execution of the primary maneuver and minimal changes to the future maneuver plans and long-term behavior, allowing TCM1 to be waived.
Perigee 3 Maneuver (P3M) P3M was the final phasing loop maneuver, responsible for targeting the lunar flyby, and as such was
planned with significant out-of-plane components. While only 29 seconds in duration, extensive analysis was used to fine-tune the maneuver to ensure that the flyby occurred as planned. Figure 9 shows the calibrated efficiency of each maneuver, calculated as the percent difference between the calibrated maneuver ΔV and the reconstructed maneuver ΔV, plotted by maneuver duration. From this plot, a trend was established leading up to P3M that shorter maneuvers tended to underperform. This behavior was confirmed by the propulsion team as an artifact of the thermal ramp-up of the thrusters, an effect that was then accounted for in the P3M maneuver planning.
Figure 9. Maneuver Execution Error, with P3M Estimate Based on Prior-Maneuver Trending
Given that the execution error of P2M exceeded -6%, the bounds of the forward-looking Monte Carlo eclipse analysis were expanded to ±10% maneuver execution error. This revealed an eclipse in the 2027 extended-mission timeframe exceeding 3.5 hours in duration within -5% of nominal execution. Two modifi-cations were used in combination to correct for this: P3M was planned with a 95% scale factor, to more closely match the estimated performance as predicted by the trend shown in Figure 9, and the maneuver duration was biased longer by 1 second (equivalent to a 3.5% positive ΔV bias) to avoid the long future eclipses.

12
Execution of P3M was nominal. After adjusting for the thrust scaling, P3M was estimated to have per-formed within about -2.3% of the reconstructed value. Post-maneuver Monte Carlo analysis showed a suc-cessful avoidance of long eclipses (>4 hour duration) and allowed for a waiver of the following TCM2.
LUNAR FLYBY
The purpose of the lunar flyby was to significantly increase both the perigee radius and the ecliptic incli-nation of the orbit. P3M targeted the precise B-Plane crossing required to achieve the post-flyby transfer orbit. The desired B-Plane target had an altitude of 8,183 km above the lunar surface and was planned to occur on May 17, 2018 at 06:33:06 UTC. The achieved flyby occurred at an altitude of 8,254 km at 06:34:36 UTC, differences of ~70 km and ~1.5 minutes due to the slight off-performance of P3M. These difference had negligible impact to the remaining trajectory, allowing the following TCM3 to be waived. The overall effect of the flyby was to increase perigee radius from 1.1 RE to 16.5 RE, osculating apogee radius from 56 RE to 73 RE, and equatorial inclination from 29 deg to 37 deg.
Operating through the flyby required special considerations for orbit determination using the filter in ODTK. The software supports OD of spacecraft with various central bodies, including the moon, but transi-tion from one to another requires conversion of the estimated state space into the frame of the new central body prior to continuing the filter. This was accomplished through the default ChangeCentralBody ODTK utility. The process to transition the filter to Moon-centered and back to Earth-centered was executed without issue and allowed the FDT to seamlessly perform OD though the flyby and into the mission orbit without sacrificing the filter’s a priori knowledge.
TRANSFER ORBIT, MISSION ORBIT AND EXTENDED MISSION DESIGN
The post-flyby trajectory consisted of an Earth-centered transfer orbit with an orbit period of about 18 days, followed by PAM, which was executed at the post-lunar-encounter perigee (PLEP). On the transfer orbit, TESS reached its peak apogee radius of 71.3 RE at post-lunar-encounter apogee (PLEA). Based on the results of the post-flyby OD, the optional TCM at PLEA, TCM3, was waived. TESS spent about 12 days in the transfer orbit, before arriving at PLEP at an altitude of about 15.5 RE.
Period Adjust Maneuver (PAM)
PAM was the final and longest maneuver in the commissioning phase. It was designed to decrease the orbit period to achieve a 2:1 lunar-resonant orbit with a period of approximately 13.67 days, an adjustment of over 4 days. Executing the burn at perigee in the anti-velocity direction lowered the apogee of the orbit, thus decreasing the orbit period. If PAM did not execute or executed off-nominally, a backup maneuver, TCM4, was to be planned at the next perigee (PLEP2). The primary goal of PAM was to achieve a 2:1 lunar-resonant orbit with no eclipses longer than 4 hours for the primary 2-year TESS mission. However, in the absence of any further planned maneuvers, eclipse mitigation and orbit stability for the extended mission was a secondary goal. For these purposes, the extended mission was defined as any additional time after the 2-year nominal mission during which the TESS observatory is operational. Extended-mission analysis was performed to 18 and 25 years, as applicable.
Eclipse mitigation involves minimizing both the number and durations of predicted eclipses. Fewer and shorter-duration eclipses allow the spacecraft to operate longer. For TESS, eclipse duration is defined as the umbra duration plus one half of the penumbra duration. Orbit stability is characterized by the ability to remain in a 2:1 lunar-resonant orbit. Maintaining a resonant orbit ensures that the observatory will remain in a pre-dictable, operationally-stable, Earth-centered orbit. Orbit stability is particularly important in assessing any potential crossings of the GEO belt during or after the extended mission.
PAM Tuning via Parametric Scans PAM was tuned via two degrees of freedom: time of execution, and maneuver duration. Adjustments to
these parameters can significantly influence both the extended mission eclipse profile and long-term orbit stability, allowing the team to optimize the long-term mission orbit behavior. Based on pre-launch analysis, the nominal orbit period target for PAM was selected to be 13.67 days. This initial selection allowed the maneuver planning algorithm to select the PAM epoch, which established the extended mission eclipse trade

13
space. Once the trade space was fixed via selection of the PAM epoch, the burn duration was varied, which had the effect of selecting a precise eclipse profile from the fixed trade space. This was possible because, as shown in Figure 11, an initial orbit period between about 12.5 and 15 days would still lead to an orbit with an average period of about 13.67 days. This variation of the burn duration is referred to as a maneuver scan since the impact was assessed by scanning through possible off-nominal performance of the burn. Because PAM decreased the size of the orbit, a longer burn duration resulted in a lower initial orbit period.
A maneuver scan was used to tune PAM for optimal long-term mission orbit performance. The PAM burn duration was first varied from 75% of the nominally-planned value to 125% in increments of 1%, which represents an approximate range of ±12.5 m/s in ΔV with 0.5 m/s increments. The resulting trajectories for each perturbed PAM duration were then propagated to obtain an 18-year eclipse profile and 25 years of orbit data, such as orbit period and perigee radius. The eclipse profile duration was limited by the duration of required data files for high-fidelity prediction. The ±25% variation on PAM duration was intentionally unre-alistic with respect to the uncertainty of performing the maneuver. However, assessing PAM for a wide range of maneuver scale factors allowed for the potential to plan an adjusted PAM that both avoids eclipses in the extended mission and ensures long-term orbit stability.
Selected PAM Target After analysis of a range of possible values, the conclusion was to initially target an orbit period of 13.63
days, then scale the PAM duration by 97%. This combination resulted in the largest gap in Figure 10 between long eclipses for the nominal trajectory over the 18-year prediction and an initial orbit period of 13.72 days.
Eclipse Profile Plots. The eclipse profile is presented as a “Napoleon plot”* in which the eclipses are plotted on a timeline for each variation of PAM for the 18-year duration. Each eclipse is represented by a circle on the plot. As indicated on the legends of the plots, the eclipse durations are color-coded from light green to red. Each color represents a different “bin” of eclipse duration.
The eclipse profile for the selected PAM target is shown in Figure 10. The starting orbit period target was 13.63 days, then PAM was scaled by a factor of 97%. Because of this scaling, the selected initial orbit period is 13.72 days, and the ±25% range corresponds to scale factors centered around 0.97 and ranging from 0.73 to 1.21. This range corresponds to initial orbit periods from 14.6 to 13 days, respectively.
Figure 10. Final PAM Scan Eclipse Profile by Scale Factor
When tuning PAM, the goal was to create the largest possible gap between long eclipses to provide more robustness to maneuver execution errors. For example, in Figure 10, the line associated with an unscaled
*The name “Napolean plot” was chosen as a reference to the information-dense yet intuitive nature of the plot, calling to mind Charles Joseph Minard’s map of Napoleon’s march on Russia.19
Unscaled PAM
Gaps between long eclipses
14
PAM lies within about 5% of a 4-hour eclipse in 2027 as well as a 3-hour eclipse in 2021. Changing the duration of PAM via scaling helps in avoiding this case.
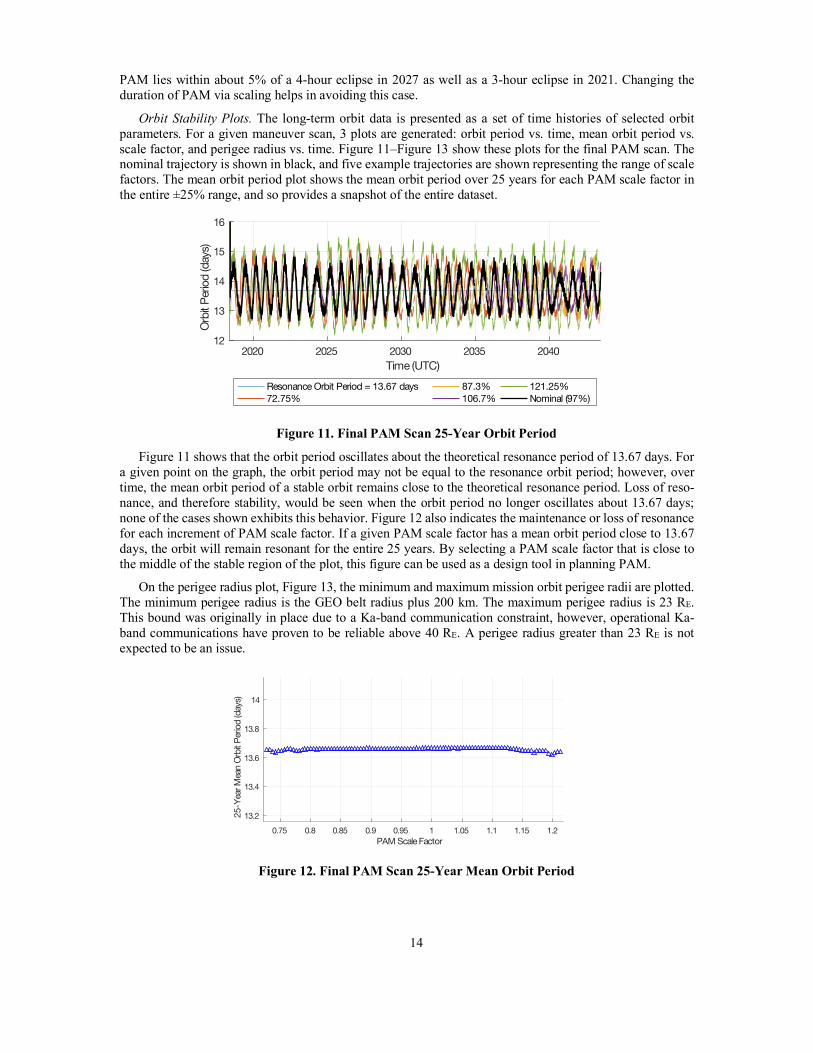
Orbit Stability Plots. The long-term orbit data is presented as a set of time histories of selected orbit parameters. For a given maneuver scan, 3 plots are generated: orbit period vs. time, mean orbit period vs. scale factor, and perigee radius vs. time. Figure 11–Figure 13 show these plots for the final PAM scan. The nominal trajectory is shown in black, and five example trajectories are shown representing the range of scale factors. The mean orbit period plot shows the mean orbit period over 25 years for each PAM scale factor in the entire ±25% range, and so provides a snapshot of the entire dataset.
Figure 11. Final PAM Scan 25-Year Orbit Period
Figure 11 shows that the orbit period oscillates about the theoretical resonance period of 13.67 days. For a given point on the graph, the orbit period may not be equal to the resonance orbit period; however, over time, the mean orbit period of a stable orbit remains close to the theoretical resonance period. Loss of reso-nance, and therefore stability, would be seen when the orbit period no longer oscillates about 13.67 days; none of the cases shown exhibits this behavior. Figure 12 also indicates the maintenance or loss of resonance for each increment of PAM scale factor. If a given PAM scale factor has a mean orbit period close to 13.67 days, the orbit will remain resonant for the entire 25 years. By selecting a PAM scale factor that is close to the middle of the stable region of the plot, this figure can be used as a design tool in planning PAM.
On the perigee radius plot, Figure 13, the minimum and maximum mission orbit perigee radii are plotted. The minimum perigee radius is the GEO belt radius plus 200 km. The maximum perigee radius is 23 RE. This bound was originally in place due to a Ka-band communication constraint, however, operational Ka-band communications have proven to be reliable above 40 RE. A perigee radius greater than 23 RE is not expected to be an issue.
Figure 12. Final PAM Scan 25-Year Mean Orbit Period
2020 2025 2030 2035 2040Time (UTC)
12
13
14
15
16Or
bit P
eriod
(day
s)
Resonance Orbit Period = 13.67 days72.75%
87.3%106.7%
121.25%Nominal (97%)
0.75 0.8 0.85 0.9 0.95 1 1.05 1.1 1.15 1.2PAM Scale Factor
13.2
13.4
13.6
13.8
14
25-Y
ear M
ean
Orbit
Per
iod (d
ays)

15
Figure 13. Final PAM Scan 25-Year Perigee Radius
Monte Carlo Simulations. In addition to performing PAM scans, Monte Carlo simulations were per-formed to assess robustness to uncertainty in the initial state, maneuver magnitude error, and maneuver point-ing error. The initial state uncertainty was provided from the covariance output by the OD before maneuver planning for PAM. Maneuver magnitude and pointing uncertainties were inflated to values of 10% and 5 degrees to stress the off-nominal performance of PAM as much as possible while still remaining in the realm of possibility. Similar eclipse profile and mean orbit period plots were used to assess the results of the Monte Carlo runs. Simulations showed that PAM was robust to perturbations on the order specified.
PAM Execution PAM executed within 1% of the planned ΔV magnitude and within 2 degrees of the planned maneuver
attitude. The burn was 15 minutes and 23 seconds long, consumed about 8.64 kg of propellant, and imparted a ΔV of 53.4 m/s on the spacecraft. The slightly off-nominal performance resulted in an initial mission orbit period of 13.735 days, only 0.15 days different than the targeted value of 13.72 days. Based on post-PAM OD and Monte Carlo analysis, the backup maneuver at PLEP2, TCM4, was waived.
COMMISSIONING RESULTS
Achieved Orbit Once PAM was determined to have executed nominally, a Monte Carlo simulation was performed to
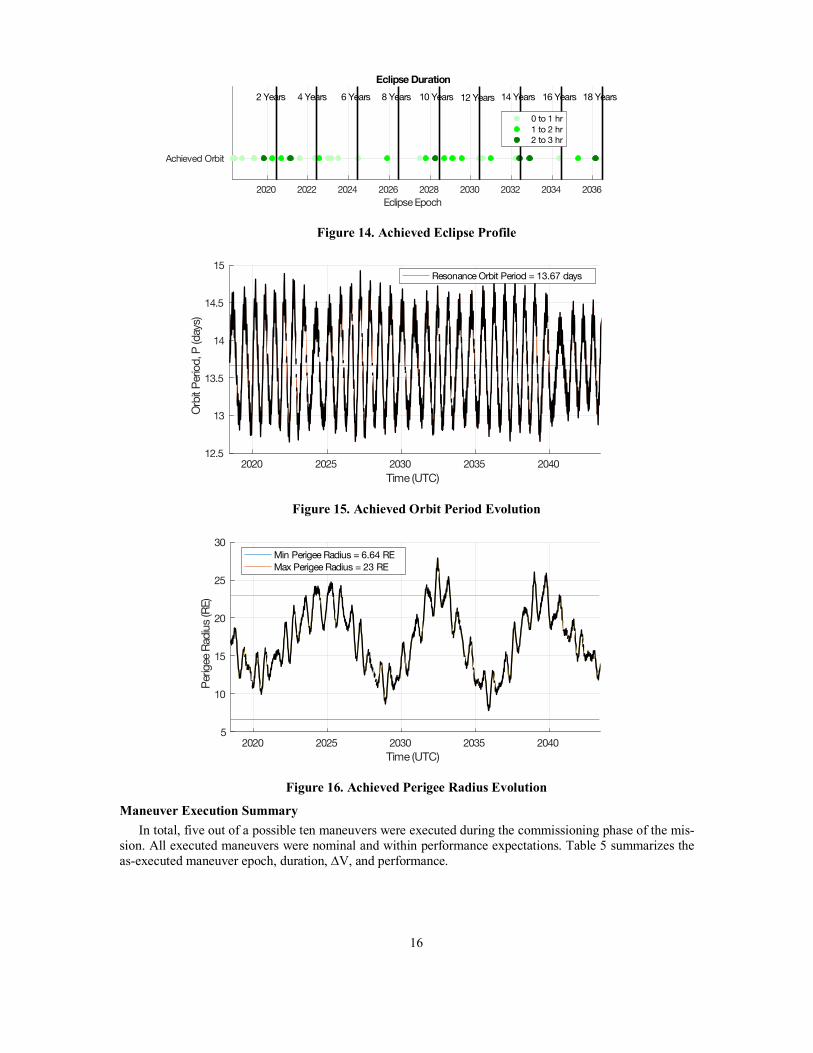
assess the long-term eclipse profile and orbit stability. Because PAM was the final maneuver for TESS, the only uncertainty modeled was that from OD covariance on the initial state. The simulation showed that the orbit will not encounter any eclipses longer than 3 hours for over 18 years and that the orbit will be stable and above the GEO belt for over 25 years.
The nominal orbit state was propagated and assessed for long-term eclipses and orbit stability. The long-term eclipse prediction is shown in Figure 14. None of the eclipses exceed 3 hours in duration for the 18-year prediction. Figure 15 shows the orbit period evolution. As expected, the orbit period oscillates about 13.67 days. The mean orbit period over the 25-year propagation is 13.66 days. Figure 16 shows the perigee radius evolution. The perigee radius remains below 23 RE for the 2-year primary mission, but exceeds it at three other intervals over 25 years. However, this is not a restrictive constraint as Ka-band communications have proven to be successful well above this limit. More importantly, perigee never falls below the GEO belt (6.6 RE) throughout the 25-year propagation.
2020 2025 2030 2035 2040Time (UTC)
5
10
15
20
25
30
35
Perig
ee R
adius
(RE)
Min Perigee Radius = 6.64 REMax Perigee Radius = 23 RE72.75%87.3%
106.7%121.25%Nominal (97%)
16
Figure 14. Achieved Eclipse Profile
Figure 15. Achieved Orbit Period Evolution
Figure 16. Achieved Perigee Radius Evolution
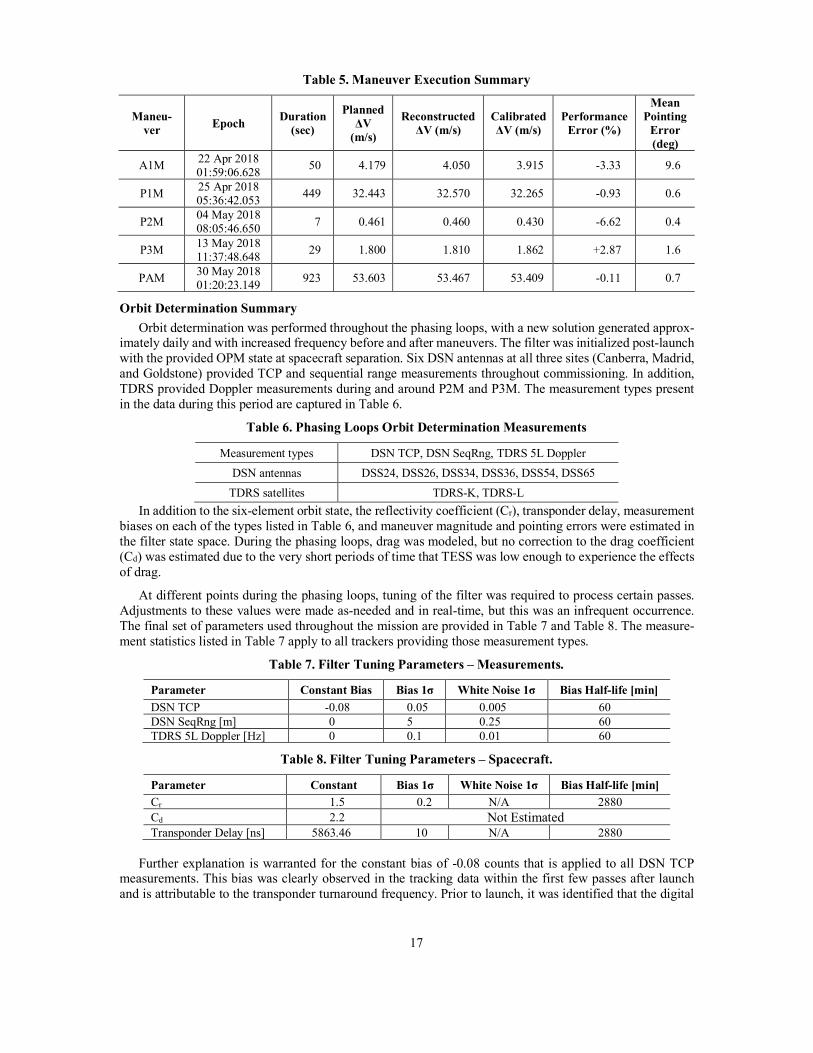
Maneuver Execution Summary In total, five out of a possible ten maneuvers were executed during the commissioning phase of the mis-
sion. All executed maneuvers were nominal and within performance expectations. Table 5 summarizes the as-executed maneuver epoch, duration, ∆V, and performance.
2020 2022 2024 2026 2028 2030 2032 2034 2036Eclipse Epoch
Achieved Orbit
Eclipse Duration
0 to 1 hr1 to 2 hr2 to 3 hr
2 Years 4 Years 6 Years 8 Years 10 Years 12 Years 14 Years 16 Years 18 Years
2020 2025 2030 2035 2040Time (UTC)
12.5
13
13.5
14
14.5
15
Orbit
Per
iod, P
(day
s)
Resonance Orbit Period = 13.67 days
2020 2025 2030 2035 2040Time (UTC)
5
10
15
20
25
30
Perig
ee R
adius
(RE)
Min Perigee Radius = 6.64 REMax Perigee Radius = 23 RE
17
Table 5. Maneuver Execution Summary
Maneu-ver Epoch Duration
(sec)
Planned ΔV
(m/s)
Reconstructed ΔV (m/s)
Calibrated ΔV (m/s)
Performance Error (%)
Mean Pointing
Error (deg)
A1M 22 Apr 2018 01:59:06.628 50 4.179 4.050 3.915 -3.33 9.6
P1M 25 Apr 2018 05:36:42.053 449 32.443 32.570 32.265 -0.93 0.6
P2M 04 May 2018 08:05:46.650 7 0.461 0.460 0.430 -6.62 0.4
P3M 13 May 2018 11:37:48.648 29 1.800 1.810 1.862 +2.87 1.6
PAM 30 May 2018 01:20:23.149 923 53.603 53.467 53.409 -0.11 0.7
Orbit Determination Summary Orbit determination was performed throughout the phasing loops, with a new solution generated approx-
imately daily and with increased frequency before and after maneuvers. The filter was initialized post-launch with the provided OPM state at spacecraft separation. Six DSN antennas at all three sites (Canberra, Madrid, and Goldstone) provided TCP and sequential range measurements throughout commissioning. In addition, TDRS provided Doppler measurements during and around P2M and P3M. The measurement types present in the data during this period are captured in Table 6.
Table 6. Phasing Loops Orbit Determination Measurements
Measurement types DSN TCP, DSN SeqRng, TDRS 5L Doppler DSN antennas DSS24, DSS26, DSS34, DSS36, DSS54, DSS65
TDRS satellites TDRS-K, TDRS-L In addition to the six-element orbit state, the reflectivity coefficient (Cr), transponder delay, measurement
biases on each of the types listed in Table 6, and maneuver magnitude and pointing errors were estimated in the filter state space. During the phasing loops, drag was modeled, but no correction to the drag coefficient (Cd) was estimated due to the very short periods of time that TESS was low enough to experience the effects of drag.
At different points during the phasing loops, tuning of the filter was required to process certain passes. Adjustments to these values were made as-needed and in real-time, but this was an infrequent occurrence. The final set of parameters used throughout the mission are provided in Table 7 and Table 8. The measure-ment statistics listed in Table 7 apply to all trackers providing those measurement types.
Table 7. Filter Tuning Parameters – Measurements.
Parameter Constant Bias Bias 1σ White Noise 1σ Bias Half-life [min] DSN TCP -0.08 0.05 0.005 60 DSN SeqRng [m] 0 5 0.25 60 TDRS 5L Doppler [Hz] 0 0.1 0.01 60
Table 8. Filter Tuning Parameters – Spacecraft.
Parameter Constant Bias 1σ White Noise 1σ Bias Half-life [min] Cr 1.5 0.2 N/A 2880 Cd 2.2 Not Estimated Transponder Delay [ns] 5863.46 10 N/A 2880
Further explanation is warranted for the constant bias of -0.08 counts that is applied to all DSN TCP
measurements. This bias was clearly observed in the tracking data within the first few passes after launch and is attributable to the transponder turnaround frequency. Prior to launch, it was identified that the digital

18
electronics in the S-band transponder may have some amount of inaccuracy in the nominal turnaround ratio. To characterize this inaccuracy, a measurement was added to the pre-launch RF compatibility tests. The results of those tests indicated that there was both some small amount of noise in the turnaround ratio as well as a non-zero mean. The mean pre-launch measured offset, taken in frequency space and converted to counts, was -0.087 counts.
Figure 17–Figure 19 show the results of the final definitive OD over the commissioning period. For this run, nearly all DSN TCP and sequential range passes were included, but the two TDRS passes through P2M and P3M were not. The TDRS passes were valuable for real-time assessment of the maneuvers, but not necessary in the final definitive solution. Additionally, after sufficient DSN tracking data was processed, the initial state was reinitialized via a least-squares solution instead of the prior OPM separation state. This rei-nitialization helped account for small deviations between the observed orbit and the OPM state, as well as initialize the state covariance with a realistic fully-formed a priori matrix.
Figure 17 shows the measurement residual ratios for all measurement types present in the solution. The residuals are well-behaved, with no apparent structure or trend visible. Figure 18 shows the 3σ position un-certainty from the smoother, which remains largely under 450 m throughout the phasing loops, and under 900 m at the start of the mission orbit. Figure 19 shows the position filter-smoother consistency, which for a well-behaved filter should lie largely within the ±3σ bounds. The consistency is within ±3σ, indicating that the state covariance throughout the OD is realistically sized. There were no anomalies throughout commis-sioning. Two DSN passes were lost due to site hardware issues during the scheduled contacts, but neither had a significant effect on the solution.
Figure 17. Measurement Residual Ratios

19
Figure 18. Position Uncertainty - Smoother (3σ)
Figure 19. Position Filter-Smoother Consistency
CONCLUSION
The TESS mission will perform the first-ever spaceborne all-sky survey of exoplanets transiting bright stars over its two-year primary mission. It has successfully completed its flight dynamics commissioning phase, consisting of a sequence of five maneuvers and a lunar flyby to place the satellite into its final mission orbit. All planned maneuvers executed nominally or were waived as unnecessary. The spacecraft is currently in its final mission orbit where it will remain without the need for further maneuvers. All commissioning and mission orbit requirements were met and are expected to be met for years to come, to the limit of the team’s ability to accurately predict.
The TESS flight dynamics design and operations contain a number of novel aspects. It is the first primary-mission use of a lunar-resonant orbit, and the first use by any mission of 2:1 lunar resonance in particular. This type of orbit enables long-term orbit stability without further need for maneuvers, and without the need for strictly-enforced initial conditions to achieve that long-term stability. The TESS flight dynamics team used innovative techniques to fine-tune the long-term eclipse and stability characteristics of the final orbit by making careful adjustments to the final maneuver. These efforts have enabled a predicted 18 years of mission life without a long eclipse, opening the possibility of greatly expanded science return. Finally, TESS is the first mission to use the open-source General Mission Analysis Tool (GMAT) for its primary mission design activities. This benefited TESS due to the unique suite of capabilities and the flexibility of the software, and now provides a baseline example for use of GMAT by other missions as a heritage capability. The team is encouraged by the successful TESS commissioning and hopes that each of these contributions proves valua-ble for future mission users.

20
ACKNOWLEDGEMENTS
The authors would like to thank the TESS project for its sponsorship and support of the activities de-scribed in this paper. We also thank Chad Mendelsohn for his leadership throughout the flight dynamics design phase, and Donald Dichmann for his integral contributions to the TESS mission design, and for review of this paper.
1 G.R. Ricker, et al., "Transiting Exoplanet Survey Satellite." Journal of Astronomical Telescopes, Instruments, and Systems. Vol. 1, No. 1. 2 W. Borucki, D. Koch, G. Basri, N. Batalha, T. Brown, D. Caldwell, J. Christensen-Dalsgaard, W. Cochran, E. Dunham, T.N. Gautier, J. Geary, R. Gilliland, J. Jenkins, Y. Kondo, D. Latham, J.J. Lissauer and David Monet, “Finding Earth-size planets in the habitable zone: the Kepler Mission.” Proceedings of the International Astronomical Union. Vol. 3, No. s249, pp. 17–24. 3 J.W. Gangestad, G.A. Henning, R.R. Persinger and G.R. Ricker, “A High Earth, Lunar Resonant Orbit for Lower Cost Space Science Missions.” AAS/AIAA Astrodynamics Specialist Conference, Hilton Head, SC. 2013. 4 D.J. Dichmann, J.J.K. Parker, T.W. Williams and C.R. Mendelsohn, “Trajectory Design for the Transiting Exoplanet Survey Satellite.” International Symposium on Spacecraft Flight Dynamics, Laurel, MD, May 2014. 5 D. Dichmann, J. Parker, C. Nickel and S. Lutz, “Trajectory Design Enhancements to Mitigate Risk for the Transiting Exoplanet Survey Satellite (TESS).” AIAA/AAS Astrodynamics Specialist Conference, Long Beach, CA. Sep. 2016. 6 C. Nickel, R. Lebois, S. Lutz, D. Dichmann and J. Parker, “Monte Carlo Analysis as a Trajectory Design Driver for the TESS Mission.” AIAA/AAS Astrodynamics Specialist Conference, Long Beach CA. Sep. 2016. 7 D.A. McGiffin, M. Matthews and S. Cooley, “High Earth Orbit Design for Lunar-Assisted Medium Class Explorer Missions.” 2001 Flight Mechanics Symposium, Greenbelt, MD. Jun. 2001. 8 J. Carrico Jr., D. Dichmann, L. Policastri, J. Carrico III, T. Craychee, J. Ferreira, M. Intelisano, R. Lebois, M. Loucks, T. Schrift and R. Sherman, “Lunar-Resonant Trajectory Design for the Interstellar Boundary Explorer (IBEX) Extended Mission.” AAS/AIAA Astrodynamics Specialist Conference, Girdwood, AK. Aug. 2011. AAS 11-454. 9 Y. Kozai, “Secular Perturbations of Asteroids with High Inclination and Eccentricity.” The Astronomical Journal. Vol. 67, No. 9, 1962, pp. 591–598. 10 M.L. Lidov, “Evolution of the Orbits of Artificial Satellites of Planets as Affected by Gravitational Perturbation from External Bodies.” AIAA Journal. Vol. 1, No. 8, 1963, pp. 1985–2002. 11 T. Stengle and S. Hoge, “Evolution and Reengineering of NASA’s Flight Dynamics Facility (FDF).” SpaceOps 2008 Conference. 2008. AIAA 2008-3276. 12 A. Kam, L. Plice, K.F. Galal, A.M. Hawkins, L.A. Policastri, M.E. Loucks, J.P. Carrico, C.A. Nickel, R.L. Lebois and R. Sherman. "LADEE Flight Dynamics: Overview of Mission Design and Operations." 25th AAS/AIAA Space Flight Mechanics Meeting Proceedings, January 11–15, 2015. 13 NASA Goddard Space Flight Center, “General Mission Analysis Tool (GMAT),” version R2017a. http://gmatcen-tral.org 14 Analytical Graphics, Inc., “Orbit Determination Tool Kit (ODTK),” version 6.3.2. http://agi.com 15 NASA Goddard Space Flight Center, “Goddard Trajectory Determination System (GTDS).” https://soft-ware.nasa.gov/software/GSC-15539-1 16 NASA Navigation and Ancillary Information Facility, “SPICE Toolkit.” https://naif.jpl.nasa.gov/naif/toolkit.html 17 Analytical Graphics, Inc., “Systems Tool Kit (STK),” version 11.0.1. http://agi.com 18 The Mathworks, Inc., “MATLAB,” version R2015b. http://mathworks.com 19 E.R. Tufte, The Visual Display of Quantitative Information. Graphics Press, Cheshire, CT. 2nd ed. 2001.
REFERENCES