probabilistic aspects of fatigue · probabilistic aspects of fatigue ... safety factors. larger...
TRANSCRIPT

1
Introduction
Professor Darrell F. SocieDepartment of Mechanical and
Industrial Engineering
© 2003-2005 Darrell Socie, All Rights Reserved
Probabilistic Aspects of Fatigue
•Probabilistic Fatigue © 2003-2005 Darrell Socie, University of Illinois at Urbana-Champaign, All Rights Reserved 1 of 352
Contact Information
Darrell SocieMechanical Engineering1206 West GreenUrbana, Illinois 61801
Office: 3015 Mechanical Engineering Laboratory
[email protected]: 217 333 7630Fax: 217 333 5634

2
•Probabilistic Fatigue © 2003-2005 Darrell Socie, University of Illinois at Urbana-Champaign, All Rights Reserved 2 of 352
Fatigue Calculations
Who really believes these numbers ?
•Probabilistic Fatigue © 2003-2005 Darrell Socie, University of Illinois at Urbana-Champaign, All Rights Reserved 3 of 352
SAE Specimen
Suspension
Transmission
Bracket
Fatigue Under Complex Loading: Analysis and Experiments, SAE AE6, 1977

3
•Probabilistic Fatigue © 2003-2005 Darrell Socie, University of Illinois at Urbana-Champaign, All Rights Reserved 4 of 352
Analysis Results
1 10 100
48 Data PointsCOV 1.27
99.9 %
99 %
90 %
50 %
10 %
1 %
0.1 %
Cum
ulat
ive
Pro
babi
lity
Analytical Life / Experimental Life
Strain-Life analysis of all test data
Non conservative
Conservative
•Probabilistic Fatigue © 2003-2005 Darrell Socie, University of Illinois at Urbana-Champaign, All Rights Reserved 5 of 352
Material Variability
1 10 100
99.9 %
99 %
90 %
50 %
10 %
1 %
0.1 %
Cum
ulat
ive
Pro
babi
lity
Analytical Life / Experimental Life
Material Analysis
Strain-Life back calculation of specimen lives

4
•Probabilistic Fatigue © 2003-2005 Darrell Socie, University of Illinois at Urbana-Champaign, All Rights Reserved 6 of 352
Probabilistic Models
Probabilistic models are no better than the underlying deterministic modelsThey require more work to implementWhy use them?
•Probabilistic Fatigue © 2003-2005 Darrell Socie, University of Illinois at Urbana-Champaign, All Rights Reserved 7 of 352
Quality and Cost
TaguchiIdentify factors that influence performanceRobust design – reduce sensitivity to noiseAssess economic impact of variation
Risk / ReliabilityWhat is the increased risk from reduced testing ?

5
•Probabilistic Fatigue © 2003-2005 Darrell Socie, University of Illinois at Urbana-Champaign, All Rights Reserved 8 of 352
Risk
10-9
10-8
10-7
10-6
10-5
10-4
10-3
Ris
k
Time, Flights etc
Acceptable risk
•Probabilistic Fatigue © 2003-2005 Darrell Socie, University of Illinois at Urbana-Champaign, All Rights Reserved 9 of 352
Reliability
99 %80 %
50 %
10 %
1 %
0.1 %
Exp
ecte
d Fa
ilure
s
106
Fatigue Life
105104103

6
•Probabilistic Fatigue © 2003-2005 Darrell Socie, University of Illinois at Urbana-Champaign, All Rights Reserved 10 of 352
Risk Contribution Factors
OperatingTemperature
Analysis Uncertainty
Speed
MaterialProperties
ManufacturingFlaws
•Probabilistic Fatigue © 2003-2005 Darrell Socie, University of Illinois at Urbana-Champaign, All Rights Reserved 11 of 352
Uncertainty and Variabilitycustomers
materials manufacturing
usage
107
Fatigue Life, 2Nf
1
10 102 103 104 105 106
0.1
10-2
1
10-3
10-4
Stra
in A
mpl
itude
time
50%
100 %
Failu
res
Strength
Stress

7
•Probabilistic Fatigue © 2003-2005 Darrell Socie, University of Illinois at Urbana-Champaign, All Rights Reserved 12 of 352
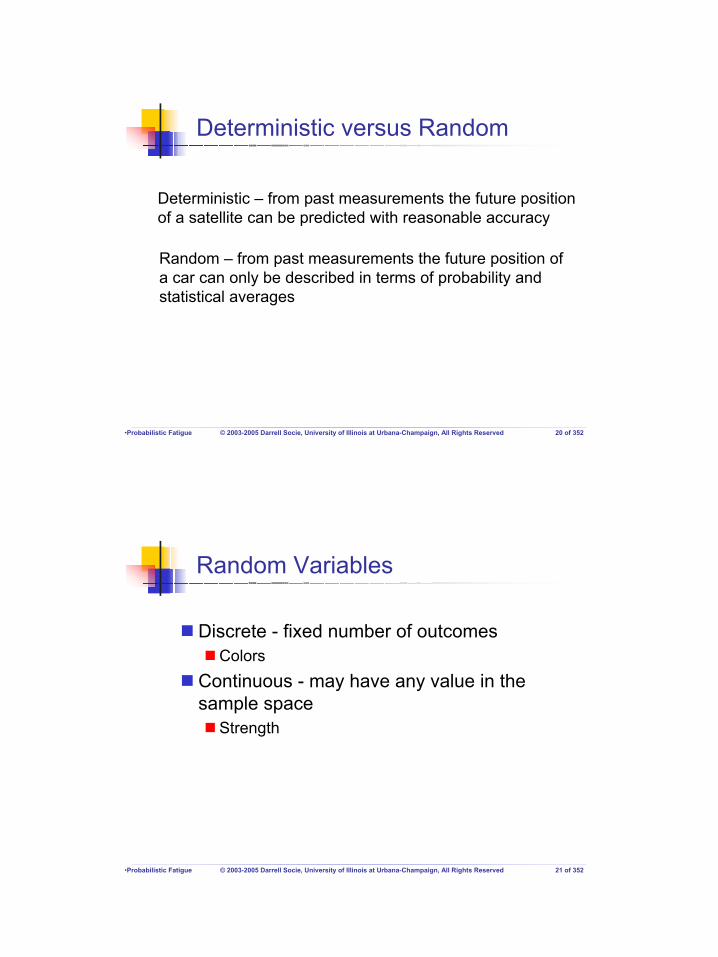
Deterministic versus Random
Deterministic – from past measurements the future position of a satellite can be predicted with reasonable accuracy
Random – from past measurements the future position of a car can only be described in terms of probability and statistical averages
•Probabilistic Fatigue © 2003-2005 Darrell Socie, University of Illinois at Urbana-Champaign, All Rights Reserved 13 of 352
Deterministic Design
Stress Strength
SafetyFactor
Variability and uncertainty is accommodated by introducing safety factors. Larger safety factors are better, but how much better and at what cost?
8
•Probabilistic Fatigue © 2003-2005 Darrell Socie, University of Illinois at Urbana-Champaign, All Rights Reserved 14 of 352
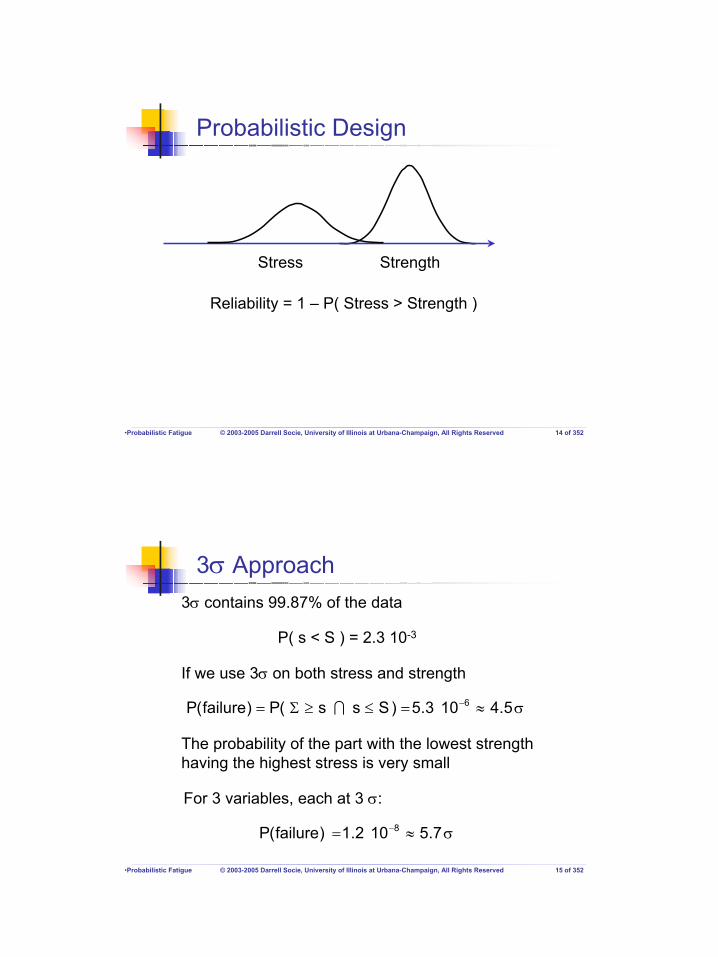
Probabilistic Design
Stress Strength
Reliability = 1 – P( Stress > Strength )
•Probabilistic Fatigue © 2003-2005 Darrell Socie, University of Illinois at Urbana-Champaign, All Rights Reserved 15 of 352
3σ Approach3σ contains 99.87% of the data
If we use 3σ on both stress and strength
The probability of the part with the lowest strengthhaving the highest stress is very small
P( s < S ) = 2.3 10-3
σ≈=≤≥Σ= − 5.4103.5)Sss(P)failure(P 6I
For 3 variables, each at 3 σ:
σ≈= − 7.5102.1)failure(P 8

9
•Probabilistic Fatigue © 2003-2005 Darrell Socie, University of Illinois at Urbana-Champaign, All Rights Reserved 16 of 352
Benefits
Reduces conservatism (cost) compared to assuming the “worst case” for every design variableQuantifies life drivers – what are the most important variables and how well are they known or controlled ?Quantifies risk
•Probabilistic Fatigue © 2003-2005 Darrell Socie, University of Illinois at Urbana-Champaign, All Rights Reserved 17 of 352
Probabilistic Aspects of Fatigue
IntroductionBasic Probability and StatisticsStatistical TechniquesAnalysis Methods Characterizing VariabilityCase StudiesFatigueCalculator.comGlyphWorks

10
Basic Probability and Statistics
Professor Darrell F. SocieDepartment of Mechanical and
Industrial Engineering
© 2003-2005 Darrell Socie, All Rights Reserved
Probabilistic Aspects of Fatigue
•Probabilistic Fatigue © 2003-2005 Darrell Socie, University of Illinois at Urbana-Champaign, All Rights Reserved 19 of 352
Probabilistic Aspects of Fatigue
IntroductionBasic Probability and StatisticsStatistical TechniquesAnalysis Methods Characterizing VariabilityCase StudiesFatigueCalculator.comGlyphWorks
11
•Probabilistic Fatigue © 2003-2005 Darrell Socie, University of Illinois at Urbana-Champaign, All Rights Reserved 20 of 352
Deterministic versus Random
Deterministic – from past measurements the future position of a satellite can be predicted with reasonable accuracy
Random – from past measurements the future position of a car can only be described in terms of probability and statistical averages
•Probabilistic Fatigue © 2003-2005 Darrell Socie, University of Illinois at Urbana-Champaign, All Rights Reserved 21 of 352
Random Variables
Discrete - fixed number of outcomesColors
Continuous - may have any value in the sample space
Strength

12
•Probabilistic Fatigue © 2003-2005 Darrell Socie, University of Illinois at Urbana-Champaign, All Rights Reserved 22 of 352
Descriptive Statistics
Mean or Expected ValueVariance / Standard DeviationCoefficient of VariationSkewnessKurtosisCorrelation Coefficient
•Probabilistic Fatigue © 2003-2005 Darrell Socie, University of Illinois at Urbana-Champaign, All Rights Reserved 23 of 352
Mean or Expected Value
Central tendency of the data
( )N
xXExMean
N
1ii
x
∑====µ=

13
•Probabilistic Fatigue © 2003-2005 Darrell Socie, University of Illinois at Urbana-Champaign, All Rights Reserved 24 of 352
Variance / Standard DeviationDispersion of the data
( )N
)xx(XVar
N
1i
2i∑
=
−=
)X(Varx =σ
Standard deviation
•Probabilistic Fatigue © 2003-2005 Darrell Socie, University of Illinois at Urbana-Champaign, All Rights Reserved 25 of 352
Coefficient of Variation
x
xCOVµσ
=
Useful to compare different dispersions
µ = 10σ = 1
COV = 0.1
µ = 100σ = 10
COV = 0.1

14
•Probabilistic Fatigue © 2003-2005 Darrell Socie, University of Illinois at Urbana-Champaign, All Rights Reserved 26 of 352
Skewness
Skewness is a measure of the asymmetry of the data around the sample mean. If skewness is negative, the data are spread out more to the left of the mean than to the right. If skewness is positive, the data are spread out more to the right. The skewness of the normal distribution (or any perfectly symmetric distribution) is zero.
( ) 3
N
1i
3i
N
)xx(XSkewness
σ
−=
∑=
•Probabilistic Fatigue © 2003-2005 Darrell Socie, University of Illinois at Urbana-Champaign, All Rights Reserved 27 of 352
Kurtosis
Kurtosis is a measure of how outlier-prone a distribution is. The kurtosis of the normal distribution is 3. Distributions thatare more outlier-prone than the normal distribution have kurtosis greater than 3; distributions that are less outlier-prone have kurtosis less than 3.
( ) 4
N
1i
4i
N
)xx(XKurtosis
σ
−=
∑=

15
•Probabilistic Fatigue © 2003-2005 Darrell Socie, University of Illinois at Urbana-Champaign, All Rights Reserved 28 of 352
Covariance
A measure of the linear association between random variables
[ ])Y()X(E)Y,X(COV YXxy µ−µ−==σ
•Probabilistic Fatigue © 2003-2005 Darrell Socie, University of Illinois at Urbana-Champaign, All Rights Reserved 29 of 352
Correlation Coefficient
0 X
Y
0 X
Y
0 X
Y
0 X
Y
0 X
Y
0 X
Y
ρ = 1 ρ = 0ρ = -1
0 < ρ < 1 ρ ~0ρ ~ 0
[ ]YX
YX )Y()X(Eσσ
µ−µ−=ρ

16
•Probabilistic Fatigue © 2003-2005 Darrell Socie, University of Illinois at Urbana-Champaign, All Rights Reserved 30 of 352
Probability
Basic probabilityConditional probabilityReliability
•Probabilistic Fatigue © 2003-2005 Darrell Socie, University of Illinois at Urbana-Champaign, All Rights Reserved 31 of 352
Basic Probability
( ) 1AP0 ≤≤
( ) certain1AP =
( ) eimposssibl0AP =
The probability of event A occurring:

17
•Probabilistic Fatigue © 2003-2005 Darrell Socie, University of Illinois at Urbana-Champaign, All Rights Reserved 32 of 352
Conditional Basic Probability
( ) ( ) ( ) ( )BandABorA
BAPBPAPBAP IU −+=
( ) ( )( )AP
BAPABP I=
( ) ( )( )BP
BAPBAP I=
P(B) given A has occurred
union intersection
•Probabilistic Fatigue © 2003-2005 Darrell Socie, University of Illinois at Urbana-Champaign, All Rights Reserved 33 of 352
Independent Events
1 2
If A and B are unrelated
( ) ( )BPABP =
( ) ( )APBAP =
( ) ( ) ( )BPAPBAP ⋅=I
Suppose the probability of bar 1 failing is 0.03 and the probability of bar 2 failing is 0.04.
What is the probability of the structure failing?

18
•Probabilistic Fatigue © 2003-2005 Darrell Socie, University of Illinois at Urbana-Champaign, All Rights Reserved 34 of 352
Failure Probability
Bar 1 or bar 2 fails
( ) 03.0AP =
( ) 04.0BP =
( ) ( ) ( ) 0012.0BPAPBAP =⋅=I
P( failure) = 0.03 + 0.04 - 0.0012 = 0.0688
( ) ( ) ( ) ( )BAPBPAPBAP IU −+=
•Probabilistic Fatigue © 2003-2005 Darrell Socie, University of Illinois at Urbana-Champaign, All Rights Reserved 35 of 352
Reliability
P( no failure ) = Reliability
( ) AnotofyprobabilitAPDefine
( ) ( )A1PAP −=
( )BAPliabilityRe I=
( ) ( ) ( )BPAPBAP ⋅=I
( ) 9312.096.097.0BAP =⋅=I
For the 2 bar structure
( ) 0688.0liabilityRe1failureP =−=

19
•Probabilistic Fatigue © 2003-2005 Darrell Socie, University of Illinois at Urbana-Champaign, All Rights Reserved 36 of 352
Structural Reliability
Collapse occurs if any member fails
( ) ( )n4321 AAAAAPAP ⋅⋅⋅⋅= IIII
( ) ( ) ( ) ( ) ( ) ( )n4321 APAPAPAPAPAP ⋅⋅⋅⋅⋅⋅⋅=
( ) linkeachfor01.0APSuppose =
( ) ( ) 932.099.0AP 7 ==
•Probabilistic Fatigue © 2003-2005 Darrell Socie, University of Illinois at Urbana-Champaign, All Rights Reserved 37 of 352
Reliability
6
5
4
3
2
1
010-9 10-8 10-7 10-6 10-5 10-4 10-3 10-2 10-1 1
Sta
ndar
d D
evia
tions
Probability

20
•Probabilistic Fatigue © 2003-2005 Darrell Socie, University of Illinois at Urbana-Champaign, All Rights Reserved 38 of 352
6 Sigma
6 sigma is 1 in a billion ( 0.999999999 Reliability )
Suppose a structure has 1000 bolted joints:
( ) ( ) 999999.0999999999.0AP 1000 ==1 in a million
3 sigma is ( 0.99865 Reliability )
( ) ( ) 26.099865.0AP 1000 ==
74 % failures
•Probabilistic Fatigue © 2003-2005 Darrell Socie, University of Illinois at Urbana-Champaign, All Rights Reserved 39 of 352
Statistical Distributions
UniformNormalLogNormalGumbleWeibull
http://www.itl.nist.gov/div898/handbook/
A useful on-line reference:

21
•Probabilistic Fatigue © 2003-2005 Darrell Socie, University of Illinois at Urbana-Champaign, All Rights Reserved 40 of 352
Cumulative Distribution Function
( ) ( )xXPXFx ≤=
( ) 0Fx =∞−
( ) 1Fx =∞
0
1
a b
Fx(X)
•Probabilistic Fatigue © 2003-2005 Darrell Socie, University of Illinois at Urbana-Champaign, All Rights Reserved 41 of 352
Probability Density Function
( ) ( )dxXfbXaPb
ax∫=≤<
( ) ( ) ξξ= ∫∞−
dfXFx
xx
0
1
a b
fx(X)ab
1−

22
•Probabilistic Fatigue © 2003-2005 Darrell Socie, University of Illinois at Urbana-Champaign, All Rights Reserved 42 of 352
Probability
( ) ( )dxXfxXxPx
xx∫
ε+
ε−
=ε+≤<ε−
0
1
a b
fx(X)ab
1−
x
2ε
•Probabilistic Fatigue © 2003-2005 Darrell Socie, University of Illinois at Urbana-Champaign, All Rights Reserved 43 of 352
Survival Function
0
1
a b
Fx(X)
( )XF1)X(S xx −=

23
•Probabilistic Fatigue © 2003-2005 Darrell Socie, University of Illinois at Urbana-Champaign, All Rights Reserved 44 of 352
Hazard Function
a b
hx(X)
( )XF1)X(f)X(h
x
xx −
=
Instantaneous failure rate
•Probabilistic Fatigue © 2003-2005 Darrell Socie, University of Illinois at Urbana-Champaign, All Rights Reserved 45 of 352
Mean or Expected Value
0
1
a b
fx(X)
( ) ∫∞
∞−
==µ dx)X(fxXE xx

24
•Probabilistic Fatigue © 2003-2005 Darrell Socie, University of Illinois at Urbana-Champaign, All Rights Reserved 46 of 352
Variance
( ) dx)X(f)X(XVar x2
x∫∞
∞−
µ−=
( ) ( ) 2x
2XEXVar µ−=
Probability Density
x
)X(Varx =σ
•Probabilistic Fatigue © 2003-2005 Darrell Socie, University of Illinois at Urbana-Champaign, All Rights Reserved 47 of 352
Normal Distribution
0.1
0.2
0.3
0.4
-3 -2 -1 0 1 2 3Quantile x
Prob
abilit
y D
ensi
ty
-3 -2 -1 0 1 2 3Quantile x
0.5
1.0
Cum
ulat
ive
Prob
abilit
y
σ
µ−−πσ
= 2
2
x 2)x(exp
21)x(f tables
25
•Probabilistic Fatigue © 2003-2005 Darrell Socie, University of Illinois at Urbana-Champaign, All Rights Reserved 48 of 352
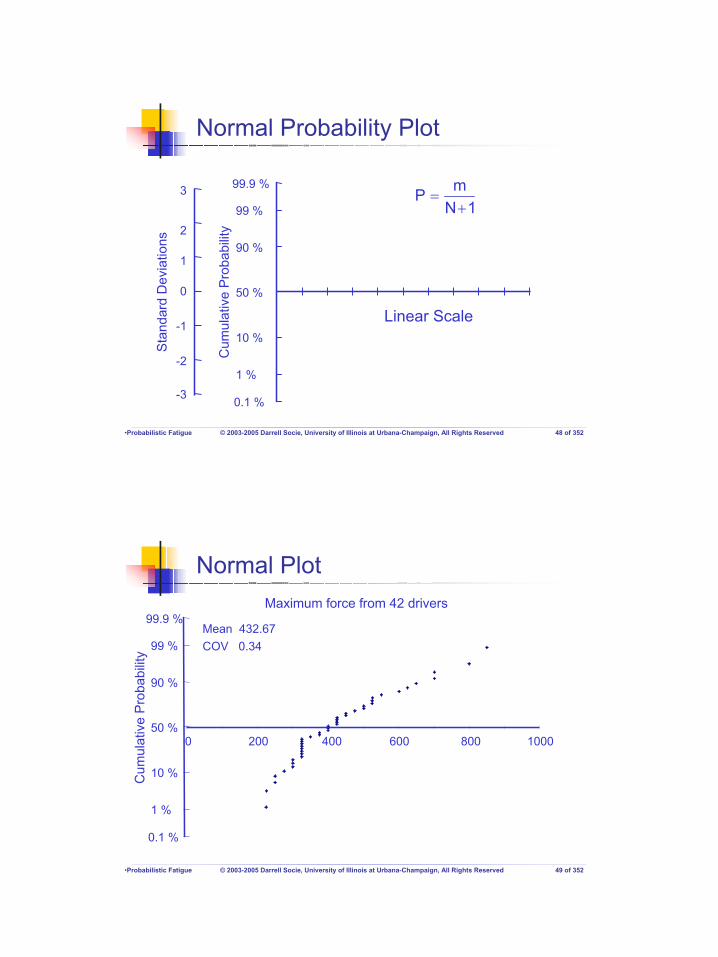
Normal Probability Plot
99.9 %
99 %
90 %
50 %
10 %
1 %
0.1 %
Cum
ulat
ive
Pro
babi
lity
0
1
2
3
-1
-2
-3
Sta
ndar
d D
evia
tions
Linear Scale
1NmP+
=
•Probabilistic Fatigue © 2003-2005 Darrell Socie, University of Illinois at Urbana-Champaign, All Rights Reserved 49 of 352
Normal Plot
99.9 %
99 %
90 %
50 %
10 %
1 %
0.1 %
0 200 400 600 800 1000
Mean 432.67COV 0.34
Maximum force from 42 drivers
Cum
ulat
ive
Pro
babi
lity

26
•Probabilistic Fatigue © 2003-2005 Darrell Socie, University of Illinois at Urbana-Champaign, All Rights Reserved 50 of 352
LogNormal Distribution
0.5
1.0
Cum
ulat
ive
Prob
abilit
y
1 32Quantile x
0.2
0.4
0.6
0.8
Prob
abilit
y D
ensi
ty
1 32Quantile x
σ = 0.6
σ = 1.0
σ = 0.6
σ = 1.0
σ
−
πσ= 2
2
x 2
)mxln(
exp2x
1)x(f tables
( )µ= expm
•Probabilistic Fatigue © 2003-2005 Darrell Socie, University of Illinois at Urbana-Champaign, All Rights Reserved 51 of 352
Useful Relationships
( )2xlnxlnx 5.0exp σ+µ=µ
+
µ=µ
2x
xxln
COV1ln
( )2x
2xln COV1ln +=σ
1)exp(COV 2xlnx −σ=
2x
xxlnx
COV1)exp(X
+
µ=µ=

27
•Probabilistic Fatigue © 2003-2005 Darrell Socie, University of Illinois at Urbana-Champaign, All Rights Reserved 52 of 352
Median / Mean ratio
COVX0 1 2 3 4 50
0.2
0.4
0.6
0.8
1.0
X
Xµ
•Probabilistic Fatigue © 2003-2005 Darrell Socie, University of Illinois at Urbana-Champaign, All Rights Reserved 53 of 352
σlnX - COVX
COVX
0 0.5 1.0 1.5 2.0
0.5
1.0
1.5
σ lnX

28
•Probabilistic Fatigue © 2003-2005 Darrell Socie, University of Illinois at Urbana-Champaign, All Rights Reserved 54 of 352
LogNormal Probability Plot
99.9 %
99 %
90 %
50 %
10 %
1 %
0.1 %
Cum
ulat
ive
Pro
babi
lity
0
1
2
3
-1
-2
-3
Sta
ndar
d D
evia
tions
Log Scale
•Probabilistic Fatigue © 2003-2005 Darrell Socie, University of Illinois at Urbana-Champaign, All Rights Reserved 55 of 352
LogNormal Plot
99.9 %
99 %
90 %
50 %
10 %
1 %
0.1 %
100 1000
Median 431COV 0.34
200 500
Maximum force from 42 drivers
Cum
ulat
ive
Pro
babi
lity

29
•Probabilistic Fatigue © 2003-2005 Darrell Socie, University of Illinois at Urbana-Champaign, All Rights Reserved 56 of 352
Gumbel Extreme Value
a-3b a+4ba a-3b a+4ba
1.0
0.5
Cum
ulat
ive
Prob
abilit
y
Quantile x Quantile x
0.5
Prob
abilit
y D
ensi
ty
−−
−=b
)ax(expexp)x(Fx
−−
−
−−
=b
)ax(expexpb
)ax(expb1)x(fx
•Probabilistic Fatigue © 2003-2005 Darrell Socie, University of Illinois at Urbana-Champaign, All Rights Reserved 57 of 352
Gumble Probability Plot
Cum
ulat
ive
Pro
babi
lity
99.9 %
99 %
80 %
50 %
10 %
1 %
99.9 %
99 %
80 %
50 %
10 %
1 %
Cum
ulat
ive
Pro
babi
lity
Linear Scale-2
-1
0
1
2
3
4
5
6
7
-ln( -
ln( F
x(X) )
)

30
•Probabilistic Fatigue © 2003-2005 Darrell Socie, University of Illinois at Urbana-Champaign, All Rights Reserved 58 of 352
Gumble Plot
200 400 600 800
Location 362.94Scale 124.61
Maximum force from 42 drivers99.9 %
99 %
80 %
50 %
10 %
1 %
Cum
ulat
ive
Pro
babi
lity
•Probabilistic Fatigue © 2003-2005 Darrell Socie, University of Illinois at Urbana-Champaign, All Rights Reserved 59 of 352
Weibull
1 32Quantile x
Prob
abilit
y D
ensi
ty 1.0
0.8
0.2
0.6
0.4
1 32
Cum
ulat
ive
Prob
abilit
y
Quantile x
c=0.5
c=1.0
c=3.0 1.00.8
0.2
0.6
0.4
c=0.5
c=1.0c=3.0
−−=
c
x bxexp1)x(F
−
=
− c
c
1c
x bxexp
bxc)x(f

31
•Probabilistic Fatigue © 2003-2005 Darrell Socie, University of Illinois at Urbana-Champaign, All Rights Reserved 60 of 352
Weibull Probability Plot
Cum
ulat
ive
Pro
babi
lity
Cum
ulat
ive
Pro
babi
lity
-7
-6
-5
-4
-3
-2
-1
0
1
2ln
( -ln
( Fx(X
) ) )
99.9 % 99 %
80 %
50 %
10 %
1 %
0.1 %
Log Scale
•Probabilistic Fatigue © 2003-2005 Darrell Socie, University of Illinois at Urbana-Champaign, All Rights Reserved 61 of 352
Weibull Plot
200 1000
99.9 % 99 %
80 %
50 %
10 %
1 %
0.1 %
Scale Factor: 473.56Slope: 3.8
500
Cum
ulat
ive
Pro
babi
lity

32
•Probabilistic Fatigue © 2003-2005 Darrell Socie, University of Illinois at Urbana-Champaign, All Rights Reserved 62 of 352
99.9 % Probability
785Weibull1223Gumbel1125LogNormal893Normal
Estimated maximum force from the distributions
•Probabilistic Fatigue © 2003-2005 Darrell Socie, University of Illinois at Urbana-Champaign, All Rights Reserved 63 of 352
Comparison
0 200 400 600 800 1000 1200Maximum Load
0.001
0.002
0.003
0.004
Pro
babi
lity
Den
sity
Normal
LogNormal
Gumble
Weibull c = 3.5
All distributions are approximately normal around the median

33
•Probabilistic Fatigue © 2003-2005 Darrell Socie, University of Illinois at Urbana-Champaign, All Rights Reserved 64 of 352
Joint Probability Density
x
y
fxy(x,y)
µX
µY
Reliability = 1 – P( Stress > Strength )
Strength
Stress
•Probabilistic Fatigue © 2003-2005 Darrell Socie, University of Illinois at Urbana-Champaign, All Rights Reserved 65 of 352
Joint Probability Density
( )
( )
σµ−
+
σµ−
σ
µ−ρ−
σ
µ−ρ−
−
ρ−σσπ=
2
y
y
y
y
x
x
2
x
x2
2yx
xy
yyx2x12
1exp
121y,xf
ρ correlation coefficient
Normal distributions

34
•Probabilistic Fatigue © 2003-2005 Darrell Socie, University of Illinois at Urbana-Champaign, All Rights Reserved 66 of 352
2D - Joint Probability Density
Contours of equal probability
y
xµx
µY
-3σx
3σY
12
34
Stress
Strength
•Probabilistic Fatigue © 2003-2005 Darrell Socie, University of Illinois at Urbana-Champaign, All Rights Reserved 67 of 352
Acceptable Risk
SafetyP(failure) ~ 10-6 → 10-9
EconomicP(failure) ~ 10-2 → 10-4
35
•Probabilistic Fatigue © 2003-2005 Darrell Socie, University of Illinois at Urbana-Champaign, All Rights Reserved 68 of 352
Extreme Values
For most durability problems, we are not interested inthe “large extremes” of stress or strength. Failure is much more likely to come from moderately high stressescombined with moderately low strengths.
•Probabilistic Fatigue © 2003-2005 Darrell Socie, University of Illinois at Urbana-Champaign, All Rights Reserved 69 of 352
Key Points
Basic NomenclatureRandom Variables
Statistical DistributionCumulative distribution functionMeanVariance
ProbabilityMarginalConditionalJoint

36
Statistical Techniques
Professor Darrell F. SocieDepartment of Mechanical and
Industrial Engineering
© 2003-2005 Darrell Socie, All Rights Reserved
Probabilistic Aspects of Fatigue
•Probabilistic Fatigue © 2003-2005 Darrell Socie, University of Illinois at Urbana-Champaign, All Rights Reserved 71 of 352
Probabilistic Aspects of Fatigue
IntroductionBasic Probability and StatisticsStatistical TechniquesAnalysis Methods Characterizing VariabilityCase StudiesFatigueCalculator.comGlyphWorks

37
•Probabilistic Fatigue © 2003-2005 Darrell Socie, University of Illinois at Urbana-Champaign, All Rights Reserved 72 of 352
Statistical Techniques
Normal DistributionsLogNormal DistributionsMonte CarloSamplingDistribution Fitting
•Probabilistic Fatigue © 2003-2005 Darrell Socie, University of Illinois at Urbana-Champaign, All Rights Reserved 73 of 352
Failure Probability
)Sss(P ≤≥Σ I
Let Σ be the stress and S the fatigue strength
Given the distributions of Σ and S find the probability of failure
Stress, Σ Strength, S
s

38
•Probabilistic Fatigue © 2003-2005 Darrell Socie, University of Illinois at Urbana-Champaign, All Rights Reserved 74 of 352
Normal Variables
Linear Response Function
∑=
+=n
1iiio XaaZ
Xi ~ N( µi , Ci )
∑=
µ+=µn
1iiioz aa
∑=
σ=σn
1i
2i
2iz a
•Probabilistic Fatigue © 2003-2005 Darrell Socie, University of Illinois at Urbana-Champaign, All Rights Reserved 75 of 352
Calculations
Z = S - Σ
µz = µS - µΣ
22Sz Σσ+σ=σ
Σ ~ N( 100 , 0.2 ) σΣ = 20µz = 200 -100 = 100
S ~ N( 200 , 0.1 ) σS = 20
Stress, Σ Strength, S
Safety factor of 2
2.282020 22z =+=σ
Let Z be a random variable:

39
•Probabilistic Fatigue © 2003-2005 Darrell Socie, University of Illinois at Urbana-Champaign, All Rights Reserved 76 of 352
Failure Probability
Failure will occur whenever Z <= 0
Z = S - Σ
Z = µz – z σz = 0
z = 3.54 standard deviations
P(failure) = 2 x 10⁻⁴
2.28100z
Z
Z =σµ
=
For this case only, a safety factor of 2 means a probability of failure of 2 x 10⁻⁴. Other situations will require differentsafety factors to achieve the same reliability.
•Probabilistic Fatigue © 2003-2005 Darrell Socie, University of Illinois at Urbana-Champaign, All Rights Reserved 77 of 352
Failure Distribution
Stress, Σ Strength, S
What is the expected distribution in fatigue lives?

40
•Probabilistic Fatigue © 2003-2005 Darrell Socie, University of Illinois at Urbana-Champaign, All Rights Reserved 78 of 352
Fatigue Data
bf
'f )N2(2
S∆=σ
102 103 104 105 106 107
Fatigue Life101
1000
100
10
1
Stre
ss A
mpl
itude
'fσ
b1
'f
f 2SN2
σ
∆=
b1
•Probabilistic Fatigue © 2003-2005 Darrell Socie, University of Illinois at Urbana-Champaign, All Rights Reserved 79 of 352
LogNormal Variables
∏=
=n
1i
aio
iXaZ
a’s are constant and Xi ~ LN( xi , Ci )
∏=
=n
1i
aio
iXaZmedian
( )∏=
−+=n
1i
a2XZ 1C1CCOV
2i
i

41
•Probabilistic Fatigue © 2003-2005 Darrell Socie, University of Illinois at Urbana-Champaign, All Rights Reserved 80 of 352
Calculations
Stress, Σ Strength, S
~ LN( 250 , 0.2 ) σ = 50
~ LN( 1000 , 0.1 ) σ = 100
b1
'f
f 2SN2
σ
∆=
'fσ
b = -0.1252S∆
8'f
8
f 2SN2Z σ
∆
==−
8'f
8
f 2SN2Z σ
∆==
−
( ) ( ) 1COV1COV1COV2
f
2 8282SZ −++= σ
−
∆
•Probabilistic Fatigue © 2003-2005 Darrell Socie, University of Illinois at Urbana-Champaign, All Rights Reserved 81 of 352
Results
'fσ∆S/2 2Nf Percentile Life
µx 250 1000 355,368 99.9 17,706,069COVx 0.2 0.1 4.72 99 4,566,613
95 1,363,200µlnx 5.50 6.90 11.21 90 715,589
X 245 995 73,676 50 73,676σx 50 100 1,676,831 10 7,586
σlnx 0.198 0.100 1.774 5 3,9821 1,189
b = -0.125 0.1 307

42
•Probabilistic Fatigue © 2003-2005 Darrell Socie, University of Illinois at Urbana-Champaign, All Rights Reserved 82 of 352
Monte Carlo Methods
( ) ( )
εσ+
σ=
∆ +cbf
'f
'f
b2f
2'ff N2N2
EE
2SK
Given random variables for Kf, ∆S, Find the distribution of 2Nf
'f
'f and εσ
Z = 2Nf = ?
•Probabilistic Fatigue © 2003-2005 Darrell Socie, University of Illinois at Urbana-Champaign, All Rights Reserved 83 of 352
Simple Example
Probability of rolling a 3 on a die
1 2 3 4 5 6
fx(x) 1/6
Uniform discrete distribution

43
•Probabilistic Fatigue © 2003-2005 Darrell Socie, University of Illinois at Urbana-Champaign, All Rights Reserved 84 of 352
Computer Simulation
1. Generate random numbers between 1 and 6,all integers
2. Count the number of 3’s
Let Xi = 1 if 30 otherwise
( ) ∑=
=n
1iiX
n13P
•Probabilistic Fatigue © 2003-2005 Darrell Socie, University of Illinois at Urbana-Champaign, All Rights Reserved 85 of 352
EXCEL
=ROUNDUP( 6 * RAND() , 0 )
=IF( A1 = 3 , 1 , 0 )
=SUM($B$1:B1)/ROW(B1)
5 0 03 1 0.54 0 0.3333334 0 0.255 0 0.26 0 0.1666671 0 0.1428573 1 0.253 1 0.3333336 0 0.3

44
•Probabilistic Fatigue © 2003-2005 Darrell Socie, University of Illinois at Urbana-Champaign, All Rights Reserved 86 of 352
Results
0.1
0.2
0.3
0.4
1 100 200 300 400 500
trials
prob
abilit
y
•Probabilistic Fatigue © 2003-2005 Darrell Socie, University of Illinois at Urbana-Champaign, All Rights Reserved 87 of 352
Evaluate π
x
y P( inside circle )
4rP
2π=
π = 4 P
x = 2 * RAND() - 1y = 2 * RAND() - 1
IF( x2 + y2 < 1 , 1 , 0 )
1
-1
1
-1

45
•Probabilistic Fatigue © 2003-2005 Darrell Socie, University of Illinois at Urbana-Champaign, All Rights Reserved 88 of 352
π
0
1
2
3
4
1 100 200 300 400 500
π
trials
•Probabilistic Fatigue © 2003-2005 Darrell Socie, University of Illinois at Urbana-Champaign, All Rights Reserved 89 of 352
Monte Carlo Simulation
Stress, Σ Strength, S
~ LN( 250 , 0.2 ) σ = 50
~ LN( 1000 , 0.1 ) σ = 100'fσ
b = -0.1252S∆
b1
'f
f 2SN2
σ
∆=
Randomly choose values of S andfrom their distributions'
fσ
Repeat many times

46
•Probabilistic Fatigue © 2003-2005 Darrell Socie, University of Illinois at Urbana-Champaign, All Rights Reserved 90 of 352
Generating Distributions
0
1
x
Fx(X)
Randomly choose a value between 0 and 1
x = Fx-1( RAND )
RAND
•Probabilistic Fatigue © 2003-2005 Darrell Socie, University of Illinois at Urbana-Champaign, All Rights Reserved 91 of 352
Generating Distributions in EXCEL
=LOGINV(RAND(),lnµ,lnσ)
=NORMINV(RAND(),µ,σ)
Normal
Log Normal

47
•Probabilistic Fatigue © 2003-2005 Darrell Socie, University of Illinois at Urbana-Champaign, All Rights Reserved 92 of 352
EXCEL
893 204 134,677 1102 301 32,180 852 285 6,355 963 173 929,249 1050 283 35,565 1080 265 77,057 965 313 8,227 1073 213 420,456 1052 226 224,000 954 322 5,878 965 240 68,671 993 207 277,192 1191 368 11,967 831 210 59,473
'fσ
2S∆
2Nf
•Probabilistic Fatigue © 2003-2005 Darrell Socie, University of Illinois at Urbana-Champaign, All Rights Reserved 93 of 352
Simulation Results
103
99.9 %
99 %
90 %
50 %
10 %
1 %
0.1 %
104 105 106 107 108
Monte Carlo AnalyticalMean 11.25 11.21Std 1.79 1.77
Cum
ulat
ive
Pro
babi
lity
Life

48
•Probabilistic Fatigue © 2003-2005 Darrell Socie, University of Illinois at Urbana-Champaign, All Rights Reserved 94 of 352
Summary
Simulation is relatively straightforward and simple
Obtaining the necessary input data is difficult
•Probabilistic Fatigue © 2003-2005 Darrell Socie, University of Illinois at Urbana-Champaign, All Rights Reserved 95 of 352
Nomenclature
Population: the totality of the observations
Sample: a subset of the population
Population mean: µx
Population variance: σx2
Sample mean: X
Sample variance: s2
( ) xXE µ=
( ) 2x
2sE σ=
49
•Probabilistic Fatigue © 2003-2005 Darrell Socie, University of Illinois at Urbana-Champaign, All Rights Reserved 96 of 352
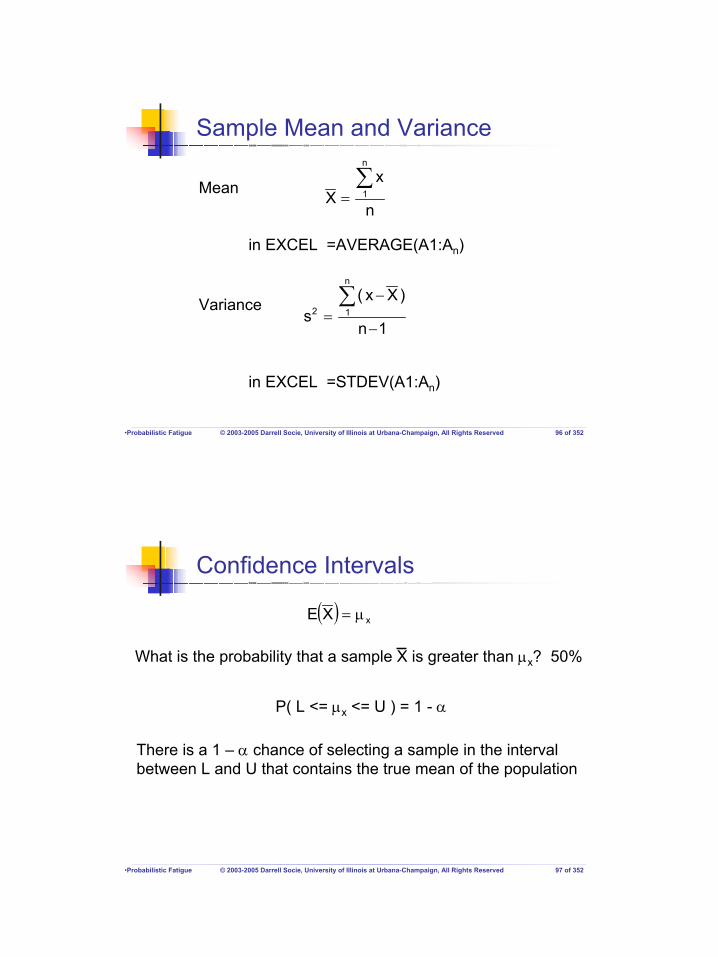
Sample Mean and Variance
in EXCEL =AVERAGE(A1:An)
in EXCEL =STDEV(A1:An)
n
xX
n
1∑
=
1n
)Xx(s
n
12
−
−=
∑
Mean
Variance
•Probabilistic Fatigue © 2003-2005 Darrell Socie, University of Illinois at Urbana-Champaign, All Rights Reserved 97 of 352
Confidence Intervals
( ) xXE µ=
What is the probability that a sample X is greater than µx? 50%
P( L <= µx <= U ) = 1 - α
There is a 1 – α chance of selecting a sample in the intervalbetween L and U that contains the true mean of the population

50
•Probabilistic Fatigue © 2003-2005 Darrell Socie, University of Illinois at Urbana-Champaign, All Rights Reserved 98 of 352
Translation
90% confidence
If we sampled a population many times to estimate the mean, 90% of the time the true population mean would lie between the computed upper and lower limit.
•Probabilistic Fatigue © 2003-2005 Darrell Socie, University of Illinois at Urbana-Champaign, All Rights Reserved 99 of 352
Confidence Interval - mean
Lower limit of µ
xx
1n, nstX µ≤− −α
Upper limit of µ
xx
1n, nstX µ≥+ −α
For a normal distribution:

51
•Probabilistic Fatigue © 2003-2005 Darrell Socie, University of Illinois at Urbana-Champaign, All Rights Reserved 100 of 352
Sample Size
0 5 10 15 20 25 30Sample size, n
0
0.5
1.0
1.5
2.0
xx
1n, nstX µ≤− −α
nt 1n, −α
95%
90%
•Probabilistic Fatigue © 2003-2005 Darrell Socie, University of Illinois at Urbana-Champaign, All Rights Reserved 101 of 352
5 Samples from Normal Distribution
0
20
40
60
80
100
120
140
0 10 20 30 40 50 60 70 80 90 100
95 % confidence – 5 samples will be outside confidence limit
Lower limit above meanUpper limit below mean
Sample Number
µx = 100 σx = 10

52
•Probabilistic Fatigue © 2003-2005 Darrell Socie, University of Illinois at Urbana-Champaign, All Rights Reserved 102 of 352
Confidence Interval - variance
Upper limit of σ
2x
1n,12
2xs)1n(
σ≤χ
−−α−
For a normal distribution:
•Probabilistic Fatigue © 2003-2005 Darrell Socie, University of Illinois at Urbana-Champaign, All Rights Reserved 103 of 352
Sample Size
0 5 10 15 20 25 300
2
4
6
8
10
Sample size, n
2x
1n,12
2xs)1n(
σ≤χ
−−α−
1n,12
)1n(−α−χ
−95%
50%
90%

53
•Probabilistic Fatigue © 2003-2005 Darrell Socie, University of Illinois at Urbana-Champaign, All Rights Reserved 104 of 352
Maximum Load Data
99.9 %
99 %
90 %
50 %
10 %
1 %
0.1 %
100 1000
Median 431COV 0.34
200 500
Maximum force from 42 drivers
Cum
ulat
ive
Pro
babi
lity
90% confidence COV 0.41
•Probabilistic Fatigue © 2003-2005 Darrell Socie, University of Illinois at Urbana-Champaign, All Rights Reserved 105 of 352
Maximum Load Data
Maximum Load0 200 400 600 800 1000 1200
0.001
0.002
0.003
0.004
Pro
babi
lity
Den
sity
Normal COV = 0.34
LogNormal
Normal COV = 0.41
Uncertainty in Variance is just as important, perhaps more important than the choice of the distribution

54
•Probabilistic Fatigue © 2003-2005 Darrell Socie, University of Illinois at Urbana-Champaign, All Rights Reserved 106 of 352
Choose the “Best” Distribution
0 200 400 600 800 1000Maximum Load
Normal
LogNormal
Gumble
Weibull
0.001
0.002
0.003
Pro
babi
lity
Den
sity
15 samples from a Normal Distribution
•Probabilistic Fatigue © 2003-2005 Darrell Socie, University of Illinois at Urbana-Champaign, All Rights Reserved 107 of 352
Goodness of Fit Tests99.9 %
99 %
90 %
50 %
10 %
1 %
0.1 %
0 200 400 600 800 1000
Cum
ulat
ive
Prob
abili
ty
99.9 %
99 %
90 %
50 %
10 %
1 %
0.1 %
99.9 %
99 %
90 %
50 %
10 %
1 %
0.1 %
0 200 400 600 800 1000
Cum
ulat
ive
Prob
abili
ty
99.9 %
99 %
90 %
50 %
10 %
1 %
0.1 %
100 1000200 500
Cum
ulat
ive
Prob
abili
ty
99.9 %
99 %
90 %
50 %
10 %
1 %
0.1 %
99.9 %
99 %
90 %
50 %
10 %
1 %
0.1 %
100 1000200 500
Cum
ulat
ive
Prob
abili
ty
99.9 %
99 %
80 %
50 %
10 %
1 %
200 400 600 800
Cum
ulat
ive
Prob
abili
ty
99.9 %
99 %
80 %
50 %
10 %
1 %
200 400 600 800
Cum
ulat
ive
Prob
abili
ty
Normal
LogNormal
Gumble
200
99.9 % 99 %
80 %
50 %
10 %
1 %
0.1 %
1000500
Cum
ulat
ive
Prob
abili
ty
200
99.9 % 99 %
80 %
50 %
10 %
1 %
0.1 %
1000500
Cum
ulat
ive
Prob
abili
ty
Weibull

55
•Probabilistic Fatigue © 2003-2005 Darrell Socie, University of Illinois at Urbana-Champaign, All Rights Reserved 108 of 352
Analytical Tests
Stephens, M. A. (1974). EDF Statistics for Goodness of Fit and Some Comparisons, Journal of the American Statistical Association, Vol. 69, pp. 730-737.
Kolmogorov-Smirnov
Chakravarti, Laha, and Roy, (1967). Handbook of Methods of Applied Statistics, Volume I, John Wiley and Sons, pp. 392-394.
Anderson-Darling
Snedecor, George W. and Cochran, William G. (1989), Statistical Methods, Eighth Edition, Iowa State University Press.
Chi-squareany univariate distribution
tends to be more sensitive near the center of the distribution
gives more weight to the tails
•Probabilistic Fatigue © 2003-2005 Darrell Socie, University of Illinois at Urbana-Champaign, All Rights Reserved 109 of 352
DistributionsNormal
StrengthDimensions
LogNormalFatigue LivesLarge variance in properties or loads
GumbleMaximums in a population
WeibullFatigue Lives

56
•Probabilistic Fatigue © 2003-2005 Darrell Socie, University of Illinois at Urbana-Champaign, All Rights Reserved 110 of 352
Statistics Software
www.palisade.com
BestFit Minitab
www.minitab.com
•Probabilistic Fatigue © 2003-2005 Darrell Socie, University of Illinois at Urbana-Champaign, All Rights Reserved 111 of 352
Central Limit Theorem
as n → ∞ is the standard normal distribution
If X1, X2, X3 ….. Xn is a random sample from the population,with sample mean X, then the limiting form of
n/XZ X
σµ−
=

57
•Probabilistic Fatigue © 2003-2005 Darrell Socie, University of Illinois at Urbana-Champaign, All Rights Reserved 112 of 352
Translation
When there are many variables affecting the outcome,The final result will be normally distributed even if the individual variable distributions are not.
•Probabilistic Fatigue © 2003-2005 Darrell Socie, University of Illinois at Urbana-Champaign, All Rights Reserved 113 of 352
ExampleProbability of rolling a die
1 2 3 4 5 6
fx(x) 1/6
Uniform discrete distribution
Let Z be the summation of six dice
Z = X1 + X2 + X3 + X4 + X5 + X6

58
•Probabilistic Fatigue © 2003-2005 Darrell Socie, University of Illinois at Urbana-Champaign, All Rights Reserved 114 of 352
Results
0
10
20
30
40
50
60
6 12 18 24 30 36Z
Freq
uenc
y
Central limit theorem states that the result should be normal for large n
500 trials
CZ = 0.20
XZ = 21.12
•Probabilistic Fatigue © 2003-2005 Darrell Socie, University of Illinois at Urbana-Champaign, All Rights Reserved 115 of 352
Central Limit Theorem
Sums: Z = X1 ± X2 ± X3 ± X4 ± ….. Xn
Z → Normal as n increases
Products: Z = X1 • X2 • X3 • X4 • ….. Xn
Z → LogNormal as n increases
Normal and LogNormal distributions are often employed for analysis even though the underlying population distribution is unknown.

59
•Probabilistic Fatigue © 2003-2005 Darrell Socie, University of Illinois at Urbana-Champaign, All Rights Reserved 116 of 352
Key Points
All variables are random and can be characterized by a statistical distribution with a mean and variance.The final result will be normally distributed even if the individual variable distributions are not.
Analysis Methods
Professor Darrell F. SocieDepartment of Mechanical and
Industrial Engineering
© 2003-2005 Darrell Socie, All Rights Reserved
Probabilistic Aspects of Fatigue
60
•Probabilistic Fatigue © 2003-2005 Darrell Socie, University of Illinois at Urbana-Champaign, All Rights Reserved 118 of 352
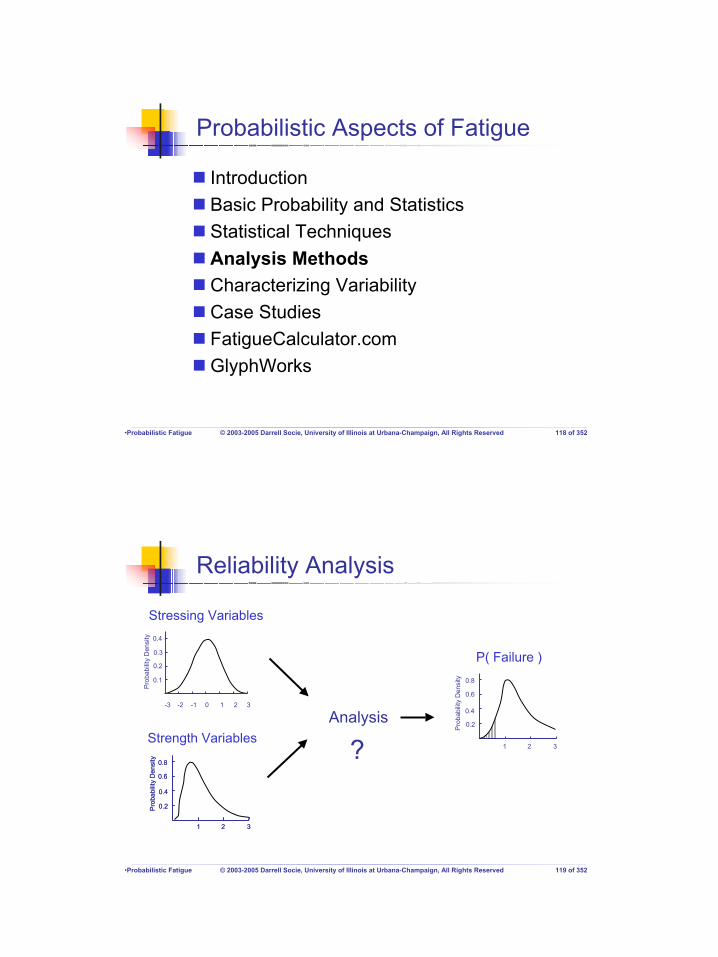
Probabilistic Aspects of Fatigue
IntroductionBasic Probability and StatisticsStatistical TechniquesAnalysis MethodsCharacterizing VariabilityCase StudiesFatigueCalculator.comGlyphWorks
•Probabilistic Fatigue © 2003-2005 Darrell Socie, University of Illinois at Urbana-Champaign, All Rights Reserved 119 of 352
Reliability Analysis
1 32
0.2
0.4
0.6
0.8
Prob
abilit
y D
ensi
ty
0.2
0.4
0.6
0.8
Prob
abilit
y D
ensi
ty
1 32
0.1
0.2
0.3
0.4
-3 -2 -1 0 1 2 3
Prob
abilit
y D
ensi
ty
Stressing Variables
Strength Variables0.2
0.4
0.6
0.8
Prob
abilit
y D
ensi
ty
1 32
P( Failure )
Analysis
?

61
•Probabilistic Fatigue © 2003-2005 Darrell Socie, University of Illinois at Urbana-Champaign, All Rights Reserved 120 of 352
Probabilistic Analysis Methods
Monte CarloSimpleHypercube samplingImportance sampling
AnalyticalFirst order reliability method FORMSecond order reliability method SORM
•Probabilistic Fatigue © 2003-2005 Darrell Socie, University of Illinois at Urbana-Champaign, All Rights Reserved 121 of 352
Limit States
Limit StatesEquilibriumStrengthDeformationWearFunctional

62
•Probabilistic Fatigue © 2003-2005 Darrell Socie, University of Illinois at Urbana-Champaign, All Rights Reserved 122 of 352
Limit State Problems
Z(X) = Z( Q, L, b, h )
Response function
Limit State function
g = Z(X) - Zo = 0
Same as the failure function
•Probabilistic Fatigue © 2003-2005 Darrell Socie, University of Illinois at Urbana-Champaign, All Rights Reserved 123 of 352
Limit States
Stress
Strength
g < 0
g > 0
failures
g = Strength - Stress

63
•Probabilistic Fatigue © 2003-2005 Darrell Socie, University of Illinois at Urbana-Champaign, All Rights Reserved 124 of 352
Monte Carlo
Stress
Strength
g < 0
g > 0
failures
Monte Carlo is simple but what if each of these calculationsrequired a separate FEM model?
•Probabilistic Fatigue © 2003-2005 Darrell Socie, University of Illinois at Urbana-Champaign, All Rights Reserved 125 of 352
Low Probabilities of Failure
Stress
Strength
failures
rare event
Need about 105 simulations for P(Failure) = 10-4

64
•Probabilistic Fatigue © 2003-2005 Darrell Socie, University of Illinois at Urbana-Champaign, All Rights Reserved 126 of 352
Transform Variables u1
u2
x
x1
xuσ
µ−=
µu1 = 0σu1 = 1
•Probabilistic Fatigue © 2003-2005 Darrell Socie, University of Illinois at Urbana-Champaign, All Rights Reserved 127 of 352
Standard Monte Carlo
-4 -3 -2 -1 0 1 2 3 4-4
-3
-2
-1
0
1
2
3
4u1
u2
1000 trials
g = 3 – ( u1 + u2 )
018.0NN)f(P f ==
u1 and u2 normally distributed

65
•Probabilistic Fatigue © 2003-2005 Darrell Socie, University of Illinois at Urbana-Champaign, All Rights Reserved 128 of 352
Multiple Simulations1 252 153 194 215 166 227 168 129 1510 1111 1912 1513 2014 1715 916 2317 1518 2019 1420 2121 1622 1823 2224 1325 20
1000 trials
25 simulations
µ = 0.017
σ = 0.0040
25,000 calculations
•Probabilistic Fatigue © 2003-2005 Darrell Socie, University of Illinois at Urbana-Champaign, All Rights Reserved 129 of 352
Stratified Sampling Methods
-4 -3 -2 -1 0 1 2 3 4
Divide into regions of constant probability and then sample by region

66
•Probabilistic Fatigue © 2003-2005 Darrell Socie, University of Illinois at Urbana-Champaign, All Rights Reserved 130 of 352
Stratified Sample
-4 -3 -2 -1 0 1 2 3 4-4
-3
-2
-1
0
1
2
3
4u1
u2
Each box should have one sample drawn at randomfrom the underlying pdf
100 trials
25 simulations
µ = 0.02
σ = 0.0093
2,500 calculations
•Probabilistic Fatigue © 2003-2005 Darrell Socie, University of Illinois at Urbana-Champaign, All Rights Reserved 131 of 352
Latin Hypercube Sample
-4 -3 -2 -1 0 1 2 3 4-4
-3
-2
-1
0
1
2
3
4u1
u2
10 trials
25 simulations
µ = 0.017
σ = 0.038
250 calculations

67
•Probabilistic Fatigue © 2003-2005 Darrell Socie, University of Illinois at Urbana-Champaign, All Rights Reserved 132 of 352
Importance Sampling (continued)
-4 -3 -2 -1 0 1 2 3 4-4
-3
-2
-1
0
1
2
3
4u1
u2
β = 2
The probability of a sample outside the circle is PS = 0.14( 2 standard deviations )
0183.0PNN)f(P S
S
f ==
138 simulations
•Probabilistic Fatigue © 2003-2005 Darrell Socie, University of Illinois at Urbana-Champaign, All Rights Reserved 133 of 352
Analytical Methods Strategy
Develop a response functionTransform the set of N variables to a set of uncorrelated u variables with µ=0 and σ=1Locate the most likely failure pointApproximate the integral of the joint probability distribution over the failure region

68
•Probabilistic Fatigue © 2003-2005 Darrell Socie, University of Illinois at Urbana-Champaign, All Rights Reserved 134 of 352
Analytical Methods Outline
Response SurfaceTransform VariablesLimit State ConceptMost Probable PointProbability Integration
FORMSORM
•Probabilistic Fatigue © 2003-2005 Darrell Socie, University of Illinois at Urbana-Champaign, All Rights Reserved 135 of 352
Response Surface Methodology
Response surface methodology is a well established collection of mathematical and statistical techniques for applications where the response of interest is influenced by several variables.
ε+⋅⋅⋅⋅= )x,x,x,x(f)X(Z n321

69
•Probabilistic Fatigue © 2003-2005 Darrell Socie, University of Illinois at Urbana-Champaign, All Rights Reserved 136 of 352
Response Surface
X1X2
Z
Fit a surface through the points
Solution points
•Probabilistic Fatigue © 2003-2005 Darrell Socie, University of Illinois at Urbana-Champaign, All Rights Reserved 137 of 352
Mathematical Representation
⋅⋅+++
⋅⋅⋅⋅⋅⋅+++
⋅⋅⋅⋅⋅⋅++++=
323312211
233
222
211
332211o
xxCxxCxxCxBxBxB
xAxAxAA)X(Z Linear
Incomplete QuadradicComplete Quadradic
SolutionsLinear N + 1
Complete Quadradic N(N + 1)/2Incomplete Quadradic 2N + 1

70
•Probabilistic Fatigue © 2003-2005 Darrell Socie, University of Illinois at Urbana-Champaign, All Rights Reserved 138 of 352
Evaluation of Response Surface
Factorial Design
Suppose stress is affected by speed and temperature
high low
high
low
X
XX
X
temperature
spee
d 4 deterministic solutions needed
2n solutions
•Probabilistic Fatigue © 2003-2005 Darrell Socie, University of Illinois at Urbana-Champaign, All Rights Reserved 139 of 352
Evaluation of Response SurfaceFactorial Design
high low
high
low
X
XX
X
temperature
spee
d 9 deterministic solutions needed
3n solutionsX X X
X
X

71
•Probabilistic Fatigue © 2003-2005 Darrell Socie, University of Illinois at Urbana-Champaign, All Rights Reserved 140 of 352
Graphical Representation
X2X1
Z
•Probabilistic Fatigue © 2003-2005 Darrell Socie, University of Illinois at Urbana-Champaign, All Rights Reserved 141 of 352
Joint Probability Density
x
y
fxy(x,y)Stress
Strength

72
•Probabilistic Fatigue © 2003-2005 Darrell Socie, University of Illinois at Urbana-Champaign, All Rights Reserved 142 of 352
2D - Joint Probability DensityContours of equal probability
µx
µy
Stress
Strength
•Probabilistic Fatigue © 2003-2005 Darrell Socie, University of Illinois at Urbana-Champaign, All Rights Reserved 143 of 352
Transform Variables
x
x1
xuσ
µ−=
µu = 0σu = 1
Any distribution can be mapped into a normal distribution
u1
u2
d ( )2d5.0expP −∝
The mathematics and behavior of normal distributions are well understood

73
•Probabilistic Fatigue © 2003-2005 Darrell Socie, University of Illinois at Urbana-Champaign, All Rights Reserved 144 of 352
X to u mapping
f(X)
F(X)F(X)
f(X)
uniform normal
•Probabilistic Fatigue © 2003-2005 Darrell Socie, University of Illinois at Urbana-Champaign, All Rights Reserved 145 of 352
Limit States
Limit states define probability problems
g = Strength(x1) – Stress(x2)
For example:
Prob( g<= 0 ) = Probability of failure = Pf
Analysis focuses on g = 0

74
•Probabilistic Fatigue © 2003-2005 Darrell Socie, University of Illinois at Urbana-Champaign, All Rights Reserved 146 of 352
Failure Probability
g = 0
u1
u2
∫<
=0g
2121uu dudu)u,u(f)Failure(P21
•Probabilistic Fatigue © 2003-2005 Darrell Socie, University of Illinois at Urbana-Champaign, All Rights Reserved 147 of 352
Thought Experiment
Suppose stress and strength had the same distribution
What is the probability of failure?
-3 -2 -1 0 1 2 3x
0.1
0.2
0.3
0.4
Prob
abilit
y D
ensi
ty

75
•Probabilistic Fatigue © 2003-2005 Darrell Socie, University of Illinois at Urbana-Champaign, All Rights Reserved 148 of 352
g function
u1
u2
g = Strength(x1) – Stress(x2)
Pf = 50%
•Probabilistic Fatigue © 2003-2005 Darrell Socie, University of Illinois at Urbana-Champaign, All Rights Reserved 149 of 352
Probable Combinations of u1 and u2
g = 0
u1
u2
Most likely failure point
g functions are not straight lines in N dimensional space

76
•Probabilistic Fatigue © 2003-2005 Darrell Socie, University of Illinois at Urbana-Champaign, All Rights Reserved 150 of 352
Most Probable Point
u1
g = 0u2
β
Probability is related to the minimum distance point β
•Probabilistic Fatigue © 2003-2005 Darrell Socie, University of Illinois at Urbana-Champaign, All Rights Reserved 151 of 352
Safety Index β
Sometimes called reliability index
Unlike safety factors, failure probability is directly related to the safety index
Pf = Φ(-β)
β is a number measured in standard deviations

77
•Probabilistic Fatigue © 2003-2005 Darrell Socie, University of Illinois at Urbana-Champaign, All Rights Reserved 152 of 352
Determining the MPP
Requires an efficient numerical search to find the tangent point of a hypersphere (β-sphere) and the limit state function in u space
•Probabilistic Fatigue © 2003-2005 Darrell Socie, University of Illinois at Urbana-Champaign, All Rights Reserved 153 of 352
Probability Integration
FORMSORM

78
•Probabilistic Fatigue © 2003-2005 Darrell Socie, University of Illinois at Urbana-Champaign, All Rights Reserved 154 of 352
First Order Reliability Model
g = 0
u2
β
exact
Linear approximation
u1
( ) ( )∑=
−+=n
1iiiio *uuaaug
FORM
MPP
•Probabilistic Fatigue © 2003-2005 Darrell Socie, University of Illinois at Urbana-Champaign, All Rights Reserved 155 of 352
FORM
u1
Pf ≈ Φ(-β)u2
β
MPP
u2*
u1*
The joint probability density is rotationally symmetric so it is possible to rotate the coordinate system

79
•Probabilistic Fatigue © 2003-2005 Darrell Socie, University of Illinois at Urbana-Champaign, All Rights Reserved 156 of 352
Second Order Reliability Model
g = 0u2
βexact
Quadradic approximation
u1
( ) ( ) ( ) ( )( )∑ ∑ ∑∑= = = =
−−+−+−+=n
1i
n
1i
n
1ijjii
n
1jij
2iiiiiio *uu*uuc*uub*uuaaug
SORM
•Probabilistic Fatigue © 2003-2005 Darrell Socie, University of Illinois at Urbana-Champaign, All Rights Reserved 157 of 352
SORM
u2
β
MPP
u2*
u1*
( ) ( )∏=
βκ−β−Φ=n
1iif 1P
κi surface curvature

80
•Probabilistic Fatigue © 2003-2005 Darrell Socie, University of Illinois at Urbana-Champaign, All Rights Reserved 158 of 352
Sensitivity Factors
99.9 %
99 %
90 %
50 %
10 %
1 %
0.1 %
Cum
ulat
ive
Pro
babi
lity
Designpoint Change in response
with a change in mean
Change in probabilitywith a change in mean
•Probabilistic Fatigue © 2003-2005 Darrell Socie, University of Illinois at Urbana-Champaign, All Rights Reserved 159 of 352
Sensitivity Factors
99.9 %
99 %
90 %
50 %
10 %
1 %
0.1 %
Cum
ulat
ive
Pro
babi
lity
Designpoint Change in response
with a change in variance
Change in probabilitywith a change in variance

81
•Probabilistic Fatigue © 2003-2005 Darrell Socie, University of Illinois at Urbana-Champaign, All Rights Reserved 160 of 352
Deterministic Sensitivity Factors
iX)X(Z
∂∂
Change in response mean with respect to a change in the input variable mean
Frequently normalized by the means to compare relative importance of variables
X/XZ/)X(Z
i∂∂
•Probabilistic Fatigue © 2003-2005 Darrell Socie, University of Illinois at Urbana-Champaign, All Rights Reserved 161 of 352
Probabilistic Sensitivity Coefficient
iii /
P/PSσσ∂
∂=σ
iii /
P/PSµµ∂
∂=µ
Standard deviation sensitivity
Mean deviation sensitivity

82
•Probabilistic Fatigue © 2003-2005 Darrell Socie, University of Illinois at Urbana-Champaign, All Rights Reserved 162 of 352
Probabilistic Sensitivity Factors
1X
)X(Z 2ii
ii =ασ
∂
∂∝α ∑
αi - probabilistic sensitivityZ(X) - responseXi - input variableσi - standard deviation of Xi
•Probabilistic Fatigue © 2003-2005 Darrell Socie, University of Illinois at Urbana-Champaign, All Rights Reserved 163 of 352
Software
General PurposeDurability

83
Variability
Professor Darrell F. SocieDepartment of Mechanical and
Industrial Engineering
© 2003-2005 Darrell Socie, All Rights Reserved
Probabilistic Aspects of Fatigue
•Probabilistic Fatigue © 2003-2005 Darrell Socie, University of Illinois at Urbana-Champaign, All Rights Reserved 165 of 352
Probabilistic Aspects of Fatigue
IntroductionBasic Probability and StatisticsStatistical TechniquesAnalysis Methods Characterizing VariabilityCase StudiesFatigueCalculator.comGlyphWorks
84
•Probabilistic Fatigue © 2003-2005 Darrell Socie, University of Illinois at Urbana-Champaign, All Rights Reserved 166 of 352
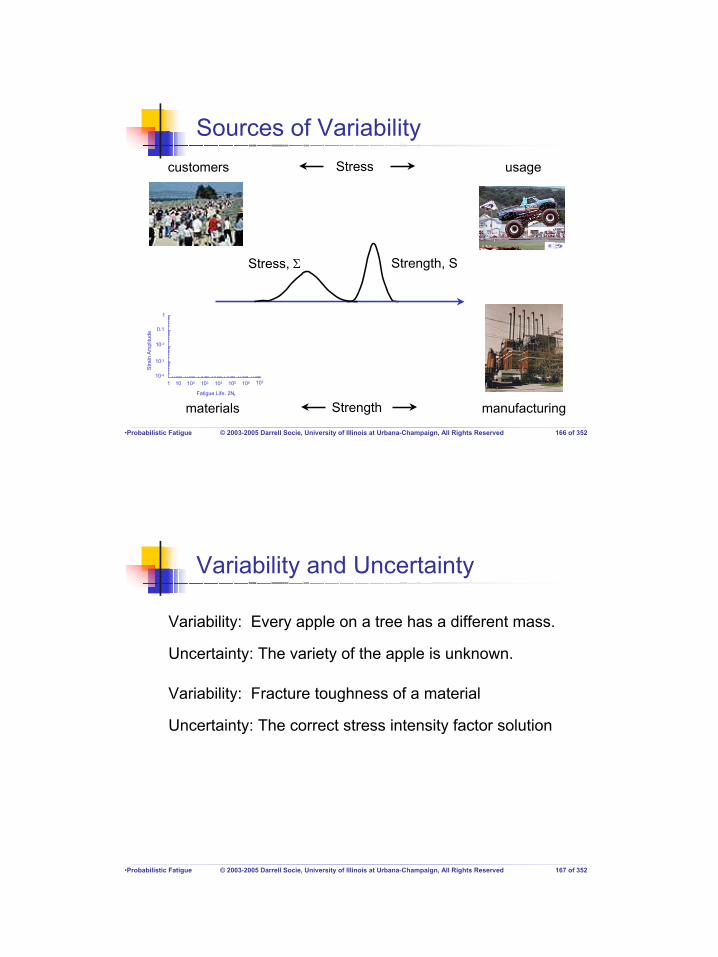
Sources of Variabilitycustomers
materials manufacturing
usage
107
Fatigue Life, 2Nf
1
10 102 103 104 105 106
0.1
10-2
1
10-3
10-4
Stra
in A
mpl
itude
Strength
Stress
Stress, Σ Strength, S
•Probabilistic Fatigue © 2003-2005 Darrell Socie, University of Illinois at Urbana-Champaign, All Rights Reserved 167 of 352
Variability and Uncertainty
Variability: Every apple on a tree has a different mass.
Uncertainty: The variety of the apple is unknown.
Variability: Fracture toughness of a material
Uncertainty: The correct stress intensity factor solution

85
•Probabilistic Fatigue © 2003-2005 Darrell Socie, University of Illinois at Urbana-Champaign, All Rights Reserved 168 of 352
Sources of Variability
Stress VariablesLoadingCustomer UsageEnvironment
Strength VariablesMaterialProcessingManufacturing ToleranceEnvironment
•Probabilistic Fatigue © 2003-2005 Darrell Socie, University of Illinois at Urbana-Champaign, All Rights Reserved 169 of 352
Sources of Uncertainty
Statistical UncertaintyIncomplete data (small sample sizes)
Modeling ErrorAnalysis assumptions
Human ErrorCalculation errorsJudgment errors

86
•Probabilistic Fatigue © 2003-2005 Darrell Socie, University of Illinois at Urbana-Champaign, All Rights Reserved 170 of 352
Modeling Variability
Products: Z = X1 • X2 • X3 • X4 • ….. Xn
Z → LogNormal as n increases
Central Limit Theorem:
COVX
0 0.5 1.0 1.5 2.0
0.5
1.0
1.5
σ lnX σlnX ~ COVX
COVX is a good measure of variability
•Probabilistic Fatigue © 2003-2005 Darrell Socie, University of Illinois at Urbana-Champaign, All Rights Reserved 171 of 352
Standard Deviation, lnx
COVX
1 2 3
68.3% 95.4% 99.7%
0.05
0.1
0.25
0.5
1
1.05
1.10
1.28
1.60
2.30
1.11
1.23
1.66
2.64
5.53
1.16
1.33
2.04
3.92
11.1
99.7% of the data is within a factor of ± 1.33 of the mean for a COV = 0.1
COV and LogNormal Distributions

87
•Probabilistic Fatigue © 2003-2005 Darrell Socie, University of Illinois at Urbana-Champaign, All Rights Reserved 172 of 352
Variability in Service Loading
Quantifying Loading VariabilityMaximum LoadLoad RangeEquivalent Stress
•Probabilistic Fatigue © 2003-2005 Darrell Socie, University of Illinois at Urbana-Champaign, All Rights Reserved 173 of 352
Maximum Force
99.9 %
99 %
90 %
50 %
10 %
1 %
0.1 %
100 1000
Median 431COV 0.34
200 500
Maximum force from 42 automobile drivers99.9 %
99 %
90 %
50 %
10 %
1 %
0.1 %
99.9 %
99 %
90 %
50 %
10 %
1 %
0.1 %
100 1000200 500
Cum
ulat
ive
Pro
babi
lity
Force

88
•Probabilistic Fatigue © 2003-2005 Darrell Socie, University of Illinois at Urbana-Champaign, All Rights Reserved 174 of 352
Maximum Load Correlation
0 200 400 600 800 1000
108
107
106
105
104
103
Maximum Load
Fatig
ue L
ives
•Probabilistic Fatigue © 2003-2005 Darrell Socie, University of Illinois at Urbana-Champaign, All Rights Reserved 175 of 352
Loading Variability
1 10 102 103 104 105
Cumulative Cycles
0
16
32
48
Load
Ran
ge
54 Tractors / Drivers

89
•Probabilistic Fatigue © 2003-2005 Darrell Socie, University of Illinois at Urbana-Champaign, All Rights Reserved 176 of 352
Variability in Loading
1 10
54 Tractors/Drivers
COV 0.53
99.9 %
99 %
90 %
50 %
10 %
1 %
0.1 %
n neq SS ∑∆=∆
Equivalent Load
Cum
ulat
ive
Pro
babi
lity
•Probabilistic Fatigue © 2003-2005 Darrell Socie, University of Illinois at Urbana-Champaign, All Rights Reserved 177 of 352
Mechanisms and Slopes
100
103
104
Stre
ss A
mpl
itude
, MPa
100
Cycles101 102 103 104 105 106 107
110
10-1210-1110-1010-910-810-710-6
Crack Growth Rate, m/cycle
1
10
100
mM
Pa,
K∆
1
3
Crack Nucleation
Crack Growth10
100
103 104 105 106 107 108
Total Fatigue Life, Cycles
1
51
Equ
ival
ent L
oad,
kN
Structures
A combination of nucleation and growth
n = 3
n = 5
n = 10

90
•Probabilistic Fatigue © 2003-2005 Darrell Socie, University of Illinois at Urbana-Champaign, All Rights Reserved 178 of 352
Effect of Slope on Variability99.9 %
99 %
90 %
50 %
10 %
1 %
0.1 %
Cum
ulat
ive
Pro
babi
lity
n = 10 5 3
Equivalent Load0.1 1 100.1 1 10
n COV3 0.535 0.4310 0.38
•Probabilistic Fatigue © 2003-2005 Darrell Socie, University of Illinois at Urbana-Champaign, All Rights Reserved 179 of 352
Loading History Variability
Test TrackCustomer Service
91
•Probabilistic Fatigue © 2003-2005 Darrell Socie, University of Illinois at Urbana-Champaign, All Rights Reserved 180 of 352
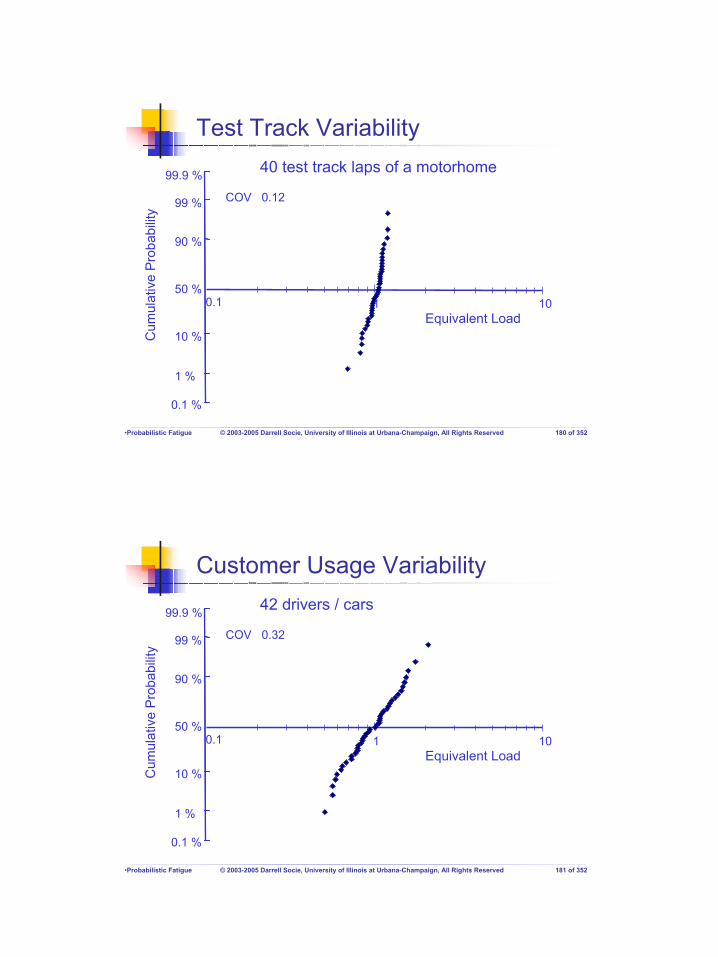
Test Track Variability
0.1 1 10
COV 0.12
40 test track laps of a motorhome99.9 %
99 %
90 %
50 %
10 %
1 %
0.1 %
Cum
ulat
ive
Pro
babi
lity
Equivalent Load
•Probabilistic Fatigue © 2003-2005 Darrell Socie, University of Illinois at Urbana-Champaign, All Rights Reserved 181 of 352
Customer Usage Variability
0.1 1 10
COV 0.32
42 drivers / cars99.9 %
99 %
90 %
50 %
10 %
1 %
0.1 %
Cum
ulat
ive
Pro
babi
lity
Equivalent Load
92
•Probabilistic Fatigue © 2003-2005 Darrell Socie, University of Illinois at Urbana-Champaign, All Rights Reserved 182 of 352
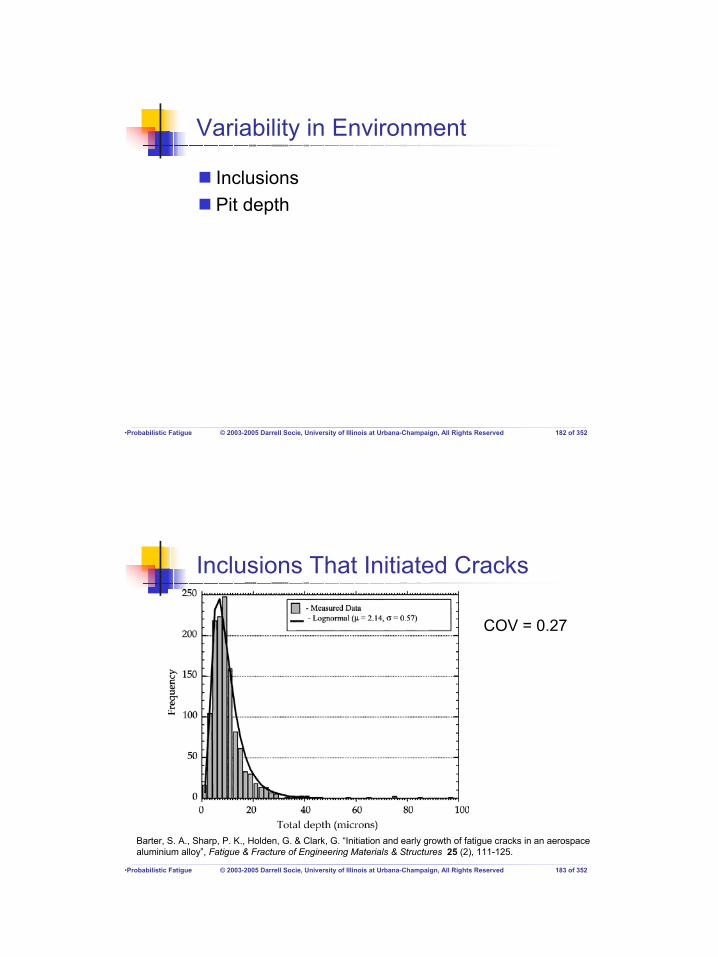
Variability in Environment
InclusionsPit depth
•Probabilistic Fatigue © 2003-2005 Darrell Socie, University of Illinois at Urbana-Champaign, All Rights Reserved 183 of 352
Inclusions That Initiated Cracks
Barter, S. A., Sharp, P. K., Holden, G. & Clark, G. “Initiation and early growth of fatigue cracks in an aerospacealuminium alloy”, Fatigue & Fracture of Engineering Materials & Structures 25 (2), 111-125.
COV = 0.27

93
•Probabilistic Fatigue © 2003-2005 Darrell Socie, University of Illinois at Urbana-Champaign, All Rights Reserved 184 of 352
Pits That Initiated Cracks
7010-T7651
Pre-corroded specimens
300 specimens
246 failed from pits
Crawford et.al.”The EIFS Distribution for Anodized and Pre-corroded 7010-T7651 under Constant Amplitude Loading” Fatigue and Fracture of Engineering Materials and Structures, Vol. 28, No. 9 2005, 795-808
•Probabilistic Fatigue © 2003-2005 Darrell Socie, University of Illinois at Urbana-Champaign, All Rights Reserved 185 of 352
Pit Size Distribution
40
30
20
10
100 200 400 500300
Freq
uenc
y
area µm
Mean = 230 COV = 0.32
94
•Probabilistic Fatigue © 2003-2005 Darrell Socie, University of Illinois at Urbana-Champaign, All Rights Reserved 186 of 352
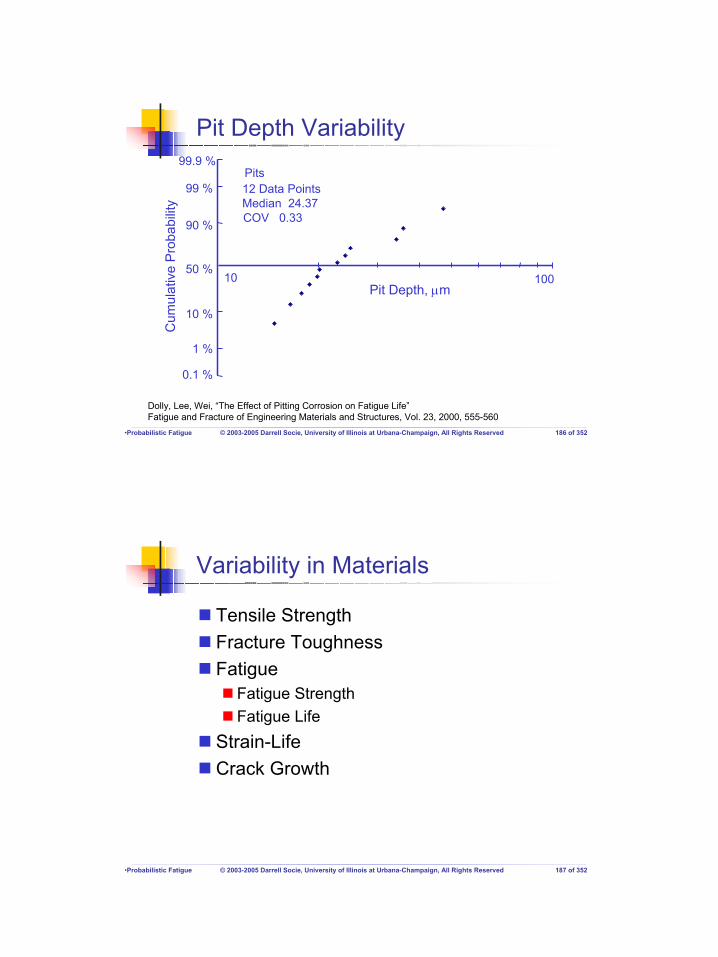
Pit Depth Variability
Pits12 Data PointsMedian 24.37
100
COV 0.33
99.9 %
99 %
90 %
50 %
10 %
1 %
0.1 %
10Pit Depth, µm
Dolly, Lee, Wei, “The Effect of Pitting Corrosion on Fatigue Life”Fatigue and Fracture of Engineering Materials and Structures, Vol. 23, 2000, 555-560
Cum
ulat
ive
Pro
babi
lity
•Probabilistic Fatigue © 2003-2005 Darrell Socie, University of Illinois at Urbana-Champaign, All Rights Reserved 187 of 352
Variability in Materials
Tensile StrengthFracture ToughnessFatigue
Fatigue StrengthFatigue Life
Strain-LifeCrack Growth

95
•Probabilistic Fatigue © 2003-2005 Darrell Socie, University of Illinois at Urbana-Champaign, All Rights Reserved 188 of 352
Tensile Strength - 1035 Steel
25
50
75
100
500 550 600 650 700
Num
ber o
f hea
ts
Tensile Strength, MPa
Metals Handbook, 8th Edition, Vol. 1, p64
Mean = 602COV = 0.045
•Probabilistic Fatigue © 2003-2005 Darrell Socie, University of Illinois at Urbana-Champaign, All Rights Reserved 189 of 352
Fracture Toughness
100
99.9 %
99 %
90 %
50 %
10 %
1 %
0.1 %
Median 76.7COV 0.06
60 70 9080
26 Data Points
Cum
ulat
ive
Pro
babi
lity
KIc, Ksi√in
Kies, J.A., Smith, H.L., Romine, H.E. and Bernstein, H, “Fracture Testing of Weldments”, ASTM STP 381, 1965, 328-356
Mar-M 250 Steel

96
•Probabilistic Fatigue © 2003-2005 Darrell Socie, University of Illinois at Urbana-Champaign, All Rights Reserved 190 of 352
Fatigue Variability
102 103 104 105 106 107
Fatigue Life101
1000
100
10
1
Stre
ss A
mpl
itude Fatigue life
Fatig
ue s
treng
th
•Probabilistic Fatigue © 2003-2005 Darrell Socie, University of Illinois at Urbana-Champaign, All Rights Reserved 191 of 352
Fatigue Life Variability
50 100 150 200 250
10
20
30
40
10
20
Num
ber o
f Tes
ts
Life x10 350 100 150 200 250
10
20
30
40
10
20
Num
ber o
f Tes
ts
Life x10 3
Production torsion bars5160H steelOne lot, 71 parts
25 lots, 300 parts
Metals Handbook, 8th Edition, Vol. 1, p219
µx = 123,000 cyclesCOV = 0.25
µx = 134,000 cyclesCOV = 0.27

97
•Probabilistic Fatigue © 2003-2005 Darrell Socie, University of Illinois at Urbana-Champaign, All Rights Reserved 192 of 352
Statistical Variability of Fatigue Life
50
10
2
90
98
104 105 106 107 108
Cycles to Failure
Per
cent
Sur
viva
l
∆s=210∆s=245∆s=315∆s=280∆s=440
Sinclair and Dolan, “Effect of Stress Amplitude on the Variability in Fatigue Life of 7075-T6 Aluminum Alloy”Transactions ASME, 1953
7075-T6 Specimens
•Probabilistic Fatigue © 2003-2005 Darrell Socie, University of Illinois at Urbana-Champaign, All Rights Reserved 193 of 352
COV vs Fatigue Life
440 14,000 0.12315 25,000 0.38280 220,000 0.70245 1,200,000 0.67210 12,000,000 1.39
∆S COVX
98
•Probabilistic Fatigue © 2003-2005 Darrell Socie, University of Illinois at Urbana-Champaign, All Rights Reserved 194 of 352
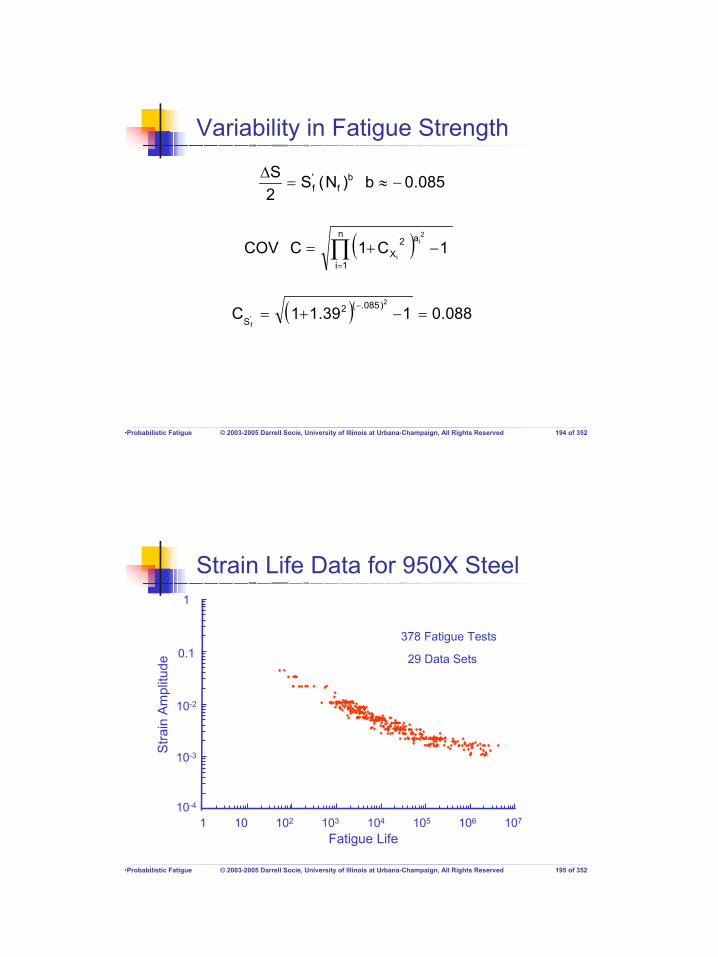
Variability in Fatigue Strength
( )∏=
−+=n
1i
a2X 1C1CCOV
2i
i
085.0b)N(S2S b
f'f −≈=
∆
( ) 088.0139.11C2
'f
)085.(2S =−+=
−
•Probabilistic Fatigue © 2003-2005 Darrell Socie, University of Illinois at Urbana-Champaign, All Rights Reserved 195 of 352
Strain Life Data for 950X Steel
102 103 104 105 106 107
Fatigue Life101
1
0.1
10-2
10-3
10-4
Stra
in A
mpl
itude
378 Fatigue Tests
29 Data Sets

99
•Probabilistic Fatigue © 2003-2005 Darrell Socie, University of Illinois at Urbana-Champaign, All Rights Reserved 196 of 352
29 Individual Data Sets'fσ
Median 820
300 1000
COV 0.25
2000
99.9 %
99 %
90 %
50 %
10 %
1 %
0.1 %
Cum
ulat
ive
Pro
babi
lity
b
-0.12 -0.08 -0.04
Mean -0.09COV 0.25
99.9 %
99 %
90 %
50 %
10 %
1 %
0.1 %C
umul
ativ
e P
roba
bilit
y
•Probabilistic Fatigue © 2003-2005 Darrell Socie, University of Illinois at Urbana-Champaign, All Rights Reserved 197 of 352
29 Individual Data Sets (continued)
0.1 1 10
Median 0.57COV 1.15
99.9 %
99 %
90 %
50 %
10 %
1 %
0.1 %
Cum
ulat
ive
Pro
babi
lity
'fε
-0.8 -0.6 -0.4 -0.2
c
Mean -0.62COV 0.23
99.9 %
99 %
90 %
50 %
10 %
1 %
0.1 %
Cum
ulat
ive
Pro
babi
lity

100
•Probabilistic Fatigue © 2003-2005 Darrell Socie, University of Illinois at Urbana-Champaign, All Rights Reserved 198 of 352
Input Data Simulation
( )( ) ( ) ( )( ) ( )bb
ff
bbff ,,Ncf
'f
,,Nbf
'f N2,,LN2
E,,L
2σµ
εεσµσσ σµε+
σµσ=
ε∆
•Probabilistic Fatigue © 2003-2005 Darrell Socie, University of Illinois at Urbana-Champaign, All Rights Reserved 199 of 352
Simulation Results
0.0001
0.001
0.01
0.1
1
10
100
1 10 100 103 104 105 106 107
Stra
in A
mpl
itude
Fatigue Life

101
•Probabilistic Fatigue © 2003-2005 Darrell Socie, University of Illinois at Urbana-Champaign, All Rights Reserved 200 of 352
Correlation
0
0.25
0.5
0.75
1.0
0.01 0.1 1 10'fε
c
0
0.05
0.1
0.15
0.2
102 103 104
'fσ
b
ρ = -0.828 ρ = -0.976
•Probabilistic Fatigue © 2003-2005 Darrell Socie, University of Illinois at Urbana-Champaign, All Rights Reserved 201 of 352
Generating Correlated Data
z1 = ( rand() )Φz2 = ( rand() )Φ
2213 1zzz ρ−+ρ=
)zexp( 1lnln'f '
f'f σσ σ+µ=σ
3bb zb σ+µ=
z1= N(0,1)

102
•Probabilistic Fatigue © 2003-2005 Darrell Socie, University of Illinois at Urbana-Champaign, All Rights Reserved 202 of 352
Correlated Properties
0.0001
0.001
0.01
0.1
1
10
100
1 10 100 103 104 105 106 107
Fatigue Life
Stra
in A
mpl
itude
•Probabilistic Fatigue © 2003-2005 Darrell Socie, University of Illinois at Urbana-Champaign, All Rights Reserved 203 of 352
Curve Fitting
102 103 104 105 106 107
Fatigue Life101
1
0.1
10-2
10-3
10-4
Stra
in A
mpl
itude
cf
'f
bf
'f )N2()N2(
E2ε+
σ=
ε∆
Assume a constant slope to get a distribution of properties
'fσ

103
•Probabilistic Fatigue © 2003-2005 Darrell Socie, University of Illinois at Urbana-Champaign, All Rights Reserved 204 of 352
Property Distribution
0.1 1
99.9 %
99 %
90 %
50 %
10 %
1 %
0.1 %
Cum
ulat
ive
Pro
babi
lity
365 Data Points
Median 0.26
COV 0.42
'fε
378 Data Points
Median 802 MPa
COV 0.12
'fσ
100 1000
99.9 %
99 %
90 %
50 %
10 %
1 %
0.1 %
Cum
ulat
ive
Pro
babi
lity
b = -0.086 c = -0.51
•Probabilistic Fatigue © 2003-2005 Darrell Socie, University of Illinois at Urbana-Champaign, All Rights Reserved 205 of 352
Correlation
0
500
1000
1500
0 0.1 0.2 0.3 0.4 0.5 0.6 0.7'fε
'fσ

104
•Probabilistic Fatigue © 2003-2005 Darrell Socie, University of Illinois at Urbana-Champaign, All Rights Reserved 206 of 352
Simulation
0.001
0.01
0.1
1
10
0.00011 10 100 103 104 105 106 107
Stra
in A
mpl
itude
Fatigue Life
•Probabilistic Fatigue © 2003-2005 Darrell Socie, University of Illinois at Urbana-Champaign, All Rights Reserved 207 of 352
Strength Coefficient
5000
99.9 %
99 %
90 %
50 %
10 %
1 %
0.1 %
Cum
ulat
ive
Pro
babi
lity
500
0
500
1000
1500
0 500 1000 1500 2000 2500
365 Data Points
Median 1002 MPa
COV 0.14
'fσ
'K
'K
ρ = 0.863

105
•Probabilistic Fatigue © 2003-2005 Darrell Socie, University of Illinois at Urbana-Champaign, All Rights Reserved 208 of 352
Crack Growth Data
0
10
20
30
40
50C
rack
Len
gth,
mm
0 50 100 150 200 250 300 350Cycles x103
Virkler, Hillberry and Goel, “The Statistical Nature of Fatigue Crack Propagation”, Journal of Engineering Materials and Technology, Vol. 101, 1979, 148-153
•Probabilistic Fatigue © 2003-2005 Darrell Socie, University of Illinois at Urbana-Champaign, All Rights Reserved 209 of 352
Crack Growth Rate Data
300,000
68 Data PointsMedian 257,000COV 0.07
99.9 %
99 %
90 %
50 %
10 %
1 %
0.1 %
Cum
ulat
ive
Pro
babi
lity
Fatigue Lives Crack Growth Rate
5 10 5010-5
10-4
10-3
10-2
Cra
ck g
row
th ra
te, m
m/c
ycle
Stress intensity, MPa√m

106
•Probabilistic Fatigue © 2003-2005 Darrell Socie, University of Illinois at Urbana-Champaign, All Rights Reserved 210 of 352
Crack Growth Properties
Median 5 x 10⁻⁸
COV 0.44
10-7
99.9 %
99 %
90 %
50 %
10 %
1 %
0.1 %
Cum
ulat
ive
Pro
babi
lity
10-6
Median 3.13COV 0.06
99.9 %
99 %
90 %
50 %
10 %
1 %
0.1 %
Cum
ulat
ive
Pro
babi
lity
2 54
mKCdNda
∆=
C m
•Probabilistic Fatigue © 2003-2005 Darrell Socie, University of Illinois at Urbana-Champaign, All Rights Reserved 211 of 352
Beware of Correlated Variables
( )2/m1SC
aaN2m
m
2/m1i
2/m1f
f
−π∆
−=
−−
Nf and C are linearly related and should have the same variability, but
07.0COVfN =
44.0COVC =
because C and m are correlated.

107
•Probabilistic Fatigue © 2003-2005 Darrell Socie, University of Illinois at Urbana-Champaign, All Rights Reserved 212 of 352
Correlation
2.0
2.5
3.0
3.5
4.0
10-8 10-610-7
C
m
•Probabilistic Fatigue © 2003-2005 Darrell Socie, University of Illinois at Urbana-Champaign, All Rights Reserved 213 of 352
Correlated Variables
2YYX
2XZ 2 σ+σρσ+σ=σ
-1 -0.5 0 0.5 1
0.5
1
1.5
2
ρ
σZ
σX = σY = 1

108
•Probabilistic Fatigue © 2003-2005 Darrell Socie, University of Illinois at Urbana-Champaign, All Rights Reserved 214 of 352
Calculated Lives
105 106
Computed fromC and m pairs experimental
105 106
0.1 %0.1 %
99.9 %
99 %
90 %
50 %
10 %
1 %
Cum
ulat
ive
Pro
babi
lity
99.9 %
99 %
90 %
50 %
10 %
1 %
Cum
ulat
ive
Pro
babi
lity experimental
( )∫ ∆=
f
o
a
amf KC
daN
•Probabilistic Fatigue © 2003-2005 Darrell Socie, University of Illinois at Urbana-Champaign, All Rights Reserved 215 of 352
Manufacturing/Processing Variability
Bolt ForcesSurface FinishDrilled Holes
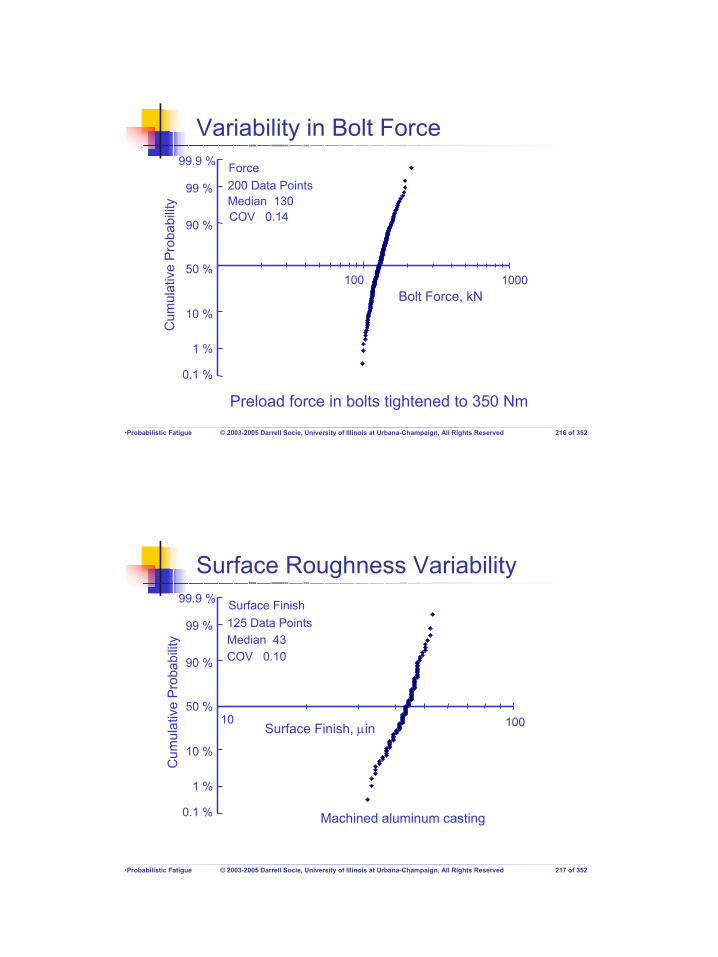
109
•Probabilistic Fatigue © 2003-2005 Darrell Socie, University of Illinois at Urbana-Champaign, All Rights Reserved 216 of 352
Variability in Bolt Force
100 1000
Force200 Data PointsMedian 130COV 0.14
99.9 %
99 %
90 %
50 %
10 %
1 %
0.1 %
Bolt Force, kN
Preload force in bolts tightened to 350 Nm
Cum
ulat
ive
Pro
babi
lity
•Probabilistic Fatigue © 2003-2005 Darrell Socie, University of Illinois at Urbana-Champaign, All Rights Reserved 217 of 352
Surface Roughness Variability
100
125 Data PointsMedian 43COV 0.10
Machined aluminum casting
10Surface Finish, µin
99.9 %
99 %
90 %
50 %
10 %
1 %
0.1 %
Cum
ulat
ive
Pro
babi
lity
Surface Finish

110
•Probabilistic Fatigue © 2003-2005 Darrell Socie, University of Illinois at Urbana-Champaign, All Rights Reserved 218 of 352
Drilled HolesFighter Spectrum154 Data PointsMedian 126,750COV 0.22 in life
99.9 %
99 %
90 %
50 %
10 %
1 %
0.1 %
Cum
ulat
ive
Pro
babi
lity
105 Cycles
From: J.P. Butler and D.A. Rees, "Development of Statistical Fatigue Failure Characteristics of 0.125-inch 2024-T3 Aluminum Under Simulated Flight-by-Flight Loading," ADA-002310 (NTIS no.), July 1974.
180 drilled holes in a single plate
COV 0.07 in strength
•Probabilistic Fatigue © 2003-2005 Darrell Socie, University of Illinois at Urbana-Champaign, All Rights Reserved 219 of 352
Analysis Uncertainty
Miners Linear Damage ruleStrain Life Analysis

111
•Probabilistic Fatigue © 2003-2005 Darrell Socie, University of Illinois at Urbana-Champaign, All Rights Reserved 220 of 352
50
90
99.9
99
10
1
0.01
0.01 0.1 1 10 100
Computed Life / Experimental
Cum
ulat
ive
Pro
babi
lity
of F
ailu
re 964 TestsCOV = 1.02
Miners Rule
From Erwin Haibach “Betriebsfestigkeit”, Springer-Verlag, 2002
A safety factor of 10 in life would result in a 10% chance of failure
•Probabilistic Fatigue © 2003-2005 Darrell Socie, University of Illinois at Urbana-Champaign, All Rights Reserved 221 of 352
SAE Specimen
Suspension
Transmission
Bracket
Fatigue Under Complex Loading: Analysis and Experiments, SAE AE6, 1977
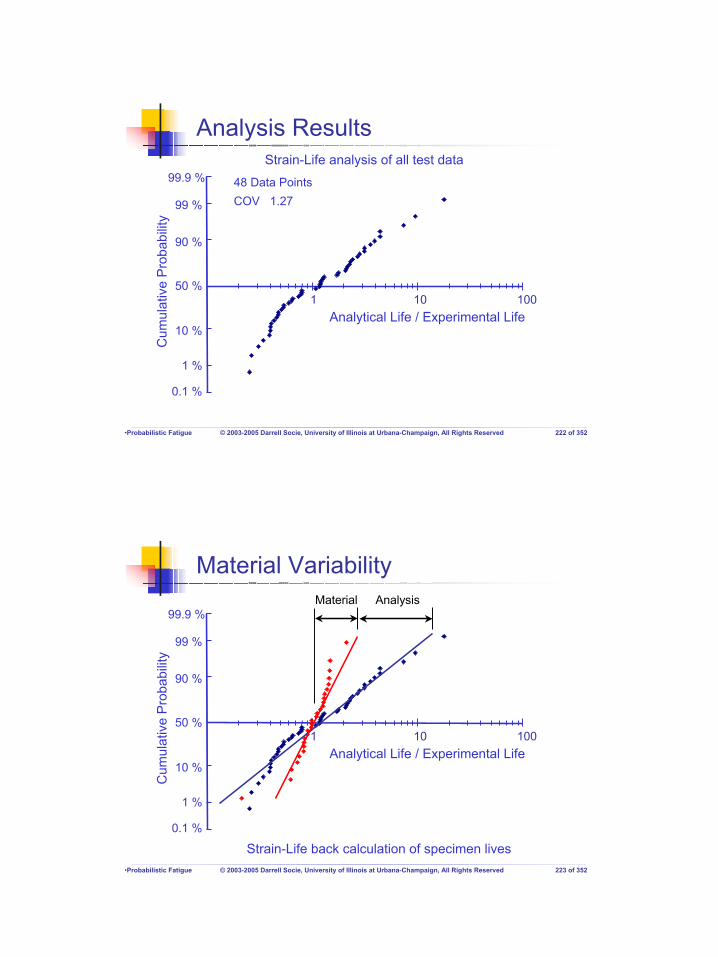
112
•Probabilistic Fatigue © 2003-2005 Darrell Socie, University of Illinois at Urbana-Champaign, All Rights Reserved 222 of 352
Analysis Results
1 10 100
48 Data PointsCOV 1.27
99.9 %
99 %
90 %
50 %
10 %
1 %
0.1 %
Cum
ulat
ive
Pro
babi
lity
Analytical Life / Experimental Life
Strain-Life analysis of all test data
•Probabilistic Fatigue © 2003-2005 Darrell Socie, University of Illinois at Urbana-Champaign, All Rights Reserved 223 of 352
Material Variability
1 10 100
99.9 %
99 %
90 %
50 %
10 %
1 %
0.1 %
Cum
ulat
ive
Pro
babi
lity
Analytical Life / Experimental Life
Material Analysis
Strain-Life back calculation of specimen lives

113
•Probabilistic Fatigue © 2003-2005 Darrell Socie, University of Illinois at Urbana-Champaign, All Rights Reserved 224 of 352
Modeling Uncertainty
( )∏=
−+=n
1i
a2X 1C1CCOV
2i
i
CU = 1.09
Analysis Uncertainty CU = ?
The variability in reproducing the original strain life data from the material constants is CM ~ 0.44
2M
2N2
U C1C1
C1 f
+
+=+
90% of the time the analysis is within a factor of 3 !99% of the time the analysis is within a factor of 10 !
•Probabilistic Fatigue © 2003-2005 Darrell Socie, University of Illinois at Urbana-Champaign, All Rights Reserved 225 of 352
Variability from Multiple Sources
( )∏=
−+=n
1i
a2X 1C1CCOV
2i
i
Suppose we have 4 variables each with a COV = 0.1
The combined variability is COV = 0.29
Suppose we reduce the variability of one of the variables to 0.05
The combined variability is now COV = 0.27
If all of the COV’s are the same, it doesn’t do any good to reduce only one of them, you must reduce all of them !

114
•Probabilistic Fatigue © 2003-2005 Darrell Socie, University of Illinois at Urbana-Champaign, All Rights Reserved 226 of 352
Variability from Multiple Sources
( )∏=
−+=n
1i
a2X 1C1CCOV
2i
i
Suppose we have 3 variables each with a COV = 0.1and one with COV = 0.4
The combined variability is COV = 0.65
Suppose we reduce the variability of these variables to 0.05
The combined variability is now COV = 0.60
If one of the COV’s is large, it doesn’t do any good to reduce the others, you must reduce the largest one !
•Probabilistic Fatigue © 2003-2005 Darrell Socie, University of Illinois at Urbana-Champaign, All Rights Reserved 227 of 352
Variability SummarySource COV
Service Loading 0.5
Materials 0.1Manufacturing 0.1Surface Finish 0.1
Environment 0.3
Strength
Stress
Fatigue LivesAnalysis Uncertainty
1.01.0
5
StressStrengthlifeFatigue
∝
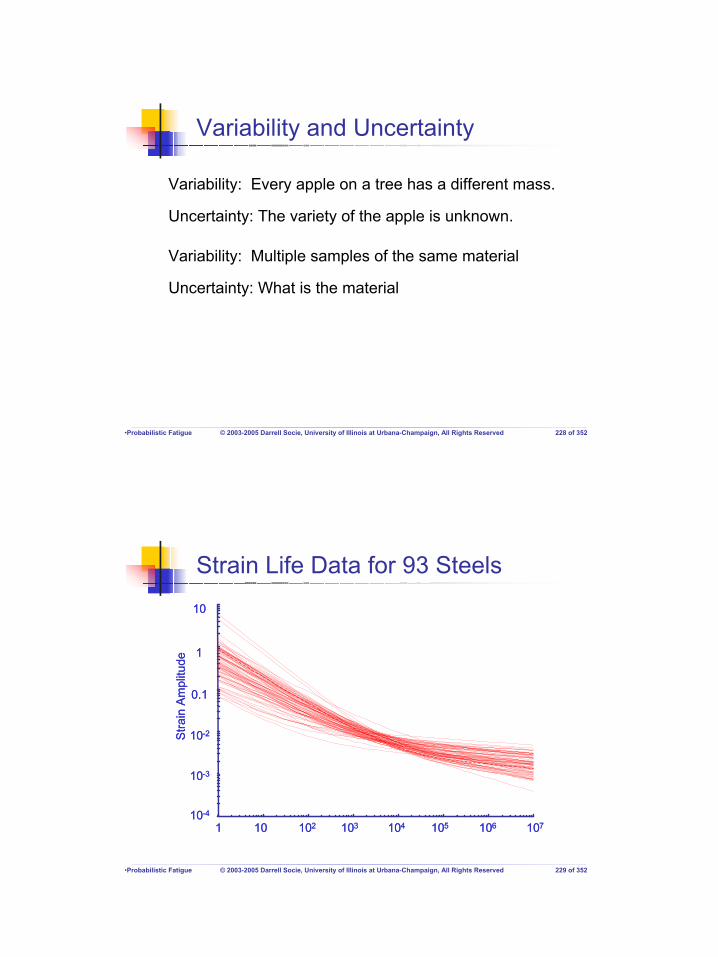
115
•Probabilistic Fatigue © 2003-2005 Darrell Socie, University of Illinois at Urbana-Champaign, All Rights Reserved 228 of 352
Variability and Uncertainty
Variability: Every apple on a tree has a different mass.
Uncertainty: The variety of the apple is unknown.
Variability: Multiple samples of the same material
Uncertainty: What is the material
•Probabilistic Fatigue © 2003-2005 Darrell Socie, University of Illinois at Urbana-Champaign, All Rights Reserved 229 of 352
Strain Life Data for 93 Steels
1 10 102 103 106 10710510410-4
10-2
10-3
0.1
10
1
Stra
in A
mpl
itude
1 10 102 103 106 10710510410-4
10-2
10-3
0.1
10
1
Stra
in A
mpl
itude

116
•Probabilistic Fatigue © 2003-2005 Darrell Socie, University of Illinois at Urbana-Champaign, All Rights Reserved 230 of 352
Uncertainty for all Steels
100 1000 10000
55 Data PointsCOV 0.48
99.9 %
99 %
90 %
50 %
10 %
1 %
0.1 %
Cum
ulat
ive
Pro
babi
lity
'fσ
•Probabilistic Fatigue © 2003-2005 Darrell Socie, University of Illinois at Urbana-Champaign, All Rights Reserved 231 of 352
Uncertainty for Structural Steels
100 1000 10000
COV 0.12
99.9 %
99 %
90 %
50 %
10 %
1 %
0.1 %
Cum
ulat
ive
Pro
babi
lity
'fσ Su 600 – 900 MPa
19 Data Points
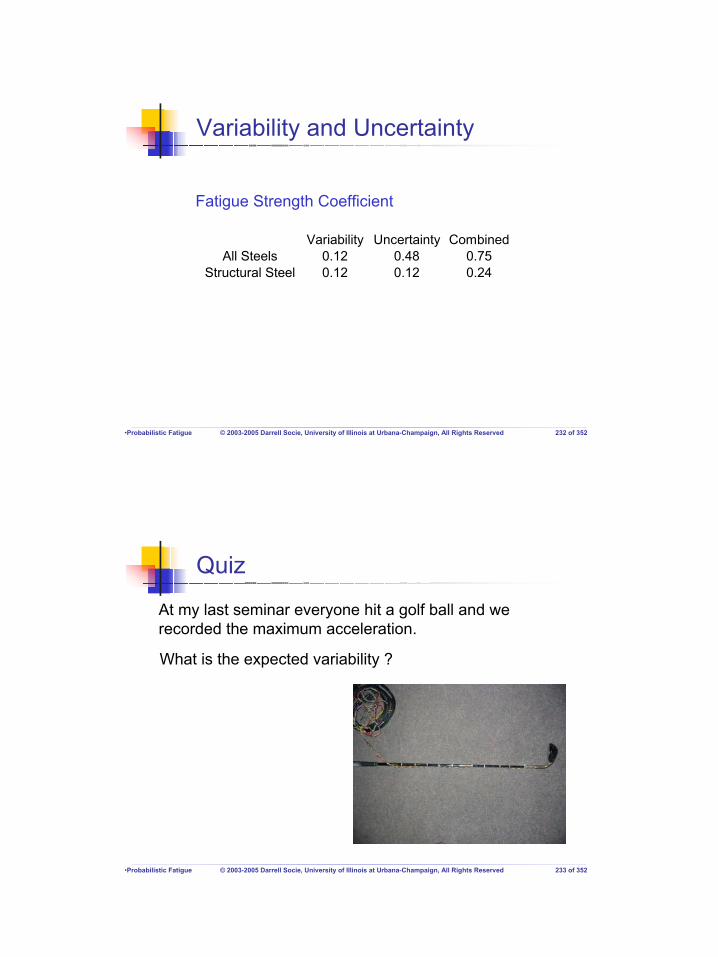
117
•Probabilistic Fatigue © 2003-2005 Darrell Socie, University of Illinois at Urbana-Champaign, All Rights Reserved 232 of 352
Variability and Uncertainty
Fatigue Strength Coefficient
Variability Uncertainty CombinedAll Steels 0.12 0.48 0.75
Structural Steel 0.12 0.12 0.24
•Probabilistic Fatigue © 2003-2005 Darrell Socie, University of Illinois at Urbana-Champaign, All Rights Reserved 233 of 352
Quiz
What is the expected variability ?
At my last seminar everyone hit a golf ball and we recorded the maximum acceleration.

118
•Probabilistic Fatigue © 2003-2005 Darrell Socie, University of Illinois at Urbana-Champaign, All Rights Reserved 234 of 352
Results
12.97.75.8811.115.510.318.111.644.260.37
µσ
COV
Case Studies
Professor Darrell F. SocieDepartment of Mechanical and
Industrial Engineering
© 2003-2005 Darrell Socie, All Rights Reserved
Probabilistic Aspects of Fatigue

119
•Probabilistic Fatigue © 2003-2005 Darrell Socie, University of Illinois at Urbana-Champaign, All Rights Reserved 236 of 352
Probabilistic Aspects of Fatigue
IntroductionBasic Probability and StatisticsStatistical TechniquesAnalysis Methods Characterizing VariabilityCase StudiesFatigueCalculator.comGlyphWorks
•Probabilistic Fatigue © 2003-2005 Darrell Socie, University of Illinois at Urbana-Champaign, All Rights Reserved 237 of 352
Case Studies
DARWINSouthwest Research
BicycleLoading Histories

120
•Probabilistic Fatigue © 2003-2005 Darrell Socie, University of Illinois at Urbana-Champaign, All Rights Reserved 238 of 352
A Software Framework for Probabilistic Fatigue Life Assessment
ASTM Symposium on Probabilistic Aspects of Life Prediction
Miami Beach, FloridaNovember 6-7, 2002
R. C. McClung, M. P. Enright, H. R. Millwater*, G. R. Leverant, and S. J. Hudak, Jr.
Southwest Research
Slides 6 – 27 used with permission of of Craig McClung
•Probabilistic Fatigue © 2003-2005 Darrell Socie, University of Illinois at Urbana-Champaign, All Rights Reserved 239 of 352
Motivation

121
•Probabilistic Fatigue © 2003-2005 Darrell Socie, University of Illinois at Urbana-Champaign, All Rights Reserved 240 of 352
UAL Flight 232July 19,1989
•Probabilistic Fatigue © 2003-2005 Darrell Socie, University of Illinois at Urbana-Champaign, All Rights Reserved 241 of 352
Turbine Disk FailureAnomalies in titanium engine disks
Hard AlphaVery rareCan cause failureNot addressed by safe life methods
Enhanced life management processRequested by FAADeveloped by engine industryProbabilistic damage tolerance methodsSupplement to safe life approach
SwRI and engine industry developed DARWIN with FAA funding

122
•Probabilistic Fatigue © 2003-2005 Darrell Socie, University of Illinois at Urbana-Champaign, All Rights Reserved 242 of 352
Probabilistic Damage Tolerance
Probabilistic Fracture Mechanics
Probability of DetectionAnomaly Distribution
Finite Element Stress Analysis
Material Crack Growth Data
NDE Inspection Schedule
Pf vs. Cycles
Risk Contribution Factors
•Probabilistic Fatigue © 2003-2005 Darrell Socie, University of Illinois at Urbana-Champaign, All Rights Reserved 243 of 352
Zone-Based Risk Assessment
Define zones based on similar stress, inspection, anomaly distribution, lifetime
Total probability of fracture for zone:(probability of having a defect) x (POF given
a defect)Defect probability determined by anomaly
distribution, zone volumePOF assuming a defect computed with
Monte Carlo sampling or advanced methods
POF for disk obtained by summing zone probabilities
As individual zones become smaller (number of zones increases), risk converges down to “exact” answer
1
2 3 4
m
5 6 7

123
•Probabilistic Fatigue © 2003-2005 Darrell Socie, University of Illinois at Urbana-Champaign, All Rights Reserved 244 of 352
Fracture Mechanics Model of Zone
m
7
Retrieve stresses along line
Fracture Mechanics Model
hx
hy
x
Y
grad
ient
dire
ctio
n
1
2
3
4
5
Defect
Finite Element Model
(Not to Scale)
•Probabilistic Fatigue © 2003-2005 Darrell Socie, University of Illinois at Urbana-Champaign, All Rights Reserved 245 of 352
Stress Processing
FE Stresses and plate definition
stress gradient
Stress gradient extraction
FE Analysis
0.0 0.2 0.4 0.6 0.8 1.0Normalized distance from the notch tip, x/r
-0.8
-0.4
0.0
0.4
0.8
1.2
1.6
2.0
σ/σo
(σz)relax
(σz)residual
(σz)elastic
Shakedown module
Computed relaxed stressσelastic - σresidual
σ0/σ
Residual stress analysis
3 4 5 6 7 0 1 2 3Load Step
01020304050607080
Hoo
p St
ress
(ksi
)
Rainflow stress pairing

124
•Probabilistic Fatigue © 2003-2005 Darrell Socie, University of Illinois at Urbana-Champaign, All Rights Reserved 246 of 352
Anomaly Distribution# of anomalies per volume of material as function of defect size
Library of default anomaly distributions for HA (developed by RISC)
•Probabilistic Fatigue © 2003-2005 Darrell Socie, University of Illinois at Urbana-Champaign, All Rights Reserved 247 of 352
Probability of Detection CurvesDefine probability of NDE flaw detection as function of flaw sizeCan specify different PODs for different zones, schedulesBuilt-in POD library or user-defined POD

125
•Probabilistic Fatigue © 2003-2005 Darrell Socie, University of Illinois at Urbana-Champaign, All Rights Reserved 248 of 352
Random Inspection Time“Opportunity Inspections” during on-condition maintenance
Inspection time modeled with Normal distribution or CDF table
•Probabilistic Fatigue © 2003-2005 Darrell Socie, University of Illinois at Urbana-Champaign, All Rights Reserved 249 of 352
Output: Risk vs. Flight Cycles

126
•Probabilistic Fatigue © 2003-2005 Darrell Socie, University of Illinois at Urbana-Champaign, All Rights Reserved 250 of 352
Output: Risk Contribution FactorsIdentify regions of component with highest risk
•Probabilistic Fatigue © 2003-2005 Darrell Socie, University of Illinois at Urbana-Champaign, All Rights Reserved 251 of 352
Implementation in IndustryFAA Advisory Circular 33.14 requests risk
assessment be performed for all new titanium rotor designs
Designs must pass design target risk for rotors
Components
Risk
MaximumAllowable
Risk
10-9
RiskReductionRequired
CA B

127
•Probabilistic Fatigue © 2003-2005 Darrell Socie, University of Illinois at Urbana-Champaign, All Rights Reserved 252 of 352
Probabilistic Fracture Mechanics
Material Crack Growth Data
Finite Element Stress Analysis
Anomaly Distribution NDE Inspection
Pf vs. Flights
RPM-Stress Transform Crack Initiation
0
4000
8000
12000
0 1000 2000 3000 4000
Load Spectrum Editing
Code Enhancements
Sensor (RPM) Input
0.0
0.1
0.2
0.3
0.4
0.5
0.6
0 5 10 15 20 25 30 35 40
THRESHOLD STRESS RANGE (KSI)
PRO
BA
BIL
ITY
OF
FAIL
UR
E A
T 20
,000
CYC
LES
0
20
40
60
80
100
120
NU
MB
ER O
F C
YCLE
S PE
R M
ISSI
ON
PfCycles Per Mission
DARWIN for Prognosis Studies
•Probabilistic Fatigue © 2003-2005 Darrell Socie, University of Illinois at Urbana-Champaign, All Rights Reserved 253 of 352
Three Sources of Variability
Anomaly size (initial crack size)FCG properties (life scatter)Mission histories (stress scatter)

128
•Probabilistic Fatigue © 2003-2005 Darrell Socie, University of Illinois at Urbana-Champaign, All Rights Reserved 254 of 352
Hard Alpha Defects in Titanium
Initial DARWIN focus on Hard AlphaSmall brittle zone in
microstructureAlpha phase stabilized by N
accidentally introduced during melting
Cracks initiate quickly
Extensive industry effort to develop HA distribution
•Probabilistic Fatigue © 2003-2005 Darrell Socie, University of Illinois at Urbana-Champaign, All Rights Reserved 255 of 352
Resulting Anomaly DistributionsPost 1995 Triple Melt/Cold Hearth + Vacuum Arc Remelt
1.00E-02
1.00E-01
1.00E+00
1.00E+01
1.00E+02
1.00E+02 1.00E+03 1.00E+04
DEFECT INSPECTION AREA (sq mils)
EXC
EED
ENC
E(p
er m
illio
n po
unds
)
MZ(5-10in Billet)/#1 FBH
MZ(5-10in Billet)/#3 FBH
MZ (12-13in Billet)/#1 FBH
#2/#1 FBH
#2/#2 FBH
#3/#1 FBH
#3/#2 FBH
#3/#3 FBH

129
•Probabilistic Fatigue © 2003-2005 Darrell Socie, University of Illinois at Urbana-Champaign, All Rights Reserved 256 of 352
FCG Simulations for AGARD Data
Use individual fits to generate set of a vs. N curves for identical conditions
Characterize resulting scatter in total propagation life
Lognormal distribution appropriate in most cases
N, cycle0 2000 4000 6000 8000
a, c
m
0.0
0.1
0.2
0.3
0.4
0.5
Corner Crack Specimen∆Ki=18.7 MPa√m, ∆Kf=56.9 MPa√m
AGARD
•Probabilistic Fatigue © 2003-2005 Darrell Socie, University of Illinois at Urbana-Champaign, All Rights Reserved 257 of 352
Engine Usage Variability
Stress/Speed: ∆σ ∝ (RPM)2
Total Cyclic Life (LCF): Nf = Ni + Np
Ni ∝ ∆σ 3-5
Np ∝ ∆σ 3-4
Life/Speed: Nf ∝ (RPM)6
Component life is very sensitive to actual usage
0
1000
2000
3000
4000
5000
6000
7000
8000
9000
10000
0 2500 5000 7500 10000 12500TIM E (SEC)
RPM
(Low
Spe
ed S
pool
)
Air Combat Tactics
Air to Ground & Gunnery
Basic Fighter Maneuvers
Intercept
Peace Keeping
Surface to Air Tactics ( hi alt)
Surface to Air Tactics ( lo alt)
Suppression of Enemy Defenses
Cross Country

130
•Probabilistic Fatigue © 2003-2005 Darrell Socie, University of Illinois at Urbana-Champaign, All Rights Reserved 258 of 352
Usage Variability
0
1000
2000
3000
4000
5000
6000
7000
8000
9000
10000
0 2500 5000 7500 10000 12500TIME (SEC)
RPM
(Low
Spe
ed S
pool
)
Air Com bat Tactics
Air to Ground & Gunnery
Basic Fighter Maneuvers
Intercept
Peace Keeping
Surface to Air Tactics ( hi alt)
Surface to Air Tactics ( lo alt)
Suppression of Enem y Defenses
Cross Country
Surface to Air Tactics ( lo alt)
0
1000
2000
3000
4000
5000
6000
7000
8000
9000
0 2500 5000 7500 10000 12500TIM E (SEC)
RPM
(Low
Spe
ed S
pool
)
Peace Keeping
0
1000
2000
3000
4000
5000
6000
7000
8000
9000
0 2500 5000 7500 10000 12500TIM E (S EC)
RPM
(Low
Spe
ed S
pool
)
Components of Usage Variability:
• Mission type
• Mission-to-mission variability
• Mission mixing variability
•Probabilistic Fatigue © 2003-2005 Darrell Socie, University of Illinois at Urbana-Champaign, All Rights Reserved 259 of 352
0.001
0.01
0.1
1
0 1000 2000 3000 4000 5000 6000 7000 8000
Number of Flight Cycles
Nor
mal
ized
PO
F
Air Combat Tactics
Combat Air Patrol
Air-Ground Weapons Delivery
Air-Air Weapons Delivery
Instrument/Ferry
Initiation and PropagationNo Inspection
Variability in Mission Type
Air-Air Weapons Delivery
Time
RPM
Air-Ground Weapons Delivery
Time
RP
M

131
•Probabilistic Fatigue © 2003-2005 Darrell Socie, University of Illinois at Urbana-Champaign, All Rights Reserved 260 of 352
Web Site: www.darwin.swri.org
•Probabilistic Fatigue © 2003-2005 Darrell Socie, University of Illinois at Urbana-Champaign, All Rights Reserved 261 of 352
Fatigue Design and Reliability in the Automotive Industry
Fatigue Design and ReliabilityESIS Publication 23
J-J. Thomas, G. Perroud, A. Bignonnet and D. Monnet
PSA Peugeot Citroën

132
•Probabilistic Fatigue © 2003-2005 Darrell Socie, University of Illinois at Urbana-Champaign, All Rights Reserved 262 of 352
Fatigue Design at PSA
Fatigue design at PSA is done with a probabilistic approach that includes analysis of customer usage, production scatter, definition of the appropriate design loads and an acceptance testing criterion.
•Probabilistic Fatigue © 2003-2005 Darrell Socie, University of Illinois at Urbana-Champaign, All Rights Reserved 263 of 352
Stress-Strength Interference
Stress Strength
Reliability = 1 – P( Stress > Strength )
How do you really get these distributions ?
Design Load
How do you establish a design load ?How do you validate the design ?

133
•Probabilistic Fatigue © 2003-2005 Darrell Socie, University of Illinois at Urbana-Champaign, All Rights Reserved 264 of 352
Stress Distribution
Variability in loading has two components, how it is used and how it is driven.
Car UsageHighway, city, fully loaded, empty etc.
Driving Stylepassive, aggressive etc.
The usage of a car is independent of the owners driving styleso that the distributions of car usage and driving style canbe obtained separately.
•Probabilistic Fatigue © 2003-2005 Darrell Socie, University of Illinois at Urbana-Champaign, All Rights Reserved 265 of 352
Car Usage
Customer surveysk l ck % rkl %1 Unloaded 27
1 Highway 102 Good Road 253 Mountain 404 City 25
2 Half Load 581 Highway 52 Good Road 303 Mountain 304 City 35
3 Fully Loaded 151 Highway 152 Good Road 253 Mountain 404 City 20
12 Customer Usage Categories

134
•Probabilistic Fatigue © 2003-2005 Darrell Socie, University of Illinois at Urbana-Champaign, All Rights Reserved 266 of 352
Owner BehaviorInstrumented Vehicles
-3
-2
-1
0
1
2
3
0 -1 -2 -33 2 1To Load, kN
0 -1 -2 -33 2 1To Load, kN
From
Loa
d,kN
Extensive field testing for each customer usage category produces a large number of histograms.
Let the usage histogram be denoted Ukl
•Probabilistic Fatigue © 2003-2005 Darrell Socie, University of Illinois at Urbana-Champaign, All Rights Reserved 267 of 352
Extrapolation
-3
-2
-1
0
1
2
3
0 -1 -2 -33 2 1To Load, kN
0 -1 -2 -33 2 1To Load, kN
From
Loa
d,kN
-3
-2
-1
0
1
2
3
0 -1 -2 -33 2 1To Load, kN
From
Loa
d,kN
-3
-2
-1
0
1
2
3
0 -1 -2 -33 2 1To Load, kN
From
Loa
d,kN
Measured data, e.g. 1,000 km Extrapolated data, 300,000 km
Ukl U*kl

135
•Probabilistic Fatigue © 2003-2005 Darrell Socie, University of Illinois at Urbana-Champaign, All Rights Reserved 268 of 352
Virtual Customers
Thousands of virtual customers can now be generated by combining customer usage with driving style.
[ ] [ ]∑= *klklk
i UrcNU
[ ]iU rainflow histogram for an individual car
N kilometersck car loading, % rkl car usage, %
[ ]*klU distributions of rainflow histograms for
different car usage classifications
•Probabilistic Fatigue © 2003-2005 Darrell Socie, University of Illinois at Urbana-Champaign, All Rights Reserved 269 of 352
Design Loads
Initial design is done on the basis of a single constant amplitude load, Feq
Find a constant amplitude load and number of cyclesthat will produce the same fatigue damage as the customeroperating a car for the design life.

136
•Probabilistic Fatigue © 2003-2005 Darrell Socie, University of Illinois at Urbana-Champaign, All Rights Reserved 270 of 352
Equivalent Fatigue Loading
101 102 103 104 105 106
Feq
m1
6
m
eq 10FF
∆= ∑
1Nn
f
=∑
•Probabilistic Fatigue © 2003-2005 Darrell Socie, University of Illinois at Urbana-Champaign, All Rights Reserved 271 of 352
Distribution of Feq
µF
ασF
Fn
Fn = µF + ασFDesign Customer:
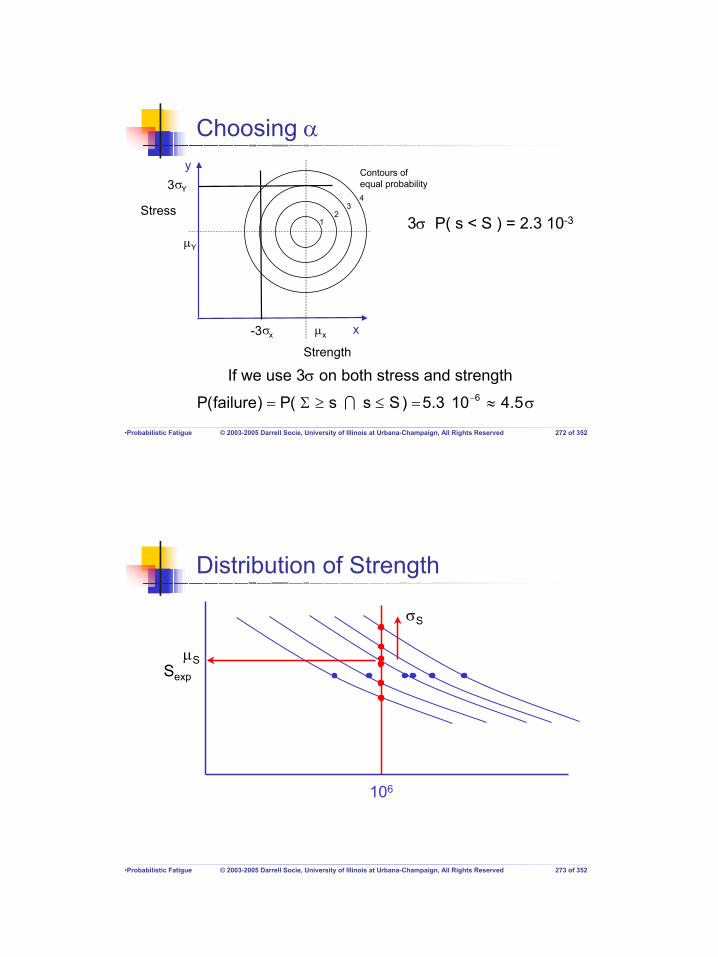
137
•Probabilistic Fatigue © 2003-2005 Darrell Socie, University of Illinois at Urbana-Champaign, All Rights Reserved 272 of 352
Choosing αContours of equal probability
y
xµx
µY
-3σx
3σY
12
34
Stress
Strength
If we use 3σ on both stress and strength
3σ P( s < S ) = 2.3 10-3
σ≈=≤≥Σ= − 5.4103.5)Sss(P)failure(P 6I
•Probabilistic Fatigue © 2003-2005 Darrell Socie, University of Illinois at Urbana-Champaign, All Rights Reserved 273 of 352
Distribution of Strength
106
Sexp
µS
σS

138
•Probabilistic Fatigue © 2003-2005 Darrell Socie, University of Illinois at Urbana-Champaign, All Rights Reserved 274 of 352
What Strength is Needed?
µF
ασF
Fn µS
βσS
•Probabilistic Fatigue © 2003-2005 Darrell Socie, University of Illinois at Urbana-Champaign, All Rights Reserved 275 of 352
Some Statistics
Z = S - F
Suppose we want a probability of failure of 1 in 50,0005
f 10x2P −=
( )2F
2S
FS
Z
Zf
1 1.4Pσ+σ
µ−µ=
σµ
==Φ−
Fn = µS( 1 – β COVS )Fn = µF( 1 + α COVF )

139
•Probabilistic Fatigue © 2003-2005 Darrell Socie, University of Illinois at Urbana-Champaign, All Rights Reserved 276 of 352
Mean Component Strength
( )2F
2S
FS
Z
Zf
1 1.4Pσ+σ
µ−µ=
σµ
==Φ−
( )2
F
F
2
Sn
S
Fn
S
f1
COV1COVCOV
F
COV11
FP
α+
+
µ
α+−
µ
=Φ−
•Probabilistic Fatigue © 2003-2005 Darrell Socie, University of Illinois at Urbana-Champaign, All Rights Reserved 277 of 352
Reliability
1 1.1 1.2 1.3 1.4 1.5 1.6 1.7 1.8 1.9 2
10-1
10-2
10-3
10-4
10-5
10-6
10-7
10-8
10-9
Rel
iabi
lity
n
S
Fµ
α = 3COVF = 0.2COVS = 0.1

140
•Probabilistic Fatigue © 2003-2005 Darrell Socie, University of Illinois at Urbana-Champaign, All Rights Reserved 278 of 352
Mean Strength
µF
ασFFn µS
βσS
µS = 1.4 Fn for a reliability of 2 x 10⁻⁵
85.2COV
F1
S
S
n
=µ
−=β
•Probabilistic Fatigue © 2003-2005 Darrell Socie, University of Illinois at Urbana-Champaign, All Rights Reserved 279 of 352
Design
Design calculations are made with loads FnLarge database relates Fn to vehicle parameters so that a new vehicle can be designed from historical measurements
Fatigue calculations are made with material properties β standard deviations from the mean

141
•Probabilistic Fatigue © 2003-2005 Darrell Socie, University of Illinois at Urbana-Champaign, All Rights Reserved 280 of 352
Component Testing
Test load is frequently higher than Fn to get failures near the design life
Component strength not life !
•Probabilistic Fatigue © 2003-2005 Darrell Socie, University of Illinois at Urbana-Champaign, All Rights Reserved 281 of 352
Interpreting the Test Data
Component tests are done with small sample sizes
2x
1N,12
2xs)1N(
σ≤χ
−−α−
Confidence limits
( )2
F
F2
1N,1
2
Sn
S
Fn
S
f1
COV1COV1NCOV
F
COV11
FP
α+
+χ
−
µ
α+−
µ
=Φ
−α−
−
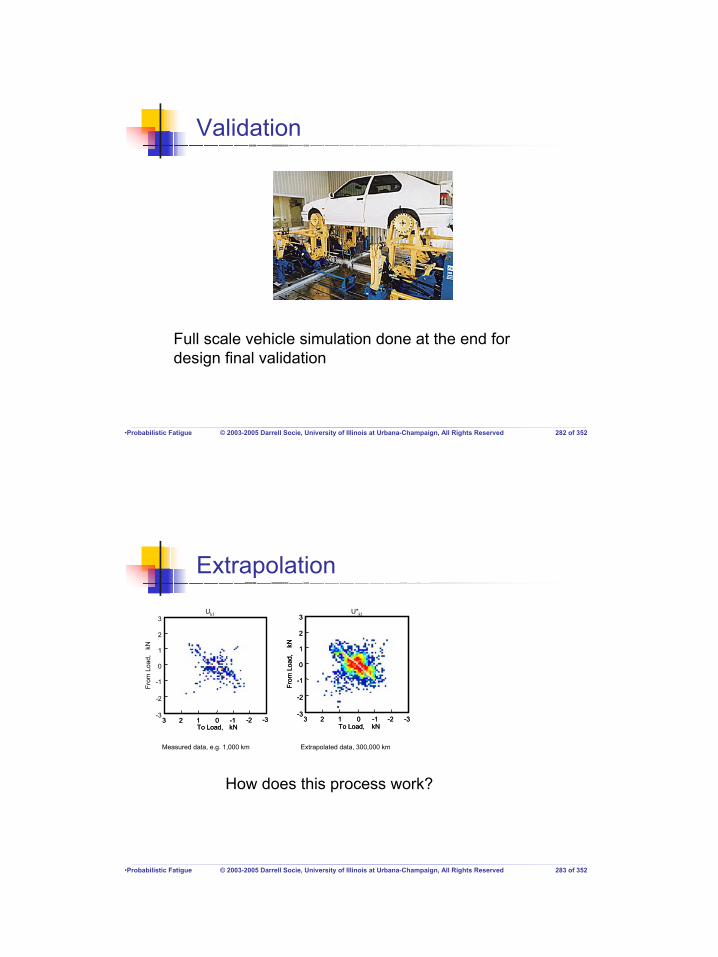
142
•Probabilistic Fatigue © 2003-2005 Darrell Socie, University of Illinois at Urbana-Champaign, All Rights Reserved 282 of 352
Validation
Full scale vehicle simulation done at the end for design final validation
•Probabilistic Fatigue © 2003-2005 Darrell Socie, University of Illinois at Urbana-Champaign, All Rights Reserved 283 of 352
Extrapolation
-3
-2
-1
0
1
2
3
0 -1 -2 -33 2 1To Load, kN
0 -1 -2 -33 2 1To Load, kN
From
Loa
d,kN
-3
-2
-1
0
1
2
3
0 -1 -2 -33 2 1To Load, kN
From
Loa
d,kN
-3
-2
-1
0
1
2
3
0 -1 -2 -33 2 1To Load, kN
From
Loa
d,kN
Measured data, e.g. 1,000 km Extrapolated data, 300,000 km
Ukl U*kl
How does this process work?

143
•Probabilistic Fatigue © 2003-2005 Darrell Socie, University of Illinois at Urbana-Champaign, All Rights Reserved 284 of 352
Service Loading Spectra
-5
5
0
Late
ral F
orce
,kN
Time history
0 1 2 3-3 -2 -1-3
-2
-1
0
1
2
3
To Load, kN
From
Loa
d,kN
0
1
2
3
4
1 10 100 1000Cumulative Cycles
Load
Ran
ge,k
N
RainflowHistogram
ExceedanceDiagram
•Probabilistic Fatigue © 2003-2005 Darrell Socie, University of Illinois at Urbana-Champaign, All Rights Reserved 285 of 352
Problem Statement
Given a rainflow histogram for a single user, extrapolate to longer times
Given rainflow histograms for multiple users, extrapolate to more users

144
•Probabilistic Fatigue © 2003-2005 Darrell Socie, University of Illinois at Urbana-Champaign, All Rights Reserved 286 of 352
Probability Density
-3
-2
-1
0
1
2
3
0 -1 -2 -33 2 1To Load, kN
From
Loa
d,kN
•Probabilistic Fatigue © 2003-2005 Darrell Socie, University of Illinois at Urbana-Champaign, All Rights Reserved 287 of 352
Kernel Smoothing
-3
-2
-1
0
1
2
3
From
Loa
d,kN
0 -1 -2 -33 2 1To Load, kN

145
•Probabilistic Fatigue © 2003-2005 Darrell Socie, University of Illinois at Urbana-Champaign, All Rights Reserved 288 of 352
Sparse Data
-3
-2
-1
0
1
2
3
From
Loa
d,kN
0 -1 -2 -33 2 1To Load, kN
•Probabilistic Fatigue © 2003-2005 Darrell Socie, University of Illinois at Urbana-Champaign, All Rights Reserved 289 of 352
Exceedance Plot of 1 Lap
0
1
2
3
4
1 10 100 1000Cumulative Cycles
Load
Ran
ge,k
N
weibull distribution

146
•Probabilistic Fatigue © 2003-2005 Darrell Socie, University of Illinois at Urbana-Champaign, All Rights Reserved 290 of 352
10X Extrapolation
0
1
2
3
4
1 10 100 1000Cumulative Cycles
Load
Ran
ge,k
N
6
5
•Probabilistic Fatigue © 2003-2005 Darrell Socie, University of Illinois at Urbana-Champaign, All Rights Reserved 291 of 352
-3
-2
-1
0
1
2
3
From
Loa
d,kN
Probability Density
0 -1 -2 -33 2 1To Load, kN

147
•Probabilistic Fatigue © 2003-2005 Darrell Socie, University of Illinois at Urbana-Champaign, All Rights Reserved 292 of 352
Results
-3
-2
-1
0
1
2
3
0 -1 -2 -33 2 1To Load, kN
From
Loa
d,kN
-3
-2
-1
0
1
2
3
From
Loa
d,kN
Simulation Test Data
0 -1 -2 -33 2 1To Load, kN
•Probabilistic Fatigue © 2003-2005 Darrell Socie, University of Illinois at Urbana-Champaign, All Rights Reserved 293 of 352
Exceedance Diagram
0
1
2
3
4
5
6
1 10 100 103 104
Cycles
1 Lap (Input Data)
Model Prediction
Actual 10 LapsLoad
Ran
ge,k
N
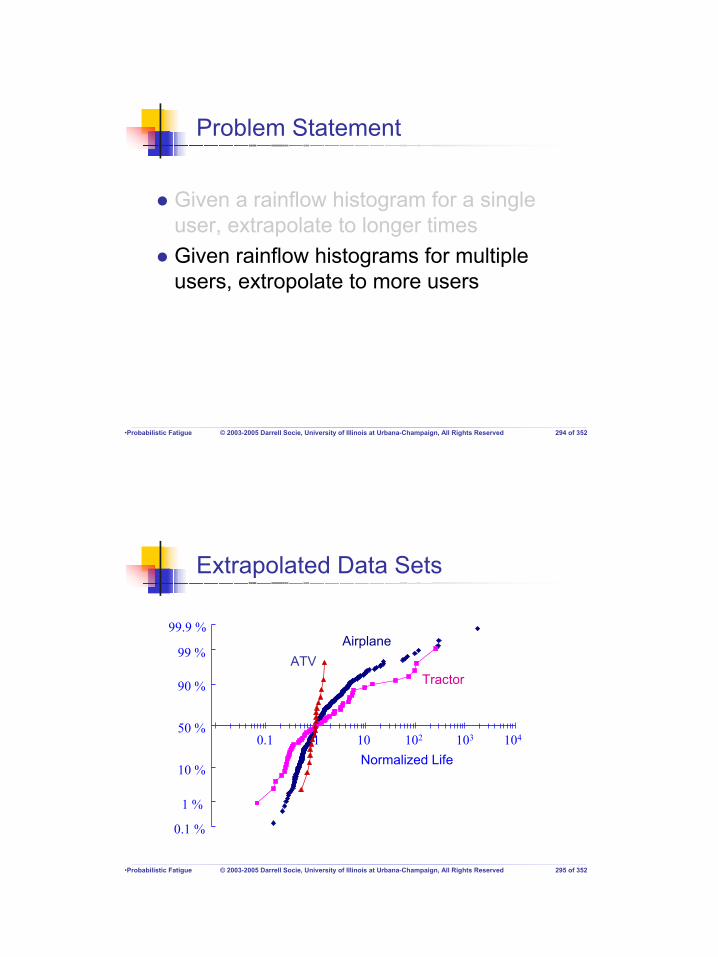
148
•Probabilistic Fatigue © 2003-2005 Darrell Socie, University of Illinois at Urbana-Champaign, All Rights Reserved 294 of 352
Problem Statement
Given a rainflow histogram for a single user, extrapolate to longer timesGiven rainflow histograms for multiple users, extropolate to more users
•Probabilistic Fatigue © 2003-2005 Darrell Socie, University of Illinois at Urbana-Champaign, All Rights Reserved 295 of 352
Extrapolated Data Sets
0.1 1 10 102 103 104
Normalized Life
Airplane
TractorATV
99.9 %
99 %
90 %
50 %
10 %
1 %
0.1 %

149
•Probabilistic Fatigue © 2003-2005 Darrell Socie, University of Illinois at Urbana-Champaign, All Rights Reserved 296 of 352
Issues
In the first problem the number of cycles is known but the variability is unknown and must be estimated
In the second problem the variability is known but the number and location of cycles is unknown and must be estimated
•Probabilistic Fatigue © 2003-2005 Darrell Socie, University of Illinois at Urbana-Champaign, All Rights Reserved 297 of 352
Assumption
0
16
32
48
1 10 102 103 104 105
Cumulative Cycles
Load
Ran
ge
0
16
32
48
0
16
32
48
1 10 102 103 104 105
On average, more severe users tend to have more higher amplitude cycles and fewer low amplitude cycles
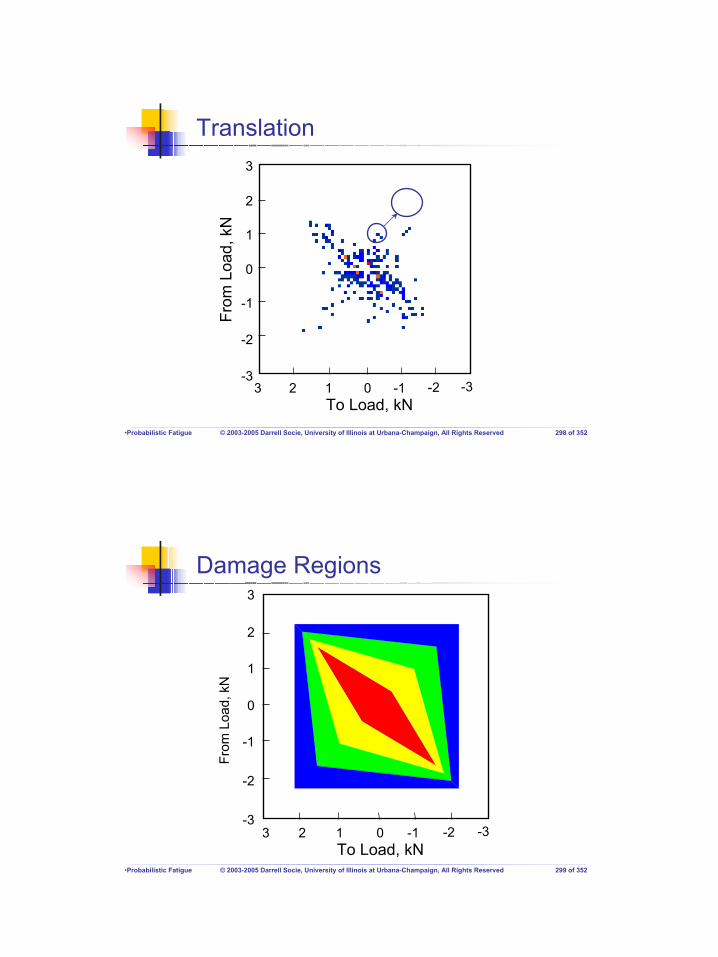
150
•Probabilistic Fatigue © 2003-2005 Darrell Socie, University of Illinois at Urbana-Champaign, All Rights Reserved 298 of 352
Translation
-3
-2
-1
0
1
2
3
From
Loa
d,kN
0 -1 -2 -33 2 1To Load, kN
•Probabilistic Fatigue © 2003-2005 Darrell Socie, University of Illinois at Urbana-Champaign, All Rights Reserved 299 of 352
Damage Regions
-3
-2
-1
0
1
2
3
From
Loa
d,kN
0 -1 -2 -33 2 1To Load, kN

151
•Probabilistic Fatigue © 2003-2005 Darrell Socie, University of Illinois at Urbana-Champaign, All Rights Reserved 300 of 352
ATV Data - Most Damaging in 19
-3
-2
-1
0
1
2
3
From
Loa
d,kN
-3
-2
-1
0
1
2
3
From
Loa
d,kN
Simulation Test Data
0 -1 -2 -33 2 1To Load, kN
0 -1 -2 -33 2 1To Load, kN
•Probabilistic Fatigue © 2003-2005 Darrell Socie, University of Illinois at Urbana-Champaign, All Rights Reserved 301 of 352
ATV Exceedance
0
1
2
3
4
5
6
1 10 100 103 104
Cycles
Load
Ran
ge,k
N
Actual Data
Simulation

152
•Probabilistic Fatigue © 2003-2005 Darrell Socie, University of Illinois at Urbana-Champaign, All Rights Reserved 302 of 352
Airplane Data - Most Damaging in 334
-30
-20
-10
0
10
20
30
0 -10 -20 -3030 20 10To Stress, ksi
From
Stre
ss,k
si
-30
-20
-10
0
10
20
30
From
Stre
ss,k
si
Simulation Test Data
0 -10 -20 -3030 20 10To Stress, ksi
•Probabilistic Fatigue © 2003-2005 Darrell Socie, University of Illinois at Urbana-Champaign, All Rights Reserved 303 of 352
Airplane Exceedance
0
10
20
30
40
1 10 100 1000Cycles
Stre
ss R
ange
,ksi
Simulation
Actual Data

153
•Probabilistic Fatigue © 2003-2005 Darrell Socie, University of Illinois at Urbana-Champaign, All Rights Reserved 304 of 352
Tractor Data - Most Damaging in 54
-1.5
-1.0
-0.5
0
0.5
1.0
1.5
0 -0.5 -1.0 -2.01.5 1.0 0.5To Strain x 10-3
From
Sta
rinx1
0-3
-1.5
-1.0
-0.5
0
0.5
1.0
1.5
From
Stra
in x
10-
3
Simulation Test Data
0 -0.5 -1.0 -2.01.5 1.0 0.5To Strain x 10-3
•Probabilistic Fatigue © 2003-2005 Darrell Socie, University of Illinois at Urbana-Champaign, All Rights Reserved 305 of 352
Tractor Exceedance
0
1.0
2.0
3.0
1 10 100 103 104 105
Cycles
Stra
in R
ange
x 1
0-3 Simulation
Actual Data
154
www.FatigueCalculator.com
Professor Darrell F. SocieDepartment of Mechanical and
Industrial Engineering
© 2004-2005 Darrell Socie, All Rights Reserved
Probabilistic Aspects of Fatigue
•Probabilistic Fatigue © 2003-2005 Darrell Socie, University of Illinois at Urbana-Champaign, All Rights Reserved 307 of 352
Probabilistic Aspects of Fatigue
IntroductionBasic Probability and StatisticsStatistical TechniquesAnalysis Methods Characterizing VariabilityCase StudiesFatigueCalculator.comGlyphWorks

155
•Probabilistic Fatigue © 2003-2005 Darrell Socie, University of Illinois at Urbana-Champaign, All Rights Reserved 308 of 352
www.FatigueCalculator.com
•Probabilistic Fatigue © 2003-2005 Darrell Socie, University of Illinois at Urbana-Champaign, All Rights Reserved 309 of 352
Probabilistic Fatigue Analysis
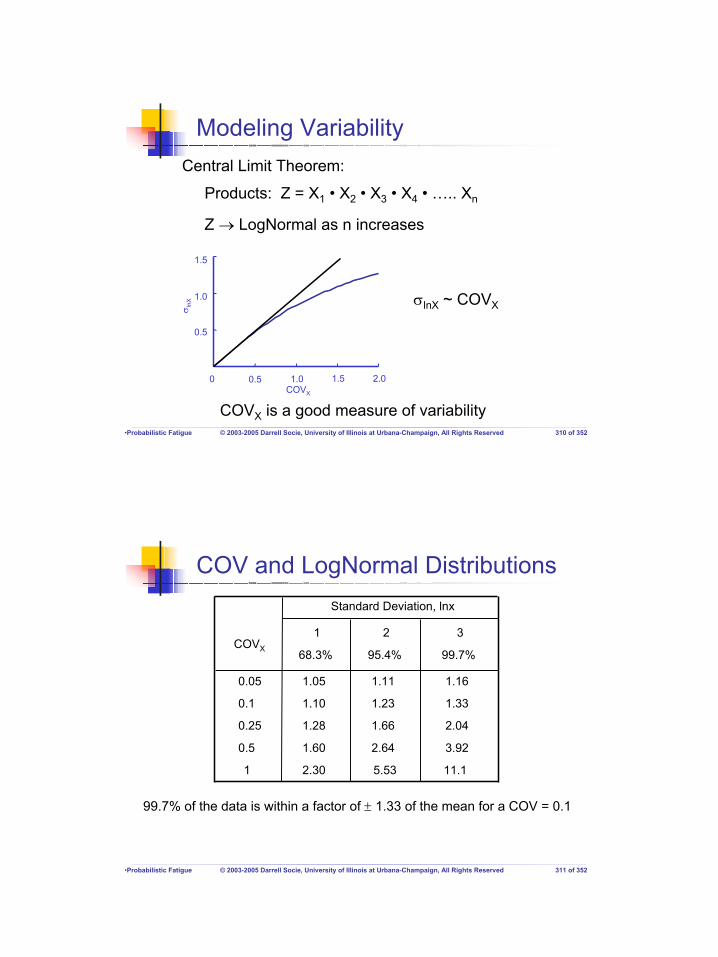
156
•Probabilistic Fatigue © 2003-2005 Darrell Socie, University of Illinois at Urbana-Champaign, All Rights Reserved 310 of 352
Modeling Variability
Products: Z = X1 • X2 • X3 • X4 • ….. Xn
Z → LogNormal as n increases
Central Limit Theorem:
COVX
0 0.5 1.0 1.5 2.0
0.5
1.0
1.5
σ lnX σlnX ~ COVX
COVX is a good measure of variability
•Probabilistic Fatigue © 2003-2005 Darrell Socie, University of Illinois at Urbana-Champaign, All Rights Reserved 311 of 352
Standard Deviation, lnx
COVX
1 2 3
68.3% 95.4% 99.7%
0.05
0.1
0.25
0.5
1
1.05
1.10
1.28
1.60
2.30
1.11
1.23
1.66
2.64
5.53
1.16
1.33
2.04
3.92
11.1
99.7% of the data is within a factor of ± 1.33 of the mean for a COV = 0.1
COV and LogNormal Distributions

157
•Probabilistic Fatigue © 2003-2005 Darrell Socie, University of Illinois at Urbana-Champaign, All Rights Reserved 312 of 352
Strain Life Analysis
•Probabilistic Fatigue © 2003-2005 Darrell Socie, University of Illinois at Urbana-Champaign, All Rights Reserved 313 of 352
Material Properties

158
•Probabilistic Fatigue © 2003-2005 Darrell Socie, University of Illinois at Urbana-Champaign, All Rights Reserved 314 of 352
Stress Concentration
•Probabilistic Fatigue © 2003-2005 Darrell Socie, University of Illinois at Urbana-Champaign, All Rights Reserved 315 of 352
Results

159
•Probabilistic Fatigue © 2003-2005 Darrell Socie, University of Illinois at Urbana-Champaign, All Rights Reserved 316 of 352
Results (continued)
•Probabilistic Fatigue © 2003-2005 Darrell Socie, University of Illinois at Urbana-Champaign, All Rights Reserved 317 of 352
Results (continued)

160
•Probabilistic Fatigue © 2003-2005 Darrell Socie, University of Illinois at Urbana-Champaign, All Rights Reserved 318 of 352
Results (continued)
•Probabilistic Fatigue © 2003-2005 Darrell Socie, University of Illinois at Urbana-Champaign, All Rights Reserved 319 of 352
Ten SimulationsLife COV
6470 0.9596930 0.8986710 0.6886640 0.9086580 0.8696470 0.9597010 0.7236690 0.9086170 0.7916560 0.971
Mean 6623 0.8674COV 0.038 0.114

161
•Probabilistic Fatigue © 2003-2005 Darrell Socie, University of Illinois at Urbana-Champaign, All Rights Reserved 320 of 352
29 Individual Data Sets'fσ
Median 820
300 1000
COV 0.25
2000
99.9 %
99 %
90 %
50 %
10 %
1 %
0.1 %
Cum
ulat
ive
Pro
babi
lity
b
-0.12 -0.08 -0.04
Mean -0.09COV 0.25
99.9 %
99 %
90 %
50 %
10 %
1 %
0.1 %C
umul
ativ
e P
roba
bilit
y
•Probabilistic Fatigue © 2003-2005 Darrell Socie, University of Illinois at Urbana-Champaign, All Rights Reserved 321 of 352
29 Individual Data Sets (continued)
0.1 1 10
Median 0.57COV 1.15
99.9 %
99 %
90 %
50 %
10 %
1 %
0.1 %
Cum
ulat
ive
Pro
babi
lity
'fε
-0.8 -0.6 -0.4 -0.2
c
Mean -0.62COV 0.23
99.9 %
99 %
90 %
50 %
10 %
1 %
0.1 %
Cum
ulat
ive
Pro
babi
lity

162
•Probabilistic Fatigue © 2003-2005 Darrell Socie, University of Illinois at Urbana-Champaign, All Rights Reserved 322 of 352
Correlation
0
0.25
0.5
0.75
1.0
0.01 0.1 1 10'fε
c
0
0.05
0.1
0.15
0.2
102 103 104
'fσ
b
ρ = -0.828 ρ = -0.976
•Probabilistic Fatigue © 2003-2005 Darrell Socie, University of Illinois at Urbana-Champaign, All Rights Reserved 323 of 352
Correlated Variables

163
•Probabilistic Fatigue © 2003-2005 Darrell Socie, University of Illinois at Urbana-Champaign, All Rights Reserved 324 of 352
Results (continued)
•Probabilistic Fatigue © 2003-2005 Darrell Socie, University of Illinois at Urbana-Champaign, All Rights Reserved 325 of 352
Results (continued)

164
•Probabilistic Fatigue © 2003-2005 Darrell Socie, University of Illinois at Urbana-Champaign, All Rights Reserved 326 of 352
Uncorrelated Variables
•Probabilistic Fatigue © 2003-2005 Darrell Socie, University of Illinois at Urbana-Champaign, All Rights Reserved 327 of 352
Results (continued)

165
•Probabilistic Fatigue © 2003-2005 Darrell Socie, University of Illinois at Urbana-Champaign, All Rights Reserved 328 of 352
Strain Amplitude± 1000 ± 250
•Probabilistic Fatigue © 2003-2005 Darrell Socie, University of Illinois at Urbana-Champaign, All Rights Reserved 329 of 352
Deterministic Analysis

166
•Probabilistic Fatigue © 2003-2005 Darrell Socie, University of Illinois at Urbana-Champaign, All Rights Reserved 330 of 352
Deterministic Analysis (continued)
•Probabilistic Fatigue © 2003-2005 Darrell Socie, University of Illinois at Urbana-Champaign, All Rights Reserved 331 of 352
Deterministic Analysis (continued)

167
•Probabilistic Fatigue © 2003-2005 Darrell Socie, University of Illinois at Urbana-Champaign, All Rights Reserved 332 of 352
Deterministic Analysis Results
•Probabilistic Fatigue © 2003-2005 Darrell Socie, University of Illinois at Urbana-Champaign, All Rights Reserved 333 of 352
Probabilistic Analysis

168
•Probabilistic Fatigue © 2003-2005 Darrell Socie, University of Illinois at Urbana-Champaign, All Rights Reserved 334 of 352
Probabilistic Analysis (continued)
•Probabilistic Fatigue © 2003-2005 Darrell Socie, University of Illinois at Urbana-Champaign, All Rights Reserved 335 of 352
Probabilistic Analysis (continued)

169
•Probabilistic Fatigue © 2003-2005 Darrell Socie, University of Illinois at Urbana-Champaign, All Rights Reserved 336 of 352
Probabilistic Analysis Results
GlyphWorks
Professor Darrell F. SocieDepartment of Mechanical and
Industrial Engineering
© 2005 Darrell Socie, All Rights Reserved
Probabilistic Aspects of Fatigue

170
•Probabilistic Fatigue © 2003-2005 Darrell Socie, University of Illinois at Urbana-Champaign, All Rights Reserved 338 of 352
Probabilistic Aspects of Fatigue
IntroductionBasic Probability and StatisticsStatistical TechniquesAnalysis Methods Characterizing VariabilityCase StudiesFatigueCalculator.comGlyphWorks
•Probabilistic Fatigue © 2003-2005 Darrell Socie, University of Illinois at Urbana-Champaign, All Rights Reserved 339 of 352
GlyphWorks / Rainflow

171
•Probabilistic Fatigue © 2003-2005 Darrell Socie, University of Illinois at Urbana-Champaign, All Rights Reserved 340 of 352
StatStrain.flo
•Probabilistic Fatigue © 2003-2005 Darrell Socie, University of Illinois at Urbana-Champaign, All Rights Reserved 341 of 352
StatStrain Glyph

172
•Probabilistic Fatigue © 2003-2005 Darrell Socie, University of Illinois at Urbana-Champaign, All Rights Reserved 342 of 352
StatOutput.xls
10000 100000 1000000
99.9 %
99 %
90 %
50 %
10 %
1 %
0 1 %
Life Distribution, Channel 6
•Probabilistic Fatigue © 2003-2005 Darrell Socie, University of Illinois at Urbana-Champaign, All Rights Reserved 343 of 352
StatOutput.xls (continued)
Probabilistic Sensitivity, Channel 6
Load History Variables57%
Stress Concentrators3%
Material Properties16%
Analysis Variables24%
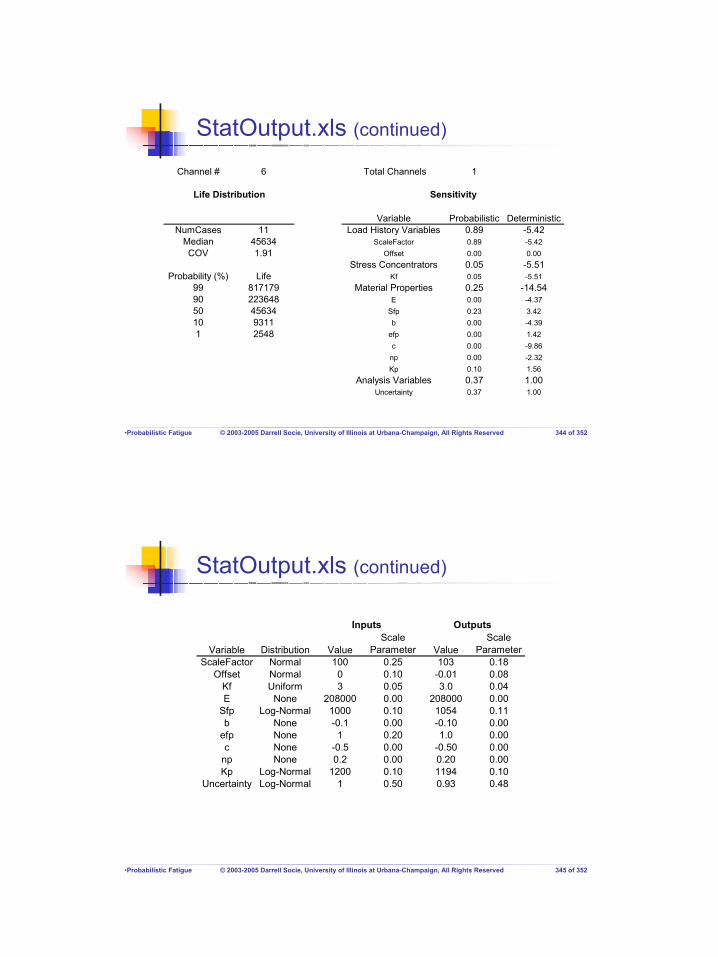
173
•Probabilistic Fatigue © 2003-2005 Darrell Socie, University of Illinois at Urbana-Champaign, All Rights Reserved 344 of 352
StatOutput.xls (continued)
Channel # 6 Total Channels 1
Variable Probabilistic DeterministicNumCases 11 Load History Variables 0.89 -5.42
Median 45634 ScaleFactor 0.89 -5.42COV 1.91 Offset 0.00 0.00
Stress Concentrators 0.05 -5.51Probability (%) Life Kf 0.05 -5.51
99 817179 Material Properties 0.25 -14.5490 223648 E 0.00 -4.3750 45634 Sfp 0.23 3.4210 9311 b 0.00 -4.391 2548 efp 0.00 1.42
c 0.00 -9.86np 0.00 -2.32Kp 0.10 1.56
Analysis Variables 0.37 1.00Uncertainty 0.37 1.00
Life Distribution Sensitivity
•Probabilistic Fatigue © 2003-2005 Darrell Socie, University of Illinois at Urbana-Champaign, All Rights Reserved 345 of 352
StatOutput.xls (continued)
Variable Distribution ValueScale
Parameter ValueScale
ParameterScaleFactor Normal 100 0.25 103 0.18
Offset Normal 0 0.10 -0.01 0.08Kf Uniform 3 0.05 3.0 0.04E None 208000 0.00 208000 0.00
Sfp Log-Normal 1000 0.10 1054 0.11b None -0.1 0.00 -0.10 0.00
efp None 1 0.20 1.0 0.00c None -0.5 0.00 -0.50 0.00
np None 0.2 0.00 0.20 0.00Kp Log-Normal 1200 0.10 1194 0.10
Uncertainty Log-Normal 1 0.50 0.93 0.48
Inputs Outputs

174
•Probabilistic Fatigue © 2003-2005 Darrell Socie, University of Illinois at Urbana-Champaign, All Rights Reserved 346 of 352
StatStress.flo
•Probabilistic Fatigue © 2003-2005 Darrell Socie, University of Illinois at Urbana-Champaign, All Rights Reserved 347 of 352
Rainflow Extrapolation
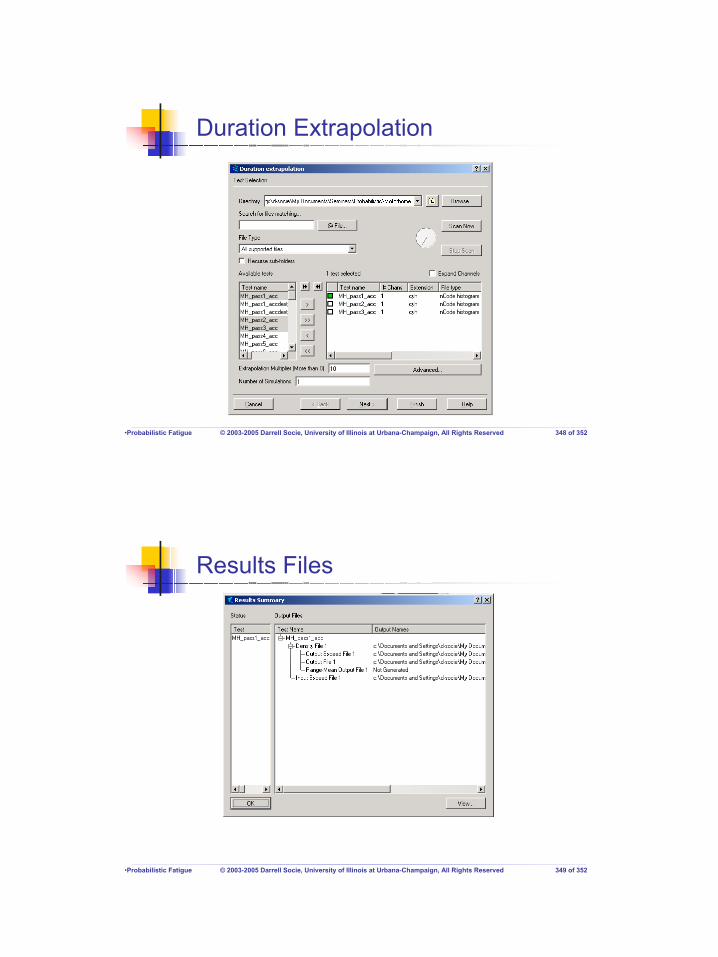
175
•Probabilistic Fatigue © 2003-2005 Darrell Socie, University of Illinois at Urbana-Champaign, All Rights Reserved 348 of 352
Duration Extrapolation
•Probabilistic Fatigue © 2003-2005 Darrell Socie, University of Illinois at Urbana-Champaign, All Rights Reserved 349 of 352
Results Files

176
•Probabilistic Fatigue © 2003-2005 Darrell Socie, University of Illinois at Urbana-Champaign, All Rights Reserved 350 of 352
Rainflow Duration
•Probabilistic Fatigue © 2003-2005 Darrell Socie, University of Illinois at Urbana-Champaign, All Rights Reserved 351 of 352
Percentile Extrapolation

177
•Probabilistic Fatigue © 2003-2005 Darrell Socie, University of Illinois at Urbana-Champaign, All Rights Reserved 352 of 352
Results
Probabilistic Aspects of Fatigue