probing red blood cell morphology using high-frequency
TRANSCRIPT
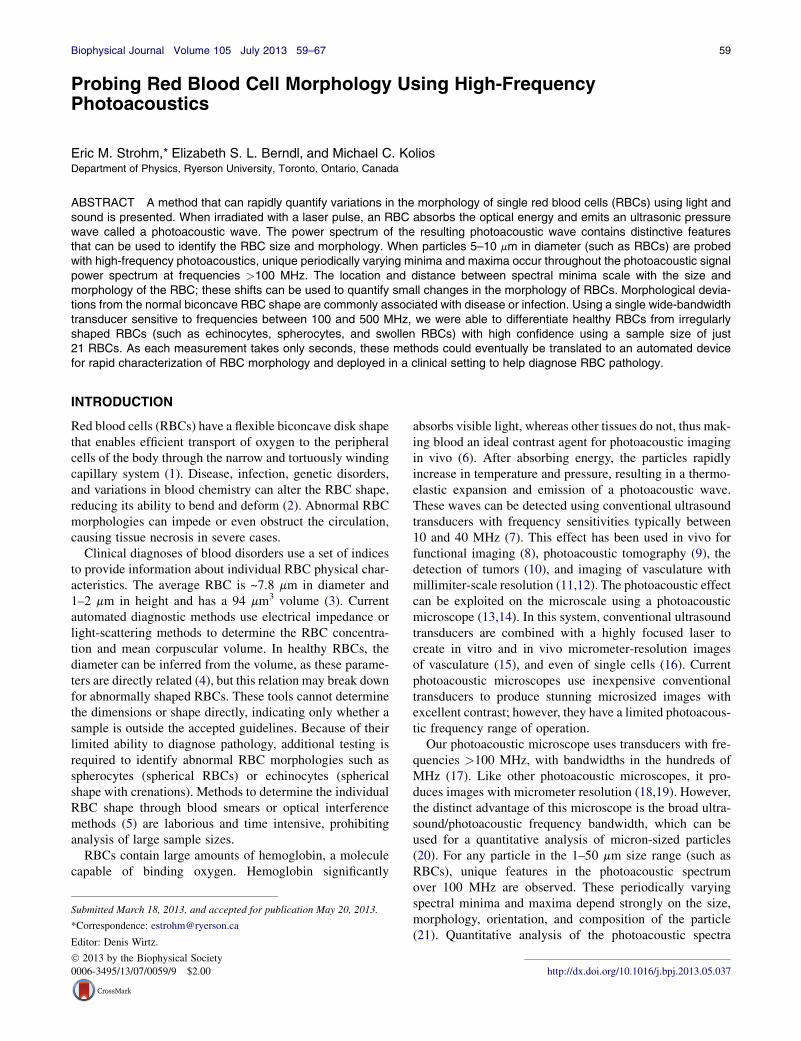
Biophysical Journal Volume 105 July 2013 59–67 59
Probing Red Blood Cell Morphology Using High-FrequencyPhotoacoustics
Eric M. Strohm,* Elizabeth S. L. Berndl, and Michael C. KoliosDepartment of Physics, Ryerson University, Toronto, Ontario, Canada
ABSTRACT A method that can rapidly quantify variations in the morphology of single red blood cells (RBCs) using light andsound is presented. When irradiated with a laser pulse, an RBC absorbs the optical energy and emits an ultrasonic pressurewave called a photoacoustic wave. The power spectrum of the resulting photoacoustic wave contains distinctive featuresthat can be used to identify the RBC size and morphology. When particles 5–10 mm in diameter (such as RBCs) are probedwith high-frequency photoacoustics, unique periodically varying minima and maxima occur throughout the photoacoustic signalpower spectrum at frequencies >100 MHz. The location and distance between spectral minima scale with the size andmorphology of the RBC; these shifts can be used to quantify small changes in the morphology of RBCs. Morphological devia-tions from the normal biconcave RBC shape are commonly associated with disease or infection. Using a single wide-bandwidthtransducer sensitive to frequencies between 100 and 500 MHz, we were able to differentiate healthy RBCs from irregularlyshaped RBCs (such as echinocytes, spherocytes, and swollen RBCs) with high confidence using a sample size of just21 RBCs. As each measurement takes only seconds, these methods could eventually be translated to an automated devicefor rapid characterization of RBC morphology and deployed in a clinical setting to help diagnose RBC pathology.
INTRODUCTION
Red blood cells (RBCs) have a flexible biconcave disk shapethat enables efficient transport of oxygen to the peripheralcells of the body through the narrow and tortuously windingcapillary system (1). Disease, infection, genetic disorders,and variations in blood chemistry can alter the RBC shape,reducing its ability to bend and deform (2). Abnormal RBCmorphologies can impede or even obstruct the circulation,causing tissue necrosis in severe cases.
Clinical diagnoses of blood disorders use a set of indicesto provide information about individual RBC physical char-acteristics. The average RBC is ~7.8 mm in diameter and1–2 mm in height and has a 94 mm3 volume (3). Currentautomated diagnostic methods use electrical impedance orlight-scattering methods to determine the RBC concentra-tion and mean corpuscular volume. In healthy RBCs, thediameter can be inferred from the volume, as these parame-ters are directly related (4), but this relation may break downfor abnormally shaped RBCs. These tools cannot determinethe dimensions or shape directly, indicating only whether asample is outside the accepted guidelines. Because of theirlimited ability to diagnose pathology, additional testing isrequired to identify abnormal RBC morphologies such asspherocytes (spherical RBCs) or echinocytes (sphericalshape with crenations). Methods to determine the individualRBC shape through blood smears or optical interferencemethods (5) are laborious and time intensive, prohibitinganalysis of large sample sizes.
RBCs contain large amounts of hemoglobin, a moleculecapable of binding oxygen. Hemoglobin significantly
Submitted March 18, 2013, and accepted for publication May 20, 2013.
*Correspondence: [email protected]
Editor: Denis Wirtz.
� 2013 by the Biophysical Society
0006-3495/13/07/0059/9 $2.00
absorbs visible light, whereas other tissues do not, thus mak-ing blood an ideal contrast agent for photoacoustic imagingin vivo (6). After absorbing energy, the particles rapidlyincrease in temperature and pressure, resulting in a thermo-elastic expansion and emission of a photoacoustic wave.These waves can be detected using conventional ultrasoundtransducers with frequency sensitivities typically between10 and 40 MHz (7). This effect has been used in vivo forfunctional imaging (8), photoacoustic tomography (9), thedetection of tumors (10), and imaging of vasculature withmillimiter-scale resolution (11,12). The photoacoustic effectcan be exploited on the microscale using a photoacousticmicroscope (13,14). In this system, conventional ultrasoundtransducers are combined with a highly focused laser tocreate in vitro and in vivo micrometer-resolution imagesof vasculature (15), and even of single cells (16). Currentphotoacoustic microscopes use inexpensive conventionaltransducers to produce stunning microsized images withexcellent contrast; however, they have a limited photoacous-tic frequency range of operation.
Our photoacoustic microscope uses transducers with fre-quencies >100 MHz, with bandwidths in the hundreds ofMHz (17). Like other photoacoustic microscopes, it pro-duces images with micrometer resolution (18,19). However,the distinct advantage of this microscope is the broad ultra-sound/photoacoustic frequency bandwidth, which can beused for a quantitative analysis of micron-sized particles(20). For any particle in the 1–50 mm size range (such asRBCs), unique features in the photoacoustic spectrumover 100 MHz are observed. These periodically varyingspectral minima and maxima depend strongly on the size,morphology, orientation, and composition of the particle(21). Quantitative analysis of the photoacoustic spectra
http://dx.doi.org/10.1016/j.bpj.2013.05.037

60 Strohm et al.
can be used to help identify these parameters and extractinformation from the particle examined.
The size, shape, and intrinsic optical absorption proper-ties of RBCs make them ideal candidates for high-frequencyquantitative photoacoustic methods. The photoacousticsignal can be used to infer the RBC size and shape, andthus give further insight into the specific abnormalityobserved than do current clinical methods. These methodscould be translated into an automated device capable ofmeasuring a large sample size for a rapid determination ofRBC morphology and thus pathology.
MATERIALS AND METHODS
RBCs were extracted from a healthy male volunteer in accordance with the
guidelines of the Ryerson Ethics Board (REB #2012-210). A drop of blood
was drawn from the subject’s finger using a lancet and immediately depos-
ited in 1 mL Dulbecco’s modified Eagle’s medium (DMEM) containing
10% fetal bovine serum to maintain viability (Sigma Aldrich, St. Louis,
MO). All measurements were made on 35 mm glass-bottom dishes (Mattek
Corporation, Ashland, MA). The dishes were coated with a thin layer of
0.5% agar ~200 mm thick to reduce photoacoustic back reflections from
the glass substrate. Approximately 30 mL of the DMEM-RBC solution
was deposited into 2 mL of coupling fluid inside the glass-bottom dish to
dilute the sample.
For the orientation and echinocyte measurements, DMEM was used as
the coupling fluid. For the osmolality measurements, phosphate-buffered
saline (PBS) was used as the coupling fluid. For both the PBS and
DMEM liquids, osmolality was measured three times using a Vapro 5520
vapor pressure osmometer (Wescor, Logan, UT) and was found to be, on
average, 294 and 332 mmol/kg, respectively. The standard deviation of
three measurements was 510 mmol/kg. The osmolality of PBS solutions
was adjusted by adding water. For the ATP-depletion procedure, the
extracted blood was stored in PBS. A small sample of the PBS-RBC solu-
tion was deposited on the glass-bottom dish containing 2 mL DMEM, and
21 RBCs were measured. The PBS-RBC solution was stored at 4�C for 24 h
to induce echinocyte formation, and a small sample was then added to a
glass-bottom dish containing 2 mL PBS. Again, 21 RBCs were measured.
Another PBS-RBC sample was added to a glass-bottom dish containing
2 mLDMEM and an additional 21 RBCs were measured. All measurements
were performed at 36�C.All measurements were completed using a photoacoustic microscope
developed by Kibero (Saarbrucken, Germany). This is an Olympus IX81
inverted optical microscope fitted with a transducer above the sample stage
Biophysical Journal 105(1) 59–67
(Fig. 1 A). The sample was positioned between the optical objective and the
transducer. The system optics allows for viewing the sample and aligning
the transducer; it also focuses the laser onto the sample. A dilute suspension
of freshly extracted human RBCs was deposited into the liquid in the sam-
ple holder. Most RBCs would fall to the substrate and align horizontally, but
some would initially come to rest in a vertical orientation (Fig. 1 B); these
would eventually tip over to a horizontal orientation. The laser was focused
onto single RBCs and the transducer recorded the resulting photoacoustic
wave (Fig. 1 C). The photoacoustic signals of RBCs were measured in
both a vertical and horizontal orientation. The diameter was obtained
from the optical images for comparison to theoretical simulations. A trans-
ducer with a center frequency of 375 MHz and f number of 1 (Kibero) was
used for all measurements. A 532 nm laser (Teem Photonics, Meylan,
France) was focused by a 10� optical objective to an ~10 mm spot size
on the sample, sufficient to irradiate a single RBC. The laser had a pulse
width of 330 ps and a pulse repetition frequency of 4 kHz. Signals were
amplified by a 40 dB amplifier (Miteq, Hauppage, NY), digitized at
8 GS/s using a DC252 digitizer (Agilent, Santa Clara, CA), and averaged
100–200 times to increase the signal/noise ratio. The laser power was
measured at the objective using a Nova II power meter and PD10 low
energy sensor (Ophir Optronics, Jerusalem, Israel). The laser power was
adjusted so that the laser fluence was 20–150 mJ/cm2 at the sample. For
the orientation measurements, photoacoustic signals were recorded approx-
imately once per second. For all other measurements, the RBCwas centered
over the laser spot and the photoacoustic signal was recorded. A Hamming
window was applied to the measured signals, and the normalized power
spectrum, P(f), was then calculated using the formula
Pðf Þ ¼ 20 log10
����
Pmðf ÞPnðf Þ
����;
where Pm(f) is the Fourier transform of the measured signal pm(t), and Pn(f)
is the Fourier transform of p (t), which is the spectral response of the trans-
nducer system and electronics. This normalization signal is used to remove
any artifacts due to the transducer/electronics of the system; it is generated
by a 200 nm thick gold film that is spectrally flat over the transducer band-
width, with variations of <3 dB from 100–1000 MHz. The normalization
signal is typically recorded using pulse-echo ultrasound from an ultrasoni-
cally flat reflective surface (22), but the transducer bandwidth for photo-
acoustic measurements is larger than that for pulse-echo ultrasound.
Pulse-echo ultrasound waves also travel twice the distance of photoacoustic
waves emitted from the sample, and they are therefore attenuated more
strongly than photoacoustic waves. More specific details about the equip-
ment, signal processing methods, and normalization procedure can be
found elsewhere (20,23).
A finite-element model (FEM) was used to validate the measured results
and determine how the photoacoustic spectral features vary with different
FIGURE 1 The photoacoustic microscope. (a)
The photoacoustic microscope. The sample is posi-
tioned between the transducer and the optical
objective. (b) RBCs after deposition into the sam-
ple holder. Most RBCs align horizontally on the
substrate, but a small number align vertically
(arrow). Scale bar, 20 mm. (c) A schematic
showing the sample positioning relative to the
transducer and focused laser. Figure 1 (a) used
with permission from Robert Lemor at Kibero
GmbH.
Photoacoustic Measurements of Blood Cells 61
parameters such as the diameter and orientation. The FEM was developed
using COMSOL Multiphysics software (Burlington, MA). A biconcave
shape using the equation developed by Fung et al. (24) was positioned at
the center of a two-dimensional axisymmetric 10 mm-radius spherical sys-
tem (Fig. 2). A mesh size of 0.05 mm was used. A density of 1100 kg/m3
(25,26) and a sound speed of 1650 m/s, similar to the sound speed measured
in previous studies (27,28), were used as input parameters. The model was
initiated with the RBC at a pressure higher than that of the surrounding fluid
to simulate the thermoelastic expansion that occurs immediately after
absorption of energy. A transient acoustics solver was used to calculate
the ultrasonic pressure wave propagation from the RBC as a function of
time. The signal was recorded at the system boundary at various angles
around the RBC. Further details about the development of the model can
be found in Strohm et al. (29).
RESULTS
Numerical simulations
Numerical simulations were performed using the FEM tocompare our measurements to theoretical predictions. Inthese simulations, the shape of the photoacoustic spectrumwas strongly dependent on the RBC size and orientation.Due to the large aspect ratio of the RBC, the photoacoustic
Transducers90°
0°
45°
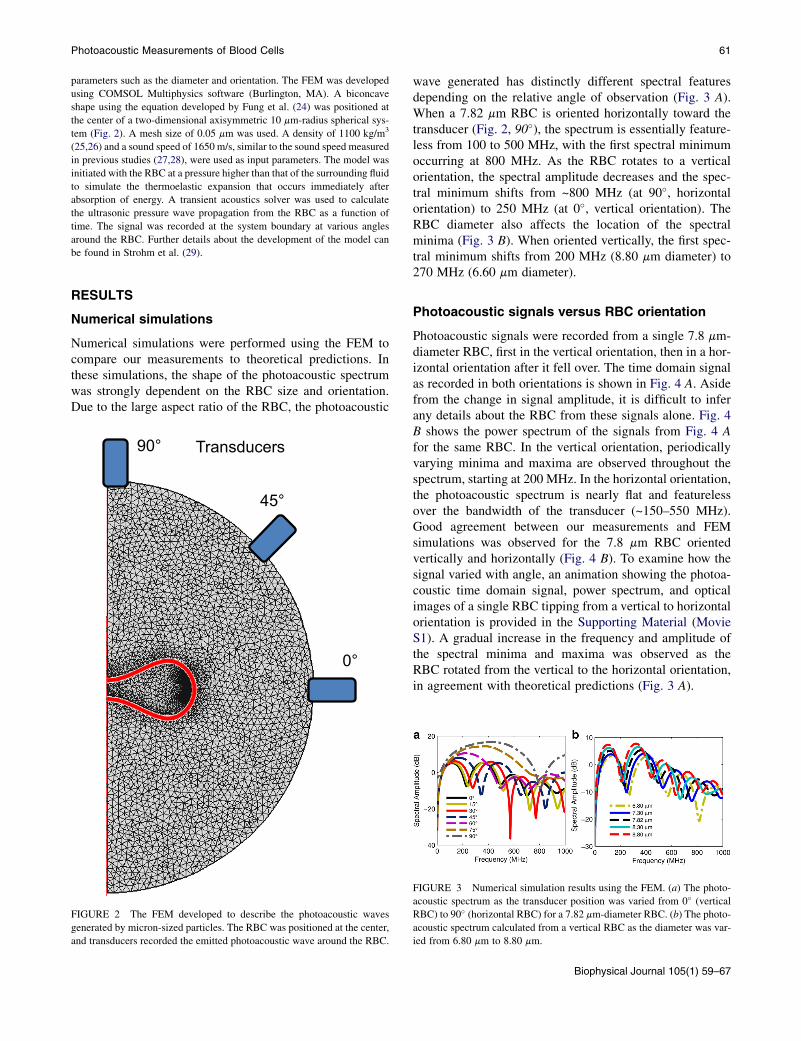
FIGURE 2 The FEM developed to describe the photoacoustic waves
generated by micron-sized particles. The RBC was positioned at the center,
and transducers recorded the emitted photoacoustic wave around the RBC.
wave generated has distinctly different spectral featuresdepending on the relative angle of observation (Fig. 3 A).When a 7.82 mm RBC is oriented horizontally toward thetransducer (Fig. 2, 90�), the spectrum is essentially feature-less from 100 to 500 MHz, with the first spectral minimumoccurring at 800 MHz. As the RBC rotates to a verticalorientation, the spectral amplitude decreases and the spec-tral minimum shifts from ~800 MHz (at 90�, horizontalorientation) to 250 MHz (at 0�, vertical orientation). TheRBC diameter also affects the location of the spectralminima (Fig. 3 B). When oriented vertically, the first spec-tral minimum shifts from 200 MHz (8.80 mm diameter) to270 MHz (6.60 mm diameter).
Photoacoustic signals versus RBC orientation
Photoacoustic signals were recorded from a single 7.8 mm-diameter RBC, first in the vertical orientation, then in a hor-izontal orientation after it fell over. The time domain signalas recorded in both orientations is shown in Fig. 4 A. Asidefrom the change in signal amplitude, it is difficult to inferany details about the RBC from these signals alone. Fig. 4B shows the power spectrum of the signals from Fig. 4 Afor the same RBC. In the vertical orientation, periodicallyvarying minima and maxima are observed throughout thespectrum, starting at 200 MHz. In the horizontal orientation,the photoacoustic spectrum is nearly flat and featurelessover the bandwidth of the transducer (~150–550 MHz).Good agreement between our measurements and FEMsimulations was observed for the 7.8 mm RBC orientedvertically and horizontally (Fig. 4 B). To examine how thesignal varied with angle, an animation showing the photoa-coustic time domain signal, power spectrum, and opticalimages of a single RBC tipping from a vertical to horizontalorientation is provided in the Supporting Material (MovieS1). A gradual increase in the frequency and amplitude ofthe spectral minima and maxima was observed as theRBC rotated from the vertical to the horizontal orientation,in agreement with theoretical predictions (Fig. 3 A).
FIGURE 3 Numerical simulation results using the FEM. (a) The photo-
acoustic spectrum as the transducer position was varied from 0� (vertical
RBC) to 90� (horizontal RBC) for a 7.82 mm-diameter RBC. (b) The photo-
acoustic spectrum calculated from a vertical RBC as the diameter was var-
ied from 6.80 mm to 8.80 mm.
Biophysical Journal 105(1) 59–67
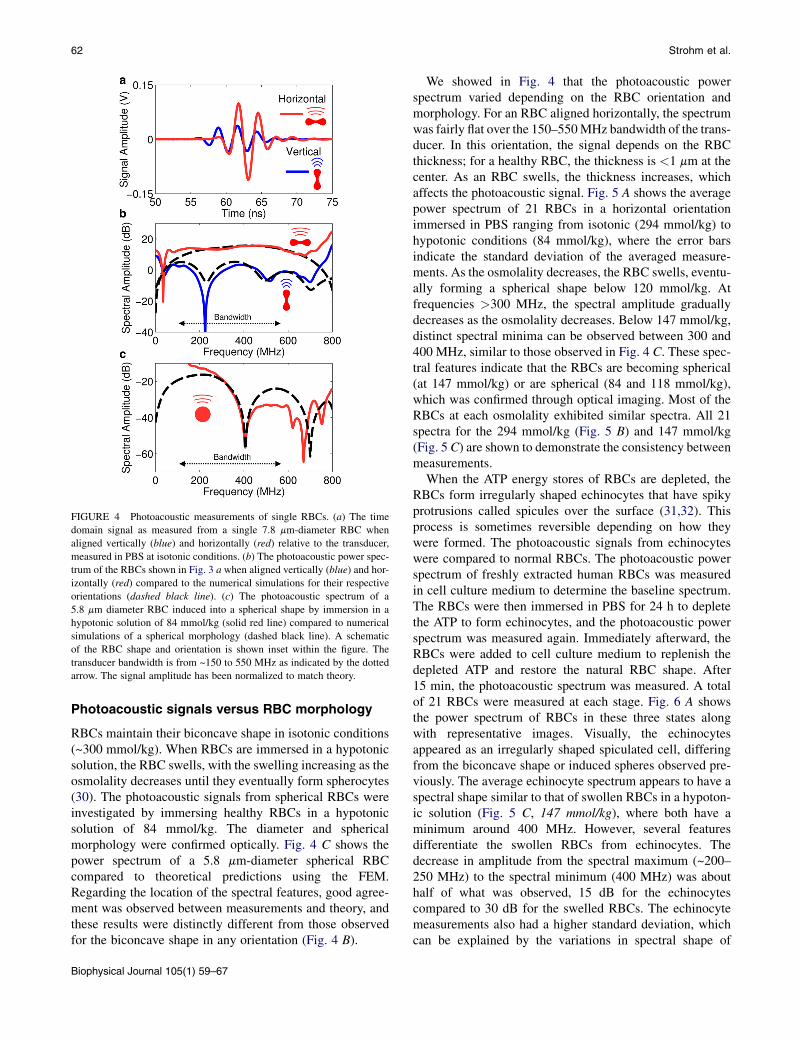
FIGURE 4 Photoacoustic measurements of single RBCs. (a) The time
domain signal as measured from a single 7.8 mm-diameter RBC when
aligned vertically (blue) and horizontally (red) relative to the transducer,
measured in PBS at isotonic conditions. (b) The photoacoustic power spec-
trum of the RBCs shown in Fig. 3 a when aligned vertically (blue) and hor-
izontally (red) compared to the numerical simulations for their respective
orientations (dashed black line). (c) The photoacoustic spectrum of a
5.8 mm diameter RBC induced into a spherical shape by immersion in a
hypotonic solution of 84 mmol/kg (solid red line) compared to numerical
simulations of a spherical morphology (dashed black line). A schematic
of the RBC shape and orientation is shown inset within the figure. The
transducer bandwidth is from ~150 to 550 MHz as indicated by the dotted
arrow. The signal amplitude has been normalized to match theory.
62 Strohm et al.
Photoacoustic signals versus RBC morphology
RBCs maintain their biconcave shape in isotonic conditions(~300 mmol/kg). When RBCs are immersed in a hypotonicsolution, the RBC swells, with the swelling increasing as theosmolality decreases until they eventually form spherocytes(30). The photoacoustic signals from spherical RBCs wereinvestigated by immersing healthy RBCs in a hypotonicsolution of 84 mmol/kg. The diameter and sphericalmorphology were confirmed optically. Fig. 4 C shows thepower spectrum of a 5.8 mm-diameter spherical RBCcompared to theoretical predictions using the FEM.Regarding the location of the spectral features, good agree-ment was observed between measurements and theory, andthese results were distinctly different from those observedfor the biconcave shape in any orientation (Fig. 4 B).
Biophysical Journal 105(1) 59–67
We showed in Fig. 4 that the photoacoustic powerspectrum varied depending on the RBC orientation andmorphology. For an RBC aligned horizontally, the spectrumwas fairly flat over the 150–550MHz bandwidth of the trans-ducer. In this orientation, the signal depends on the RBCthickness; for a healthy RBC, the thickness is <1 mm at thecenter. As an RBC swells, the thickness increases, whichaffects the photoacoustic signal. Fig. 5 A shows the averagepower spectrum of 21 RBCs in a horizontal orientationimmersed in PBS ranging from isotonic (294 mmol/kg) tohypotonic conditions (84 mmol/kg), where the error barsindicate the standard deviation of the averaged measure-ments. As the osmolality decreases, the RBC swells, eventu-ally forming a spherical shape below 120 mmol/kg. Atfrequencies >300 MHz, the spectral amplitude graduallydecreases as the osmolality decreases. Below 147 mmol/kg,distinct spectral minima can be observed between 300 and400 MHz, similar to those observed in Fig. 4 C. These spec-tral features indicate that the RBCs are becoming spherical(at 147 mmol/kg) or are spherical (84 and 118 mmol/kg),which was confirmed through optical imaging. Most of theRBCs at each osmolality exhibited similar spectra. All 21spectra for the 294 mmol/kg (Fig. 5 B) and 147 mmol/kg(Fig. 5 C) are shown to demonstrate the consistency betweenmeasurements.
When the ATP energy stores of RBCs are depleted, theRBCs form irregularly shaped echinocytes that have spikyprotrusions called spicules over the surface (31,32). Thisprocess is sometimes reversible depending on how theywere formed. The photoacoustic signals from echinocyteswere compared to normal RBCs. The photoacoustic powerspectrum of freshly extracted human RBCs was measuredin cell culture medium to determine the baseline spectrum.The RBCs were then immersed in PBS for 24 h to depletethe ATP to form echinocytes, and the photoacoustic powerspectrum was measured again. Immediately afterward, theRBCs were added to cell culture medium to replenish thedepleted ATP and restore the natural RBC shape. After15 min, the photoacoustic spectrum was measured. A totalof 21 RBCs were measured at each stage. Fig. 6 A showsthe power spectrum of RBCs in these three states alongwith representative images. Visually, the echinocytesappeared as an irregularly shaped spiculated cell, differingfrom the biconcave shape or induced spheres observed pre-viously. The average echinocyte spectrum appears to have aspectral shape similar to that of swollen RBCs in a hypoton-ic solution (Fig. 5 C, 147 mmol/kg), where both have aminimum around 400 MHz. However, several featuresdifferentiate the swollen RBCs from echinocytes. Thedecrease in amplitude from the spectral maximum (~200–250 MHz) to the spectral minimum (400 MHz) was abouthalf of what was observed, 15 dB for the echinocytescompared to 30 dB for the swelled RBCs. The echinocytemeasurements also had a higher standard deviation, whichcan be explained by the variations in spectral shape of
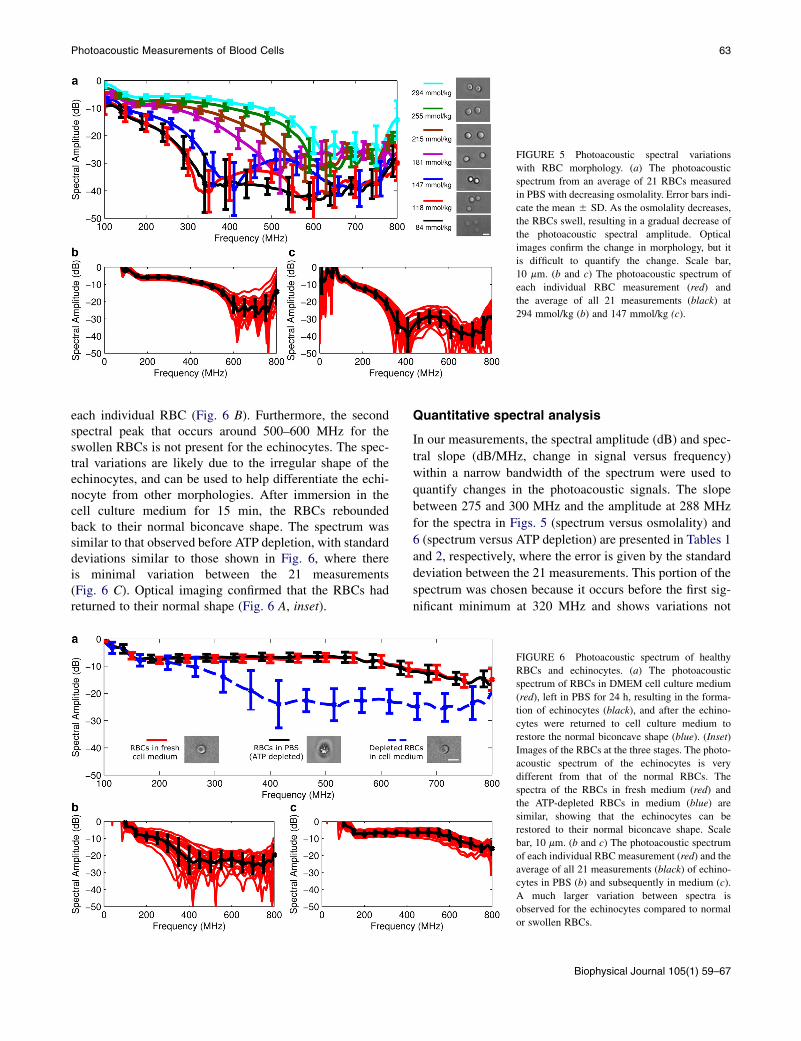
FIGURE 5 Photoacoustic spectral variations
with RBC morphology. (a) The photoacoustic
spectrum from an average of 21 RBCs measured
in PBS with decreasing osmolality. Error bars indi-
cate the mean 5 SD. As the osmolality decreases,
the RBCs swell, resulting in a gradual decrease of
the photoacoustic spectral amplitude. Optical
images confirm the change in morphology, but it
is difficult to quantify the change. Scale bar,
10 mm. (b and c) The photoacoustic spectrum of
each individual RBC measurement (red) and
the average of all 21 measurements (black) at
294 mmol/kg (b) and 147 mmol/kg (c).
Photoacoustic Measurements of Blood Cells 63
each individual RBC (Fig. 6 B). Furthermore, the secondspectral peak that occurs around 500–600 MHz for theswollen RBCs is not present for the echinocytes. The spec-tral variations are likely due to the irregular shape of theechinocytes, and can be used to help differentiate the echi-nocyte from other morphologies. After immersion in thecell culture medium for 15 min, the RBCs reboundedback to their normal biconcave shape. The spectrum wassimilar to that observed before ATP depletion, with standarddeviations similar to those shown in Fig. 6, where thereis minimal variation between the 21 measurements(Fig. 6 C). Optical imaging confirmed that the RBCs hadreturned to their normal shape (Fig. 6 A, inset).
Quantitative spectral analysis
In our measurements, the spectral amplitude (dB) and spec-
tral slope (dB/MHz, change in signal versus frequency)
within a narrow bandwidth of the spectrum were used to
quantify changes in the photoacoustic signals. The slope
between 275 and 300 MHz and the amplitude at 288 MHz
for the spectra in Figs. 5 (spectrum versus osmolality) and
6 (spectrum versus ATP depletion) are presented in Tables 1
and 2, respectively, where the error is given by the standard
deviation between the 21 measurements. This portion of the
spectrum was chosen because it occurs before the first sig-
nificant minimum at 320 MHz and shows variations not
FIGURE 6 Photoacoustic spectrum of healthy
RBCs and echinocytes. (a) The photoacoustic
spectrum of RBCs in DMEM cell culture medium
(red), left in PBS for 24 h, resulting in the forma-
tion of echinocytes (black), and after the echino-
cytes were returned to cell culture medium to
restore the normal biconcave shape (blue). (Inset)
Images of the RBCs at the three stages. The photo-
acoustic spectrum of the echinocytes is very
different from that of the normal RBCs. The
spectra of the RBCs in fresh medium (red) and
the ATP-depleted RBCs in medium (blue) are
similar, showing that the echinocytes can be
restored to their normal biconcave shape. Scale
bar, 10 mm. (b and c) The photoacoustic spectrum
of each individual RBC measurement (red) and the
average of all 21 measurements (black) of echino-
cytes in PBS (b) and subsequently in medium (c).
A much larger variation between spectra is
observed for the echinocytes compared to normal
or swollen RBCs.
Biophysical Journal 105(1) 59–67

TABLE 1 Quantitative parameters for RBCs in PBS with
varying osmolalities
Osmolality
(mmol/kg)
Spectral amplitude
at 288 MHz (dB)
Spectral slope at
275–300 MHz (dB/MHz)
294 �5.8 5 0.7 �0.006 5 0.004
255 �7.4 5 0.9 �0.009 5 0.004
215 �9.3 5 1.1 �0.022 5 0.006
181 �11.0 5 1.1 �0.042 5 0.012
147 �18.1 5 2.3 �0.112 5 0.026
118 �26.1 5 3.7 �0.217 5 0.073
84 �25.2 5 5.4 �0.176 5 0.084
Spectral amplitude and spectral slope were calculated between 275 and
300 MHz in Fig. 5 for the RBCs immersed in PBS with osmolality ranging
from 294 to 84 mmol/kg. Statistically significant differences in the spectral
amplitude and spectral slope were found between each change in osmo-
lality from 294 to 118 mmol/kg (p < 0.001), but not between 118 and
84 mmol/kg. At these two osmolalities, the RBCs were spherical and their
spectral shapes are similar.
64 Strohm et al.
observed at lower frequencies. A one-sided t-test was usedto test for statistical significance between samples. A statis-tically significant change in the spectral slope and amplitudewas observed between each change in osmolality from 294to 118 mmol/kg (p < 0.001). From 118 to 84 mmol/kg, thechange in spectral amplitude and spectral slope was not sig-nificant (p > 0.05). This was likely because the RBCs werespherical at these two osmolalities, and reducing theosmolality further had no effect. For the echinocyte datapresented in Fig. 6, a significant difference (p < 0.001) inthe spectral amplitude and slope was observed betweenRBCs that have been ATP depleted in PBS and either freshlyextracted RBCs in medium (before ATP depletion) orechinocytes after immersion in medium (to restore theATP). Comparing the differences between the freshlyextracted RBCs in medium and echinocytes in medium
TABLE 2 Quantitative parameters of healthy and abnormal
RBCs
RBC state
Spectral amplitude
at 288 MHz (dB)
Spectral slope
at 275–300 MHz
(dB/MHz)
Fresh RBCs in culture medium
(normal biconcave shape)
�7.4 5 1.3 �0.011 5 0.004
ATP-depleted RBCs in PBS
(echinocytes)
�11.7 5 4.1 �0.078 5 0.045
ATP-depleted RBCs in
culture medium (restored
biconcave shape)
�6.8 5 1.3 �0.008 5 0.003
Spectral amplitude and spectral slope were calculated between 275 and
300 MHz in Fig. 6 for fresh RBCs in DMEM, echinocytes in PBS, and
the same echinocytes redeposited in DMEM. The echinocytes were formed
by immersing fresh RBCs in PBS for 24 h. After these echinocytes were
immersed again in DMEM, they regained their normal biconcave shape.
Statistically significant differences in the spectral amplitude and slope
were observed between fresh RBCs and the echinocytes (p < 0.001). No
statistically significant difference was observed between fresh RBCs and
the depleted RBCs returned to DMEM (p > 0.05), but there was a small
difference in the spectral slope (p < 0.01).
Biophysical Journal 105(1) 59–67
(ATP was restored and the echinocytes regained theirnormal biconcave shape), the spectral amplitude was notstatistically significant (p > 0.05); however, there was asmall but statistically significant difference in the spectralslope (p < 0.01).
DISCUSSION
The morphology of blood cells has been studied exten-sively using ultrasound (33–35), but there have beenlimited studies using the closely related photoacousticsmethod. These experiments demonstrate the first quanti-tative analysis of any type using photoacoustic fre-quencies >100 MHz. The photoacoustic microscope usedin this study is capable of high-resolution imaging similarto that of other photoacoustic microscopes that use lower-frequency transducers; however, unlike other photoacousticmicroscopes, it can also be used for a broadband signalanalysis using frequency bandwidths in the hundreds ofMHz. Below 100 MHz, the photoacoustic power spectrumof cells is generally featureless and the shape or orientationof RBCs does not significantly affect the spectral shape oramplitude. As demonstrated in Figs. 3 and 4, distinctminima and maxima occur only above 100 MHz, whereshifts of hundreds of MHz with amplitude variationsof >10 dB occur as the RBC rotates. This is due to thelarge aspect ratio of the RBC. For RBCs measured verti-cally, our simulations have shown that the spectral minimaand maxima shift to lower frequencies as the RBC diam-eter increases. The diameter can be determined from thespectral features if the orientation of the particle is known.Our goal is to translate this new measurement method toan automated flow system capable of measuring thousandsof cells per second. However, there are several obstaclesthat must be overcome. For sequential scanning with thephotoacoustic microscope, the RBCs naturally align hori-zontally on the substrate, and the RBC can be viewed dur-ing the measurements for confirmation of its orientation.When translated to a flow system, RBCs could be madeto flow in a horizontal or random orientation using stand-ing waves (36) or specific flow conditions (37,38). Theanalysis methods could be improved by including a secondultrasound transducer positioned at a specific angle fromthe first transducer. This would record the photoacousticsingle from the RBC from a second position, which wouldprovide more information related to cell orientation. Pulse-echo ultrasound measurements using the same transducerscould also be combined with the photoacoustic measure-ments to help identify the cell orientation, as the ultra-sound is sensitive to cell orientation at the frequenciesused (39).
Our technique is highly sensitive to small variations inRBC morphology. A statistically significant difference(p < 0.001) in the spectral slope and amplitude wasobserved as the osmolality was decreased gradually from

Photoacoustic Measurements of Blood Cells 65
294 to 118 mmol/kg. As the osmolality decreases and theRBC morphology shifts to a spherical shape, the spectralslope and amplitude decrease at each step. The spectrumwas similar at 118 and 84 mmol/kg, and no statistical dif-ference was found in the spectral amplitude or slope. Thisis not surprising, as the RBC is spherical at these osmo-lalities. This sensitivity to RBC shape variations isunequalled by any kind of existing automated method. Inflow-cytometry analysis of RBCs, light-scattering methodscould not detect changes in cell morphology until osmo-lality was below 170 mOsm/kg, at which point the RBCshave already undergone significant swelling (40). Modernefforts have used light-scattering methods to differentiateabnormal from healthy RBC morphologies, but thesemethods require thousands of measurements and cannotdifferentiate abnormality types (41). Our photoacousticmethod is also capable of distinguishing the irregular echi-nocyte shape from other RBC morphologies. Echinocytesare generally a result of dehydration or high pH; whenseverely deformed, they are termed acanthocytes. Usuallyobserved in vitro, the prevalence in vivo is associatedwith various diseases such as liver cirrhosis and heart dis-ease, among others (42). The spectrum has a shape similarto that of nearly spherical RBCs, with a spectral minimumaround 400 MHz (Fig. 5 B, 147 mmol/kg), but the echino-cytes can be differentiated through quantitative spectralanalysis. From 200 to 400 MHz, the decrease in echino-cyte spectral amplitude was half that of the swelledRBCs, and the standard deviation was higher. Good sensi-tivity to the morphological shape was observed using asample size of just 21 RBCs. Automating the procedureto increase the counts by one or two orders of magnitudecould give even better sensitivity, and we anticipate thatwe could also differentiate other types of RBC morpholog-ical abnormalities, such as stomatocytes (spherically in-dented) and those observed in malaria infection (irregularswelling) and sickle cell disease (cigar-shaped), amongothers.
A significant application of this methodology is in thediagnosis of blood-related diseases. Deviations from theregular biconcave shape are a significant indicator of RBCpathology, whether genetic, infectious, or simply from achemical imbalance. For example, spherically shapedRBCs impede blood flow, resulting in anemia, fatigue, andsplenomegaly (43). Aggregated RBCs could also be charac-terized using this system, as the photoacoustic signalchanges depending on the type of aggregation (44). Usinga tunable light source would allow for optical spectroscopymeasurements using photoacoustics. The fact that absorp-tion of RBCs varies with optical wavelength has beenexploited to detect oxygenated/deoxygenated blood in ves-sels (45) and changes in oxygenation due to RBC aggrega-tion (46). A theoretical framework has been developedrecently to detect RBCs infected with malaria using photo-acoustics as a function of wavelength (47).
Another significant application is in the characterizationof donated blood. Blood can be stored up to 42 days, afterwhich it becomes unsuitable for transfusion. After 7 daysin storage, 23% of RBCs had abnormal shapes such asechinocytes and stomatocytes; after 42 days, this percent-age increased to 77% (48). Using older blood results indecreased transport efficiency, poor circulation, andincreasing time spent in hospital. The viability of blood isdetermined by the storage conditions and how it was pre-pared. Blood is perishable and demand is constant. Thereis extensive research devoted to improving the preservationmethods by reducing the blood degradation and prolongingits shelf life. A method to rapidly characterize the bloodmorphology and thus determine its viability does notcurrently exist and would be useful for rapidly character-izing blood both for research purposes and immediatelybefore transfusion (49).
CONCLUSION
Our experiments demonstrate that it is possible to quantifythe morphology of RBCs using high-frequency photoacous-tic spectral features with a very low sample size. Experi-mental measurements were validated with numericalsimulations using a FEM. The photoacoustic spectralmethods described are a first step toward an automated pro-cess for the detection of RBC abnormalities via morpholog-ical identification with good sensitivity. With somerefinement, these methods could eventually be used in aclinical setting to help diagnose RBC pathology using justa single drop of blood. Application of the methods presentedis not limited to characterization of RBCs; in fact, nearlyany micron-sized particle has unique spectral features above100 MHz that are strongly dependent on size, shape, andorientation, and these features can be used for particle char-acterization and/or identification. These methods arecurrently being applied to the analysis of other particles,such as biological cells and ultrasound/photoacousticcontrast agents (18,20).
SUPPORTING MATERIAL
One movie is available at http://www.biophysj.org/biophysj/supplemental/
S0006-3495(13)00624-3.
The authors acknowledge helpful discussions and technical support from
Eno Hysi and Arthur Worthington (Ryerson University, Toronto, Canada),
Eike Weiss, Wolfgang Bost, and Robert Lemor (Kibero/Fraunhofer Insti-
tute, Saarbrucken, Germany), and Gregory Czarnota (Sunnybrook Health
Sciences Center, Toronto, Canada) for scientific input. The authors thank
David Dubins (University of Toronto) for his assistance in measuring the
osmolality of our solutions.
E. Strohm is supported through a Natural Sciences and Engineering
Research Council doctoral fellowship. This research was undertaken, in
part, thanks to funding from the Natural Sciences and Engineering Research
Council of Canada (216986-2012), the Canadian Institutes of Health
Research (CCI 1117964), and the Canada Research Chairs Program
Biophysical Journal 105(1) 59–67
66 Strohm et al.
awarded to M. Kolios. Funding to purchase the equipment was provided by
the Canada Foundation for Innovation, the Ontario Ministry of Research
and Innovation, and Ryerson University.
REFERENCES
1. Wintrobe, M. M., J. P. Greer, and G. R. Lee. 2009. Wintrobe’s ClinicalHematology. Lippincott Williams & Wilkins,, Philadelphia.
2. Chien, S. 1987. Red cell deformability and its relevance to blood flow.Annu. Rev. Physiol. 49:177–192.
3. Fung, Y. C. 1993. Biomechanics: Mechanical Properties of LivingTissues, Second Edition. Springer, New York.
4. Canham, P. B., and A. C. Burton. 1968. Distribution of size and shapein populations of normal human red cells. Circ. Res. 22:405–422.
5. Park, Y., M. Diez-Silva, ., S. Suresh. 2008. Refractive indexmaps and membrane dynamics of human red blood cells parasitizedby Plasmodium falciparum. Proc. Natl. Acad. Sci. USA. 105:13730–13735.
6. Xu, M., and L. V. Wang. 2006. Photoacoustic imaging in biomedicine.Rev. Sci. Instrum. 77: 041101–041101–22.
7. Wang, L. V. 2009. Multiscale photoacoustic microscopy and computedtomography. Nat. Photonics. 3:503–509.
8. Wang, X., Y. Pang, ., L. V. Wang. 2003. Noninvasive laser-inducedphotoacoustic tomography for structural and functional in vivo imagingof the brain. Nat. Biotechnol. 21:803–806.
9. Wang, L. V., and S. Hu. 2012. Photoacoustic tomography: in vivoimaging from organelles to organs. Science. 335:1458–1462.
10. Zhang, H. F., K. Maslov,., L. V. Wang. 2006. Functional photoacous-tic microscopy for high-resolution and noninvasive in vivo imaging.Nat. Biotechnol. 24:848–851.
11. Kolkman, R. G. M., E. Hondebrink, ., F. F. M. de Mul. 2003.In vivo photoacoustic imaging of blood vessels using an extreme-narrow aperture sensor. IEEE J. Sel. Top. Quantum Electron.9:343–346.
12. Beard, P. 2011. Biomedical photoacoustic imaging. Interface Focus.1:602–631.
13. Ku, G., K. Maslov, ., L. V. Wang. 2010. Photoacousticmicroscopy with 2-microm transverse resolution. J. Biomed. Opt.15:021302.
14. Zhang, C., K. Maslov, and L. V. Wang. 2010. Subwavelength-resolu-tion label-free photoacoustic microscopy of optical absorption in vivo.Opt. Lett. 35:3195–3197.
15. Maslov, K., H. F. Zhang,., L. V. Wang. 2008. Optical-resolution pho-toacoustic microscopy for in vivo imaging of single capillaries. Opt.Lett. 33:929–931.
16. Yao, D.-K., R. Chen, ., L. V. Wang. 2012. Optimal ultraviolet wave-length for in vivo photoacoustic imaging of cell nuclei. J. Biomed. Opt.17:056004–056007.
17. Bost, W., F. Stracke,., R. Lemor. 2009. Developing a high-resolutionphotoacoustic microscopy platform. Proc. 4th Eur. Conf. Int. Fed. Med.Biol. Eng. 22:448–451.
18. Strohm, E. M., M. Rui,., M. Kolios. 2011. Vaporization of perfluoro-carbon droplets using optical irradiation. Biomed. Opt. Express.2:1432–1442.
19. Rui, M., S. Narashimhan,., M. C. Kolios. 2010. Gigahertz optoacous-tic imaging for cellular imaging. Proc. SPIE. 7564:756411.
20. Strohm, E. M., I. Gorelikov,., M. C. Kolios. 2012. Acoustic and pho-toacoustic characterization of micron-sized perfluorocarbon emulsions.J. Biomed. Opt. 17:96016.
21. Diebold, G. J., M. I. Khan, and S. M. Park. 1990. Photoacoustic ‘‘sig-natures’’ of particulate matter: optical production of acoustic monopoleradiation. Science. 250:101–104.
Biophysical Journal 105(1) 59–67
22. Baddour, R. E., M. D. Sherar, ., M. C. Kolios. 2005. High-frequencyultrasound scattering from microspheres and single cells. J. Acoust.Soc. Am. 117:934–943.
23. Strohm, E. M., G. J. Czarnota, and M. C. Kolios. 2010.Quantitative measurements of apoptotic cell properties using acousticmicroscopy. IEEE Trans. Ultrason. Ferroelectr. Freq. Control.57:2293–2304.
24. Evans, E., and Y.-C. Fung. 1972. Improved measurements of the eryth-rocyte geometry. Microvasc. Res. 4:335–347.
25. Grover, W. H., A. K. Bryan,., S. R. Manalis. 2011. Measuring single-cell density. Proc. Natl. Acad. Sci. USA. 108:10992–10996.
26. Godin, M., A. K. Bryan, ., S. R. Manalis. 2007. Measuring the mass,density, and size of particles and cells using a suspended microchannelresonator. Appl. Phys. Lett. 91: 123121–123121–3.
27. Dukhin, A. S., P. J. Goetz, and T. G. M. van de Ven. 2006. Ultra-sonic characterization of proteins and blood cells. Colloids Surf. BBiointerfaces. 53:121–126.
28. Mohamed, E. T. A., A. E. Kamanyi, ., W. Grill. 2012. Age-dependent acoustic and microelastic properties of red blood cellsdetermined by vector contrast acoustic microscopy. Microsc. Micro-anal. 18:436–444.
29. Strohm, E. M., E. Hysi, and M. C. Kolios. 2012. Photoacoustic mea-surements of single red blood cells. Proc. IEEE Int. UltrasonicsSymp. Dresden. 1406–1409.
30. Canham, P. B. 1970. The minimum energy of bending as a possibleexplanation of the biconcave shape of the human red blood cell.J. Theor. Biol. 26:61–81.
31. Reinhart, W. H., and S. Chien. 1986. Red cell rheology in stomatocyte-echinocyte transformation: roles of cell geometry and cell shape.Blood. 67:1110–1118.
32. Gov, N. S., and S. A. Safran. 2005. Red blood cell membrane fluctua-tions and shape controlled by ATP-induced cytoskeletal defects.Biophys. J. 88:1859–1874.
33. Shung, K. K., R. A. Sigelmann, and J. M. Reid. 1976. Scattering ofultrasound by blood. IEEE Trans. Biomed. Eng. 23:460–467.
34. Cloutier, G., and Z. Qin. 1997. Ultrasound backscattering from non-aggregating and aggregating erythrocytes—a review. Biorheology.34:443–470.
35. Fontaine, I., M. Bertrand, and G. Cloutier. 1999. A system-basedapproach to modeling the ultrasound signal backscattered by red bloodcells. Biophys. J. 77:2387–2399.
36. Coakley, W. T., D. W. Bardsley, ., D. J. Clarke. 1989. Cell manipula-tion in ultrasonic standing wave fields. J. Chem. Technol. Biotechnol.44:43–62.
37. Kachel, V., E. Kordwig, and E. Glossner. 1977. Uniform lateral orien-tation, caused by flow forces, of flat particles in flow-through systems.J. Histochem. Cytochem. 25:774–780.
38. Dupire, J., M. Socol, and A. Viallat. 2012. Full dynamics of a red bloodcell in shear flow. Proc. Natl. Acad. Sci. USA. 109:20808–20813.
39. Baddour, R. E. 2004. High frequency ultrasound scattering frommicro-spheres and single cells [microform]. Thesis (M.Sc.), University ofToronto, Toronto.
40. Gutowski, K. A., J. L. Hudson, and D. Aminoff. 1991. Flow cytometricanalysis of human erythrocytes: I. Probed with lectins and immuno-globulins. Exp. Gerontol. 26:315–326.
41. Piagnerelli, M., K. Zouaoui Boudjeltia, ., M. Vanhaeverbeek. 2007.Assessment of erythrocyte shape by flow cytometry techniques.J. Clin. Pathol. 60:549–554.
42. Brecher, G., and M. Bessis. 1972. Present status of spiculed red cellsand their relationship to the discocyte-echinocyte transformation: acritical review. Blood. 40:333–344.
43. Perrotta, S., P. G. Gallagher, and N. Mohandas. 2008. Hereditary spher-ocytosis. Lancet. 372:1411–1426.

Photoacoustic Measurements of Blood Cells 67
44. Hysi, E., R. K. Saha, andM. C. Kolios. 2012. On the use of photoacous-tics to detect red blood cell aggregation. Biomed. Opt. Express. 3:2326–2338.
45. Zhang, H. F., K. Maslov,., L. V. Wang. 2007. Imaging of hemoglobinoxygen saturation variations in single vessels in vivo using photoacous-tic microscopy. Appl. Phys. Lett. 90:053901.
46. Hysi, E., R. K. Saha, and M. C. Kolios. 2012. Photoacoustic ultrasoundspectroscopy for assessing red blood cell aggregation and oxygenation.J. Biomed. Opt. 17:125006.
47. Saha, R. K., S. Karmakar, and M. Roy. 2012. Computational investiga-tion on the photoacoustics of malaria infected red blood cells. PLoSONE. 7:e51774.
48. Blasi, B., A. D’Alessandro, ., L. Zolla. 2012. Red blood cell storageand cell morphology. Transfus. Med. 22:90–96.
49. Scott, K. L., J. Lecak, and J. P. Acker. 2005. Biopreservation ofred blood cells: past, present, and future. Transfus. Med. Rev.19:127–142.
Biophysical Journal 105(1) 59–67