productivity and profit calculator user manual
TRANSCRIPT

1 | P a g e
Productivity and Profit Calculator User Manual
Introduction The Productivity and Profit Calculator was developed in response to dentists’ concerns about the potential negative effects of training and deployment of allied providers on their businesses. The calculator is an economic tool that enables dentists and policy makers to simulate the impacts of adding allied providers in the context of real-world dental practices. The model gauges the direction and magnitude of the gain or loss to earnings (pre-tax) and productivity associated with hiring allied providers.
The calculator and the scenarios in the Pew report It Takes a Team were developed by Scott & Company, Inc., in consultation with an advisory panel of private practice dentists, who offered input on the assumptions regarding the procedures included in the model, the time required to perform each procedure and the costs related to operating a dental practice (e.g., wages, supplies and capital expenditures). For some variables (e.g., average fees), information was validated using national data sources such as the American Dental Association’s Survey of Dental Practice. The “Methodology” section of the report contains additional information regarding data sources for the calculator.
Policy makers, dental practices and other users should not rely on the Productivity and Profit Calculator as a formal business planning tool or as a substitute for tax, legal, accounting or other professional guidance as such advice requires case-by-case consideration of individual circumstances.
This user guide explains how to adjust variables in five of the six Excel spreadsheet tabs to perform the simulation of adding allied providers and to account for local conditions that may differ from the default values. The output tab also is described.
Table of Contents Tab: Introduction The Table of Contents tab (see Figure 1) provides a brief description of the tabs included in the model.

2 | P a g e
Figure 1
Tab 1: Procedures, Times, Fees There are two steps or tables that comprise Tab 1; these tables calculate the time needed for each procedure preformed and the average fee for each procedure.
Step 1: Define Scope and Time per Procedure The first table in Tab 1 allows the user to define the dental procedures that each provider can perform by inputting the procedure’s average amount of time, in minutes. Eight dental procedure categories, based on the American Dental Association’s Current Dental Terminology code set, plus a ninth, “Other” category are presented (see Figure 2). Several representative procedures are included in each category. Columns E through I identify the type of staff member who may perform each of these tasks.
The model was developed with default settings for all variables that are based on the recommendations of the project’s advisory panel. For Table 1 (Figure 2) these include the red and green cells. The time needed for each procedure is entered in minutes and will appear in green indicating that the procedure is in scope and being considered. If staff do not perform or are not authorized to perform a specific procedure or set of procedures, the user enters a zero and the cell will be highlighted in red. To change a time, simply place the cursor over the cell, enter the new value and press Enter.
For example, a Registered Dental Hygienist with a zero in the cell labeled “oral evaluations” means that a hygienist cannot perform oral evaluations and will not be spending any time performing them. When a zero is entered the cell automatically turns red so the user knows the procedure in question is not being considered in the allied practitioner’s scope and will not be calculated in the model.

3 | P a g e
Figure 2
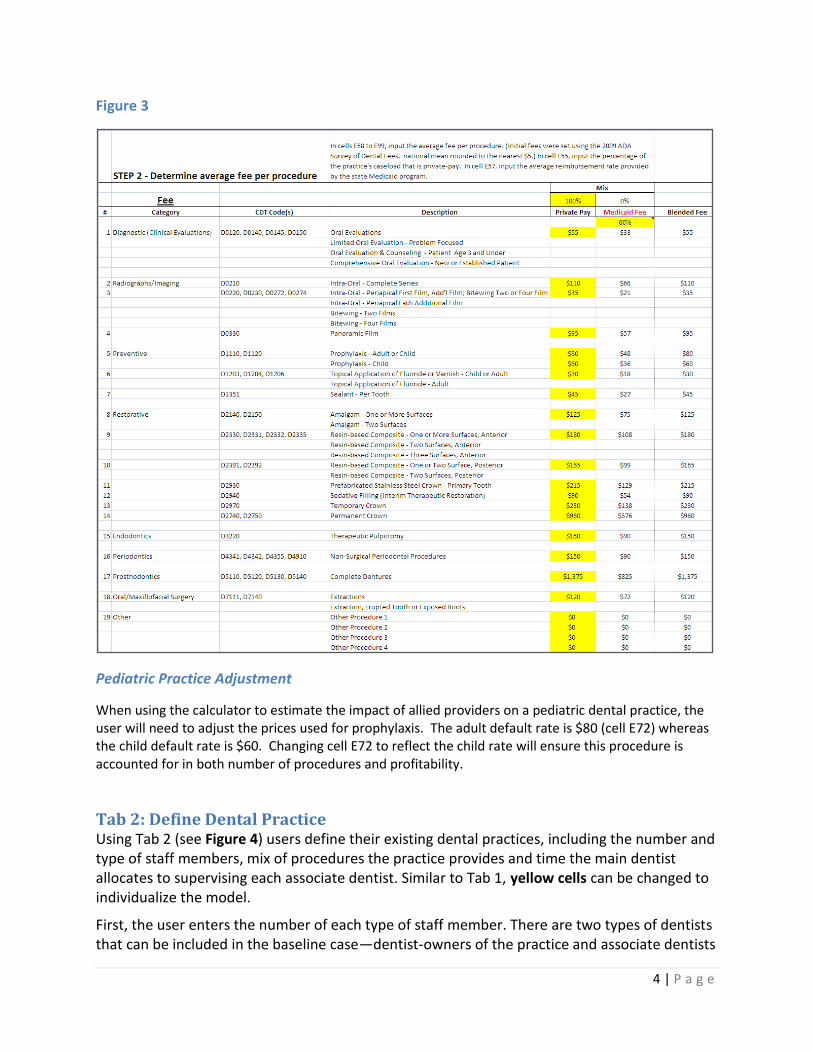
Step 2: Determine Average Fee per Procedure The second table in Tab 1 (see Figure 3) allows the user to define private insurer fees and Medicaid fees, or a combination of the two.
To change the fees per procedure, a user may simply change the cells highlighted in yellow located under Private Pay (column E, rows 60 to 101). Fees are shown in U.S. dollars.
To change the Medicaid fee, change cell F57 (Medicaid Fee) to any percentage of the private insurance fee. For example, a value of 60 percent in cell F59 means the Medicaid fee is 60 percent of the private fee. So, if the private fee is $100, the Medicaid fee will be 60 percent of that, or $60.
Changing cell E57 allows the user to have a mix of various payment populations, essentially changing the mix between private insured and Medicaid-enrolled patients. For example, a value of 80 percent in cell E57 would mean that 80 percent of the practice’s revenue will come from private insurance payments, with the remainder coming from Medicaid reimbursements.
4 | P a g e
Figure 3
Pediatric Practice Adjustment
When using the calculator to estimate the impact of allied providers on a pediatric dental practice, the user will need to adjust the prices used for prophylaxis. The adult default rate is $80 (cell E72) whereas the child default rate is $60. Changing cell E72 to reflect the child rate will ensure this procedure is accounted for in both number of procedures and profitability.
Tab 2: Define Dental Practice Using Tab 2 (see Figure 4) users define their existing dental practices, including the number and type of staff members, mix of procedures the practice provides and time the main dentist allocates to supervising each associate dentist. Similar to Tab 1, yellow cells can be changed to individualize the model.
First, the user enters the number of each type of staff member. There are two types of dentists that can be included in the baseline case—dentist-owners of the practice and associate dentists

5 | P a g e
who are employed by the practice. (The main difference between the two types is in the calculation of wages—associate dentists are assumed to be paid 30 percent of the fees they produce).
The user then defines the percentage of time each dentist is providing patient care each day. This utilization rate (column C) for the dentist initially is set at 90 percent (based on 244 working days per year at 6.12 hours a day, allowing for lunch, breaks, and other administrative tasks), and the user can change the rate by entering an amount greater or less than 90 percent.
Note: The calculator automatically adds two dental assistants per dentist. Users can add additional front or back office support staff, if desired. For the solo pediatric and solo general dental practice scenarios, 2 front/back office staff were used. For the small group scenario, 3 front/back office staff were used.
Second, the user customizes the model to the clinical services provided by the individual practice by assigning a percentage of the practice’s time to each of the nine procedure categories (columns A and B, rows 15 to 23). The procedure categories are: Diagnostic, Radiographs/Imaging, Preventive, Restorative, Endodontics, Periodontics, Prosthodontics, Oral/Maxillofacial Surgery, and Other. The percentages for each of these categories must add up to 100 percent.
Finally, supervision time (column B, row 28) is the amount of time, in minutes per day, the dentist spends providing guidance to and reviewing the work of associate dentists. Note: Time spent supervising cannot be counted toward direct patient care for the supervising dentist.
Figure 4

6 | P a g e
Tab 3: Define Allied Practitioner(s) Tab 3 (see Figure 5) is identical to Tab 2 with the exception of allowing the user to add one or more allied providers who work alongside the dentists. The user can add three types of allied providers to the practice: Dental Therapist, Hygienist-Therapist or Registered Dental Hygienist.
Dental Therapist—Performs a limited set of preventive and restorative services
Hygienist-Therapist—Performs a larger range, compared with a Dental Therapist, of restorative and preventive services
Registered Dental Hygienist—Performs preventive procedures
Similar to Tab 2, the user can manipulate any of the yellow cells but will likely focus on adding the additional allied practitioners, their utilization rates and, finally, their supervision time. See the description in Tab 2 for more details.
Note: If adding more than two allied practitioners, a user may wish to increase the size of the practice and/or number of operatories in Tab 5: Cost Tab.
Figure 5
7 | P a g e
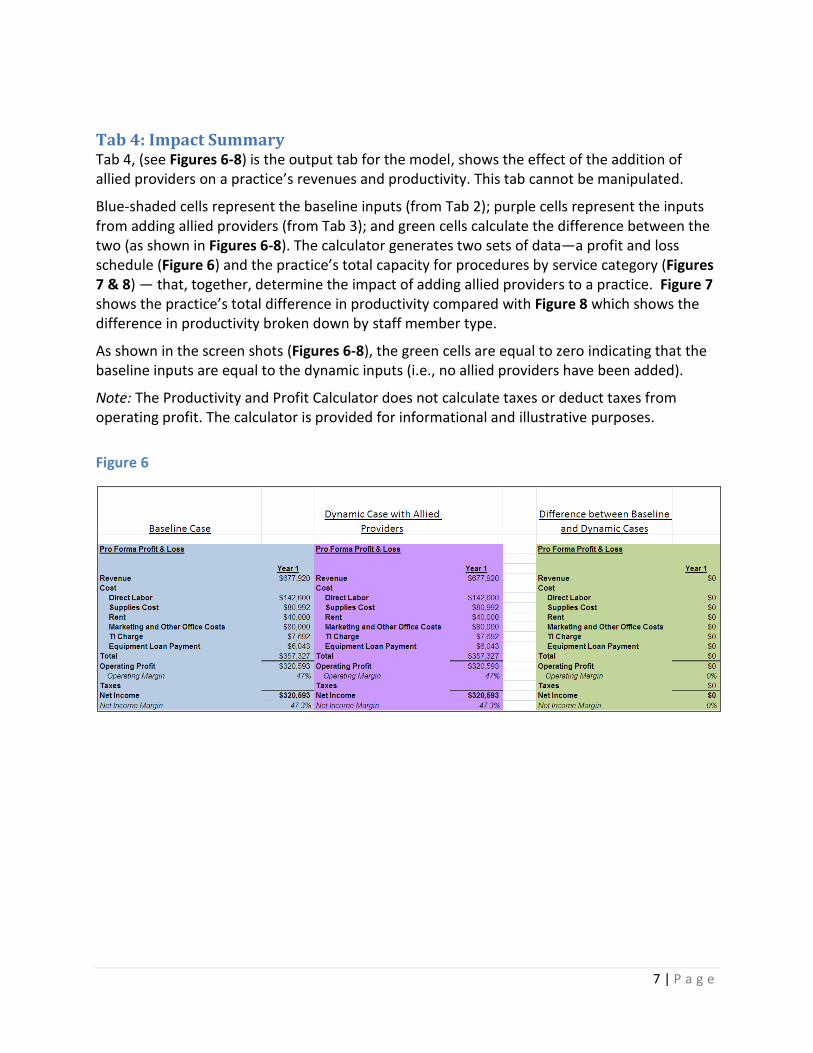
Tab 4: Impact Summary Tab 4, (see Figures 6-8) is the output tab for the model, shows the effect of the addition of allied providers on a practice’s revenues and productivity. This tab cannot be manipulated.
Blue-shaded cells represent the baseline inputs (from Tab 2); purple cells represent the inputs from adding allied providers (from Tab 3); and green cells calculate the difference between the two (as shown in Figures 6-8). The calculator generates two sets of data—a profit and loss schedule (Figure 6) and the practice’s total capacity for procedures by service category (Figures 7 & 8) — that, together, determine the impact of adding allied providers to a practice. Figure 7 shows the practice’s total difference in productivity compared with Figure 8 which shows the difference in productivity broken down by staff member type.
As shown in the screen shots (Figures 6-8), the green cells are equal to zero indicating that the baseline inputs are equal to the dynamic inputs (i.e., no allied providers have been added).
Note: The Productivity and Profit Calculator does not calculate taxes or deduct taxes from operating profit. The calculator is provided for informational and illustrative purposes.
Figure 6

8 | P a g e
Figure 7
Figure 8

9 | P a g e
Tab 5: Cost Tab 5 includes capital and operating expenses that can be adjusted, if desired. A user can refine a practice’s cost structure by adjusting the default values for rent, lease improvements, equipment depreciation, marketing, supplies and other overhead costs. This tab also allows users to adjust wage and salary information. Only yellow cells can be adjusted.
If a user changes the number of operatories, the equipment changes correspondingly to ensure each operatory has the appropriate equipment. If a user increases the square footage of the practice, the costs for rent and tenant improvements will rise. For example, Scenarios 1 and 2 are each based on a 2,000-square-foot practice with four operatories. Scenario 3 is based on a 4,000-square-foot practice with eight operatories. When creating Scenario 3 (small group practice) the user must manually adjust the number of operatories to 8 and the space to 4,000 square feet.
Equipment and tenant improvements are amortized, and a user can select the interest rate and the length of the loan or amortization.
Note: Default salaries and benefit loads are based on national data from the Bureau of Labor Statistics and also on recommendations from an advisory panel of dental practitioners. Users are encouraged to input values that reflect local costs.
Tab 6: Assumptions This tab (see Figure 9) contains the number of days and hours per year that the practice is in operation, as well as the percentage of time during the day that is unavailable for clinical care due to lunch and breaks (referred to as “shrinkage”). The user can adjust the number of holidays, days closed for weekends, hours of operation and percentage of "shrinkage." Only yellow cells can be adjusted.
Figure 9