professor aloke (al) ghosh presents at hec business school
TRANSCRIPT

Managerial Exposure to Losses
Aloke (Al) Ghosh Stan Ross Department of Accountancy
Baruch College, The City University of New York Box B12-225, One Bernard Baruch Way
New York, NY 10010 e-mail: [email protected]
and
Doocheol Moon School of Business Yonsei University
Seoul, Korea e-mail: [email protected]
November 2010
Managerial Exposure to Losses 1. Introduction
In a recent study, Roychowdhury (2006) provides persuasive evidence consistent with
the premise that managers manipulate operating (‘real’) activities to avoid reporting losses. By
deviating from normal operations, managers avoid reporting losses through cash flow from
operations. Similarly, the discontinuity in the frequency of firm-years around zero earnings (e.g.,
Hayn 1995, Burgstahler and Dichev 1997) is widely cited as evidence of earnings management
to avoid reporting losses.1 In a related survey, Graham et al. (2005) conclude that executives
prefer not to report losses by manipulating earnings even when such activities might erode firm
value. But why are Chief Executive Officers (CEOs) so keen to avoid reporting losses?
Some popular explanations for earnings management include bonus compensation and
capital market consequences (e.g., Hayn 1995, Dechow and Sloan 1991). However, changes in
bonus compensation are unlikely to be large because managers report small profits rather than
losses. Similarly, because stock market response to losses is muted (e.g., Joos and Plesko
2005, Hayn 1995), managers are unlikely to be concerned about capital market penalties from
reporting losses. In this study, we investigate an alternative explanation that is more directly
associated with the CEO’s personal exposure to losses, job security. In particular, we examine
whether losses lead to higher CEO turnover.
The decision to replace a CEO is probably one of the most important decisions made by
the board of directors with long-term implications for a firms’ investment, operating and financing
decisions (Huson et al. 2001). CEO turnover was around 10% per year during the 1970s and
1980s and 11% in the 1990s (Murphy and Zabonjik 2004). However, between 1992 and 2005,
annual CEO turnover jumped to 15%. In the more recent years since 1998, CEO turnover is
1The claims of earnings management based on observed discontinuities in firm-year distributions
are controversial. For instance, Durtschi and Easton (2005) attribute the discontinuities in firm-year distributions to deflation and sample selection criteria. Similarly, Dechow et al. (2003) are unable to document evidence consistent with firms using accounting accruals to report small profits.
2
around 16.5% implying that the average CEO tenure is just over six years (Kaplan and Minton
2006). More important, while prior studies find modest relationship between turnover and firm
performance (Murphy 1999, Murphy and Zimmerman 1993), Kaplan and Minton (2006) find that
the CEO turnover-performance relationship is much stronger for the recent years which
suggests that boards have become more sensitive to firm performance and are acting decisively
in response to poor performance. Overall, the results suggest that the CEO’s job is more
precarious than thought previously.
Prior studies examining the relationship between CEO turnover and firm performance
tend to use either accounting measures (e.g., operating income, income from continuing
operations, net income) or/and stock price measures (e.g., stock returns, industry adjusted
stock returns) of performance. Our fundamental hypothesis is that losses capture an
independent assessment of the CEO’s ability that is not fully captured in the traditional
accounting and market-based performance measures. In addition to reflecting poor or declining
performance, losses are one of the ultimate indicators of management failure. Therefore, boards
are more likely to closely scrutinize CEO tenure considerations for loss firms. Boards might also
be concerned that their reputation as the ultimate monitors of management might be tarnished if
they do not hold CEOs accountable for losses, which erodes shareholder equity. Finally,
because annual losses frequently trigger concurrent and future dividend omissions and
reductions (DeAngelo et al. 1992), which are important shareholder considerations, it might be
easier for boards to justify firing a CEO when firms report losses.
Based on a comprehensive sample of CEO turnovers between 1997 and 2005, we find a
statistically and economically significant relationship between CEO turnover and accounting
losses. Controlling for the other determinants of CEO turnover including market and accounting
measures of performance, volatility, industry concentration, firm size, growth, restructuring
activities, financial restatements, and CEO age, we find that CEOs reporting losses are more
likely to lose their jobs within the two-year period following losses, including the year of the loss,
3
compared to profit firms. The economic magnitude of the estimates is also large. Holding the
other variables at the mean values, we find that the probability of a CEO losing a job within two
years of reporting a loss is about 52% higher than firms reporting profits. Additionally, our
results suggest that boards typically tend to focus on the bottom line number; CEOs are held
accountable for losses when a loss includes core, non-core, and discontinued operations and
not just core operations.
Prior studies document that sustained earnings growth is rewarded by debt and equity
markets because of better performance and superior managerial ability (Elliott et al. 2010,
Ghosh et al. 2005, Barth et al. 1999). Similar to the studies examining the rewards from
sustained growth for positive earnings, we analyze whether sustained losses impact CEO
turnover by including five indicator variables measuring consecutive annual losses from years
one to five. We observe that the relationship between CEO turnover and losses is the strongest
when a firm reports a loss for the current year. Controlling for the current period loss, CEOs are
more likely to be dismissed when a firm reports two consecutive annual losses. However, losses
sustained over three or more years do not increase the chances of a CEO turnover. These
results suggest that boards play a proactive role in holding management responsible for poor
performance and that they do not allow matters to worsen before firing the incumbent CEO.
Our analyses assume that accounting loss is a pre-determined variable. However,
because prior research suggests that accounting loss might be endogenously determined (Klein
and Marquardt 2006, Joos and Plesko 2005), the regression estimates from a logistic
regression of CEO turnover on an indicator variable for accounting losses might be biased and
inconsistent. We overcome the endogeneity problem using a two-stage least squares estimation
procedure. Drawing on prior studies, in the first stage we model the likelihood of a firm reporting
an annual loss. In the second stage, we use the estimated value of the likelihood of a loss as an
instrumental variable in the CEO turnover regressions. After controlling for endogeneity of
4

accounting losses, we continue to find unusually high frequency of CEO turnover for firms
reporting losses.
Prior studies find that the stock market views the appointment of an outsider CEO more
favorably than the appointment of an insider CEO, especially when the incumbent CEO is
forced to resign because of performance related reasons (e.g., Borokhovich et al. 1996).
Therefore, we also examine whether losses increase the likelihood that the board hires an
outsider to replace the incumbent CEO to send a credible signal to investors. We find that
losses lead to more frequent appointments of CEOs from outside the firm.
The rest of the paper is organized as follows. Section 2 develops the hypotheses,
Section 3 outlines our research design to test our hypotheses, and Section 4 describes the
sample selection procedure and the data. Section 5 reports the empirical results, Section 6
discusses sensitivity analyses, and finally Section 7 concludes the paper.
2. Hypothesis Development
Annual reports, news releases and press coverages often reference the importance of
consistently making profits which suggests that management has incentives to avoid reporting
losses. In a survey and interview of 400 key executives directly involved in the financial
reporting process, Graham et al. (2005) find that 65% of the executives prefer to report a profit
rather than a loss. Consistent with the loss-avoidance conjecture, Burgstahler and Dichev
(1997) find evidence of earnings management to avoid reporting losses.2 In a subsequent
study, Roychowdhury (2006) provides direct evidence of management using real activities to
avoid reporting losses.
2Earnings management could include a broad range of actions that affect earnings through
operating, investing and financing decisions or through pure accounting choices. Roychowdhury (2006) finds that firms avoid losses by offering price discounts to temporarily increase sales, by increasing production temporarily to decrease the cost of goods sold, and by reducing discretionary expenditures aggressively to improve operating margins.
5
Why are CEOs so concerned about reporting accounting losses and why would they go
to such lengths to manage earnings so as not to report losses? In the subsequent sub-section,
we hypothesize that the primary reason for CEOs avoiding losses is related to career concerns.
Anecdotal evidence supports this conjecture. For example, Jacques Aigrain, the CEO of Swiss
Re, was dismissed following the announcement of an annual loss in 2009.
Losses and Career Concerns
Management in publicly held corporations is entrusted with the task of running a
business to generate profits for shareholders. Graham et al. (2005) find that three-fourths of the
survey respondents believe that their inability to avoid losses is seen as a “managerial failure”
by the executive labor market and by corporate boards. According to one of the surveyed
executives, “if I miss the target, I am out of a job.” One such target includes avoiding losses;
failure to report a profit may be seen as a sign of an incompetent executive. Similarly, Watts
(2003) claims that “managers have incentives to hide losses to avoid being fired before their
tenure is over” because admitting to losses could indicate that they invested in negative net
present value projects.
The board of directors is primarily charged with the responsibility of monitoring,
evaluating, and rewarding management and ultimately firing a CEO for poor performance.
Board members asses the ability of the CEO based on reported numbers and inside
information. When a firm reports a loss rather than a profit, it acts as a heuristic for ultimate
failure (Pinnuck and Lillis 2007). Accounting losses are a signal that the underlying business
model has failed under the present leadership.
When firms report losses, the board is expected to become more proactive in finding out
the reasons for losses and ultimately taking the decision to dismiss the CEO for several
reasons. First, shareholders might expect the board to dismiss the CEO when a firm reports a
loss because of erosion in equity value and the board might be acting to placate shareholders
(Watts 2003). Second, boards have no assurance that CEOs would change their business
6
strategy following losses, which suggests that current losses might persist into the future. For
instance, instead of abandoning loss-making projects, CEOs may continue to operate their pet
projects by subsidizing the losses with the profits from other segments. Similarly, entrenched
and powerful CEOs may be unwilling to discontinue projects with losses either because they are
reluctant to acknowledge their mistakes or because of some personal benefits from managing a
larger firm. Third, a newly appointed CEO is more likely to perform an objective and critical
review of the firm’s business operations, to shut down poorly performing divisions, and to
consider new strategies that allow the firm to become profitable again than an incumbent CEO
who might have strong preferences about his/her prior investments. In summary, a testable
hypothesis is that CEO turnover is higher following accounting losses.
Our hypothesis has broader implications. Several valuation studies find that the relation
between returns and earnings is weaker for loss firms than for profit firms (Collins et al. 1999,
Burgstahler and Dichev 1997, Hayn 1995). The “liquidation/abandonment option” to redeploy
existing assets is often used as an explanation for the differential results between firm values
and earnings for profit and loss firms. Assuming that CEOs are willing to liquidate a firm or to
discontinue a segment, when losses are expected to perpetuate, investors perceive losses as
being temporary. Therefore, the stock market reaction to losses is muted.
However, in the presence of agency problems, it is less clear why CEOs might be willing
to exercise the liquidation/abandonment option when losses are expected to continue. For
example, Ofek (1993) finds that entrenched managers are reluctant to discontinue operations
even when a firm is distressed. In general, prior studies do not directly address or specify what
mechanisms ensure that even entrenched CEOs, or CEOs keen to build empires through value
reducing acquisitions would liquidate or abandon a loss-making operation if losses are expected
to continue.
Our study suggests that personal career concerns and higher frequency of CEO
turnover following reporting of accounting losses ensure that the liquidation or abandonment
7
option is not delayed. If the incumbent CEO is dismissed by the board because the firm reported
a loss, the successor CEO has no reasons to delay liquidating a division or reversing a strategy
implemented by his/her predecessor. When a CEO is retained by the board despite reporting a
loss, the incumbent CEO is as keen as a new CEO to exercise the liquidation/abandonment
option because he/she is conscious that not doing so is likely to result in a dismissal by the
board.
3. Research Design
We test the relationship between CEO turnover and accounting losses using the
following logistic regression.
Turnover = β0+ β1Loss + β2Market-return + β3Asset-return + β4ΔEarnings + β5Stock-volatility + β6Earnings-volatility + β7Concentration + β8Size + β9Growth + β10Restructure + β11Restatement + β12Age + Industry/Year Fixed effects + ε (1)
Where Turnover is an indicator variable that equals 1 when there is a change in the CEO in the
current or subsequent year and 0 otherwise. Our main independent variable is Loss, which is
also an indicator variable with a value of 1 when net income is negative for the current year and
0 otherwise. The predicted sign of the coefficient on Loss is positive; CEO turnover for firms with
losses is expected to be higher than firms with profits.
We include the following control variables which are measured one year prior to the year
of the CEO turnover. Market-return is the difference between the raw returns and the value-
weighted CRSP market returns over a twelve-month fiscal period. Asset-return is industry-
adjusted return on assets measured as the difference between the firm-specific and the
industry-median income before extraordinary items deflated by total assets at the beginning of
the year. ΔEarnings is the difference between current period earnings before extraordinary
items and the corresponding number in the prior year deflated by market value of equity at the
beginning of the year. Stock-volatility is the standard deviation of Market-return based on prior
twenty-four monthly returns. Earnings-volatility is the standard deviation of Asset-return over the
8
previous five years. Concentration is the industry level Herfindahl index. Size is the logarithmic
transformation of the fiscal year-end market value of equity. Growth is the sum of the market
value of equity and the book value of debt scaled by the book value of total assets. Restructure
is an indicator variable that equals 1 if special items as a percentage of total assets is less than
or equal to -5 percent and 0 otherwise. Restatement is an indicator variable equal to 1 when a
firm restates its financial statement in the current or prior year and 0 otherwise. Age is an
indicator variable equal to 1 when the CEO is over the age of 60 years and 0 otherwise.
We include one market and two accounting measures of performance (Market-return,
Asset-return, ΔEarnings) because prior studies find that CEO turnover is related poor
performance (e.g., Farrell and Whidbee 2003, DeFond and Park 1999, Murphy and Zimmerman
1993, Weisbach 1988). We include two measures of volatility, one market (Stock-volatility) and
another accounting (Earnings-volatility) because firms with higher volatility are more prone to
severe shocks that lead to more frequent CEO turnovers (Engel et al. 2003, DeFond and Park
1999). We control for industry concentration because CEO turnover is greater in highly
concentrated industries than in less concentrated industries (DeFond and Park 1999). We
control for firm size (Size) and investment opportunity (Growth) because larger firms and
growing firms have a greater demand for high quality CEOs (Smith and Watts 1992). We
include indicator variables for restructuring activities (Restructure) and financial restatements
(Restatement) because firms with structural or reporting problems are more likely to be
associated with CEO turnovers (Desai et al. 2006, Pourciau 1993). Because not all CEO
turnovers are performance related, as in DeFond and Park (1999), we include an indicator
variable for CEOs who are 60 years or older (Age). Finally, we include fixed effects for years
and industry to control for variations in CEO turnover over time and across industries.
We also estimate an augmented equation that includes several governance variables in
addition to those control variables already included in Equation (1) because prior studies find
9

that CEO turnover is associated with board characteristics (e.g., Weisbach 1988, Goyal and
Park 2002). Specially, we include the number of directors on the board (Board-size), the
percentage of independent directors on the board (Board-independence), indicator variables
when the CEO is also the board chair (CEO-duality) and when a firm has separate audit,
nominating, and compensation committees (Separate-committees), and the percentage of
common stock held by the five top executives (Ownership).
4. Data and Descriptive Statistics
4.1. Data and sample selection
Our sample consists of Standard and Poor’s (S&P) 1500 firms from Compustat’s
ExecuComp files during the period 1997 to 2006. Included in the ExecuComp files are the
names of the top five executives in the firm, a CEOANN variable indicating which of the five
executives has the title of a CEO, and the starting date of the CEO. Our CEO turnover indicator
variable is constructed from the information contained in ExecuComp files. If the name of the
executive listed as a firm’s CEO for the current year is different from the one listed as the CEO
for the prior year, we conclude that there was a change in the CEO, or a new CEO was hired,
for the current year. Because we define Turnover as one when there is a change in a CEO for
the current or subsequent year, and our sample period ends with 2006, we consider accounting
loss from 1997 to 2005. We also obtain the five top executive stock ownership and CEO age
data from the ExecuComp files.
The data on earnings and other firm characteristics are obtained from Compustat annual
files. Stock return data are obtained from CRSP files. We obtain board characteristics (size,
composition, and structure) from the RiskMetrics database (also previously known as IRRC).
We construct one combined sample by merging the CEO, accounting, stock return, and
governance data. To remove the effect of outliers, we winsorize the top or bottom 1 percent of
the observations for Market-return, Asset-return, ΔEarnings, Earnings-volatility, Concentration,
10

and Growth.3 This sample selection procedure results in 11,738 firm-year observations over
fiscal years 1997 through 2005 with information about CEO turnover included up to 2006.
4.2. Descriptive statistics
Panel A of Table 1 reports the descriptive statistics for the variables included in Equation
(1). CEO turnover levels are higher than those typically reported by prior studies; the frequency
of CEO turnover is 23.6% over the entire sample period. The difference in turnover levels
between our study and prior studies is attributable to the measurement of our CEO turnover
variable. CEO turnover is generally measured for any given year while we measure turnover for
the current and subsequent year. Losses are fairly common; of all the firm years, 17.5% report
negative net income. The mean (median) cumulative market-adjusted stock returns (Market-
return) are 0.085 (0.017). The mean (median) industry-adjusted return on assets (Asset-return)
and changes in earnings before extraordinary items deflated by market value of equity
(ΔEarnings) are 0.050 (0.029) and 0.011 (0.006), respectively. The mean (median) return
volatility (Stock-volatility) is 0.116 (0.104), whereas the mean (median) earnings volatility
(Earnings-volatility) is 0.057 (0.030). The Herfindahl index (Concentration) has a median of
0.041. The mean fiscal-year end market value of equity (Market-equity) is $7.2 billion, while the
median number is much smaller ($1.36 billion). The mean (median) market-to-book ratio
(Growth) is 1.70 (1.20). 8.5% of firm years report special items less than or equal to -5 percent
of total assets and 8.9% of firm years are involved with restatements in the current or prior year.
The mean and median values of CEO age are very close; the median CEO age is 56.
Panel B of Table 1 reports the summary statistics for the CEO turnover and non-turnover
samples and the significance of the difference in means between the two samples. We find that
losses are more frequent for CEO turnover firms. 25.5% of the CEO turnover sample has losses,
while the corresponding number for the non-turnover sample is 15.1%. The difference in Loss
3Our results are not sensitive to other outlier identification methods and they remain qualitatively unchanged when we remove the top and/or bottom 0.5 or 1 percent of observations or even retain all the outliers.
11

(10.4%) is statistically significant at the 1 percent level. As in prior studies, we also find that,
compared to non-turnover firms, CEO turnover firms have lower stock market and accounting
performance, are riskier, have lower growth opportunities, restate their financial statements
more frequently, and have older CEOs. The mean difference of two other variables,
Concentration and Market-equity, is not significant.
Table 2 presents the relative frequency of CEO turnover for firms reporting losses and
firms reporting profits. Consistent with our expectations that accounting losses are more likely to
lead to a CEO turnover, Turnover in Panel A is higher among loss firms than among profit firms.
More specifically, the frequency of a CEO turnover for the current or subsequent year is 34%
when firms report negative net income while the corresponding number is 21% when firms
report a non-negative number as net income. The difference in frequency in turnover between
the two groups of firms is statistically significant at the 1 percent level. Thus, our preliminary
results indicate that firms with losses have a higher chance of being associated with current or
future CEO turnover than firms with profits.
Panel B of Table 2 reports the frequency of CEO turnover for loss and profit firms from
1997 to 2005. The frequency of CEO turnover for firms reporting profits appears to be constant
around 20% over the sample years. On the other hand, the frequency of CEO turnover for firms
reporting losses fluctuates over time. However, the difference in the frequency of CEO turnover
between loss and profit firms is statistically significant for each of the sample years indicating
that our hypothesis that losses lead to higher CEO turnover is statistically reliable across each
of the years.
5. Empirical Results
5.1. CEO turnover and accounting losses
Table 3 presents the logistic regression results for Equation (1) that predicts the
probability of top executive turnover following losses. The dependent variable Turnover is an
indicator variable that equals 1 when there is a change in the CEO in the current or subsequent
12

year and 0 otherwise. Our interest is in the sign and magnitude of the coefficient on Loss.
Consistent with our expectations and with our univariate results, we find a statistically and
economically significant relationship between CEO turnover and accounting losses. The
coefficient on Loss is 0.655 (χ2=155.48) in the first regression without the control variables. The
coefficient on Loss remains positive and significant (0.586; χ2=86.09) in the second regression
when we include other variables such as the market and accounting measures of firm
performance. The economic magnitude of the coefficient is large. Holding the control variables
at their mean values, the probability of a CEO losing his/her job within two years of reporting a
loss is 32 percent, while the corresponding number for profit firms is 21 percent. Thus, the
likelihood of CEO turnover for loss firms is about 52 percent larger than that for profit firms.
The results of the control variables are generally consistent with our expectations and
similar to those reported in prior studies. The coefficient estimate on Market-return is negative
and significant, which indicates that poor stock performance significantly increases the
likelihood of CEO turnover. In contrast, the coefficient estimates on Stock-volatility, Size,
Restructure, Restatement, and Age are all positive and significant. The results suggest that the
likelihood of CEO turnover is higher for firms with higher volatility, larger firms with restructuring
activities and financial restatements, and firms with older CEOs. The coefficients on Asset-
return, ΔEarnings, Earnings-volatility, Concentration, and Growth are insignificant.
Our analysis in Table 3 relies on net income to partition firms into profit and loss groups
because net income is the bottom-line measure of accounting performance which includes core,
non-core, and discontinued operations, cumulative effect of accounting changes, and losses
attributable to minority interest. We additionally consider two other earnings measures: (1)
income before extraordinary items and (2) operating income. The first measure captures
earnings from core and non-core operations, while the second measure includes only earnings
from core operations.
13
Table 4 reports the regression results, using these alternative measures of reported
earnings to define Loss. Our results suggest that all the measures of reported earnings are
associated with a higher likelihood of a CEO turnover. Controlling for the other determinants of
CEO turnover−such as market and accounting measures of performance, volatility of market
and accounting performance, industry concentration, firm size, growth opportunities,
restructuring activities, financial restatements, and CEO age−the coefficient on Loss in Panel A
is 0.586 (χ2=86.09), 0.562 (χ2=74.16), and 0.305 (χ2=8.11), respectively, when Loss is defined
using net income, income before extraordinary items, and operating income as alternative
measures of reported earnings. As indicated in Panel B, the magnitude of the coefficient on
Loss is the largest when Loss is based on net income, but it is the smallest when Loss is based
on operating income. Our results suggest that boards tend to focus on the bottom line number
for holding CEOs accountable for losses.
One concern with Table 3 is that our regression specification excludes governance
measures for various agency problems which might impact CEO turnover and also be
associated with the likelihood of a firm reporting a loss. For instance, a CEO with a higher equity
ownership in the firm has more power because greater equity ownership might affect CEO
turnover decisions. Similarly, a more independent, effective and diligent board is more likely to
hold a CEO accountable for poor performance than one that is less effective. Accordingly, we
additionally include the size, composition, and structure of the board and managerial ownership
in Equation (1). Specifically, we include the number of members on the board (Board-size), the
percentage of independent directors on the board (Board-independence), the combination of
CEO and board chair positions (CEO-duality), the presence of separate standing sub-
committees (Separate-committees), and the percentage of common stock held by the top five
executives (Ownership). The additional data requirement reduces our sample to 7,516 firm-year
observations.
14
The results in Table 5 show that the inclusion of the additional board and ownership
variables does not alter the relation between CEO turnover and accounting losses. Consistent
with the results in Tables 3 and 4, the positive relation between CEO turnover and losses
continues to hold. The coefficient on Loss is 0.621 (χ2=77.92) and 0.552 (χ2=43.71),
respectively, without and with the control variables in the first and second regressions. The
parameter estimate in the second regression suggests that, based on the mean values of the
control variables, the probability of a CEO losing a job within two years of reporting a loss is 29
percent, while that of a CEO reporting a profit is 19 percent. We also find that, consistent with
the findings in prior studies (e.g., Goyal and Park 2002, Ghosh et al. 2010), the coefficient on
CEO-duality is negative and significant, suggesting that firms with combined CEO-Chair
positions have lower turnover than firms with separate positions. The coefficients on Board-size,
Board-independence, Separate-committees, and Ownership are all insignificant.
Overall, the results from Tables 3 to 5 suggest that CEOs reporting losses are more
likely to lose their jobs within the two-year period following losses including the year of the loss,
compared to CEOs reporting profits, which is consistent with our hypothesis.
5.2. CEO turnover and sustained accounting losses
Prior studies show that debt and equity markets reward firms with sustained earnings
growth because sustained earnings increases are indicative of the firms’ competitive
advantages and a higher probability of future earnings and cash flow growth (Elliott et al. 2010,
Ghosh et al. 2005, Barth et al. 1999). Similar to the studies on the information contents of
sustained earnings growth, we analyze whether sustained accounting losses affect the
likelihood of a CEO turnover. To measure sustained losses, we decompose Loss into 5 indicator
variables depending on the number of years of consecutive annual losses. Loss1 equals 1 for
firms with a loss in the current year but not in the prior year (i.e., NIt<0 and NIt-1≥0). Loss2 equals
1 for firms with two consecutive years of losses (i.e., NIt<0, NIt-1<0, and NIt-2≥0). Similarly, Loss3,
15
Loss4, and Loss5 equal 1 for firms with 3, 4, and 5 or more years of consecutive losses,
respectively.
Table 6 presents the regression results of CEO turnover on sustained losses. We find
evidence on the dampening effect of a sustained loss on the likelihood of CEO turnover. While
the coefficients on Loss1, Loss2, and Loss3 are all positive and significant in the first regression
with the control variables, the magnitude of the coefficients decreases as the length of sustained
loss period increases. The coefficients on Loss4 and Loss5 are insignificant.
In the second regression when we add the governance variables, the coefficients on
Loss1 and Loss2 remain positive and significant; they are 0.600 (χ2=35.33) and 0.565 (χ2=15.25),
respectively. Our results indicate that the effect of losses on CEO turnover is the strongest for
firms with a loss in the current year. Further, controlling for the current period loss, CEOs are
more likely to be dismissed when firms report losses over two consecutive years. However, the
coefficients on Loss3, Loss4, and Loss5 are insignificant, indicating that losses sustained over
three or more years do not increase the chances of a CEO turnover. These results may suggest
that boards of directors play a proactive role in replacing a poorly performing CEO before
matters even get worse which is one explanation why investors treat losses as being temporary.
5.3. Outside replacement and accounting losses
The decision to fire a poorly performing CEO benefits shareholders only when the board
appoints a more capable successor. CEOs who are appointed from outside the firm are more
likely to change pre-existing firm policies that resulted in losses. Borokhovich et al. (1996) find
that the stock market views the appointment of an outsider to the CEO position more favorably
than the appointment of an insider, especially when the incumbent CEO is forced to resign.
Therefore, we also examine whether accounting losses increase the likelihood of an outside
replacement to send a strong signal to investors that the CEO is committed turning around the
firm from a loss making firm to one making profits. We hand collect data to establish whether
16
the successor CEO is from outside the firm by reading press releases, 10-K reports, and
associated proxy statements. The sample to examine the impact of losses on outside
appointments consists of 1,483 CEO turnover observations.
Table 7 presents the regression results on the relationship between accounting losses
and the likelihood of outside succession, conditional on CEO turnover. We estimate Equation
(1) using a dichotomous dependent variable that equals 1 when the incumbent CEO is replaced
with a successor CEO from outside the firm and 0 if the replacement CEO is appointed from
within the firm. We find that the coefficient on Loss is positive and significant; it is 0.450
(χ2=7.96) and 0.488 (χ2=6.38), respectively, when we exclude and include the governance
variables in the first and second regressions. The parameter estimate in the second regression
suggests that, based on the mean values of the governance and control variables, the
probability of an outside appointment for firms reporting a loss is 29 percent, while that for firms
reporting a profit is 20 percent. Our results suggest that accounting losses lead to more frequent
appointments of CEOs from outside the firm.
We also find that the coefficient on Separate-committees is positive and significant,
which indicates that the likelihood of outside succession is higher for firms with specialized
committees on audit, appointment, and remuneration issues. Among the control variables, we
find that the coefficients on Market-return, Size, and Age are negative and significant, implying
that the boards of larger firms with higher stock performance and older CEOs tend to hire an
insider to replace the incumbent CEO.
6. Sensitivity Analysis
6.1. Endogeneity
A potential concern with our prior results is that accounting losses are likely to be
endogenously determined (Klein and Marquardt 2006, Joos and Plesko 2005), which suggests
that the coefficient estimates from the regressions might be biased and inconsistent. We
17

address any endogeneity concerns using a two stage least squares (2SLS) estimation
procedure to obtain consistent and efficient estimates for losses. Specifically, drawing on prior
studies, we model losses in the first stage and then in the second stage we regress CEO
turnover on the probability of a firm reporting a loss obtained from the first stage regression.
The results for the first stage estimation are presented in the first column of Table 8. The
coefficients on Cash-flow, Accrual, Dividend, and Size are all negative and significant, which
suggests that firms with higher cash flow from operations, larger accruals, and larger firms
paying dividend are less likely to report accounting losses. In contrast, the coefficient on
lag(Loss) is positive and significant, indicating that firms with losses in the prior year are more
likely to incur losses in the current year.
In the second stage, we use the estimated values of losses from the first stage as an
instrumental variable and re-estimate Equation (1). After controlling for the endogeneity of
accounting losses, our results confirm the earlier findings on the positive relationship between
CEO turnover and losses. The coefficient on Pred-Loss is 0.648 (χ2=8.81) and 0.501 (χ2=4.15)
when we exclude and include the governance variables in the second and third columns,
respectively. Thus, our results once again confirm that the likelihood of CEO turnover is higher
for firms reporting accounting losses.
6.2. Magnitude of losses
Our analysis adopts the indicator variable Loss to examine the relation between
accounting losses and CEO turnover. Using the indicator variable to represent negative net
income, we presume that the impact of losses on CEO turnover does not depend on the
magnitude of accounting losses. Thus, as part of our sensitivity analyses, we examine whether
the strength of the relation between losses and turnover varies with the size of losses by adding
Magnitude which is the absolute value of net income deflated by book value of equity at the
beginning of the year.
18
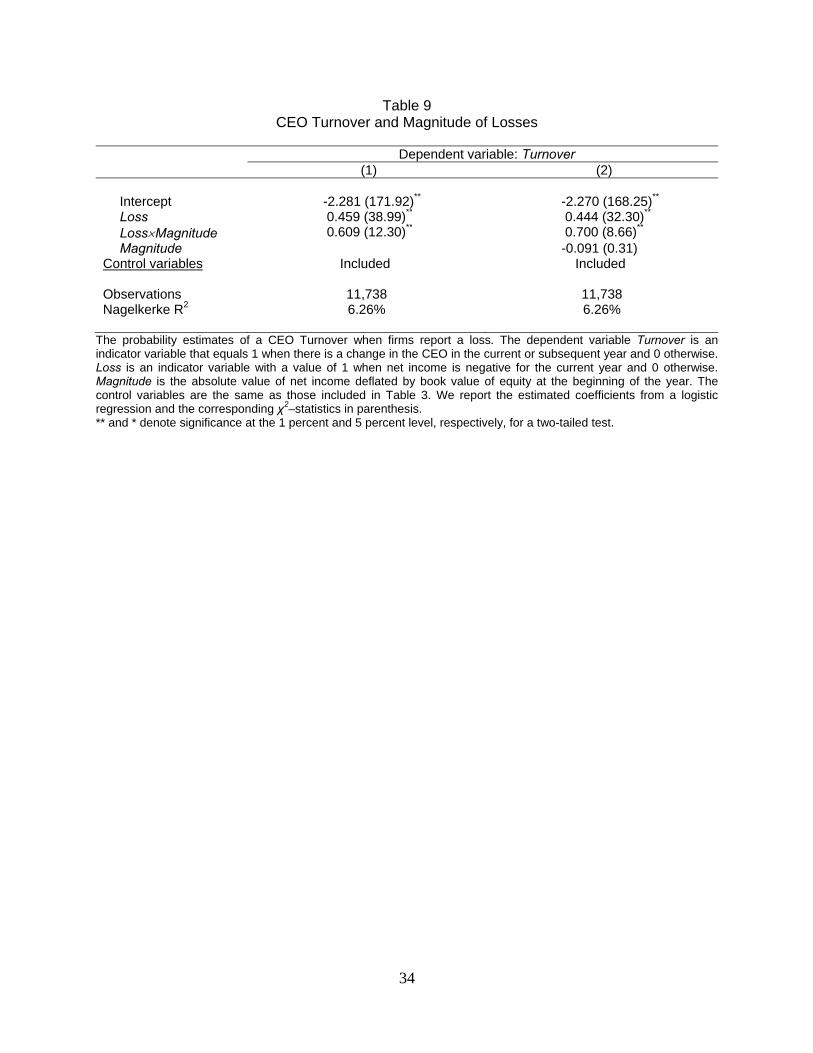
Table 9 reports the results after including the interaction term between Magnitude and
Loss to estimate how Magnitude affects the sensitivity of top executive turnover to losses. Our
results on accounting losses continue to hold; the coefficient on Loss remains positive and
significant in the first and second regressions without and with Magnitude. Similarly, the
coefficient on Loss×Magnitude is positive and significant; it is 0.609 (χ2=12.30) and 0.700
(χ2=8.66) in the first and second regressions, indicating that the sensitivity of CEO turnover to
accounting losses becomes larger as the magnitude of accounting losses increases. Our results
suggest that boards take into account both incidence and size of accounting losses in removing
poorly-performing CEOs.
6.3. The effect of governance on the relationship between CEO turnover and losses
Goyal and Park (2002) examine how the leadership structure of the board affects the
sensitivity of CEO turnover to firm performance and find that the sensitivity of CEO turnover to
market-adjusted stock return is less for firms with CEO duality than for firms with separate
positions. Accordingly, we also examine whether governance characteristics affect the
sensitivity of turnover to losses by augmenting the logistic regressions reported in Table 5 after
additionally including interactions between accounting losses and the five governance variables
described earlier.
In unreported results, we find that the inclusion of interactions has no effect on our
results presented in Table 5. The coefficient on CEO-duality remains negative and significant,
while the coefficients on the other four governance variables also continue to remain
insignificant. Further, we find that the coefficients on Loss×CEO-duality and Loss×Separate-
committees are both positive and significant. These results suggest that the sensitivity of top
executive turnover to accounting losses is higher for firms with separate subcommittees and
firms with combined CEO and chairman positions. In the contrast to the results on CEO-duality
whose coefficient is negative, the coefficient on Loss×CEO-duality is positive. Because the
19
interaction term capture the marginal effect of CEO-duality on CEO turnover for loss firms
relative to profit firms, our results suggest that CEO-duality becomes less influential in affecting
CEO turnover for loss firms.
7. Conclusions
Several studies examine the importance of earnings and stock returns as measures of
firm performance on CEO turnover considerations (e.g., Weisbach 1988, Murphy and
Zimmerman 1993, Goyal and Park 2002). We suggest that accounting losses reflect managerial
effort and quality that are not fully captured in the traditional measures of firm performance. In
this paper, we investigate whether accounting losses provide information that can be used to
assess CEO retention/dismissal decision. Specifically, we examine whether accounting losses
lead to subsequent top executive turnover.
Based on a comprehensive sample of CEO turnover between 1997 and 2005, we find
that compared to profit firms, the likelihood of CEO turnover is significantly higher for loss firms.
Controlling for the other determinants of CEO turnover that include traditional market and
accounting measures of firm performance, the relative probability of a CEO losing a job within
two years is about 52 percent higher for firms reporting losses than firms reporting profits. Also,
when we use two other reported earnings measures (income before extraordinary items and
operating income) in addition to the bottom-line number (net income) to define accounting
losses, we find a positive relation between turnover and losses for all the three measures used
to define losses. However, the sensitivity of CEO turnover to losses is the strongest when
losses are defined using the bottom line net income number. Further, when we include the size,
composition, and structure of the board and managerial ownership in our regression
specifications, we find that inclusion of these additional governance variables does not alter the
effect of accounting losses on CEO turnover. Our results on the relation between turnover and
losses are also robust to the endogeneity of accounting losses and inclusion of magnitude of
accounting losses.
20

Moreover, we examine whether sustained accounting losses affect the likelihood of CEO
turnover and find that CEOs are more likely to be dismissed when firms report losses in the
current year or over two consecutive years but not when earnings are sustained over longer
periods which suggests that boards are more proactive in disciplining poorly performing
managers. We also examine whether accounting losses increase the likelihood of outside
replacement. We find that accounting losses lead to more frequent appointments of CEOs from
outside the firm. The probability of an outside appointment is 29 percent and 20 percent,
respectively, for loss firms and profit firms.
Our results suggest that while boards incorporate accounting and market measures of
performance in evaluating management, they view losses as an indicator of management failure
and consequently penalize CEOs for reporting losses. Additionally, prior studies often presume
that managers exercise the liquidation/abandonment option when losses are expected to persist
and, therefore, investors view negative earnings as having low information content relative to
positive earnings. However, the literature is silent why management will not continue to subside
their pet projects or invest in negative net present value projects when such projects benefit
their personal welfare. Our results suggest that CEO turnover or the threat of a higher turnover
following losses ensures that CEOs will exercise the liquidation/abandonment option. Finally,
our results also provide one explanation why firms manage earnings to avoid reporting losses.
21

References
Barth, M. E., J. A. Elliott, and M. A. Finn, 1999, Market rewards associated with patterns of increasing earnings, Journal of Accounting Research 37, 387-413.
Borokhovich, K. A., R. Parrino, and T. Trapani, 1996, Outside directors and CEO selection,
Journal of Financial and Quantitative Analysis 31, 337-355. Burgstahler, D., and I. Dichev, 1997, Earnings management to avoid earnings decreases and
losses, Journal of Accounting and Economics 24, 99-126. Collins, D. W., M. Pincus, and H. Xie, 1999, Equity valuation and negative earnings: The role of
book value of equity, The Accounting Review 74, 29-62. DeAngelo, H., L. DeAngelo, and D. J. Skinner, 1992, Dividends and losses, Journal of Finance
58, 1837-1863. Dechow, P., S. Richardson, and I. Tuna, 2003, Why are earnings kinky? An examination of the
earnings management explanation, Review of Accounting Studies 8, 355-384. Dechow, P., and R. Sloan, 1991, Executive incentives and the horizon problem, Journal of
Accounting and Economics 14, 51-89. DeFond, M. L., and C. W. Park, 1999, The effect of competition on CEO turnover, Journal of
Accounting and Economics 27, 35-56.
Desai, H., C. E. Hogan, and M. S. Wilkins, 2006, The reputational penalty for aggressive
accounting: Earnings restatements and management turnover, The Accounting Review 81, 83-112.
Durtschi, C., and P. Easton, 2005, Earnings management? The shapes of the frequency
distributions of earnings metrics are not evidence ipso facto, Journal of Accounting Research 43, 557-592.
Elliott, J. A., A. Ghosh, and D. Moon, 2010, Asymmetric valuation of sustained growth by bond-
and equity-holders, Review of Accounting Studies, Forthcoming. Engel, E., R. M. Hayes, and X. Wang, 2003, CEO turnover and properties of accounting
information, Journal of Accounting and Economics 36, 197-226. Farrell, K. A., and D. A. Whidbee, 2003, Impact of firm performance expectations on CEO
turnover and replacement decisions, Journal of Accounting and Economics 36, 165-196. Ghosh, A., Z. Gu, and P. Jain, 2005, Sustained earnings and revenue growth, earnings quality,
and earnings response coefficients, Review of Accounting Studies 10, 33-57. Ghosh, A., C. Karuna, and D. Moon, 2010, When the CEO is also the chair of the board,
Working paper, Baruch College, New York, NY.
22
Goyal, V., and C. Park, 2002, Board leadership structure and CEO turnover, Journal of Corporate Finance 8, 49-66.
Graham, J. R., C. R. Harvey, and S. Rajgopal, 2005, The economic implications of corporate
reporting, Journal of Accounting and Economics 40, 3-73. Hayn, C., 1995, The information content of losses, Journal of Accounting and Economics 20,
125-154.
Huson, M. R., R. Parrino, and L. T. Starks, 2001, Internal monitoring mechanisms and CEO
turnover: A long-term perspective, Journal of Finance 55, 2265-2297. Joos, P., and G. Plesko, 2005, Valuing loss firms, The Accounting Review 80, 847-870.
Kaplan, S., and B. A. Minton, 2006, How has CEO turnover changed? Increasingly performance
sensitive boards and increasingly uneasy CEOs, Working paper, University of Chicago, Chicago, IL.
Klein, A., and C. Marquardt, 2006, Fundamentals of accounting losses, The Accounting Review
81, 179-8206.
Murphy, K. J., 1999. Executive compensation, In O. Ashenfelter and D. Card (eds.), Handbook
of Labor Economics. Volume 3, North Holland, 2485-2525. Murphy, K. J., and J. Zabonjik, 2004, Managerial capital and the market for CEOs, Working
paper, University of Southern California, Los Angeles, CA. Murphy, K. J., and J. L. Zimmerman, 1993, Financial performance surrounding CEO turnover,
Journal of Accounting and Economics 16, 273-315. Ofek, E., 1993, Capital structure and firm response to poor performance, Journal of Financial
Economics 34, 3-30. Pinnuck, M., and A. Lillis, 2007, Profits versus losses: Does reporting an accounting loss act as
a heuristic trigger to exercise the abandonment option and divest employees?, The Accounting Review 82, 1031-1053.
Pourciau, S., 1993, Earnings management and nonroutine executive change, Journal of
Accounting and Economics 16, 317-336. Roychowdhury, S., 2006, Earnings management through real activities manipulation, Journal of
Accounting and Economics 42, 335-370. Smith, C. W., and R. L. Watts, 1992, The investment opportunity set and corporate financing,
dividend, and financing policies, Journal of Financial Economics 32, 262-292. Watts, R. L., 2003, Conservatism in accounting, Part I: Explanations and implications,
Accounting Horizons 17, 207-221.
23

Weisbach, M., 1988, Outside directors and CEO turnover, Journal of Financial Economics 20, 431- 460.
24

Table 1 Descriptive Statistics
Mean 1st Quartile Median 3rd Quartile Std. Dev. Panel A: Full Sample
Turnover 0.236 0.000 0.000 0.000 0.424 Loss 0.175 0.000 0.000 0.000 0.380 Market-return 0.085 -0.235 0.017 0.293 0.520 Asset-return 0.050 -0.002 0.029 0.096 0.115 ΔEarnings 0.011 -0.010 0.006 0.029 0.089 Stock-volatility 0.116 0.074 0.104 0.147 0.055 Earnings-volatility 0.057 0.013 0.030 0.065 0.080 Concentration 0.057 0.027 0.041 0.067 0.048 Market-equity 7.159 0.517 1.360 4.537 23.913 Growth 1.697 0.833 1.202 1.966 1.502 Restructure 0.085 0.000 0.000 0.000 0.279 Restatement 0.089 0.000 0.000 0.000 0.286 Age 56.204 51.000 56.000 61.000 7.491
CEO Turnover Yes No Differences Panel B: Firms with and without CEO Turnover
Loss 0.255 0.151 0.104** Market-return 0.006 0.110 -0.104** Asset-return 0.037 0.054 -0.017** ΔEarnings 0.003 0.013 -0.010** Stock-volatility 0.120 0.115 0.005**
Earnings-volatility 0.062 0.056 0.006**
Concentration 0.056 0.057 -0.001
Market-equity 7.870 6.939 0.931
Growth 1.638 1.716 -0.078*
Restructure 0.115 0.076 0.039** Restatement 0.111 0.083 0.028** Age 58.085 55.622 2.463**
Turnover is an indicator variable that equals 1 when there is a change in the CEO in the current or subsequent year and 0 otherwise. Loss is an indicator variable with a value of 1 when net income is negative for the current year and 0 otherwise. Market-return is the difference between the raw returns and the value-weighted CRSP market returns over a twelve-month fiscal period. Asset-return is the industry-adjusted return on assets measured as the difference between the firm-specific and the industry-median income before extraordinary items deflated by total assets at the beginning of the year. ΔEarnings is the difference between current period earnings before extraordinary items and the corresponding number in the prior year deflated by market value of equity at the beginning of the year. Stock-volatility is the standard deviation of Market-return based on prior twenty-four monthly returns. Earnings-volatility is the standard deviation of Asset-return over the previous five years. Concentration is the industry level Herfindahl index. Market-equity is the fiscal year-end market value of equity. Growth is the sum of the market value of equity and the book value of debt scaled by the book value of total assets. Restructure is an indicator variable that equals 1 if special items as a percentage of total assets is less than or equal to -5 percent and 0 otherwise. Restatement is an indicator variable equal to 1 when a firm restates its financial statement in the current or prior year and 0 otherwise. Age is the age of the CEO in years (for the outgoing CEO in turnover firms) as of the fiscal-year end. Panel A is based on the full sample with 11,738 firm-year observations between 1997 and 2005, while Panel B is based on the samples with and without CEO turnover (2,772 and 8,966 observations, respectively). The significance test of differences in means between firms with and without CEO turnover is based on the t-tests. ** and * denote significance at the 1 percent and 5 percent level, respectively, for a two-tailed test.
25
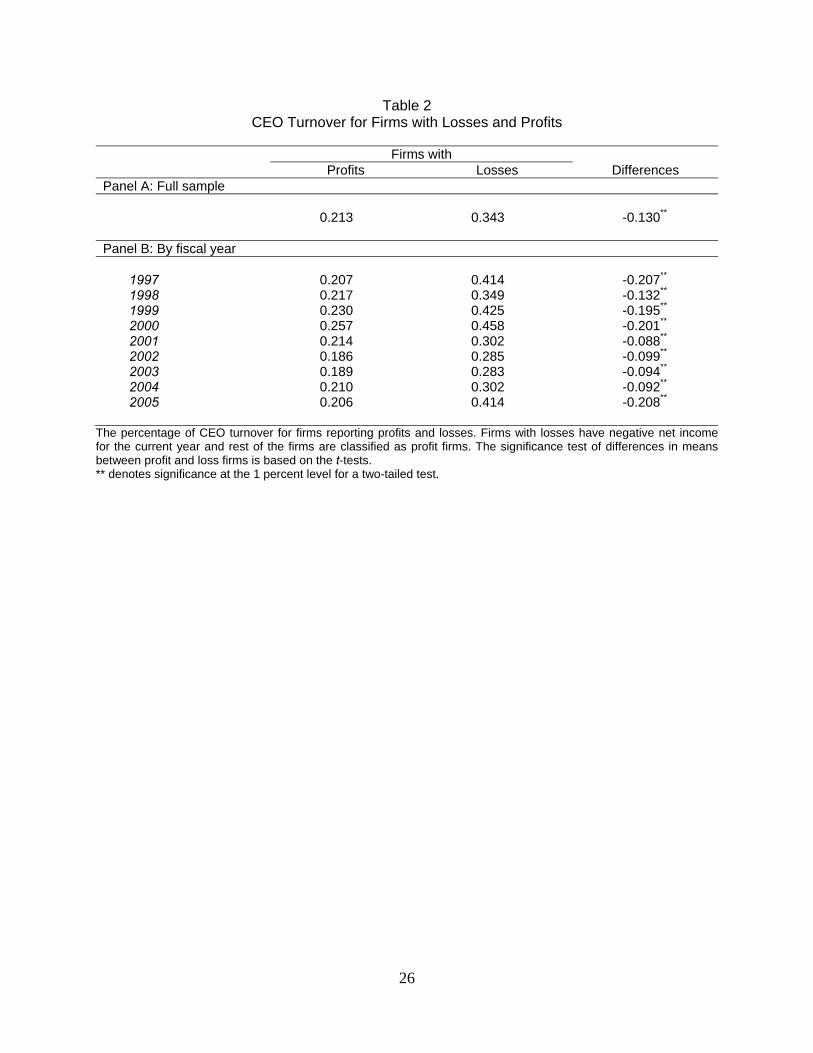
Table 2 CEO Turnover for Firms with Losses and Profits
Firms with Profits Losses Differences Panel A: Full sample
0.213 0.343 -0.130**
Panel B: By fiscal year
1997 0.207 0.414 -0.207**
1998 0.217 0.349 -0.132**
1999 0.230 0.425 -0.195**
2000 0.257 0.458 -0.201** 2001 0.214 0.302 -0.088** 2002 0.186 0.285 -0.099** 2003 0.189 0.283 -0.094** 2004 0.210 0.302 -0.092** 2005 0.206 0.414 -0.208**
The percentage of CEO turnover for firms reporting profits and losses. Firms with losses have negative net income for the current year and rest of the firms are classified as profit firms. The significance test of differences in means between profit and loss firms is based on the t-tests. ** denotes significance at the 1 percent level for a two-tailed test.
26
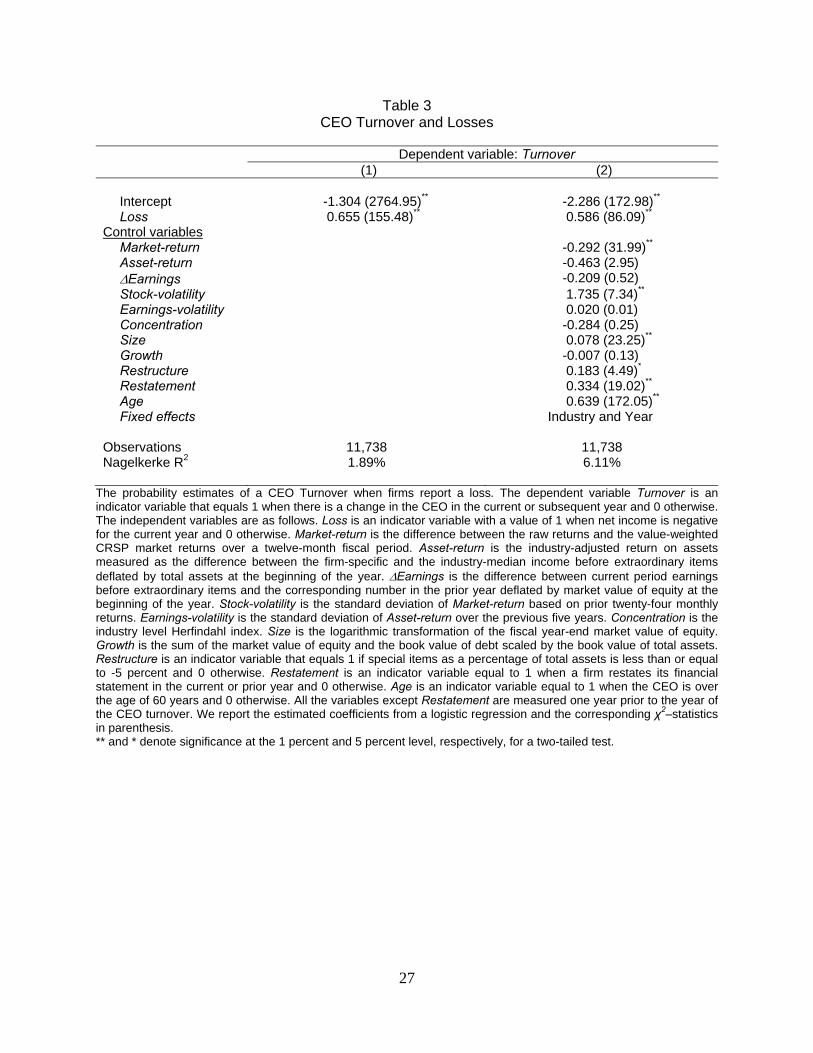
Table 3 CEO Turnover and Losses
Dependent variable: Turnover
(1) (2)
Intercept -1.304 (2764.95)** -2.286 (172.98)**
Loss 0.655 (155.48)** 0.586 (86.09)**
Control variables
Market-return -0.292 (31.99)**
Asset-return -0.463 (2.95)
ΔEarnings -0.209 (0.52)
Stock-volatility 1.735 (7.34)**
Earnings-volatility 0.020 (0.01)
Concentration -0.284 (0.25)
Size 0.078 (23.25)**
Growth -0.007 (0.13)
Restructure 0.183 (4.49)*
Restatement 0.334 (19.02)**
Age 0.639 (172.05)**
Fixed effects Industry and Year Observations 11,738 11,738 Nagelkerke R2 1.89% 6.11%
The probability estimates of a CEO Turnover when firms report a loss. The dependent variable Turnover is an indicator variable that equals 1 when there is a change in the CEO in the current or subsequent year and 0 otherwise. The independent variables are as follows. Loss is an indicator variable with a value of 1 when net income is negative for the current year and 0 otherwise. Market-return is the difference between the raw returns and the value-weighted CRSP market returns over a twelve-month fiscal period. Asset-return is the industry-adjusted return on assets measured as the difference between the firm-specific and the industry-median income before extraordinary items deflated by total assets at the beginning of the year. ΔEarnings is the difference between current period earnings before extraordinary items and the corresponding number in the prior year deflated by market value of equity at the beginning of the year. Stock-volatility is the standard deviation of Market-return based on prior twenty-four monthly returns. Earnings-volatility is the standard deviation of Asset-return over the previous five years. Concentration is the industry level Herfindahl index. Size is the logarithmic transformation of the fiscal year-end market value of equity. Growth is the sum of the market value of equity and the book value of debt scaled by the book value of total assets. Restructure is an indicator variable that equals 1 if special items as a percentage of total assets is less than or equal to -5 percent and 0 otherwise. Restatement is an indicator variable equal to 1 when a firm restates its financial statement in the current or prior year and 0 otherwise. Age is an indicator variable equal to 1 when the CEO is over the age of 60 years and 0 otherwise. All the variables except Restatement are measured one year prior to the year of the CEO turnover. We report the estimated coefficients from a logistic regression and the corresponding χ2–statistics in parenthesis. ** and * denote significance at the 1 percent and 5 percent level, respectively, for a two-tailed test.
27
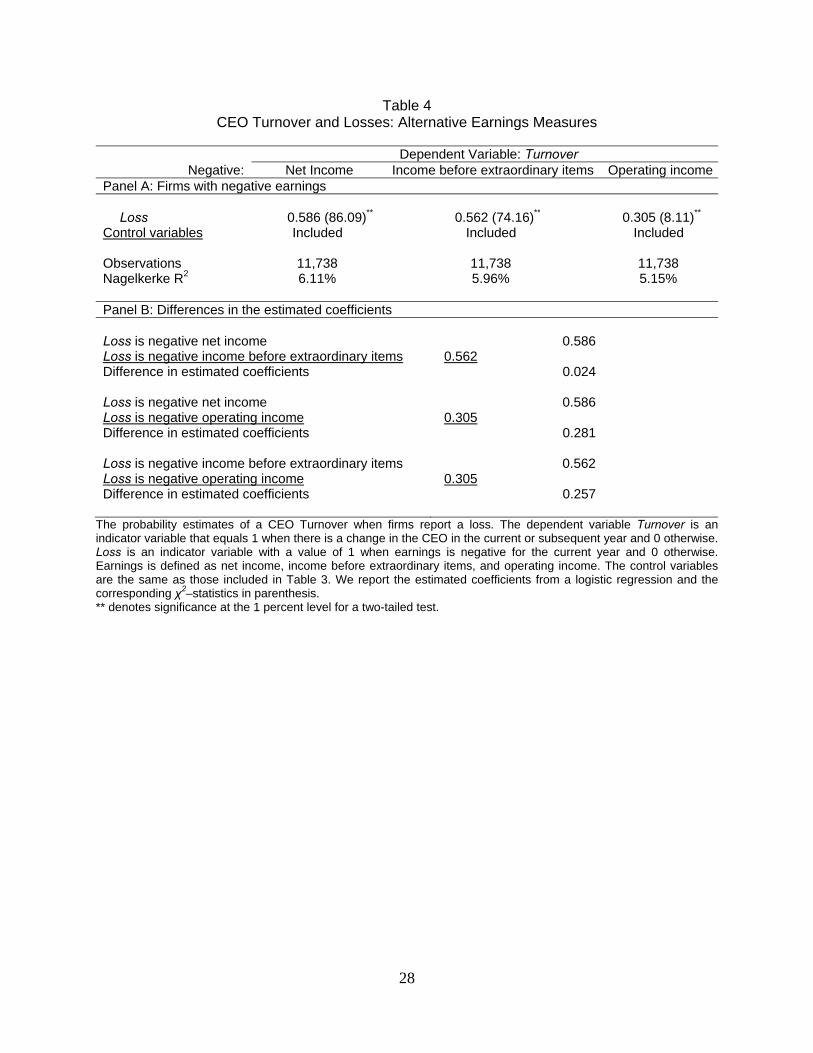
Table 4 CEO Turnover and Losses: Alternative Earnings Measures
Dependent Variable: Turnover
Negative: Net Income Income before extraordinary items Operating incomePanel A: Firms with negative earnings
Loss 0.586 (86.09)** 0.562 (74.16)** 0.305 (8.11)**
Control variables Included Included Included Observations 11,738 11,738 11,738 Nagelkerke R2 6.11% 5.96% 5.15% Panel B: Differences in the estimated coefficients
Loss is negative net income 0.586 Loss is negative income before extraordinary items 0.562 Difference in estimated coefficients 0.024
Loss is negative net income 0.586 Loss is negative operating income 0.305 Difference in estimated coefficients 0.281
Loss is negative income before extraordinary items 0.562 Loss is negative operating income 0.305 Difference in estimated coefficients 0.257
The probability estimates of a CEO Turnover when firms report a loss. The dependent variable Turnover is an indicator variable that equals 1 when there is a change in the CEO in the current or subsequent year and 0 otherwise. Loss is an indicator variable with a value of 1 when earnings is negative for the current year and 0 otherwise. Earnings is defined as net income, income before extraordinary items, and operating income. The control variables are the same as those included in Table 3. We report the estimated coefficients from a logistic regression and the corresponding χ2–statistics in parenthesis. ** denotes significance at the 1 percent level for a two-tailed test.
28
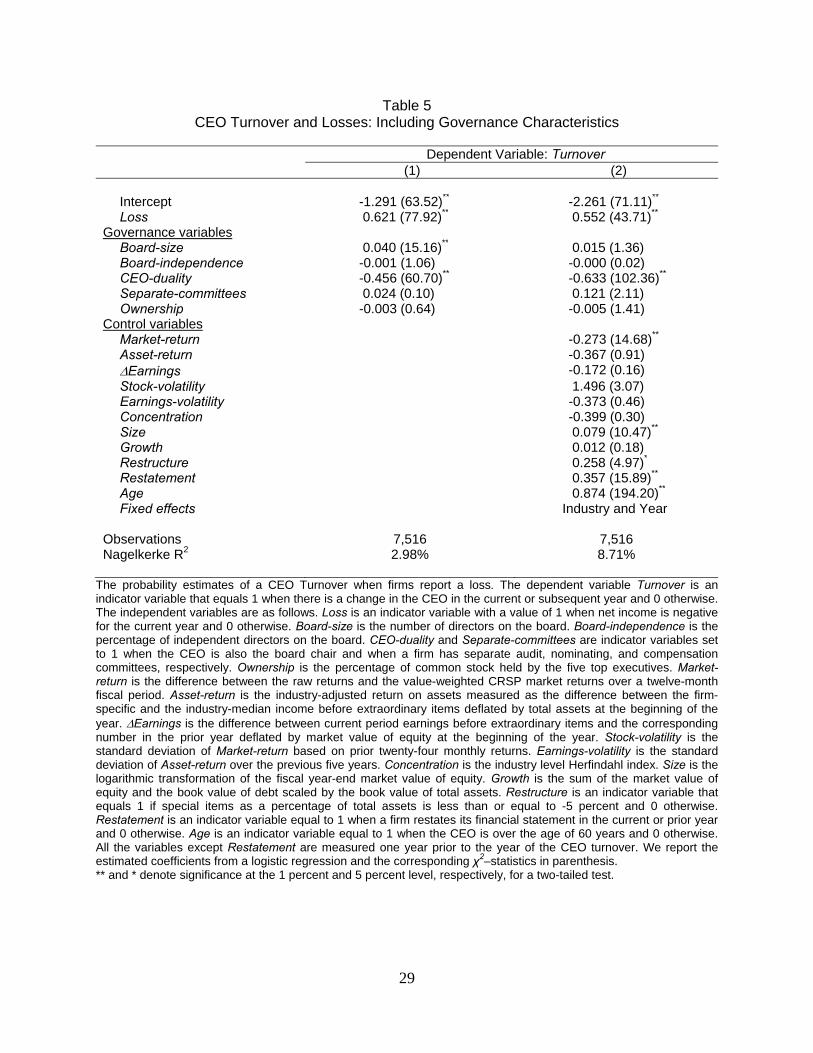
Table 5 CEO Turnover and Losses: Including Governance Characteristics
Dependent Variable: Turnover
(1) (2)
Intercept -1.291 (63.52)** -2.261 (71.11)**
Loss 0.621 (77.92)** 0.552 (43.71)**
Governance variables
Board-size 0.040 (15.16)** 0.015 (1.36)
Board-independence -0.001 (1.06) -0.000 (0.02)
CEO-duality -0.456 (60.70)** -0.633 (102.36)**
Separate-committees 0.024 (0.10) 0.121 (2.11)
Ownership -0.003 (0.64) -0.005 (1.41)
Control variables Market-return -0.273 (14.68)**
Asset-return -0.367 (0.91)
ΔEarnings -0.172 (0.16)
Stock-volatility 1.496 (3.07)
Earnings-volatility -0.373 (0.46)
Concentration -0.399 (0.30)
Size 0.079 (10.47)**
Growth 0.012 (0.18)
Restructure 0.258 (4.97)*
Restatement 0.357 (15.89)**
Age 0.874 (194.20)**
Fixed effects Industry and Year Observations 7,516 7,516 Nagelkerke R2 2.98% 8.71%
The probability estimates of a CEO Turnover when firms report a loss. The dependent variable Turnover is an indicator variable that equals 1 when there is a change in the CEO in the current or subsequent year and 0 otherwise. The independent variables are as follows. Loss is an indicator variable with a value of 1 when net income is negative for the current year and 0 otherwise. Board-size is the number of directors on the board. Board-independence is the percentage of independent directors on the board. CEO-duality and Separate-committees are indicator variables set to 1 when the CEO is also the board chair and when a firm has separate audit, nominating, and compensation committees, respectively. Ownership is the percentage of common stock held by the five top executives. Market-return is the difference between the raw returns and the value-weighted CRSP market returns over a twelve-month fiscal period. Asset-return is the industry-adjusted return on assets measured as the difference between the firm-specific and the industry-median income before extraordinary items deflated by total assets at the beginning of the year. ΔEarnings is the difference between current period earnings before extraordinary items and the corresponding number in the prior year deflated by market value of equity at the beginning of the year. Stock-volatility is the standard deviation of Market-return based on prior twenty-four monthly returns. Earnings-volatility is the standard deviation of Asset-return over the previous five years. Concentration is the industry level Herfindahl index. Size is the logarithmic transformation of the fiscal year-end market value of equity. Growth is the sum of the market value of equity and the book value of debt scaled by the book value of total assets. Restructure is an indicator variable that equals 1 if special items as a percentage of total assets is less than or equal to -5 percent and 0 otherwise. Restatement is an indicator variable equal to 1 when a firm restates its financial statement in the current or prior year and 0 otherwise. Age is an indicator variable equal to 1 when the CEO is over the age of 60 years and 0 otherwise. All the variables except Restatement are measured one year prior to the year of the CEO turnover. We report the estimated coefficients from a logistic regression and the corresponding χ2–statistics in parenthesis. ** and * denote significance at the 1 percent and 5 percent level, respectively, for a two-tailed test.
29
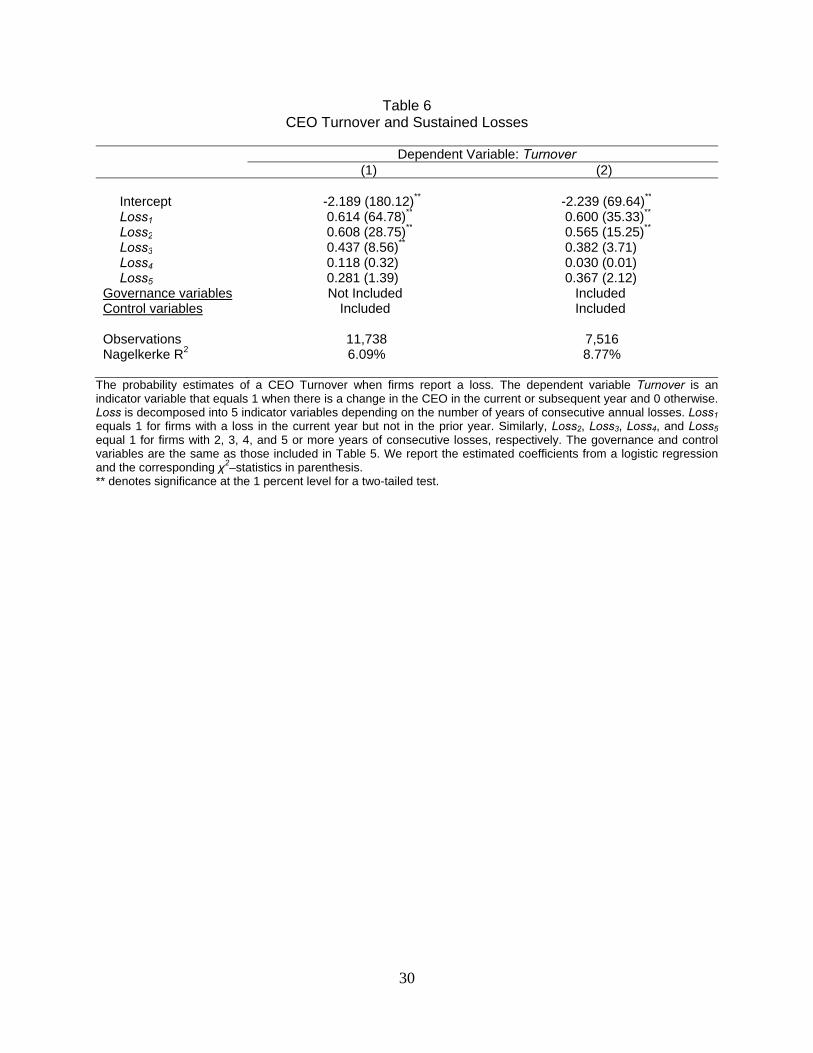
Table 6 CEO Turnover and Sustained Losses
Dependent Variable: Turnover
(1) (2)
Intercept -2.189 (180.12)** -2.239 (69.64)**
Loss1 0.614 (64.78)** 0.600 (35.33)**
Loss2 0.608 (28.75)** 0.565 (15.25)**
Loss3 0.437 (8.56)** 0.382 (3.71)
Loss4 0.118 (0.32) 0.030 (0.01)
Loss5 0.281 (1.39) 0.367 (2.12)
Governance variables Not Included Included Control variables Included Included Observations 11,738 7,516 Nagelkerke R2 6.09% 8.77%
The probability estimates of a CEO Turnover when firms report a loss. The dependent variable Turnover is an indicator variable that equals 1 when there is a change in the CEO in the current or subsequent year and 0 otherwise. Loss is decomposed into 5 indicator variables depending on the number of years of consecutive annual losses. Loss1 equals 1 for firms with a loss in the current year but not in the prior year. Similarly, Loss2, Loss3, Loss4, and Loss5 equal 1 for firms with 2, 3, 4, and 5 or more years of consecutive losses, respectively. The governance and control variables are the same as those included in Table 5. We report the estimated coefficients from a logistic regression and the corresponding χ2–statistics in parenthesis. ** denotes significance at the 1 percent level for a two-tailed test.
30
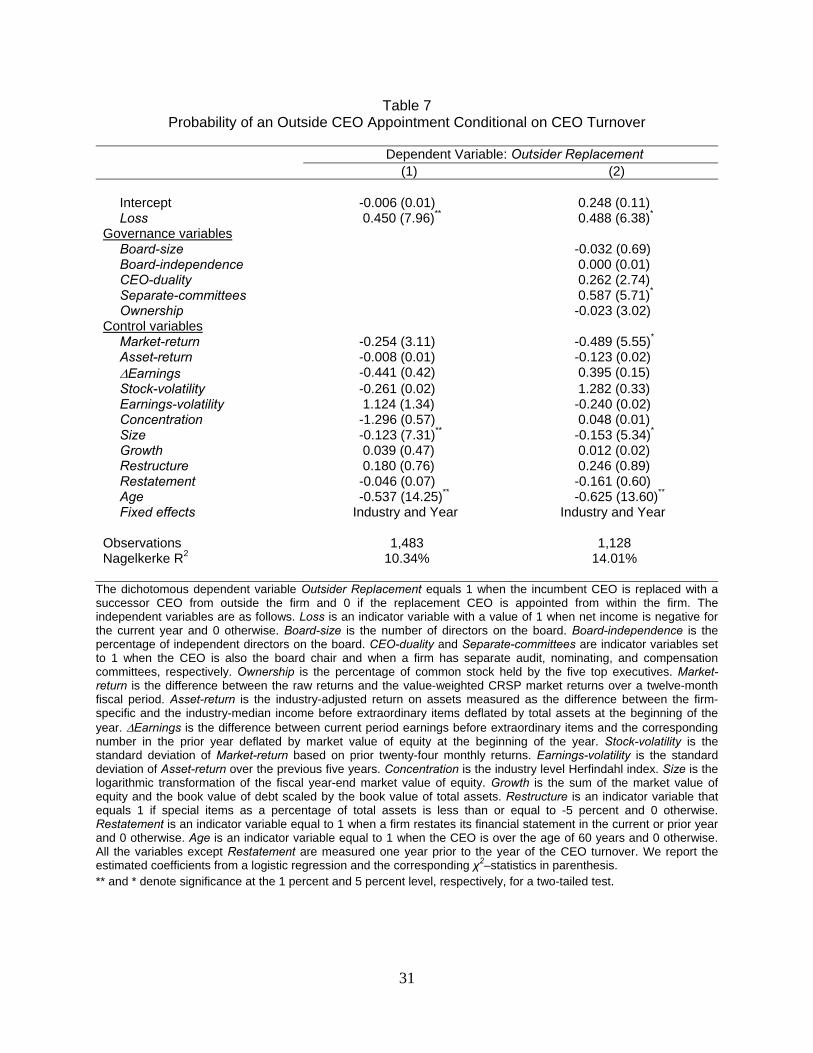
Table 7 Probability of an Outside CEO Appointment Conditional on CEO Turnover
Dependent Variable: Outsider Replacement (1) (2)
Intercept -0.006 (0.01) 0.248 (0.11)
Loss 0.450 (7.96)** 0.488 (6.38)*
Governance variables
Board-size -0.032 (0.69)
Board-independence 0.000 (0.01)
CEO-duality 0.262 (2.74)
Separate-committees 0.587 (5.71)*
Ownership -0.023 (3.02)
Control variables
Market-return -0.254 (3.11) -0.489 (5.55)*
Asset-return -0.008 (0.01) -0.123 (0.02)
ΔEarnings -0.441 (0.42) 0.395 (0.15)
Stock-volatility -0.261 (0.02) 1.282 (0.33)
Earnings-volatility 1.124 (1.34) -0.240 (0.02)
Concentration -1.296 (0.57) 0.048 (0.01)
Size -0.123 (7.31)** -0.153 (5.34)*
Growth 0.039 (0.47) 0.012 (0.02)
Restructure 0.180 (0.76) 0.246 (0.89)
Restatement -0.046 (0.07) -0.161 (0.60)
Age -0.537 (14.25)** -0.625 (13.60)**
Fixed effects Industry and Year Industry and Year
Observations 1,483 1,128 Nagelkerke R2 10.34% 14.01%
The dichotomous dependent variable Outsider Replacement equals 1 when the incumbent CEO is replaced with a successor CEO from outside the firm and 0 if the replacement CEO is appointed from within the firm. The independent variables are as follows. Loss is an indicator variable with a value of 1 when net income is negative for the current year and 0 otherwise. Board-size is the number of directors on the board. Board-independence is the percentage of independent directors on the board. CEO-duality and Separate-committees are indicator variables set to 1 when the CEO is also the board chair and when a firm has separate audit, nominating, and compensation committees, respectively. Ownership is the percentage of common stock held by the five top executives. Market-return is the difference between the raw returns and the value-weighted CRSP market returns over a twelve-month fiscal period. Asset-return is the industry-adjusted return on assets measured as the difference between the firm-specific and the industry-median income before extraordinary items deflated by total assets at the beginning of the year. ΔEarnings is the difference between current period earnings before extraordinary items and the corresponding number in the prior year deflated by market value of equity at the beginning of the year. Stock-volatility is the standard deviation of Market-return based on prior twenty-four monthly returns. Earnings-volatility is the standard deviation of Asset-return over the previous five years. Concentration is the industry level Herfindahl index. Size is the logarithmic transformation of the fiscal year-end market value of equity. Growth is the sum of the market value of equity and the book value of debt scaled by the book value of total assets. Restructure is an indicator variable that equals 1 if special items as a percentage of total assets is less than or equal to -5 percent and 0 otherwise. Restatement is an indicator variable equal to 1 when a firm restates its financial statement in the current or prior year and 0 otherwise. Age is an indicator variable equal to 1 when the CEO is over the age of 60 years and 0 otherwise. All the variables except Restatement are measured one year prior to the year of the CEO turnover. We report the estimated coefficients from a logistic regression and the corresponding χ2–statistics in parenthesis. ** and * denote significance at the 1 percent and 5 percent level, respectively, for a two-tailed test.
31
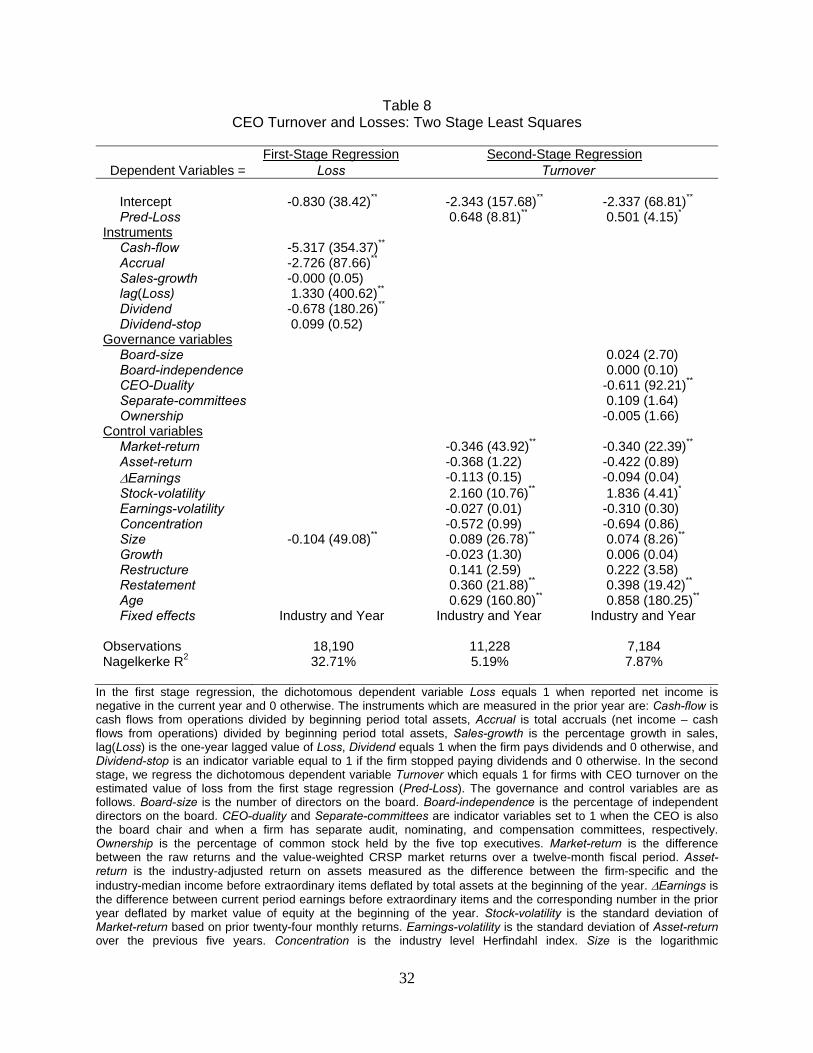
Table 8 CEO Turnover and Losses: Two Stage Least Squares
First-Stage Regression Second-Stage Regression
Dependent Variables = Loss Turnover Intercept -0.830 (38.42)** -2.343 (157.68)** -2.337 (68.81)**
Pred-Loss 0.648 (8.81)** 0.501 (4.15)*
Instruments Cash-flow -5.317 (354.37)** Accrual -2.726 (87.66)** Sales-growth -0.000 (0.05) lag(Loss) 1.330 (400.62)** Dividend -0.678 (180.26)** Dividend-stop 0.099 (0.52)
Governance variables Board-size 0.024 (2.70)Board-independence 0.000 (0.10)CEO-Duality -0.611 (92.21)**
Separate-committees 0.109 (1.64)Ownership -0.005 (1.66)
Control variables
Market-return -0.346 (43.92)** -0.340 (22.39)**
Asset-return -0.368 (1.22) -0.422 (0.89)ΔEarnings -0.113 (0.15) -0.094 (0.04)Stock-volatility 2.160 (10.76)** 1.836 (4.41)*
Earnings-volatility -0.027 (0.01) -0.310 (0.30)Concentration -0.572 (0.99) -0.694 (0.86)Size -0.104 (49.08)** 0.089 (26.78)** 0.074 (8.26)**
Growth -0.023 (1.30) 0.006 (0.04)Restructure 0.141 (2.59) 0.222 (3.58)Restatement 0.360 (21.88)** 0.398 (19.42)**
Age 0.629 (160.80)** 0.858 (180.25)**
Fixed effects Industry and Year Industry and Year Industry and Year
Observations 18,190 11,228 7,184 Nagelkerke R2 32.71% 5.19% 7.87%
In the first stage regression, the dichotomous dependent variable Loss equals 1 when reported net income is negative in the current year and 0 otherwise. The instruments which are measured in the prior year are: Cash-flow is cash flows from operations divided by beginning period total assets, Accrual is total accruals (net income – cash flows from operations) divided by beginning period total assets, Sales-growth is the percentage growth in sales, lag(Loss) is the one-year lagged value of Loss, Dividend equals 1 when the firm pays dividends and 0 otherwise, and Dividend-stop is an indicator variable equal to 1 if the firm stopped paying dividends and 0 otherwise. In the second stage, we regress the dichotomous dependent variable Turnover which equals 1 for firms with CEO turnover on the estimated value of loss from the first stage regression (Pred-Loss). The governance and control variables are as follows. Board-size is the number of directors on the board. Board-independence is the percentage of independent directors on the board. CEO-duality and Separate-committees are indicator variables set to 1 when the CEO is also the board chair and when a firm has separate audit, nominating, and compensation committees, respectively. Ownership is the percentage of common stock held by the five top executives. Market-return is the difference between the raw returns and the value-weighted CRSP market returns over a twelve-month fiscal period. Asset-return is the industry-adjusted return on assets measured as the difference between the firm-specific and the industry-median income before extraordinary items deflated by total assets at the beginning of the year. ΔEarnings is the difference between current period earnings before extraordinary items and the corresponding number in the prior year deflated by market value of equity at the beginning of the year. Stock-volatility is the standard deviation of Market-return based on prior twenty-four monthly returns. Earnings-volatility is the standard deviation of Asset-return over the previous five years. Concentration is the industry level Herfindahl index. Size is the logarithmic
32

transformation of the fiscal year-end market value of equity. Growth is the sum of the market value of equity and the book value of debt scaled by the book value of total assets. Restructure is an indicator variable that equals 1 if special items as a percentage of total assets is less than or equal to -5 percent and 0 otherwise. Restatement is an indicator variable equal to 1 when a firm restates its financial statement in the current or prior year and 0 otherwise. Age is an indicator variable equal to 1 when the CEO is over the age of 60 years and 0 otherwise. All the control variables except Restatement in the second stage regression are measured one year prior to the year of the CEO turnover. We report the estimated coefficients from a logistic regression and the corresponding χ2–statistics in parenthesis. ** and * denote significance at the 1 percent and 5 percent level, respectively, for a two-tailed test.
33
34
Table 9 CEO Turnover and Magnitude of Losses
Dependent variable: Turnover
(1) (2)
Intercept -2.281 (171.92)** -2.270 (168.25)**
Loss 0.459 (38.99)** 0.444 (32.30)**
Loss×Magnitude 0.609 (12.30)** 0.700 (8.66)**
Magnitude -0.091 (0.31)
Control variables Included Included Observations 11,738 11,738 Nagelkerke R2 6.26% 6.26%
The probability estimates of a CEO Turnover when firms report a loss. The dependent variable Turnover is an indicator variable that equals 1 when there is a change in the CEO in the current or subsequent year and 0 otherwise. Loss is an indicator variable with a value of 1 when net income is negative for the current year and 0 otherwise. Magnitude is the absolute value of net income deflated by book value of equity at the beginning of the year. The control variables are the same as those included in Table 3. We report the estimated coefficients from a logistic regression and the corresponding χ2–statistics in parenthesis. ** and * denote significance at the 1 percent and 5 percent level, respectively, for a two-tailed test.