project code: 504051415 for megha …environmentclearance.nic.in/writereaddata/online/risk...project...
TRANSCRIPT

HYDRODYNAMIC MODELLING STUDY FOR DISCHARGE OF
TREATED EFFLUENT FROM ETPs TO SEA AT RAJAHMUNDRY ASSET
IN ANDHRA PRADESH
PROJECT CODE: 504051415
For
MEGHA ENGINEERING & INFRASTRUCTURES LTD.
HYDERABAD
JULY 2014
INDOMER COASTAL HYDRAULICS (P) LTD. AN ISO 9001 : 2008 CERTIFIED COMPANY
63, GANDHI ROAD, ALWAR THIRUNAGAR CHENNAI 600 087.
Tel: (+) 91 44 2486 2482 to 84 Fax: (+) 91 44 2486 2484
Web site: www.indomer.com, E-mail: [email protected]

INDOMER COASTAL HYDRAULICS (P) LTD. 63, Gandhi Road, Alwar Thirunagar
Chennai 600 087. Tel: + 91 44 2486 2482 to 84 Fax: + 91 44 2486 2484
Web site: www.indomer.com, E-mail: [email protected]
Client : Megha Engineering & Infrastructures Ltd., Hyderabad.
Project Title : Hydrodynamic modelling study for discharge of treated effluent from ETPs to sea at Rajahmundry Asset in Andhra Pradesh.
Project Code : 504051415
Abstract : ONGC has established facilities for the extraction of oil and gas in Kesanapalli village located
about 36 km from Amalapuram and 90 km from Rajahmundry in Andhra Pradesh. The effluent
generated from the Kesanapalli facility will be treated in the ETPs and will be released in the
sea. This report presents the results of the modelling study carried out to establish the
suitability of the discharge location.
Foreword :
The materials presented in the report carry the copy right of MEIL and INDOMER and should
not be altered or distorted or copied or presented in different manner by other organizations
without the written consent from MEIL and INDOMER.
References : W. O. No: JV/ MEIL – APLUS/ ICH/ ETP – RJY/ WO/ 02/ 18 dt. 16.5.2014
Date Report Type Originator Checked by Approved by Approved
Draft
11.07.14 Final √ V. Vaigaiarasi K. Dharmalingam P. Chandramohan
Project Code 504051415 Text pages : 15
File Location : F:/2014 Projects/June 14/504. MEIL Table : 1
Figures : 18

MEIL INDOMER
Hydrodynamic modelling study for discharge of treated effluent from July 2014 ETPs to sea at Rajahmundry Asset in Andhra Pradesh
TEAM
Name Qualification Experience Task
Dr. P. Chandramohan Ph.D. (Ocean Engineering)
(Former scientist, CSIR-NIO, Goa) 37 years Project Coordinator
K. Dharmalingam
B.E. (Civil), DIIT (Dock and Harbour Engineering)
(Former UN expert, Ports & Harbours)
41 years QA & QC
Dr. R. Mahadevan Ph.D. (Ocean Engineering)
(Former Professor, IIT, Chennai) 32 years
Project Leader – mathematical
modelling
Dr. R. Alfred Selvakumar Ph.D. (Marine Biology)
(Former Asst. Director General, Marine Fisheries ICAR, New Delhi)
38 years Ecology
Dr. Susant Kumar Misra Ph.D. (Marine Science) 8 years MIKE 21 – AD model
V. Vaigaiarasi M.E. (Hydrology) 2 years CORMIX Model
B. Viswagar M.Sc. (Ocean Science & Tech.) 2 years Mike 21 - HD Flow
model
A.P. Anu M. Tech. (Ocean Tech. &
Management) 2 years
Data interpretation & Report preparation
G. Yogaraj M.Sc. (Ocean Science & Tech.) 6 years Currents, tides & waves
Dr. M. Karuppaiyan Ph. D. (Marine Biology) 6 years Marine Biology
S. Karthikeyan D.C.E. (Civil) 2 years CAD & Reprographics
R. Ranjitha D.C.E. (Civil) 2 years Report preparation

MEIL INDOMER
Hydrodynamic modelling study for discharge of treated effluent from Page i ETPs to sea at Rajahmundry Asset in Andhra Pradesh July 2014
CONTENTS Page
Contents i
List of Tables ii
List of Figures iii
1. INTRODUCTION 1
2. SCOPE 2
3. DETAILS OF DIFFUSER 3
4. MIKE 21 - HYDRODYNAMIC & ADVECTION DIFFUSION MODELS 4
4.1. Methodology
4
4.2. Units and Conventions used 7
4.3. Model Setup 7
4.4. Simulations 10
4.5. Results 10
5. CONCLUSIONS 15
TABLE
FIGURES

MEIL INDOMER
Hydrodynamic modelling study for discharge of treated effluent from Page ii ETPs to sea at Rajahmundry Asset in Andhra Pradesh July 2014
LIST OF TABLES
Table
1. Dilution pattern for three seasons
MEIL INDOMER
Hydrodynamic modelling study for discharge of treated effluent from Page iii ETPs at Rajahmundry Asset in Andhra Pradesh July 2014
LIST OF FIGURES
Figure
1. Location map
2. Satellite imagery
3. Location of LFP and Outfall diffuser
4. Bathymetry map
5. Bathymetry - Modelling Region
6. Comparison of simulated and measured tides
7. Flow field - Fair weather - Spring tide
8. Secondary dispersion - Fair weather - Spring tide
9. Flow field - Fair weather - Neap tide
10. Secondary dispersion - Fair weather - Neap tide
11. Flow field - SW Monsoon - Spring tide
12. Secondary dispersion - SW Monsoon - Spring tide
13. Flow field - SW Monsoon - Neap tide
14. Secondary dispersion - SW Monsoon - Neap tide
15. Flow field - NE Monsoon - Spring tide
16. Secondary dispersion - NE Monsoon - Spring tide
17. Flow field - NE Monsoon - Neap tide
18. Secondary dispersion - NE Monsoon - Neap tide

MEIL INDOMER
Hydrodynamic modelling study for discharge of treated effluent from Page 1 ETPs to sea at Rajahmundry Asset in Andhra Pradesh July 2014
1. INTRODUCTION
ONGC has established facilities for the extraction of oil and gas in Kesanapalli village
located about 36 km from Amalapuram and 90 km from Rajahmundry in Andhra
Pradesh. The effluent generated from the Kesanapalli facility will be treated in the
ETPs. The treated effluent has been proposed to be released in the sea in the
adjacent Bay of Bengal. The marine outfall will have diffuser at the seaward end
with adequate number of diffuser ports to achieve maximum dilution.
The contract has been awarded to MEIL (Megha Engineering & Infrastructures
Limited) for the construction of ETPs and the related pipeline system including
marine outfall. The marine survey at nearshore has been carried by Geostar Surveys
India Pvt. Ltd. The diffuser design has been done by marine pipeline contactor
Hydroair - Tectonics (SPD) Pvt Ltd., Mumbai. The effluent generated in the ONGC
Kesanapalli asset is proposed to be released into open sea at 1500 m offshore at the
water depth of 6.7 m CD (Chart Datum).
In order to comply the partial requirements of ONGC, MEIL has asked Indomer
Coastal Hydraulics (P) Ltd., Chennai, to undertake the mathematical modelling study
on the advection-diffusion of released effluent in the sea. This report presents the
methods and results of the modelling study carried out on the advection-diffusion
of the effluent discharged in the open sea.
The project location is shown in Fig. 1 and the satellite imagery is shown in Fig. 2.
All calendar dates are referred in Indian style as dd.mm.yy (eg. 15.06.14 for
15th June, 2014). The WGS84 spheroid in Zone 44 is followed for the
presentation in this report.

MEIL INDOMER
Hydrodynamic modelling study for discharge of treated effluent from Page 2 ETPs to sea at Rajahmundry Asset in Andhra Pradesh July 2014
2. SCOPE
i. to conduct Hydro-Dynamic modelling study using MIKE 21 software in respect of Advection–Diffusion for the pipeline with outfall diffuser considering environmental parameters such as wave velocity, wave frequency, depth, tidal amplitude, Atterberg limits & plasticity of sediments etc.
ii. to prepare and submit the report.

MEIL INDOMER
Hydrodynamic modelling study for discharge of treated effluent from Page 3 ETPs to sea at Rajahmundry Asset in Andhra Pradesh July 2014
3. DETAILS OF DIFFUSER
MEIL has provided the details on diffuser ports for the discharge of treated effluent
in the report ‘Design of diffuser system (Revised), Document No.
HTSPD/MEIL/DM/101 (REV.0) & Diffuser drawing No. HTSPD/MEIL/DA/08/13
(REV.1)’.
Land Fall Point: The LFP of the outfall is shown in Fig. 3. The details are:
Location Geographical Co-ordinates
(WGS 84) UTM Coordinates
(Zone - 44)
Latitude, N Longitude, E X (m) Y (m)
Land Fall Point (LFP)
16° 23’ 33.20” 81° 55’ 28.00” 0598715.968 1812583.244
Outfall diffuser: The outfall diffuser ports will be located at 1500 m offshore at a
water depth of 6.7 m with respect to Chart Datum. The outfall will have 8 nos. x 225
mm diameter ports oriented 45° to the horizontal. The location of outfall diffuser is
shown in Fig. 3. The details are:
Location Geographical Co-ordinates
(WGS 84) UTM Coordinates
(Zone - 44)
Latitude, N Longitude, E X (m) Y (m)
Outfall Diffuser Port
16° 22’ 44.79” 81° 55’ 34.50” 0598915.452 1811096.568
Outfall volume: MEIL has indicated that the volume of effluent discharge will be
1500 m3/day (≈62.5 m3/hour ≈0.017 m3/s).
Initial Dilution: The above report says that there will be an initial dilution of 163
times. (Page 3).

MEIL INDOMER
Hydrodynamic modelling study for discharge of treated effluent from Page 4 ETPs to sea at Rajahmundry Asset in Andhra Pradesh July 2014
4. MIKE 21 - HYDRODYNAMIC & ADVECTION DIFFUSION MODELS
The mathematical modelling study using Mike 21 HD (hydrodynamic) and AD
(Advection–Diffusion) models has been carried out for the effluent released at
1500 m offshore in 6.7 m water depth having a volume of 1500 m3/day
(≈62.5 m3/hour ≈0.017 m3/s).
The secondary dispersion of the effluent has been estimated using MIKE 21 HD
(hydrodynamic) & AD (Advection – Diffusion) models. This model has been
developed by Danish Hydraulic Institute (DHI), Denmark which is being used
worldwide for many marine discharge problems.
4.1. Methodology
Mike 21 Flow Module (HD): The MIKE 21-Flow module is a multi-dimensional 2D or
3D (present case 2D), hydrodynamic flow simulation model, which solves shallow-
water equations for given boundary conditions to compute non-steady flow fields in
response to a variety of environmental forcing and processes in natural water
bodies. The environmental forcing and processes include: bottom shear stress, wind
shear stress, barometric pressure gradients, Coriolis force, momentum dispersion,
sources and sinks, evaporation, flooding and drying and wave radiation stresses.
This model uses an Alternate Direction Implicit (ADI) Finite Difference Method on
staggered orthogonal grids and also has the option to use Finite Element Method.
The basic shallow-water equations in the Cartesian co-ordinate system used in the
MIKE 21 HD flow module are:
Continuity equation:
eSY
q
X
p
t

MEIL INDOMER
Hydrodynamic modelling study for discharge of treated effluent from Page 5 ETPs to sea at Rajahmundry Asset in Andhra Pradesh July 2014
Momentum equations in x- and y- directions:
iXEXa
W
Xabx SFqX
phWWKF
Xgh
h
qp
Yh
p
Xt
p
2
iYEYa
W
Yaby SFpY
phWWKF
Ygh
h
q
Yh
qp
Xt
q
2
Symbol list
Y
uh
YX
uh
XF YXEX
Y
uh
YX
uh
XF YXEY
bxF = h
p
h
q
h
p
C
g2
2
2
2
2
byF = h
q
h
q
h
p
C
g2
2
2
2
2
(x, y, t) - Water surface level above datum (m)
p(x, y, t) - Flux density in the x-direction (m3/s/m)
q(x, y, t) - Flux density in the y-direction (m3/s/m)
h(x, y, t) - Water depth (m)
S - Source magnitude per unit horizontal area (m3/s/m2)
iXS , iYS - Source impulse in x and y-directions (m3/s/m2.m/s)
e - Evaporation rate (m/s)
g - Gravitational acceleration (m/s2)
C - Chezy resistance No. (m1/2/s)
Ka - Water
airwC
Cw - Wind friction factor
W, WX, WY(x, y, t) - Wind speed and components in x- and y-directions
(m/s)
pa (x, y, t) - Barometric pressure (Kg/m/s2)
ρw - Density of water (kg/m3)
Ω - Coriolis coefficient (latitude dependent) (s-1)
ε(x, y) - Eddy or momentum dispersion coefficient (m2/s)
x, y - Space coordinates (m)
t - Time (s)

MEIL INDOMER
Hydrodynamic modelling study for discharge of treated effluent from Page 6 ETPs to sea at Rajahmundry Asset in Andhra Pradesh July 2014
Advection and dispersion model
The advection-dispersion module (AD) of the MIKE 21 model suite simulates the
spreading of effluent released in an aquatic environment under the influence of the
fluid transport and associated natural dispersion process. The dispersing substance
may be conservative or non-conservative, inorganic or organic: e.g. salt, heat,
dissolved oxygen, inorganic phosphorus, nitrogen and other such water quality
parameters. Applications of the MIKE 21 AD module are in principle essential for
two types of investigations, viz., i) cooling water recirculation studies for power
plants and salt recirculation studies for desalination plants, and ii) water quality
studies connected with sewage outfalls and non-point pollution sources.
This module determines the concentration of the dispersing substance by solving
the equation of conservation of mass for a dissolved or suspended substance. The
concentration of the substance is calculated at each point of a rectangular grid
covering the area of interest using a two-dimensional finite difference scheme.
Information on the transport, i.e. currents and water depths at each point of the
grid, are provided by the MIKE 21 HD module. Other data required in the model
include effluent volume discharged, the concentration of the pollutant, initial and
the boundary conditions.
Governing equation
The MIKE 21 AD module solves the advection-dispersion equation for dissolved or
suspended substances in two dimensions. This is in reality the mass-conservation
equation to which quantities of substances discharged and their concentrations at
source and sink points are included together with their decay rate.
SchFy
CDh
yx
CDh
x)vhc(
y)uhc(
x)hc(
tyx

MEIL INDOMER
Hydrodynamic modelling study for discharge of treated effluent from Page 7 ETPs to sea at Rajahmundry Asset in Andhra Pradesh July 2014
Symbol List C - Compound concentration (arbitrary units)
u, v - Horizontal velocity components in the x, y directions (m/s)
h - Water depth (m)
Dx, Dy - Dispersion coefficients in the x, y directions (m2/s)
F - Linear decay coefficient (1/s)
S - Qs . (Cs – C)
Qs - Source / sink discharge per unit horizontal area (m3/s/ m2)
Cs - Concentration of compound in the source / sink discharge.
Information on u, v and h at each time step is provided by the MIKE 21 HD module.
4.2. Units and Conventions used
Units: Units of all parameters and variables in the model study are according to
international SI conventions. Coordinate system: The coordinate system used for
model grid generation and other horizontal positioning was UTM based on WGS 84
spheroid. Vertical reference level: The depth information used in the tidal flow
models is relative to Mean Sea Level (MSL); depths below MSL are defined negative.
Directions: Current – Ocean current directions refer to the direction towards which
the flow is taking place. Directions of the flow are always given clockwise with
respect to North. The Unit is degrees, where 360 degrees cover the circle. Wind -
Wind directions refer to the direction from which the wind is approaching.
Directions of the wind are always given clockwise with respect to North. The Unit is
degrees, where 360 degrees cover the circle.
4.3. Model Setup
The tide and wind induced flow fields over the study area were simulated using
MIKE 21-HD module. The model domain stretches between the longitudes 81 55’
53.248” E to 81 52’ 55.159” E and latitudes 16 24’ 22.250” N to 16 19’ 34.698” N,

MEIL INDOMER
Hydrodynamic modelling study for discharge of treated effluent from Page 8 ETPs to sea at Rajahmundry Asset in Andhra Pradesh July 2014
with an area of approximately 5 km (perpendicular to coast) x 4 km (parallel to
coast). A rectilinear grid system was used for the simulation of flow field in the
study region. The grid spacing of 50 m was considered in both X & Y directions.
Depth Schematization: For the schematization of depths in the flow model, the
depths of the sea were extracted from: i) DHI - MIKE 21 – C Map data base, and
ii) the measured bathymetry chart surveyed by Geostar Surveys India Pvt. Ltd.
(Fig. 4). The bathymetry used in the model is shown in Fig. 5.
Boundary conditions: The coarse resolution model is forced by the tidal water level
variations along the open sea boundaries. For the generation of these boundary
conditions, the MIKE 21 C-Map data base can be used. These boundary conditions
for the coarse resolution model are prescribed as time series of tidal water level
variations along the open boundaries of the model.
If the tidal constituents along the boundaries of the coarse resolution model are
available, then the boundary conditions are represented by:
n
i
iiiiit )gu)(vt(cosAfAh1
00
With:
ht = Water level at time = t
Ao = Mean value of the signal
Ai = Amplitude of component i
fi = Nodal amplitude factor of component i
i = Angular frequency of component i
(v0+u)i = Astronomic argument of component i
gi = Phase lag of component i

MEIL INDOMER
Hydrodynamic modelling study for discharge of treated effluent from Page 9 ETPs to sea at Rajahmundry Asset in Andhra Pradesh July 2014
Calibration: The model is calibrated using the tides measured from 18.09.13 to
20.09.13. Good agreement is observed among the simulated and the measured
data (Fig. 6).
Seasons: The flow simulations were done for fair weather, i.e. when there is no
wind and it leads to minimum mixing condition (‘conservative scenario’) with the
prevalence of larger mixing zone for the effluent released into the sea. The
simulations were also carried out with wind forcing representing southwest
monsoon and northeast monsoon conditions. In the presence of wind, the sea
becomes more turbulent with high waves and the flow becomes stronger which
then leads to good mixing with less mixing zone.
The tidal effects on currents in the nearshore region particularly in the study area
are small and the currents are generally dominated by wind. By the onset of
southwest monsoon, the coastal currents turn gradually and tend to prevail
consistently towards north. Consequently, with the commencement of northeast
monsoon, the nearshore currents tend to be consistently northward. Hence during
monsoons, the discharge released through the diffuser tends to travel in coast
parallel direction, towards south in NE monsoon and north during SW monsoon.
To represent monsoon seasons, the normal wind conditions expected during the
southwest and northeast monsoons, i.e. 10 m/s, corresponding to 25% exceedence
was used in the model. For the flow simulation during the fair weather, no wind was
introduced in the model. In the secondary dispersion studies, the discharge of
effluent introduced at any grid cell is assumed to be uniformly dispersed over the
entire volume of water in this grid cell.
To represent monsoon seasons, the normal wave conditions expected during the
Fair weather (0.6 m wave height with a wave period of around 10s) and southwest
and northeast monsoons (1.2 m wave height with a period of 8 s), corresponding to

MEIL INDOMER
Hydrodynamic modelling study for discharge of treated effluent from Page 10 ETPs to sea at Rajahmundry Asset in Andhra Pradesh July 2014
25% exceedence was used in the model. In the secondary dispersion studies, the
discharge of effluent introduced at any grid cell is assumed to be uniformly
dispersed over the entire volume of water in this grid cell.
Input to AD Model
Details of Outfall: The volume of effluent discharge will be 1500 m3/day
(≈62.5 m3/hour ≈0.017 m3/s).
4.4. Simulations
In each simulation, the flow field and the mixing pattern were obtained for a period
of one lunar month (i.e. 28 days). Totally three number of simulations were carried
out to cover three seasons.
4.5. Results
Fair weather
The flow simulation and the corresponding secondary dispersion of the effluent for
fair weather with no wind condition representing conservative mixing scenario are
presented.
Spring tide
Flow: The tide induced flow fields during different phases of tide on a spring tidal
day are shown in Fig. 7. During the peak flood flow, the tidal current speed reaches
up to 0.12 m/s and it is directed towards northeast. During the peak ebb flow, the
current speed reaches up to 0.11 m/s and directed towards southwest. During the

MEIL INDOMER
Hydrodynamic modelling study for discharge of treated effluent from Page 11 ETPs to sea at Rajahmundry Asset in Andhra Pradesh July 2014
slack hours, the current speed remained very much less (< 0.02 m/s) and it was
reversing its direction.
Dilution: The extent of dilution of the effluent at 3 hourly interval during flood and
ebb tides corresponding to the spring tidal day is shown in Fig. 8. From the dilution
pattern, the effluent is found to spread parallel to coast from the outfall diffuser.
The effluent gets diluted to nearly 50 times within 50 m distance from the outfall. It
gets further diluted to nearly 100 times at a distance of 200 m in the alongshore
direction from the outfall.
Neap tide
Flow: The tide induced flow fields during different phases of tide on a Neap tidal
day are shown in Fig. 9. During the peak flood flow, the tidal current speed reaches
up to 0.09 m/s and it is directed towards northeast. During the peak ebb flow, the
current speed reaches up to 0.07 m/s and directed towards southwest. During the
slack hours, the current speed remained very much less (< 0.01 m/s) and it was
reversing its direction.
Dilution: The dilution of the effluent during the flood and ebb tides at 3 hourly
intervals corresponding to the Neap tidal day is shown in Fig. 10. From the dilution
pattern, the effluent is found to spread radially around outfall point. The effluent
gets diluted to nearly 50 times within 100 m from the outfall. It gets further diluted
to nearly 100 times at the distance of 300 m in the alongshore direction from the
outfall.

MEIL INDOMER
Hydrodynamic modelling study for discharge of treated effluent from Page 12 ETPs to sea at Rajahmundry Asset in Andhra Pradesh July 2014
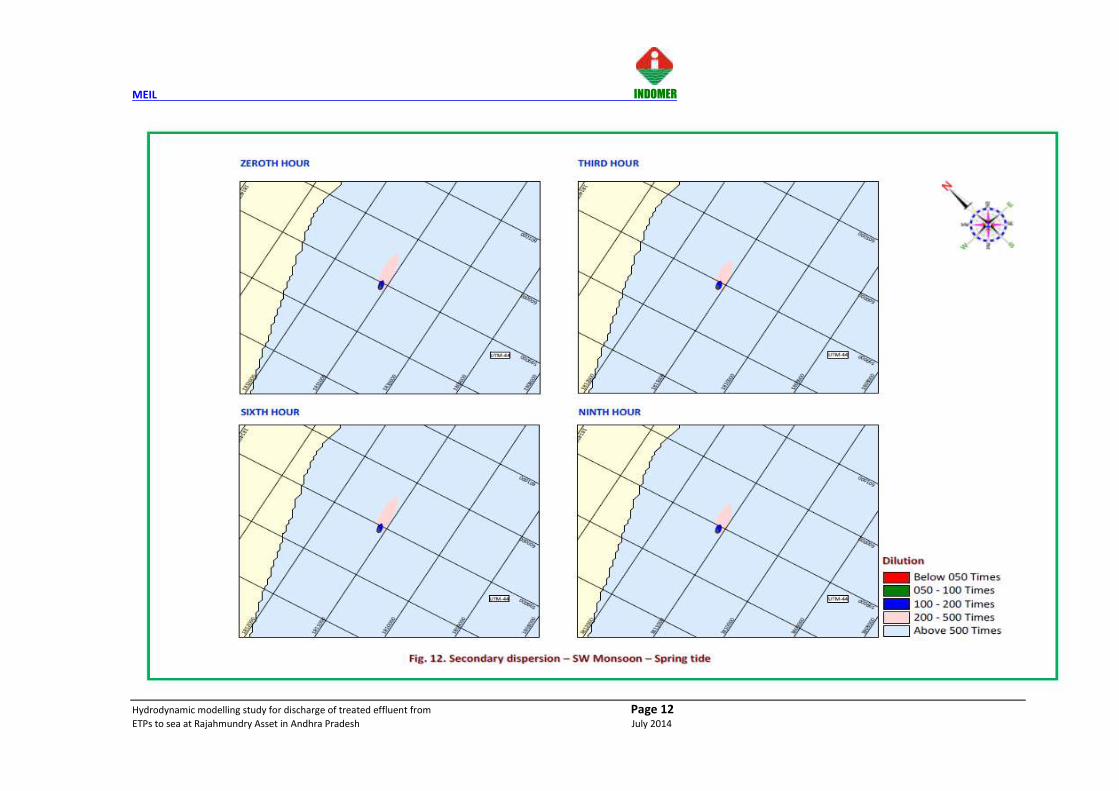
SW monsoon
Spring tide
Flow: The tide induced flow fields during different phases of tide on a spring tidal
day are shown in Fig. 11. During the peak flood flow, the tidal current speed reaches
up to 0.15 m/s and it is directed towards east. During the peak ebb flow, the current
speed reaches up to 0.13 m/s and directed towards east. During the slack hours, the
current speed remained very much less (< 0.08 m/s) and it was reversing its
direction.
Dilution: The dilution of the effluent during the flood and ebb tides at 3 hourly
intervals corresponding to the spring tidal day is shown in Fig. 12. From the dilution
pattern, the effluent is found to spread radially around outfall point. The effluent
gets diluted to nearly 50 times within 50 m from the outfall. It gets further diluted to
nearly 100 times at the distance of 150 m in the alongshore direction from the
outfall.
Neap tide
Flow: The tide induced flow fields during different phases of tide on a Neap tidal
day are shown in Fig. 13. During the peak flood flow, the tidal current speed reaches
up to 0.13 m/s and it is directed towards east. During the peak ebb flow, the current
speed reaches up to 0.11 m/s and directed towards east. During the slack hours, the
current speed remained very much less (< 0.08 m/s) and it was reversing its
direction.
Dilution: The dilution of the effluent during the flood and ebb tides at 3 hourly
intervals corresponding to the neap tidal day is shown in Fig. 14. From the dilution
pattern, the effluent is found to spread radially around outfall point. The effluent

MEIL INDOMER
Hydrodynamic modelling study for discharge of treated effluent from Page 13 ETPs to sea at Rajahmundry Asset in Andhra Pradesh July 2014
gets diluted to nearly 50 times within 100 m from the outfall. It gets further diluted
to nearly 100 times at the distance of 200 m in the alongshore direction from the
outfall.
NE monsoon
Spring tide
Flow: The tide induced flow fields during different phases of tide on a spring tidal
day are shown in Fig. 15. During the peak flood flow, the tidal current speed reaches
up to 0.14 m/s and it is directed towards southwest. During the peak ebb flow, the
current speed reaches up to 0.13 m/s and directed towards southwest. During the
slack hours, the current speed remained very much less (< 0.08 m/s) and it was
reversing its direction.
Dilution: The dilution of the effluent during the flood and ebb tides at 3 hourly
intervals corresponding to the spring tidal day is shown in Fig. 16. From the dilution
pattern, the effluent is found to spread radially around outfall point. The effluent
gets diluted nearly 50 times within 50 m from the outfall. It gets further diluted to
nearly 100 times at the distance of 150 m in the alongshore direction from the
outfall.
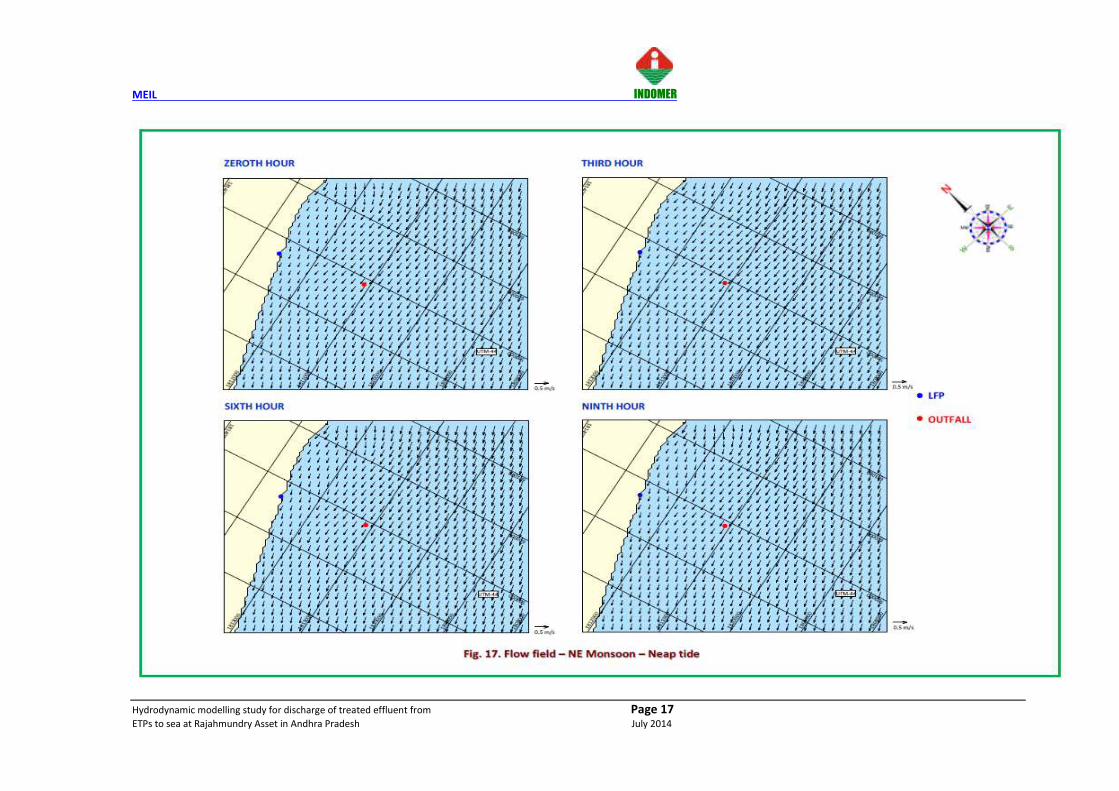
Neap tide
Flow: The tide induced flow fields during different phases of tide on a Neap tidal
day are shown in Fig. 17. During the peak flood flow, the tidal current speed reaches
up to 0.12 m/s and it is directed towards southwest. During the peak ebb flow, the
current speed reaches up to 0.11 m/s and directed towards southwest. During the
slack hours, the current speed remained very much less (< 0.04 m/s) and it was
reversing its direction.

MEIL INDOMER
Hydrodynamic modelling study for discharge of treated effluent from Page 14 ETPs to sea at Rajahmundry Asset in Andhra Pradesh July 2014
Dilution: The dilution of the effluent during the flood and ebb tides at 3 hourly
intervals corresponding to the neap tidal day is shown in Fig. 18. From the dilution
pattern, the effluent is found to spread radially around outfall point. The effluent
gets diluted nearly 50 times within 100 m from the outfall. It gets further diluted to
nearly 100 times at the distance of 200 m in the alongshore direction from the
outfall. Dilution pattern for three seasons is given in Table 1.

MEIL INDOMER
Hydrodynamic modelling study for discharge of treated effluent from Page 15 ETPs to sea at Rajahmundry Asset in Andhra Pradesh July 2014
5. CONCLUSION
It has been planned to discharge the treated effluent of 1500 m3/day
(≈62.5 m3/hour ≈0.017 m3/s) in the sea at 1500 m offshore in water depth of 6.7 m
CD. The outfall will have multiple ports of 8 nos. x 225 mm diameter ports oriented
45° to horizontal.
It is reported that the jet plume from the outfall port will undergo initial dilution of
163 times.
The MIKE 21 modelling study shows dispersion leading to a higher dilution of
100 times within 300 m distance in fair weather; and within 100 m distance in
southwest monsoon and northeast monsoon periods. The increase in turbulence is
due to stronger currents (> 0.5 m/s) induced by monsoon wind and rough seas that
enhances the mixing during the southwest monsoon and northeast monsoon.
Thus the study shows that the impact due to the discharge of the effluent on the
marine environment would be insignificant.
Hence, it is recommended that the effluent collected from the ETPs can safely be
discharged into the open sea at the identified location of 1500 m offshore where the
water depth is 6.7 m CD.

MEIL INDOMER
Hydrodynamic modelling study for discharge of treated effluent from Page 16 ETPs to sea at Rajahmundry Asset in Andhra Pradesh July 2014
Table 1. Dilution pattern for three seasons
SEASONS Tidal phases Dilution (Times)
Mixing of dilution (m)
Spring tide Neap tide
FAIR
WEA
THER
Low tide slack
Below 50 50 50
50 100 150
100 200 300
Flooding phase
Below 50 - 50
50 75 100
100 200 300
High tide slack
Below 50 - 50
50 75 200
100 200 500
Ebbing phase
Below 50 - -
50 100 100
100 250 400
SW M
ON
SOO
N
Low tide slack
Below 50 50 50
50 75 100
100 200 200
Flooding phase
Below 50 50 50
50 50 100
100 150 200
High tide slack
Below 50 50 50
50 75 100
100 150 200
Ebbing phase
Below 50 50 50
50 75 100
100 200 200
NE
MO
NSO
ON
Low tide slack
Below 50 100 50
50 150 150
100 250 200
Flooding phase
Below 50 50 50
50 50 100
100 150 200
High tide slack
Below 50 50 50
50 75 100
100 150 200
Ebbing phase
Below 50 50 50
50 100 100
100 200 250

MEIL INDOMER
Hydrodynamic modelling study for discharge of treated effluent from Page 1 ETPs to sea at Rajahmundry Asset in Andhra Pradesh July 2014

MEIL INDOMER
Hydrodynamic modelling study for discharge of treated effluent from Page 2 ETPs to sea at Rajahmundry Asset in Andhra Pradesh July 2014

MEIL INDOMER
Hydrodynamic modelling study for discharge of treated effluent from Page 3 ETPs to sea at Rajahmundry Asset in Andhra Pradesh July 2014

MEIL INDOMER
Hydrodynamic modelling study for discharge of treated effluent from Page 4 ETPs to sea at Rajahmundry Asset in Andhra Pradesh July 2014

MEIL INDOMER
Hydrodynamic modelling study for discharge of treated effluent from Page 5 ETPs to sea at Rajahmundry Asset in Andhra Pradesh July 2014

MEIL INDOMER
Hydrodynamic modelling study for discharge of treated effluent from Page 6 ETPs to sea at Rajahmundry Asset in Andhra Pradesh July 2014

MEIL INDOMER
Hydrodynamic modelling study for discharge of treated effluent from Page 7 ETPs to sea at Rajahmundry Asset in Andhra Pradesh July 2014

MEIL INDOMER
Hydrodynamic modelling study for discharge of treated effluent from Page 8 ETPs to sea at Rajahmundry Asset in Andhra Pradesh July 2014

MEIL INDOMER
Hydrodynamic modelling study for discharge of treated effluent from Page 9 ETPs to sea at Rajahmundry Asset in Andhra Pradesh July 2014

MEIL INDOMER
Hydrodynamic modelling study for discharge of treated effluent from Page 10 ETPs to sea at Rajahmundry Asset in Andhra Pradesh July 2014

MEIL INDOMER
Hydrodynamic modelling study for discharge of treated effluent from Page 11 ETPs to sea at Rajahmundry Asset in Andhra Pradesh July 2014
MEIL INDOMER
Hydrodynamic modelling study for discharge of treated effluent from Page 12 ETPs to sea at Rajahmundry Asset in Andhra Pradesh July 2014

MEIL INDOMER
Hydrodynamic modelling study for discharge of treated effluent from Page 13 ETPs to sea at Rajahmundry Asset in Andhra Pradesh July 2014

MEIL INDOMER
Hydrodynamic modelling study for discharge of treated effluent from Page 14 ETPs to sea at Rajahmundry Asset in Andhra Pradesh July 2014

MEIL INDOMER
Hydrodynamic modelling study for discharge of treated effluent from Page 15 ETPs to sea at Rajahmundry Asset in Andhra Pradesh July 2014

MEIL INDOMER
Hydrodynamic modelling study for discharge of treated effluent from Page 16 ETPs to sea at Rajahmundry Asset in Andhra Pradesh July 2014
MEIL INDOMER
Hydrodynamic modelling study for discharge of treated effluent from Page 17 ETPs to sea at Rajahmundry Asset in Andhra Pradesh July 2014

MEIL INDOMER
Hydrodynamic modelling study for discharge of treated effluent from Page 18 ETPs to sea at Rajahmundry Asset in Andhra Pradesh July 2014