public health reports - europe pubmed central
TRANSCRIPT
Public Health ReportsVol. 63 * SEPTEMBER 17, 1948 * No. 38
Effect of Topically Applied Fluoride onDental Caries Experience 1
VI. Experiments with sodium fluoride and calcium chloride...Widely spaced applications . . . Use of different solutionconcentrations
By DONALD J. GALAGAN, Dental Surgeon, and JOHN W. KNUTSON, Senior DentalSurgeon, Public Health Service
Previous reports in this series (1, 2,3, 4, 5) oni the effects of tepicallyapplied fluoride on dental caries experience indicate that uIniderI thleconditions of the application technique employed: (1) A series offour topical applications of a 2 percent solution of sodiumn fluoride",preceded by a single dental cleansing, effects a 40 percent re(luctioinin dental caries incidence. More than four applications do not in-crease the caries-prophylactic effect. (2) The caries-iinhibiting valueof topically applied sodium fluoride is not appreciably decrease(1during a 3-year period following treatment. (3) The omission ofdental cleansing prior to a series of applications reduces the effective-ness of topically applied sodium fluoride solutioni by approximatelyhalf. (4) Application of a saturated solution of lead fluoride (0.06percent),, using the same application techniquie as for solutions ofsodium fluoride, is not associated with a significant redluctioni in theincidence of dental decay.
This report presents the results of seven additional stud(lies designiedto investigate the possibility of increasing the caries-inhibiting effectof topically applied fluoride solutions. Briefly, the results of thesestudies indicate: (1) The application of a 2 percent solution ofsodium fluoride to the teeth, followed immediately by a 5 percentsolution of calcium chloride, does not increase the caries-proplhylacticeffect over that accomplished by the use of a solution of sodiurmfluoride alone. (2) An increase in the time interval between applica-tions of the fluoride solution in a given series of applications from oneor two a week to one each 3 or 6 months decreases the caries-prophy-
I From the Dental Public Health Section, States Relations Division, Public Healthl Service, Washing-ton, D. C., in cooperation with the Dlvision of Dental Hygiene, Ohio State Department of Health, andthe Troy-Miami County Department of Health.
(1215)

Septemllber 17, 1948
lactic effect observed. (3) A concentration of 1 percent solution ofsodium fluoride appears to be equally as effective in inhibiting newdental decay as a 2 percent sodium fluoride solution.
Materials and Methods
Duiring the period from May to December 1946, groups of schoolchildren in Bradford, Tipp City, Newton, and Piqua, Ohio-all inMiami County-were givenI applications to the teeth in hialf themouth. as follows:Group 1. Two applications of a 2 percent solutioin of sodium fluoride followed bythe application of a 5 percent solution of calcium chloride, usiiig cotton applicator,and given at the rate of one or two treatments a week, without initial cleansing ofthe teetb.Group 2. Two applications of a 2 percent solution of sodium fluoride followed bythe application of a 5 percent solution of calcium chloride, using cottoII applicator,anid given at the rate of one or two treatments a week, with initial cleansing of theteeth.Group 3. Four applications of a 2 percent solution of sodium fluoride followed bythe application of a 5 percent solution of calcium chloride, uising cotton applicator,and given at the rate of one or two treatments a week, with initial cleansing of theteeth.Group 4. Three applicationis of a 2 percent solution of sodium fluoride, usinlg cottonapplicator, and given at the rate of oine treatment each 3 months, cleansing of theteeth preceding each application.Group 5. Two applications of a 2 percenit solution of sodium fluoride, using cottonapplicator, and given at the rate of one treatment each 6 months, cleansing ofthe teeth preceding each application.Group 6. Two applicationls of a 1 percent solution of sodium fluoride, using spraybottle, and given at the rate of one or two treatments a week, with initial cleansingof the teeth.Group 7. Four applications of a 1 percent solution of sodium fluoride, using spravbottle, and given at the rate of one or two treatments a week, with initial cleansingof the teeth.
In approximately half the children in each group, teeth in upperand lower right mouth quadrants were treated; in the other half ofthe children, teeth in left mouth quadrants were treated. Teeth inuntreated mouth quadrants served as controls. Fine pumice pasteand motor driven rubber cup were used for cleansing the teeth. Adetailed dental examination was made and the findings recorded foreach of the children before treatment was begun.The examinations were made with a No. 4 plane mouth mirror and
a double end No. 5 explorer, under artificial light and with com-pressed air available for use at the discretion of the examiner. Thetreatment consisted of isolating the teeth of the treated side withcotton rolls, drying with compressed air and wetting the crown sur-faces with the treatment solution by using either cotton applicator or
1216
1217 September 17, 1948
a fine spray. The applied solution was allowed to dry in air for from3 to 4 minutes and then the cotton rolls were removed and the childdismissed.
In the case of the first three study groups, the crown surfaces ofthe teeth were wet with a 5 percent solution of calcium chlorideafter the solution of sodium fluoride had dried. The calcium chloridesolution was also permitted to dry in air.One year after the series of applications were begun, the children
were reexamined. Analysis of the data on caries experience is con-fined to tlhe erupted permanent teeth present at the time of the initialexamination.The age classification of the children in eachi of the seven study
groups reported is shown in table 1. The number of males and femalesin each group is approximately equal.
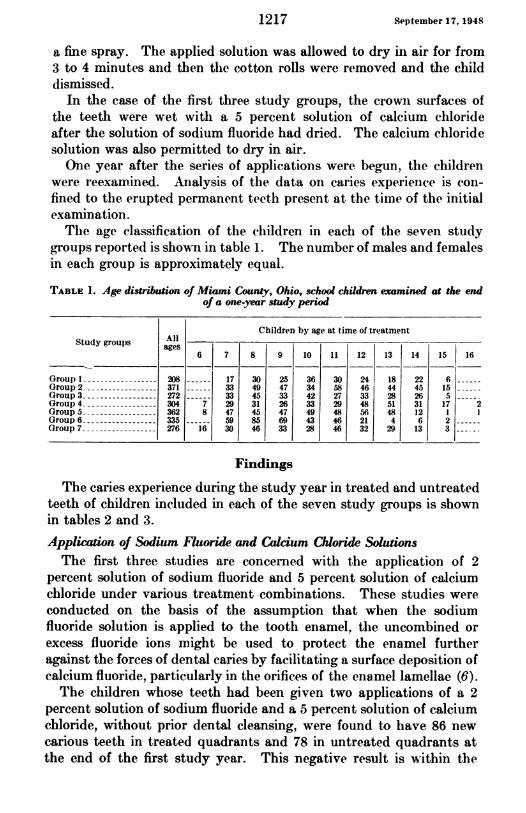
TABLE 1. Age distribution of Miami County, Ohio, school children examined at the endof a one-year study period
Children by age at time of treatmentStudy groups ages
6 7 8 9 10 11 12 13 14 15 16
Group I - 208 17 30 25 36 30 24 18 22 6fGroup 2 -371 33 49 47 34 58 46 44 45 15--Group 3 - ---------- 272 33 45 33 42 27 33 28 265-Group 4 ----------- 304 7 29 31 26 33 29 48 51 31 172Group 5 - ---------- 362 8 47 45 47 49 48 56 48 121Group 6 -335 59 85 69 43 46 21 4 6 2Group 7 -276 16 30 46 33 28 46 32 29 13 3
Findings
The caries experience during the study year in treated and untreatedteeth of children included in each of the seven study groups is shownin tables 2 and 3.Application of Sodium Fluoride and Calcium Chloride SolutionsThe first three studies are concerned with the application of 2
percent solution of sodium fluoride and 5 percent solution of calciumchloride under various treatment combinations. These studies wereconducted on the basis of the assumption that when the sodiumfluoride solution is applied to the tooth enamel, the uncombined orexcess fluoride ions might be used to protect the enamel furtheragainst the forces of dental caries by facilitating a surface deposition ofcalcium fluoride, particularly in the orifices of the enamel lamellae (6).The clhildren whose teeth had been given two applications of a 2
percent solution of sodium fluoride and a 5 percent solution of calciumchloride, without prior dental cleansing, were found to have 86 newcarious teeth in treated quadrants and 78 in untreated quadrants atthe end of the first study year. This negative result is within the
September 17, 1948 1218
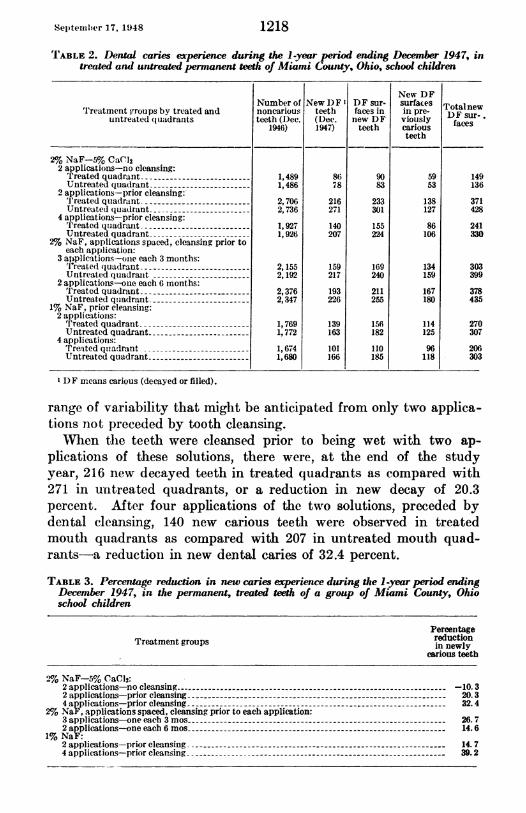
TABLE 2. Dental caries experience during the 1-year period ending December 1947, intreated and untreated permanent teeth of Miami County, Ohio, school children
New DFNumber of New 1DF DDF sur- surfaces Totalnew
Treatment groups by treated and noncarious teeth faces in in pre- DF sur-untreated (I uadrants teeth (Dec. (Dec. new DF viously faces
1946) 1947) teeth cariousteeth
21% NaF-5%o CaCJ2 applications-no cleansing:Treated quadrant -1,489 86 90 59 149Untreated quadrant- 1,486 78 83 53 136
2 applieationis-prior cleansing:'I'reated qua(lrzant -------- 2,706 216 233 138 371Untreated( quadrant -2,736 271 301 127 428
4 applications-prior cleansing:Treated qtuadrat -- 1,927 140 155 86 241Unitreated quadrant -- 1,926 207 224 106 330
2% NaF, applications spaced, cleansing prior toeach application:
3 aliplications-one each 3 months:'freate(d (quadrant -2,155 159 169 134 303Untreated quadrait -2,192 217 240 159 399
2 applications-one each 6 months:Treated quadrant -_ - 2,3376 193 211 167 378Untreated qtuadrant- 2,347 226 255 180 435
1% NaF, prior cleansing:2 applicationis:
'lTreated quadrant -------- - 1,769 139 156 114 270Untreated quadrant- 1,772 163 182 125 307
4 applications:treatedqtiadrant - 1,674 101 110 96 206Untreated quadrant -1,680 166 185 118 303
DF imcans carious (decayed or filled).
range of variability that might be anticipated from only two applica-tions not preceded by tooth cleansing.When tlle teeth were cleansed prior to being wet with two ap-
plications of these solutions, there were, at the end of the studyyear, 216 new decayed teeth in treated quadrants as compared with271 in untreated quadrants, or a reduction in new decay of 20.3percent. After four applications of the two solutions, preceded bydental cleansing, 140 new carious teeth were observed in treatedmoutlh quadrants as compared with 207 in untreated mouth quad-rants-a reduction in new dental caries of 32.4 percent.
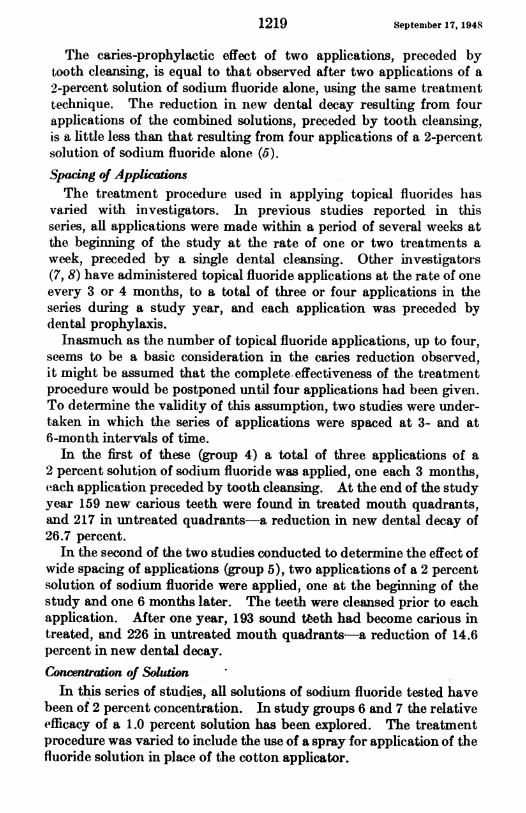
TABLE 3. Percentage reduction in new caries experience during the 1-year period endingDecember 1947, in the permanent, treated teeth of a group of Miami County, Ohioschool children
Treatment groups
Percentagereductionin newly
carious teeth
90 NaF-5% CaCd2:2 applications-no cleansing --10.32 applications-prior cleansing -20.34 applications-prior cleansing - 32.4
20% NaF, applications spaced, cleansing prior to each application:3 applications-one each 3 mos -26.72 applications-one each 6 mos -14.6
1% NaF:2 applications-prior cleansing -14. 74 applications-prior cleansing -39.2
September 17, 1948
The caries-prophylactic effect of two applications, preceded bytooth cleansing, is equal to that observed after two applications of a2-percent solution of sodium fluoride alone, using the same treatmenttechnique. The reduction in new dental decay resulting from fourapplications of the combined solutions, preceded by tooth cleansing,is a little less than that resulting from four applications of a 2-percentsolution of sodium fluoride alone (5).Spacing of ApplicationsThe treatment procedure used in applying topical fluorides has
varied with investigators. In previous studies reported in thisseries, all applications were made within a period of several weeks atthe beginning of the study at the rate of one or two treatments aweek, preceded by a single dental cleansing. Other investigators(7, 8) have administered topical fluoride applications at the rate of oneevery 3 or 4 months, to a total of three or four applications in theseries during a study year, and each application was preceded bydental prophylaxis.Inasmuch as the number of topical fluoride applications, up to four,
seems to be a basic consideration in the caries reduction observed,it might be assumed that the complete.effectiveness of the treatmentprocedure would be postponed until four applications had been given.To determine the validity of this assumption, two studies were under-taken in which the series of applications were spaced at 3- and at6-month intervals of time.
In the first of these (group 4) a total of three applications of a2 percent solution of sodium fluoride was applied, one each 3 months,each application preceded by tooth cleansing. At the end of the studyyear 159 new carious teeth were found in treated mouth quadrants,and 217 in untreated quadrants-a reduction in new dental decay of26.7 percent.
In the second of the two studies conducted to determine the effect ofwide spacing of applications (group 5), two applications of a 2 percentsolution of sodium fluoride were applied, one at the beginning of thestudy and one 6 months later. The teeth were cleansed prior to eachapplication. After one year, 193 sound teeth had become carious intreated, and 226 in untreated mouth quadrants-a reduction of 14.6percent in new dental decay.Concentration of Solution
In this series of studies, all solutions of sodium fluoride tested havebeen of 2 percent concentration. In study groups 6 and 7 the relativeefficacy of a 1.0 percent solution has been explored. The treatmentprocedure was varied to include the use of a spray for application of thefluoride solution in place of the cotton applicator.
1219

Septemiber 17, 1 948
Two applications of a 1 percent solution were made within a weekor two after dental cleansing, and after one year, 139 new cariousteeth were observed in treated mouth quadrants, and 163 in untreatedquadrants-a percentage reduction of 14.7 in new dental caries.FouI applicatioins of a 1 percenit solution of sodium fluoride effecteda reduction of 39.2 percent in new decay, with 101 new decayed teetlamong those treated and 166 among teeth untreated.
Summary
A study of the incidence of new dental decay in seven groups ofMiami County, Ohio, children who received topical fluoride applica-tions on the teeth in half the mouth has been presented and analyzed.The seven separate studies may be divided into three general groups:
1. Children whose teeth were given applications of 2 percent solu-tion of sodium fluoride and 5 percent solution of calcium chloride, onegroup receiving two applications without prior tooth cleansing;another group, two applications with prior tooth cleansing, and thethiird group four applications with prior tooth cleansing. All applica-tions were given at the rate of one or two a week at the beginning ofthe treatment period.
2. Children whose teeth were given two and tlhree applications of2 percent solution of sodium fluoride spaced intermittently over thefirst study year, each application preceded by a dental cleansing.
3. Children whose teeth were given by the spray method two andfour applications of 1 percent solution of sodium fluoride, with priortooth cleansing, all applications being given at the rate of one or twoa week at the beginning of the treatment period.
Analysis of the data for the first study year indicates:1. The use of calcium clhloride as a supplemental treatment to
applications withi a 2 percent solution of sodium fluoride does notenhance the caries-inhibitive action of sodium fluoride alone.
2. An increase in the spacing between applications of a 2 percentsolution of sodium fluoride from one or two weekly, to 3-month orto 6-montlh time intervals, decreases the observed caries-inhibitingaction and apparently postpones the time when the full effectivenessof four applications is operative.
3. Apparently a 1 percent solution of sodium fluoride is as effectiveas a 2 percent solution. However, clinical experience witlh the caries-prophiylactic effect of a 2 percent solution is at present far moreextensive than witlh solutions of lower concentration.
4. Application of the fluoride solution to the teeth by means of aspray appetars to be as effective as wheni application is made by cottonapplicator.
1220
1221 Se'p'temolber 17, 1948
REFERENCES
(I) Knutson, John W. aind Armstronig, Wallace 1).: The effeet of topically apl)liedsodium fluoride on denital caries experieince. I. Report of find(inogs for thefirst study year. Pub. Health Rep. 58: 1701. (1943).
(2) : Ibid. II. Report of finidinigs for the seconid study year. Pulb).Health Rep. 60: 1085. (1945).
(3) : Ibid. III. Report of finidings for the third study year. Ptib.Health Rep. 61: 1683. (1946).
(4) Knutsoni, Johni W. Armilstronig, WVallace D., anid Feldmnan, Floy(l At.: Theeffect of topically applied sodiinu fluoride oni denital caries experienice. IV.Report of findinigs with two, fouir aind six applications. Pub. Health Rtep.62: 425. (1947).
(5) Galagan, Donald J., anid Knutttsoni, Johni W.: The effect of topically appliedfluorides on dental caries experience. V. Report of finditngs with two,four and six applications of sodium fluoride anid of lead flutoride. Pub.Health Rep. 62: 1477. (1947).
(6) Souder, W., and Schoonover, I. C.: Experimerntal reinineralizatioii of denzitn.Am. Dent. A. J. 31: 1579. (1944).
(7) Bibbv, B. G.: New approach to caries prophylaxis. Tufts Denital Ouitlook.15:4. (1942).
(8) Bibby, B. G. aiid Tureskv, S. S.: A note oIn the duratioii of caries inhibitionproduiced bv fluoride applicatiotis. J. Dent. Res. 26: 105. (1947).
Dentist-time for Children's Services'By ERNA LANDSIEDEL and ISIDORE ALTMAN
Public Health Service
The data presented in this paper on time per dental service wvereobtained in studies made by the Public Health Service in cooperationwith the Children's Fund of Michigan at four of the clinics sponsoredby the Fund. Results of similar time studies made in the clinicsof the Philadelphia Mouth Hygiene Association have been reportedin an earlier paper (1). The average time intervals determinedfor specific individual operations in the routine and most frequlentlyoccurring dental services given to preschool and school childrenin the Children's Fund clinics reflect a program somewhat differentin its policies and procedures.
Information on the time required for basic services furnishie(iunder different methods of operation and routines is of interest sincethe time element is an important factor in the choice of treatmentthat will produce a maximum amount of care for the chil(d populationof a community. The data presented here bring togetlher actualexperiences observed in established programs which have pioneeredin dental care for large groups of children. These data for specifiedroutines are of value particularly in view of the continued emphiasisXFrom the Division of Public Health Methods.
802101-48-2

September 17, 1948
on services to insure and maintain the dental health of children.It is generally accepted that the effort to meet their needs has priorityin attacking the country's dental problem.
Dental Program of the Children's Fund of Michigan
The Children's Fund of Michigan was created in 1929 by the lateSenator James Couzens, "To promote the health, welfare, happiness,and development of the children of the State of Michigan primarily,and elsewhere in the world." In line with this objective there hasbeen in existence since 1929 a dental program 'which provides treat-ment for indigent children throughout a good part of Michigan.Personnel-Generally a full-time staff of 20 to 30 dentists is assigned
to the clinics. In some of the sparser areas, several clinics may bemanned by the same dentist, who spends a part of the year in each.In each clinic visited there was a dental assistant who set up thetrays, sterilized the instruments, took care of the record files, recordedthe examination findings, and charted the work done.
Eligibility-Eligibility for dental services is based on a meanstest and is limited by age and school status. A child on reaching hissixteenth birthday or graduating from the eighth grade, whicheveroccurs first, is no longer eligible. Preschool children are treatedif the family is eligible for care. No charge is made for any of theFund's dental services.
Procedures-Examinations, with mirror and explorer only, aremade at the first of each new series of visits. All filings and extrac-tions are done under a local anesthetic, except that loose deciduousteeth may be extracted without anesthesia. The anesthetic is admin-istered to three or four patients in succession and then work is begunon the first patient injected. Complicated extractions are not han-dled, but patients may be referred to private specialists at the expenseof the Fund. It is required that a cement base be placed in all cavities,and pulp cappings are employed wherever necessary. Prophylaxesare done by the dentist only when considered necessary and subsequentto all other treatment.
Material and Method of the Study
Clinics studied-The four dental clinics studied were the clinic mHamtramck; the Oakland County clinic, located just outside RoyalOak; the Bay County clinic in Bay City; and the SanilacCounty dental unit while operating in Sandusky. The first two clinicsserve urban areas, the third, a mixed rural and urban area, and thefourth, a predominantly agricultural area. The Oakland Countyclinic also serves as a training center for newly employed dentists.
1222
3Septewber 17, 1948
Method of recording time per service-Tlhe clock hour and minuteswere called out to the assistant by the dentist at the beginning of anoperation and again when it was completed. These time records wereaccumulated over an average period of 10 weeks per clinic. Time forfillings was tabulated only where the treatment indicated for a toothhlad been completed, whether one surface or more than oine surfacewas filled.Number of observations-The total number of children oni whom
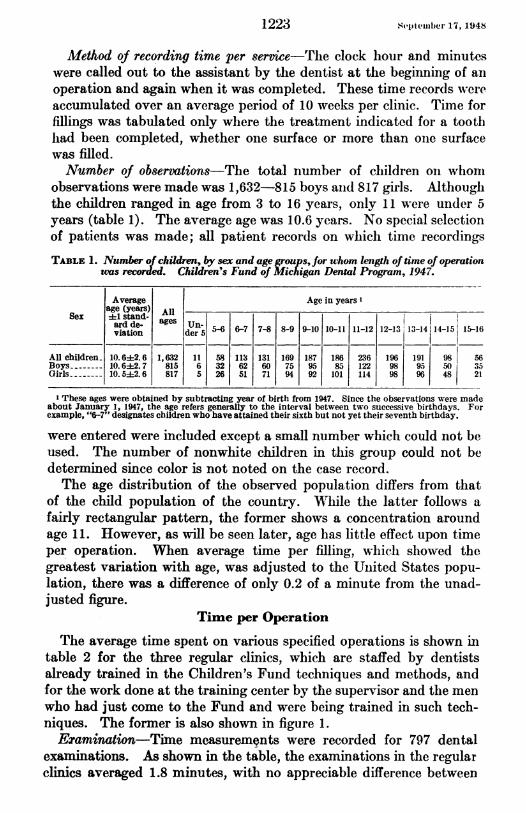
observations were made was 1,632-815 boys aind 817 girls. Althouglthe children ranged in age from 3 to 16 years, only 11 were under 5years (table 1). The average age was 10.6 years. No special selectionof patients was made; all patient records on which time recordingsTABLE 1. Number of children, by sex and age groups,for whom length of time of operation
was recorded. Children's Fund of Mlichigan Dental Program, 1947.
Average Age in years'age (years) All
Sex 4±1 stand.viadtien a dern 5-6 6-7 7-8 8-9 9-10 10-11 11-12 12-13 3lo -1411415 15-16
All children 10.6:4:2.6 1,632 11 58 113 131 169 187 186 236 196 191 98| 56Boys- 10. 642. 7 815 6 32 62 60 75 95 85 122 98 95 50 35Girls- 10.5+2.6 817 5 26 51 71 94 92 101 114 98 96 48 21
1 These ages were obtained by subtracting year of birth from 1947. Since the observations were madeabout January 1, 1947, the age refers generally to the interval between two successive birthdays. Forexample, "6-7" designates children who have attained their sixth but not yet their seventh birthday.
were entered were included except a small number which could not beused. The number of nonwhite children in this group could not bedetermined since color is not noted on the case record.The age distribution of the observed population differs from that
of the child population of the country. Whlile the latter follows afairly rectangular pattern, the former shows a concentration aroundage 11. However, as will be seen later, age has little effect upon timeper operation. When average time per filling, which showed thegreatest variation with age, was adjusted to the Uinited States popu-lation, there was a difference of only 0.2 of a minute from the unad-justed figure.
Time per Operation
The average time spent on various specified operations is shown intable 2 for the three regular clinics, which are staffed by dentistsalready trained in the Children's Fund techniques and methods, andfor the work done at the training center by tthe supervisor and the menwho had just come to the Fund and were being trained in such tech-niques. The former is also shown in figure 1.Examination-Time measurements were recorded for 797 dental
examinations. As shown in the table, the examinations in the regularclinics averaged 1.8 minutes, with no appreciable difference between
1223

Septemiber 17, 1948 1224
boys and girls. At the training center an average of 2.3 minutes wasgiven to an examination. It frequently happened that further inspec-tion while work was being done revealed additional needs which wouldthen be recorded.
Tooth-filling-The term "tooth-filling" is used here to indicate thatfillings are being considered on a per tootlh basis. The time recordedfor a tooth-filling includes the time required for injecting the localanesthetic added to the time taken to prepare the cavity and to placea cement base and thie filling. Thie average time for this operationcame to 16.1 minutes in the regtular clinics and to 31.4 minutes at theTABLE 2. Average time per specified operation in regular clinics and in the training
center. Children's Fund of Michigan Dental Program, 1947.
Extraction
Clinic and sex Examina- Tooth- Polishing Prophy-tion flling Deciduous Permanent axis
teeth teeth
Average time (minutes)i 1 standard deviation 2
Regular clinicsAll children -1.8+0. 8 16.11+ 6.7 2.22+1.7 4.1+2.-9 7. 0+4. 1 5.8+2.7
Boys -1.8+0.7 16.0+ 6.4 2.3+1.7 4.3+3.2 -- 5.8+1.9Girls -1. 8+0. 9 16.33+ 7.0 2.2+1. 8 3.9+2.6 7.2+4.4 5.88+3.2
Training centerAll children -2.341.3 31.44+15.1 3.243. 0 4.7±4. 1 8.44+9.3 9.8±4.9Boys---------------- 2.3-1.6 .30.7±14.9 3.4±3.6 4.6±3.4-
Girls -2.2±1. 1 32.00+15.3 2.9+2. 4 4. 8+4. 7 7.2±5.9 10.5±5.4
Number of observations
Regular clinicsAll children -514 1,550 364 170 16 44Boys-- -------------- 269 795 201 88 4 18Girls -245 755 163 82 12 26
Training centerAll children -283 522 175 65 19 18Boys - ----- -------- 130 246 86 35 6 5Girls ------ -------- 153 276 89 30 13 13
X The average time to completely fill a tooth irrespective ofnumber of fillings or filling surfaces involved.2 Averages based on 10 or less observations are omitted.
training center. An average of 1.4 fillings per tooth was placed in the16.1 nlinutes taken to complete a tooth-filling. Differences betweenboys and girls were too small to have any apparent significance.To give the anesthetic generally took between one and two minutes.
When more than one tooth was filled at a single visit, the time for theanesthetic was divided equally among the teeth filled.E.traction-In the regular clinics, extraction time averaged 2.2
minutes for deciduous teeth and 4.1 minutes for permanent teeth.The corresponding figures for the training center were 3.2 and 4.7minutes, respectively. These figures include the time taken to givethe local anesthetic.
It was pointed out earlier that the anesthetic, which is requiredfor all children, is given to a group of patients and that work is thenbegun directly on tile first one anesthetized. Tabulations were made

1September 17. 194M
of the time that each patient waited, after receiving the anesthetic,until the extraction was begun. Such observations of the intetvalbetween anesthetic and extraction, obtained on 512 children's visitsaveraged 34.1 minutes. The waiting period did not seem to presentany hardship to the patients, as the school children generally wouldcome in a group and be excused when treatmenit of the group wascompleted. Reasons for this arrangement were that it cut to a mini-mum the disturbance of the school's routine, permitted an easiercheck on the children's attendance at the clinic, andI guaranteed thedentist a suifficient volume of work.
EXAMINATION
FILLING
DECIDUOUSEXTRACTION
PERMANENT .EXTRACTION
POLISHING -.
PROPHYLAXIS
I _ I -I .
U 2 4 6 8 10 12 14 16 18MINUTES PER OPERATION
Figure 1. Average number of minutes per specified treatment in the regular clinics.Children's Fund of Michigan, 1947.
A comparison of multiple and single extractions done in the regularclinics shows marked differences. The average time taken for adeciduous extraction when only one was done was 3.1 minutes; whentwo teeth were extracted, each took 1.8 minutes. Single extractionsof permanent teeth averaged 4.6 minutes while for two in a singlesitting they averaged 2.8 minutes per tooth.
In one of the clinics a record was kept of the supervised bleedingtime following extractions. The length of time a patient waitedbefore being discharged averaged 23.6 minutes after deciduous ex-tractions and 30.5 minutes after the extraction of permanent teeth.The child did not stay in the dental chair during this time.Polishing-Only a small number of polishings were recorded because
time for this operation was frequently either not reported or combinedwith time for prophylaxis. The average time in the regular clinics,based on 16 observations, was 7.0 minutes; the average for 19 obser-vations at the training center was 8.4 minutes.
1225
S.epteniber 17. 1'948 1
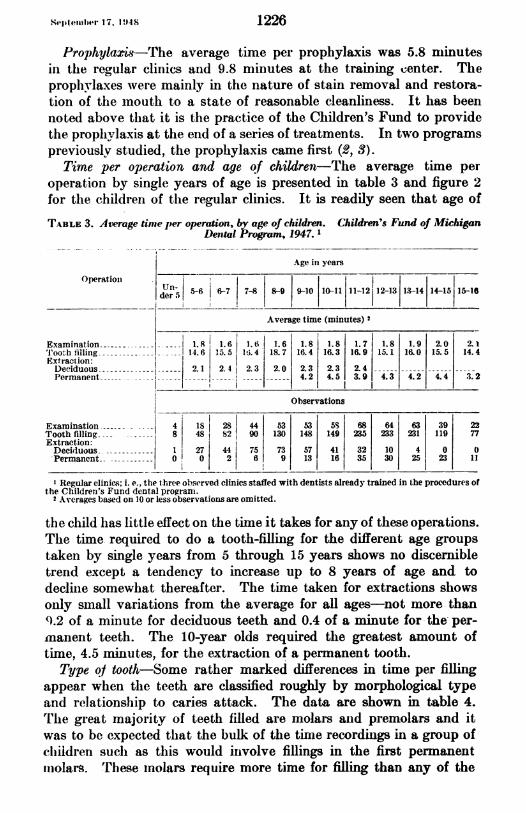
Prophylaxis-The average time per prophylaxis was 5.8 miinutesin the regular clinics and 9.8 nminutes at the training center. Theprophylaxes were mainly in the nature of stain removal and restora-tioIn of the mouth to a state of reasonable cleanliness. It has beennoted above that it is the practice of the Clhildren's Fund to providethe prophylaxis at the end of a series of treatments. In two programspreviously studied, the prophylaxis came first (2, 3).
Time per operation and age of children--The average time peroperation by single years of age is presented in table 3 and figure 2for the children of the regular clinics. It is readily seen that age of
TABLE 3. Average time per operation, F age of children. Children's Fund of MichiganDerstal Program, 1947.
Age in years
Operatioil.5-6 -6-7 7-8 8-9 9-10 10-11 11-12I12-13 1.3-14 14-15 15-16
Average time (minutes) 2
Examination - 1.8 1.6 1.6 1.6 1.8 1.8 1.7 1.8 1.9 2.0 2.1'Tooth filling -- 14.6 15.5 I li. 4 18.7 16.4 16.3 16.9 15.1 16.0 15.5 14.4Extraction:Deciduous 2.1 2.4 2.3 2.0 2.3 2.3 2.4Permanent --- - - 4.2 4.5 3.9 4.3 4.2 4.4 3.2
I__-IObservations
Examination- 4 181 28 44 53 53 5S 68 64 63 39 22
Extracthion: 8 48 82 90 130 148 149 235 233 231 119 77Decidluous 11 27 44 75 73 57 41 32 10 4 0 0Permanent. 0 0 2 f6 9 13 16 35 30 25 23 11
I Regular clinics; i. e., the three observed clinics staffed with dentists already trained in the procedures ofthe Children's Fund dental progranm.
2 Averages based on 10 or less observations are omitted.
the child hlas little effect on the time it takes for any of these operations.The time required to do a tooth-filling for the different age groupstaken by single years from 5 through 15 years shows no discernibletrend except a tendency to increase up to 8 years of age and todecline somewhat thereafter. The time taken for extractions showsonly small variations from the average for all ages-not more than9.2 of a minute for deciduous teeth and 0.4 of a minute for the- per-manent teeth. The 10-year olds required the greatest amount oftime, 4.5 minutes, for tlle extraction of a permanent tooth.
Type o/ tooth-Some rather marked differences in time per fillingappear when the teeth are classified roughly by morphological typeand relationship to caries attack. The data are shown in table 4.The great majority of teeth filled are molars aind premolars and itwas to be expected that the bulk of the time recordings in a group ofchiidren suchi as this would inivolve fillings in the first pennanentmnolars. These molars require more time for filling than any of the
1226

1227
20
16z
0
-
12at0
II8uxrz
z4
0
Ietpteiiiher 17. 1 948
Under 5.5 5.5 6.5 7.5 8.5 9.5 10.5 11.5 12.5 13.5 14.5 15.5AGE IN YEARS
Figure 2. Average number of minutes per specified treatment and age of childrentreated. Children's Fund of Michigan, 1947.
others, 17.7 minutes on the average as compared with 13.2 minutesfor the permanent upper incisors and 12.4 minutes for the permanentbicuspids. By the same token the dentists spend more time pertooth on the deciduous molars, 15.2 minutes, than on the otherdeciduous teeth, 11.3 minutes.TABLE 4. Average time to fill tooth, y type of tooth, for children attending the regular
clinics. Children's Fund ofM in Dental Program, 1947. 1
Tooth groups '
I II III IV V VI
Average time to flll tooth (minutes)--- 15.2 11.3 13.2 12.4 17.7 11.0Number of teeth- 259 10 50 287 939 5
XSee table 3, footnote 1.2 Deciduous:
I Upper and lower molars.II All other deciduous teeth.
Permanent:III Upper central and lateral incisors.IV Upper and lower pre-molars.V Upper and lower molars.VI All other permanent teeth.
Time per dentist-Observations of the time per operation are pre-3ented in table 5 for each of 8 dentists. Dentists A, B, and C arcthe operators in the regular clinics as defined above; the remaining
Troothe-tfie tirntgjAverage time
rPe rmanent ext raction.>Ave-rage time _-_ _
do Deciduous extraction
CAverage time
l l l l l l l l l l a

i plei.er 7., 19t48 1228
dentists are the supervisor and trainees at the training center. Anappreciable difference is shown in the mean time per filling and ex-traction between the two groups. The trainees were just out ofnilitary service and were in the process of adjusting to somewhatdifferent techniques. The data do not afford any reliable conceptionof age and experience as factors in the speed of these operators.
''A1III.E 5. AlivraigE tinme per operation by dentist. Children's Fund of Michigan DentalProgram, 1947.
Dentists XOperal io,r--- ---i----
p A B C 1) E F ( If
Average t:me (minutes)2
Prophylaxis -4.2 7.8 6.5 -- --
Tooth-filling -18.2 16.4 15.5 23. 0 29.8 33.3 37.8 32.6Extraction -2.9 2.6 4.6 2.4 6.8 4.5 2.7 4.5
Number of observations
Prophyl:axis -20 12 12 4 10 3 0 1Tooth-filliig -145 635 770 117 69 88 119 129Extraction -89 410 35 88 16 20 43 7:,
Dl)entists E, F, (, anid H are operators in training.2 Averages Naused oni 1(1 or less observations are omitted.
Comparison with Other Studies
ln table 6, the data on the basic operations studied in the tllreeregular clinics of the Children's Fuind have been added to the tabularsummary presented in the Philadelphia paper (1) in which comparisonswitlh other studies were discussed. The same code used in thePhiladelphia studv was adapte(d to tabulating the Michigan data an(d
T.BIE 6. Comparison of time data from four studies. Children's Fund of MichiganDental Program, 1947.
Children's Philadel-Fund of phia Mouth Brand- Lee-
Item Michigan Hygiene horst 3 Jones4Dental Associa-
Program tion 2
N uIIl)er of dentists reporting -3 12 8Number of children -1,182 1,068 6.644Age grouip (ycars) -3-16 4-17 5 5-17MIinutess for:Prophylaxis and examination -7.6 15.5 20 30Tooth-filling -16.1 16.8 37 45Extraction:Deciduous- 2.2 9.3 ---5 15Permanent -4.1 12.5 - ' 27 5' 20
.__
D1)ata for regular clinics onily; dentists worked with dental assistants.2 See reference (1). Dentists assisted by dental hygienists.3,S<3ee reference (5).4 See reference (4).5 Time spent in waiting for anesthetic to take effect is included.From data for young adults.
1229 September 17, 1948
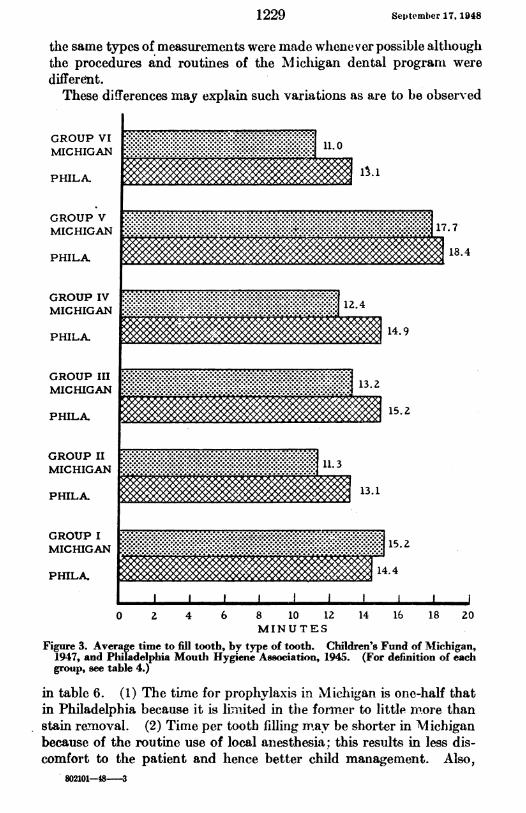
the same types of measurements were made wlhenever possible altlhoughthe procedures and routines of the Michiigan dental programi weredifferett.These differences may explain such variations as are to be observed
GROUP VI . . .. ........
.GROUP VI . ..... ........I............V.......
MICHIGAN ......
............................... .. ..................................
PHILA. 14.9
GROUP V .
MICHIGAN .. ..
GROPHILA. 15.2......................... ..........4
MICHIGAN
PHILA. 13.1
GROUP II 13..... . . . .>
MICHIGAN ~~~~~~~~~~~~~~~~~~~~~~~~~~~~~~~~~~~~~~~~~.
MICHIGAN .5.2
PHILA. 144
0 2 4 6 8 10 12 14 16 18 20MIN U TES
Figure 3. Average time to fill tooth, by type of tooth. Children's Fund of Michigan,1947, and Philadelphia Mouth Hygiene Association, 1945. (For definition of eachgroup, see table 4.)
in table 6. (1) The time for prophylaxis in Michig,an is one-half thatin Philadelphia because it is limi-ited in the form-ei to little niore thanstain re.-moval. (2) Time per tooth filling may be shorter in Michiganbecause of the routine use of local anesthesia; this results in less dis-comfort to the patient and hence better child management. Also,
802101-48-3

September 17, 1948
some minor cavities are not treated because of the Fund's aim tospread its services to as many children as possible. It is interesting toobserve that when comiparison is nmade of time per filling accordingto type of tooth the differences are fairly consistent. Figure 3 hasbeen prepared to bring this out. (3) Extraction time is so very muchslhortei in M1ichig,an because the child does Inot wait in the dentalchair wlhile the anestlhetic takes effect.The other studies have been reported in such a way as to make
comparisons with the MNIichigan data difficult. The estimates of timeby Lee and Jones (4) were made for them by practicing dentists, andthe study of St. Louis children reported by Brandhorst is ]iase(d ondata "compiled from reports submitted by good operators" (5).As was said in the report of the Philadelphia study, "The time re-corded in the two latter reports is far in excess of that observed in thepresent study, but we do not know just how the observations weremade and what factors were taken into consideration; for example,the time for polishing is very likely included with the time for fillingin these reports. Conditions may be sufficiently different betweenprivate practice and that in clinics, where assistants maintain a routineconstant flow of patients, to account in large part for these variationsin time." Valid contrast is indicated only between studies which aremade by parallel methods and for which equivalent time measurementsare defined.
Klein, Dollar and Bagdonas have also reported recently on dentisttime required to perform dental observations (6). They found theaverage time per operative procedure-as distinguished from a pros-thetic procedure-to be 8.7 minutes for children under 10 years and14.2 minutes for patients 10 through 19 years. This is in generalaccord with the findings here and in the Philadelphia study.
Summary
1. Time per dental operation was recorded for some 3,700 servicesreceived by 1,632 children. The observations were made in fourclinics of the Children's Fund of Michigan, including the center fortraining dentists new to the Fund.
2. The operations for which time was observed were the moreroutine ones: examination, filling, extraction, polishing, and prophy-laxis. The average time for each procedure is presented in the text.
3. Age of the child slhowed no discernible relationship to time perspecific operation.
4. The permanent molars were the teeth that took longest to fill,17.7 minutes on the average.
5. Dentists already familiar with the Fund's procedures performedeach operation in half the average time required by new trainees.
1230
1231 September 17, 1948
6. Comparison is made with time per service observed in an earlierstudy of the clinics of the Philadelphia-Moutlh Hygiene Association.Differences in the rates are apparently due to differences in the pro-cedure for lhandling patients.
ACKNOWLEDGMENT
This study was made possibl( by the wholehearted interest and assistance ofDr. Kenneth R. Gibson, Director of the Children's Fund dental program. Dr.Gibson generously arranged for the use of the Fund's clinic facilities and records.Thanks- are also due to the cliric dentists and all their staff who gave unstintinglyof th31ir time to provide the information needed.
REFERENCES(1) Altman, Isidore: Time per service in a children's dental clinic. Pub. Health
Rep. 61:1211 (1946).(2) : Dental services received by children in a New York clinic. Pub.
Health Rep. j2:1355 (1947).(3) - : Services and visits in a children's dental clinic. Pub. Health Rep.
62:113 (1947).(4J Lee, Roger I., and Jones, Lewis W.: The fundamentals of good medical care.
Chicago, University of Chicago Press, 1933 (Committee onI the Costs ofMedical Care, Publication No. 22).
(5) Brandhorst, 0. W.: Some facts that should be considered in any plan fordental service for the masses. J. Am. Coll. Dentists, 5:273 (1938).
(6) Klein, Henry; Dollar, MIelvin, and Bagdonas, Joseph E.: Dentist-time re-quired to perform dental operations. J. Am. Dent. Assoc. 35:153 (1947).
Effects of a New Tetrazolium Derative on Tisue,Bacteria, and Onion Root Tips'
By WILAM ANTOPOL, Susi GLAUBACH, and LEsTR GOLDMAN
For the past few years we have used the nitroprusside reaction forlocalization of active -SH groups in tissues. However, because of thesolubility and diffusion of the resultant colored compound, satisfactorymicroscopic preparations could not be obtained and therefore preciselocalization could not be determined. The use of tetrazolium deriva-tives as a test reagent for seed germination (1, 2, 3, 4) is of great interestin the field of cellular physiology as they represent promising tools inthe study of active cell processes. Recently tetrazolium derivativesbecame commercially available and a substance called Neotetrazolium 2
I From the Division of Laboratories, Newark Beth Israel Hospital, Newark, N. J. Aided by a granfrom the Dorothea Lichtman Fund of the Newark Beth Israel Hospital Research Foundation. Presentedat the National Institutes of Health, July 13, 1948.
2 Purchased from the Pannone Chemical Company, Farmington, Conn. (Trade names are carried as ame of identifying the products under discussion, and do not represent endorsement by the Public HealthService.)

September 17, 1948
(hereafter designated as NT in text) was obtained. The formula forthis compound is:
Cl- ci-
Thi Ner,\ti- prdue a tbeprlet lc ooro5 eutoN N N N
o CC61ts CcHs
This derivative produced a s'table purple to black color on reductionby living cells. In addition, the stailned tissue could be fixed in neutral10-percent formalin without loss of color. The substance also was lesstoxic than others previously tested and therefore could be usedin vivo.
Reaction of Neotetrazolium on Supravital Tissues
Slices of freslh tissue, approximately 2 mm. thiclk, were incubatedat 370 C. with 0.5 percent NT dissolved in 0.85 percent sodium chlo-ride. The tissues assumed a purplish color, usually in less than one-half hotu. This color increased in intensity, as a rule reaching amaximum in one lour. The development of the color appeared earlierin the more deeply imnmersed portions than on the surface closer tothe air. In addition, the color in the former area wa-s more intense.With fresh tissue the fluid as a rule did not become purple.The color change varied strikingly with different tissues. Thus
fibrous tissue stained little, if at all, in contrast to muscle, epithelialtissues, and parenchymal organs: such as liver and kidney whichstained deep purple to black. In the brain, the gray matter was stainedintensely and the white matter weakly; maligrLant tumors stained veryrapidly and more intensely than normal parenebymal tisisue. Fattissue took on a diffuse pinl to orange bue.
Tissue immersed in NT and kept in the refrigerator for 24 hoursshowed no color development. However, if thlis was then placed inthe incubator at 370 C., the same reaction, with slightly less intensitythan for freslh tissue, was obtained. If the tissue was incubatedoverniglht at 370 C. with 0.85 percent NaCl and then NT was added,slight color changes were produced in the tissue, but the fluid alsobecame purple. If this fluid was boiled, a stained precipitate wasobtained. Tissue which was kept at room temperature for 24 hoursand then incubated witlh NT showed considerably less intense colorchlange than freslh tissue. Boiled tissue did not react with NT.
Tissue immersed in NT at 370 C., even for seven days, did notautolyze or putrify and there was little effect on the cell morphologyin stained sections. Tissues previously fixed in formalin or.ethyl
1232
1233 September 17, 1948
alcohol did not react with NT. Tissue treated with NT and then fixedin neutral 10 percent formalin showed more contrasting color thanbefore fixation. Frozen sections made of the formalin fixed tissuerevealed intracytoplasmic purple to black granular and crystallinedeposits. In some cells, it was suggestive that this reaction tookplace in organoid portions of the cell. The nuclei of normal cells didnot stain. On the basis of alcohol and chloroform extraction, thereappears to be more than one component of the colored substance.A systematic investigation is being made of all organs. We are
reporting here on the changes produced in the liver and kidney.Microscopically in the liver (after one hour incubation), dark
staining intracytoplasmic granules and needle-like intracytoplasmiccrystals were present, most pronounced in the parenchymal cells andslightly in the duct cells. The nuceli remained unstained. If thetissue was incubated for 24 hours the cytoplasm of smooth musclealso contained the inclusions, and the endothelium stained only afterprolonged incubation.
In the kidney, the deposition was also present only in the cellcytoplasm. This was most striking in the tubules.' Cells of theglomeruli were stained but it was difficult to determine whether itwas in the epithelial or endothelial elements; the impression was thatit involved the former. Cells of the parietal layer of Bowman'scapsule were stained.
In Vivo Effects of NT in Mice
Mice injected daily intraperitoneally in the lower abdominalquadrants with 0.5 cc. of a 0.1 percent NT, for periods varying from1 to 21 days, showed intense staining of the skin, the liver, and thekidney cortex, in addition to the peritoneum. The peritoneal fatwas diffusely pink.
Histologic examination of the liver showed changes similar to thoseproduced in supravital tissues except that the color was due to veryfine black granules in the cytoplasm of the parenchymal cells. Theduct cells remained clear, the Kupfer cells were unaffected exceptafter repeated dosing. The kidney also showed very fine black intra-cytoplasmic granules and these, in contrast to those in the supravitalstudies, were more pronounced in the collecting and convolutedtubules. The glomeruli remained clear.
If injections were made subcutaneously or intraperitoneally in micewith sarcoma 180, there was a faint purple hue in the non-necroticportions of the tumor. The effect of this and related substances onvarious types of tumors are being studied.
1233
September 17, 1948
Effects of NT on Bacteria
When 5 drops of a 0.5 percent solution of NT were added to 20cc. plain broth containing actively growing (18-hour) cultures ofBacillus pyocyaneous, Streptococcus viridans, Streptococcus haemolyticus,Staphyloccus aureus, Bacillus proteus, Bacillus subtilis, Escherichia coliand Bacillus mucosus capsulatus, the preparation, in varying periodsof time, usually less than 30 minutes, became purple in color. Micro-scopic examination of unstained preparations showed the colorchanges to be due to black inclusions in the organisms. This gavea striking beaded appearance to bacilli. In cultures of gram positiveorganisms, many of the bacteria lost their gentian violet fastness.In the case of cocci this was difficult to observe in organisms in whichthe entire body was black. The organisms revealed morphologicchanges not unlike those obtained with penicillin. With time thecolor became progressively more intense and a black sediment ofhighly pigmented bacteria fell to the bottom of the tube. When NThad distinct bacteriocidal activity, the supernatant fluid becameclear, i. e., with Streptococcus haemolyticus. With Streptococcusviridans, many of the bacteria died and fell to the bottom of the tube.Some gurvived as manifested by a slightly cloudy and faintly purplecolor in the upper layer. Microscopic examination showed the colorhere also to be due to inclusions in the bacteria. With otherorganisms, as B. coli, B. proteus, and B. pyrocyaneus, the colorbecame diffusely black and the organisms apparently remain viableand multiply. Kuhn and Jerchel (5) found that their tetrazoliumcompounds also stained bacteria.
In the case of actinomycosis (obtained from a dental lesion) theorganism was grown in 20 cc. semi-solid medium. Five drops of a0.5 percent solution of NT dropped on the surface produced a purplecolor wherever the organism grew. Here also the color was due tointracellular inclusions.The effect on Mycobacterium tuberculosis was similar. The organ-
isms were grown on fluid and Petragnini medium. After the additionof 5 drops of 0.5 percent solution of NT to 20 cc. of medium, a purplecolor was apparent in the growing colonies in less than 5 minutes,gradually becoming more intense, finally black. The organisms stillretained their acid fast properties and if no counterstain was used,black bodies contrasted with the fuchsin stained portions of thebacteria. The growth of the organism in the above culture wasmarkedly inhibited after the addition of NT.With all the above organisms, as the color changes occurred, there
was marked swelling and distortion of the cell body with numerousb)izarre shapes, giant forms, and chain arrangement.
1234

S41etea1l,er- 1,. 1914s
With some organisms the clhanges in glucose brotlh varied soinewlatfrom those in plain brotlh due in all likelihood to aci(d production.'ThIlis is beiIng studied.
Plate assays employing Staphylococcus aureus, using 3 drops of a0.5 percenlt solution of NT in the cup, were set up. After 18 houIrsthere was a clear zoine, 20 mnm. in diameter, in whiclh there was nogrowth. About this was a thin puirple-black ring. Peripheral to thisritng was a wi(ler liglt purple zone. Culture from the wide zoneshowedlgrowth for the first 48 hours afteir wlicil the organisms lost theirviability. If the plate was permnittedl to incubate for 72 hours,a second thin deep purple ring formed at the periphery of the widepurple zone. This ring was less dense than the first ring.
In penicillin cup assays, a ring of increased growth in which -SHgroups could be detected was obtained about the clear zone (6, 7).With NT, both purple rings are also probably areas of increased growtlwith marked reducing activity as evident by- increased formazanformation. Pratt and! Dufreiioy (7) used tiriplhernyltetrazoliumchloride as an indicator for incre.ased growth oIn penicillin assay plates.
Clear zones about the cup were obtained with Streptococcu.?haemolyticus, B. mucosus capsulatus, Streptococcus viridans, Staphy-lococcus aureus, and B. subtilis.With B. proteus, B. pyocyaneous, and E. coli, Ino clear zones were
present but purple zones and rings formed about the cup. These wereoften multiple with deep purple to black narrow rings separatinglighter purple broader zones.
Effect of NT on Onion Root Tips3
Onion roots grown at room temperature in tap water containing NTin conceintrations from 1:20,000 to 1:60,000 became purple within 2to 6 hours at room temperature. The process was decidedly accel-erated in the incubator at 370 C. The significant feature was theaccumulation of the reduced substance in the merostematic portionof the tip, the site of marked growthi. When excised root tips wereplaced in a 0.5 percent solution of NT in saline and incubated at 370 C.in the same concentrations of NT, reduction with the formation of adeep purple color also took place in the embryonic zone. Smearpreparations slhowed discrete purple to black fine granules in thecytoplasm of the merostematic cells, with marked grouping of thegranules in the perinuclear zoine. Pratt and Dufrenoy (7) employedtriphenyltetrazolium chloride to locate intracellular sites of dehydro-genase activity in sugar cane.
3 This investigation is being oonducted in collaboration with Dr. B. Sonnenblick.
1235

September 17, 1948
Studies on Mechanism of NT Reduction
The conversion of colorless tetrazolium derivatives into coloredformazan compounds represents a reducing process. The findings thatliving matter exposed to tetrazolium compounds in vivo or in vitroshow accumulation of the formazan particularly in areas where growth,multiplication, and marked physiologic activity take place is sig-nificant, for these areas show high respiratory activity promoted byenzyme systems wlhieh are concerned with oxido-reduction processes.
It is known that the activity of a great number of these enzymessuch as various dehydrogenases and oxidases is dependent upon theactive form of their -SH groups (8); maintenance of this group istherefore of great importance. It is assumed that the reduced formof glutathione, a substance present in living cells, aids in keeping the-SH radical in reduced form. Glutathione is important also for main-taining ascorbic acid in its reduced form.The role of cysteine, glutathione, and ascorbic acid as factors re-
ducing tetrazolium compounds to formazan lhas been considered byKuhn and Jerchel (5). However, due to the fact that reduction tookplace at pH 9 and not at pH 7, it appeared doubtful to the authorsthat these compounds were participating in the reduction of tetrazo-lium derivatives in the living cell. Recently Mattson, Jensen, andDutcher (4) published a preliminary report in which the effect ofpyridine nucleotide dehydrogenases on triphenyltetrazolium is dis-cussed.
In the course of our experiments with NT it was observed thatcysteine reduced NT in vitro at pH 7. It was, thlerefore, desirable toinvestigate whether active -SH groups play a role in the reduction ofNT. The compounds used were cysteine, reduced glutathione,methionine, cystine, sodium cyanide, and arsphenamine.The effect of cysteine, reduced glutathione, methionine and cystine
on NT was tested at pH ranging from 4.5 to 8; phosphate mixtureswere used as buffers. Cysteine hydrochloride and glutathione wereneutralized before being added to the buffer-NT mixture.With cysteine and glutathione a faint purple color appeared at the
highest pH within 15 minutes. After one hour, the color was observeddown to pH 6.9. On further standing the color became darker andafter 3 hours a purple precipitate began to settle out. This wasdarker at the higher pH.No reaction took place with the methionine and cystine. If cystine
was treated with sodium cyanide which converts cystine to cysteine,NT was reduced to formazan. These results show the necessity offree -SH groups for the reduction of NT. For in methionine we aredealing with a compound where the H of the -SH groups is replacedby a CH3 group, and in cystine we have the -S-S- form.
1236
1237 September 17, 1948
It was of interest to examinie the effect of tissue exposed to arsphena -mine since trivalent organic arsenicals combine with active -SHgroups (9). Fresh tissue was incubated with asphenamine for onelhour, removed from the solution, rapidly washed in saline, and thenplaced in the incubator with NT. No color developed although thespecimen was incubated for 15 hours. The control tissue incubatedfor one hour in 0.85 percent NaCl and then treated the same as thearsphenamine tissue, showed typical purple color af.ter one hlour.Arsenic poisoning is treated with BAL (dimercaptopropanol), thethiol groups serving as arsenic acceptors, thus protecting the -SHgroup (10, 11). The question arose whether BAL could not be usedfor the reduction of NT. BAL was mixed with NT and the reactionstarted in a few minutes. In 15 minutes a heavy reddish precipitatewas formed.The effect of cyanide on respiratory enzymes has been the object of
many studies. Its inhibiting effect on oxidases such as cytochromeoxidase, ascorbic oxidase and others is established. Also well knownis its reducing effect on oxidized glutathione (12). It could, there-fore, be expected that tissue exposed first to cyanide and then to NTshould more readily reduce NT to formazan. Experiments performedin this respect verified the assumption. Tissue incubated for one hourin NaCN and then transferred to NT solution showed faster and moreintense color changes than normal tissue. Also of interest was theobservation that the color appeared on both surfaces, that touchingthe bottom and that facing upward at the same time and intensity incontrast to control tissue in which the color appeared earlier and ingreater intensity on the lower surface.
Experiments performed to test the reduction of metbylene blue byminced tissue in the presence of NT, using the Thunberg method,failed to show decolorization of methylene blue. However, formationof formazan took place. If 0.5 cc. of a 0.1 percent solution of NTwas injected into a rat muscle in vivo and excised after 24 hours,this muscle which was now purple, failed to decolorize methyleneblue. The question therefore arises whether NT interferes withactivity of -SH group of dehydrogenases. This subject is under in-vestigation.
REFERENCES
(1) Lakon, G.: Topographischer Nachweis (ler Keimfahigkeit des Mais durchTetrazoliumsalze. Ber. der Deutsch. Bot. Ges. 60: 434 (1942).
(2) Porter, R. H., Durrell, M., and Romm, H. J.: The use of 2,3,5-triphenyl-tetrazolium-chloride as a measure of seed germinability. Plant Physiol.22: 149 (1947).
(3) Cotrell, H. J.: Tetrazolium salt as a seed germination indicator. Nature,159: 748 (1947).

Septemnber 17, 1948 1238
(4) Mattson, A. M., Jensen, C. O., and Dutcher, R. A.: Triphenyltetrazoliuiichloride as a dye for vital tissues. Science, 106: 294 (1947).
(5) Kuhn, R. and Jerchel, D.: tYber Invertseifen. VIII. Mitteil.: ReduktionvoIn Tetrazoliumsalzen durch Bakterien, gairende Hefe uind keimendeSanien. Ber. der Deutsch. Chem. Ges. 74B: 949 (1941).
(6) Dufrenoy, J., and Pratt, R.: Cytochemical Mechanisms of Penicillin Action.V. Comparative effects of ribonuclease, cobra venom, and penicillin onsusceptible bacteria. J. Bact. 55: 525 (1948).
(7) Pratt, R., and Dufrenoy, J.: Triphenyltetrazolium chloride, a valuiablereagent in stain technology. Stain Technology, 23: 137 (1948).
(8) Barron, E. S. G., and Singer, T. S.: Studies on Biological Oxidations. XIX.Sutlfhydryl enzvmes in carbohvdrate metabolism. J. Biol. Chem.157: 22 (1945).
(9) Voegtlin, C., Dyer, H. A., and Leonard, C. S.: Mechanisnm of actionl ofarsenic upon protoplasm. Pub. Health Rep. 38: 1882 (1923).
(10) Peters, R. A., Stocken, L. A., and Thompson, R. H.: British antilewisite.Nature, 156: 616 (1945).
(11) Eagle, H., Magnuson, H. J., and Fleischman, R.: The systemic treatmentof experimental arsenic poisoning (mapharsen, lewisite, phenvl arsenoxide)with BAL. J. Clin. Invest. 25: 451 (1946).
(12) Vocgtlin, C., Johnson, J. M., and Dyer, H. A.: Biological significance ofcystine and glutathione; mechanism of cyanide action. J. Pharmacol.Exp. Therap. 27: 467 (1926).
United States-Canadian Boundary WatersPollution Control
A pollution control program for Uniited States-Canadian boundarywaters has been proposed by the International Joint Commission ofthe two countries. Objectives of the program are now under con-sideration at hearings which began September 8 in Room 859, FederalBuilding, Detroit, Mich.The program, covering the St. Clair River, Lake St. Clair, the
Detroit River and the St. larys River from Lake Superior to LakeHuron, was developed by a board of technical advisors to the Inter-national Joint Commission. The board consists of representativesfrom the Federal health agencies of the United States and Canada,and representatives from the State of Michigan and the province ofOntario whose boundaries are formed in part by the waters beinginvestigated.The objectives, given below, are for the boundary waters in general.
More stringent requirements may be necessary in certain specific in-stances, influenced by local conditions. They are preliminary only,and are subject to change from time to time as the investigation ofthese waters continues, and until the final report has been adopted.The International Joint Commission is interested in receiving
comments on the program. Their offices are in the Department ofLabor Building, Washington, D. C., and in the Victoria Building,Ottawa, Canada.
September 17, 1948
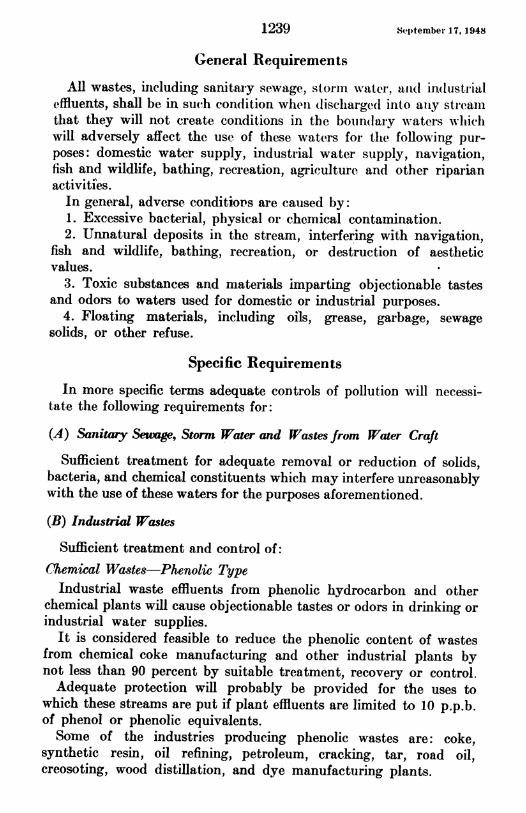
General Requirements
All wastes, includiiig sanitary sewage, storim*wtiter, allnd in(lustrialeffluents, shall be in such condition wheni (lischlaige(I into aiiy streamthat they will not create conditions in the boundary w-aters wlichwill adversely affect the use of these waters for tlhe folowing pur-poses: domestic water supply, industrial water supply, navigation,fish and wildlife, bathing, recreation, agriculture and other riparianactiviti'es.In general, adverse conditiops are caused by:1. Excessive bacterial, physical or chemical contamination.2. Unnatural deposits in the stream, interfering with navigation,
fish and wildlife, bathing, recreation, or destruction of aestheticvalues.
3. Toxic substances and materials imparting objectionable tastesand odors to waters used for domestic or industrial purposes.
4. Floating materials, including oils, grease, garbage, sewagesolids, or other refuse.
Specific Requirements
In more specific terms adequate controls of pollution will necessi-tate the following requirements for:
(A) Sanitary Sewage, Storm Water and Wastes from Water Craft
Sufficient treatment for adequate removal or reduction of solids,bacteria, and chemical constituents which may interfere unreasonablywith the use of these waters for the purposes aforementioned.
(B) Industrial Wastes
Sufficient treatment and control of:Chemical Wastes-Phenolic Type
Industrial waste effluents from phenolic hydrocarboil and otherchemical plants will cause objectionable tastes or odors in drinking orindustrial water supplies.
It is considered feasible to reduce the phenolic content of wastesfrom chemical coke manufacturing and other industrial plants bynot less than 90 percent by suitable treatment, recovery or control.Adequate protection will probably be provided for the uses to
which these streams are put if plant effluents are limited to 10 p.p.b.of phenol or phenolic equivalents.Some of the industries producing phenolic wastes are: coke,
synthetic resin, oil refining, petroleum, cracking, tar, road oil,creosoting, wood distillation, and dye manufacturing plants.
1239
September 17, 1948
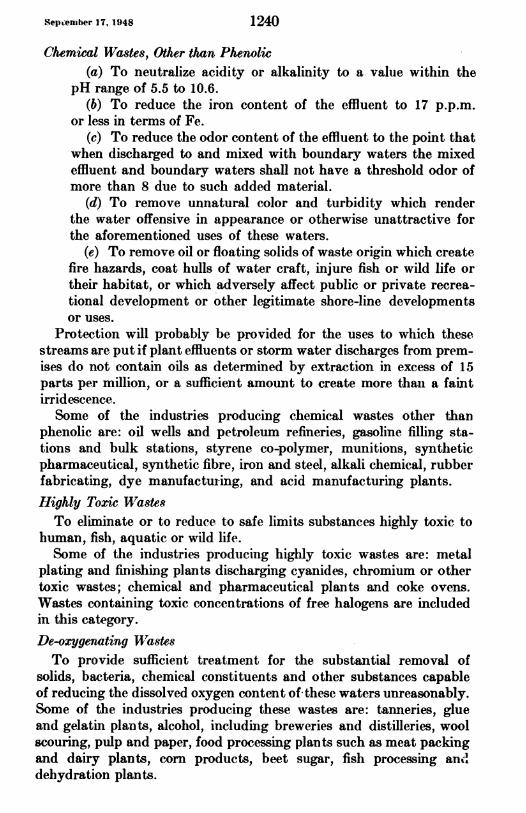
Chemical Wastes, Other thain Phenolic(a) To neutralize acidity or alkalinity to a value within the
pH range of 5.5 to 10.6.(b) To reduce the iron content of the effluent to 17 p.p.m.
or less in terms of Fe.(c) To reduce the odor content of the effluent to the point that
when discharged to and mixed with boundary waters the mixedeffluent and boundary waters shall not have a threshold odor ofmore than 8 due to such added material.
(d) To remove unnatural color and turbidity which renderthe water offensive in appearance or otherwise unattractive forthe aforementioned uses of these waters.
(e) To remove oil or floating solids of waste origin which createfire hazards, coat hulls of water craft, injure fish or wild life ortheir habitat, or which adversely affect public or private recrea-tional development or other legitimate shore-line developmentsor uses.
Protection will probably be provided for the uses to which thesestreams are put if plant effluents or storm water discharges from prem-ises do not contain oils as determined by extraction in excess of 15parts per million, or a sufficient amount to create more thanl a faintirridescence.Some of the industries producing chemical wastes other than
phenolic are: oil wells and petroleum refineries, gasoline filling sta-tions and bulk stations, styrene co-polymer, munitions, syntheticpharmaceutical, synthetic fibre, iron and steel, alkali chemical, rubberfabricating, dye manufacturing, and acid manufacturing plants.Highly Toxic WastesTo eliminate or to reduce to safe limits substances highly toxic to
human, fislh, aquatic or wild life.Some of the industries producing highly toxic wastes are: metal
plating and finishing plants discharging cyanides, chromium or othertoxic wastes; chemical and pharmaceutical plants and coke ovens.Wastes containing toxic concentrations of free halogens are includedin this category.De-oxygenating WastesTo provide sufficient treatment for the substantial removal of
solids, bacteria, chemical constituents and other substances capableof reducing the dissolved oxygen content of these waters unreasonably.Some of the industries producing these wastes are: tanneries, glueand gelatin plants, alcohol, including breweries and distilleries, woolscouring, pulp and paper, food processing plants such as meat packingand dairy plants, corn products, beet sugar, fish processing anddehydration plants.
1240
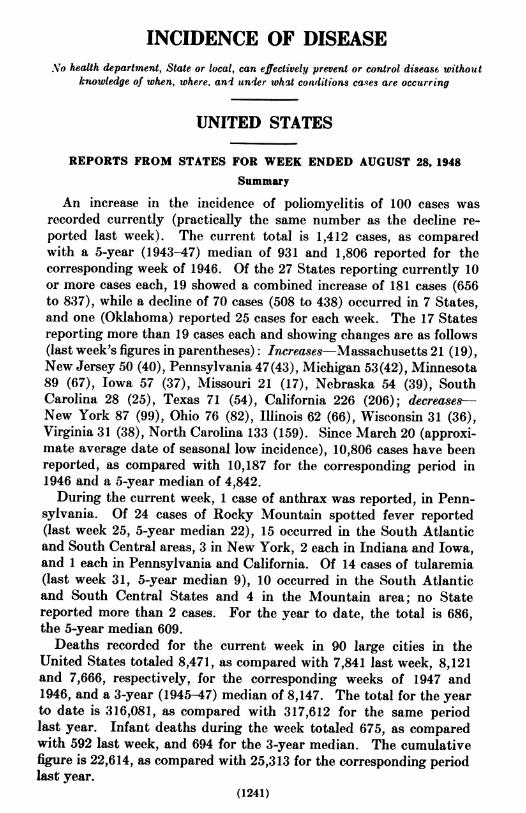
INCIDENCE OF DISEASE.No health department, State or local, can effectively prevent or control disease without
knowledge of when, where. ani under whst condlitions ca.ses are occurring
UNITED STATES
REPORTS FROM STATES FOR WEEK ENDED AUGUST 28, 1948
Summary
An increase in the incidence of poliomyelitis of 100 cases wasrecorded currently (practically the same number as the decline re-ported last week). The current total is 1,412 cases, as comparedwith a 5-year (1943-47) median of 931 and 1,806 reported for thecorresponding week of 1946. Of the 27 States reporting currently 10or more cases each, 19 showed a combined increase of 181 cases (656to 837), while a decline of 70 cases (508 to 438) occurred in 7 States,and one (Oklahoma) reported 25 cases for each week. The 17 Statesreporting more than 19 cases each and slhowing chainges are as follows(last week's figures in parentheses): Inereases-Massachusetts 21 (19),New Jersey 50 (40), Pennsylvania 47 (43), Michigan 53 (42), Minnesota89 (67), Iowa 57 (37), Missouri 21 (17), Nebraska 54 (39), SouthCarolina 28 (25), Texas 71 (54), California 226 (206); decreases-New York 87 (99), Ohio 76 (82), Illinois 62 (66), WVisconsin 31 (36),Virginia 31 (38), North Carolina 133 (159). Since March 20 (approxi-mate average date of seasonal low incidence), 10,806 cases have beenreported, as compared with 10,187 for the corresponding period in1946 and a 5-year median of 4,842.During the current week, 1 case of anthrax was reported, in Penn-
sylvania. Of 24 cases of Rocky Mountain spotted fever reported(last week 25, 5-year median 22), 15 occurred in the South Atlanticand South Central areas, 3 in New York, 2 each in Indiana and Iowa,and 1 each in Pennsylvania and California. Of 14 cases of tularemia(last week 31, 5-year median 9), 10 occurred in the South Atlanticand South Central States and 4 in the Mountain area; no Statereported more than 2 cases. For the year to date, the total is 686,the 5-year median 609.Deaths recorded for the current week in 90 large cities in the
United States totaled 8,471, as compared with 7,841 last week, 8,121and 7,666, respectively, for the corresponding weeks of 1947 and1946, and a 3-year (1945-47) median of 8,147. The total for the yearto date is 316,081, as compared with 317,612 for the same periodlast year. Infant deaths during the week totaled 675, as comparedwith 592 last week, and 694 for the 3-year median. The cumulativefigure is 22,614, as compared with 25,313 for the corresponding periodlast year.
(1241)
September 17, 1948
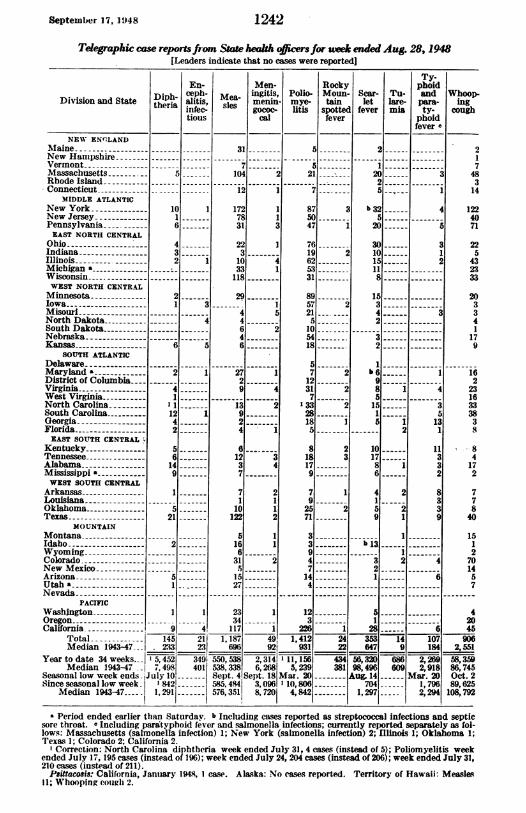
Telegraphic case reports fiom Sta health oicers for uwk ended Aug. 28, 1948Leaders indicate that no cases were reported]
En-
Division and State tDhieprha alitis,infec-
tious
NEW ENCLANDMaine - ---- ---New HampshireVermontMassachusetts-- 5---Rhode IslandConnecticut-
MIDDLE ATLANTICNew York -10 INew Jersey -1
Pennsylvania 6EAST NORTH CENTRAL
Ohio ------------- 4Indiana- 3--Illinois 2 1Michigan a :Wisconsin -.
WEST NORTH CENTRALMinnesota- 2--Iowa-- 1 3MisouriNorth Dakota- 4South DakotaNebraskaKansas -6 5
SOUTH ATLANTICDelaware-Maryland a- 2 1District of Columbia .Virginia- 4West Virginia -1
North Carolina-1South Carolina-12 1Georgia- 4Florida- 2EAST SOUTH CENTRAL
Kentucky- 5Tennessee- 6Alabama -14Mississippi a- 9WEST SOUTH CENTRAL
Arkansas -1
LouisianaOklahoma- 5Texas -21
MOUNTAINMontanaIdaho -- -- 2WyomingColoradoNew MexicoArizona -- 5Utah 1-Nevada .
PACIFICWashington -1 1OregonCalifornia -9 4,
Total 145 2l1Median 1943-47 233 23
Year to date 34 weeks. 5,452 349iMedian 1943-47 7,498 401
Seasonal low week ends -July10Since seasonal low week 842-
Median 1943-47 .. 1,291|
Ty-Men- Rocky phoid
Me- ingitis, Polio- Moun- Scar- Tu- and Whoop-sles menin- mye- tain let lare- pars- inggococ- litis spotted fever mia ty- cough
cal fever phoidfever a
31
104
.12
1727E31
22
310
33
118
29
4
4
6
4
6
29
-3113
9
2
6
12
37
7
1
10
12
5
16
6
31
15
27
23
34
117
2
I
1
3
1741
5
2
.2
1
I21
8750
47
7619625331
8957215
105418
5
712317
13328185
818179
792571
33947144
..
2
2
2
12025
B b325
20
301015118
15!3
42
32
1
b 69851515
101786
4159
b 13.
321
-~---i-
-~ i
2-----i
2
2
1
5
312
-3
-4
-3
S
13
11
3
3
2
8
3
3
4
6--
12 233 1
226 1 281 6
2.1
748314
1224071
225
432333
203341
179
1622316333838
8-84172
77840
1512701457
4
2045
1, 187 491 1, 412 24 353 14 107 906'696; 92 ' 931 22 647 9 184 2,551IA AI
550, 538 2,3141 11,156538338 6,268 5, 239Sept. 4 Sept. 18 Mar. 20585, 4841 3, 0961 10, 804576,3511 8,7201 4,842
434381
56,320 686 2,26998,496 609 2,918Aug. 14 Mar. 20
704 1,7961,297 2, 294
58,35986,745Oct. 289,625108,792
a Period ended earlier than Saturday. b Including cases reported as streptococcal infections and septicsore throat. a Including para'typhoid fever and salmonella infections; currently reported separately as fol-lows: Massachusetts (salmonella infection) 1; New York (salmonella infection) 2; Illinois 1; Oklahoma 1;Texas 1; Colorado 2; Califomia 2.
' Correction: North Carolina diphtheria week ended July 31, 4 cases (instead of 5); Poliomyelitis weekended July 17, 195 cases (instead of 196); week ended July 24, 204 cases (instead of 206); week ended July 31,210 cases (instead of 211).
Psittacosis: California, January 1948, 1 case. Alaska: No eases reported. Territory of Hawaii: Measles11; Whooping cough 2.
1242
.1I
I
1243 September 17, 1948
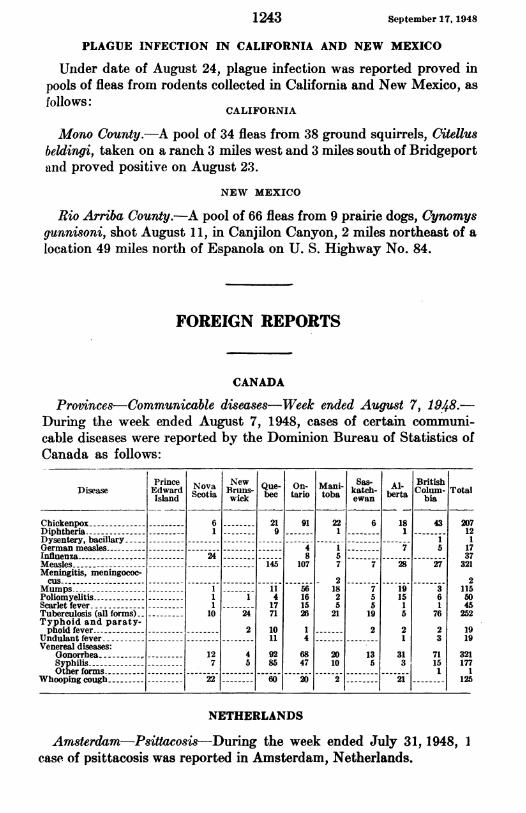
PLAGUE INFECTION IN CALIFORNIA AND NEW MEXICO
Under date of August 24, plague infection was reported proved inpools of fleas from rodents collected in California and New Mexico, asfollows:
CALIFORNIA
Mono County.-A pool of 34 fleas from 38 ground squirrels, Citellusbeldingi, taken on a ranch 3 miles west and 3 miles south of Bridgeportand proved positive on August 23.
NEW MEXICO
Rio Arriba County.-A pool of 66 fleas from 9 prairie dogs, Cynomysgunnisoni, shot August 11, in Canjilon Canyon, 2 miles northeast of alocation 49 miles north of Espanola on U. S. Highway No. 84.
FOREIGN REPORTS
CANADA
Provtinces-Communicable diseases-Week ended August 7, 1948.-During the week ended August 7, 1948, cases of certain commumi-cable diseases were reported by the Dominion Bureau of Statistics ofCanada as follows:
PinceNova w Que- On- Mani Ss Al- BritishDisease Edward ScotYa Bruns- bec tario toba katch- Colum- Total
Island Scta wick be ai os ewan bra bia
Chickenpox- 6-- 21 91 22 6 18 43 207Diphtheria -1 -- 9 1 1-- 12Dysentery, bacillary- -------
German measles --- - 4 1 7 5 17Influenza---------- 24 --- 8 5---- 37Measles -- - - ------145 107 7 7 28 27 321Meningitis, meningococ-cus-- ---------------------------------2--------------- 2
Mumps -1-- 11 56 18 7 19 3 115Poliomyelitis -1 1 4 16 2 5 15 6 50Scarlet fever- 1-- 17 15 5 5 1 1 45Tuberculosis (all forms) -10 24 71 26 2119 5 76252Typhoid and paraty-phoid fever - -2 10 1 2 2 2 19
Undulant fever ---11 4 --- 1 3 19Venereal diseases:
Gonorrhea - 12 4 92 68 20 13 31 71 321Syphilis - --- 7 5 85 47 10 5 3 15 177Other forms --- - - - -1 1
Whooping cough - 22 60 20 2- - 21 125
NETHERLANDS
Amsterdam-Psittacosis-During the week ended July 31, 1948, 1case of psittacosis was reported in Amsterdam, Netherlands.

September 17, 19)48 1244
MADAGASCAR
Notifiable diseases -June 1948.-Notifiable contagious diseases werereported in Madagascar and Comoro Islands during June 1948 asfollows:
June 1948
Disease Aliens Natives
Cases Deaths Cases Deaths
Beri-beri- -----1-I 0 1 0Bilharziasis-0 0--- -------------------- O O 171 0Cerebrospinal meningitis - 0------------ O O 123Diphtheria --- ------------------------------------ 1 0 0Dysentery:
Amebic ----- ---------------- 16 0 287 2Bacillary - - ------------------ 0 0 8 1
Encephalitis, lethargic ------ --------------- 0 0 1 0Erysipelas -- -------------- ------------- ------ 0 0 6 0Influenza -- ------ --------------------- --------- 38 0 10,389 104Leprosy ----- --------- ----------------------------- 0 0 47 0Malaria ---------------------------------------- 519 4 38,840 301
Measles -3 0 33 0Mumps-6 0 147 0Plague-0 0 3 3Pneumonia, broncho -3 0 346 61Pneumonia, pneumococcic ------ - 13 1 785 140Puerperal infection -0 0 5 2Relapsing fever -0 0 1 0Scarlet fever -1 0 0 0Tuberculosis, pulmonary -- 7 1 178 37Typhoid fever- -------------------------- 3 1 11 0Whooping cough- 0------- 173 8
NORWAY
Notifiable diseases-May 1948.-During the month of May 1948,cases of certain notifiable diseases were reported in Norway as follows:
Disease Cases Disease Cases
Cerebrospinal meningitis -9 Mumps-1,835Diphtheria - -34 Paratyphoid fever- 5Dysentery, unspecified - 4 Pneumonia (all forms)-2,615Encephalitis, epidemic -1 Poliomyelitis-16
Erysipelas-368 Rheumatic fever -116Gastroenteritis -4,099 Scabies-1,979
Gonorrhea -385 Scarlet fever -174Hepatitis, epidemic -151 Syphilis-124Impetigo contagiosa -2,352 Tuberculosis (all forms)- 468Influenza-2-- 2,016 Typhoid fever 1
Laryngitis -10,465 Whooping cough -413Measles -1,761
REPORTS OF CHOLERA, PLAGUE, SMALLPOX, TYPHUS FEVER, ANDYELLOW FEVER RECEIVED DURING THE CURRENT WEEK
NoTE.-Except in cases of unusual incidence, only those places are included which had not previouslyreported any of the above-named diseases, except yellow fever, during recent months. All reports of yellowfever are published currently.A table showing the accumulated figures for these diseases for the year to date is published in the PUBLIC
HZALTH REPORTS for the last Friday of each month.

1245 Sllllr1. 4v
Cholera
India-Madras.-Information dated August 10, 1948, states thatcholera has been reported increasing in Madras Province and City.For the week ended July 31, 1948, 912 cases with 387 deaths werereported in the Province, and 12 cases with 2 deaths were reported inMXadras City. During the week ended August 7, 17 cases with 2deaths were reported in Madras City, and for the week ended August14, 45 cases withi 10 deaths were reported in the city.
Plague
British East Africa-Kenya.-For the week ended July 31, 1948,7 cases of plague with 2 deaths were reported in Kenya, British EastAfrica.Ecuador-Loja Province.-During the period July 1-31, 1948, 3
fatal cases of plague were reported in Loja Province, Ecuador--2cases in Overal, Celica Canton, and 1 case in Zozoranga, MacaraCanton.
Smallpox
Ecuador.-During the period July 1-31, 1948, 238 cases of smallpoxwith 21 deaths were reported in Ecuador.
Typhus Fever
Ecuador.-For the period July 1-31, 1948, 36 cases of typhus feverwith 4 deaths were reported in Ecuador, including 5 cases (murine)with 1 death in Guayaquil, and 4 cases (murine) in Manta.
DEATHS DURING WEEK ENDED AUG. 21, 1948[From the Weekly Mortality Index, issued by the National Office of Vital Statistics]
Week ended Crespond-Aug. 21,1948 ing week,
Data for 03 large cities of the United States:Total deaths ---------------------------------- 8,085 8,348Median for 3 prior years - - 8,348Total deaths, first 34 weeks of year------- ------- 317,064 318,515Deaths under 1 year of age - -618 684Median for 3 prior years -684-Deaths under 1 year of age, first 34 weeks of year - - 22,731 25,489
Data from industrial insurance companies:Policies in force- - - - - - -- - - - - ---- -- - - -- - - - 70,951,356 67,217,265Number of death claims - -11,496 10,280Death claims per 1,000 policies in force, annual rate - -8.5 0Death claims per 1,000 policies, first 34 weeks of year, annual rate-- 9.5 9.5
September 17, 1948
Annual Conference at Washington
The Annual Conference of the Surgeon General witlh the State andlTerritorial Health Officers, the State Hospital Survey and Construc-tion Authorities, and the State Mental Health Authorities will beheld in Washington, D. C., from Sunday, November 14, throughWednesday, November 17. Meetings will be held in the FederalSecurity Building (North), Independence Avenue and Fourth StreetSW. The headquarters hotel will be the Washington Hotel atFifteenth Street and Pennsylvania Avenue NW. Requests for hotelreservations may be addressed to the Surgeon General, Public HealthService, Washington, D. C.
- 1246