purchase for progress country case study: tanzania see page 12 for a detailed description of the p4p...
TRANSCRIPT

Investment AnAlysIs for InstItutIonal Procurement
Purchase for Progress
country case study:
tanzanIa

Purchase for Progress
country case study
tanzanIa
Food and agriculture organization oF the united nationsrome, 2016
Investment AnAlysIs for InstItutIonal Procurement
Authors Luis Dias Pereira, Wadzi Katsande, Lisa Paglietti and Roble Sabrie FAO Investment Centre economists
Coordinator Lisa Paglietti

The designations employed and the presentation of material in this information product do not imply the expression of any opinion whatsoever on the part of the Food and Agriculture Organization of the United Nations (FAO) concerning the legal or development status of any country, territory, city or area or of its authorities, or concerning the delimitation of its frontiers or boundaries. The mention of specific companies or products of manufacturers, whether or not these have been patented, does not imply that these have been endorsed or recommended by FAO in preference to others of a similar nature that are not mentioned.
The views expressed in this information product are those of the author(s) and do not necessarily reflect the views or policies of FAO.
© FAO, 2016
FAO encourages the use, reproduction and dissemination of material in this information product. Except where otherwise indicated, material may be copied, downloaded and printed for private study, research and teaching purposes, or for use in non-commercial products or services, provided that appropriate acknowledgement of FAO as the source and copyright holder is given and that FAO’s endorsement of users’ views, products or services is not implied in any way.
All requests for translation and adaptation rights, and for resale and other commercial use rights should be made via www.fao.org/contact-us/licence-request or addressed to [email protected].
FAO information products are available on the FAO website (www.fao.org/publications) and can be purchased through [email protected].

iii
FOREWORD v
ACKNOWLEDgEmENTS vI
ACRONymS AND AbbREvIATIONS vII
INTRODUCTION 1
1 COUNTRy HIgHLIgHTS 3
2 P4P COSTS ANALySIS 7
3 bENEFITS ANALySIS 13
4 ILLUSTRATIvE mODELS 19
5 KEy FINDINgS AND CONCLUSIONS 23
ANNEX 1 List of documents 25
ANNEX 2 breakdown of official P4P costs 26
ANNEX 3 Questionnaire for SACCOs 27
ANNEX 4 Crop budget and numeric model 28
taBle of contents

iv
TAbLES
Table 1: Comparison of standard LRP and P4P food procurement requirements 3
Table 2: Commodity purchases 2009-2012 4
Table 3: P4P staff and country office staff 8
Table 4: P4P purchases 2009-2012 8
Table 5: Share of the delivery methods in the overall P4P procurement 9
Table 6: Number of contracts by typology 11
Table 7: Direct and indirect benefits 13
Table 8: NFRA purchasing 17
Table 9: maize and bean crop models 20
FIgURES
Figure 1: Trends of P4P regular overall purchases by WFP in Tanzania 5
Figure 2: Price evolution of beans 10
Figure 3: Price evolution of maize 10

v
Purchase for Progress (P4P), a World Food Programme (WFP) pilot launched in 2008, aims to leverage smallholder agricultural growth in some of the world’s poorest countries through supply chain reforms. P4P links WFP’s demand for staple foods with the expertise of partners working to strengthen the capacity of smallholder farmers to produce more and higher-quality food, reduce post-harvest losses, access markets and fetch a fair price for their surplus crops. P4P tests and institutionalizes different food procurement models and related programmatic approaches that sustainably promote smallholder agricultural and market development.
At WFP’s request, the FAO Investment Centre conducted an investment analysis of the P4P initiative in four countries: malawi, mali, Tanzania and El Salvador. The FAO team, which included Alexander Jones, a former senior programme development officer, and economists Lisa Paglietti, Roble Sabrie, Luis DiasPereira and Wadzi Katsande, combined desk reviews with field visits and consultations with the P4P Coordination Unit in Rome and stakeholders at country level.
foreword

vi
FAO Investment Centre economists Luis DiasPereira, Wadzi Katsande, Lisa Paglietti and Roble Sabrie were the main authors of the study, with Lisa Paglietti coordinating the study team.
The team is grateful to the P4P Coordination Unit, which led the preparation of the concept, scope and funding for the study, and WFP staff at country level for participating in meetings and sharing documentation.
Special thanks go to Alberta mascaretti, service chief, Africa Service, Astrid Agostini, senior economist, FAO Investment Centre, Siobhan Kelly, Jorge Fonseca, and Natalie vergara, agribusiness officers, FAO Rural Infrastructure and Agro-industry Division who reviewed earlier drafts of the report. Their constructive comments were helpful during the revision process.
The team also acknowledges the contributions of other stakeholders in mali, malawi, El Salvador and Tanzania, including from local government, the private sector, non-governmental organizations, farmers and farmer associations, who all willingly and openly shared their expertise, opinions and data, without which this study would not have been possible.
The authors are also grateful to Clare O’Farrell, knowledge management officer, FAO Investment Centre Division, for overseeing the publication process, and Jane Kronner and Adriana brunetti for editing and formatting the report.
acknowledgements

vii
acronyms and aBBrevIatIons
AgRA Alliance for a green Revolution in Africa
DAP Delivery at place
EXW Ex-warehouse
FAO Food and Agriculture Organization of the United Nations
FDC Forward delivery contract
FO Farmer organization
LRP Local and regional procurement
m&E monitoring and evaluation
NFRA National Food Reserve Agency
ODI Overseas Development Institute
P4P Purchase for Progress
SACCO Savings and Credit Cooperative
TP Total local purchase
WFP World Food Programme
WRS Warehouse receipt system


1
IntroductIon
Tanzania was identified as a pilot country to test the study methodology developed during the consultation phase (Annex 4); assess data availability and reliability at country level; and shape the way forward for the other country case studies.1
The objective of this country study was to investigate the main benefits arising from the Tanzania Purchase for Progress (P4P) initiative and its impact on the beneficiaries, in particular those who were not documented by the programme’s monitoring and evaluation system (m&E).
Methodology. According to the methodology developed, and given the time constraints and heterogeneity of the data,2 the analysis focused on the period from 2009 to 2012. It was based on a review of official procurement data (including quantities purchased, price paid to farmer, etc.), consolidated secondary information such as data from the m&E officers, financial service group records and logistics, and complemented by information and primary information/data gathered during fieldwork in Tanzania, especially during discussions with farmer organizations (FOs). Whenever possible, both quantitative and qualitative data were gathered during the interviews. The quantitative data included production costs reported by farmers. The qualitative data were used to understand the objectives, risks and constraints that underlay the quantitative data. While official quantitative data were not readily available, proxies and estimations based on anecdotal field findings and discussions with World Food Programme (WFP) officials were used.
Data review and collection
Field visits. An FAO mission was carried out in October 2013 in Tanzania for about ten days and included work at the country office and field visits to the two selected
1 The four countries selected were: El Salvador, malawi, mali and Tanzania.
2 For example, the introduction of WINgS2 and 2008 start-up costs were not quantified as they were not budgeted as such.
areas of Arusha and Karatu. Three of the 28 Savings and Credit Cooperatives (SACCOs) participating in the P4P scheme (producing only maize and not beans) were selected for the field visits.
The interview tools used during the fieldwork comprised focus group discussions, informal discussions and a key informant interview (one-to-one or groups). A questionnaire was developed and shared with the stakeholders to facilitate the group discussions (Annex 3).The team carried out the following:
• Interviews with P4P participating farmers to gather data on the experiences and responses of the target groups. WFP in Tanzania buys commodities from farmer associations that have formed a marketing group or are affiliated with the SACCOs; and
•Key informant interview with a service provider on its capacity building activities. The interview was a technical meeting to gather the service provider’s views on the benefits of P4P and the challenges participating farmers face in engaging with a market player such as WFP.
Limitation of the country study. First, the study did not seek to comment comprehensively on the P4P programme but rather focus on a specific subset of costs and benefits not analysed in the mid-term review or in other studies. It is a limited and focused study that complements and provides data for future programming and P4P reviews, using a country case study approach. As previously explained, the available data are not homogenous. It will not be possible to fill this gap through a qualitative study of this size. This study will use quantitative methods combined with qualitative research where appropriate to build on the information available.
The combination of quantitative and qualitative information may provide a solid foundation for reasonably attributing overall changes to P4P. It is important, however, to note that attributing benefits

2
Investment Analysis for Institutional Procurement
to a programme is a complex activity and difficult to fully achieve, particularly if baseline data were not available at programme start-up. Furthermore, as P4P is not operating in isolation, careful attention should be paid to all ongoing projects/programmes in the same intervention areas.
This paper includes the following chapters:
•Chapter 1 presents country highlights on WFP activities and P4P interventions.
•Chapter 2 outlines an analysis of the costs of P4P activities.
•Chapter 3 describes the quantitative analysis of benefits at farmer level as well as a qualitative analysis where figures and data are not available or numeric modelling is not appropriate.
•Chapter 4 develops some financial models to provide further insight into the P4P benefits and sustainability.
•Chapter 5 summarizes key findings and conclusions.

3
Chapter
1
Country Highlights on WFP Activities and P4P Interventions In Tanzania, WFP has a team of over 150 staff and an operating budget of USD 65 million per year. WFP Tanzania reaches almost one million vulnerable people per year through its Country Programme, the P4P initiative and the Refugee Operation. P4P began in September 2008, with the aim of increasing farmers’ capacity to sell their crops at a fair price and to boost their
3 See page 12 for a detailed description of the P4P procurement modalities.
income. Twenty-eight SACCOs were selected to participate in the P4P scheme. P4P targets farmers through SACCOs that are often hindered by poor infrastructure, thus leaving farmers isolated and unable to reach markets. WFP buys directly from SACCOs through either competitive tendering processes, or non-competitive processes such as direct contracts and forward delivery contracts.
country hIghlIghts
Table 1: Comparison of Standard LRP and P4P Food Procurement Requirements
Standard LRP P4P
Suppliers Pre-qualified suppliers (mostly larger traders)
Pre-qualified smallholder FOs and small and medium traders
Contracting mechanisms
Competitive tenders • Competitive tenders
• modified competitive tenders (see contract terms below)
• Direct contracts
• Forward contracts
• Commodity exchanges3
• Purchasing through warehouse receipt systems (WRS)
• Developing links with food processors
Procurement requirements
Price Determined by authorized contracting mechanisms but not to exceed import parity
Determined by authorized contracting mechanisms but not to exceed import parity
Quantities Preference for relatively large quantities
Will consider much smaller quantities to accommodate suppliers’ capacities
Performance bond
5 – 10 percent None
Quality WFP standards (or relevant country standards)
WFP standards (or relevant country standards)
bagging bagged in 50 kg bags and marked with WFP logo
Flexible
Delivery terms Delivered duty unpaid to specified destination (usually WFP warehouse) on specified date
Flexible
Source: WFP headquarters, Rome.

4
Investment Analysis for Institutional Procurement
Table 1 compares WFP’s standard local and regional procurement (LRP) and P4P procurement requirements and mechanisms.
Among all the waived procurement modalities, three are available for use by P4P in Tanzania:
•Soft tendering is a type of adapted competitive tender that is less strict than the usual competitive tender process applied to large traders. Soft tenders, for example, waive performance bonds (sureties), generally waive bag markings and involve smaller tender sizes. Farmers’ cooperatives bid against each other for a P4P tender. Those with the most competitive prices win the tender and a contract is then drawn up. Soft tendering retains all the transparency and cost-efficiency of the regular competitive tendering process.
•Direct contracting entails a non-competitive procurement process, wherein WFP negotiates directly with a single supplier to determine a purchase price and other contract terms. On occasion, WFP used direct contracts before P4P, such as when it needed to procure on short notice.
• Forward contracting is another non-competitive procurement modality, which WFP is testing for the first time
through P4P. From WFP’s perspective, forward contracting is exactly like direct contracting except that it includes a minimum price guarantee and the stipulation to adapt prices against market prices during the time of delivery. If market prices increase by the time of delivery, WFP will pay the re-negotiated price. This procurement option is intended to reduce farmers’ risk and create greater certainty for farmers in their planning.
Currently, P4P operates in ten regions and engages with 19 000 maize and beans farmers who are registered in the 28 SACCOs. P4P also engages farmers in training on a number of topics such as leadership and good governance, production and productivity, basic business management, warehouse management skills and post-harvest management. Overall, 5 046 farmers were trained under the programme at a cost of USD 0.7 million, which translates to an investment of approximately USD 140 per farmer.
During the period under analysis, P4P activities represented, in total, 18 percent of bean purchases, 13 percent of maize purchases and 14 percent in USD value terms of WFP procurement for Tanzania’s
Table 2: Commodity purchases 2009-2012
P4P PURCHASES STANDARD LOCAL PURCHASE TOTAL LOCAL PURCHASES (TP)
yEAR Tonne PRICE vALUE (USD)
Tonne % of TP
yEAR Tonne PRICE vALUE (USD) yEAR Tonne vALUE (USD)
Beans
2009 285.0 690 196 530 19% 2009 1 185.0 558 660 730.4 2009 1 470.0 857 260.4
2010 1 220.0 685 835 964 18% 2010 5 468.0 706 3 860 726.2 2010 6 688.0 4 696 690.2
2011 307.6 644 476 053 15% 2011 1 689.8 699 1 181 140.0 2011 1 997.4 1 657 193.1
2012 431.6 690 162 862 19% 2012 1 870.3 732 1 369 426.2 2012 2 301.9 1 532 288.5
Total 2244.2 1 671 409 18% Total 10 213.1 7 072 022.8 Total 12 457.3 8 743 432.2
Maize
2009 1 795.1 367 659 664 29% 2009 4 380 359 2 172 376.0 2009 6 175.1 2 832 039.5
2010 2 395.7 258 553 510 9% 2010 24 038 274 7 245 158.1 2010 26 433.4 7 798 668.2
2011 3 992.7 310 1 316 946 16% 2011 21 082 280 8 209 055.1 2011 25 074.6 9 526 001.1
2012 1 306.3 375 490 471 9% 2012 13 989 287 6 286 064.1 2012 15 295.8 6 776 535.0
Total 9 489.8 3 020 591 13% Total 63 489 23 912 653.3 Total 72 978.9 26 933 243.8
TOTAL 11 734.0 4 692 000 14% TOTAL 73 702 30 984 676.1 TOTAL 85 436.2 35 676 676
Source: Author’s compilation from official purchasing data.
5
Purchase for Progress Country Case Study: Tanzania
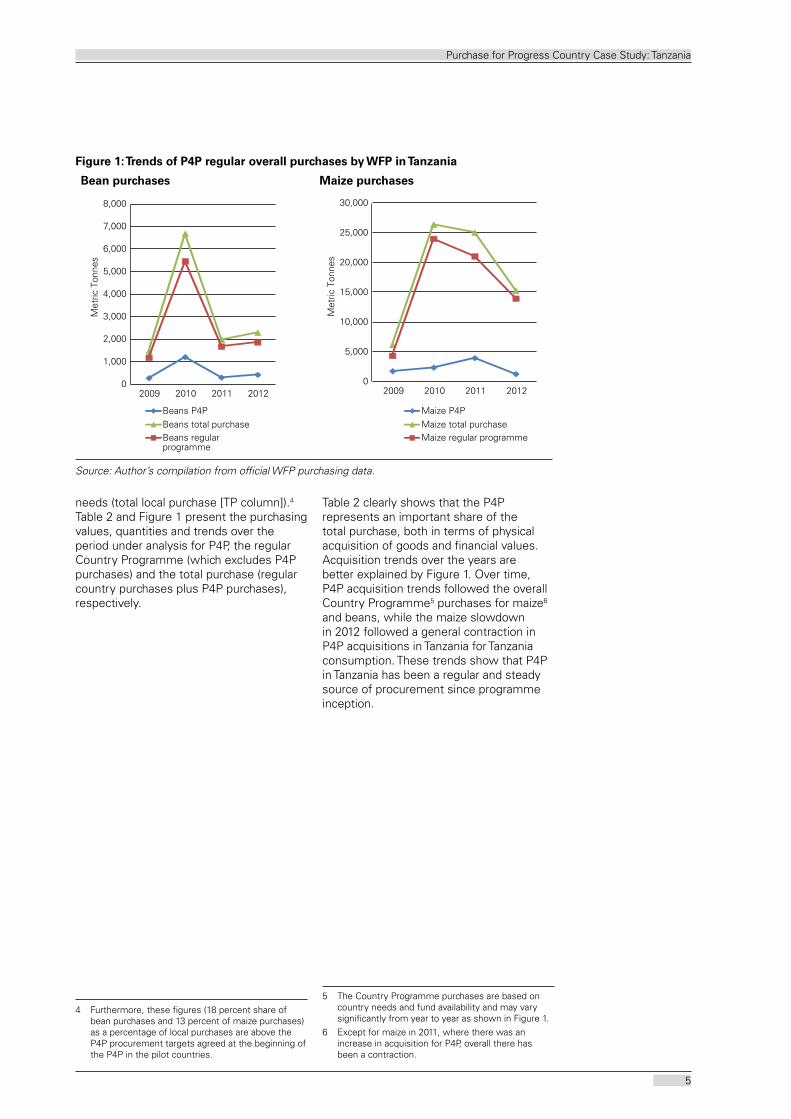
needs (total local purchase [TP column]).4 Table 2 and Figure 1 present the purchasing values, quantities and trends over the period under analysis for P4P, the regular Country Programme (which excludes P4P purchases) and the total purchase (regular country purchases plus P4P purchases), respectively.
4 Furthermore, these figures (18 percent share of bean purchases and 13 percent of maize purchases) as a percentage of local purchases are above the P4P procurement targets agreed at the beginning of the P4P in the pilot countries.
Table 2 clearly shows that the P4P represents an important share of the total purchase, both in terms of physical acquisition of goods and financial values. Acquisition trends over the years are better explained by Figure 1. Over time, P4P acquisition trends followed the overall Country Programme5 purchases for maize6 and beans, while the maize slowdown in 2012 followed a general contraction in P4P acquisitions in Tanzania for Tanzania consumption. These trends show that P4P in Tanzania has been a regular and steady source of procurement since programme inception.
5 The Country Programme purchases are based on country needs and fund availability and may vary significantly from year to year as shown in Figure 1.
6 Except for maize in 2011, where there was an increase in acquisition for P4P, overall there has been a contraction.
Figure 1: Trends of P4P regular overall purchases by WFP in Tanzania
Bean purchases Maize purchases
0
1,000
2,000
3,000
4,000
5,000
6,000
7,000
8,000
2009 2010 2011 2012
Met
ric T
onne
s
Beans P4PBeans total purchaseBeans regular programme
0
5,000
10,000
15,000
20,000
25,000
30,000
2009 2010 2011 2012
Met
ric T
onne
s
Maize P4PMaize total purchaseMaize regular programme
Source: Author’s compilation from official WFP purchasing data.


7
Chapter
The overall cost of P4P (excluding procurement of goods) during the period examined is USD 3.2 million, which was spent on: personnel, travel, consultants, supplies, contracted services, subgrants to other organizations and equipment, (see Annex 2 for a precise breakdown). For the purpose of this analysis, these categories have been aggregated as follows:
•Start-up costs
•Recurrent costs
•Procurement costs
•Other costs
Start-up costs normally include the costs incurred in the first year to launch a project. The P4P budget was prepared for the entire five-year period with no breakdown between the initial start-up and running costs. Some of the initial start-up costs, however, (around USD 0.9 million) targeting the coordination and worldwide assessment of the overall programme were reported and financed through the bill and melinda gates Foundation interim fund. These funds were received and spent in 2008 and were intended for mozambique, burkina Faso, malawi, mali and WFP headquarters. For this exercise, it was not possible to specifically identify the start-up costs for the Tanzania initiative, as they were not qualified as such.
Recurrent costs account for USD 2.8 million and include staffing costs (six full-time staff) and country unit running costs (personnel, travel, consultants, supplies). As shown in Table 3, P4P activities also benefited from additional staff support from the Tanzania country office and the South Africa regional bureau, namely procurement and logistics officers and drivers. The additional staff support7 costs cannot be precisely quantified, but a tentative allocation of their time to P4P
7 The estimated time allocations provided by the Tanzania country office are based on “peak” engagement of WFP staff in P4P activities in 2013, and therefore may slightly overestimate the average associated staff costs to support P4P from 2009 to 2012.
activities is provided in Table 3, as they clearly represent an incremental support to the P4P activities.
Procurement costs are readily available through the purchase transaction records of the P4P, broken down by individual purchase order. As these are auditable financial data, they are accurate and reliable. Aggregated records provide information on dates of order and purchase, commodity type, volumes and defaults. In this analysis, procurement costs are those costs directly related to the purchase of commodities; P4P Tanzania concentrates its purchases on maize and beans. Table 4 summarizes the costs, unit prices per tonne and quantities purchased during the period under investigation. generally, P4P adheres to the WFP procurement principle of cost-efficiency by ensuring that P4P purchases compare favourably with the cost of imported and local food. However, the USD per tonne purchasing values do not provide the real purchasing costs for WFP under the P4P scheme. An in-depth analysis of procurement contracts and delivery modalities was undertaken and illustrated in the next paragraphs.
Procurement was undertaken through different contract typologies, which applied different delivery methods and affected the final prices WFP paid to the farmers.
Two types of delivery methods are currently used to purchase grains and beans: Ex-warehouse (EXW) and delivery at place (DAP). The differences are extremely important for a correct calculation of the final unit price per tonne and for the risk distribution assessment.
• The EXW method: WFP collects the produce at the P4P SACCO’s warehouse. This system relieves the P4P vendor (SACCO) of the obligation to arrange transportation and the seller does not bear the delivery risks.8 Transportation costs are not included in the final procurement price. Logistics costs
8 In terms of loss, damage or any other cost
P4P costs analysIs
2

8
Investment Analysis for Institutional Procurement
need to be added to the unit price per tonne; this additional unit cost has been estimated at USD 74 per tonne;9
• The DAP method: P4P SACCOs are responsible for delivering the grains to the WFP warehouse. The seller bears
9 This figure is an average estimated by the WFP procurement officer in Tanzania and does not differentiate between location or crops.
the costs and risks involved in delivery. The seller has maximum obligation. Transportation costs are reflected in the final procurement price; in this case the price paid to SACCOs is greater than the EXW contract.
These differences imply important changes to the actual USD per tonne paid by WFP. The logistics costs to implement EXW are incremental costs to the regular WFP
Table 3: P4P staff and country office staff
TanzaniaTime allocated to P4P
%
Programme Officer/P4P Coordinator 100
Logistics Officer 100
Senior Programme Assistant 100
P4P Data manager 100
Driver 100
Driver 100
Senior Programme Assistant (Dodoma SO) 65
Senior Programme Assistant (Arusha SO) 65
Senior Programme Assistant (Kigoma SO) 40
Programme Officer/Head of Programme Unit 30
Food Procurement Officer 25
Public Information Officer on P4P activities 25
Regional Bureau Johannesburg
Regional Food Procurement Officer 5
Source: WFP P4P Tanzania country team.
Table 4: P4P Purchases 2009-2012
YEAR Tonne USD/Tonne VALUE (USD) Tonne % of TP
beans
2009 285 690 196 530 19%
2010 1 220 685 835 964 18%
2011 308 644 476 053 15%
2012 432 690 162 862 19%
Total 2 245 1 671 409 18%
maize
2009 1 795 367 659 664 29%
2010 2 396 258 553 510 9%
2011 3 993 310 1 316 946 16%
2012 1 306 375 490 471 9%
Total 9 490 3 020 591 13%
Source: Author’s compilation from official WFP procurement data.

9
Purchase for Progress Country Case Study: Tanzania
procurement and need to be added to the purchasing unit cost to estimate the exact P4P purchasing costs. As an example for a contract delivered with the EXW method, the real USD per tonne for maize in 2012 would be USD 449 per tonne as opposed to USD 375 per tonne.10
Table 5 highlights the share of the two procurement methods in the overall P4P procurement. The DAP method accounts for about 70 percent of the quantity purchased through P4P versus around 30 percent for the EXW method. Despite the predominance of the DAP method, during field visit discussions, farmers identified the EXW as their preferred procurement method because WFP bears the transportation risks (once the commodities are loaded onto the truck they are under WFP’s responsibility).
Simulation on purchasing prices (Figures 2 and 3) shows the adjusted price paid by WFP, taking into account logistics and capacity building/training costs. As previously mentioned, the unit price for EXW does not include the average logistics costs (USD 74 per tonne). bearing this in mind, the USD per tonne unit price purchased through P4P is on average greater than that purchased through the regular programme. Figures 2 and 3 show the adjusted price for maize and bean
10 See column 4 of Table 5 and add the 74 USD per tonne.
prices with respect to the different delivery methods.
The analysis went a step further, showing that by adding the training costs pro rata per tonne, 11 the USD per tonne unit price would increase by an additional USD 62 per tonne.12 The same figures show the adjusted USD per tonne unit price (EXW) level for maize and beans with the different hypothesis (adding both logistics and capacity building costs to P4P tender costs) with respect to the regular programme.
It is important to note that food purchasing prices were not the same over the year. The unit costs per tonne used in the analysis are average prices provided by WFP. Nevertheless, the analysis provides interesting insights on the impact of the capacity building and logistics costs on the final price paid by WFP, and on the investment needed to purchase from smallholders.
Interestingly, the adjusted DAP price is closer to the regular programme purchase price, even if adjusted with the capacity building investment costs. This implies that without
11 The unit cost was based on the overall number of farmers trained and not on the farmers trained and delivering to WFP, as this latest figure was not readily available. See section on other costs on page 19 for a full definition of what is included.
12 The unit cost used is an average, although we would expect capacity building costs to reduce over time, as often they are a one-off start-up cost.
Table 5: Share of the delivery methods in the overall P4P procurement
YEARDelivery method
TonneUSD
TonneVALUE USD
Delivery method
TonneUSD
TonneVALUE USD
Maize Beans
2009 DAP 1 795.1 367.5 659 663.5 DAP 285.0 689.6 196 530.0
2010 1 568.7 269.6 422 949.8 1 220.0 685.2 835 964.0
2011 2 457.3 336.8 827 665.5 307.6 662.7 203 866.7
2012 323.0 504.7 163 042.4 211.6 634.4 134 212.0
Total 6 144.1 2 073 321.2 2 024.2 1 370 572.7
Maize Beans
2010 EXW 827.0 241.5 199 748.4 EXW
2011 1 535.4 273.8 420 327.5
2012 983.3 333.0 327 428.4 220.0 638.9 140 568.3
Total 3 345.7 947 504.3 220.0 140 568.3
TOTAL 9 489.8 3 020 825.5 2 244.2 1 511 141.0
Source: Author’s compilation from official WFP Tanzania purchasing data.

10
Investment Analysis for Institutional Procurement
the logistics costs (assured by the change in delivery from EXW to DAP) and decreasing capacity building investment costs over time, the P4P procurement prices are closer to the regular programme ones.
Lastly, the superintendence13 costs (supervision for quality standards) appear to be greater for P4P purchases
13 In order to protect WFP from the risk of non-conforming goods being shipped to distant locations where they may be rejected, WFP may appoint an independent superintendent company to inspect an order. The inspection is carried out at WFP’s expense during production or prior to dispatch. If, however, an inspection has to be repeated due to a supplier’s fault, the costs of a second inspection and of the superintendent company for the same purchase order will be charged directly to the supplier. Inspections must be completed within the delivery period stated in the purchase order.
(USD 5 versus USD 2 per tonne).14 Regularly recorded/disaggregated data for this cost were not available and the differential in the superintendence costs was estimated through discussions with the procurement and logistics officers.
Critical information is also provided by the analysis of the contract typology with SACCOs (Table 6). Contracts stipulated with the SACCOs comprise three typologies:
•Direct purchase (waived): Direct purchase is when WFP negotiates directly with the P4P vendor on particular contractual terms. given the direct negotiation, an authorization from the procurement
14 These higher costs are mainly due to the fact that for P4P SACCOs, quality inspection happens at the SACCO level in warehouses rehabilitated by P4P interventions. The superintendent needs to travel to several warehouses that are dispersed country-wide. Regular procurement occurs in the WFP warehouses, of which there are only three in Tanzania.
Figure 2: Price evolution of beans
-
100
200
300
400
500
600
700
800
900
2009 2010 2011 2012
Beans price P4P
Beans price RP
Beans EXW CB-LG
Beans DAP CB
Figure 3: Price evolution of maize
-
100
200
300
400
500
600
2009 2010 2011 2012
US
D/M
T
Maize price P4P
Maize price RP
Maize EXW CB-LG
Maize DAP CB
Source: Official purchasing data and author’s simulation.

11
Purchase for Progress Country Case Study: Tanzania
authority is required prior to the negotiations. This type of contract modality was to be used during the initial phase of the P4P procurement activities in 2009/10 to facilitate SACCO participation; however, it continued until 2012 in the form of a forward delivery contract (FDC).
• FDCs (waived): The FDC method allows the SACCOs to sign contracts at the current market price. At the actual selling time to WFP, if the market price is greater than the price when the contract was signed, WFP will adjust the contractual price. Farmers benefit from this adjustment, which results in a fair market price.
•Competitive tendering: Request for quotations is issued to all P4P vendors who then compete among themselves to respond to the WFP bid.
Further to these measurable costs, discussions with the procurement and logistics officers noted that the actual duration of the produce delivery process by farmers was a major issue. Once a tender is concluded and a contract is issued with a SACCO, it takes months before the overall agreed production is delivered, causing default15 rates as high as 30 percent. These issues led to additional superintendence costs, which were significantly greater per tonne than those of regular commercial sellers as previously explained. These delays were not entirely the farmers’ fault, especially the two steps following the produce aggregation at the warehouses: inspection and payment. These are WFP’s responsibilities and are areas where WFP could accelerate the timing.
15 Default can be partial or complete due to side selling, quality problems or underproduction.
Other costs
Training costs16 were estimated at USD 0.715 million. Overall, more than 5 000 farmers were trained under the programme (5 046); the investment cost was USD 0.717 million, which translates to approximately USD 140 per farmer. One of the most important partnerships for which figures were recorded was with the Alliance for a green Revolution in Africa (AgRA); their contribution of around USD 0.5 million was basically two-thirds of the overall spending on training.
P4P established a broad series of partnerships with various stakeholders,18 which helped the implementation of project activities. It was difficult to estimate these contributions, as partners’ costs were not recorded.
Infrastructure and equipment costs. Under the P4P initiative, WFP made important investments to rehabilitate, construct and equip warehouses, with around USD 0.5 million invested in
16 Training on production/productivity, post-harvest techniques and access to and management of modern post-harvest infrastructure, business skills and others
17 Data provided by Tanzania country office, including a USD 0.5 million contribution from AgRA.
18 AgRA; Caritas; Cereals growers Association; Cooperative Rural Development bank (CRDb); Dunduliza; Food and Agriculture Organization of the United Nations (FAO); International Fund for Agricultural Development (IFAD); ILO/Coopafrica Kaderes Peasants’ Development Limited; National microfinance bank (Nmb); Research on Poverty Alleviation (REPOA); Rural Urban Development Initiative (RUDI); Stanbic bank Tanzania Agricultural Partnership; USAWA; World vision.
Table 6: Number of contracts by typology
Year Number of contracts CompetitiveCompetition waived
(soft tendering, direct contracts and FDC)
Total tonnes
2009 8 0 8 1 833
2010 25 20 5 3 299
2011 38 31 7 4 865
2012 20 11 9 2 008
2013 10 10 0 1 564
Total 101 72 29 13 569
Source: Author’s compilation from official WFP Tanzania purchasing data.

12
Investment Analysis for Institutional Procurement
equipment (including rubhalls19) and USD 0.1 million in warehouse rehabilitation.
Default rates. According to the Overseas Development Institute (ODI) P4P mid-term review,20 defaults did not significantly disrupt the pipeline to WFP’s food aid beneficiaries. The fact that over three-quarters of the food contracted from smallholders in some of the poorest countries was delivered, meeting time, price and quality specifications, is an important achievement. However, the overall P4P default rate, which stands at 24 percent of the total purchases delivered, is only tolerable because P4P is such a small share of WFP’s total local purchase. In Tanzania, default rates have been high, representing almost 20 percent of the total contracted quantities.
19 Rubhalls are mainly used for food storage and as warehouses and shelter. These buildings are easily transported and erected, ideal for a rapid response to emerging storage needs or while awaiting the construction of proper warehouses.
20 WFP 2008–2013 Purchase for Progress (P4P) Initiative: A Strategic Evaluation (mid-term), ODI (2011). http://www.wfp.org/content/mid-term-evaluation-wfp-2008-2013-%E2%80%9Cpurchase-progress%E2%80%9D-pilot-project-terms-reference
Defaults represent a cost for WFP and for its country programme due to re-tendering procedures and the possible physical unavailability of food for the country activities. It was not possible to estimate the financial costs of default,21 but it is an area of interest that could be further explored, tracking the costs of re-tendering and/or the social costs of being unable to deliver the country programme. Farmers reported that default rates were linked to long payment periods (as explained earlier) as immediate cash was needed after harvest by most of the farmers, and affordable hedging strategies were not yet available (see access to finance in the qualitative analysis chapter).
21 In addition, delivery delays have a cost and should be estimated. Often, by extending delivery terms/periods because the SACCO is unable to meet the original delivery time, one “masks” defaults: i.e., the contract is not defaulted because one has extended the delivery terms/dates.

13
Chapter
A benefit constitutes an increase in output or savings in resource use. Table 7 presents a list of direct and indirect benefits. The direct benefits to farmers investigated and described in the P4P Tanzania programme include: crop intensification through improved use of productive inputs and agronomic practices; incremental income owing to increased production and/or higher selling prices; increased output quality (and higher unit prices); reduced production costs; reduced crop wastage through access to storage facilities (warehouse); time saving or better remuneration of labour. The indirect benefits are those not directly expected by implementing project activities but more likely generated by the dynamics of the project activities and results. The benefits list is not exhaustive and not all potential benefits were included in the analysis. During field visits, some minor benefits were observed but excluded as being merely anecdotal, thus bringing no added value to the analysis.
Further to the benefits description and analysis, two representative crop models were developed to systematically show the benefits at farm level. A numeric model was developed to estimate the likely overall impact of the P4P intervention on increased annual production and reduced post-harvest losses.
Farm/household characteristics. According to the baseline survey, at national level, rural Tanzanian households hold an average of 2 hectares and cultivate between 0.9 and 3.0 hectares. Land is the principal input in agricultural production. Land holding is also an indicator of wealth that might be used as collateral for credit or capital investment. The P4P baseline survey results are in line with the national statistics. Surveyed P4P participating households owned an average of about 1.7 hectares and cultivated an average of 1.5 hectares. For the purpose of this analysis, farmers participating in P4P activities are smallholders holding an average of 1 to 2 hectares, cultivated with maize, beans and other traditional crops. Smallholder farmers suffer from low productivity, poor access to credit and distance or lack of access to markets. The P4P initiative specifically targeted these issues and the programme’s main benefits stem from the intervention in these areas.
Quantitative analysis
Although difficult to distinguish clearly, these benefits would result primarily from a combination of the following changes for farmers due to P4P interventions in training, infrastructure and equipment:
•greater farmgate prices through better quality produce;
BenefIts analysIs
3Table 7: Direct and Indirect Benefits
Direct Benefits Indirect Benefits
Increased selling price(price premium, greater sales to market)
Access to rural finance
Predictable market access Increased market opportunities
Increased productivity/production Access to storage for overall production
Entrepreneurship and basic business management
Improved sales conditions(weight- versus volume-based sales)
P4P post-harvest loss reduction Job creation
Increased FO capacity and membership Increased food availability
Source: Author’s compilation.
14
Investment Analysis for Institutional Procurement
•Adoption of improved technology packages leading to increased production, productivity and selling techniques;
• Improved technical and negotiation capacity of farmers; and
•Post-harvest techniques and warehouses.
Increased selling price. While the investment analysis does not seek to provide an overall analysis of price trends, there are interesting opportunities for examining the scale of increased financial benefits accrued by participating farmers through P4P, especially as this is one of the key indicators of the entire programme. This takes into account different commodity quality categories, given that one of the goals and requirements of P4P is improved commodity standards by FOs. In the case of Tanzania, crop prices received by farmers selling to WFP have significantly increased since they joined the P4P scheme. It is assumed that the price increase is largely due to the enhanced quality of crops produced (maize and beans), improved post-harvest handling activities and correct grading,22 which enabled farmers to enter new markets. The price increases were estimated at 50 percent for both crops.23
There is an indication that benefits from the greater price and incremental production sold seem to more than compensate for the increased production and post-harvest handling costs (see the chapter on illustrative numeric models). It has, however, proved to be difficult to attribute the effect of the P4P intervention on farmers’ prices because P4P has only recently begun collecting information on farmgate prices for local procurement - essential information for demonstrating this kind of impact.
Only a limited percentage of farmers, around 30 percent of SACCO members, are currently selling to WFP and benefiting from the price increases. For the remaining 70 percent of farmers, it is reasonable
22 grading is an important practice for producers in preparing the crop for market. The grade actually determines the price the farmers receive for their crop. It is a good practice for producers to start grading at the farm before taking the produce to the market as it gives them an indication of the worth of their crop-related income.
23 The same price increases were used for the quantitative model, illustrating the financial analysis at farm level and presented in the next chapter (quantitative models).
to assume there were no price changes. These improved terms of trade translate into increased income or increased food availability (not all the additional production is sold on the market) at farm level or a combination of both. During the field visits, farmers (especially women) reported increased food availability, which they considered one of the major programme benefits.24 Increased income was also recorded by the preliminary results of the baseline and follow-up report surveys (2009 and 2013).
In general, farmers interviewed during field visits showed great interest and appreciation for the training provided, which ranged from production enhancement to post-harvest loss reduction and marketing. Skills acquired by farmers had an impact well beyond the targeted crops. A commercial mindset is growing among farmers. It was also recorded during field visits that farmers not trained directly by WFP were benefiting from training by lead farmers (training of trainers) and learning by doing with trained farmers. There appeared to be a significant spill-over effect, resulting in a larger number of actual beneficiaries and a lower unit cost per trainee. It would be interesting to research this further to verify these preliminary findings. Training is instrumental for all the changes in farmers’ practices, but it is difficult to attribute the benefits to a specific training. main impacts of benefits are listed below.
1. Adoption of improved agricultural practices. Specific training was provided to improve agricultural practices and input use. Preliminary data from the follow-up survey report show an increased number of P4P households (from 29 to 37 percent) using improved/certified seed, which clearly demonstrates the positive uptake of agricultural innovation. Similar evidence is available for the P4P households using fertilizer, which increased from 18 to 28 percent. The combined impact of improved agricultural practices and input use was significant and an increase between 20 and 30 percent (depending on crops) of available agricultural output (including reduced post-harvest losses addressed below) could be reasonably expected and confirmed by farmers during field visits. WFP did not directly facilitate access
24 It was not possible to verify this information with official data or other research.
15
Purchase for Progress Country Case Study: Tanzania
to inputs, but input use was one of the topics of the training on agricultural practices. The uptake in improved agricultural input use was applied in the modelling, although the final results of the impact surveys are not yet available.
2. Training in entrepreneurship and basic business management skills changed farmers’ approach to agriculture. Agriculture is now perceived by interviewed P4P participating farmers as a business. Improved seed and fertilizer are increasingly used in P4P areas, as reported by farmers. Farmers have learned the basics of a correct approach for recording expenditures of inputs and price settings for the final produce. Farmers are applying these acquired skills to all their transactions, which go well beyond P4P crops. The benefit increase for maize and beans led to a partial shift in cropping patterns favourable to these crops. However, no expansion of land under production was reported during field visits due to land unavailability in the zones visited (Arusha and Karatu).
3. The switch from volume-based to weight-based sale was reported as a major change in sales. Prior to the P4P, there was no standardized system of measurement, which resulted in mistrust between seller and buyers. Farmers believe, for example, that one full bucket of maize weighs 20 kg and that a sack of the same commodity weighs 100 kg. In reality, a bucket can weigh 22 to 23 kg and a sack can weigh 110 to 120 kg in what is colloquially known as lumbesa. This standardization of weight-to-volume ratio and verification of true weight to avoid an unfair advantage of traders had a dramatic impact on farmers’ revenues, and during field visits it was reported as the first perceived benefit from the programme. Empirical evidence25 during field visits estimates an additional 20 percent of production now available at household level for sale or home consumption. Farmers adopted the weight-based selling system for all other crops produced, regardless of the buyers (e.g. sales beyond WFP to middlemen and other traders).
25 It was not possible to verify this information with official data or other research.
4. Post-harvest losses in Tanzania range between 25 to 35 percent of yields.26 High post-harvest losses are blamed on low capacity in agroprocessing, lack of storage facilities and mismanagement of crops after harvest at farm level. P4P had a tremendous impact in this area through training on post-harvest handling and physical infrastructure rehabilitation. Training on post-harvest losses was provided to around 4 000 farmers. Overall, an additional storage capacity of 8 250 tonnes was installed in the country, both for maize and bean production. This additional warehousing capacity would provide improved storage and reduce post-harvest losses for the potential production of more than 20 000 farmers (overall number of SACCO members) and non-member farmers, as access to warehouses is not limited to SACCO members. Estimates of post-harvest loss reduction for the analysis is therefore based both on new storage capacity installed though the P4P intervention and specific training on post-harvest crop handling and storage at household level before storage at warehouses.
5. Increased farmer participation in SACCOs. P4P in Tanzania currently operates in ten regions and engages with 19 000 maize and bean farmers who are registered in the 28 SACCOs. Around 15 to 20 percent of the SACCO members participated in the P4P marketing. Non-SACCO members can complement the tender with their production; there is a trend among non-member farmers to enrol in the SACCOs upon completion of their first contract. Their participation in the tender process was estimated between 20 to 30 percent of the total production. It was also reported that non-SACCO member farmers participated in the marketing once the market contract was awarded to the SACCOs. During field discussions it emerged that the collapse of the former Cooperative Union had undermined farmers’ trust in collective schemes for crop marketing. P4P activities have shown to attract non-members who were likely to formally register as part of the SACCOs after successfully participating in a WFP contract. This clearly represents
26 brief No 5 - ministry Of Agriculture, Food and Cooperatives “Improving market access and value addition for sustainable agriculture development”.

16
Investment Analysis for Institutional Procurement
an indirect benefit in that P4P is contributing to rebuilding trust in cooperative marketing schemes, and also helping SACCOs to access other markets.
6. Privileged access to markets. Critical information is provided by the analysis of the SACCO contract typology (Table 6). The waived contracts allowed the SACCOs to sign contracts with privileged conditions with respect to the competitive ones (explained earlier). Discussions held with farmers and SACCOs highlighted the importance of the introduction of WFP P4P FDCs, included in the waived category. most of the farmers appreciated this type of contract as it had a positive impact for smallholders on the planning of the planting seasons, both in terms of crops and inputs. This was also confirmed through a key informant interview with a capacity building service provider.
The contract typology analysis shows that 70 percent of the contracts were done through a competitive tendering and competition was waived on 30 percent of the contracts. It is difficult to draw conclusions from this data alone and a deeper analysis of single transactions would provide a clearer picture. WFP will sooner or later withdraw as an institutional buyer, thus it is important for SACCOs to be able to compete on the market without waivers or other privileged market access. In 2013, no waived contracts were awarded, which is a good sign for the farmers’ competitiveness process.
During field visits farmers reported that the additional production available was partially used for household consumption. The latter was particularly interesting as it led to a dual benefit: increased food availability and smoothing of consumption at household level during the lean season.
Qualitative analysis
Qualitative data can provide important indicators of programme results or constraints, and also increase insight into the impact of the P4P activities in areas where figures are not yet available or a numeric modelling is not appropriate. Important benefit trends are highlighted and this category may suggest areas for future study that, with appropriate sampling methodology, could provide statistically valid data.
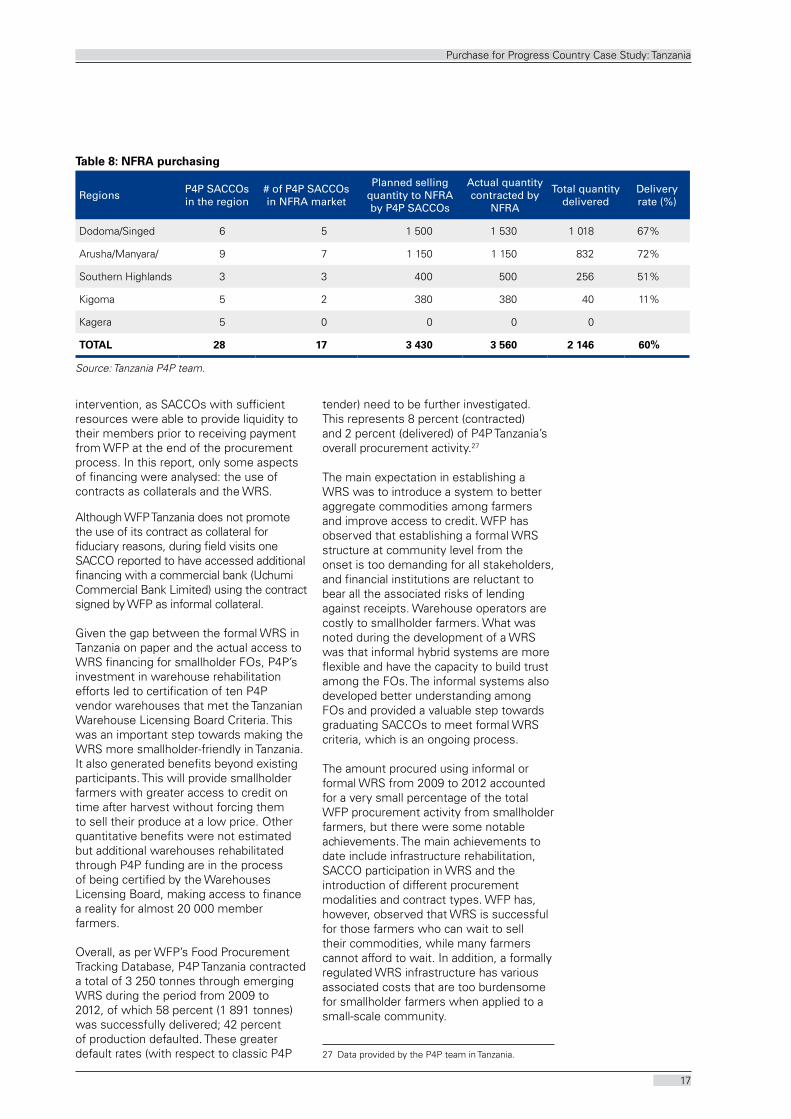
New market access. Partial information is available on market access beyond WFP. There is an increasing trend for P4P SACCOs to sell to institutional buyers such as the National Food Reserve Agency (NFRA) and large private traders. NFRA purchases have been facilitated by WFP, and WFP and NFRA have signed a memorandum of Understanding to facilitate the linkages with P4P-supported SACCOs. This new market is now accessible to all P4P SACCO participants. Table 8 shows 2013 seasonal purchases. Currently the NFRA is engaged with 23 of the 28 P4P SACCOs, planning to buy around 3 560 tonnes, with a delivery rate close to 60 percent; however, final data are not yet available.
The NFRA market is somehow different from the WFP market. NFRA’s quality requirements are less strict as no grain certification standards are yet in place in Tanzania. There is also no need to rebag, fumigate or stock in the warehouses, as the collection is much quicker than WFP’s. The NFRA purchase is always carried out under the EXW contract modality, which is highly appreciated by farmers as the risks associated with transport are born by the buyer, as previously mentioned. The disadvantage is the lower price, around 520 Tsh per kg versus 750 Tsh per kg for WFP’s, which can be compensated by the fewer quality requirements. As indicated by the preliminary financial analysis and discussions with farmers, the price they received was almost the same final price, as the higher prices received by WFP were offset by the greater requirement costs.
Farmers, however, reported that the WFP requirements were welcome as they provided additional work (e.g. re-bagging). These activities generated incremental employment and income at village level, which were appreciated and recognized as an important additional benefit to the community.
Further to NFRA markets, some SACCOs are now approached by private traders attracted by the quality of the commodities and the availability of bulked quantities at warehouses. These additional contracts were reported during field visits but no quantitative evidence (e.g. quantities, prices) was available. Traders were from Tanzania (e.g. Kilimo market) and neighbouring countries (e.g. Kenya).
Access to finance. Access to credit was a significant component of the P4P
17
Purchase for Progress Country Case Study: Tanzania
intervention, as SACCOs with sufficient resources were able to provide liquidity to their members prior to receiving payment from WFP at the end of the procurement process. In this report, only some aspects of financing were analysed: the use of contracts as collaterals and the WRS.
Although WFP Tanzania does not promote the use of its contract as collateral for fiduciary reasons, during field visits one SACCO reported to have accessed additional financing with a commercial bank (Uchumi Commercial bank Limited) using the contract signed by WFP as informal collateral.
given the gap between the formal WRS in Tanzania on paper and the actual access to WRS financing for smallholder FOs, P4P’s investment in warehouse rehabilitation efforts led to certification of ten P4P vendor warehouses that met the Tanzanian Warehouse Licensing board Criteria. This was an important step towards making the WRS more smallholder-friendly in Tanzania. It also generated benefits beyond existing participants. This will provide smallholder farmers with greater access to credit on time after harvest without forcing them to sell their produce at a low price. Other quantitative benefits were not estimated but additional warehouses rehabilitated through P4P funding are in the process of being certified by the Warehouses Licensing board, making access to finance a reality for almost 20 000 member farmers.
Overall, as per WFP’s Food Procurement Tracking Database, P4P Tanzania contracted a total of 3 250 tonnes through emerging WRS during the period from 2009 to 2012, of which 58 percent (1 891 tonnes) was successfully delivered; 42 percent of production defaulted. These greater default rates (with respect to classic P4P
tender) need to be further investigated. This represents 8 percent (contracted) and 2 percent (delivered) of P4P Tanzania’s overall procurement activity.27
The main expectation in establishing a WRS was to introduce a system to better aggregate commodities among farmers and improve access to credit. WFP has observed that establishing a formal WRS structure at community level from the onset is too demanding for all stakeholders, and financial institutions are reluctant to bear all the associated risks of lending against receipts. Warehouse operators are costly to smallholder farmers. What was noted during the development of a WRS was that informal hybrid systems are more flexible and have the capacity to build trust among the FOs. The informal systems also developed better understanding among FOs and provided a valuable step towards graduating SACCOs to meet formal WRS criteria, which is an ongoing process.
The amount procured using informal or formal WRS from 2009 to 2012 accounted for a very small percentage of the total WFP procurement activity from smallholder farmers, but there were some notable achievements. The main achievements to date include infrastructure rehabilitation, SACCO participation in WRS and the introduction of different procurement modalities and contract types. WFP has, however, observed that WRS is successful for those farmers who can wait to sell their commodities, while many farmers cannot afford to wait. In addition, a formally regulated WRS infrastructure has various associated costs that are too burdensome for smallholder farmers when applied to a small-scale community.
27 Data provided by the P4P team in Tanzania.
Table 8: NFRA purchasing
RegionsP4P SACCOs in the region
# of P4P SACCOs in NFRA market
Planned selling quantity to NFRA by P4P SACCOs
Actual quantity contracted by
NFRA
Total quantity delivered
Delivery rate (%)
Dodoma/Singed 6 5 1 500 1 530 1 018 67%
Arusha/manyara/ 9 7 1 150 1 150 832 72%
Southern Highlands 3 3 400 500 256 51%
Kigoma 5 2 380 380 40 11%
Kagera 5 0 0 0 0
TOTAL 28 17 3 430 3 560 2 146 60%
Source: Tanzania P4P team.

18
Investment Analysis for Institutional Procurement
Farmers reported job creation at family or village level due to additional labour requirements during production and harvest/post-harvest periods. During field visits, farmers reported the job creation as one of the major additional indirect benefits of the P4P scheme.
The payment period was seen as a burden by participating farmers and perceived as an additional cost. globally, the standard payment period for WFP contracts is 30 days. This payment period forced farmers in need of liquidity out of the scheme, although the price differential was important. During 2013 field visits, the reported selling price to WFP was 750 Tsh per kg, while the selling price for immediate cash offered by middlemen was around 500 Tsh.28 A reduced payment period is key to enabling more farmers to participate, or alternative pre-financing methodologies need to be found (such as the WRS or mobile phone advance payment).
28 Reported selling prices for middlemen are based on 2013 activities, during which the presence of the NFRA market caused middlemen to raise their buying price from FOs. NFRA contracts with P4P FOs ranged between 480 to 520 Tsh per kilo. Usually middlemen do not pay above market price.
Although P4P is only a few years into the pilot, the project appears to have generated some major additional preliminary institutional benefits: (a) producer and marketing groups are effectively functioning and linked to markets; (b) local communities are sustainably managing their physical infrastructure investments (warehouses and equipment); and (c) public and private sector operators are providing quality services that are demanded by smallholder producers and rural entrepreneurs. These are promising areas of research for additional impact and results; however, it was not possible to quantify them at this stage.
19
Chapter
4This chapter develops some financial models to provide further insight into the P4P benefits and sustainability.
The objective is to provide a practical means to assess profitability and benefits, both for farmers and the country’s overall economy, of P4P activities and procurement. As the analysis was ex-post and data were not originally collected for this purpose, no attempt was made to calculate the internal rate of return and the net present value of the supported activities.
The financial crop models (Annex 4) present best-case scenarios for farmers who apply the improved agronomic practices and inputs learned through the formal trainings and on-the job training provided by P4P, bearing in mind that this scenario does not apply to all farmers participating in the P4P scheme.
The parameters for the models are based on the information gathered during the mission and, in particular, through the farmer group discussions, interviews with about 50 members, SACCO board members and a review of P4P preliminary baseline follow-up reports, available documents and statistics from ongoing interventions supporting agricultural and value chain development in Tanzania (World bank-ADSP). Prices reflect those actually paid/received by the farmers. These were collected during the field visits. Conservative assumptions were made both for inputs and outputs.
The analysis focused on a comparison of the “without project” and “with project” scenarios. In the “without project” scenario, it is assumed that farmers would continue with the existing low-input, low-output production system and that opportunities for increased value addition and marketing in the project area would remain limited. However, it is important to note that in recent years a general increase in overall production of maize and beans was reported in Tanzania due to government intervention with extension
and input support.29 Thus, a 10 percent increase in production was retained in the “without project” scenario.
In the “with project” scenario, estimations for increased production were based mostly on field visits and information from ongoing interventions in Tanzania and the P4P preliminary baseline follow-up report. These models, however, do not have any statistical validity, are only representative of the areas of the country visited and cannot be used to estimate general income increases at household level.
An illustrative numerical model was developed to estimate the likely aggregated impact of P4P after project completion, the details of which are presented in Annex 4. The hypothesis and assumptions of this model are primarily based on field visit data. The model based its assumption on: number of farmers belonging to the SACCOs working with WFP; average land size per household; average area under production (maize and beans); increase in production (using the results of the representative crop models); and post-harvest loss reduction of 10 percent.
Two representative P4P crops models (maize and beans) were developed to depict the benefits previously described at farmer/farm level, including:
• Increased selling price;
• Increased production/productivity through training on improved agronomic techniques;
•Reduced post-harvest losses through the adoption of improved post-harvest
29 The counterfactual was estimated from field visits and secondary data estimating the increase in production “without project” at 10 percent and no increase in the selling price. No comparison was made with other projects.
IllustratIve models

20
Investment Analysis for Institutional Procurement
techniques and access to modern post-harvest infrastructure;30 and
•Use of modern inputs.
These increases were based on m&E data and field visits and were not verified with statistical data or other official research.
Additional benefits discussed during field visits were achieved by switching from a volume- to a weight-based sales system. This switch provided an additional 20 percent gain for maize and bean farmers and an additional percentage gain (not estimated) from the application of this system to other crops (e.g. cowpeas). Women particularly appreciated this result and felt empowered to the extent that they applied this weight sale system to every crop they grew. This is expected to lead to a significant impact on women, given that poor women generally lack decision-making and negotiating power.
The maize and bean crop models (see Annex 4 for details) show the potential gains at farm level for participating farmers with 1 hectare of land (Table 9).
Maize. The estimated total production increase per farmer is around 500 kg per hectare, equivalent to a 35 percent production increase with respect to the baseline, owing to improved agronomic techniques and inputs. The related increase in income for 1 hectare of land is approximately USD 187, equivalent to an increase of 52 percent with respect
30 Post-harvest loss reduction was estimated based on the additional storage capacity, of which 8 250 tonnes were installed through P4P’s rehabilitation of existing warehouses, and 3 000 tonnes provided by around ten temporary warehouses mobilized by WFP (rubbhalls).
to the “without project” scenario. According to the P4P follow-up report, farmers sold on average 22 to 27 percent of their maize; the model provides an estimate of the financial value of the overall production.
The model captures family or village job creation (family labour line) in terms of additional labour requirements during production and harvest/post-harvest periods. During field visits, farmers reported the creation of jobs in farming and post-harvest activities as one of the major additional indirect benefits of the P4P scheme. According to the model, the average number of labour days (man-days to cultivate1 hectare of land) increased by almost 20.
Production costs increased significantly from around USD 0.19 to 0.25 per kg, equivalent to a 31 percent increase. This increase was due to the new requirements in terms of improved inputs and additional labour. Farmers seem to be able to afford greater production costs; however, they need to inject more financial resources into production, so they are more exposed to financial risk in case of crop failure (maize and beans are almost all rainfed) or price drops. Investment and working capital are sometimes difficult to raise, as credit is not easily available in rural areas. The link with financial service providers could enhance the benefits and ensure sustainability of the scheme.
Regarding the bean crop model (see Annex 4 for details), the increase in production was estimated at 10 percent in the “without project” scenario and 20 percent in the “with project” scenario, including reduced post-harvest losses. The estimated gains, only for the participating
Table 9: Maize and bean crop models
MAIZE BEANS
Start No P4P With P4P Change %
Start No P4P
With P4P
Change %
Physical production
Kg 1 350 1 485 1 820 35 700 770 840 20
Inputs USD 27,5 69 198 720 76 91 148 95
Family labour
DAyS 118 122 137 16 59 70 89 51
Total production costs/kg
USD 0.19 0.22 0.25 31 0.33 0.36 0.45 37
Net income USD 355 396 542 52 219 233 355 62

21
Purchase for Progress Country Case Study: Tanzania
farmers, are significant and stem from increased production/productivity, reduced post-harvest losses and increased prices as the reference market has changed. In the “with project” scenario, farmers’ production costs are greater due to the use of certified seed and fertilizer and the additional labour requirements needed for production and post-harvest activities. Consequently, the farmers were more exposed to financial risks in case of crop failure or price fluctuations.
The estimated increase in production per hectare is 140 kg, equivalent to 20 percent additional production with respect to the baseline. The estimated increase in net income generated with 1 hectare of land is around USD 136, equivalent to a 62 percent increase with respect to the “without project” scenario. On average, according to the P4P follow-up survey report, farmers sold 39 to 44 percent of their beans, and the model provides an estimation of the financial value of the overall production.
As for the maize model, the job creation is captured (family labour line) by the additional labour requirements during production and harvest/post-harvest periods. Labour requirements also increased for the bean growers. According to the modelling, the average number of days to cultivate 1 hectare of land increased by almost 30 man-days.
based on the assumptions of the financial models and overall farmer participation, a numerical model was developed to estimate the likely aggregated impact of P4P after the project’s completion (see Annex 4 for details). The two major aggregated benefits were increased production and reduced post-harvest losses per year. The proxies used were the training on production, productivity, business and post-harvest losses and the enhanced availability of proper warehouses. This model was based on the same hypothesis on production/productivity increases and post-harvest loss reduction as assumed in the crops budgets. It used 2012 prices, assuming they remained constant, to calculate the value of the additional production. Additional hypotheses were made on the members producing maize and beans, based on field visit observations.
The numerical model records significant increased production with a conservative increase of 35 percent for maize and 20 percent for beans, and a reduction of 50 percent in post-harvest losses from 20 to 10 percent. These figures show that the impact of P4P will hold out well beyond the duration of the five-year programme. Production could potentially increase by up to 20 000 tonnes and 4 000 tonnes for maize and beans, respectively. This additional production would be either available for household consumption (increasing food security) or marketing (increasing incomes). Since the hypotheses of the model are based on field visits only, they cannot be used to estimate the sustainability of the intervention. more reliable data with statistical validity are needed to carry out a proper calculation of the aggregated benefits of the P4P intervention. The main purpose here is to propose a logic of aggregation that could be tested once the needed data were available.
Using 2012 USD prices per tonne, the aggregated estimated value of the production is around USD 3 million in one year. These figures are merely indicative and based on the assumptions described above. In order to achieve a more detailed analysis, quality data would be required on farmers’ production patterns, area under production, production increases per hectare, percentage of production sold for cash and post-harvest loss reduction. This information will likely be available once the programme has finished. It would be interesting to repeat this exercise with a final set of data, although it would be partially compromised by the lack of baseline data at project start.


23
Chapter
5This country case study highlights a number of significant results of the P4P intervention among the targeted population: increased productivity and physical outputs; changes in agricultural practices; shifts in technologies; and reduced post-harvest losses. Through the P4P, WFP was able to purchase around 15 percent of its food needs for country assistance programmes.
The analysis of unit costs per tonne shows that P4P purchases are more expensive than regular purchases, especially when EXW delivery methods are used. When capacity building and logistics costs are added, the differential with regular programme purchase is even greater. However, this differential is expected to decrease over time as no more investment is foreseen (e.g. capacity building and infrastructure), and contracts are switching to DAP delivery modality.
The investment cost per beneficiary was estimated at USD 200 (including overall SACCO membership and overall costs of the P4P intervention in Tanzania, excluding procurement), and the financial benefits per beneficiary (assuming he/she cultivates 1 hectare of land) will potentially exceed the investment costs after a few years, if calculated at farm level:31 additional USD 187 in income for maize and USD 136 for beans (see financial models for more details in Annex 4).
On the basis of the assumptions described in earlier chapters, the programme generated important benefits. Not all potential benefits were included in the analysis, and the likely multiplier effects described were not quantified.
Training had a dramatic impact on farmers’ activities and approach to agriculture as a business. In particular, the shift from volume-based sales to weight-based sales was reported as the major benefit from the scheme (leading to an income gain of approximately 20 percent). Agriculture is now perceived as a business for P4P farmers and the use of improved seed
31 based on 1 hectare of land.
and fertilizer is growing among farmers, although erratic rainfall in recent years is increasing the financial risks of farmers investing in improved inputs.
In addition, new jobs were created for both women and men, particularly in post-harvest activities. It was not possible to estimate this increase in employment due to the limited time available for the study, but during field visits farmers highlighted this additional indirect benefit. It would be an interesting area for further research.
Thanks to the P4P intervention, benefits sharing and power relationships have started to change along the value chains to farmers’ advantage. by establishing new and improved capacity in production and access to markets, the P4P intervention somehow changed the ‘rules of the game’ governing the nature of commercialization of participating farmers well beyond the targeted crops, generating tangible spill-over effects. best practices in grading were applied to other crops leading to higher prices for farmers. Improved capacity in post-harvest losses and access to warehouse facilities caused a general decrease in post-harvest losses at farm level. The switch from volume-based sales to weight-based sales is now applied to all crops produced and used even by non-participating farmers in the same villages. Overall, interviewed farmers reported a change in their approach to agriculture from a traditional low-input, low-output activity to a commercial one.
The project design and implementation incorporated a flexible approach to women’s inclusion and provided specific training on gender in an effort to consider the specific issues faced by women. It was not possible to verify the actual number of women participating in the programme, either during field visits or from m&E reports, as participating farmers were not individually tracked. The percentage of women members in SACCOs in Tanzania is 40 percent. Women’s participation during all farmer meetings was high.
key fIndIngs and conclusIons
24
Investment Analysis for Institutional Procurement
Additional unquantifiable benefits from the project result from its de facto focus on rural poverty reduction and food security. The project provides additional sources of income and food availability for poor rural households, thereby contributing to reduced vulnerability.
The single major constraint for farmers participating in the P4P scheme was the long payment period. The standard payment period is 30 days in WFP contracts. This payment period forces farmers in need of liquidity out of the scheme even if the price differential is important; the reported selling price to WFP is 750 Tsh per kg, while the selling price for immediate cash with middlemen is around 500 Tsh per kg. A reduction in this payment period is key to enabling more farmers to participate, or pre-financing alternatives must be sought. The WRS, depending on cost of credit, or partial electronic payments through cell phones at product delivery, could be useful alternatives.
Farmers reported market uncertainty related to the competitive tender process as a major risk. The requirement for FOs to compete for WFP contracts, and the implied risks of not winning the contracts, lead to uncertainty in production decisions.
Overall, the crops targeted by the P4P interventions performed well, but the analysis did not fully capture the high level of support provided. It would be interesting to test the sustainability of the models at a financial level with reduced or no support over time.
A key element of programme sustainability was access to markets other than WFP. Evidence has shown an increasing trend and capacity among farmers to gain access to other institutional (NFRA) and commercial markets. Private traders are attracted both by the quality of the grain produced, and by the bulking function of warehouses that can easily reach up to 100 tonnes. The availability of produce in a single location with similar standards is key to attracting commercial buyers who cannot afford the transaction costs of dealing with many small producers and/or are not interested in hiring middlemen to aggregate on their behalf.
The P4P interventions show a significant increase in productivity and physical agriculture outputs with no adverse effects on retail and producer prices, benefiting highly vulnerable populations. However, due to the pilot nature and limited size and scale of the project, it cannot be expected to have a significant impact in changing overall farmer participation in the value chains at country level. Nevertheless, lessons learned could be drawn and used to scale up best practices.
Despite achievements in production increases, post-harvest loss reductions and market access, the participation of SACCO members was still low (around 20 percent), as payment delays were lengthy and access to warehouse facilities for farmers not living in the village difficult. Erratic rainfall in recent years lowered the output of some farmers and thus their willingness to invest in improved inputs.

25
Annex lIst of documents
•Consolidated P4P FOs & training report
•Consolidated procurement reports for P4P
• FO sales beyond P4P
• Investment analysis methodology
• Logistics study
•Numeric datasets on purchases, commodity prices, procurement methods, training provided and warehouse rehabilitation
•ODI mid-term review
•P4P global learning agenda
•P4P monthly update
•P4P global log frame
•Status of P4P survey data
• Tanzania baseline survey report 2012
•Contribution of P4P to building the capacity of FOs
•USDA study on the impact of P4P purchases on local market price data
•WFP Tanzania country brief
1

26
Investment Analysis for Institutional Procurement
Breakdown of offIcIal P4P costs
Bill and Melinda Gates Foundation funded grant 10003314
Tanzania2009 to March
2010April to Dec 2010 Jan to Dec 2011 Jan to Dec 2012
Personnel 492 948 374 272 544 366 560 362
Travel 87 005 65 169 116 966 110 069
Consultant 4 431 - 4 200 21 286
Supplies 118 292 191 471 63 605 92 574
Contracted Services 1 662 10 137 9 091 85 978
Subgrants to Other Organizations 3 641 47 689 87 762 71 772
Equipment 27 132 - - -
Grand total 735 111 688 738 825 990 942 041
Overall total 3 191 880
2annex
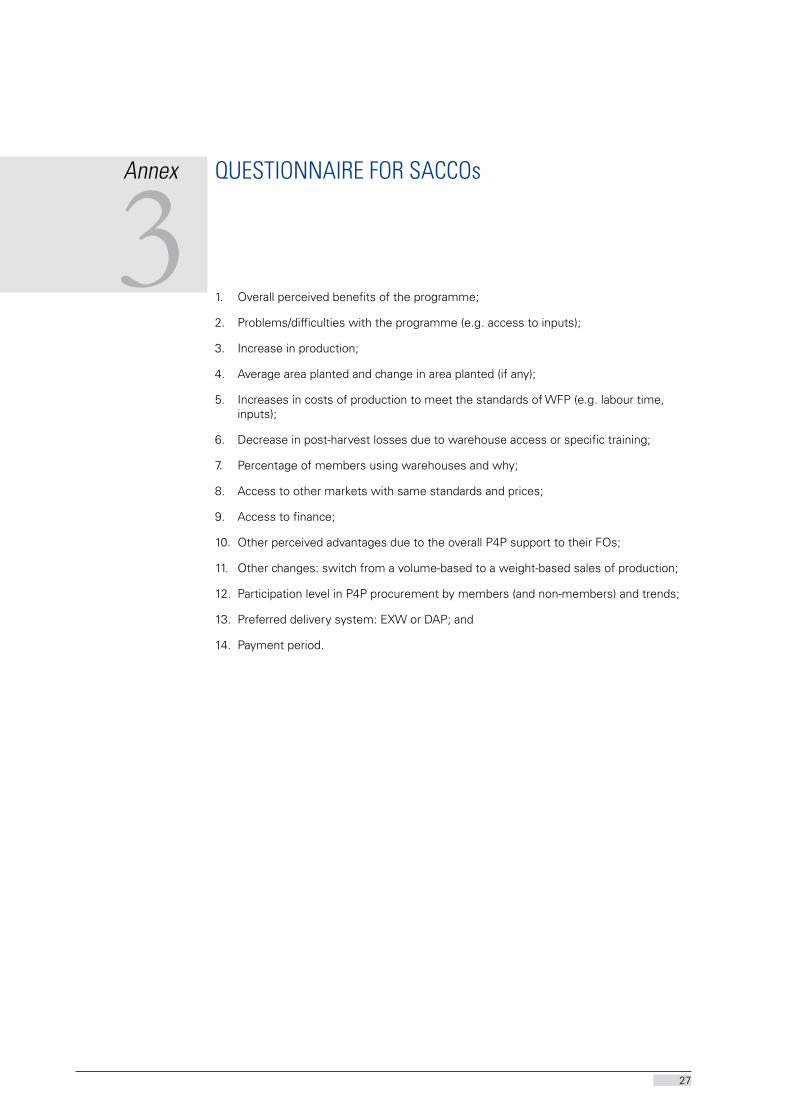
27
Annex QuestIonnaIre for saccos
1. Overall perceived benefits of the programme;
2. Problems/difficulties with the programme (e.g. access to inputs);
3. Increase in production;
4. Average area planted and change in area planted (if any);
5. Increases in costs of production to meet the standards of WFP (e.g. labour time, inputs);
6. Decrease in post-harvest losses due to warehouse access or specific training;
7. Percentage of members using warehouses and why;
8. Access to other markets with same standards and prices;
9. Access to finance;
10. Other perceived advantages due to the overall P4P support to their FOs;
11. Other changes: switch from a volume-based to a weight-based sales of production;
12. Participation level in P4P procurement by members (and non-members) and trends;
13. Preferred delivery system: EXW or DAP; and
14. Payment period.
3
28
annex croP Budget and numerIc model
4

29
Purchase for Progress Country Case Study: Tanzania
Mai
ze c
rop
bu
dge
t
Are
a: 1
Hec
tare
Uni
t
Past
Sit
uat
ion
Pre
sen
t S
itu
atio
n
Wit
ho
ut
Pro
ject
: ou
tpu
t w
ill
incr
ease
by
10%
Wit
h P
roje
ct: o
utp
ut
will
in
crea
se b
y 35
%N
o. o
f U
nits
Uni
t C
ost
(TZS
)va
lue
(TZS
)N
o. o
f U
nits
Uni
t C
ost
(TZS
)va
lue
(TZS
)N
o. o
f U
nits
Uni
t C
ost
(TZS
)
valu
e(T
ZS)
Ou
tpu
t
gra
inkg
1.35
045
0,00
607.
500
1.48
550
0,00
742.
500
1.82
365
0,00
1.18
4.62
5
kg
00
0,00
00
0,00
0
mai
ze s
tove
rkg
2.00
05
10.0
002.
200
5,00
11.0
002.
700
5,00
13.5
00
Tota
l Ou
tpu
t
617.
500
753.
500
1.19
8.12
5
Var
iab
le C
ost
s
1. In
pu
ts
See
d
Impr
oved
see
dskg
202.
000
40.0
00
Rec
ycle
d/sa
ved
seed
skg
201.
700,
034
.000
201.
700
34.0
0020
Fert
ilize
r /h
DA
Pkg
00
020
080
016
0.00
0
UR
EA
kg
0
5080
0,00
40.0
0010
01.
100
110.
000
Her
bici
de
025
1.10
027
.500
Fung
icid
e
0
0
mis
cella
neou
s (b
ags
etc.
.)lu
mps
um1,
010
.400
10.4
001,
010
.400
10.4
00
10.4
00
Su
b-t
ota
l In
pu
ts
44.4
00
11
1.90
0
32
0.40
0
2. F
amily
Lab
ou
r
Tot.
P
loug
hing
& p
lant
ing
(incl
. fer
t. a
pplic
.)pe
rs. d
ay38
,03.
000,
011
4.00
042
,03.
000
126.
000
50,0
3.00
015
0.00
0
Har
row
ing
pers
. day
20,0
3.00
0,0
60.0
0020
,03.
000
60.0
0025
,03.
000
75.0
00
Pud
dlin
gpe
rs. d
ay33
,03.
000,
099
.000
33,0
3.00
099
.000
35,0
3.00
010
5.00
0
Spr
ayin
gpe
rs. d
ay0
0,0
00
0,0
00
Wee
ding
pers
. day
27,0
3.00
0,0
81.0
0027
,03.
000
81.0
0027
,03.
000
81.0
00
Hir
ed L
abo
ur
pers
. day
3.00
0,0
00,
03.
000
00,
03.
000
0
Su
b-t
ota
l Lab
ou
r11
8,0
354.
000
122,
036
6.00
013
7,0
411.
000

30
Investment Analysis for Institutional Procurement
3. M
ach
iner
y/A
nim
al P
ower
P
low
ing
& p
lant
ing
/gox
en-p
air
day
Thr
eshi
ng
/gox
en-p
air
day
0
00
0
00
0
00
Su
b-t
ota
l Mac
hin
ery/
An
imal
Po
wer
0,0
00,
00
0,0
0
4. O
ther
Var
iab
le C
ost
s
Har
vest
ing
bags
14,0
500,
07.
000
14,0
500,
07.
000,
018
,050
0,0
9.00
0,0
Tran
spor
ting
bags
14,0
300,
04.
200
14,0
300,
04.
200,
014
,030
0,0
4.20
0,0
Pos
t-ha
rves
tba
gs14
,050
0,0
7.00
014
,050
0,0
7.00
0,0
18,0
500,
09.
000,
0
Pes
ticid
e ap
plic
atio
nba
gs14
,030
0,0
4.20
014
,030
0,0
4.20
0,0
14,0
300,
04.
200,
0
Su
b-t
ota
l oth
er v
aria
ble
co
sts
22.4
0022
.400
26.4
00
Tota
l Var
iab
le C
ost
s42
0.80
050
0.30
075
7.80
0
Gro
ss M
arg
in (
fam
ily la
bo
ur
no
t va
lued
)57
3.10
064
1.60
087
7.72
5
Val
ue
Ad
ded
per
ha
/b57
3.10
064
1.60
087
7.72
5
Val
ue
Ad
ded
per
kg
of
ou
tpu
t42
4,52
432,
0548
1,60
Fam
ily L
abou
r p
ers.
day
/c11
8,0
3.00
035
4.00
012
2,0
3.00
036
6.00
013
7,0
3.00
041
1.00
0
Gro
ss M
arg
in (
fam
ily la
bo
ur
valu
ed)
196.
700
253.
200
440.
325
Var
iab
le P
rod
uct
ion
Co
sts
/ kg
(fam
ily la
bour
not
val
ued)
/d49
9019
0
Var
iab
le P
rod
uct
ion
Co
sts
/ kg
(fam
ily la
bour
val
ued)
/d31
233
741
6
Fixe
d C
ost
s (e
xclu
ding
cos
t of
cap
ital)
% p
.a. /
eIn
vest
. cos
t (T
ZS)
Inve
st. c
ost
(TZS
)In
vest
. cos
t (T
ZS)
Tota
l Fix
ed C
ost
s0
00
Net
inco
me
(fam
ily la
bo
ur
no
t va
lued
)57
3.10
064
1.60
087
7.72
5
Ret
urn
to fa
mily
labo
ur (p
er p
erso
n da
y)4.
857
5.25
96.
407
Ret
urn
to t
otal
labo
ur (p
er p
erso
n da
y)7.
857
8.25
99.
407
Net
inco
me
(fam
ily la
bo
ur
valu
ed)
196.
700
253.
200
440.
325
Tota
l Pro
du
ctio
n C
ost
s /
kg (
fam
ily la
bour
not
val
ued)
311,
70
33
6,90
415,
80
Tota
l Pro
du
ctio
n C
ost
s /
kg (
fam
ily la
bour
val
ued)
/d
573,
93
58
3,37
641,
32
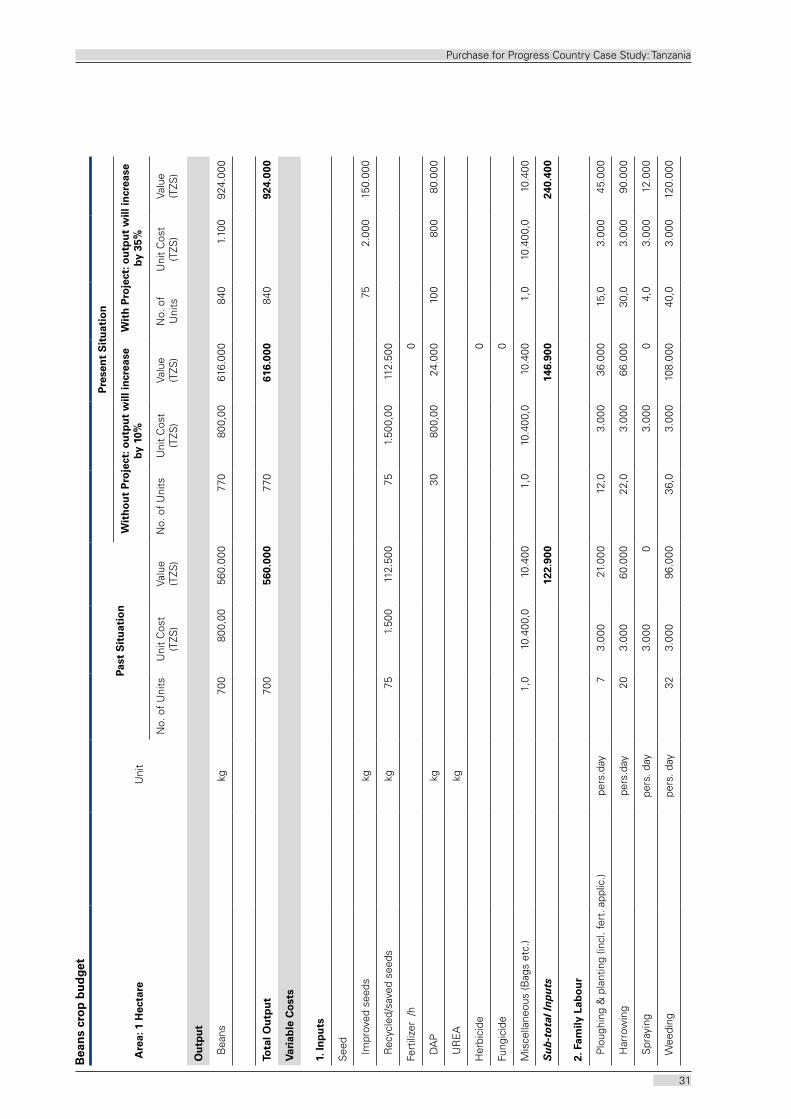
31
Purchase for Progress Country Case Study: Tanzania
Bea
ns
cro
p b
ud
get
Are
a: 1
Hec
tare
Uni
t
Past
Sit
uat
ion
Pre
sen
t S
itu
atio
n
Wit
ho
ut
Pro
ject
: ou
tpu
t w
ill in
crea
se
by 1
0%W
ith
Pro
ject
: ou
tpu
t w
ill in
crea
se
by 3
5%
No.
of
Uni
tsU
nit
Cos
t(T
ZS)
valu
e(T
ZS)
No.
of
Uni
tsU
nit
Cos
t(T
ZS)
valu
e(T
ZS)
No.
of
Uni
tsU
nit
Cos
t(T
ZS)
valu
e(T
ZS)
Ou
tpu
t
bea
nskg
700
800,
0056
0.00
077
080
0,00
616.
000
840
1.10
092
4.00
0
Tota
l Ou
tpu
t
700
56
0.00
077
0
616.
000
840
92
4.00
0
Var
iab
le C
ost
s
1. In
pu
ts
See
d
Impr
oved
see
dskg
75
2.00
015
0.00
0
Rec
ycle
d/sa
ved
seed
skg
751.
500
112.
500
751.
500,
0011
2.50
0
Fert
ilize
r /h
0
DA
Pkg
30
800,
0024
.000
100
800
80.0
00
UR
EA
kg
Her
bici
de
0
Fung
icid
e
0
mis
cella
neou
s (b
ags
etc.
)
1,0
10.4
00,0
10.4
001,
010
.400
,010
.400
1,0
10.4
00,0
10.4
00
Su
b-t
ota
l In
pu
ts
122.
900
146.
900
240.
400
2. F
amily
Lab
ou
r
Plo
ughi
ng &
pla
ntin
g (in
cl. f
ert.
app
lic.)
pers
.day
7 3
.000
21
.000
12,0
3.00
036
.000
15,0
3.0
00
45.0
00
Har
row
ing
pers
.day
20 3
.000
60
.000
22,0
3.00
066
.000
30,0
3.0
00
90.0
00
Spr
ayin
gpe
rs. d
ay 3
.000
0
3.00
00
4,0
3.0
00
12.0
00
Wee
ding
pers
. day
32 3
.000
96
.000
36,0
3.00
010
8.00
040
,0 3
.000
12
0.00
0
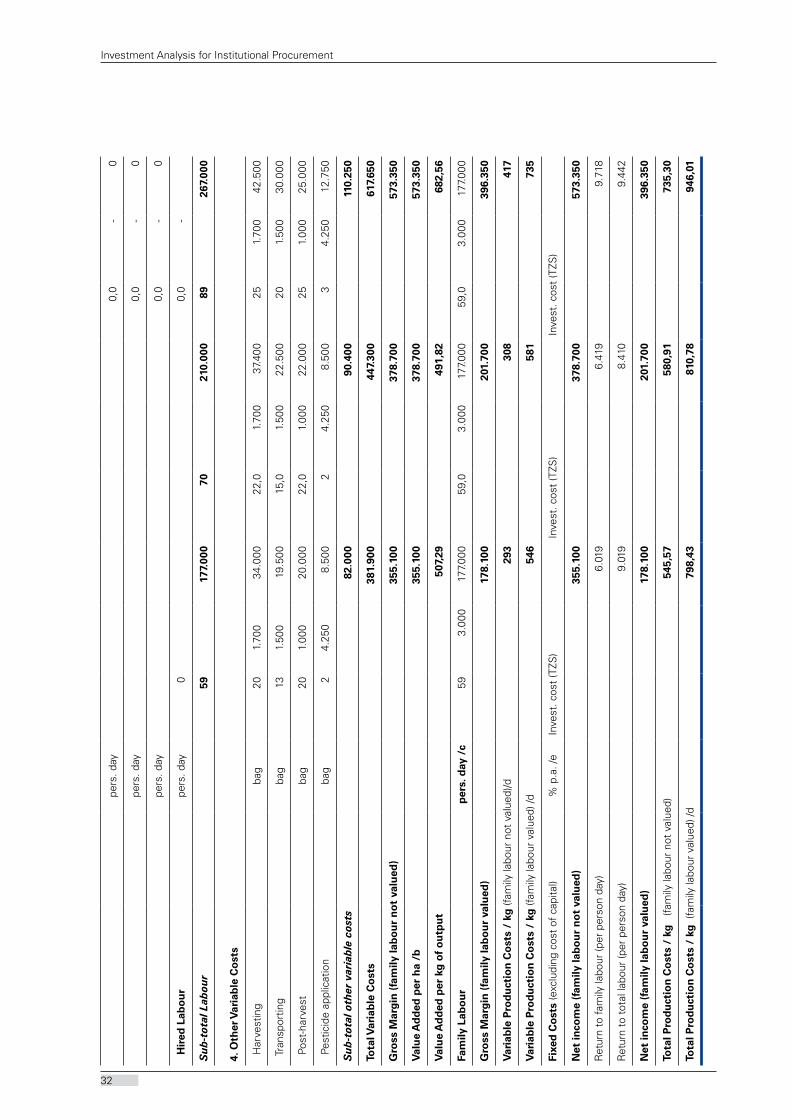
32
Investment Analysis for Institutional Procurement
pe
rs. d
ay0,
0 -
0
pe
rs. d
ay0,
0 -
0
pe
rs. d
ay0,
0 -
0
Hir
ed L
abo
ur
pers
. day
00,
0 -
Su
b-t
ota
l Lab
ou
r59
177.
000
7021
0.00
089
267.
000
4. O
ther
Var
iab
le C
ost
s
Har
vest
ing
bag
20 1
.700
34
.000
22,0
1.70
037
.400
251.
700
42.5
00
Tran
spor
ting
bag
13 1
.500
19
.500
15,0
1.50
022
.500
201.
500
30.0
00
Pos
t-ha
rves
tba
g20
1.0
00
20.0
0022
,01.
000
22.0
0025
1.00
025
.000
Pes
ticid
e ap
plic
atio
nba
g2
4.2
50
8.50
02
4.25
08.
500
34.
250
12.7
50
Su
b-t
ota
l oth
er v
aria
ble
co
sts
82.0
0090
.400
110.
250
Tota
l Var
iab
le C
ost
s38
1.90
044
7.30
061
7.65
0
Gro
ss M
arg
in (
fam
ily la
bo
ur
no
t va
lued
)35
5.10
037
8.70
057
3.35
0
Val
ue
Ad
ded
per
ha
/b35
5.10
037
8.70
057
3.35
0
Val
ue
Ad
ded
per
kg
of
ou
tpu
t50
7,29
491,
8268
2,56
Fam
ily L
abo
ur
per
s. d
ay /
c59
3.00
017
7.00
059
,03.
000
177.
000
59,0
3.00
017
7.00
0
Gro
ss M
arg
in (
fam
ily la
bo
ur
valu
ed)
178.
100
201.
700
396.
350
Var
iab
le P
rod
uct
ion
Co
sts
/ kg
(fam
ily la
bour
not
val
ued)
/d29
330
841
7
Var
iab
le P
rod
uct
ion
Co
sts
/ kg
(fam
ily la
bour
val
ued)
/d54
658
173
5
Fixe
d C
ost
s (e
xclu
ding
cos
t of
cap
ital)
% p
.a. /
eIn
vest
. cos
t (T
ZS)
Inve
st. c
ost
(TZS
)In
vest
. cos
t (T
ZS)
Net
inco
me
(fam
ily la
bo
ur
no
t va
lued
)35
5.10
037
8.70
057
3.35
0
Ret
urn
to fa
mily
labo
ur (p
er p
erso
n da
y)6.
019
6.41
99.
718
Ret
urn
to t
otal
labo
ur (p
er p
erso
n da
y)9.
019
8.41
09.
442
Net
inco
me
(fam
ily la
bo
ur
valu
ed)
178.
100
201.
700
396.
350
Tota
l Pro
du
ctio
n C
ost
s /
kg
(fam
ily la
bour
not
val
ued)
54
5,57
580,
91
73
5,30
Tota
l Pro
du
ctio
n C
ost
s /
kg (
fam
ily la
bour
val
ued)
/d
79
8,43
810,
78
94
6,01

33
Purchase for Progress Country Case Study: Tanzania
Numeric model
Overall SACCO members number 19.000
Members producing maize/beans % 80%
Members producing maize/beans number 15.200
Average area under cultivation ha 1
Overall area under production maize ha 10.640
Overall area under production beans ha 4.560
Average production per ha maize before P4P MT 1,35
Average production per ha beans before P4P MT 0,7
Overall estimated production maize 14.364
Overall estimated production beans 3.192
Average production per ha maize after P4P MT 1,85
Average production per ha beans after P4P MT 0,84
Overall estimated production maize with P4P MT 19.684
Overall estimated production beans with P4P MT 3.830
Post-harvest loss before P4P maize % 20% 2.873
Post-harvest loss before P4P beans 20% 638
Post-harvest loss after P4P maize 10% 1.968
Post-harvest loss after P4P beans % 10% 383
Estimated value of additional production USD 2.953.715

I536
8E/1
/01.
16