r1 presentation 4.0
TRANSCRIPT

8/13/2019 R1 Presentation 4.0
http://slidepdf.com/reader/full/r1-presentation-40 1/106
Community Profile and Resources&Proposal For Community Diagnosis
Group H (PBL 14 & PBL 15)Kok Lanas, Kelantan
[25 September 2013]
Residency 1

8/13/2019 R1 Presentation 4.0
http://slidepdf.com/reader/full/r1-presentation-40 2/106
Introduction to Group H
Supervisor: Prof. Madya. Dr. Norsa’adah Bachok
Ahmad Shafaeez b Abdul Satar 110758 Amira Hafiza bt Nor Rani 110762
Belinda Teo Sing Yee 110767 Choo Gee Lynn 110776
Danusha a/p Arumugam 110778 Lam Chun-Hau 110812
Kok Chee Lim 110810 Mohamad Azdri b Azman 110821
Marlene Ing Yin Zin 110820 Mohd Hisyam b Rosdi 110824
Mohd Hafizuddin b Mohd Salleh 107465 Norshazwani bt Mohd Izhar 110842
Noor Ayuni bt Abu Yamim 110838 Nur Amirah Fazira bt Malzuki 110844
Nor Amira bt Md Isa 110840 Sharalini bt Zainuddin 107524Nor Annasuhah Najwa bt Zakaria 110841 Sharon Lai Hui Yee 110873
Nurul Syazwani bt Hamid Sultan 110857 Tan Zhi Yan 110890
Tan Zeng Guang Gareth 110889 Yogapriya a/p Muniandy 110904
1

8/13/2019 R1 Presentation 4.0
http://slidepdf.com/reader/full/r1-presentation-40 3/106

8/13/2019 R1 Presentation 4.0
http://slidepdf.com/reader/full/r1-presentation-40 4/106

8/13/2019 R1 Presentation 4.0
http://slidepdf.com/reader/full/r1-presentation-40 5/106
[1] Introduction to Operational Area
Operational Area: Kok Lanas, Daerah Ketereh,Jajahan Kota Bharu, Kelantan.
Head of Village: Hasan B. Awang Kechik
PJKKKP: Hj Halim B. Jusoh
Size: 3 km 2
Number of Houses: 1092
Population: 5060 people
4
8/13/2019 R1 Presentation 4.0
http://slidepdf.com/reader/full/r1-presentation-40 6/106
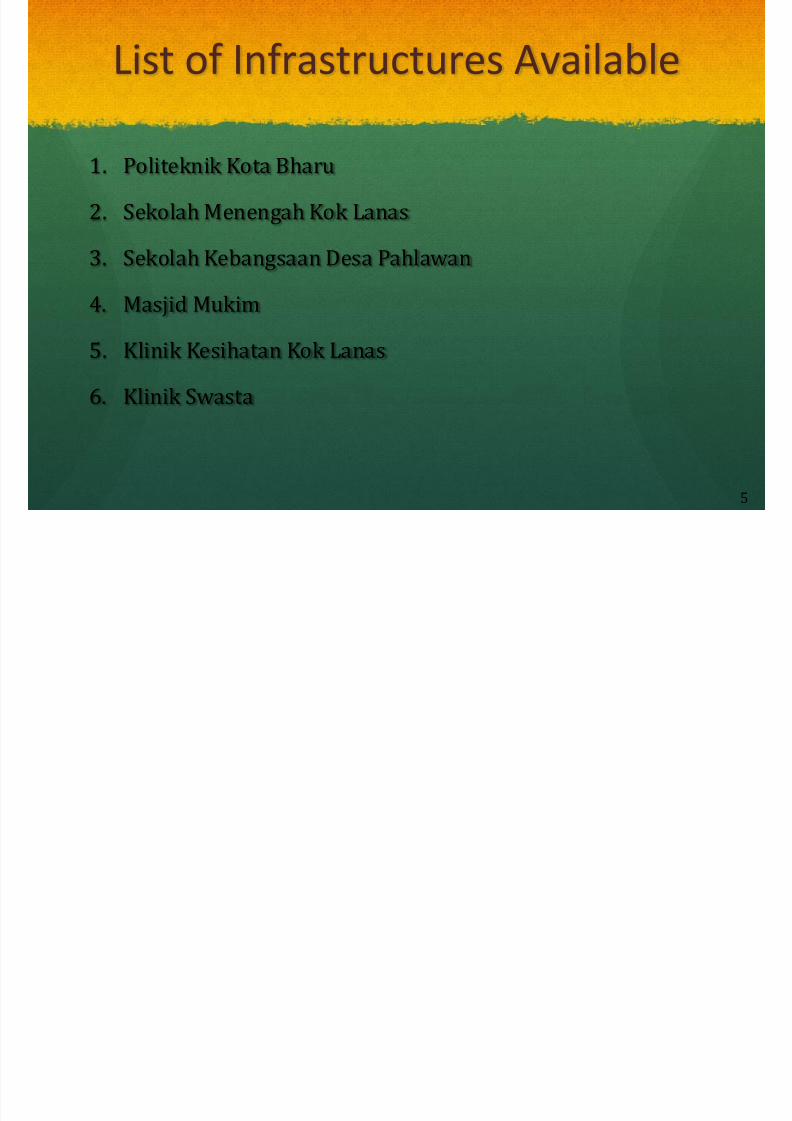
List of Infrastructures Available
1. Politeknik Kota Bharu
2. Sekolah Menengah Kok Lanas
3. Sekolah Kebangsaan Desa Pahlawan
4. Masjid Mukim
5. Klinik Kesihatan Kok Lanas
6. Klinik Swasta
5

8/13/2019 R1 Presentation 4.0
http://slidepdf.com/reader/full/r1-presentation-40 7/106
Kok Lanas (circled)6

8/13/2019 R1 Presentation 4.0
http://slidepdf.com/reader/full/r1-presentation-40 8/106 7

8/13/2019 R1 Presentation 4.0
http://slidepdf.com/reader/full/r1-presentation-40 9/106
Nearest Clinic/Hospital Average Distance from Kok Lanas
(km)
Klinik Kesihatan Kok Lanas 1.0
Private Clinic 1.0
Hospital Universiti Sains Malaysia(HUSM)
22.0
Hospital Machang 22.0
Hospital Raja Perempuan Zainab II(HRPZ)
26.0
Healthcare Facilities in Kok Lanas
8
8/13/2019 R1 Presentation 4.0
http://slidepdf.com/reader/full/r1-presentation-40 10/106
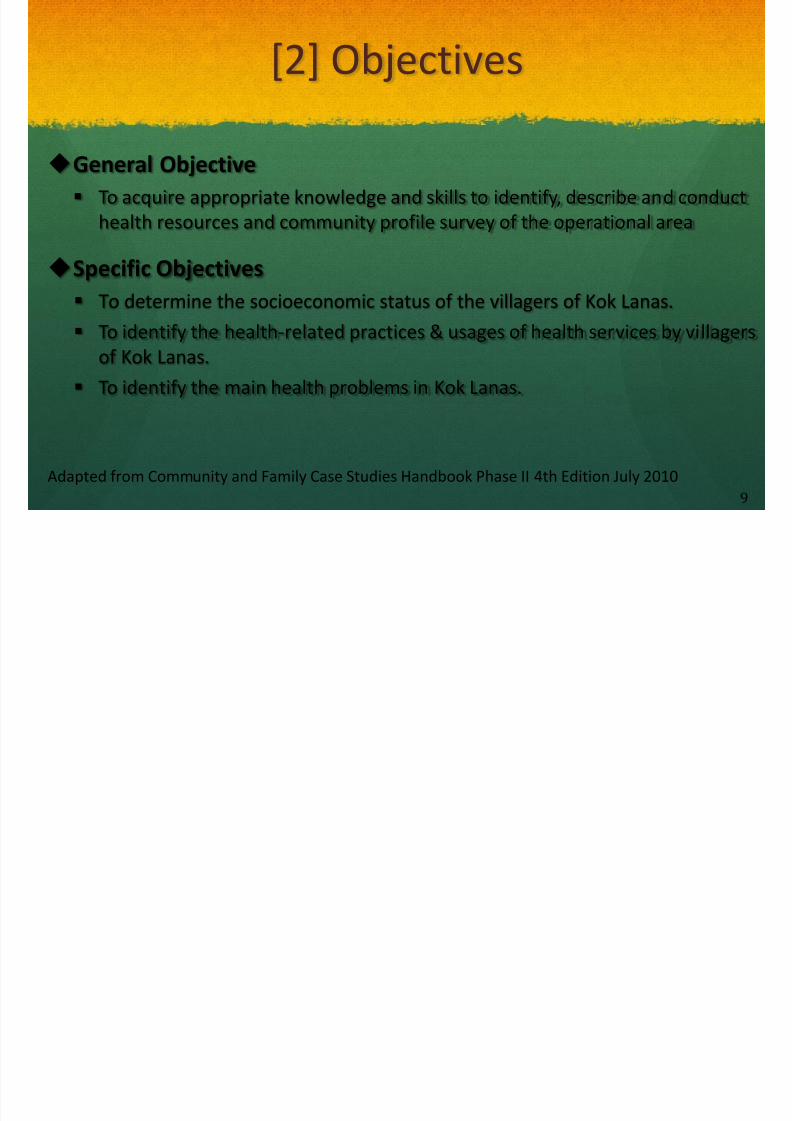
[2] Objectives
General ObjectiveTo acquire appropriate knowledge and skills to identify, describe and conducthealth resources and community profile survey of the operational area
Specific ObjectivesTo determine the socioeconomic status of the villagers of Kok Lanas.
To identify the health-related practices & usages of health services by villagersof Kok Lanas.
To identify the main health problems in Kok Lanas.
Adapted from Community and Family Case Studies Handbook Phase II 4th Edition July 20109

8/13/2019 R1 Presentation 4.0
http://slidepdf.com/reader/full/r1-presentation-40 11/106
[3] Methodology
Study Design: Cross Sectional Study
Study Area: Kok Lanas, Ketereh, Kelantan
Study Period: 15 th -19 th March 2013
Study Population: All villagers of Kok Lanas
Sample Size: Number of houses as determined
by the CFCS secretariat (150)
10

8/13/2019 R1 Presentation 4.0
http://slidepdf.com/reader/full/r1-presentation-40 12/106
[3] Methodology (cont.)
Inclusion Criteria Exclusion Criteria
1. Respondents were residents of
the operational area for morethan 2 years.
1. Residents who refused to be
interviewed.2. Single students who lived inthe area.
3. Residents that were notavailable throughout theresidency period.
11
8/13/2019 R1 Presentation 4.0
http://slidepdf.com/reader/full/r1-presentation-40 13/106
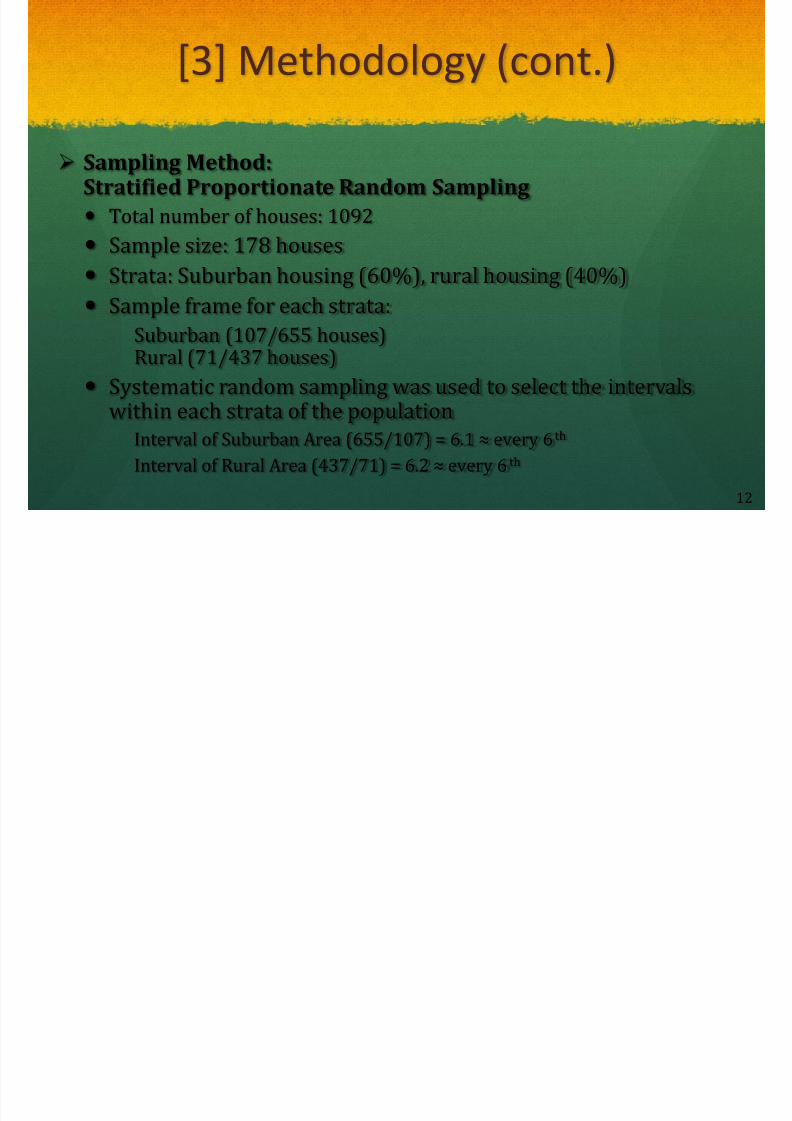
[3] Methodology (cont.)
Sampling Method:Stratified Proportionate Random Sampling
Total number of houses: 1092Sample size: 178 housesStrata: Suburban housing (60%), rural housing (40%)Sample frame for each strata:
Suburban (107/655 houses)Rural (71/437 houses)
Systematic random sampling was used to select the intervalswithin each strata of the populationInterval of Suburban Area (655/107) = 6.1 ≈ every 6 th Interval of Rural Area (437/71) = 6.2 ≈ every 6 th
12

8/13/2019 R1 Presentation 4.0
http://slidepdf.com/reader/full/r1-presentation-40 14/106
[3] Methodology (cont.)
Methods of Data Collection:- Structured Interview based on the questionnaires (Form B and C)
provided by the secretariat of CFCS.- Observation of the subjects’ height, weight, waist and hip
measurements using the appropriate tools.Research Tools:1. Questionnaires
- Form B: Family Profile- Form C: Individual Profile
2. Measuring Tape (to measure the height and waist & hipcircumferences)
3. Weighing Scale (to measure the weight)
13

8/13/2019 R1 Presentation 4.0
http://slidepdf.com/reader/full/r1-presentation-40 15/106
[3] Methodology (cont.)
Data Management & Analysis:
Data Entry:- SPSS Version 21.0
Descriptive Statistics:- Numerical data (mean & standard deviation)- Categorical data (frequency & percentage)
14

8/13/2019 R1 Presentation 4.0
http://slidepdf.com/reader/full/r1-presentation-40 16/106
[4] Results of Survey Form B: Family Profile
B1 Socioeconomic StatusB2 Health-related
Practices
B3 Utilization of Health
ServicesB4 Health & Social
Problems AmongTeenagers & Adults
15

8/13/2019 R1 Presentation 4.0
http://slidepdf.com/reader/full/r1-presentation-40 17/106
Figure 1 Monthly Household Income of Villagersin Kok Lanas [n=178] 16

8/13/2019 R1 Presentation 4.0
http://slidepdf.com/reader/full/r1-presentation-40 18/106

8/13/2019 R1 Presentation 4.0
http://slidepdf.com/reader/full/r1-presentation-40 19/106
Figure 3 Number of Bedrooms in Each Household [n = 178]18

8/13/2019 R1 Presentation 4.0
http://slidepdf.com/reader/full/r1-presentation-40 20/106
Figure 4 Type of Household Appliances in Each Household[n=178]
Each selection is non-mutually exclusive
19

8/13/2019 R1 Presentation 4.0
http://slidepdf.com/reader/full/r1-presentation-40 21/106
Figure 5 Type of Water Supply of Each Household[n = 178]
Each selection is non-mutually exclusive
20

8/13/2019 R1 Presentation 4.0
http://slidepdf.com/reader/full/r1-presentation-40 22/106
[4] Results of Survey Form B: Family Profile
B1 Socioeconomic StatusB2 Health-related
Practices
B3 Utilization of Health
ServicesB4 Health & Social
Problems AmongTeenagers & Adults
21

8/13/2019 R1 Presentation 4.0
http://slidepdf.com/reader/full/r1-presentation-40 23/106
Bo led water,24.2%
Boiled water,84.3%
Raw water,11.8%
Figure 6 Type of Drinking Water of Each Household[n=178]
22
Table 1 Garbage Management of Each Household

8/13/2019 R1 Presentation 4.0
http://slidepdf.com/reader/full/r1-presentation-40 24/106
Dustbin Availability in Kitchen Frequency Percentage (%)
Available 171 96.1
Not available 7 3.9
Frequency of Emptying the Dustbin Frequency Percentage (%)
Once a day 127 74.3
Twice a day 24 14.0
Once in 2 days or more 20 11.7Method of Garbage Disposal Frequency Percentage (%)
Open burning 34 19.1
Buried 1 0.6
Open disposal 3 1.7
River or drain disposal 8 4.5
Majlis daerah 129 72.5
Recycled 3 1.7
Table 1 Garbage Management of Each Household[n = 178]
23

8/13/2019 R1 Presentation 4.0
http://slidepdf.com/reader/full/r1-presentation-40 25/106
Types of Toilet (n=178) Frequency Percentage (%)
Septic / Flush toilet 135 75.8
Pour toilet 42 23.6
Pit toilet 1 0.6
Distance from Septic Tank to Well, in m (n=85) Frequency Percentage (%)
1- 10m 39 45.9
11- 20m 25 29.4
21- 50m 18 21.2
More than 50m 3 3.5
Household Usage of Toilet (n=178) Frequency Percentage (%)
Every member uses toilet 176 98.9Not every member uses toilet 2 1.1
Table 2 Waste Management of Each Household [n=178]
24

8/13/2019 R1 Presentation 4.0
http://slidepdf.com/reader/full/r1-presentation-40 26/106
Figure 7 Sewage Management System of Each Household[n = 178]
77.0%
23.0%
Drainage System
Yes
No
65.2%
34.8%
Sanitary
Yes
No
25

8/13/2019 R1 Presentation 4.0
http://slidepdf.com/reader/full/r1-presentation-40 27/106
Figure 8 Frequency of Buying Food Outside per Weekby Each Household [n=178]
26

8/13/2019 R1 Presentation 4.0
http://slidepdf.com/reader/full/r1-presentation-40 28/106
Refrigerator57.3%
Withoutrefrigerator
41.6%
Throw away1.1%
Figure 9 Method of Keeping Leftover Food by EachHousehold [n=178]
27

8/13/2019 R1 Presentation 4.0
http://slidepdf.com/reader/full/r1-presentation-40 29/106
Figure 10 Types of Animals Reared by Each Household[n = 178]
Each animal reared is non-mutually exclusive
28
Each selection is non mutually exclusive

8/13/2019 R1 Presentation 4.0
http://slidepdf.com/reader/full/r1-presentation-40 30/106
Figure 11 Types of Pests in Each Household[n = 178]
Each selection is non-mutually exclusive
29

8/13/2019 R1 Presentation 4.0
http://slidepdf.com/reader/full/r1-presentation-40 31/106
Figure 12 Pest Control Methods Used in Each Household[n = 178]
Each selection is non-mutually exclusive
30

8/13/2019 R1 Presentation 4.0
http://slidepdf.com/reader/full/r1-presentation-40 32/106
[4] Results of Survey Form B: Family Profile
B1 Socioeconomic StatusB2 Health-related
Practices
B3 Utilization of Health
ServicesB4 Health & Social
Problems AmongTeenagers & Adults
31
bl 3 ili i f d d di i l S i

8/13/2019 R1 Presentation 4.0
http://slidepdf.com/reader/full/r1-presentation-40 33/106
Type of Service Use of the service
(%) Visit 1-5 times (%)
Government Hospital 17.9 15.1
Government Clinic 55.1 46.1
Private Hospital 6.4 5.0
Private Clinic 26.3 23.0
Pharmacy 39.1 32.6
Sundry / Retailer 35.3 15.7
Bomoh / Sinseh 3.2 2.2 Homeopathy Clinic 1.3 1.1
Other (Supermarket) 1.3 1.1
Table 3 Utilization of Modern and Traditional Servicesin the Past 3 Months to Buy Medication [n = 178]
32

8/13/2019 R1 Presentation 4.0
http://slidepdf.com/reader/full/r1-presentation-40 34/106
[4] Results of Survey Form B: Family Profile
B1 Socioeconomic StatusB2 Health-related
Practices
B3 Utilization of Health
ServicesB4 Health & Social
Problems AmongTeenagers & Adults
33
Each social problem is non-mutually exclusive

8/13/2019 R1 Presentation 4.0
http://slidepdf.com/reader/full/r1-presentation-40 35/106
Figure 13 Reports of Social Problems among LocalTeenagers (12-17 years old) in the Past 12 Months [n=178]
34
Domestic violence and physical abuse are non-mutually exclusive

8/13/2019 R1 Presentation 4.0
http://slidepdf.com/reader/full/r1-presentation-40 36/106
Figure 14 Reports of Domestic Violence & Physical AbuseIn the Past 12 Months [n=178]
35

8/13/2019 R1 Presentation 4.0
http://slidepdf.com/reader/full/r1-presentation-40 37/106
[4] Results of Survey Form C: Individual Profile
C1 Socio-demographicsC2 Anthropometric Status
C3 Occupational Profile
C4 Medical Health
ProblemsC5 Dental & Oral Health
C6 Smoking & Exercise
C7 Women’s Health &
Breastfeeding
36

8/13/2019 R1 Presentation 4.0
http://slidepdf.com/reader/full/r1-presentation-40 38/106
• The total number of respondents involved in this survey is641 people.
• Among all 641 respondents:
- 96.7% were Malay, 2% were Chinese, 0.3% were Thai and0.9% were from other ethnics.
- 96.7% were Muslims, 2.2% were Buddhists, 0.5% wereChristians and 0.6% were from other religions.
- Male population: 47.1% (302 people)
- Female population : 52.9% (339 people).
Socio-demographics
37
Infant (<1)Geriatric ( ≥ 65)5%
Infant (<1 year old)

8/13/2019 R1 Presentation 4.0
http://slidepdf.com/reader/full/r1-presentation-40 39/106
2%
Toddler (1 ≤ x<5)9%
Child (5 ≤ x<12)12%
Adolescent(12 ≤ x<18)
13%
Adult (18 ≤ x<65)59%
5% = 2% (n=13)
Toddler (1 ≤ x < 5) = 9% (n=59)
Child (5 ≤ x < 12 years old)= 12% (n=77)
Adolescent (12 ≤ x < 18) = 13% (n=80)
Adult (18 ≤ x < 65 years old)= 59% (n=380)
Geriatric (≥ 65 years old andabove) (defined by NCBI)= 5.0% (n=32)
Figure 15 Distribution of Respondents By Age Group[n=641]
38

8/13/2019 R1 Presentation 4.0
http://slidepdf.com/reader/full/r1-presentation-40 40/106
Table 4 Distribution of Highest Education Level Among Adults(≥ 18 years old ) [n =412]
Education Level Frequency Percentage (%)
Not schooling 29 7.0
Primary 62 15.0 Secondary 260 63.1
Tertiary 61 14.8
Total 412 100.0
39

8/13/2019 R1 Presentation 4.0
http://slidepdf.com/reader/full/r1-presentation-40 41/106
Marital Status (Adult) Frequency Percentage (%)
Single 75 18.2
Married 315 76.5
Widow/Widower 22 5.3
Total 412 100.0
Table 5 Marital Status of Respondents ( ≥ 18 years old )[n = 412]
40

8/13/2019 R1 Presentation 4.0
http://slidepdf.com/reader/full/r1-presentation-40 42/106
[4] Results of Survey Form C: Individual Profile
C1 Socio-demographicsC2 Anthropometric Status
C3 Occupational Profile
C4 Medical Health
ProblemsC5 Dental & Oral Health
C6 Smoking & Exercise
C7 Women’s Health &
Breastfeeding
41
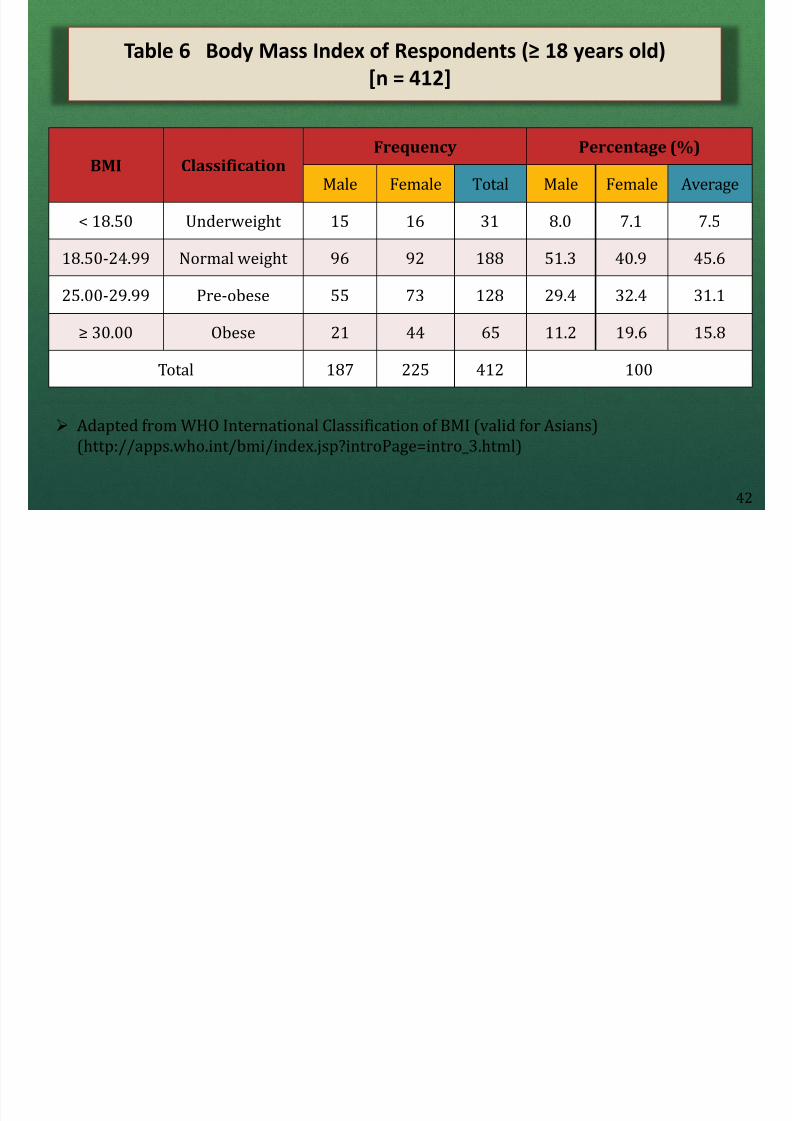
Table 6 Body Mass Index of Respondents (≥ 18 years old)
8/13/2019 R1 Presentation 4.0
http://slidepdf.com/reader/full/r1-presentation-40 43/106
BMI ClassificationFrequency Percentage (%)
Male Female Total Male Female Average
< 18.50 Underweight 15 16 31 8.0 7.1 7.5
18.50-24.99 Normal weight 96 92 188 51.3 40.9 45.6
25.00-29.99 Pre-obese 55 73 128 29.4 32.4 31.1
≥ 30.00 Obese 21 44 65 11.2 19.6 15.8
Total 187 225 412 100
Table 6 Body Mass Index of Respondents (≥ 18 years old)[n = 412]
Adapted from WHO International Classification of BMI (valid for Asians)(http://apps.who.int/bmi/index.jsp?introPage=intro_3.html)
42

8/13/2019 R1 Presentation 4.0
http://slidepdf.com/reader/full/r1-presentation-40 44/106
8/13/2019 R1 Presentation 4.0
http://slidepdf.com/reader/full/r1-presentation-40 45/106
[4] Results of Survey Form C: Individual Profile
C1 Socio-demographicsC2 Anthropometric Status
C3 Occupational Profile
C4 Medical Health
ProblemsC5 Dental & Oral Health
C6 Smoking & Exercise
C7 Women’s Health &
Breastfeeding
44

8/13/2019 R1 Presentation 4.0
http://slidepdf.com/reader/full/r1-presentation-40 46/106
8/13/2019 R1 Presentation 4.0
http://slidepdf.com/reader/full/r1-presentation-40 47/106
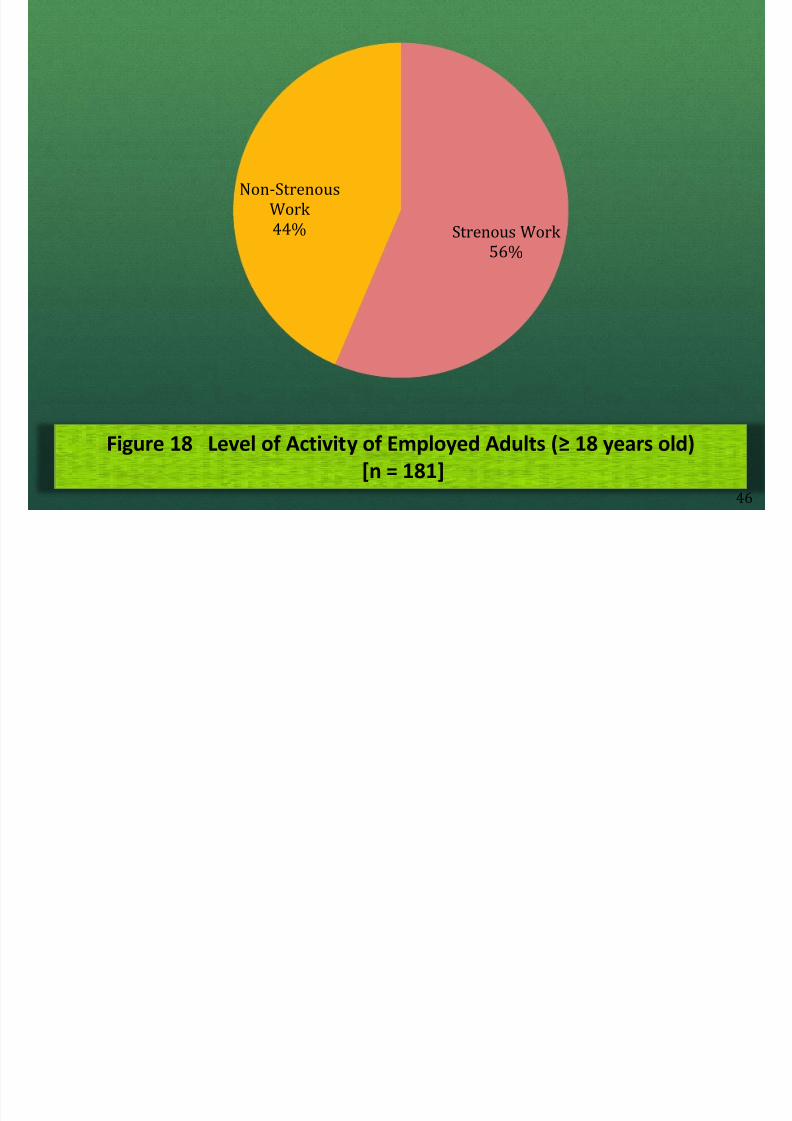
Figure 18 Level of Activity of Employed Adults ( ≥ 18 years old)[n = 181]
Strenous Work56%
Non-StrenousWork44%
46
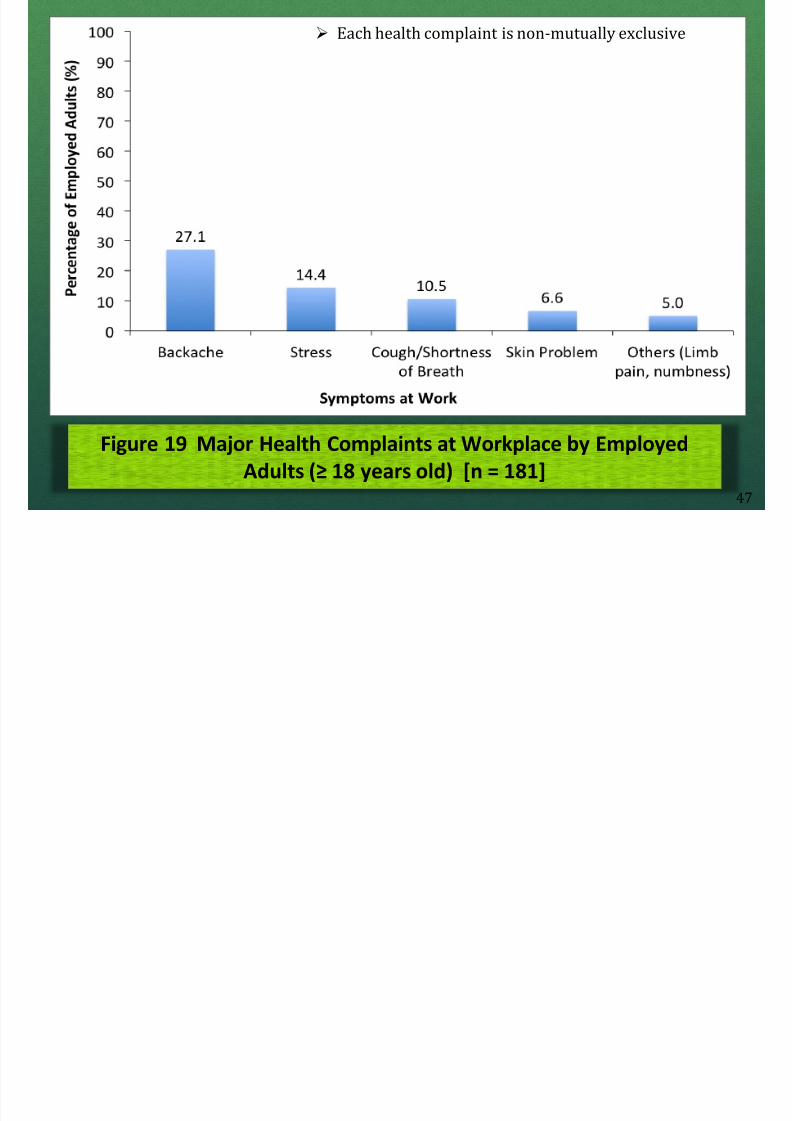
Each health complaint is non-mutually exclusive
8/13/2019 R1 Presentation 4.0
http://slidepdf.com/reader/full/r1-presentation-40 48/106
Figure 19 Major Health Complaints at Workplace by EmployedAdults (≥ 18 years old) [n = 181]
47

8/13/2019 R1 Presentation 4.0
http://slidepdf.com/reader/full/r1-presentation-40 49/106
[4] Results of Survey Form C: Individual Profile
C1 Socio-demographicsC2 Anthropometric Status
C3 Occupational Profile
C4 Medical Health
ProblemsC5 Dental & Oral Health
C6 Smoking & Exercise
C7 Women’s Health &
Breastfeeding
48
Table
7
Chronic Diseases Among Respondents and Family
History of Such Conditions
[n=641]

8/13/2019 R1 Presentation 4.0
http://slidepdf.com/reader/full/r1-presentation-40 50/106
Chronic Diseasesof Respondents
Percentage (%) Family History ofChronic Diseases
Percentage (%)
Diabetes 7.0 Diabetes 18.6Hypertension 10.3 Hypertension 21.2
Asthma 8.1 Asthma 13.4
Heart Disease 1.7 Heart Disease 6.4
Stroke 1.1 Stroke 2.7Tuberculosis (TB) 0.5 Tuberculosis (TB) 1.6
PhysicallyHandicapped
0.9 PhysicallyHandicapped
2.0
Other Conditions:
- Allergy- Gout- Cancer
5.8 Other Conditions:
- Allergy- Gout- Cancer
5.8
Each condition is non-mutually exclusive49
Table
8
Medical Problems of Respondents in the

8/13/2019 R1 Presentation 4.0
http://slidepdf.com/reader/full/r1-presentation-40 51/106
Table 8 Medical Problems of Respondents in thePast 2 Months [n = 641]
Medical Problems faced in Last 2 Months Percentage (%)
Diarrhea 4.7
Cough (more than 2 weeks) 8.0
Fever 23.7
Flu 25.3Other Problems- Vomiting- Sore Throat- Chest Pain
3.3
Each medical problem is non-mutually exclusive
50
T bl
9
M di l P bl A Child

8/13/2019 R1 Presentation 4.0
http://slidepdf.com/reader/full/r1-presentation-40 52/106
Table 9 Medical Problems Among Children(< 6 Years) [n = 85]
Medical Problems Faced by Child Percentage (%)
Cough at night 13.6
Wheezing/noisy breathing 3.9
Ear Discharge 1.0
Flu 22.3
Sputum early in the morning 6.8
Throat problem/hoarseness 1.0
Each medical problem is non-mutually exclusive
51
F C I di id l P fil

8/13/2019 R1 Presentation 4.0
http://slidepdf.com/reader/full/r1-presentation-40 53/106
[4] Results of Survey Form C: Individual Profile
C1 Socio-demographicsC2 Anthropometric Status
C3 Occupational Profile
C4 Medical Health
ProblemsC5 Dental & Oral Health
C6 Smoking & Exercise
C7 Women’s Health &Breastfeeding
52
90
100 Each oral problem is non-mutually exclusive

8/13/2019 R1 Presentation 4.0
http://slidepdf.com/reader/full/r1-presentation-40 54/106
18.1 17.212.8
3.9
0
10
20
30
40
50
60
70
80
90
Oral problems (in thelast 6 months)
Need dentures Not comfortable whenchewing
Chew betel nuts
PercentageofRespondents(%)
Oral Problems
Figure 20 Oral Problems Among Respondents [n = 624]53
Table 10 Brushing of Teeth & Dental Visits

8/13/2019 R1 Presentation 4.0
http://slidepdf.com/reader/full/r1-presentation-40 55/106
Variables Frequency Percentages (%)
Frequency of Brushing Teeth per Day (n =624)• Once• Twice• When necessary
8645781
13.873.213.0
• Gargle or Brush After Eating (n=641) 337 52.6
• Gargle or Brush Before Sleep (n=641) 428 66.8
Frequency of Dental Visits (n=624)• Never• Once in 6 months• Once in a year• When necessary or pain only
1097125
419
17.511.44.0
67.1
Each variable is non-mutually exclusive
54
[ ] l f Form C: Individual Profile

8/13/2019 R1 Presentation 4.0
http://slidepdf.com/reader/full/r1-presentation-40 56/106
[4] Results of Survey Form C: Individual Profile
C1 Socio-demographicsC2 Anthropometric Status
C3 Occupational Profile
C4 Medical Health
ProblemsC5 Dental & Oral Health
C6 Smoking & Exercise
C7 Women’s Health &Breastfeeding
55

8/13/2019 R1 Presentation 4.0
http://slidepdf.com/reader/full/r1-presentation-40 57/106
Figure 21 Smoking Status of Respondents (≥ 12 years old) [n = 492]
56

8/13/2019 R1 Presentation 4.0
http://slidepdf.com/reader/full/r1-presentation-40 58/106
Figure 22 Number of Cigarettes Smoked per Day Among Respondents(≥12 years old) *n=108+
57

8/13/2019 R1 Presentation 4.0
http://slidepdf.com/reader/full/r1-presentation-40 59/106
Figure 23 Money Spent on Cigarettes per Day (RM) byRespondents ( ≥12 years old) [n = 108]
58

8/13/2019 R1 Presentation 4.0
http://slidepdf.com/reader/full/r1-presentation-40 60/106
Figure 24 Factors that Influenced Respondents to start smoking(≥12 years old) [n=108]
59
Friends/peers68.5%
Parents, 0.9%
Siblings, 1.9%
Other familymembers, 5.6%
Other factors23.1%
Each physical activity is non-mutually exclusive

8/13/2019 R1 Presentation 4.0
http://slidepdf.com/reader/full/r1-presentation-40 61/106
Figure 25 Physical Activities in the Past Week Among Adults(≥18 years old) *n = 412+
60
[4] Results of Survey Form C: Individual Profile

8/13/2019 R1 Presentation 4.0
http://slidepdf.com/reader/full/r1-presentation-40 62/106
[4] Results of Survey Form C: Individual Profile
C1 Socio-demographicsC2 Anthropometric Status
C3 Occupational Profile
C4 Medical Health
ProblemsC5 Dental & Oral Health
C6 Smoking & Exercise
C7 Women’s Health &Breastfeeding
61
Table 11 Health Practice for Adult Women

8/13/2019 R1 Presentation 4.0
http://slidepdf.com/reader/full/r1-presentation-40 63/106
Women’s Health Practice Frequency Percentage (%)
Pap smear 131 58.2
Breast self examination 131 58.2
Family planning 66 29.3
Dental checkup during pregnancy 120 53.3
Table 11 Health Practice for Adult Women(≥ 18 years old) (n=225)
Each method is non-mutually exclusive
62

8/13/2019 R1 Presentation 4.0
http://slidepdf.com/reader/full/r1-presentation-40 64/106
Figure 26 Breastfeeding by Childbearing Women[n=153]
63

8/13/2019 R1 Presentation 4.0
http://slidepdf.com/reader/full/r1-presentation-40 65/106
Figure 27 Number of Gravida of Married Women[n = 167]
64

8/13/2019 R1 Presentation 4.0
http://slidepdf.com/reader/full/r1-presentation-40 66/106
Figure 28 Number of Parity of Married Women[n = 167]
65

8/13/2019 R1 Presentation 4.0
http://slidepdf.com/reader/full/r1-presentation-40 67/106
Figure 29 Number of Abortions of Married Women[n = 168]
66

8/13/2019 R1 Presentation 4.0
http://slidepdf.com/reader/full/r1-presentation-40 68/106

8/13/2019 R1 Presentation 4.0
http://slidepdf.com/reader/full/r1-presentation-40 69/106
[5] Discussion5.1 Household Background
5.2 Medical HealthProblems
5.3 Women’s Health
5.4 Smoking
5.5 Accidents & PhysicalInjury
68
8/13/2019 R1 Presentation 4.0
http://slidepdf.com/reader/full/r1-presentation-40 70/106
5.1 Household BackgroundOf Households in Kok Lanas
69
Household background(Income)

8/13/2019 R1 Presentation 4.0
http://slidepdf.com/reader/full/r1-presentation-40 71/106
(Income)
Absolute poverty in the country is measured based on the Poverty Line Income(PLI). The PLI takes into account the minimum requirements for food,clothing, shelter, and other regular expenditures that are necessary tomaintain a decent standard of living in a household.
The monthly household income, as defined by the Ministry of Women, Family& Community Development in 2010 for Peninsular Malaysia:- extreme poor (≤ RM440 per month)
- poor (≤ RM750 per month)
- low- income (≤ RM 2,000 per month)
(http://www.pemandu.gov.my/gtp/upload/999afc34-141a-4c5c-801f-45701389df74.pdf )
70
According to Malaysia's Chief Statistician, Dr Abdul Rahman Hasan:The average household income in Kelantan in 2012 is RM3 168

8/13/2019 R1 Presentation 4.0
http://slidepdf.com/reader/full/r1-presentation-40 72/106
The average household income in Kelantan in 2012, is RM3,168.http://www.nst.com.my/opinion/columnist/average-household-income-in-kelantan-still-low-1.351654
Our study in Kok Lanas suggests that the average monthly householdincome here is lower (RM 1807.03).
Based on our findings, about 66% of households in Kok Lanas earn less
than RM 2,000 per month.The majority of villagers are either unemployed or self-employed,which could be the reason of low income. Approximately 71.9% ofwomen and 24.7% of men are unemploy ed, while 10.4% of women and38.0% of men are self-employed.
71

8/13/2019 R1 Presentation 4.0
http://slidepdf.com/reader/full/r1-presentation-40 73/106
Issues Analysis of Group H Study Comparison References
Body Mass Index(age ≥ 18 years old)
• 7.5% underweight Lower • 8.5% underweight(NHMS III 2006)

8/13/2019 R1 Presentation 4.0
http://slidepdf.com/reader/full/r1-presentation-40 74/106
(age ≥ 18 years old)
• 31.1% pre-obese
• 15.8% obese
Higher
Higher
(NHMS III, 2006)
• 29.1% overweight
(NHMS III, 2006)
• 14.0% obese(NHMS III, 2006)
Waist to Hip Ratio(age ≥ 18 years old)
• 48.4% adult females > 0.85
• 4.8% adult male >1.00
Higher
Lower
• 26.0% adult females>0.85
(NHMS III,2006)
• 7.3% adult males >1.00(NHMS III, 2006)
Diabetes Mellitus • 7.0% respondents Lower • 11.6% Malaysian AdultPopulation
(NHMS III, 2006)
Hypertension • 10.3% respondents Lower • 32.2% Malaysian AdultPopulation
(NHMS III, 2006)
73

8/13/2019 R1 Presentation 4.0
http://slidepdf.com/reader/full/r1-presentation-40 75/106
Issues Analysis of Group H Study Comparison References
B f di 80 0% i hild l h L Fi 12 h 94 7%

8/13/2019 R1 Presentation 4.0
http://slidepdf.com/reader/full/r1-presentation-40 76/106
Breastfeeding • 80.0% in children less than12 months old
Lower • First 12 months 94.7%(NHMS III, 2006)
Pap SmearExamination
• 58.2% female respondents Higher • 43.7% Malaysian female(NHMS, 2006)
Breast SelfExamination (BSE)
• 58.2% female respondents Higher • 57.1% Malaysian female(NHMS III, 2006)
Family PlanningPractice
• 29.3% female respondents Lower • 52.3% Malaysian female(Lembaga Pembanguna
Keluarga Negara LPPKN)
75

8/13/2019 R1 Presentation 4.0
http://slidepdf.com/reader/full/r1-presentation-40 77/106
5.5 Accidents & Physical InjuryAmong Residents in Kok Lanas
76

8/13/2019 R1 Presentation 4.0
http://slidepdf.com/reader/full/r1-presentation-40 78/106
Conclusion

8/13/2019 R1 Presentation 4.0
http://slidepdf.com/reader/full/r1-presentation-40 79/106
The top 5 medical problems in Kok Lanas that we identified were:
1. Back Pain (27.1%)
2. Obesity (15.8%)
3. Hypertension (10.3%)
4. Asthma (8.1%)
5. Diabetes Mellitus (7.0%)
From these, we decided to select back pain as our communitydiagnosis because its prevalence was more than double that of thenational prevalence among adults.
78

8/13/2019 R1 Presentation 4.0
http://slidepdf.com/reader/full/r1-presentation-40 80/106
Introduction

8/13/2019 R1 Presentation 4.0
http://slidepdf.com/reader/full/r1-presentation-40 81/106
Back: Posterior part of the trunk from the neck to the pelvisPain: A more or less localized sensation of discomfort, distress oragony resulting from the stimulation of specialized nerve endings
(Dorland’s Illustrated Medical Dictionary 31 st Edition)
The major risk factors for back pain are:1) aging (usually >30 years old)
2) overweight
3) lack of exercise
4) occupational hazards , such as repeating bending and lifting andlong hours of standing or sitting(News-Medical Net; Dr Ananya Mandal, 2013)
80
Summary of Community Profile
8/13/2019 R1 Presentation 4.0
http://slidepdf.com/reader/full/r1-presentation-40 82/106
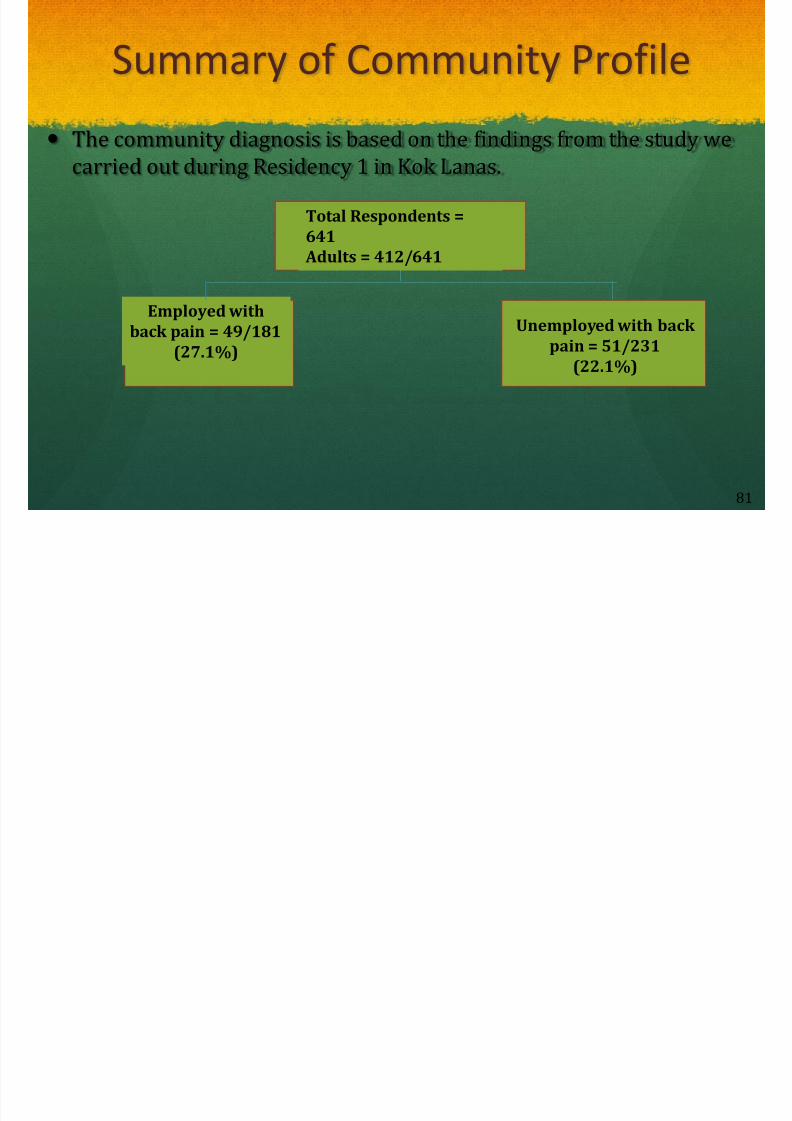
The community diagnosis is based on the findings from the study wecarried out during Residency 1 in Kok Lanas.
Total Respondents =641 Adults = 412/641
Employed withback pain = 49/181
(27.1%)
Unemployed with backpain = 51/231
(22.1%)
81
Rationale

8/13/2019 R1 Presentation 4.0
http://slidepdf.com/reader/full/r1-presentation-40 83/106
1. There is a high prevalence of back pain problems among theemployed residents of Kok Lanas, which is 27.1% . This is higher thanthe national prevalence rate of back pains, which is only 11.6%.
(Veerapen et. al , A COPCORD Study on Musculoskeletal Pains in Malaysia; 2007)
2. Most of our adult residents hold occupations like office workers andmanual workers which put them at risk of suffering from severe backpains that can be highly detrimental to health.
3. A high number of Kok Lanas adult residents also do not practice any
form of exercise (43.6%) which can lead to back pains.(based on our survey results)
82
Rationale (cont.)
8/13/2019 R1 Presentation 4.0
http://slidepdf.com/reader/full/r1-presentation-40 84/106
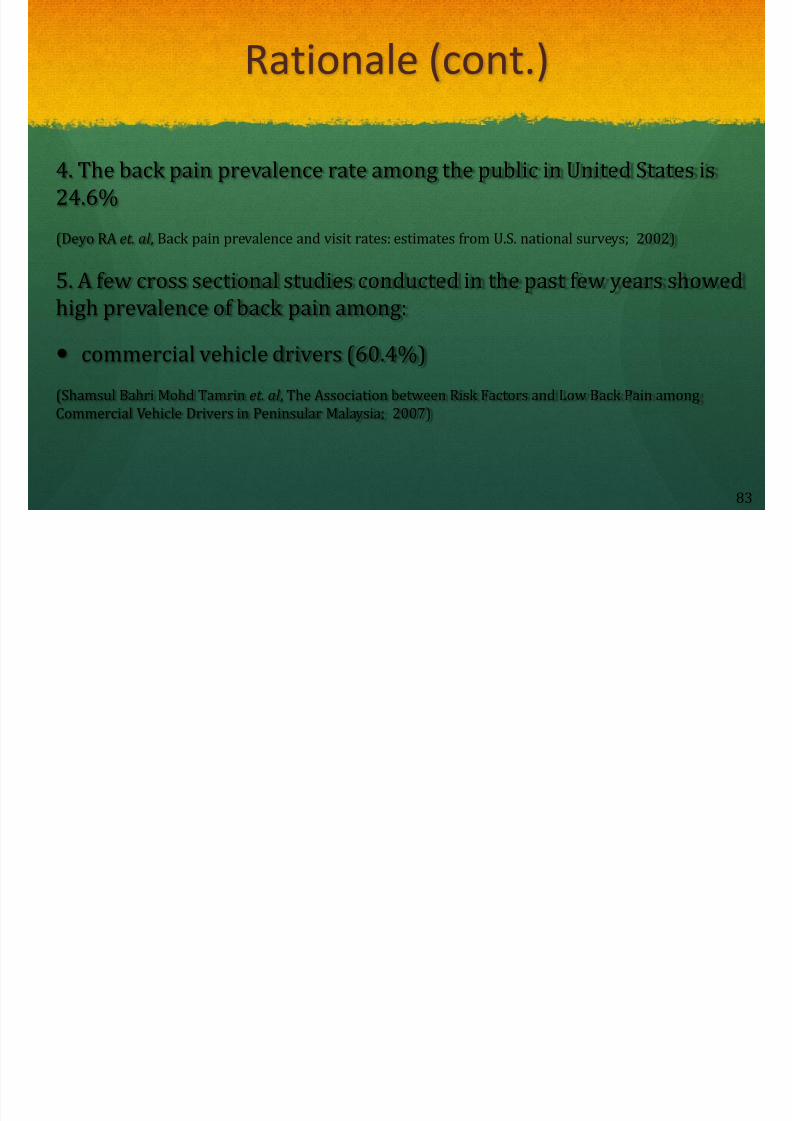
4. The back pain prevalence rate among the public in United States is24.6%
(Deyo RA et. al , Back pain prevalence and visit rates: estimates from U.S. national surveys; 2002)
5. A few cross sectional studies conducted in the past few years showedhigh prevalence of back pain among:
commercial vehicle drivers (60.4%)
(Shamsul Bahri Mohd Tamrin et. al , The Association between Risk Factors and Low Back Pain among
Commercial Vehicle Drivers in Peninsular Malaysia; 2007)
83
Rationale (cont.)

8/13/2019 R1 Presentation 4.0
http://slidepdf.com/reader/full/r1-presentation-40 85/106
health care providers in Sibu Hospital, Malaysia (72.5%)
(Wong et. al , Prevalence and Risk Factors Associated with Low Back Pain Among Health CareProviders in a District Hospital; 2010)
batik workers in Kelantan (75.4%)
(Razlan Musa, Work-Related Musculoskeletal Symptoms Among Batik Workers in Kelantan;1998)
dental personnel (44.9%)
(Razan Abdul Samat et. al , Prevalence and Associated Factors if Back Pain among DentalPersonnel In North-Eastern State of Malaysia; 2011)
84
Objectives

8/13/2019 R1 Presentation 4.0
http://slidepdf.com/reader/full/r1-presentation-40 86/106
General objectives :
To study the prevalence, level of knowledge, attitude andpractice (KAP) score of back pain and its associated factorsamong residents of Kok Lanas.
85
Objectives (cont.)

8/13/2019 R1 Presentation 4.0
http://slidepdf.com/reader/full/r1-presentation-40 87/106
Specific objectives:
1. To determine the prevalence of back pain among residents of KokLanas.
2. To determine the level of knowledge on back pain among the
residents in Kok Lanas.
3. To determine the attitudes of residents in Kok Lanas towards backpain.
4. To determine whether the residents of Kok Lanas are practicingergonomic daily routines.
5. To determine the associated factors of back pain.86
Methodology

8/13/2019 R1 Presentation 4.0
http://slidepdf.com/reader/full/r1-presentation-40 88/106
Study Design: Cross Sectional Study
Study Area: Kok Lanas, Ketereh, Kelantan
Study Period: 1 st -5 th October 2013
Study Population: All adult residents of Kok Lanas
Inclusion Criteria:All the adult residents aged 18 and above.
Permanent residents who agree to participate.
Exclusion CriteriaThose who cannot be contacted throughout the residency
Mentally-ill respondent87

8/13/2019 R1 Presentation 4.0
http://slidepdf.com/reader/full/r1-presentation-40 89/106
Sample size calculation for prevalence ofadults with back pain
Andrew M.B, Joanne E.J, Rachelle B, et al, Individuals with chronic lowback pain have greater difficulty in engaging in positive lifestyle
behaviors than those without back pain: An assessment of healthliteracy (2011), page 6 of 10, table 3
88
Sample Size CalculationSample size is calculated using the single proportion formula:
z é ù2

8/13/2019 R1 Presentation 4.0
http://slidepdf.com/reader/full/r1-presentation-40 90/106
The objective is to determine the sample size to obtain a confidence interval of95%. Therefore Z α = 1.96 (95% CI)The precision is estimated to be 10%. Therefore, Δ = 0.1
Thus, n = 125 adult respondents are required
n =
ëê ûú * P (1 P )
Domain for risk factorof back pain
Prevalence(%)
Sample size (n) (n) + expected drop-out rate (30%)
Prevalence of back pain 24.6 71 93
Good knowledge 48.6 96 125
Good attitude 45.2 95 124
Good practice 43.2 94 123
89

8/13/2019 R1 Presentation 4.0
http://slidepdf.com/reader/full/r1-presentation-40 91/106
Sample size calculation for proportion ofadults with obesity and back pain
Mohamud WN, Musa KI, Khir AS , et al, Prevalence of overweightand obesity among adult Malaysians: an update. (2011), Internet
Communication at 12.39am fromhttp://www.ncbi.nlm.nih.gov/pubmed/21393108
90
Sample Size CalculationSample size is calculated using the two proportion { Pocock’s ) formula:
n = P
1 (1 P 1 ) + P
0 (1 P 0 )
( P P )2 z + z ë
ùû
2

8/13/2019 R1 Presentation 4.0
http://slidepdf.com/reader/full/r1-presentation-40 92/106
Type I error is taken to be 0.05. Therefore Z α = 1.96 (95% CI)Type II error is taken to be 0.80. Therefore Z β = 0.84Proportion of obesity among general adult population, P 0 = 19.5% = 0.195, takenfrom previous study.Proportion of obesity among adults with back pain, P 1 = 40% 0.40, based on
researcher’s opinion.
Thus, n = 192 adult respondents are required to estimate the proportion of adults withobesity who also suffer back pain.
( P 1
P 0 )
CalculationMethod
Sample size, n,per group
Non-response (30%) Total Sample (x2)
Using theformula
= n= 74
= n x 0.30= 30Total (after consider non response)= 74+22=96
n x 2 = 96 x 2= 192
91
Sampling Methods:By using random sampling methods and by using SPSS Statisticsversion 21 0

8/13/2019 R1 Presentation 4.0
http://slidepdf.com/reader/full/r1-presentation-40 93/106
version 21.0.
Sampling unit = house(since around 200 adults are needed for our sample size, we assumethere are 2 adults in each household, hence we will require 100houses)
Sampling interval:
Total houses = 1092Needed houses = 100Interval is calculated by 1092/100 ≈ every 10 th house
92
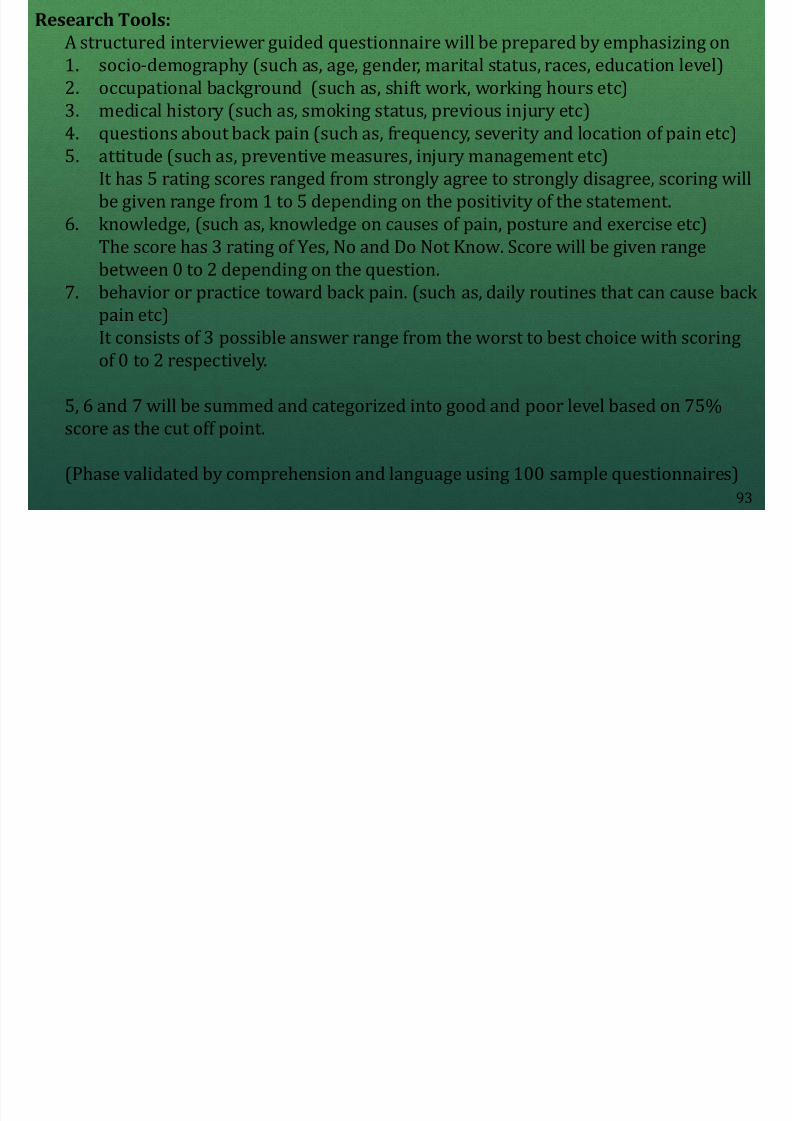
Research Tools:A structured interviewer guided questionnaire will be prepared by emphasizing on1. socio-demography (such as, age, gender, marital status, races, education level)2. occupational background (such as, shift work, working hours etc)3. medical history (such as, smoking status, previous injury etc)
8/13/2019 R1 Presentation 4.0
http://slidepdf.com/reader/full/r1-presentation-40 94/106
93
y ( , g , p j y )4. questions about back pain (such as, frequency, severity and location of pain etc)
5. attitude (such as, preventive measures, injury management etc)It has 5 rating scores ranged from strongly agree to strongly disagree, scoring willbe given range from 1 to 5 depending on the positivity of the statement.
6. knowledge, (such as, knowledge on causes of pain, posture and exercise etc)The score has 3 rating of Yes, No and Do Not Know. Score will be given rangebetween 0 to 2 depending on the question.
7. behavior or practice toward back pain. (such as, daily routines that can cause backpain etc)It consists of 3 possible answer range from the worst to best choice with scoringof 0 to 2 respectively.
5, 6 and 7 will be summed and categorized into good and poor level based on 75%score as the cut off point.
(Phase validated by comprehension and language using 100 sample questionnaires)
Data Analysis
8/13/2019 R1 Presentation 4.0
http://slidepdf.com/reader/full/r1-presentation-40 95/106
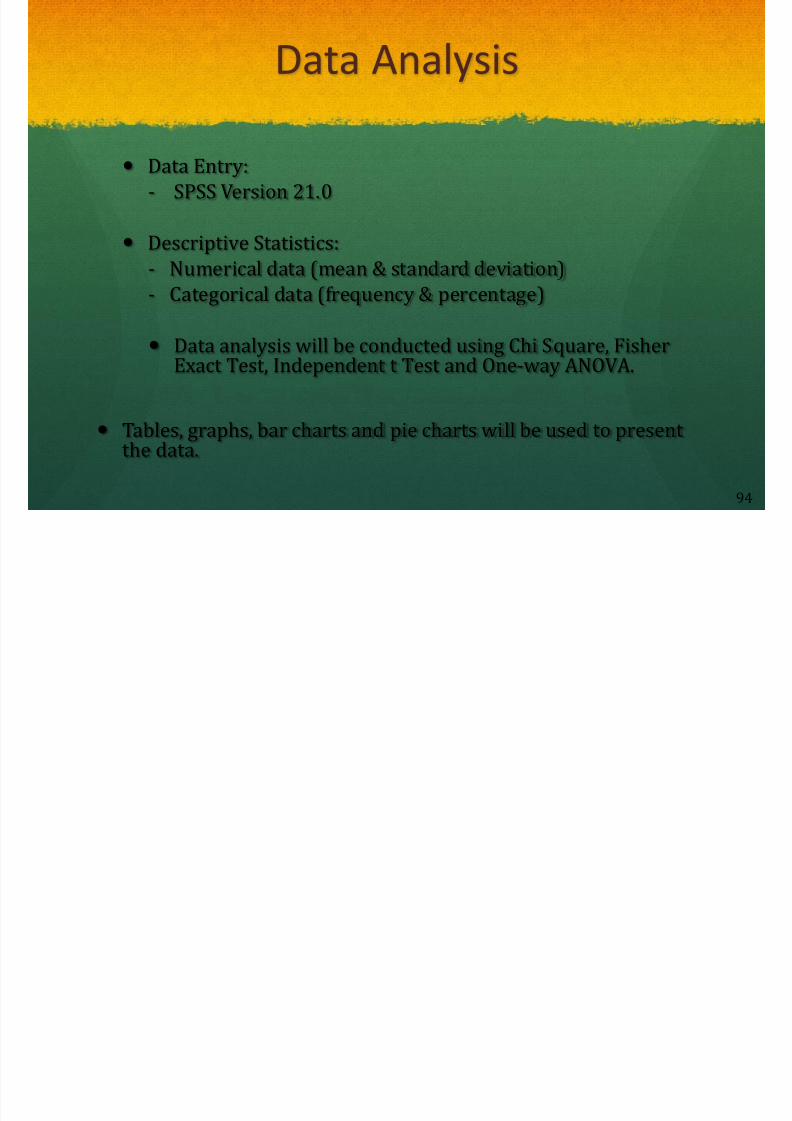
Data Entry:- SPSS Version 21.0
Descriptive Statistics:- Numerical data (mean & standard deviation)- Categorical data (frequency & percentage)
Data analysis will be conducted using Chi Square, FisherExact Test, Independent t Test and One-way ANOVA.
Tables, graphs, bar charts and pie charts will be used to presentthe data.
94
Dummy table on Socio-demographicFactors of Residents aged ≥ 18

8/13/2019 R1 Presentation 4.0
http://slidepdf.com/reader/full/r1-presentation-40 96/106
Factors Frequency(%)
Mean (SD) Median (IQR)
Age
Sex
Race
Occupation
95
Table 1 : Socio-demographic characteristics of respondents (n=200)
Dummy Chart on Prevalence of Back Painamong Residents aged ≥ 18

8/13/2019 R1 Presentation 4.0
http://slidepdf.com/reader/full/r1-presentation-40 97/106
Yes50%
No50%
96
Figure 1 : Prevalence of back pain among villagers of Kok Lanas (n=200)
Dummy Table on Knowledge aboutBack Pain among Residents aged ≥ 18

8/13/2019 R1 Presentation 4.0
http://slidepdf.com/reader/full/r1-presentation-40 98/106
Frequency (%)
Yes No Do not know
Knowledge
Mean (SD) total score of knowledgeFrequency (%) of good and poor knowledge
97
Table 2: Responses on knowledge questions of respondents (n=200)
Dummy Table on Attitude towards Back painamong Residents aged ≥ 18

8/13/2019 R1 Presentation 4.0
http://slidepdf.com/reader/full/r1-presentation-40 99/106
Frequency (%)
Stronglyagree
Agree Neutral Disagree Stronglydisagree
Attitude
Mean (SD) total score of attitudeFrequency (%) of good and poor attitude
98
Table 3: Responses on attitude among respondents (n=200)

8/13/2019 R1 Presentation 4.0
http://slidepdf.com/reader/full/r1-presentation-40 100/106
Dummy Table on Factors Associated with Back Painamong Residents aged ≥ 18

8/13/2019 R1 Presentation 4.0
http://slidepdf.com/reader/full/r1-presentation-40 101/106
100
Table 5: Factors associated with back pain among respondents ofKok Lanas (n=200)
CriteriaFrequency of back pain
(%)P value
Yes NoAge
Sex
Occupation
Knowledge
Attitude
Practice
Gantt Chart

8/13/2019 R1 Presentation 4.0
http://slidepdf.com/reader/full/r1-presentation-40 102/106
Week 8(29/9/2013-5/10/2013) Week 9(6-10/10/2013)
Preparation for Residency 2
Community Residency 2(data collection)
Data entry and data analysis
Preparation for PowerPoint
Presentation on community diagnosisand intervention for Residency 3,4
Preparation for residency 3
Writing report
101
REFERENCES

8/13/2019 R1 Presentation 4.0
http://slidepdf.com/reader/full/r1-presentation-40 103/106
1. National Health and Morbidity Survey III (Vol II), 2006
2. Ministry of Health (MOH), Health Facts, Kuala Lumpur, Malaysia, 2008
3. Ministry of Health (MOH), Oral Health Division, Kuala Lumpur, Malaysia, 2004
4. Lembaga Pembangunan Perancang Keluarga dan Negara (LPPKN), 25September 2011, http://www.lppkn.com.my
5. Department of Statistic Malaysia, 25 September 2011,http://www.stat.gov.my
6. Ministry of Women, Family and Community De velopment, NKRA LowHousehold Income, http://www.kpwkm.gov.my
102
REFERENCES (cont.)

8/13/2019 R1 Presentation 4.0
http://slidepdf.com/reader/full/r1-presentation-40 104/106
8. Noor Sa ’ adah Bachok, Journal of Acceptance and knowledge of familyplanning among Muslim women in rural villages of Kelantan, 2007, Page 3
9. Asmani R & Aziah D, Pap Smear Screening Among Women inMukim Jaya Setia, Kelantan, Malaysia Journal of Public Health
Medicine 2007.
10. T O Lim, Z Morad, Prevalence, Awareness, Treatment andControl of Hypertension in the Malaysian Adult Population, 2004.
11. Verapeen, et .al : Musculoskeletal Pain in Malaysia: A COPCORD Survey(2007)
103
References (cont.)

8/13/2019 R1 Presentation 4.0
http://slidepdf.com/reader/full/r1-presentation-40 105/106
12. Razlan M., Win Kyi, Rampal K.G., Work-Related MusculoskeletalSymptoms Among Batik Workers in Kelantan (2000)
13. Deyo RA, Mirza SK, Martin BI. Back pain prevalence and visit rates: estimatesfrom U.S. national surveys, 2002. Department of Medicine, University of
Washington, Seattle, WA, USA. [email protected]
104

8/13/2019 R1 Presentation 4.0
http://slidepdf.com/reader/full/r1-presentation-40 106/106
Thank YouBy CFCS Group H Session 2012-2014