rand hani al-dmour · ii abstract this thesis investigates the influence of firms’ internal and...
TRANSCRIPT

An Integration Model for Identifying the Determinants
of the Adoption and Implementation Level of HRIS
Applications and Its Effectiveness in Business
Organisations in Jordan
A Thesis Submitted for the Degree of Doctor of Philosophy
By
Rand Hani Al-Dmour
School of Information Systems, Computing and Mathematics
Brunel University London
April 2014
II
ABSTRACT
This thesis investigates the influence of firms’ internal and external environmental factors upon
their adoption of HRIS behaviour (i.e., the variation between adopters and non-adopters) and the
level of implementation of HRIS applications and its effectiveness. An integrated conceptual
framework was developed for the factors that determine the organisation’s adoption and the level
of practice of HRIS applications. This framework integrates ideas and elements from the Diffusion
of innovation Theory (DOI) and technology organization environment (TOE) model, the Unified
Theory of Acceptance and Use of Technology (UTAUT) and the IT studies in the area of HRM.
Data were collected through structured-directed interviews with 236 respondents. The survey units
were the shareholding companies in Jordan, and the key single respondents approach was
employed. The findings of the study support that internal and external environmental factors are
related not only to adoption of HRIS behaviour (i.e., the difference between adopters and non-
adopters), but also to the level of implementing of HRIS applications. In comparison to each
environmental dimension acting alone, the integration approach of the two internal and external
dimensions gives better explanation not only of the prediction of the level of implementing of
HRIS applications, but also of the prediction of adoption behaviour. Therefore, a better
understanding of adoption of HRIS behaviour and the level of implementing of HRIS applications
requires that firms’ environmental factors be viewed as whole (i.e., the interaction of the internal
and external dimension) rather than being isolated fragments (i.e., only a single dimension).
The current research contributes to the existing body of knowledge by enhancing current
understanding of the organisational adoption of HRIS, which is an under-researched area in Jordan
as a developing country. By employing analytical tools based on Rogers’s Innovation Diffusion
Theory , UTAUT, TOE , and the findings of empirical studies of IT adoption, evidence confirms
that the adoption of HRIS in the business organisations depends largely on interaction of internal
and external environmental factors and the findings support the need for an integrated view of the
adoption phenomenon. In that respect, this study also attempts to make an important theoretical
contribution towards articulating differences in the determinants of adoption and the level of
implementations of HRIS applications and its effectiveness.

III
PUBLICATIONS
Published Papers in 2013/2014
AL-Dmour, R.H, Love, S and Al-Zu'bi, Z. (2013) ‘Factors Influencing the Adoption of
HRIS Applications: A Literature Review’ , Int. J. Management & Business studies, Vol. 3,
Issue 4, oct - Dec 2013.
AL-Dmour, .R H., and Al-Zu'bi, Z. (2014) ‘Factors Inhabiting and Motivating the
Adoption of HRIS in Business Organization ’, International Business Research, Vol. 7,
No. 7, p139.
Accepted Papers in 2013/2014
Al-Dmour, R.H., Love, S. and Al-Debei, M.M. (2013) ‘Measuring the effectiveness of
HRIS practice in business organisations: a study in the context of a developing country’,
Int. J. Business Innovation and Research, Vol. X, No. Y, pp.
AL-Dmour, R.H and Love, S. (2013) ‘An Integrated Model for Identifying the
Determinants of the Adoption of Human Resources Information System (HRIS)
Applications in Business Organisations’, Int. J. Business Innovation and Research, Vol. X,
No. Y, pp.
AL-Dmour, R.H., Love, S. and Al-Debei, M.M. (2014) ‘Factors Influencing the
Organisational Adoption of Human Resource Information Systems: A Conceptual Model
’, Int. J. Business Innovation and Research, Vol. X, No. Y, pp.
AL-Dmour, R.H and Love, S. (2014) ‘Determinants of the Implementation of HRIS
Applications in Business Organisations in Jordan’, Int. J. Human Resources Development
and Management, Vol. X, No. Y, pp.
Papers under Review in 2013/2014
AL-Dmour, R.H, Love, S. (2013) ‘ Factors Influencing the Adoption and Implementation
of HRIS Applications: Are They Similar in Jordanian Business Organisations ’ , Int. J.
Management & Business studies, Vol. X, No. Y, pp.
Other Published Papers 2012
AL-Dmour, R.H and O. Shannak, R. (2012) ‘Determinants of the Implementation Level of
Electronic Human Resources Management (E-HRM) in Jordanian Shareholding
Companies, European Scientific Journal, Vol. 8, No. 17(2012).
Sweidan, G., Al-Dmour, H, Al-Zu’bi, Z and Al-Dourer.(2012) ‘The Effect of Relationship
Marketing on Customer Loyalty in the Jordanian Pharmaceutical Industry’,
Eurojournals,Issue.53,Sep2012mPP.153-173 .
IV
TABLE OF CONTENTS
ABSTRACT ............................................................................................................................................... II
PUBLICATIONS ...................................................................................................................................... III
TABLE OF CONTENTS ......................................................................................................................... IV
LIST OF TABLES ................................................................................................................................. VIII
LIST OF FIGURES ................................................................................................................................ XIII
DEDICATIONS .......................................................................................................................................... XIV
ACKNOWLEDGMENTS ...................................................................................................................... XV
DECLARATION ................................................................................................................................... XVI
INTRODUCTION ............................................................................................................ 17 CHAPTER 1:
1.1 BACKGROUND ............................................................................................................................................ 17
1.2 PROBLEM STATEMENT ................................................................................................................................. 18
1.3 RESEARCH AIM, OBJECTIVES AND QUESTIONS .................................................................................................. 20
1.4 THE SIGNIFICANCE OF THE STUDY ................................................................................................................... 21
1.5 HRIS OVERVIEW: DEFINITION AND IMPLICATIONS............................................................................................. 22
1.5.1 Definition of HRIS ........................................................................................................................... 22
1.5.2 HRIS Applications ........................................................................................................................... 22
1.6 THESIS OVERVIEW ...................................................................................................................................... 26
1.7 SUMMARY ................................................................................................................................................. 27
LITERATURE REVIEW ................................................................................................ 28 CHAPTER 2:
2.1 INTRODUCTION .......................................................................................................................................... 28
2.2 DIFFUSION THEORIES AND MODELS AT THE FIRM LEVEL ..................................................................................... 28
2.2.1 Diffusion of Innovation Theory (DOI) ............................................................................................. 29
2.2.2 Unified Theory of Acceptance and Use of Technology (UTAUT) .................................................... 36
2.2.3 Technology-Organisation-Environment Framework (TOE) ............................................................ 38
2.3 OVERVIEW COMMENTS ON THE ADOPTION OF INNOVATION MODELS ................................................................... 42
2.4 PREVIOUS STUDIES ...................................................................................................................................... 44
2.5 THE CONCEPTUAL APPROACH ANALYSIS OF PREVIOUS STUDIES ........................................................................... 49
2.5.1 The Firm’s Internal Environmental Factors .................................................................................... 50
2.5.2 The Firm’s External Environmental Factors ................................................................................... 67
2.6 THE LIMITATIONS OF THE PREVIOUS STUDIES .................................................................................................... 72
2.7 THE EFFECTIVENESS OF HRIS STUDIES ............................................................................................................ 74
2.8 CHAPTER SUMMARY.................................................................................................................................... 79
CONCEPTUAL FRAMEWORK .................................................................................... 81 CHAPTER 3:
3.1 INTRODUCTION .......................................................................................................................................... 81
V
3.2 THE NATURE OF THE CONCEPTUAL FRAMEWORK .............................................................................................. 81
3.3 THE MAIN CONSTRUCTS OF THE STUDY’S CONCEPTUAL FRAMEWORK ................................................................... 85
3.3.1 The Organisation’s Adoption and the Level of Implementing HRIS ............................................... 85
3.3.2 HRIS Effectiveness .......................................................................................................................... 88
3.4 THE CONSTRUCTS OF THE FIRM’S INTERNAL ENVIRONMENTAL DIMENSION ............................................................ 90
3.4.1 Management’s Expectations (Perceived HRIS Characteristics) ...................................................... 90
3.4.2 Organisation’s Dynamic Capabilities ............................................................................................. 92
3.4.3 Organisational Structures .............................................................................................................. 93
3.4.4 Management Commitment and Corporate Culture ....................................................................... 94
3.4.5 The Socio-Demographic Characteristics of Decision-Makers ......................................................... 97
3.5 THE CONSTRUCTS OF THE FIRM’S EXTERNAL ENVIRONMENT DIMENSION ............................................................... 98
3.5.1 Industry Characteristics and Market Structure .............................................................................. 99
3.5.2 Social Influences (Externalities Network) ..................................................................................... 101
3.5.3 Government Policies and Support ................................................................................................ 102
3.6 RESEARCH HYPOTHESES.............................................................................................................................. 103
3.7 SUMMARY ............................................................................................................................................... 105
RESEARCH DESIGN AND DATA COLLECTION .................................................... 108 CHAPTER 4:
4.1 INTRODUCTION ........................................................................................................................................ 108
4.2 RESEARCH APPROACHES ............................................................................................................................ 108
4.3 RESEARCH PARADIGMS .............................................................................................................................. 109
4.4 RESEARCH DESIGN PROCESS ....................................................................................................................... 110
4.4.1 Deciding on the Alternative Data Collection Methods ................................................................. 112
4.4.2 Deciding on the Most Appropriate Type of Questioning Methods .............................................. 114
4.4.3 Deciding on the Appropriate Structure of the Interview .............................................................. 116
4.4.4 Deciding on the Domain of Respondents ..................................................................................... 116
4.4.5 Deciding on the Appropriate Key Informant Approach ................................................................ 117
4.4.6 Deciding on the Appropriate Instrument of Measurement ......................................................... 118
4.5 THE QUESTIONNAIRE DEVELOPMENT PROCESS ............................................................................................... 119
4.5.1 Pilot Study: Methodology and Findings ....................................................................................... 121
4.6 DEVELOPMENT OF QUESTIONNAIRE ITEMS ..................................................................................................... 121
4.7 ETHICAL CONSIDERATIONS .......................................................................................................................... 122
4.8 PREPARING FOR DATA ANALYSIS .................................................................................................................. 122
4.9 SUMMARY ............................................................................................................................................... 123
RESEARCH METHODOLOGY ................................................................................... 124 CHAPTER 5:
5.1 INTRODUCTION ........................................................................................................................................ 124
5.2 CLASSIFICATION OF STATISTICAL TECHNIQUES ................................................................................................. 124
5.3 STATISTICAL METHODS USED FOR RESEARCH OBJECTIVES ................................................................................. 125
5.3.1 Factor Analysis ............................................................................................................................. 125

VI
5.3.2 Discriminant Function Analysis .................................................................................................... 128
5.3.3 Multiple Regression Analysis ....................................................................................................... 130
5.3.4 Simple Correlation Coefficient ..................................................................................................... 133
5.4 STATISTICAL METHODS USED FOR TESTING RESEARCH HYPOTHESES ................................................................... 134
5.5 RELIABILITY AND VALIDITY ASSESSMENT ........................................................................................................ 138
5.5.1 Testing the Internal Consistency Reliability: ................................................................................ 139
5.5.2 Validity Assessment: Content (Face) validity ............................................................................... 142
5.6 SUMMARY ............................................................................................................................................... 144
THE FACTOR ANALYSIS, RELIABILITY AND VALIDITY FINDINGS ............... 146 CHAPTER 6:
6.1 INTRODUCTION ........................................................................................................................................ 146
6.2 THE FINDINGS OF THE FACTOR ANALYSIS ....................................................................................................... 146
6.2.1 The Interpretation of the Final Factor Analysis ............................................................................ 147
6.2.2 The Main Factors Underlying the HRIS Effectiveness Measures .................................................. 153
6.3 VALIDITY ASSESSMENT ............................................................................................................................... 154
6.3.1 Evidence of Content Validity ........................................................................................................ 154
6.3.2 Evidence of Convergent Validity. ................................................................................................. 155
6.4 SUMMARY ............................................................................................................................................... 156
DETERMINANTS HRIS ADOPTION BEHAVIOUR - ADOPTERS VS. NON-CHAPTER 7:
ADOPTERS ........................................................................................................................................... 158
7.1 INTRODUCTION ........................................................................................................................................ 158
7.2 TESTING THE RESEARCH HYPOTHESES ........................................................................................................... 159
7.2.1 Testing the Significant of Discriminant Function (Chi-Square and Univariate F Ratio) ................ 159
7.2.2 Testing the Improvement in Predicting Group Membership ........................................................ 161
7.3 IDENTIFICATION AND PREDICTION OF ADOPTION OF HRIS APPLICATIONS: INTERPRETATION OF DFA ........................ 163
7.3.1 Comparative Analysis between the Impact of Internal and External Dimensions Applications .. 163
7.3.2 Validation of the Prediction of Adoption Behaviour (Adopter’s and Non-Adopters) Group
Membership .......................................................................................................................................... 165
7.4 THE RELATIVE IMPORTANT OF THE PREDICTOR FACTORS IN TERMS OF THEIR CONTRIBUTIONS ................................. 167
7.4.1 The Internal Dimension Factors ................................................................................................... 167
7.4.2 The External Dimension Factors ................................................................................................... 169
7.5 THE DIFFERENCES BETWEEN ADOPTERS AND NON-ADOPTERS OF HRIS APPLICATIONS: VARIABLES FINDINGS ............. 170
7.5.1 The Interpretation of the Variables Findings ............................................................................... 171
7.6 SUMMARY AND CONCLUSIONS .................................................................................................................... 184
THE DETERMINANTS OF THE LEVEL OF HRIS IMPLEMENTATION AND ITS CHAPTER 8:
EFFECTIVENESS ................................................................................................................................ 186
8.1 INTRODUCTION ........................................................................................................................................ 186
8.2 THE EXTENT OF THE LEVEL OF IMPLANTATION OF HRIS APPLICATIONS ................................................................ 187
8.3: THE MULTIPLE REGRESSION FINDINGS: DETERMINANTS OF THE LEVEL OF IMPLEMENTATION OF HRIS APPLICATIONS . 188

VII
8.4 THE INTERPRETATION OF THE MULTIPLE REGRESSION FINDINGS......................................................................... 189
8.4.1 Stepwise Multiple Regressions: (Internal Dimension) .................................................................. 190
8.4.2 Stepwise Multiple Regressions: (External Dimension) ................................................................. 192
8.4.3 Stepwise Multiple Regressions: (Combination Findings) ............................................................. 193
8.5 THE BIVARIATE CORRELATION: FACTOR FINDINGS ........................................................................................... 194
8.6 INTERPRETATION OF THE CORRELATION FACTOR FINDINGS ................................................................................ 195
8.6.1 Internal Environmental Dimension: Factors Correlations ............................................................ 195
8.6.2 External Environmental Dimension: Factors Correlations ........................................................... 197
8.7 THE BIVARIATE CORRELATIONS: VARIABLES FINDINGS ...................................................................................... 198
THE PEARSON CORRELATION WAS USED TO TEST THE FOLLOWING HYPOTHESES: .......................................................... 198
8.8 THE INTERPRETATION OF THE CORRELATION VARIABLES FINDINGS ...................................................................... 198
8.9 THE MULTIPLE REGRESSION FINDINGS: EFFECTIVENESS OF HRIS ....................................................................... 210
8.10 THE BIVARIATE CORRELATIONS: EFFECTIVENESS VARIABLES FINDINGS ............................................................... 212
8.10.1 The "Operational/Administrative Effectiveness" Factor: Variables Correlations ....................... 212
8.10.2 The “Relational Effectiveness” Factor: Variables Correlations .................................................. 213
8.10.3 The "Transformational/Strategic Effectiveness" Factor: Variables Correlations ....................... 214
8.11 SUMMARY AND CONCLUSION .................................................................................................................... 214
SUMMARY, CONCLUSIONS, CONTRIBUTIONS AND FUTURE STUDIES............................... 217 CHAPTER 9:
9.1 SUMMARY ............................................................................................................................................... 217
9.2 MAIN CONCLUSIONS OF THE RESEARCH FINDINGS ........................................................................................... 218
9.2.1 The Determinants of the Firm’s Adoption Behaviour: The Finding of the first objective ............. 221
9.2.2 The Determinants of the Level of Implementation of HRIS Applications: The findings of the
Second objective ................................................................................................................................... 223
9.2.3 Main Findings on the Effectiveness of the HRIS: The findings of the Third objective ................... 227
9.3 RESEARCH CONTRIBUTIONS ........................................................................................................................ 228
9.3.1 Theoretical and Methodological Contributions ........................................................................... 228
9.3.2 Practical Contributions................................................................................................................. 229
9.4 RESEARCH LIMITATIONS ............................................................................................................................. 231
9.6 PERSONAL REFLECTION ON THE THESIS ......................................................................................................... 231
9.7 AREAS FOR FURTHER RESEARCH .................................................................................................................. 232
REFERENCES .................................................................................................................................................. 234
APPENDIX 1: THE QUESTIONNAIRE .................................................................................................................... 261
APPENDIX 2: ETHICAL APPROVAL ...................................................................................................................... 269
APPENDIX 3: TRANSLATION APPROVAL ............................................................................................................... 270
APPENDIX 4: EXAMPLES OF PREVIOUS STUDIES ..................................................................................................... 271
APPENDIX5: VARIABLES OPERATIONALISATION'S .................................................................................................. 276
APPENDIX 6: THE MAIN FACTORS UNDERLYING CONSTRUCTS ................................................................................. 286

VIII
LIST OF TABLES
TABLE 1.1: SUMMARY OF HRIS APPLICATIONS ........................................................................................................... 25
TABLE 2.1: SUMMARY OF THE MAIN COMMENTS ON THE ADOPTION OF INNOVATION THEORIES ......................................... 44
TABLE 2.2: INNOVATION CLASSICAL CHARACTERISTICS ................................................................................................. 53
TABLE 2.3: ORGANISATION READINESS AND COMPETENCES STUDIES .............................................................................. 56
TABLE 2.4: ORGANISATION DEMOGRAPHIC CHARACTERISTICS STUDIES ........................................................................... 59
TABLE 2.5: ORGANISATIONAL STRUCTURE STUDIES ........................................................................................ 61
TABLE 2.6: SOCIO-DEMOGRAPHIC CHARACTERISTICS OF DECISION-MAKERS ................................................. 67
TABLE 2.7: SUMMARY OF SELECTED EFFECTIVENESS MEASURES OF HRIS IN PREVIOUS STUDIES .................. 76
TABLE 3.1: MAIN CONSTRUCTS OF THE STUDY’S CONCEPTUAL FRAMEWORK .................................................. 82
TABLE 3.2: THE ELEMENTS OF THE EFFECTIVENESS HRIS USAGE .................................................................................... 89
TABLE 3.3: THE ELEMENTS OF MANAGEMENT’S EXPECTATIONS ..................................................................... 91
TABLE 3.4: THE ELEMENTS OF ORGANISATION’S DYNAMIC CAPABILITIES ......................................................................... 93
TABLE 3.5: THE ELEMENTS OF ORGANISATIONAL STRUCTURE ........................................................................ 94
TABLE 3.6: THE ELEMENTS OF MANAGEMENT COMMITMENT AND CULTURE .................................................. 97
TABLE 3.7: THE ELEMENTS OF SOCIO-DEMOGRAPHIC CHARACTERISTICS OF DECISION-MAKER ..................... 98
TABLE 3.8: THE ELEMENTS OF INDUSTRY CHARACTERISTICS AND MARKET STRUCTURE .............................. 101
TABLE 3.9: ELEMENTS OF THE EXTERNALITIES NETWORK .............................................................................. 102
TABLE 3.10: ELEMENTS OF GOVERNMENT POLICIES AND SUPPORT ................................................................. 103
TABLE 3.11: RESEARCH HYPOTHESES (NULL) ................................................................................................. 103
TABLE 4.1: QUESTIONNAIRE MODE OF DATA COLLECTION .............................................................................. 114
TABLE 4.2: THE DOMAIN OF THE STUDY'S RESPONDENTS ............................................................................................ 117
TABLE 4.3: RESEARCH DESIGN AND DATA COLLECTION TECHNIQUES ............................................................................. 123
TABLE 5.1: RESEARCH OBJECTIVE AND TECHNIQUES OF DATA ANALYSIS ........................................................................ 133
TABLE 5.2: RESEARCH HYPOTHESES AND THEIR RELEVANT STATISTICAL TESTS ................................................................. 135
TABLE 6.1: FACTORS UNDERLYING THE INTERNAL AND EXTERNAL DIMENSIONS............................................................... 147
TABLE 6.2: KMO AND BARTLETT'S TEST ................................................................................................................. 148
TABLE 6.3: TOTAL VARIANCE EXPLAINED ................................................................................................................. 148
TABLE 6.4: KMO AND BARTLETT'S TEST ................................................................................................................. 148
TABLE 6.5: TOTAL VARIANCE EXPLAINED ................................................................................................................. 149
TABLE 6.6: KMO AND BARTLETT'S TEST ................................................................................................................. 149
TABLE 6.7: TOTAL VARIANCE EXPLAINED ................................................................................................................. 150
TABLE 6.8: KMO AND BARTLETT'S TEST ................................................................................................................. 150
TABLE 6.9: TOTAL VARIANCE EXPLAINED ................................................................................................................. 150
IX
TABLE 6.10: KMO AND BARTLETT'S TEST ............................................................................................................... 151
TABLE 6.11: TOTAL VARIANCE EXPLAINED ............................................................................................................... 151
TABLE 6.12: KMO AND BARTLETT'S TEST ............................................................................................................... 152
TABLE 6.13: TOTAL VARIANCE EXPLAINED ............................................................................................................... 152
TABLE 6.14: KMO AND BARTLETT'S TEST ............................................................................................................... 152
TABLE 6.15: TOTAL VARIANCE EXPLAINED ............................................................................................................... 153
TABLE 6.16: KMO AND BARTLETT'S TEST ............................................................................................................... 153
TABLE 6.17: TOTAL VARIANCE EXPLAINED ............................................................................................................... 153
TABLE 6.18: KMO AND BARTLETT'S TEST ............................................................................................................... 154
TABLE 6.19: TOTAL VARIANCE EXPLAINED ............................................................................................................... 154
TABLE 6.20: SURVEY OF AVERAGE EXPLAINED VARIANCE AND RELIABILITY ESTIMATIONS OF ALL MEASURES OF CONSTRUCTS .. 155
TABLE 6.21: SUMMARY OF THE FACTORS UNDERLYING THE MAJOR CONSTRUCTS OF THE COMPANY'S INTERNAL ENVIRONMENTAL
DIMENSION .............................................................................................................................................. 156
TABLE 6.22: SUMMARY OF THE FACTORS UNDERLYING THE MAJOR CONSTRUCTS OF THE COMPANY'S EXTERNAL ENVIRONMENTAL
DIMENSION .............................................................................................................................................. 157
TABLE 7.1: SUMMARY OF CANONICAL DISCRIMINANT FUNCTIONS FOR INTERNAL ENVIRONMENTAL MEASURES, TAKEN TOGETHER
.............................................................................................................................................................. 160
TABLE 7.2: SUMMARY OF CANONICAL DISCRIMINANT FUNCTIONS FOR EXTERNAL ENVIRONMENTAL MEASURES, TAKEN TOGETHER
.............................................................................................................................................................. 160
TABLE 7.3: UNIVARIATE F VALUE AND ITS SIGNIFICANT LEVEL IN THE DFA OF THE INTERNAL ENVIRONMENTAL DIMENSION, TAKEN
SEPARATELY .............................................................................................................................................. 162
TABLE 7.4: UNIVARIATE F VALUE AND ITS SIGNIFICANT LEVEL IN THE DFA OF THE EXTERNAL ENVIRONMENTAL DIMENSION, TAKEN
SEPARATELY .............................................................................................................................................. 162
TABLE 7.5: FOURFOLD TABLE OF MCNEMAR TEST .................................................................................................... 162
TABLE 7.6: COMPARATIVE RESULTS OF TWO SEPARATE DISCRIMINANT ANALYSIS FUNCTION ............................................. 164
TABLE 7.7: VALIDATION OF THE DISCRIMINANT FUNCTIONS: COMPARISON OF THE ANALYSIS AND VALIDATION SAMPLE ......... 166
TABLE 7.8: A COMPARISON BETWEEN THE HIT RATIOS OF THE DFA AND THE JACKNIFE METHOD ....................................... 167
TABLE 7.9: STANDARDIZED DISCRIMINANT COEFFICIENT ............................................................................................. 169
TABLE 7.10: SUMMARY OF THE RESULTS OF THE F-TEST OF THE DIFFERENCES BETWEEN ADOPTER’S GROUP AND NON –
ADOPTER’S GROUP IN TERMS OF VARIABLES ................................................................................................... 170
TABLE 7.11: F-TEST BETWEEN ADOPTERS AND NON-ADOPTERS OF HRIS APPLICATION IN TERMS OF VARIABLES CONSTITUTING
“PERCEIVED ADVANTAGES “FACTOR.............................................................................................................. 171
TABLE 7.12: F-TEST BETWEEN ADOPTERS AND NON-ADOPTERS OF HRIS APPLICATION IN TERMS OF VARIABLES CONSTITUTING
“COMPATIBILITY” FACTOR ........................................................................................................................... 172
TABLE 7.13: F-TEST BETWEEN ADOPTERS AND NON-ADOPTERS OF HRIS APPLICATION IN TERMS OF VARIABLES CONSTITUTING
“COMPLEXITY” FACTOR .............................................................................................................................. 173

X
TABLE 7.14: F-TEST BETWEEN ADOPTERS AND NON-ADOPTERS OF HRIS APPLICATION IN TERMS OF VARIABLES CONSTITUTING
“IT EXPERIENCES AND CAPABILITIES)” FACTOR ................................................................................................ 173
TABLE 7.15: F-TEST BETWEEN ADOPTERS AND NON-ADOPTERS OF HRIS APPLICATION IN TERMS OF VARIABLES CONSTITUTING
“HR STRATEGIC ROLE” FACTOR .................................................................................................................... 174
TABLE 7.16: F-TEST BETWEEN ADOPTERS AND NON-ADOPTERS OF HRIS APPLICATION IN TERMS OF VARIABLES CONSTITUTING
“ORGANISATIONAL RESOURCES (FACILITATING CONDITIONS)” FACTOR ................................................................ 174
TABLE 7.17: F-TEST BETWEEN ADOPTERS AND NON-ADOPTERS OF HRIS APPLICATION IN TERMS OF VARIABLES “SIZE &
EXPERIENCE” FACTOR ................................................................................................................................. 175
TABLE 7.18: F-TEST BETWEEN ADOPTERS AND NON-ADOPTERS OF HRIS APPLICATION IN TERMS OF
VARIABLES WHICH CONSTITUTE THE CONSTITUTING “EMPLOYMENT STRUCTURE “FACTOR ................ 175
TABLE 7.19: F-TEST BETWEEN ADOPTERS AND NON-ADOPTERS OF HRIS APPLICATION IN TERMS OF
VARIABLES CONSTITUTING “SPECIALISATION “FACTOR ....................................................................... 176
TABLE 7.20: F-TEST BETWEEN ADOPTERS AND NON-ADOPTERS OF HRIS APPLICATION IN TERMS OF
VARIABLES CONSTITUTING “FORMALISATION “FACTOR GROUP ........................................................... 176
TABLE 7.21: F-TEST BETWEEN ADOPTERS AND NON-ADOPTERS OF HRIS APPLICATION IN TERMS OF
VARIABLES CONSTITUTING “CENTRALISATION” FACTOR ..................................................................... 177
TABLE 7.22: F-TEST BETWEEN ADOPTERS AND NON-ADOPTERS OF HRIS APPLICATION IN TERMS OF
VARIABLES CONSTITUTING “TOP MANAGEMENT WILLINGNESS TO SUPPORT” FACTOR ....................... 178
TABLE 7.23: F-TEST BETWEEN ADOPTERS AND NON-ADOPTERS OF HRIS APPLICATION IN TERMS OF
VARIABLES CONSTITUTING “INTRA-ORGANISATION COMMUNICATION “ FACTOR ............................... 179
TABLE 7.24: F-TEST BETWEEN ADOPTERS AND NON-ADOPTERS OF HRIS APPLICATION IN TERMS OF
VARIABLES WHICH CONSTITUTE THE CONSTITUTING “ORGANISATION SHARING CULTURE “FACTOR ... 179
TABLE 7.25: F-TEST BETWEEN ADOPTERS AND NON-ADOPTERS OF HRIS APPLICATION IN TERMS OF
VARIABLES CONSTITUTING “SOCIAL AND TECHNOLOGY SKILLS “FACTOR ........................................... 180
TABLE 7.26: F-TEST BETWEEN ADOPTERS AND NON-ADOPTERS OF HRIS APPLICATION IN TERMS OF
VARIABLES CONSTITUTING “CEO’S DEMOGRAPHIC CHARACTERISTICS “FACTOR ............................... 181
TABLE 7.27: F-TEST BETWEEN ADOPTERS AND NON-ADOPTERS OF HRIS APPLICATION IN TERMS OF
VARIABLES CONSTITUTING AVAILABILITY OF IT SUPPLIERS & ACTIVITIES “FACTOR ........................... 181
TABLE 7.28: F-TEST BETWEEN ADOPTERS AND NON-ADOPTERS OF HRIS APPLICATION IN TERMS OF
VARIABLES CONSTITUTING “COMPETITION PRESSURE” FACTOR .......................................................... 182
TABLE 7.29: F-TEST BETWEEN ADOPTERS AND NON-ADOPTERS OF HRIS APPLICATION IN TERMS OF VARIABLES CONSTITUTING
“SOCIAL INFLUENCES “FACTOR ..................................................................................................................... 183
TABLE 7.30: F-TEST BETWEEN ADOPTERS AND NON-ADOPTERS OF HRIS APPLICATION IN TERMS OF
VARIABLES CONSTITUTING “GOVERNMENT POLICIES AND SUPPORT” FACTOR .................................... 184
TABLE 8.1: HRIS APPLICATIONS ............................................................................................................................ 188
TABLE 8.2: A SUMMARY RESULT OF THE MULTIPLE REGRESSIONS: DETERMINANTS OF THE LEVEL OF IMPLEMENTATION OF HRIS
.............................................................................................................................................................. 189

XI
TABLE 8.3: THE STEPWISE REGRESSION ANALYSIS: INTERNAL DIMENSION ...................................................................... 191
TABLE 8.4: THE STEPWISE REGRESSION ANALYSIS: EXTERNAL DIMENSION ..................................................................... 193
TABLE 8.5: THE STEPWISE REGRESSION ANALYSIS: COMBINED DIMENSION .................................................................... 193
TABLE 8.6: THE CORRELATION COEFFICIENTS BETWEEN EACH FACTOR AND THE LEVEL OF IMPLEMENTATION OF HRIS
APPLICATIONS ........................................................................................................................................... 194
TABLE 8.7: THE CORRELATION COEFFICIENTS BETWEEN THE VARIABLES COMPRISING EACH INDEPENDENT FACTOR (TOGETHER OR
SEPARATELY) AND THE LEVEL OF IMPLEMENTATION OF HRIS .............................................................................. 198
TABLE 8.8: THE CORRELATION COEFFICIENT BETWEEN THE VARIABLES OF THE “PERCEIVED ADVANTAGE” FACTOR AND THE LEVEL
OF IMPLEMENTATION OF HRIS ..................................................................................................................... 199
TABLE 8.9: THE CORRELATION COEFFICIENT BETWEEN THE VARIABLES OF THE “COMPATIBILITY” FACTOR AND THE LEVEL OF
IMPLEMENTATION OF HRIS ......................................................................................................................... 200
TABLE 8.10: THE CORRELATION COEFFICIENT BETWEEN THE VARIABLES OF THE “COMPLEXITY” FACTOR AND THE LEVEL OF
IMPLEMENTATION OF HRIS ......................................................................................................................... 200
TABLE 8.11: THE CORRELATION COEFFICIENT BETWEEN THE VARIABLES OF THE “IT EXPERIENCES AND CAPABILITIES” FACTOR AND
THE LEVEL OF IMPLEMENTATION OF HRIS ...................................................................................................... 201
TABLE 8.12: THE CORRELATION COEFFICIENT BETWEEN THE VARIABLES OF THE “ORGANISATIONAL RESOURCES (FACILITATING
CONDITIONS)” FACTOR AND THE LEVEL OF IMPLEMENTATION OF HRIS ................................................................ 201
TABLE 8.13: THE CORRELATION COEFFICIENT BETWEEN THE VARIABLES OF THE “HR STRATEGIC ROLE” FACTOR AND THE LEVEL OF
IMPLEMENTATION OF HRIS ......................................................................................................................... 202
TABLE 8.14: THE CORRELATION COEFFICIENT BETWEEN THE VARIABLES OF THE “SIZE & EXPERIENCE” FACTOR AND THE LEVEL OF
IMPLEMENTATION OF HRIS ......................................................................................................................... 202
TABLE 8.15: THE CORRELATION COEFFICIENT BETWEEN THE VARIABLES OF THE “EMPLOYMENT STRUCTURE” FACTOR AND THE
LEVEL OF IMPLEMENTATION OF HRIS ............................................................................................................ 203
TABLE 8.16: THE CORRELATION COEFFICIENT BETWEEN THE VARIABLES OF THE “FORMALISATION” FACTOR AND THE LEVEL OF
IMPLEMENTATION OF HRIS ......................................................................................................................... 203
TABLE 8.17: THE CORRELATION COEFFICIENT BETWEEN THE VARIABLES OF THE “CENTRALISATION “FACTOR AND THE LEVEL OF
IMPLEMENTATION OF HRIS ......................................................................................................................... 204
TABLE 8.18: THE CORRELATION COEFFICIENT BETWEEN THE VARIABLES OF THE “SPECIALISATION” FACTOR AND THE LEVEL OF
IMPLEMENTATION OF HRIS ......................................................................................................................... 204
TABLE 8.19: THE CORRELATION COEFFICIENT BETWEEN THE VARIABLES OF THE “TOP MANAGEMENT WILLINGNESS TO SUPPORT”
FACTOR AND THE LEVEL OF IMPLEMENTATION OF HRIS .................................................................................... 205
TABLE 8.20: THE CORRELATION COEFFICIENT BETWEEN THE VARIABLES OF THE “INTRA-ORGANISATION COMMUNICATION”
FACTOR AND THE LEVEL OF IMPLEMENTATION OF HRIS .................................................................................... 206
TABLE 8.21: THE CORRELATION COEFFICIENT BETWEEN THE VARIABLES OF THE “ORGANISATION SHARING CULTURE” FACTOR AND
THE LEVEL OF IMPLEMENTATION OF HRIS ...................................................................................................... 206
TABLE 8.22: THE CORRELATION COEFFICIENT BETWEEN THE VARIABLES OF THE “SOCIAL AND TECHNOLOGY SKILLS” FACTOR AND
THE LEVEL OF IMPLEMENTATION OF HRIS ...................................................................................................... 207

XII
TABLE 8.23: THE CORRELATION COEFFICIENT BETWEEN THE VARIABLES OF THE “DEMOGRAPHIC CHARACTERISTICS” FACTOR AND
THE LEVEL OF IMPLEMENTATION OF HRIS ...................................................................................................... 207
TABLE 8.24: THE CORRELATION COEFFICIENT BETWEEN THE VARIABLES OF THE “AVAILABILITY OF IT SUPPLIERS & ACTIVITIES”
FACTOR AND THE LEVEL OF IMPLEMENTATION OF HRIS .................................................................................... 208
TABLE 8.25: THE CORRELATION COEFFICIENT BETWEEN THE VARIABLES OF THE “COMPETITION PRESSURE” FACTOR AND THE
LEVEL OF IMPLEMENTATION OF HRIS ............................................................................................................ 209
TABLE 8.26: THE CORRELATION COEFFICIENT BETWEEN THE VARIABLES OF THE “SOCIAL INFLUENCES” FACTOR AND THE LEVEL OF
IMPLEMENTATION OF HRIS ......................................................................................................................... 209
TABLE 8.27: THE CORRELATION COEFFICIENT BETWEEN THE VARIABLES OF THE “GOVERNMENT POLICIES AND SUPPORT” FACTOR
AND THE LEVEL OF IMPLEMENTATION OF HRIS ................................................................................................ 210
TABLE 8.28: A SUMMARY RESULT OF THE MULTIPLE REGRESSIONS: THE EFFECTIVENESS OF HRIS, TAKEN TOGETHER ........... 211
TABLE 8.29: A SUMMARY RESULT OF THE MULTIPLE REGRESSIONS: THE EFFECTIVENESS OF HRIS, TAKEN SEPARATELY ......... 211
TABLE 8.30: THE CORRELATION COEFFICIENT BETWEEN THE LEVEL OF IMPLEMENTATION OF HRIS AND THE VARIABLES OF
“OPERATIONAL/ADMINISTRATIVE EFFECTIVENESS” FACTOR ............................................................................... 213
TABLE 8.31: THE CORRELATION COEFFICIENT BETWEEN THE LEVEL OF IMPLEMENTATION OF HRIS AND THE VARIABLES OF
“RELATIONAL EFFECTIVENESS “FACTOR .......................................................................................................... 213
TABLE 8.32: THE CORRELATION COEFFICIENT BETWEEN THE LEVEL OF IMPLEMENTATION OF HRIS AND THE VARIABLES OF
“TRANSFORMATIONAL/STRATEGIC EFFECTIVENESS FACTOR ............................................................................... 214
TABLE 9.1: THE MOST IMPORTANT FACTORS THAT INFLUENCE THE ADOPTION AND IMPLEMENTATION LEVEL OF HRIS
APPLICATIONS (AGGREGATE) IN TERMS OF THE ORDER OF IMPORTANCE ............................................................... 220
TABLE 9.2: THE IMPORTANT FACTORS THAT INFLUENCE THE ADOPTION AND IMPLEMENTATION LEVEL OF HRIS APPLICATIONS,
TAKEN SEPARATELY .................................................................................................................................... 220
TABLE 9.3: HRIS APPLICATIONS ............................................................................................................................ 224
TABLE 1: THE MAIN FACTORS UNDERLYING THE MANAGEMENT'S EXPECTATIONS CONSTRUCT .......................................... 286
TABLE 2: THE MAIN FACTORS UNDERLYING THE ORGANISATION'S DYNAMIC CAPABILITIES ................................................ 287
TABLE 3: THE MAIN FACTORS UNDERLYING THE ORGANISATIONAL STRUCTURE CONSTRUCT ............................................. 288
TABLE 4: THE MAIN FACTORS UNDERLYING THE MANAGEMENT COMMITMENT AND CORPORATE CULTURE ......................... 289
TABLE 5: THE MAIN FACTORS UNDERLYING THE SOCIO-DEMOGRAPHIC CHARACTERISTICS OF DECISION-MAKERS .................. 291
TABLE 6: THE MAIN FACTORS UNDERLYING THE INDUSTRY CHARACTERISTICS AND MARKET STRUCTURE CONSTRUCT ............. 291
TABLE 7: THE MAIN FACTORS UNDERLYING SOCIAL INFLUENCES (EXTERNALITIES NETWORK) ............................................. 292
TABLE 8: THE MAIN FACTORS UNDERLYING THE GOVERNMENT POLICIES AND SUPPORT CONSTRUCT MEASURES................... 293
TABLE 9: THE MAIN FACTORS UNDERLYING THE HRIS EFFECTIVENESS MEASURES ........................................................... 293

XIII
LIST OF FIGURES
FIGURE 1.1: THESIS STRUCTURE ......................................................................................................................... 27
FIGURE 2.1: MODEL OF STAGES IN THE INNOVATION-DECISION PROCESS ........................................................ 30
FIGURE 2.2: DIFFUSION OF INNOVATION MODEL .............................................................................................. 33
FIGURE 2.3: DIFFUSION OF INNOVATION ........................................................................................................... 34
FIGURE 2.4: UNIFIED ACCEPTANCE OF TECHNOLOGY ....................................................................................... 37
FIGURE 2.5: TOE MODEL ................................................................................................................................. 40
FIGURE 2.6: HRIS ADOPTION IN THE AUSTRALIAN PUBLIC SECTOR ................................................................. 41
FIGURE 3.1: THE STUDY’S PROPOSED CONCEPTUAL FRAMEWORK ................................................................... 83
FIGURE 3.2: A SUMMARY OF CONCEPTUAL FRAMEWORK RELATIONSHIPS ..................................................... 107
FIGURE 4.1: PROCESS INVOLVED IN THIS STUDY ......................................................................................................... 112
FIGURE 5.1 : A FOURFOLD TABLE FOR USE IN TESTING THE SIGNIFICANCE OF CHANGE ..................................................... 138
FIGURE 7.1: MODEL USED IN THIS CHAPTER ............................................................................................................. 159
FIGURE 8.1: MODEL USED IN THIS CHAPTER................................................................................................... 186
FIGURE 9.1: RESEARCH MODEL ADJUSTED FOR INDEPENDENT VARIABLES’ R SQUARE ................................. 227

XIV
DEDICATIONS
Dedications
I dedicate this work to God almighty, to whom all glory shall always be, for his grace and strength that
helped me to accomplish this work. I also dedicate this work to my parents, for making me who I am today. To my dad for all the things he has done for me since
day one. Thank you for being my Dad, my Teacher, and my Friend Prof.Hani Al-dmour

XV
ACKNOWLEDGMENTS
The writing of this thesis has been one of the most significant academic challenges I have
ever had to face. Without the support, patience and guidance of the following people, this
study would not have been completed. It is to them that I owe my deepest gratitude.
Above all, thanks be to the Almighty for giving me the strength and patience to work
through all these years so that today I can stand proud with my head held high.
I would like to start with the person who made the biggest difference in my life, my mentor,
My greatest appreciation goes to the best Dad, Professor Hani Al-dmour, He has been
motivating and inspiring every bit of me towards new possibilities in life. Without him I
wouldn’t be where I am today.
I would like to express my sincere gratitude to my advisor Dr. Steve Love for his
continuous support throughout my Ph.D. study and research, for his patience, motivation,
enthusiasm, and immense knowledge. His guidance helped me in all the time of research
and writing of this thesis. I could not have imagined having a better advisor and mentor
for my Ph.D. study.
Special thanks to my committee, Dr. Mahmood shah, Dr. Steve Counsell and Dr. Mark
Perry, for their support, guidance and helpful suggestions. Their guidance has served me
well and I owe them my heartfelt appreciation.
Thanks to my friends, who have encouraged, entertained, cajoled, supported me through
the dark times, celebrated with me through the good, who have been brilliant and
understanding when I needed them to be, I take this opportunity to thank you:
My special words of thanks to Mina, Maria, and Muna, who always stand beside me, thank
goes to, Sara, Yasmeen ,Mayssa , Chedos, Masoud, Faris and Anan who made my school
life easier, Dr. ziad. Dr.Sultan, who helped me tremendously.
I find it difficult to express my appreciation because it is so boundless. He is my most
enthusiastic cheerleader; my best friend without his willingness to be Miles’ primary
caregiver, this thesis would have taken even longer to complete. I am grateful to my best
friend Dido because he has always supported, encouraged me through the ups and downs
of the entire PhD process.
Finally, I would like to acknowledge the people who mean world to me, my lovely parents
,my brothers(Ahmad ,Mohammad & yazeed) and uncle-aunty,. I extend my respect to my
parents, my paternal and maternal grandparents and all elders to me in the family. I don’t
imagine a life without their love and blessings. Thank you my greatest mom, dad, uncle
and aunty for showing faith in me and giving me liberty to choose what I desired. I
consider myself the luckiest in the world to have such a supportive family, standing behind
me with their love and support.

XVI
DECLARATION
This work was produced by the author unless otherwise stated and duly acknowledged.
Signed: ……………………….
Date: ………………………….

17
INTRODUCTION CHAPTER 1:
1.1 Background
This chapter presents the theoretical research background and boundaries, and the study rationale
and locations. It introduces the reader to the research problem, questions and objectives, and the
significance of the study, and outlines the structure of the thesis.
With the changing world and constant new technology that is available, managers need to be aware
of technology that will increase the effectiveness of their organisations. The knowledge-
intensifying process of the economy and the development of organisational networks, with their
greater dependency on qualified and committed employees, identify the need for a new form of
human resource management that meets the demands and needs of the management and the
employees. The need for Human Resource Information System (HRIS) has become imperative to
meet Human Resources (HR) challenges in the information-based economy.
A key issue in the management of information system (IS) in recent years is the growing
importance of specialized information within the traditional functional areas of the organisations.
HRIS is one such system, which in recent years has become critical to the operation of the
personnel departments of large organisations. Technology, a global economy and a shrinking work
force are among factors that have converged to push HR managers to the forefront and while no
one really knows what lies ahead for business in the 21st century; “futurists say one thing is certain
– human resource executives will play a vital role in helping business organisations compete”
(Chmielecki, 2012, P.52). Given such trends, traditional HR systems management is completely
inadequate (Beckers and Bsat, 2002; Laumer et al., 2013). Information technology (IT) has
considerable potential as a tool that managers can use (generally and in HR functions in particular)
to increase organisational capabilities and efficiency (Tansley and Watson, 2000). Those who
manage human resource functions have not ignored such potential, and a widespread use of HRIS
has occurred (Cedar, 2010).
The importance of IT systems in organisations (of all sizes, in the private and public sectors) has
grown exponentially since the 1990s, with the popularisation of IT and the Internet from that time
and the corresponding growth of IT users and services offered. Undoubtedly it also affected
organisations’ employees and their workplaces in job design, conditions of work and other ways
(Baloh and Trkman, 2003). From academic and practitioner perspectives, it is believed that the HR
is perceived as an internal service provider which is considered to play a key part of the company’s
strategic development and performance (Barney and Wright, 1998; Iwu, et al., 2013). In addition,
there has been an increasing demand that HR has to respond and meet managers changing
18
expectations (Floyd and Lane, 2000). Consequently, academic interest in HRIS application has
increased, as several special issues of HR-related journals demonstrate (Strohmeier, 2007).
HR and IT are the two elements that many organisations are learning to use as strategic weapons to
compete (Jenkins and Lloyd, 1985). To capitalize on the synergy between these two assets, human
resource information systems (HRIS) is an emerging area that may lead human resource
management into a new era (Lin, 1997).
The reality of the situation of IT in HR in Jordan offers a unique context. There are changes taking
place in the IT landscape of Jordan. While Jordan is a regional hub of IT expertise and an important
market for corporations, there are lots of hurdles to be met with. This study considers where Jordan
stands in terms of IT applications implementation especially in the HR field and measuring the
effectiveness of HRIS in its major organisations (shareholding companies).
The basic theme of this study is based upon identifying the determinants of the adoption and the
implementation level of HRIS applications at the organisational level and its effectiveness. This is
very important for two main reasons. First, it provides some insights into the implementation of
HRIS by Jordanian companies, which should help HR practitioners, acquire a better understanding
of the current status, benefits, and barriers to the implementation of HRIS. Many companies have
identified the need to transform the way HR functions are performed in order to keep up with new
technology and increasing numbers of employees. Second, the proliferation of IT and its
applications in recent years has precipitated the need for cost-benefit analysis on the part of
organisations. An organisation must evaluate the potential advantages and disadvantages of
investment in IT (both hardware and software) applications before deciding to adopt them. HR
professionals should be informed about the advanced state of HRIS applications in Jordan, while
some general insights are offered concerning which kind of organisations should take HRIS
adoption into consideration.
This study mainly focus on isolating those factors affecting the adoption and implementation level
of information technology management system (HRIS) applications from the viewpoint of HR
managers and its effectiveness in shareholding companies in Jordan. Based upon a review of
literature a conceptual framework has been developed, which proposes that the interaction of the
internal and external environmental factors affects the adoption and practice of HRIS applications
and the effectiveness of the latter on business organisations.
1.2 Problem Statement
Over the past two decades, there have been extensive studies on the adoption and use of HRIS.
While some of them have examined the type of applications that dominate in HRIS (Grant and
Heijltjes, 1999; Nielson and Vallone, 2002), and the necessary antecedents for the successful

19
implementation of HRIS (Yeh,1997) as well as the conditions that support successful HRIS
(Haines and Petit, 1997), others have investigated the organisational adoption (Panayotopoulou and
Galanaki, 2007; Lau and Hooper, 2008).
Generally, the majority of these studies are tested in developed countries such as in Western
Europe and the US (Panayotopoulou and Galanaki, 2007), while studies in developing countries are
rare and restricted to a few countries. Given that most studies of HRIS implementation have been
based on cases in Europe and the US, cultural challenges, although complex, show some
consistency inconsistency. However, relatively few studies have been investigated outside of the
most developed countries, such as in Jordan, which is a beachhead for new technologies and
business practices in the Middle East and North Africa (MENA).
The context of MENA (specifically Jordan) is in numerous aspects strikingly different from the
West culturally. Although the notion of technology adoption is considered universal, there are a
certain restrictions in terms of the viability of technology models established in the Western world
when applied to non-Western cultures. Previous research on the adoption of IS has been
inconclusive regarding the applicability of a Western-developed model of technology adoption in
other cultures. For example, the influential cultural theorist Hofstede (2001) gave the Arab World
(based on data from Egypt, Iraq, Kuwait, Lebanon, Libya and Saudi Arabia, which are relatively
representative of culture throughout MENA) a high score of 68 for Uncertainty Avoidance Index
(UAI), which means that it can be concluded that Arab society preserves rigid codes of belief and
behaviour and people are generally intolerant of unusual behaviour and ideas which leave them
with a high preference for avoiding uncertainty and anxiety about the future. This means that
people in the Arab World, according to the UAI index, are reluctant and less likely to adopt new
technologies, behaviours or beliefs; they are correspondingly afraid of change and likely to resist it.
Therefore, this study examines the applicability of HRIS models in Jordan, a non-western country.
Furthermore, (Wejnert, 2002) revealed that the previous studies show that a broad array of factors
can significantly influence the probability of whether an organisation will adopt HRIS or not.
Analyses of these studies showed that these diffusion factors were examined independently for the
sake of clarity; however, in reality they might exert their effects on the process of diffusion
interactively. The interaction between factors can be either potentiating or mitigating, and the
relative weight of each variable may change according to the circumstances characterizing the
innovation and its context (Wejnert, 2002).
Reviews of previous studies also suggest that HRIS results are inconsistent. For example, Downs
Jrand Mohr (1976) stated that the variation of results among studies of innovation is extreme and
beyond interpretation. Wolfe (1994) claimed that the most consistent result of innovation research
is that the results are inconsistent. Drazin and Schoonhoven (1996) stated that “innovation research
20
demonstrates little in the way of common theoretical underpinnings to guide its
development”p.1066.
It is worth mentioning studies identifying environmental factors (i.e. internal and external) that
determine organisations’ need for and practice of the HRIS applications at the firm level are
limited, and consequently our understanding of why some organisations adopt HRIS applications
and techniques and others is incomplete (Yu and Tao, 2009). Furthermore, the importance of the
adoption of high quality HRIS applications and the risk and costs associated with implementation
such systems are debatable.
This study examines the determinants of the adoption and implementation of HRIS applications
and their effectiveness in shareholding companies in Jordan. A better understanding of these
influential factors that are associated with implementation of HRIS applications at the firm level
might be extremely useful for business decision-makers. The knowledge of these factors which
determine the adoption of HRIS behaviour at the firm level could influence the type of changes that
should be considered within their organisations and also might help the HR unit in these
organisations to improve and to enhance the effectiveness of the use of HRIS applications.
1.3 Research Aim, Objectives and Questions
The research aims to enhance knowledge and understanding the environmental factors that
influence the adoption and practice of HRIS applications and its effectiveness in developing
countries with particular reference to the Jordanian business organisations.
Specifically, the key objectives of this study are as follows:
1. To identify the main environmental factors that influences the adoption of HRIS
applications in business organisations.
2. To find out which environmental factors can explain larger the variations of the level of
implementation of HRIS applications among business organisations.
3. To identify the relationship between the level of implementation of HRIS and its
effectiveness.
The specific questions to be examined are:
1. What environmental factors (internal or external or jointly) highly determine the
likelihood of adoption of HRIS in Jordanian business organisations?
2. Why have some firms adopted HRIS applications while others in the same industry have
not?
3. To what extent are IT system applications implemented by Human Resources
Management (HRM), and why do some firms implement HRIS applications more than
others?
21
4. How much influence does HRIS exert on the operational, relational, and transformational
aspects of HR?
5. What is the relationship between the level of implementation of HRIS and its
effectiveness?
1.4 The Significance of the Study
The major contributions of the present study can be summarized in the following points:
Based on an extensive literature search, this study is one of the few attempts undertaken
in MENA in general and Jordan in particular to identify the main determinants of the
practice of HRIS applications at the level of organisation and its effectiveness. Most
HRIS studies in Jordan have concerned non-business organisations and the individual
level.
An integrated conceptual framework is developed for the factors that determine the
organisation’s adoption and the level of practice of IT applications in HRM and
measuring its effectiveness. This framework integrates ideas and elements from the
Diffusion of innovation Theory (DOI) and technology organization environment (TOE)
model, the Unified Theory of Acceptance and Use of Technology (UTAUT) and the IT
studies in the area of HRM.
This study is a significant attempt to discover the level of HRIS implementation in Jordan
and the way it has shaped the role of HR. First, its target was to determine the level and
types of technologies applications that are used by HR in Jordan. Secondly, it has paid
attention to how HR professionals’ role has changed with the adoption of HRIS
applications. Thirdly, it has identified drivers of the adoption of technology in HRM, and
evaluated drivers’ adoption, critical success factors for implementation and finally
identified the key issues that affected the performance of the whole system. Therefore,
this study will be beneficial to different interested parties, especially to the top
management of large companies, HR managers and academics.
Top management could use this study’s findings in decision-making for adopting such
technology. Additionally, the study could support HR managers in two ways: it enables
HR managers in Jordan to adopt HRIS applications confidently; and it helps to build HR
divisions as strategically important sections of modern businesses. Finally, it could help
academics to realize the background of the HRIS adoption in the context of developing
countries (particularly MENA) and the relationship between HRIS applications and their
value.
22
Non-transferability of findings from research in developed countries is not the only
reason for the necessity of this study; it is also inspired by the limited understanding of
what drives HRIS adoption among businesses in developing countries, alongside the
manifest need for more research to improve understanding of the drivers of HRIS in
developing countries. Gathering empirical evidence from different environments will
make it possible to generalize concerning the adoption of HRIS. Yeung, Brockbank and
Ulrich (1994) indicated that it is highly likely that the adoption of technology in HR will
continue to grow and all companies will eventually adopt a total technological solution
approach to deliver HR services, and those who have already been on this path for some
time will continue to expand and upgrade their systems to deliver their services more
efficiently. If that is the case, the number of researches regarding the adoption of
technology in HR and its impact should continue to grow.
1.5 HRIS Overview: Definition and Implications
1.5.1 Definition of HRIS
Recent research has revealed quite a number of definitions of HRIS, stemming from the seminal
definition promulgated by DeSanctis (1986): “a systematic procedure for collecting, storing,
maintaining, retrieving, and validating data needed by an organisation about its human resources,
personnel activities, and organisation unit characteristics. It is generally a collection of databases
that integrate together to form a vast record of all employee issues that exist within a company. Its
development has been evolutionary”. (DeSanctis, 1986. p16).
Bohlander & Snell (2011) define "human resources information systems as a system that develops
current and accurate information for decision-making and monitoring. As they report, according to
a recent survey, most of applied information technology has been to maintenance staff’s
information, monitoring salary operations, keeping information about absences and doing
administrative affairs and employment and training programs. Computerized system is just for
collecting, storing, maintaining, retrieving organization’s required data about its employees. In
addition to above usages they are developed to help planning, administrative functions, decision
making and controlling human resource management activities.
1.5.2 HRIS Applications
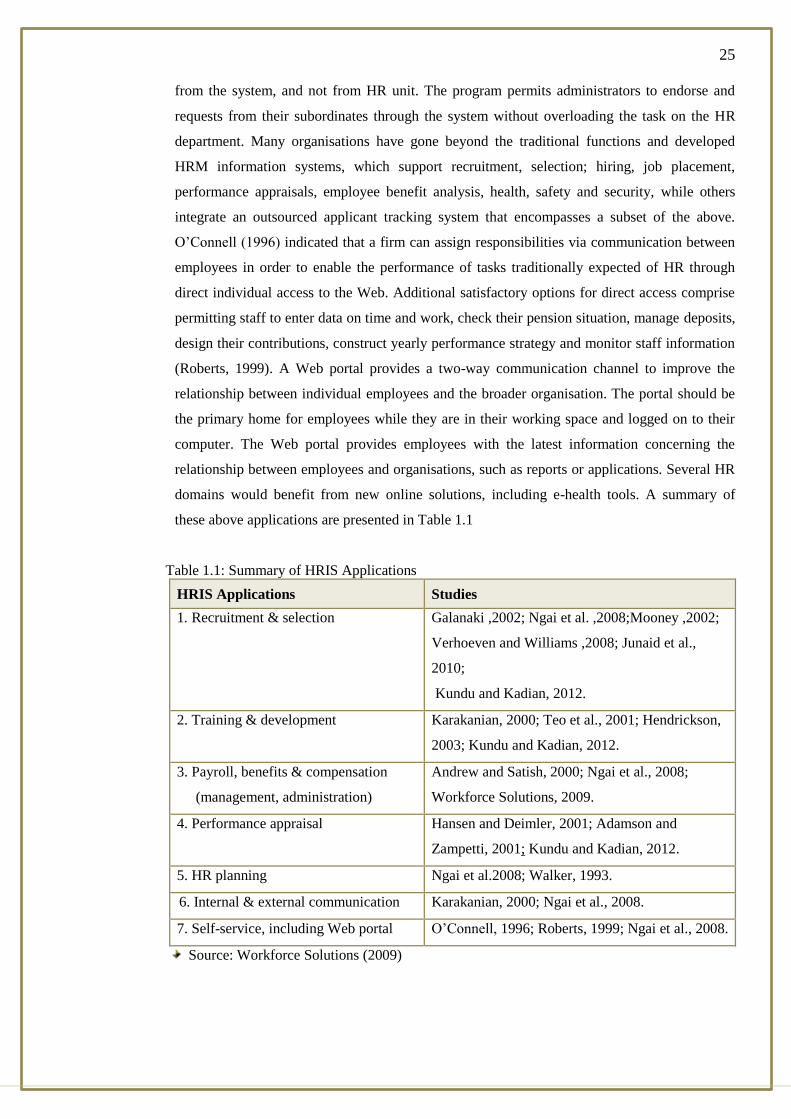
1. Recruitment and Selection: One of the main activities of HRM is staffing. Staffing is
important because it provides a supply of individuals needed to fill the jobs within an
organisation necessary to achieve business objectives. Once HR professionals have undertaken
job analysis, a job description can be prepared. This job description is used when recruiting

23
individuals. E-recruiting, or Internet recruiting, is one of the methods available to HR
professionals that may be integrated with HRIS.
2. Training and development: Provides a system for organisations to administer and track
employee training and development efforts. The system, normally called a learning
management system (LMS), if a standalone product, allows HR to track education,
qualifications and skills of the employees, as well as outlining what training courses, books,
CDs, Web based learning or materials are available to develop which skills. Courses can then
be offered in date-specific sessions, with delegates and training resources being mapped and
managed within the same system. Sophisticated LMS allows managers to approve training,
budgets and calendars alongside performance management and appraisal metrics. Research on
HRM (Kirrane, 1990) defines the employment of Web access in staff training and professional
growth. Web-based training (WBT) is a common method of self-education through computer
programs, the Web and the different networks. Advances in Web technologies in recent years
provide a promising new avenue for the development of training support applications.
Attributes such as instant communication and capability to send information back and forth
without errors are two important advantages of incorporating Web technologies in training
needs assessment. (Meade, 2000) emphasized that Web-based HRIS software provides self-
service convenience to the employees and managers via the Internet for mutual
communication.
3. Payroll Administration: The payroll module automates the pay process by gathering data on
employee time and attendance, calculating various deductions and taxes, and generating
periodic pay cheques and employee tax reports. This module can contain the entire staff-related
business, and can also conjoin with the finance administrative units established some time
before a firm applied an HRIS. The administration of traditional payrolls comprised a tiresome
and time-consuming task that could be liable to error, taking into consideration the many
details needed, such as the original wage minus or plus different payments. An HRIS can
streamline this process; generally the payroll staff member only needs to enter the hours
worked (or possibly not even that for companies using an electronic time clock integrated with
the HRIS), and then the system will use a series of steps and procedures to do all of the
calculations for the employer. Paycheques are then quickly printed and distributed.
4. Benefits Administration: The management of the general staff benefit policies in large
organisations requires a huge amount of written work and information, something that can be
more efficiently performed if an HRIS is employed. The system can track benefit eligibility
dates, trigger reports to remind HR to notify employees, allow benefit choices to be quickly
inputted, and deductions can be triggered on the payroll side of things, all of which reduces the
24
communication and paper flow between HR and payroll staff and reduces the likelihood of
errors being made at any step in the process.
5. Compensation Management/Administration: Provides a system for organisations to
administer and track employee participation in benefits programs. These typically encompass
insurance, compensation, profit sharing and retirement. This process needs all sorts of
information to be gathered and administered, especially the nature of the accident or sickness,
the individuals implicated, medical reports, regulations controlling staff behaviour, and
government information, etc. (Hendrickson, 2003). Studies of the payroll interface have been
conducted for areas such as record keeping, pension calculations, and retiree payments and
statements (e.g. Andrew and Satish, 2001). The Internet provides a real-time way of allowing
employees to review information on the breakdown of salaries, deductions and accumulated
balances. Organisations gather data on salary, wages and other benefits to streamline inputs to
the payroll, benefits and compensation application online.
6. Performance Appraisal: Although relatively few research studies have focused on the online
application of performance appraisal (Hansen and Deimler, 2001), the Internet plays an
important role in reducing the effort and agony of managing performance evaluation.
Normally, staff members have their performance reviewed periodically. Performance reviews
become immediately available to those involved, including supervisors, colleagues, clients and
others.
7. HR Planning: Effective HR planning is the process or system that assigns the correct number
of qualified employees to the right task at the right time. One reason for the increased use of
the Internet to support HRM is that the Internet is essential if HR managers are to achieve
business-related goals (Walker, 1993). These technological changes are thought to increase the
ability of HR practitioners to monitor the workforce, produce reports easily, utilize employee
skills effectively and even reduce labour costs.
8. Internal and External Communication: The Internet and intranets provide effective channels
for organisations to enhance the process of internal and external communication. Concerning
internal communication, staff can directly contact each other at the entire hierarchical structure
of the firm. They can access up-to-date and relevant information when they connect to the
Internet. Externally, individuals can use the Internet to link and share data across other
departments in different branches, including internationally (Karakanian, 2000).
9. Self-Service (including Web portal): Permits staff to request HR information and conduct
some HR requirements through the system. Staff may request their attendance reports directly
25
from the system, and not from HR unit. The program permits administrators to endorse and
requests from their subordinates through the system without overloading the task on the HR
department. Many organisations have gone beyond the traditional functions and developed
HRM information systems, which support recruitment, selection; hiring, job placement,
performance appraisals, employee benefit analysis, health, safety and security, while others
integrate an outsourced applicant tracking system that encompasses a subset of the above.
O’Connell (1996) indicated that a firm can assign responsibilities via communication between
employees in order to enable the performance of tasks traditionally expected of HR through
direct individual access to the Web. Additional satisfactory options for direct access comprise
permitting staff to enter data on time and work, check their pension situation, manage deposits,
design their contributions, construct yearly performance strategy and monitor staff information
(Roberts, 1999). A Web portal provides a two-way communication channel to improve the
relationship between individual employees and the broader organisation. The portal should be
the primary home for employees while they are in their working space and logged on to their
computer. The Web portal provides employees with the latest information concerning the
relationship between employees and organisations, such as reports or applications. Several HR
domains would benefit from new online solutions, including e-health tools. A summary of
these above applications are presented in Table 1.1
Table 1.1: Summary of HRIS Applications
HRIS Applications Studies
1. Recruitment & selection Galanaki ,2002; Ngai et al. ,2008;Mooney ,2002;
Verhoeven and Williams ,2008; Junaid et al.,
2010;
Kundu and Kadian, 2012.
2. Training & development Karakanian, 2000; Teo et al., 2001; Hendrickson,
2003; Kundu and Kadian, 2012.
3. Payroll, benefits & compensation
(management, administration)
Andrew and Satish, 2000; Ngai et al., 2008;
Workforce Solutions, 2009.
4. Performance appraisal Hansen and Deimler, 2001; Adamson and
Zampetti, 2001; Kundu and Kadian, 2012.
5. HR planning Ngai et al.2008; Walker, 1993.
6. Internal & external communication Karakanian, 2000; Ngai et al., 2008.
7. Self-service, including Web portal O’Connell, 1996; Roberts, 1999; Ngai et al., 2008.
Source: Workforce Solutions (2009)

26
1.6 Thesis Overview
This thesis is composed of nine chapters. The content of these chapters is briefly outlined below
and illustrated in (Figure 1.1):
Chapter One: Provides an introduction to the thesis, starting the importance of HRIS
applications to the business organisations, the research problem, research objectives, and the
significance of the thesis.
Chapter Two: Primarily focuses on the existing literature related to adoption and
implementation of HRIS and its effectiveness. The main findings and limitations of the
previous research are presented.
Chapter Three: Presents the research conceptual framework. It details the main constructs of
the study’s framework; the study hypotheses are formulated and proposed in this chapter.
Chapter Four: Explains the research design and data collection. This chapter evaluates the
alternative methods of data collection and provides the basis and rationale for selecting an
appropriate method. The selection of the scale of measurement, the key respondent approach,
the domain of the study’s population and questionnaire development are also presented.
Chapter Five: Presents the methodology of analysis. The chapter starts with a review of the
alternative statistical techniques available, the epistemological assumptions behind these
methods and the basis for the selection of the appropriate techniques. The chapter gives a
description of this analysis and the justification of the use in the research.
Chapter Six: Presents the research findings related to the main pattern of factors that underlie
each construct of firms’ internal and external environmental dimensions.
Chapters Seven and Eight: Discuss the research findings and interpret them in relation to the
determinants of the adoption of HRIS and the level of implementation and its effectiveness.
Chapter Nine: Gives a summary review of the entire study and presents the main conclusions
of the research and its implications for business decision-makers. The research contributions
in terms of theory and practice also presented, recommendations for potential adopters of
HRIS, Research limitation and area for further information are discussed.

27
Figure 1.1: Thesis Structure
1.7 Summary
This chapter has provided an introduction to the issues that this research has been designed to
address. The research topics were organized as: 1) The research background; 2) research problem;
3) research aim; 4) research questions; 5) main area of the study and the significance of the study;
and 6) the HRIS definition and applications, the outline of the thesis. The next chapter will present
a review of literature, as well as the theoretical model for this study.

28
LITERATURE REVIEW CHAPTER 2:
2.1 Introduction
In the previous chapter, the research problem, the research aim, objectives and questions, the
significance of the research and the applications of HRIS were presented. This chapter presents and
discusses empirical studies relating to the adoption and implementation of HRIS by means of a
content analysis of the findings of studies concerning HRIS and its effectiveness; the literature
review is then used to inform the development of a conceptual framework with which to conduct
this study. This framework consists of integrated literature and models of innovation adoption,
implementation and effectiveness of HRIS at the firm level (i.e., diffusion models and empirical
studies of HRIS).
2.2 Diffusion Theories and Models at the Firm Level
IT is considered as an important tool in developing and enhancing the competitiveness of the
economy of a country as well as the productivity of business organisations. These improvements
will only be achieved if, and when, IT applications are widely spread and practiced. Researchers
have found that the way that IT organisations manage their IT professionals is related to important
outcomes, including productivity, turnover, and satisfaction (Nag and Slaughter, 2004; Ferret et.
al., 2005), as well as the implementation of HRM practices, such as those related to career
development, pay, and job security. The technology has been used to change the traditional
processes, either through increasing their efficiency or their capability in the sense of greater
functionality (Hendrickson, 2003). Therefore, various theoretical studies have developed the
understanding of IT diffusion, adoption, acceptance and implementation (Davis, 1989; Rogers,
1995; Rogers and Signal, 2003; Venkatesh et. al., 2003).
However, in this study, the only theories for adoption and diffusion models at the organisational
level used in management information systems (MIS) literature reviewed and presented with
respect to HRIS are: Diffusion of Innovation (DOI) theory, the Technology, Organisation, and
Environment (TOE) framework and Unified of Acceptance and Use of Technology (UTAUT). The
other models such as the Technology Acceptance Model (TAM) (Davis, 1989) and the Theory of
Planned Behaviour (TPB) (Ajzen, 1985; Ajzen, 1991; Venkatesh et al., 2003) are mainly used at
the individual level. As all of these theories were mainly developed in a Western context, a
consideration of the appropriateness of HRM for developed countries (e.g. the US and the UK) in a
non-Western context is faced by the inherent difficulty in assuming that Western-developed
theories can be applied in culturally divergent situations. In these circumstances, a critical question
arises: what are the main factors influencing the HRIS adoption, diffusion and its effectiveness at
the firm level in non-Western countries such as Jordan?
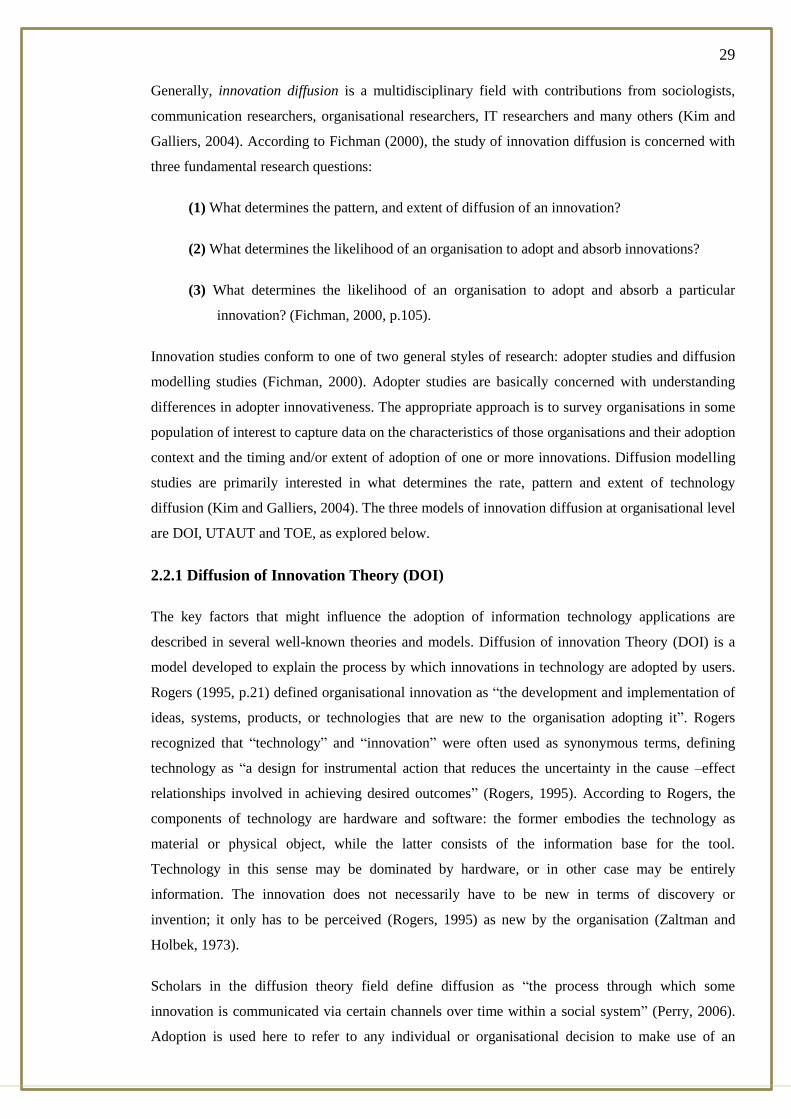
29
Generally, innovation diffusion is a multidisciplinary field with contributions from sociologists,
communication researchers, organisational researchers, IT researchers and many others (Kim and
Galliers, 2004). According to Fichman (2000), the study of innovation diffusion is concerned with
three fundamental research questions:
(1) What determines the pattern, and extent of diffusion of an innovation?
(2) What determines the likelihood of an organisation to adopt and absorb innovations?
(3) What determines the likelihood of an organisation to adopt and absorb a particular
innovation? (Fichman, 2000, p.105).
Innovation studies conform to one of two general styles of research: adopter studies and diffusion
modelling studies (Fichman, 2000). Adopter studies are basically concerned with understanding
differences in adopter innovativeness. The appropriate approach is to survey organisations in some
population of interest to capture data on the characteristics of those organisations and their adoption
context and the timing and/or extent of adoption of one or more innovations. Diffusion modelling
studies are primarily interested in what determines the rate, pattern and extent of technology
diffusion (Kim and Galliers, 2004). The three models of innovation diffusion at organisational level
are DOI, UTAUT and TOE, as explored below.
2.2.1 Diffusion of Innovation Theory (DOI)
The key factors that might influence the adoption of information technology applications are
described in several well-known theories and models. Diffusion of innovation Theory (DOI) is a
model developed to explain the process by which innovations in technology are adopted by users.
Rogers (1995, p.21) defined organisational innovation as “the development and implementation of
ideas, systems, products, or technologies that are new to the organisation adopting it”. Rogers
recognized that “technology” and “innovation” were often used as synonymous terms, defining
technology as “a design for instrumental action that reduces the uncertainty in the cause –effect
relationships involved in achieving desired outcomes” (Rogers, 1995). According to Rogers, the
components of technology are hardware and software: the former embodies the technology as
material or physical object, while the latter consists of the information base for the tool.
Technology in this sense may be dominated by hardware, or in other case may be entirely
information. The innovation does not necessarily have to be new in terms of discovery or
invention; it only has to be perceived (Rogers, 1995) as new by the organisation (Zaltman and
Holbek, 1973).
Scholars in the diffusion theory field define diffusion as “the process through which some
innovation is communicated via certain channels over time within a social system” (Perry, 2006).
Adoption is used here to refer to any individual or organisational decision to make use of an

30
innovation, while diffusion indicates the extent to which users of an innovation in a market has
reached (Rogers, 1995). A number of factors interact to influence the diffusion of an innovation.
The four major factors that influence the diffusion process according to Rogers (1995) are:
Type of innovation (e.g., optional, collective, or authoritative)
Communication channel (e.g., mass media or interpersonal)
Time
Nature of social system (e.g., norms, degree of network interconnectedness).
The innovation adoption process is defined as:
“The process through which an individual or other decision making unit passes from
first knowledge of an innovation, to forming an attitude toward the innovation, to a
decision to adopt or reject, to implementation of the new idea, and confirmation of this
decision”. (Rogers and Coleman, 2003, p. 168).
The implementation stage occurs when an organisation actually puts an innovation into use (Rogers
and Coleman, 2003). Implementation is the “critical gateway between the decision to adopt the
innovation and the routine use of the innovation” (Klein and Sorra, 1996, p.1074) these stages of
the process are Knowledge, Persuasion, Decision, Implementation, and Confirmation, as outlined
below (Figure 2.1):
Figure 2.1: Model of Stages in the Innovation-Decision Process
Source: Rogers and Coleman (2003)

31
Knowledge: Occurs when an individual is exposed to the innovation’s existence and
gains some understanding of how it functions. During this stage of the process the
individual has not been inspired to find more information about the innovation.
Persuasion: Occurs when an individual forms a favourable or unfavourable attitude
toward the innovation.
Decision: Occurs when an individual engages in activities that lead to a choice to adopt
or reject the innovation.
Implementation: Occurs when an individual puts an innovation into use.
Confirmation: Occurs when an individual seeks reinforcement of an innovation decision
or reverses the previous decision due to the conflict (Rogers, 1995).
However, Rogers’ five-stage model of innovation adoption and implementation in organisations
(Rogers, 1995) differs from his model of individual innovation adoption and implementation.
Roger’s five-stage model of innovation adoption and implementation in organisations corresponds
to initiation (stages 1-2) and implementation (stages 3-5). Initiation is understood here to include
agenda-setting (problem identification) and matching (fitting an innovation to a predefined
problem), while implementation includes making changes to both the organisation and the
innovation to exploit the innovation through redefining/restructuring, clarifying, and routinizing.
With respect to the adoption at the organisational level, commonly two main stages can be
distinguished: initiation and implementation (Zaltman, and Holbek, 1973; Gopalakrishnan and
Damanpour 1997). The actual adoption decision takes place between the initiation and the
implementation phases. In this context, in the initiation stage, the organisation discovers the
innovation, forms an attitude towards it and evaluates it (Gopalakrishnan and Damanpour 1994); it
consists of the awareness, consideration and intention stages. In the implementation stage, the
organisation decides to make use of the innovation. The innovation process can only be considered
a success when the innovation is accepted and integrated into the organisation and the target
adopters demonstrate commitment by continuing to use the product over a period of time
(Parthasarathy and Bhattacherjee, 1998).This concept is consistent with Rogers (1995, p. 21), who
defines adoption as “the decision to make full use of an innovation as the best course of action
available”. Therefore, the full and actual adoption of innovations at an organisational level implies
that adoption also occurs within the organisation at the individual level. The contingent innovation
decisions or “forced adoption” refers to the instance where the implementation of an innovation by
organisational “ultimate-users” is uncertain, and contingent upon the adoption decision of a former
organisation (Rogers, 1995. p.39).
Rogers (1995) related the time of adoption to the characteristics of the innovation. He identified the
five characteristics of an innovation that may affect its rate of diffusion: relative advantage,
complexity, compatibility, trialability, and observability. All these factors except complexity have a

32
positive relationship with the rate of adoption of technology (Zaltman and Holbek, 1973; Rogers,
1995). Rate of adoption is the relative speed with which an innovation is adopted by members of a
community system, usually measured by the number of individuals who adopt a new idea in a
specified period of time. In other words, it is a numerical indicator of the steepness of the adoption
curve for an innovation (Rogers, 1995). When potential adopters consider that the innovation has a
relative advantage and is compatible with their practices and needs, innovation of diffusion is
faster. This requires that potential adopters must learn about the innovation, be persuaded of its
merits, decide to adopt, implement the innovation, and confirm (reaffirm or reject) the decision to
adopt it (Rogers, 1995). Furthermore, individuals’ perceptions of the attributes of an innovation
affect the rate of adoption.
Rogers’ perceived attributes of an innovation have been the focal point of many studies, especially
those related to potential users’ perceptions of IT innovation and its influence on adoption. Rogers
and Singhal (2003) described the five attributes as:
Relative advantage: “the degree to which an innovation is perceived as being better than the
idea it supersedes”.
Compatibility: “the degree to which an innovation is perceived as consistent with the existing
values, past experiences, and needs of potential adopters”.
Complexity: “the extent to which an innovation is perceived as difficult to understand and use
considering various dimensions, such as the extent to which an innovation can be implemented
on a limited basis, the difficulty associated with understanding the innovation, and the extent of
newness of the innovation”. (Gopalakrishnan and Damanpour, 1994).
Trialability: “the degree to which an innovation can be tried on a limited scale before an
adoption decision is made”.
Observability: “the degree to which the results of an innovation are visible to others”. This last
factor is sometimes termed communicability by other researchers (Daniel, 1998).
It should be noted that among the aforementioned attributes, only relative advantage, compatibility
and complexity are consistently related to innovation adoption. According to Eastin (2002), these
attributes are interdependent. While the diffusion model provides a framework by which to study a
given innovation, each innovation differs and so it should be conceptualized based on its specific
attributes (Eastin, 2002).
Rogers (1995) defined a Social System (Figure 2.2) as a set of interrelated units that is engaged in
joint problem-solving to accomplish a common goal. The members of units of a social system may
be individuals, informal groups, organisations structure, and/or subsystems. The unit of adoption at
the organisational level is the organisation while the organisation’s external environment stands for
the social system. In this study, the HRIS user firm in Jordan stands for the unit of adoption and the

33
HRIS user organisations’ external environment such as competition, governmental policies, and
technological support is considered as the social system.
To apply this theory at the organisational level, innovativeness is related to such independent
variables as characteristics leader (individual), internal organisational structural characteristics, and
external characteristics of the organisation (Rogers, 1995). (Figure 2.3) exhibits these variables.
Individual characteristics: describe the leader’s attitude toward change.
Internal characteristics of organisational structure : includes observations according
to Rogers (1995) whereby: “centralisation is the degree to which power and control in a
system are concentrated in the hands of a relatively few individuals”; “complexity is the
degree to which an organisation’s members possess a relatively high level of knowledge
and expertise”; “formalisation is the degree to which an organisation emphasizes its
members’ following rules and procedures”; “interconnectedness is the degree to which
the units in a social system are linked by interpersonal networks”; “organisational lack is
the degree to which uncommitted resources are available to an organisation”; and “size is
the number of employees of the organisation”.
External characteristics of organisational: refer to system openness (Oliveira and
Martins, 2011).
Figure 2.2: Diffusion of Innovation Model
Source: Rogers (1995)

34
Figure 2.3: Diffusion of Innovation
Source: Rogers (1995)
However, Rogers (1995) indicated that innovations requiring an organisation innovation decision
are generally adopted less rapidly than an individual optional decision, as the more individuals are
involved in making a decision the slower the rate of adoption is. To accelerate the rate of adoption,
fewer individuals should be involved. Additionally, when interpersonal communication channels
are used rather than mass media channels, the rate of adoption is slowed. In addition, social system
norms and network connectedness, agents’ promotion efforts and changes within such efforts also
affect the rate of adoption of an innovation at any stage of the process (Rogers and Singhal, 2003).
According to Rogers (1995), there are five types of innovation adopters: (1) innovators; (2) early
adopters; (3) early majority; (4) late majority; and (5) laggards. Innovators are the fastest adopters
while laggards are the slowest.
Ellsworth (2000) pointed out that the most critical benefits of Rogers’ model are the innovation
attributes: “Practitioners are likely to find this perspective of the greatest use if they are engaged in
the actual development of the innovation or if they are deciding whether (or how) to adapt the
innovation to meet local requirements…Rogers’ framework can be useful in determining how it is
to be presented to its intended adopters” Ellsworth (2000 p.40). Rogers’ model identified the
critical components in the change system and their characteristics. The model is relatively
systematic because the consequence of the change is confined with a predetermined “innovation”

35
(i.e. a predetermined goal). The interrelationship and dynamic exchange between the components
in the change system are not expected to contribute to the continuous shaping of the vision, but to
be controlled to adopt a desirable idea, object, or program.
Innovation diffusion research has also been characterized as rational and interpretive (Fichman and
Kemerer, 1999; Beynon and Williams, 2003), and Rogers’ diffusion of innovation theory (DOI) is
one of the most widely used rational theories (Rogers, 1995). Many previous studies have built
their theoretical premises around Rogers’s diffusion of innovation theory, which states that
observed adoptions are largely prompted and determined by key innovation attributes that have
been communicated to potential adopters. This theory encompasses an innovation (technology)
emphasis and has primarily arisen to explain or predict innovation (technology) adoption by an
individual or organisation (Tornatzky and Klein, 1982). Fichman noted that:
“while much of classical diffusion theory is still applicable to adoption of innovations by
organisations modifications and extensions are needed because: (1) some classical variables
do not map cleanly to the organisational level of analysis (e.g., adopter characteristics) (2)
the organisational adoption of an innovation is not typically a binary event, but rather, one
stage in a process that unfolds over time, and (3) the organisational decision process,
particularly in the absence of a dominant individual decision maker, frequently involves
complex interactions between vested stakeholders”. (Fichman, 1992, p.4).
Rogers (1983) provided a useful summary of early research on organisational diffusion and
highlighted factors such as individual leader characteristics (e.g., attitude towards change) as well
as organisational structure (e.g., centralisation, formalisation, and organisational slack). However,
Fichman and Kemerer stated that:
“No single theory of innovation exists, nor does it seem likely one will emerge. The closest the
field has come to producing such as theory is Rogers’ classical model of diffusion (Rogers,
1995) . However, while this model has quite rightly had a profound role in shaping the basic
concepts, terminology, and scope of the field, it does not nor does it aim to apply equally well
to all kinds of innovations in all adoption contexts”. (Fichman and Kemerer, 1999. p. 45)
A review of literature conducted by Oliveira and Martins (2011) found that several authors used the
DOI theory to understand different IT adoptions, such as material requirements planning (Cooper
and Zmud,1990), Intranet (Eder and Igbaria, 2001), website (Beatty et al., 2001), e-business (Zhu
et al., 2006) and enterprise resource planning (Bradford and Florin, 2003). The literature shows that
the DOI theory has a solid theoretical foundation and consistent empirical support (Premkumar and
King, 1994; Beatty et al., 2001; Zhu et al., 2006). This theory is helpful for studying a variety of IS
innovations (Moore and Benbasat, 1991).
In sum, DOI theory tries to explain the innovation decision process, factors determining the rate of
adoption, and categories of adopters. It helps in predicting the likelihood rate of adoption of an
innovation. Nevertheless, it has been argued that the theory does not provide evidence on how

36
attitude evolves into accept/reject decisions, and how innovation characteristics fit into this process
(Karahanna and Chervany, 1999).
Brancheau and Wether be argued that Rogers’s innovation adoption theory did not provide a
complete explanation for technology adoption and implementation in organisations; furthermore,
while HRIS may have new characteristics compared to other IT innovations, the impacts of HRIS
innovation characteristics deserve attention, but have not been fully understood in the HRIS context
at the organisational level (Brancheau and Wetherbe, 1990). In addition, it has been noted that
''much of the existing research has focused on the adoption decision and on measures such as
‘intent to adopt’ and ‘adoption versus non-adoption’'' (Zhu and Kraemer, 2005 p.62). This would
be helpful for understanding adoption decisions, but there is a need for better understanding of the
adoption and post-adoption variations in implementation and effectiveness. This study focuses on
adoption and post- adoption stages (implementation and impact).
2.2.2 Unified Theory of Acceptance and Use of Technology (UTAUT)
Studies on MIS have been performed for many years to identify and assess organisational
characteristics that lead to the success or failure of IS (Ginzberg, 1981). Furthermore, a number of
theoretical models have been proposed to identify the main factors influencing the acceptance of
information technologies (Davis, 1989; Chau, 1996; Venkatesh and Davis, 2000). Each theory or
model has been widely tested to predict user acceptance (Thompson and Howell, 1991; Venkatesh
and Davis, 2000). However, no comprehensive instrument to measure the variety of perceptions of
information technology innovations existed until Venkatesh et al. (2003).
Venkatesh et al. (2003) noticed that IS or IT researchers were bound to choose constructs across
models or choose a favoured model when confronted with a choice among a multitude of models,
hence ignoring the contribution from alternative ones. They felt the need for a synthesis in order to
reach a unified view of users’ technology acceptance. They reviewed and compared the eight
dominant models that have been used to explain technology acceptance behaviour: the Theory of
Reasoned Action (TRA), Technology Acceptance Model (TAM), Motivational Model (MM),
Theory of Planned Behaviour (TPB), Model Combining the Technology Acceptance Model and
Theory of Planned Behaviour (C-TAM-TPB), Model of PC Utilisation (MPCU), Innovation of
Diffusion of innovation Theory (DOI), and Social Cognitive Theory (SCT). Upon review, the
authors reported five limitations of prior model tests and comparisons and addressed them in their
work:
1. The technologies studied were simple and individual-oriented as opposed to complex and
sophisticated organisational technology.
2. Most participants in these studies were students (except for a few studies).

37
3. Time of measurement was general and in most studies well after acceptance or Rejection of
the usage decisions so individuals’ reactions were retrospective.
4. The nature of measurement was in general cross-sectional; most of the studies were
conducted in voluntary usage contexts, making it rather difficult to generalize results to mandatory
settings (Venkatesh et al., 2003).
As result, they developed the UTAUT model to consolidate previous TAM related studies.
(Figure 2.4) presents Venkatesh et al.’s (2003) UTAUT model, and provides a brief description of
each independent variable and the underlying models from which they are derived.
Figure 2.4: Unified Acceptance of Technology
Source: Venkatesh et al. (2003)
The four constructs in the model were defined and related to similar variables in the eight models
as follows:
Performance expectancy: “the degree to which an individual believes that using the
system will help him or her to attain gains in job performance”. (Venkatesh et al., 2003, p.
447).
Effort expectancy: “the degree of ease associated with the use of the system”. (Venkatesh
et al., 2003, p. 162) .
Social influence: “the degree to which an individual perceives that important others
believe he or she should use the new system” (Venkatesh and Davis, 2000, p. 451)
Facilitating conditions: “the degree to which an Individual believes that an organisational
and technical infrastructure exists to support use of the system” (Venkatesh and Davis,
2000, p. 453).

38
The UTAUT explains user intentions to use an IS and subsequent usage behaviour. The theory
holds that four key constructs (performance expectancy, effort expectancy, social influence, and
facilitating conditions) determine of usage intention and behaviour (Venkatesh et al., 2003).
Empirically UTAUT explains as much as 70% of the variance in intention of individual acceptance
and usage decisions in organisations (Stahl and Maass2006). Moreover, the UTAUT model
attempts to explain how individual differences influence technology use. More specifically, the
relationship between perceived usefulness, ease of use, and intention to use can be moderated by
age, gender, and experience. These characteristics can be related to the position of user within the
firms (compulsory or optional). Lee (2001) concluded that the company’s innovation possessed
actual influence toward the adoption of information system.
Researchers believe that social factors, such as peer and social network, are likely to influence
individuals’ attitudes toward adoption. Therefore, social factors have been introduced in the
development of the model that is being empirically tested in the research, extending the TAM.
Notably, however, the UTAUT model discussed earlier also included social influence as an
important predictor of usage of innovation. The UTAUT structure model found social influence to
be a significant predictor of technology use (Venkatesh et al., 2003). Oliveira and Martins (2011)
stated that the UTAUT provides great promise to enhance our understanding for technology
acceptance, based on the initial UTAUT study focused on large organisations. However, the scales
used in UTAUT model are new, as they are in combination of a number of prior scales, and
therefore the suitability of these scales needs to be further tested.
Carlsson et al. (2006) pointed out that this framework was developed to describe and explain
organisational adoption of information technologies. They attempted to examine the adoption rates
by examining the applicability of the UTAUT in order to explain the acceptance of mobile
devices/services. Based on their empirical evidence from a survey conducted in Finland, they noted
that the UTAUT (to some extent, and with some reservations) can be used as a starting point to find
some explanations for the adoption of mobile devices/services, therefore some components of this
model will be used in this study to examine its validity and reliability with regard to the rate of
adoption of HRIS applications (Carlsson et al., 2006).
2.2.3 Technology-Organisation-Environment Framework (TOE)
The TOE framework was developed by Tornatzky and Fleischer (1990). It identifies the main three
contexts of an enterprise that influence the process by which it adopts and implements a
technological innovation: technological, organisational and environmental contexts.
The technological context includes the internal and external technologies that are relevant to the
organisation (Hedberg and Starbuck, 1976; Starbuck, 1983). This includes current processes,
equipment internal to the company as well as the set of available technologies external to the

39
company (Tornatzky and Fleischer, 1990). Troshani and Hill (2011) further explained that “the
technology context focuses on the manner in which technology characteristics can influence
adoption” (Lee, and Lee 2007, p.19). The context emphasis relates to the operationalisation and
potential realisation of benefits and current organisational capabilities of adoption (Tan et al.,
2009).
The characteristics of innovations are assessed by adopters in terms of “gains and barriers” (Chau
and Tam, 1997, p. 6). Gains pointed out to the benefits that the organisations expect to receive
upon adopting including increased levels of service quality, efficiency and reliability (Oliveira and
Martins, 2010). Barriers include innovation complexity and its compatibility with organisational
technology competency and legacy systems (Rogers and Coleman, 2003). The manner in which
innovation opportunities are exploited by organisations relies on the degree of match between
innovation characteristics and the practices and technological infrastructure that organisations
currently adopt (Moon and Ngai, 2008).
Among the factors that define the organisational context are the company’s size, degree of
centralisation, degree of formalisation, managerial structure and human resources and other
variables. Troshani and Hill (2011) observed that the adoption can be facilitated in organisations
that show a higher degree of centralisation, because top management can make adoption decisions
irrespective of resistance from lower level managers or employees (Lee and Lee, 2007;Jayasingam,
and Jantan, 2010). A supporting organisational setting, including a skilled workforce, is critical for
successful innovation adoption (Lin, 2006). The greater the support from top management, the
easier it will be for adopting organisations to overcome difficulties encountered during adoption
(Figueroa and González, 2007). Owing to financial advantages, larger organisations are more likely
to adopt innovations before smaller ones; however, the latter can be faster than larger organisations
in adopting innovations due to greater flexibility and adaptability factors (Barbosa and Musetti,
2010).
The environment context refers to the arena where organisations conduct their business, and
includes industry characteristics, government regulations and policies, competition pressure, and
supporting infrastructure (Tornatzky and Fleischer, 1990; Oliveira and Martins, 2011; Troshani and
Hill, 2011). Tornatzky and Fleischer (1990), Oliveira and Martins (2011) and Troshani et al. (2011)
indicated that these factors can present opportunities to encourage organisations or prevent them
from adopting innovations. Information about innovation must be available to prospective adopters
(Rogers and Singhal, 2003; Doolin, and Troshani, 2007). In addition, infrastructure and technical
support are also important requirements for innovation adoption (Chau and Hui, 2001), and
government intervention can also play an important role in encouraging technology adoption by
raising awareness, training and support, including funding (Chong and Ooi, 2008).
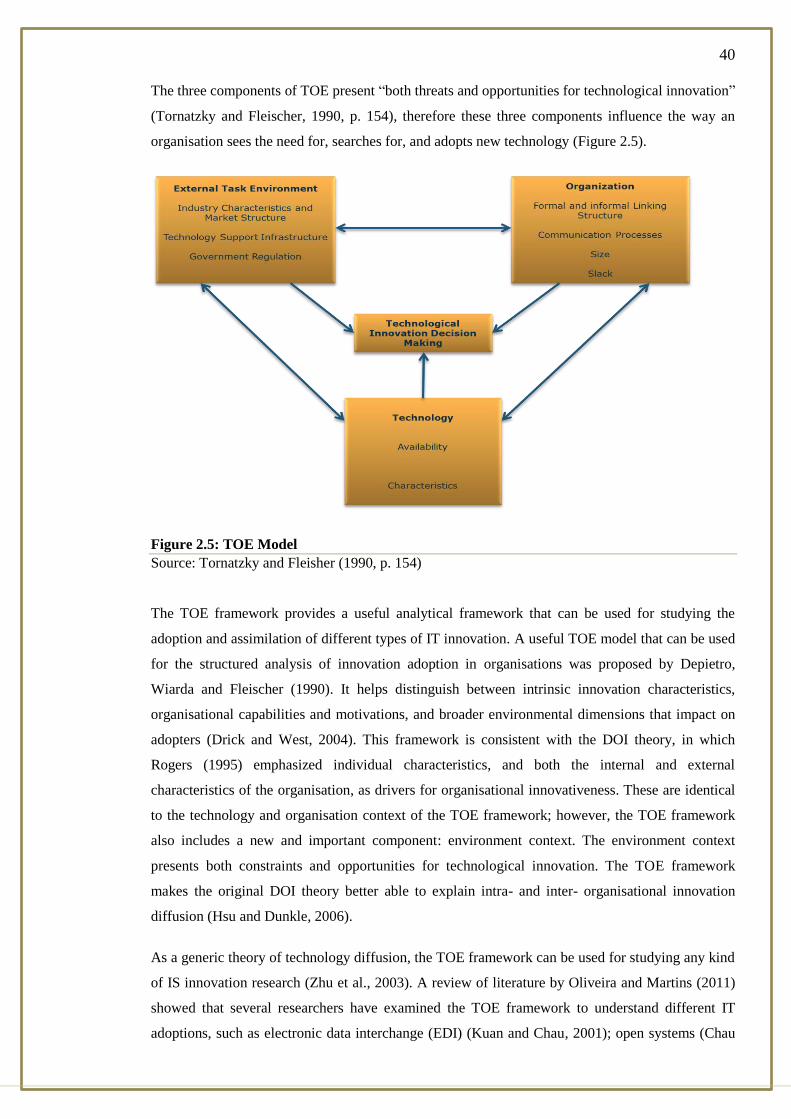
40
The three components of TOE present “both threats and opportunities for technological innovation”
(Tornatzky and Fleischer, 1990, p. 154), therefore these three components influence the way an
organisation sees the need for, searches for, and adopts new technology (Figure 2.5).
Figure 2.5: TOE Model
Source: Tornatzky and Fleisher (1990, p. 154)
The TOE framework provides a useful analytical framework that can be used for studying the
adoption and assimilation of different types of IT innovation. A useful TOE model that can be used
for the structured analysis of innovation adoption in organisations was proposed by Depietro,
Wiarda and Fleischer (1990). It helps distinguish between intrinsic innovation characteristics,
organisational capabilities and motivations, and broader environmental dimensions that impact on
adopters (Drick and West, 2004). This framework is consistent with the DOI theory, in which
Rogers (1995) emphasized individual characteristics, and both the internal and external
characteristics of the organisation, as drivers for organisational innovativeness. These are identical
to the technology and organisation context of the TOE framework; however, the TOE framework
also includes a new and important component: environment context. The environment context
presents both constraints and opportunities for technological innovation. The TOE framework
makes the original DOI theory better able to explain intra- and inter- organisational innovation
diffusion (Hsu and Dunkle, 2006).
As a generic theory of technology diffusion, the TOE framework can be used for studying any kind
of IS innovation research (Zhu et al., 2003). A review of literature by Oliveira and Martins (2011)
showed that several researchers have examined the TOE framework to understand different IT
adoptions, such as electronic data interchange (EDI) (Kuan and Chau, 2001); open systems (Chau
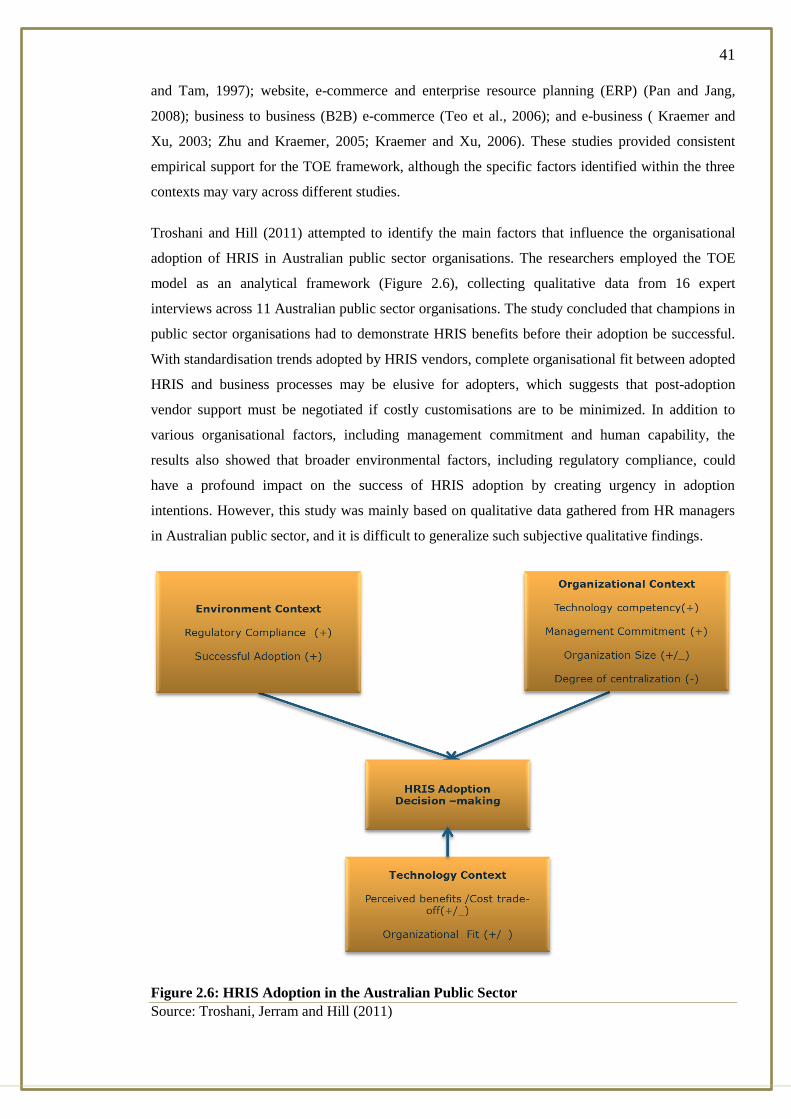
41
and Tam, 1997); website, e-commerce and enterprise resource planning (ERP) (Pan and Jang,
2008); business to business (B2B) e-commerce (Teo et al., 2006); and e-business ( Kraemer and
Xu, 2003; Zhu and Kraemer, 2005; Kraemer and Xu, 2006). These studies provided consistent
empirical support for the TOE framework, although the specific factors identified within the three
contexts may vary across different studies.
Troshani and Hill (2011) attempted to identify the main factors that influence the organisational
adoption of HRIS in Australian public sector organisations. The researchers employed the TOE
model as an analytical framework (Figure 2.6), collecting qualitative data from 16 expert
interviews across 11 Australian public sector organisations. The study concluded that champions in
public sector organisations had to demonstrate HRIS benefits before their adoption be successful.
With standardisation trends adopted by HRIS vendors, complete organisational fit between adopted
HRIS and business processes may be elusive for adopters, which suggests that post-adoption
vendor support must be negotiated if costly customisations are to be minimized. In addition to
various organisational factors, including management commitment and human capability, the
results also showed that broader environmental factors, including regulatory compliance, could
have a profound impact on the success of HRIS adoption by creating urgency in adoption
intentions. However, this study was mainly based on qualitative data gathered from HR managers
in Australian public sector, and it is difficult to generalize such subjective qualitative findings.
Figure 2.6: HRIS Adoption in the Australian Public Sector
Source: Troshani, Jerram and Hill (2011)
42
2.3 Overview Comments on the Adoption of Innovation Models
The reviewed adoption models (DOI, UTAUT and TOE) will be used and integrated as foundation
for the purpose of this study. These models were used as the primary theoretical foundation for a
lot of research projects on IT acceptance and use. Kishore (1999) reported that most empirical
studies in the IT adoption literature have based their research on either the DOI (Rogers, 1995) or
the UTAUT (Davis, and Warshaw, 1989). However, they are reported to show significant
shortcomings in their ability to capture the diffusion and adoption of IS applications. Kamal (2006,
P.34) reported that “most of the traditional models neglect the realities of implementing technology
innovations within organisations, especially when individual adoption decisions are made at the
organisational, division, or workgroup levels, rather than at the individual level”.
As mentioned previously, these adoption models have mostly been devised for and applied to
technology adoption in developed countries; technology adoption in developed countries might be
different from in developing countries, as the challenges are different in various contexts (Molla
and Licker, 2005). The social, cultural and economic conditions of developed and developing
countries are different (Molla and Licker, 2005), therefore developed countries’ technology
adoption model cannot be directly transposed to developing countries without modifications.
Humphrey et al. (2003) noted that in most developing countries, IT adoption has been inhibited by
the quality, availability and cost of accessing infrastructure (Humphrey et al., 2003).
In the context of developing countries, Williams and Edge (1996) indicated that two issues should
be considered: the effects of technology and external competitive conditions on HRM are not
deterministic, and there are several competing theories about how organisations are likely to
combine technology and human resources and empirical support can be found for all of them
(Clark et al., 1988); and countries differ in the underlying organizing principles and institutional
characteristics in which HRM philosophies and practices are embedded. Furthermore, much
empirical research has indicated that the influential factors are different in different countries
(Kraemer and Xu, 2003; Kraemer and Dedrick, 2004; Zhu and Kraemer, 2005). It is therefore
important to understand the factors that affect a firm’s decision regarding the adoption of
information systems.
Fichman (1992) claimed that while much of classical diffusion theory can be still applied to
adoption of innovations by organisations, modifications and extensions are needed because: (a)
some classical variables do not map cleanly to the organisational level of analysis (e.g., adopter
characteristics); (b) the organisational adoption of an innovation is not typically a binary event, but
rather one stage in a process that unfolds over time; and (c) the organisational decision process,
particularly in the absence of a dominant individual decision maker, frequently involves complex
interactions between vested stakeholders.
43
Socio-technical approaches claim that technological innovation should be examined within the
contexts in which they are embedded (Orlikowski and Barley, 2001). Moreover, to initiate adopting
or to start implementing innovation in an organisation, the IT innovation adoption process involves
a sequence of stages that organisations pass through before initiating a new technology. This can
explain and predict the influence of a wide range of factors on innovation adoption and
implementation decisions. The predictors include factors from the focal social system, the
perceived nature of the innovation itself, communication channels, and time. DOI is particularly
attuned to the reaction of social factors, organisational culture, communication patterns, and IT
innovation characteristics. Theoretically organisational innovation is best thought of as a
continuous variable. As there is no single measure that empirically captures the full extent of
organisational innovation at the firm level, researchers have used a wide array of indicators to assay
organisational innovation.
Fichman (1992) reviewed prior IT innovation studies and noted that classical innovation attributes
by themselves are not likely to be strong predictors of organisational technology adoptions,
suggesting additional factors are needed. Prior empirical studies anchored in innovation adoption
theory have produced findings of considerable inconsistency (Fichman, 1992). It has been claimed
that while the diffusion model provides a framework within which to study a given innovation,
each innovation differs and should be conceptualized based on its specific attributes (Eastin, 2002).
To a large extent, the observed differences may in part attribute to several reasons, including failure
to differentiate individual and organisational adoption and neglecting other essential contexts.
Wolfe (1994) also observed that “the most consistent theme found in the organisational innovation
literature is that its research results have been inconsistent”, a finding more recently confirmed by
Rye and Kimberly (2007), and a problem which stems from a lack of clearly “specifying the
characteristics of the innovation(s) studied, the stage(s) of the innovation process considered, and
the type(s) of organisations included in an investigation” (Wolfe, 2004, P.7).
It is argued that DOI theory is relevant to the study of HRIS applications, and that HRIS has unique
features suggesting that HRIS needs its own specific study. HRIS has technical and functional
components, similar to other IS innovations, but it also has inter-organisational elements which
distinguish it from other types of innovations.
According to Rogers and Shoemaker (1983), diffusion is the process by which an innovation is
communicated through certain channels over time among members of a social system. However,
prior to that, a decision has to be made concerning whether the organisation should adopt new IS
applications. Rogers and Shoemaker (1983, p. 21) also distinguished diffusion from adoption by
stating that adoption is a decision to make full use of an innovation as the best course of action,
whereas rejection is a decision not to adopt an available innovation. In this study, adoption is
therefore defined as the decision to make use of HRIS applications.
44
Table 2.1: Summary of the Main Comments on the Adoption of Innovation Theories
2.4 Previous Studies
In order to identify empirical studies with MIS as main focus, the search engine Google Scholar
was used in addition to several online databases covering all leading journals not only in the fields
of HR and general management, but also in IS, the recently developing field of e-business, as well
as industrial and organisational psychology. A number of studies related to HRIS can be found in
various HR journals and magazines. However, many of them are conceptual or non-empirical
studies using qualitative approach (Nagai and Wat, 2004).
Over the last two decades, there has been a tremendous amount of studies concentrating on HRIS
applications and usage. While the majority of these studies have focused on the type of applications
that predominate in HRIS (Ruta, 2005; Smale and Heikkilä, 2009; Rolfstam and Bakker, 2011;
Krishna and Bhaskar, 2011; Kundu and Kadian, 2012; Samkarpad, 2013), and the contexts
necessary for the successful implementation of HRIS (Yeh, 1997) as well as the conditions that
support successful HRIS (Haines and Petit, 1997;Florkowski and Olivas-Luján, 2006), few of them
have focused on the organisational adoption and utilisation of HRIS and its effectiveness (e.g.
Overview Comments on the Adoption of Innovation Models Studies Examples
Most of the traditional models neglect the realities of
implementing technology innovations within organisations,
especially when individual adoption decisions are made at
the organisational, division, or workgroup levels, rather than
at the individual level”.
Kamal, 2006. P.34.
These adoption models have mostly been devised for and
applied to technology adoption in developed countries;
technology adoption in developed countries might be
different from in developing countries, as the challenges are
different in various contexts.
Molla and Licker,
2005.
Much of classical diffusion theory can be still applied to adoption
of innovations by organisations, modifications and extensions are
needed.
Fichman, 1992.
Prior empirical studies anchored in innovation adoption
theory have produced findings of considerable
inconsistency.
Fichman, 1992;Rye
and Kimberly, 2007.
It is argued that DOI theory is relevant to the study of HRIS
applications, and that HRIS has unique features suggesting that
HRIS needs its own specific study.
Wolfe, 2004
Organisational innovation is best thought of as a continuous
variable. As there is no single measure that empirically captures
the full extent of organisational innovation at the firm level,
researchers have used a wide array of indicators to assay
organisational innovation.
Orlikowski and
Barley, 2001

45
Panayotopoulou, and Galanaki, 2007; Lau and Hooper, 2008). Basically, these studies can be
classified by their regional and functional focus.
The majority of regional focus studies have been conducted in developed countries (Nagai and
Wat, 2004; Panayotopoulou et al., 2007; Bakker, 2011), and where studies have been conducted in
the developing world they are generally concentrated on a few countries. The cultural challenges of
most studies of HRIS implementation which are based on cases in Europe and the US show some
consistency, but developing countries show strikingly different cultural conditions. A summary of
relative studies can be seen in Table 2.2.
It has been noted that the majority of these studies focus on the use of HRIS and its applications
and features which are integrated as part of HRIS. Only a few studies have tackled the external
factors which influence the adoption and implementation of HRIS. This study attempts to address
both areas by examining internal and external factors associated with adoption decision of HRIS,
the extent of implementation and the value of HRIS in Jordanian business organisations.
The earliest empirical studies on HRIS implementation were conducted during the 1980s, and
many of their findings are irrelevant in the current situation due to the vast proliferation of IT
throughout the world, including in developing countries, during the last three decades, in addition
to the popularisation of the Internet since the 1990s onwards. The first study was conducted by
Mathys and LaVan (1982), who conducted a survey to examine stages in the development of HRIS.
Nearly 40 percent of the surveyed organisations did not have a computerized HRIS. Some studies
showed a low implementation of HRIS (Murdick and Schuster, 1983). DeSanctis (1986) also
studied the status of HRIS and assessed its operation and relationships to MIS functions. Moreover,
the degree and sophistication in the use of IT for HRM between Canada and Hong Kong were
compared by Martinsons (1994).
Ein-Dor and Segev (1978) suggested in their study that IT use in an organisational unit can be
characterized by a two-factor model, which considers the degree to which tasks have been
automated and the sophistication level of the resulting IS utilisation. Using this model, DeSanctis
(1986) and Martinsons (1994) reported that unsophisticated applications predominate in HRM and
the typical focus of HRIS applications was improved efficiency rather than greater effectiveness.
They attributed this situation to the perceived difficulties of building a HRIS as well as the
commonly held view that HR activities are not strategic, and treating the installation of HR
technology as a form of innovation.
Attewell (1992) stated that “these studies on innovations have used two distinct perspectives for
analysis – adoption and diffusion. The characteristics of an organisation which make it receptive to
innovation and change are evaluated by studies that use adoption perspective”, p.16. On the other
hand, understanding why and how an innovation spreads and what characteristics help the

46
innovation to be widely accepted is achieved by studies that use the diffusion perspective. For the
innovation to present all its benefits, the innovation has to spread within the organisation. An
organisation may adopt the innovation for its fad value, but because some of constraints (such as
lack of top management support) the use of this innovation may not spread.
Lin (1997) examined the content and context of HRIS in Taiwan. His study showed that higher
HRIS level, usage by top managers, usage by HR staff, and HRIS experience contribute to greater
organisational support and HRIS effectiveness (Lin, 1997). Training, support of the information
systems department, involvement of human resource leaders, and computer literacy of HR staff are
the most significant contributors to the effectiveness of HRIS. In addition, more emphases on
support for decision making, timeliness, comprehensiveness, and accuracy can also enhance
systems’ effectiveness.
Ball (2001) reviewed the issues surrounding the use of HRIS by personnel and human resources
departments in smaller organisations This study used empirical information about 115 UK
companies in the service sector in terms of personnel, training and recruitment and information
processing features (Ball, 2001), revealing that the organisation tends to hold information
electronically about its employees and about the organisation itself as the number of employees
increases. Similarly, the more people and organisation employed, the more likely it was that
information analysis with HRIS would occur. However, only half of the firms who employed less
than 500 employees, and those who used only core HR modules (rather than additional training and
recruitment modules) used HRIS. Ball’s (2001) results indicated that organisational size is a clear
determinant of whether an organisation has an HRIS at all; whether it adopts certain modules (such
as core personnel administration) over others (e.g., training and administration); and how
information is used and analysed.
Shrivastava and Shaw (2003) introduced a model describing the technology implementation
process. The aim was to use the model to highlight various issues that merited the attention of
academics and practitioners. An exploratory method of research was used with a descriptive model
for HR technology installations. The model was divided into three phases: adoption,
implementation, and institutionalisation. The various HR technology and implementation processes
were compared with the descriptive model. They showed that organisations which adopted a
process-driven approach customized IT solutions to support their HR processes, whereas
organisations that adopted a technology-driven approach use directly off-the-shelf packages
(Shrivastava and Shaw, 2003).
Moreover, Samir et al. (2003) found that there was universal agreement that large-scale technology
projects failed due to managerial and not technical reasons. Additionally, they identified that
climate conduciveness for technology implementation related positively to the extent of

47
neutralisation of inhibitors. In consequence, they realized that firms needed effective facilitating
strategies in order to create a climate conducive for implementing technology.
Ngai and Wat (2004) concluded that the industries in Hong Kong found that the greatest benefits
using of HRIS were the quick response and access to information. The greatest barrier, however,
was insufficient financial support. Regarding benefits and barriers, statistically significant
differences were observed between adopters and non-adopters of HRIS, and between small,
medium and large companies. They revealed that the size of a company might have an impact on
the achievement of a number of benefits and on the obstacles faced when implementing HRIS.
Again, they indicated that support of top management was one of the most important factors in
successful implementation of HRIS.
Florkowski and Olivas-Luján (2006) evaluated the diffusion of eight ITs that are transforming HR
service-delivery in North America and Europe. Such information technologies include HR
functional applications, integrated HR suits, IVR systems, HR intranets, employee and manager
self-service applications, HR extranets, and HR portals. The study applied external, internal, and
mixed-influence models of Human Resource Information Technology (HRIT) adoption decisions
of cross-sectional sample of US, Canadian, UK and Irish firms. Senior HR executives provided the
underlying data by means of a dynamically branching, web-based survey. The researcher
concluded that overall diffusion was best characterized as an outgrowth of internal influences,
fuelled primarily by contacts among members in the social system of potential adopters. Similar
results were obtained when controls were introduced for national setting, targeted end user, and
technology type. The paper showed that the modest correlation between the number of acquired ITs
and HR-transactions automation supports the general call for more formalized HR-technology
strategies at the firm level to coordinate purchasing and implementation decisions (Florkowski and
Olivas-Luján, 2006).
Teo (2007) attempted to identify the state of use of HRIS in organisations in Singapore as well as
the impacts of HRIS adoption via a questionnaire survey of 500 firms, of which 110 usable
responses (22.2%) were received. The research model consists of three sets of variables:
innovation, organisational and environmental characteristics. These variables are hypothesized to
be associated with the decision to adopt HRIS and the extent of HRIS adoption (Teo, 2007). Most
surveyed organisations adopted more administrative HRIS applications like payroll and employee
record keeping, rather than strategic applications like succession planning. The results also
indicated a tremendous amount of unrealized HRIS potential, as few respondents are using the
HRIS strategically to directly improve their competitiveness.
Beadles II et al. (2005) studied the implementation of an HRIS in the public sector, specifically the
implementation of HRIS within public universities. The main study questions were: (1) Have
human resource information systems achieved the administrative potential of HRIS in HR
48
departments at universities?; and (2) have they achieved the strategic goals? They also attempted to
assess satisfaction with the system. They concluded while valuable, HRIS has not yet reached its
full potential in this environment. The directors overall are satisfied with the system, but do not yet
see many benefits from its usage outside of its effect on information sharing.
Hussain, Wallace and Cornelius (2007) carried out a survey on the human resource information
usage and impact which involved the 40 HR UK organisations. They stated that HRIS usage
permits the HR professional to become a good strategic planner. By increasing the functionality
and affordability, HRIS can be used widely in organisations of all sizes. However, there still
differences related to the size of companies and the impact of HRIS between general professionals
and HR professionals. Hussain, Wallace and Cornelius (2007) argued that when reducing staffing
level of routine administrative tasks, non-strategic benefits are accrued by using HRIS. According
to the results of the study, to generate consistent and reliable quality data for audit purposes, SMEs
gain more from HRIS adoption, but empirical results indicate that small companies feel that the
costs of HRIS are too high.
Reddick (2009) examined HRIS in Texas City governments using a sample of HR directors
(HRDS), contacting 30% of HR employees through email and the Web. However, web-based self-
services offered by HR are mostly providing information, with much less supplying of online
services. Increasing customer service, improving the quality of services, and retaining knowledge
are important relational and transformational aspects for HRDS. Improved data accuracy was the
most critical success factor of HRIS, while the inadequate funding the most important barrier.
Hooi (2006) tried to understand the extent of e-HRM practiced in Malaysian SMEs in the
manufacturing sector in five main areas of human capital management. Human capital is believed
to have a great influence on competitiveness, in terms of recruitment, compensation and benefits,
training and development, communication and performance appraisal and to gauge the feasibility
of implementing e-HRM in these companies. According to this study, more companies use
conventional HRM than e-HRM, although the latter is considered a catalyst towards achieving
business strategies. Some claim that they lack financial resources, expertise or suitable
infrastructure to implement e-HRM. These companies are of the opinion that the implementation
and maintenance of e-HRM systems involve huge investment. On the contrary, others view that the
lack of resources is not a constraint for them and they opine that the advantages of e-HRM far
outweigh the costs involved (Hooi, 2006).
De Alwis (2010) examined the impact of the adoption of e-HRM on the HRM function and how it
has affected the role of HR managers. In addition to that, he intended to study the level and types of
technologies that were used in HR in Sri Lanka and the drivers of adoption of technology in the Sri
Lankan context. The sample of this study consisted of 30 large companies selected randomly from
various industries. A descriptive questionnaire, which was distributed through e-mail or personal

49
visits, was used to collect data. 70% of the companies in the sample have a moderate knowledge
while 30% displayed very high knowledge. HR professionals also changed their role from
“Administrative Expert” to “Strategic Agent”. The study revealed that there were several reasons
for driving organisations towards the adoption of e-HRM in Sri Lanka, the most common of which
was the desire to be a leading company in terms of technology adoption. The critical success
factors behind the successful implementation were employee attitudes, organisational culture,
characteristics and the way of collaborating those with HR and IT. The researcher believed that the
adoption should not be done in an ad hoc way but in a proper manner. Since the software affects
the post-performance of the system, its reliability should identify through proper evaluation (De
Alwis, 2010).
Al-Mobaideen and Basioni (2013) examined the main factors influencing the adoption of HRIS
within the Aqaba Special Economic Zone Authority (ASEZA) in Jordan. They examined the
importance of four factors: (1) TAM Model (Perceived Ease of Use (PEOU) and Perceived
Usefulness (PU)); (2) Information Technology Infrastructure (ITI); (3) Top Management Support
(TMS); and (4) Individual Experience with Computer (IEC). The study indicated that while the IT
infrastructure was found to be significant in effecting on the adoption of HRIS, the PU, PEOU,
TMS, and IEC were not. Furthermore, the results revealed no significant statistical differences with
regard to demographic characteristics on HRIS adoption (Al-Mobaideen, Allahawiah and Basioni,
2013).
2.5 The Conceptual Approach Analysis of Previous Studies
In the last three decades, the adoption of IT innovation behaviour of firms relating to the adoption
of innovation theory has been a topic of interest. A substantial amount of research has been
undertaken in an attempt to study and isolate the main important factors that determine the
adoption of IT innovation behaviour at the level of individual firms. Some researchers have
developed conceptual models to verify the adoption of IT behaviour aspects. However, the majority
of these studies have failed to give a complete account of the factors underlying the adoption of IT
innovation behaviour in general and the adoption of HRIS in particular. The analysis of the
empirical studies is used here to identify and isolate the important predictor’s factors that
associated either negatively or positively with the organisational adoption of HRIS.
Furthermore, in the absence of empirical studies to assist in the selection of the most significant
factors for HRIS adoption, all relevant factors have been identified and grouped into broad
categories of internal and external environment factors. The distinctions into internal and external
environment factors is made to distinguish between organisation-specific (organisationally
determined) factors and factors that are imposed (determined) from outside the organisation in the
adoption decision and deployment process of HRIS.
50
According to the organisation behavioural theories (e.g. Cyart and March, 1963; Robbins and
Stuart-Kotze, 1994), the organisation’s behaviour is linked inseparably to the environment in which
it operates; in other words, the organisation’s adoption of new innovation (practices) is not
determined by the its internal characteristics but through the interaction of its internal
environmental characteristics and the factors in its external environment. Because the purpose of
the current study is to determine the presence (frequencies) of certain aspects of contents related to
the adoption and implementation of IT, conceptual approach analysis is employed. Therefore, the
aim of this analysis of the previous studies is to gain a better understanding of these main
constructs and factors that underlie the adoption and implementation of IT innovation in general
and HRIS in particular (internal or external factors). These factors will be classified and integrated
together with other relevant theoretical literature to develop a conceptual framework to guide this
study.
The analysis of findings of these studies concerning these factors is categorized, presented and
discussed in the following subsections.
2.5.1 The Firm’s Internal Environmental Factors
2.5.1.1 Perceived IT Classical Innovation Characteristic
Based on an analysis of the organisational innovation literature, technological classical innovation
characteristics are widely and frequently used as a key determinant of innovation adoption. As
previously mentioned, Rogers (1995) and Rogers and Shoemaker (1983) identified five attributes
of an innovation that can influence adoption: relative advantage; complexity; compatibility;
trialability; and observability. Previous studies (Chen, 2003; Burke and Menachemi, 2004;
Menachemi, Burke and Ayers, 2004) revealed that the five attributes of innovation characteristics
proposed by Rogers (1995) influence the adoption of information systems. However, a meta-
analysis of research in this area (Tornatzky and Klein, 1982) found that out of as many as 25
innovation attributes studied by researchers, there are three items (relative advantage/benefit,
complexity and compatibility) that usually are consistently related to adoption. Teo, Lim and
Fedric (2007) indicated that relative advantage and compatibility are positively related to the
adoption of HRIS. Tornatzky and Fleischer (1990) identified perceived barriers and perceived
benefits as technological innovation characteristics. A further two characteristics discussed by
Herbig and Day (1992) are cost and risk. These attributes are explained in more detail below.
Relative advantage refers to the expected benefits and the usefulness arising from HRIS
applications in comparison to other applications (Rogers, 1995). Relative advantage has been found
to be one of the best predictors, and it is positively related to an innovations rate of adoption
Kendall et al., 2001; Limthongchai and Speece, 2003,Jeon and Lee, 2006). The common benefits of
HRIS frequently cited in studies included improved accuracy, the provision of timely and quick

51
access to information, and the saving of costs (Tetz, 1973; Wille and Hammond, 1981 Lederer,
1984). Lederer (1984) discussed why the accuracy and timeliness of HRIS is very important in
terms of operating, controlling, and planning activities in HR. The degree of relative advantage is
often expressed in terms of economic profitability, social prestige, or other benefits such as savings
in time and effort, and cost reduction (Rogers and Singhal, 2003). HRIS can improve the
effectiveness of an HR department by automating administrative tasks, reducing paperwork,
simplifying work processes and distributing better information to management.
Other acclaimed benefits include quicker and less expensive recruitment. Many researchers have
suggested that the most important benefit of HRIS is that organisations can spend more time on
decision-making and strategic planning and less time on information input and day-to-day HR
administration (Gree and Gray, 1999). The higher the appreciation of the benefits HRIS by
management, the more likely they are to set aside organisational resources necessary to adopt and
implement HRIS applications. There are potential opportunities and benefits of using HRIS by HR
managers and professionals. The growing awareness and understanding of the advantages of HRIS
applications and tools among the organisations in Jordan could positively influence in their desire
and interest to the adoption of HRIS.
Perceived compatibility is defined as “the degree to which an innovation is perceived as consistent
with the existing values, past experiences, and needs of potential adopters” (Rogers and Singhal,
2003. P.250). An innovation might be perceived as technically or financially superior in
accomplishing a given task, but it may not be adopted, if a potential adopter views it as irrelevant to
its needs (Rogers, 1995). An innovation can be compatible or incompatible with socio-culture
values and beliefs, previously introduced ideas, or client needs for innovation (Rogers, 1995). The
compatibility also depends on knowledge or familiarity with the innovation and its processes
(Roberts and Berry, 1984). For example, research shows that compatibility with existing systems is
positively associated with technology adoption (Duxbury and Corbett, 1996). Compatibility also
includes the extent to which a technology aligns with the firm’s needs, including the alignment of a
firm’s IT strategy with its business strategy (King and Teo, 1996; Walczuch and Lundgren, 2000).
For example, research has shown that business strategy directly influences the adoption and
integration of IT into the organisation (Teo and Pian, 2003). Similarly, Grandon and Pearson
(2004) found that compatibility was a key factor distinguishing adopters from non-adopters.
According to Rogers’ model, compatibility consists of two dimensions: values, or norms, of the
adopter and practices of the adopter (Tornatzky and Fleischer, 1990; Moore and Benbasat, 1991;
Kim, 2009). The first dimension implies cognitive compatibility (compatibility with what people
feel or think about a technology), while the second argues practical or operational compatibility
(Tornatzky and Klein, 1982; Kim, 2009) several researchers indicate that the adoption of HRIS
applications technologies could bring significant changes to the work practices of businesses and
52
resistance to change is a normal organisational reaction. Therefore, it is important, especially for
business organisations, that the changes are compatible with its infrastructure, values and beliefs.
HRIS also automates many of the routine HR administrative tasks and streamlines the workflow in
the HR department. Users’ resistance to change due to changes in work practices and procedures
and possible loss of jobs, as well as computer phobia, are major impediments in the adoption and
implementation of HRIS (Teo and Pian, 2003). Therefore, organisations with a corporate culture
that embraces change and encourages employees to learn would be more likely to adopt HRIS.
Perceived complexity (ease of use or learning HRIS applications) is defined as “the degree to
which an innovation is perceived as relatively difficult to understand and use” (Rogers, 2003, p.
257; Rogers and Singhal, 2003). It is the opposite of ease of use or the degree to which a particular
system is perceived to be relatively free from physical and mental effort (Davis, 1989). The
complexity of the technology creates greater uncertainty for successful implementation and
therefore increases the risk of the adoption process. It is also suggested that the perceived
complexity of an innovation leads to resistance due to lack of skills and knowledge (Rogers and
Shoemaker, 1983). Hence, this factor has been found to be negatively associated with adoption of
IS innovations (e.g. Cooper and Zmud, 1990; Grover, 1993). It is expected that HRIS complexity
(perceived or actual) is negatively related to its adoption.
Many HR departments have been slow in adopting HRIS, as until recently most HR systems have
been difficult for non-technical professionals to understand and use. For those who have adopted
HRIS, the systems are limited and generally maintained by the IS department, because the systems
are difficult for ordinary HR professionals to use and require computer expertise to modify
(Dunivan, 1991).
Perceived trialability is the degree to which an innovation may be experimented with on a limited
basis (Chen, 2004). New ideas that can be tried on the instalment plan are generally adopted more
rapidly than innovations that are not divisible. Some innovations are more difficult to divide for
trial than are others. A testable innovation is less risky for the adopters. Fliegel and Kivlin (1966)
and others support this statement. According to Mansfield (1986, P.33), “the extent of the
commitment required to try out the innovation” determines its adoption.
Perceived observability is the degree to which the results of an innovation are visible to others. The
results of some ideas are easily observed and communicated to others, whereas some innovations
are difficult to observe or to describe to others. According to Rogers and Shoemaker (1971),
observability in an innovation is an important factor in early adoption. Mansfield (1986, p.34)
states that “the rate of reduction of the initial uncertainty regarding the innovations performance
affects its rate of diffusion”.
53
Other innovation characteristics have also been cited by various researchers. Tornatzky and Klein
(1982) identified perceived barriers and perceived benefits as technological innovation
characteristics. A further two discussed by Herbig and Day (1992) are cost and risk. In a meta-
analysis of research in this area, Tornatzky and Klein (1982) found that only three of Roger’s
attributes - relative advantage, complexity, and compatibility - are consistently related to adoption.
In specific relation to HRIS adoption, findings also vary. Teo and Fedric (2007) indicated that
relative advantage and compatibility are positively related to the adoption of HRIS. They
concluded that none of the perceived innovation characteristics were found to be significant in the
implementation of HRIS. They explained that the innovation characteristics may be associated with
the initial decision to adopt HRIS, but they are not significant factors in the subsequent diffusion of
the HRIS.
Table 2.2: Innovation Classical Characteristics
Innovation
Classical
Characteristics
Variables Researchers
Relative
Advantage
Rogers and Shoemaker, 1983; Lederer, 1984; Meyer and Goes, 1988; Cooper
and Zmud, 1990 Moore and Benbasat, 1991; Ramiller, 1994; Rogers, 1995;
Rashid and Al-Qirim, 2001; Kendall et al., 2001; Limthongchai and Speece,
2003; Carter and Belanger, 2004; Lee and Xia, 2006 ;Jeon, and Lee, 2006; Tan
et al., 2009a; Fisher and Ke, 2009 Tetz, 1973; Tornatzky and Klein, 1982;
Wille and Hammond, 1981.
Compatibility
Rogers and Shoemaker, 1971; Tornatzky and Klein, 1982; Raymond and
Bergeron, 1996; Tan and Teo, 2000; limthongchai and Speece, 2003; Rashid
and Al-Qirim, 2001; Carter and Belanger, 2004.
Complexity
Carter and Belanger, 2004; Cooper and Zmud, 1990; Rashid and Al-Qirim,
2001; Rogers and Shoemaker, 1983; Davis, 1989; Tan et al., 2009b; Ziliak and
McCloskey, 2003.
Observability
Rogers and Shoemaker, 1971; Rogers and Shoemaker, 1983; Mansfield, 1986;
Hall and Singh, 1998 Santhapparaj and Eze, 2008.
Trialability
Rogers and Shoemaker, 1983; Raymond and Bergeron, 1996;Kendall et al.,
2001; Khalifa and Cheng, 2002.
Source : Developed by the researcher
2.5.1.2 Organisational Readiness and Competences
Organisational readiness refers to the level of human, economic, financial, business and technical
resources of the firm (Kuan and Chau, 2001). Zhu and Kraemer (2005) mentioned that
organisational readiness includes infrastructure, relevant systems, and technical skills. Although,
the definition of organisational readiness differs in the literature, all authors are agreed that
organisational readiness has a strong influence on the adoption of organisational technologies. The
organisation readiness construct is used to assess whether the organisation has the necessary
attributes that ensure the overall readiness towards adopting HRIS.

54
Financial readiness refers to the financial resources available to pay for new technological
innovation costs, for implementation of any subsequent enhancements, and for on-going expenses
during usage (Iacovou and Dexter, 1995). Although Mehrtens, Cragg and Mills (2001) found no
significant relationship between adoption and financial support, this might be because large firms
could readily afford the cost of adopting the IT at a basic level. Similarly, Chan and Mills (2002)
explored a more costly adoption, but found insufficient evidence to conclude whether financial
readiness was a key factor. Nonetheless, it is reasonable to expect that having access to adequate
financing is a critical step in the adoption process and in determining the level of adoption at the
early stage.
Technical (technological) readiness refers to the level of sophistication of IT usage and IT
management in an organisation (Iacovou et al., 1995). For example, research has found that firms
with greater IT sophistication (e.g., having a formally established IT department and other IT
assets, such as IT knowledge and IT capabilities) are more likely to adopt technologies systems
(Bassellier and Reich, 2003), while lack of knowledge appears to inhibit uptake. The availability of
IT skills usually includes employees’ skills of using the Internet and related technologies (Zhu and
Xu, 2003). IT skills are essential for firms to develop successfully IT applications. This
complementary factor has been identified in many studies as a crucial element of IT
implementation (Brynjolfsson and Hitt, 2000; Black and Lynch, 2001). In this research, IT skills
are defined by the number of employees working exclusively in tasks related to IT activities. It
would be expected that firms with more IT skills are more likely adopt IT applications (other
factors being constant).
Human readiness refers to the availability of employees with adequate experience and exposure to
information and communication technology and other skills needed to use IT applications (Molla
and Licker, 2005). The quality of human resources is also considered important to the success of
the implementation of HRIS. The presence of skilled labour in a firm increases its ability to absorb
and make use of an IT innovation, and therefore is an important determinant of IT diffusion.
Companies are more likely to implement HRIS if resources are available and employees view
HRIS positively:
“Employees’ IT skills and attitudes play a crucial role in the above-mentioned
integration. So, HRM needs to invest in supporting people to develop the necessary
skills and attitudes in order to actively participate and use the new services. It also
needs to invest in communicating the benefits of these services, in order to
eliminate any resistance or reluctance to use the new service”. (Papalexandris and
Panayotopoulou, 2005, P. 283)
Previous studies (Kavanagh, Gueutal and Tannenbaum, 1990; Bell and Yeung, 2006; Harris, 2008)
indicated that HRM is a profession which requires its own body of knowledge by developing its
unique HRM competencies. However, Bakker (2010) indicate that human capital, social capital and

55
strategic direction of the corporate business have no significant influence on the features of e-HRM
applications and their adoption.
Organisational technical support (IT architecture) consists of components including application
development tools, databases, networks, and computer hardware and business applications. Laudon
and Laudon (2010) indicated that IT infrastructure consists of a set of physical devices and
software applications that are required to operate in the entire enterprise. IT infrastructure is also a
set of organisation-wide services budgeted by management and comprising both human and
technical capabilities. In the development of HRIS, the IS department was found to play a major
role in facilitating the computerisation of human resource information (e.g. Kinnie and Arthurs,
1993). DeSanctis (1986) concluded from her survey that although the HRIS has set up
independence from corporate MIS, it is not yet ready to be an independent entity within the
personnel area in a large number of firms. Cholak and Simon (1991) also mentioned that an HRIS
still requires the participation of IS department, particularly in the planning and developmental
stages. Al-Mobaideen and Basioni (2013) indicated IT infrastructures have a positive and
significant effect on the successful adoption of HRIS.
A computer skill training for relevant employees helps to achieve ideal HRIS effectiveness
(O’Connell, 1996). DeSanctis (1986) explained that one of the potential problems of HRIS
management is a lack of employee technical training and experience in information management.
Kavanagh and Tannenbaum (1990) also commented that for a successful HRIS, appropriate
training should be given to all HR staff, line managers, as well as other employees. Budget support
for system development, for training and cooperation of IS department and line managers may be
forthcoming. A positive outcome has been revealed from high support of the IS department as rated
by human resource personnel. A common department-centric phenomenon has not been found in IS
departments, and HR department interactions in support of top management are critical to HRIS
implementation (Lin, 1997).
The availability of human resources is associated with the existence of employees who have the
knowledge and experience to use HRIS applications (Mehrtens and Mills, 2001).The availability of
financial resources, although linked to the cost of applications, is related with organisation’s
financial health. The competitive attitude is allied to organisation’s perception regarding the way in
which improvements in the competitive position of the organisation will be achieved as a result of
the adoption of HRIS applications (Waarts and Hillegersberg, 2002). According to many scholars,
this construct is critical (Mehrtens and Mills, 2001; Beveren and Thomson, 2002). The adoption of
HRIS applications is dependent on various factors, including the availability of resources
associated with the existence of employees who have the knowledge and experience to use HRIS
applications, and the attitudes of the latter.

56
The employees’ structure and educational level have also been reported to positively influence
innovation adoption, particularly in HRM (Kimberly and Evanisko, 1981; Kossek, 1987). IT skills
and familiarity with electronic tools facilitate e-HRM adoption, as they are related to both the
willingness and capability of the end users to utilize the system (Shrivastava and Shaw, 2003;
Voermans, 2007; Panayotopoulou and Galanaki, 2007,). However, a recent European study by
Strohmeier and Kabst (2009) found that education structures neither furthered nor hindered e-HRM
adoption decisions, attributing this to the continuous spread of basic IT literacy in many
demographic segments.
Another variable likely to affect the implementation of HRIS is the involvement level of HR
management. Lederer (1984) reported that the HR department should be responsible for advocating
the need for an HRIS, as it is in the best position to obtain and keep an organisation’s management
commitment to an HRIS. However, Kossek et al. (1994) found that in corporations, those in high-
ranking HR positions were more likely to have negative perceptions of an HRIS – perhaps due to a
possible power-shift brought on by changing systems. Their interviews revealed that HRIS use is
viewed as a clerical activity that does little to enhance HR’s reputation. Pitman (1994) noted that
user participation is a critical factor to successful change; as clerical staff have considerable
responsibility in system operations, their support is crucial.
Finally, the critical role of effective internal communication (e.g. choosing appropriate methods;
communicating early, extensively, and candidly) as a facilitator in HRIS implementation is
underlined in many studies (Shrivastava and Shaw, 2003;Ruta, 2005). Furthermore, the networking
and communication skills of an HR manager, especially in consensus building, are essential for the
successful adoption of IS (McGourty and Swart, 1998). Sources of organisational readiness and
competence thought to influence the adoption and implementation of the HRIS applications are
shown in Table 2.3.
Table 2.3: Organisation Readiness and Competences Studies
Readiness and
Competences
Variables Researchers
Financial Resources Mehrtens, and Mills, 2001; Kuan and Chau, 2001b; Zikmund, 2003;
Chaveesuk, 2010.
Human
Resources
DeSanctis, 1986; O’Connell, 1996; Kuan and Chau, 2001a; Mehrtens,
Cragg and Mills, 2001; Wagner and Johansson, 2003; Bakker, 2010.
Organisational
Competitive Attitude
DeSanctis, 1986; O’Connell, 1996; Waarts, Everdingen and
Hillegersberg, 2002.
Technical Resources Molla and Licker, 2005; Papalexandris and Panayotopoulou, 2005;
Panayotopoulou and Galanaki, 2007; Al-Mobaideen, and Basioni, 2013.
Managerial IT
Knowledge
Jarvenpaa and Ives, 1991; Boynton and Jacobs, 1994; Davies and
Finlay, 2001.
Involvement of HR
Leaders
Lederer, 1984; Kossek et al., 1994.
Source : Developed by the researcher
57
2.5.1.3 Organisational Demographic Characteristics
A number of studies have found that the demographic characteristics of organisations - including
organisation size, experience with technology, type of business, and organisational ownership - are
significant determinants of organisational IT adoption (Iacovou and Dexter, 1995b).
Organisation size was defined by Kimberly and Evanisko (1981) as an organisation’s resources,
transaction volumes, or total workforce. It plays an important role in innovation adoption because
increasing size creates a “critical mass”, which justifies the acquisition of particular innovations
and necessitates adoption behaviour. Organisation size has also been proposed as a significant
antecedent of adoption in many innovation and IT studies (Bajwa and Lewis, 2003; Bakker, 2010).
Consistent with previous results (Ball, 2001; Hausdorf and Duncan, 2004; Florkowski and Olivas-
Luján, 2006; Teo, Lim and Fedric, 2007; Bakker, 2010), organisation size should constitute a
central adoption factor. Thong and Yap (1995) pointed out that business size is the most important
discriminator between adopters and non-adopters of IT within Singaporean small businesses.
Additionally, the results of Ball’s (2001) survey of 115 companies in the UK on HRIS usage
indicated that organisational size was the clearest determinant of whether an organisation has any
HRIS, as well as whether it adopts particular applications.
Firm size is considered one of the most commonly studied determinants of IT adoption and
diffusion. Lee and Xia (2006) analysed (through meta-analysis) the association between firm size
and IT innovation adoption, concluding that although a positive relationship generally existed, the
relationship was moderated by five variables: type of IT innovation, type of firm, stage of adoption,
scope of size, and type of size measurement. Three major arguments support the positive role of
firm size in determining IT innovations: the benefits of the new IT is higher for larger firms; the
availability of funds for these firms is greater; and many IT innovations, like the Internet, are scale-
enhancing, therefore larger firms adopted them sooner - and more intensively - because they
capture economies of scale more quickly (Moch and Morse, 1977; Ngai and Wat, 2004; Zhu,
Kraemer and Xu, 2003; Florkowski and Olivas-Luján, 2006).
Damanpour (1992) also found a positive relationship between organisation size and innovation
adoption, stating that: (1) size is more positively related to innovation in manufacturing and profit-
making organisations than in service and non-profit making organisations; (2) the association
between size and innovation is stronger when non-personnel or a log transformation measure of
size is used; (3) types of innovation do not have a considerable moderating effect on the
relationship between size and innovation; and (4) size is more strongly related to the
implementation than to the initiation of innovations in organisations.
However, a negative relationship between size and adoption behaviour has also been reported, as
well as non-significant interdependencies (Aiken and French, 1980; Gremillion, 1984; Grover,

58
1993). These inconsistent findings may be due to the different definitions of organisational size
used by different researchers. It should also be noted that previous studies did not provide evidence
on whether there is a relationship between the size of the firm and the actual level of
implementation of HRIS applications.
A firm’s experience with technology and the length of time it has been committed to IT in the HR
department has been found to have a strong effect on the overall success of IT in an organisation
(Tye and Chau, 1995; Teo and Fedric, 2001). A firm’s past experience with technology, in terms of
exposure and organisational learning, ultimately affects its future choices in adopting technology
(Burgelman and Rosenbloom, 1989). This past experience can be measured through time since first
acquisition, number and type of technologies or applications adopted percentage of personnel
familiar with the technologies, and the current level of assimilation and integration of the
technologies. Previous studies (Osterman, 1994; Ichniowski and Prennushi, 1995; Freeman and
Kleiner, 2007) found that younger businesses were more likely to adopt workplace innovations, as
they have not yet had time to build up an entrenched management or practices that would be
threatened by the adoption or diffusion of organisational innovation.
The type of business is also a factor in IT adoption, as the industry in which a company operates
plays an important role in HRIS adoption (Rashid and Ai-Qirim, 2001). Companies in high-
technology sectors, such as telecommunications, use more elaborate HR information systems, often
adopting HRIS earlier than other sectors in order to maintain a high-tech appearance (Galanaki,
2002). Industries with a high proportion of clerical work, such as banking, promise an
uncomplicated adoption, since there is a high share of workplace computers and computer literate
employees. In contrast, industries with mainly non-clerical tasks, like building construction, do not
generally consider workplace computers and computer literacy as a characteristic of their task
structure (Arad and Schneider, 1997). While both the manufacturing and service industries express
an intention to adopt ICT, the greatest move toward this trend is found in service-based SMEs (Tan
and Teo, 2000). However, some studies have expressed doubt about whether sectoral differences in
HRIS adoption actually exist (Ball, 2001; Ghobakhloo, Arias-Aranda and Benitez-Amado, 2011;
Yeung and Cohen, 2004).
Organisational ownership characteristics are another important factor. Casile and Davis-Blake
(2002) found, in the context of adoption, that private sector organisations were more responsive to
technical factors, whereas public sector organisations were more responsive to institutional factors.
However, the effect of ownership type has been seldom examined in the HRIS implementation
literature. Studies that investigated organisational demographic characteristics are listed in Table
2.4.

59
Table 2.4: Organisation Demographic Characteristics Studies
Demographic
Characteristics
Studies
Size
Moch and Morse, 1977a; Ball, 2001; Bajwa and Lewis, 2003; Lee and Xia,
2006; Zhu, and Xu, 2003; Gibbs and Kraemer, 2004; Florkowski and Olivas-
Luján, 2006; Nagai and Wat, 2004; Bakker, 2010.
Experience Burgelman and Rosenbloom, 1989; Tye and Chau, 1995; Teo, Soon and
Fedric, 2001.
Type of
Business
Arad and Schneider, 1997; Ball, 2001; Panayotopoulou, and Galanaki, 2007.
Source : Developed by the researcher
2.5.1.4 Organisational Structures
Organisational structure has been found to either facilitate or inhibit innovation adoption. It can be
identified through indicators such as the degree of centralisation within an organisation, the degree
of formalisation of different activities, and the degree of employee specialisation. All of these
characteristics are associated with the adoption of new technology, particularly the degree of
employee specialisation, which is a strong contributing factor in IT standards adoption.
Generally speaking, organisational structure can be understood in terms of the complexity and
specialisation of organisations. Organisational complexity refers to the levels of organisational
hierarchy, the number of geographical locations, and the number of departments or jobs within an
organisation. During the 1990s it was found to play a significant role in the adoption of LAN
technology (Ellis and Arnett, 1994). However, Lai and Guynes (1997) disputed this, finding no
significant relationship between integrated services digital network (ISDN) adoption and the degree
of centralisation, formalisation, or complexity. They argued that other factors may overpower
structural factors. Eder and Igbaria (2001) similarly found that organisational structure was not
related to the diffusion or infusion of intranets.
Organisational specialisation represents the different specialties found within an organisation
(Kimberly and Evanisko, 1981; Damanpour, 1991). By employing specialists, organisations
acquire new ideas, practices, and technical skills, which are prerequisites for adopting innovation
(Moch and Morse, 1977). Specialisation is often considered to be positively correlated with
organisational innovativeness ( Moch and Morse, 1977;Kimberly and Evanisko, 1981;Damanpour,
1991; Frambach, 1993; Frambach et al., 1998; Grover, 1993). The diversity in background of an
organisation’s employees increases the number of information sources by which an organisation
may learn of new sources of innovation (Zaltman and Holbek, 1973).
Organisational centralisation is often used as a method in judging overall organisational structure -
more concentrated decision-making being associated with a more centralized organisational
structure (Kwon and Zmud, 1987). While the literature agrees that the degree of centralisation in
decision-making plays a large role in IT/IS usage and adoption (Hage and Aiken, 1969), opinions
60
on the optimal degree of centralisation differ from study to study. Previous studies found
decentralized decision-making as one of the strongest facilitators of customer-based information
inter-organisational system (CIOS) adoption (Grover, 1993) and IT use in large and complex
organisations (Boynton and Jacobs, 1994). Zaltman and Holbek (1973) concluded that more
formalized and centralized organisations have lower levels of innovativeness. Arad, Hanson and
Schneider (1997) and the CIMA Study (StudyText, 1996) further added that a flat structure,
autonomy, and work teams promote innovation, whereas specialisation, formalisation,
standardisation and centralisation inhibit it.
Conversely, several studies indicated that a highly centralized organisational design leads to more
effective end user computing (Brown and Bostrom, 1994), and the adoption of more successful
strategic information systems applications (King and Sabherwal, 1992). Pierce and Delbecq (1977)
suggest centralisation of decision-making may reduce conflict between organisational units and
foster innovation adoption. In support of this proposition, Ettlie and O’Keefe (1984) found that
organisations with a centralized structure were more likely to adopt new technologies.
Burns and Stalker (1961) suggested two different types of organisational structure: mechanistic and
organic. A mechanistic structure is somewhat rigid, consisting of clearly delineated jobs, a well-
defined hierarchical structure, and a formal chain of command. An organic structure is more
dynamic, decentralized, flexible, and informal. Daft and Lengel (1986) stated that more organic
organisations tend to adopt new technology more readily.
The institutionalisation of HRM, or the existence of a formal HR department, appears to increase
the likelihood of a firm adopting HRIS, as the HR department functions as an internal promoter.
This is because, although the advantages of adoption are beneficial for the whole organisation,
gains such as alleviation of administrative burdens via automation are most beneficial for the HR
department. Motivation, capacity, and ability to adopt HRIS are considerably higher when there is
an institutionalized HR department (Strohmeier and Kabst, 2009). This is even more apparent in
larger firms. As the HR administrative burden grows, the need for automation becomes more
imperative.
Additionally, the recognition of HR as a change agent or strategic partner is more likely to
influence the adoption and implementation of HRIS applications practices ( Ulrich, 1997; Lepak
and Snell, 1998; Lengnick-Hall and Moritz, 2003 ;Bakker, 2010). Ulrich (1997). Bakker (2010)
reported that the identified four roles of HR:
1. Administrative expert: Traditional role of HR, which implies responsibility of HR for the
efficiency of their own function as well as the entire organization. The HR staffs are
primarily participating in administering HR practices (e.g., payroll).
61
2. Employee champion: This role is considered to keep employees of the business committed
to the organization. The HR staff is assumed to be responsible for the engagement of
employees within the organization, help the employees to meet the demands placed on
them, represent the ideas and mindsets of employees in management discussions, and offer
opportunities for growth.
3. Change agent: HR is responsible for building the organizations capacity to change towards
new HRM ways (e.g., HRIS), and thereby take away any resistance and fear in this change.
4. Strategic partner: Combination of the former three roles, and aligns HR practices with
strategic management.
Bakker (2010) reported that the role of HR affects the features of an e-HRM application, finding
that organisations which indicate their HR as supporting staff before e-HRM implementation are
more likely to feature e-HRM with basic strategic activities – payroll, collection of employee data.
Organisations who regard their HR department as a competitive advantage are more likely to
feature e-HRM with advanced strategic activities, such as training and development of employees,
developing job content, and employee reward programs (Bakker, 2010). Collaboration of HRM and
IT has also been identified as a crucial success factor in HRIS adoption and use. This collaboration
can ensure successful integration of technology into HRM processes, responding to the need for
quality HRM services (Panayotopoulou and Galanaki, 2007). Organisational structure studies are
listed in Table 2.5
Table 2.5: Organisational Structure Studies
Organisational Structure
Variables
Studies
Centralisation Hage and Aiken, 1970; Kimberly and Evanisko, 1981; Rogers,
1995; Damanpour, 1991; Grover, 1993.
Formalisation Hage and Aiken, 1967; Zaltman and Holbek, 1973; Rogers,
1995.
Specialisation Zaltman and Holbek, 1973; Moch and Morse, 1977; Frambach
and Schillewaert, 2002.
Standardisation Eder and Igbaria, 2001.
Complexity Lai and Guynes, 1997; Eder and Igbaria, 2001.
Institutionalisation of HRM Strohmeier and Kabst, 2009.
Comprehensiveness of HRM Strohmeier and Kabst, 2009.
HR Role Lepak and Snell, 1998; Ulrich, 1997 Lengnick-Hall and Moritz,
2003; Bakker, 2010.
Source : Developed by the researcher
2.5.1.5 Top Management Support and Commitment
Researchers argue that top management support - involvement and participation of the executive or
top-level management - of an innovation plays a large role in adoption or early adoption of that
innovation (King and Teo, 1996; Jarvenpaa and Ives, 1991; Raymond and Bergeron, 1996). The
strong commitment of top management, especially of a particular innovation champion, leads to
62
early adoption, while a lack of top management commitment inhibits adoption (Cragg and Mills,
2001;Chan and Mills, 2002). Given the important role of top-level managers in organisations, it is
not surprising that top management support has been one of the most widely discussed
organisational factors in several HRIS adoption studies (Jones and Arnett, 1994; Kavanagh and
Tannenbaum, 1990; Pitman, 1994; Wong and Louise, 1994).
In addition to verbal support, top management can demonstrate their confidence in HRIS by
personally utilizing the system. Their frequent personal HRIS usage may result in sufficient
delegation of resources and an increased pressure for HRIS success. Davies and Finlay (2001)
examined 47 Malaysian public sector agencies on IT usage to support total quality management
(TQM). Among the organisational factors explored, the researchers found top management support
for IT applications as the highest predictor of IT usage.
Top management support has also been recognized as essential for creating a supportive climate
and providing adequate resources for the adoption and implementation of new technologies
(Premkumar and Roberts, 1999). Shrivastava and Shaw (2003) concluded that there is universal
agreement that large-scale technology projects generally fail due to managerial, and not technical,
reasons. Additionally, they identified that climate conduciveness for technology implementation
related positively to the extent of neutralisation of inhibitors. Lado and Wilson (1994) realized that
conditions in the firm’s external and internal environment might enable or constrain the capacity of
HR systems to develop and exploit organisational competencies.
According to Thong and Raman (1996), top management, with its broader perspective, is better
able to identify business opportunities for the exploitation of IT and provide appropriate strategic
vision and direction for the adoption and implementation of new innovations or technologies.
Visible top management support also sends signals about the importance of the innovation, helping
to overcome organisational resistance to HRIS. This in turn leads to positive attitudes on the part of
users towards the use of the new technology and thus leads to a smoother conversion from existing
work procedures (Weill, 1992) . By virtue of their leadership role, top management is also able to
ensure that adequate resources will be allocated if the innovation is adopted. Pitman (1994) cited
visible management support and commitment as critical success factors. Johannessen (1994)
reported that successful innovation can also be associated with an open management style, stating
that this can be reinforced by means of communication-related IT. In a study of large innovative
organisations, Quinn (1986) and James Brian (1986) speculated that IT innovation would develop
continuously if top management appreciated innovation and contributed actively to maintaining the
value system and atmosphere of the organisation in a manner conducive to innovation
(Johannessen, 1994).
Management support is one of the key recurring factors affecting system success and computing
acceptance. Previous studies (Kwon and Zmud, 1987; Lucas, 1975; Razali and Vrontis, 2010)
63
indicated that top management involvement and organisational commitment appeared as the two
largest coefficients for the impact on the acceptance level of employees toward the new HRIS
implemented in the Malaysian Airlines HR system. Ngai and Wat (2004) also indicated that
support of top management was one of the most important factors in successful implementation of
HRIS in Hong Kong. It is also worth noting that the adoption of an innovation process may vary
across cultures in the rate of innovation activity and in the importance placed on management
decisions (Murphy and Southey, 2003).
The literature has also acknowledged the critical nature of the innovation champion - “a
charismatic individual who throws his or her weight behind an innovation” (Rogers and Singhal,
2003, p. 414) - in the successful adoption of HRIS. A champion’s willingness to explore new
usages, ability to use a variety of influential tactics, and engage in risk-taking has been shown to
result in a greater rate of innovation adoption and is particularly important in the adoption of HRIS
application (Ruppel and Howard, 1998; Murphy and Southey, 2003; Urbano and Yordanova,
2008). Within this context, the power of the innovation champion (in this case, the HR executive)
is critical to HRM innovations (Wolfe and Ortega, 1995). The relationship warrants further
investigation in a human resource management-context, given the potential key role champions
play as recipients and disseminators of HR information. Kossek (1987) simply declared that if the
top management does not view HRM innovation favourably, it will simply not occur.
2.5.1.6 Corporate Culture
For many years, scholars of organisational behaviour have attempted to demonstrate the
relationship between an organisation’s culture and its success. Successful organisations have the
capacity to absorb innovation into their organisational culture and management processes,
furthering the argument that the success of organisational adoption behaviour is based, to some
extent, on the culture of the organisation (Syrett and Lammiman, 1997; Tushman and O’Reilly,
1997). According to Tushman and O’Reilly (1997), corporate culture lies at the heart of
organisational innovation.
A review of several studies led to the development of a common definition of corporate culture:
“the pattern of shared values and beliefs that help individuals understand organisational functioning
and thus provide them with the norms for behaviour in the organisation” (Deshpande and Webster
Jr, 1989; Hofstede, 1998. p. 4). This notion of culture is similar to previous definitions (Lock and
Kirkpatrick, 1995; Martins and Terblanche, 2003; Trice and Beyer, 1993). This definition
emphasizes the importance of the pervading culture within an organisation in relation to the degree
of acceptance of a new innovation. Zaltman and Holbek (1973) suggested that for innovation to
occur and be successful there must be a perception among managers and other users that the
organisation can adapt and implement the new processes. These perceptions are likely to derive
from the prevailing organisational climate or culture, and whether it embodies norms and

64
expectations that support openness, change, and risk-taking ( O’Reilly and Caldwell, 1991; Baer
and Frese, 2003).
Organisations with open and flexible corporate cultures adapt easily to new technology and the
changes that come with it, as their employees at all levels tend to view changes positively and are
more willing to adapt to the changes. This is especially true if a philosophy of empowering and
motivating employees prevails in the organisation (Cooper and Zmud, 1990; Ezzamel and Holland,
1996). Irani et al. (2005) similarly suggests that organisational cultures with a more supportive
climate and flexible structures might be more amenable to the successful deployment of new
technologies than organisations with less flexible and more mechanistic cultures. Although some
staff may be resistant to changing their ways, empowering them gives a sense of involvement in the
shift away from manual systems. He further asserts that employees perceiving the culture of their
organisation as open are more inclined to have a positive attitude toward organisational change,
and subsequently will more readily accept future changes. Another study by Kitchell (1995) found
that organisations with cultures seen as being flexible or open, and having a long-term orientation,
had a greater propensity in adopting advanced manufacturing technology.
Jackson (2011) stated that organisational culture continues to be cited as an important factor in the
success or failure of IS adoption. This is evidenced by the growing trend in the number of studies
that address cultural issues in IS literature over the last several decades. Small businesses, along
with businesses that have high levels of employee autonomy or highly value employee welfare,
were more likely to introduce employee involvement programs, have a TQM program, or utilize
diverse planning team (Osterman, 1994). Furthermore, values such as flexibility, freedom, and
cooperative teamwork promote innovation, while values such as rigidity, control, predictability,
and stability hinder it (Arad and Schneider, 1997). Additionally, Hoffman and Klepper (2000)
found that organisations low in sociability and high in solidarity (‘mercenary cultures’) experienced
more favourable outcomes with technology assimilation than more networked, higher sociability
and low solidarity cultures.
2.5.1.7 Socio-Demographic Characteristics of Decision-Makers
Organisational leaders often view innovation as a source of organisational change, growth, and
effectiveness (Damanpour and Schneider, 2006). Because organisations reflect their decision-
makers’ influence in promoting innovation as a means to enhance organisational effectiveness and
possibly pioneer beneficial change, several researchers have examined the influence of managers’
demographic and personal characteristics on the relationship between innovation characteristics
and innovation adoption. Decision-makers’ characteristics (such as CEO knowledge of IT, values,
and attitude towards an innovation) are also considered important factors influencing IT adoption
(Thong, 1999; Bassellier and Reich, 2003).

65
A number of other researchers have argued that a manager’s increasing age and tenure negatively
affect innovation and change in organisations. They indicated that senior managers have been
socialized into accepting prevailing organisational conditions and routines and have a greater
psychological commitment to them; hence, they will be less willing to commit to changing them
(Hambrick and Mason, 1984; Huber et al., 1993; Damanpour and Schneider, 2006a).
Correspondingly, managers new to their position are more receptive to innovation (Huber et al.,
1993).
A review of relevant literature has also identified other decision-makers’ traits that may influence
the adoption of IT innovation, such as the ability of HR practitioners to develop networking
activities and communication skills, as well as the degree of their knowledge, experience,
education, and level of training (Damanpour, 1991). While some studies have argued against the
impact of these characteristics on HR adoption behaviour (Daellenbach, McCarthy and
Schoenecker, 1999), others tend to support the relationship between these characteristics and the
adoption of innovation (Murphy and Southey, 2003). Damanpour and Schneider (2008 either 2009
or 2006) report that research findings on the effect of gender on innovation are mixed. DiTomaso
and Farris (1992) found that female R&D engineers tend to rate themselves lower than men do on
innovativeness, and Fox and Schuhmann (1999)found that female city managers tend to view
themselves as less entrepreneurial than their male counterparts. Damanpour and Schneider (2006)
found that gender does not significantly affect the initiation, adoption and implementation phases
of the innovation adoption process. Leadership research also suggests that despite possible
differences in characteristics and values between men and women, there is no strong evidence that
such differences would affect their leadership styles or behaviours (Bass and Pointon, 1990;
Hooijberg and DiTomaso, 1996).
Education is widely assumed to enhance innovation, as new ideas and solutions require knowledge
and expertise (Mumford, 2000). Likewise, educated administrators and managers are more likely to
use complex and diverse approaches to problem solving and decision-making (Bantel and Jackson,
1989; Huber et al., 1993; Lee, 2005). Since the newness of innovation creates a sense of
uncertainty, educated managers’ greater ability in gaining information to reduce that uncertainty
would facilitate the adoption of innovation (Rogers, 1995). Education also inspires receptivity to
new ideas, which plays an important role in both detecting the need for innovation and creating a
favourable environment for its implementation (Damanpour and Schneider, 2006). Damanpour and
Schneider (2009) also indicated that personal beliefs and attitudes tend to affect behavioural
intentions, which in turn influence actual behaviours and outcomes (Fishbein and Ajzen, 1972).
Although these variables may not necessarily determine managerial decisions due to the influence
of other factors such as education, job level and extrinsic rewards, the causation between attitudes
and outcomes is not always clear ( Walker and Enticott, 2004;Lonti, 2005). The adoption of

66
innovation is also affected by organisational leaders’ values, including reinvention values ( Rivera,
Streib and Willoughby, 2000;Moon, 2001) and leaders’ attitudes or dispositions, such as their
affiliation with professional organisations (Sabet and Klingner, 1993), and perceptions of
alignment of their interests in the innovation (Berry and Foster, 1998). In general, a manager’s pro-
innovation attitude or managerial innovation orientation positively affects innovation adoption
(Damanpour, 1991; Moon and Norris, 2005).
Leadership style is also considered the key precondition for successful implementation of any
system (Hussain and Cornelius, 2007; Rezaei et al., 2009) . Leadership style concerns the way in
which management tends to influence, coordinate, and direct people’s activities towards group
objectives (Aldag and Stearns, 1991; Robbins and Stuart-Kotze, 1994). Lu and Wang (1997)
indicated that many studies have classified leadership style into people-oriented and task-oriented
leaders. People-oriented leaders focus on inter-personal relationships and are concerned with
mutual trust, friendship, respect, and warmth. Conversely, task-oriented leaders tend to focus more
on the task aspect of jobs and deal with defining and organizing tasks for goal achievement.
Lu and Wang (1997) examined the relationship between leadership style with user participation
and systems’ effectiveness over MIS growth stages. The researchers found mixed results. They
found that leadership style varied in importance over the MIS growth stages. At the development
stage and the maturity stage, both people-oriented and task-oriented styles had a positive significant
relationship with system effectiveness. However, at the initiation stage, neither style influenced
system effectiveness (Lu and Wang, 1997). They argued that at the initiation stage, the innovation
is being introduced to the organisation and users must learn the new technology on their own.
Studies of organisational innovation have also found that senior executives influence the adoption
of innovation by creating a favourable climate toward innovation (Hage and Dewar, 1973; Dewar
and Dutton,1986; Nystrom and Wilson, 2002). For instance, innovation in information technologies
in both public and private sectors is facilitated by managers’ proactive orientation toward adopting
new technology (Thong and Yap, 1995; Moon and Norris, 2005). Although some studies have
found no relationship between managers’ attitude toward new public management (NPM),
reinventing government (RG) and adoption of the innovations associated with it (Julnes and
Holzer, 2001;Boyne et al., 2005), Kearney and Scavo (2000) found a positive relationship.
Researchers support the idea that managers with a more favourable attitudes toward innovation and
change are more likely to support ideas derived from existing practices and allocate resources to
acquire and implement them (Damanpour and Schneider, 2006). These managers facilitate
innovation by providing support to employees who propose new ideas, building coalitions among
different constituencies, and helping coordination and conflict resolution among units and members
(Hage and Dewar, 1973; Dewar and Dutton, 1986; Mumford, 2000). Studies that explored the
socio-demographic characteristics of decision-makers are listed in Table 2.6.
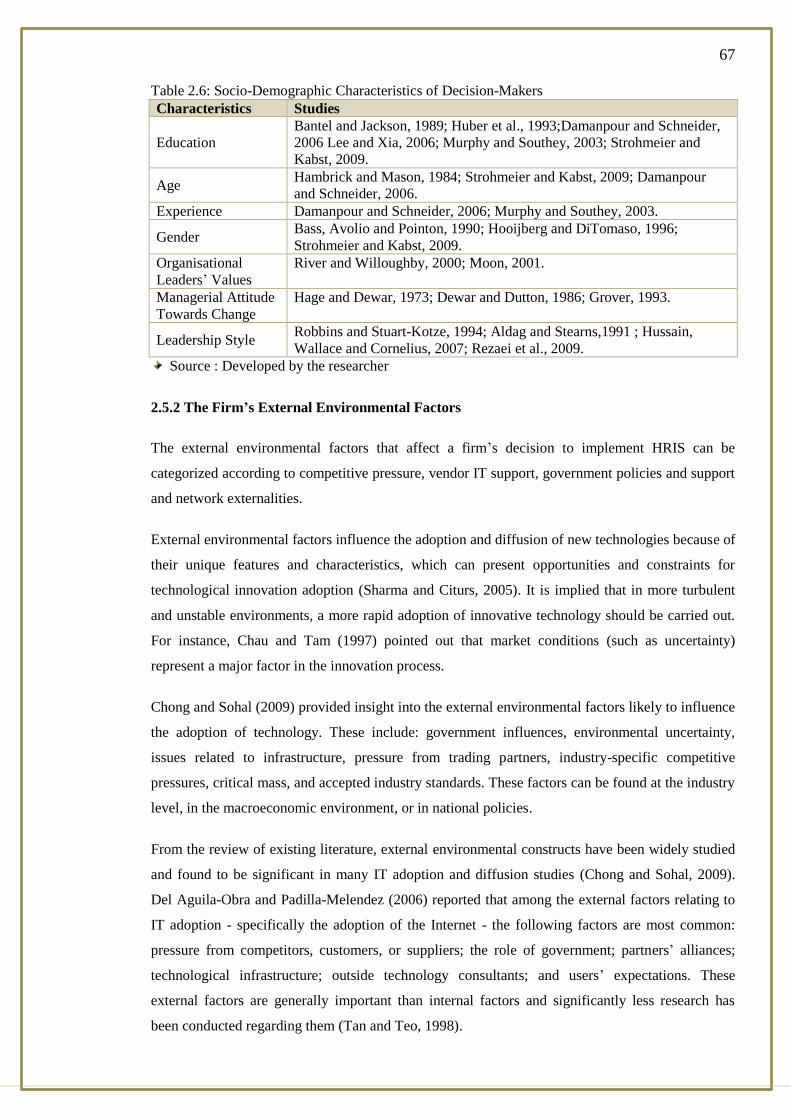
67
Table 2.6: Socio-Demographic Characteristics of Decision-Makers
Characteristics Studies
Education
Bantel and Jackson, 1989; Huber et al., 1993;Damanpour and Schneider,
2006 Lee and Xia, 2006; Murphy and Southey, 2003; Strohmeier and
Kabst, 2009.
Age Hambrick and Mason, 1984; Strohmeier and Kabst, 2009; Damanpour
and Schneider, 2006.
Experience Damanpour and Schneider, 2006; Murphy and Southey, 2003.
Gender Bass, Avolio and Pointon, 1990; Hooijberg and DiTomaso, 1996;
Strohmeier and Kabst, 2009.
Organisational
Leaders’ Values
River and Willoughby, 2000; Moon, 2001.
Managerial Attitude
Towards Change
Hage and Dewar, 1973; Dewar and Dutton, 1986; Grover, 1993.
Leadership Style Robbins and Stuart-Kotze, 1994; Aldag and Stearns,1991 ; Hussain,
Wallace and Cornelius, 2007; Rezaei et al., 2009.
Source : Developed by the researcher
2.5.2 The Firm’s External Environmental Factors
The external environmental factors that affect a firm’s decision to implement HRIS can be
categorized according to competitive pressure, vendor IT support, government policies and support
and network externalities.
External environmental factors influence the adoption and diffusion of new technologies because of
their unique features and characteristics, which can present opportunities and constraints for
technological innovation adoption (Sharma and Citurs, 2005). It is implied that in more turbulent
and unstable environments, a more rapid adoption of innovative technology should be carried out.
For instance, Chau and Tam (1997) pointed out that market conditions (such as uncertainty)
represent a major factor in the innovation process.
Chong and Sohal (2009) provided insight into the external environmental factors likely to influence
the adoption of technology. These include: government influences, environmental uncertainty,
issues related to infrastructure, pressure from trading partners, industry-specific competitive
pressures, critical mass, and accepted industry standards. These factors can be found at the industry
level, in the macroeconomic environment, or in national policies.
From the review of existing literature, external environmental constructs have been widely studied
and found to be significant in many IT adoption and diffusion studies (Chong and Sohal, 2009).
Del Aguila-Obra and Padilla-Melendez (2006) reported that among the external factors relating to
IT adoption - specifically the adoption of the Internet - the following factors are most common:
pressure from competitors, customers, or suppliers; the role of government; partners’ alliances;
technological infrastructure; outside technology consultants; and users’ expectations. These
external factors are generally important than internal factors and significantly less research has
been conducted regarding them (Tan and Teo, 1998).
68
2.5.2.1 Competitive Pressure
Several empirical studies show that competitive pressure is a powerful diver of IT adoption and
diffusion (Sadowski, et al, 2002; Beveren and Thomson, 2002; Scupola, 2003; Zhu and Xu, 2003;
Gibbs and Kraemer, 2004; Hollenstein, 2004). As organisations move towards a knowledge-based
economy, the pressures continue to grow for HR to reduce costs and serve a more strategic role in
the organisation (Chaveesuk, 2010; Strong and McCormick, 1999). As competitive pressures
increase, the importance of managing human resources becomes more apparent. Organisations are
thus using HRIS to help make more informed decisions, get the most out of their employees,
streamline HR processes, and better allocate HR resources. Hence, the drive to be competitive in all
business aspects will lead to the adoption and use of HRIS.
However, Teo (2007) found that competition was not a significant factor influencing the adoption
of HRIS, indicating that competition does not truly provide any direct impetus for organisations to
adopt HRIS. This result may be due to the fact that many top managers and boards of directors
perceive HRIS as more administrative than strategic, therefore do not view HRIS as being able to
deal with the competition in the external environment. This implies that competition in the external
environment would not induce organisations to adopt HRIS, however once they have adopted
HRIS and are more familiar with it and aware of its benefits, companies are willing to invest even
further in HRIS when faced with additional external environmental pressures.
2.5.2.2 Vendor IT Support
There is an extensive research that testifies external IT expertise of consultants and vendors along
with their quality is among the essential aspects of the IT adoption process (Kim and Galliers,
2004; Ghobakhloo, Arias-Aranda and Benitez-Amado, 2011). Studies have also shown that
supplier-marketing activities have a significant effect on the adoption decision. According to
Rogers and Shoemaker (1983), marketing activities and competitive strategies play an important
part in the adoption of innovations and it has been found that vendors play a significant role in
determining adoption decisions (Dash, 2001). Supplier marketing includes vendor efforts to inform,
educate, and encourage trial and adoption of the innovation among their target audience.
Vendor refers to IT-related assistance received from outside the firm (e.g. external consultants).
Since small firms in particular often lack access to sufficient internal IT resources, external support
is a key enabler of technology adoption (Cragg and King, 1993; Raymond and Bergeron, 1996). In
fact, several studies have shown that most SMEs are suffering from lack of IT experts and hiring
external consultants (Gable, 1991; Soh and Raman, 1992; Premkumar and Roberts, 1999;
Walczuch and Lundgren, 2000; Thong, 2001). Nguyen (2009), Morgan, Colebourne and Thomas
(2006) and Cragg and Zinatelli (1995) pointed out that a lack of internal expertise has seriously
hindered IS sophistication and evolution within small firms, and that these firms must overcome
69
this problem through help from external sources or developing their own internal end-users’
computing skills (DeLone, 1981). In a similar context, effectiveness of external expertise is also an
influencing factor in IT adoption within SMEs (Fink, 1998; Thong, 2001Morgan and Thomas,
2006). Thong (2001) revealed that small businesses with higher levels of IS consultant
effectiveness have higher-levels of user satisfaction and overall IS effectiveness.
Easingwood and Beard (1989) indicated that different marketing variables might stimulate or
facilitate adoption, and they specified three in particular that can be expected to significantly affect
adoption probability: the targeting of the innovation, the communication on the innovation, and the
activities the supplier undertakes to reduce the risk of adoption for the potential customer.
The quantity, quality, and value of information provided by the supplier of the innovation were also
found to influence the adoption decision (Clark and Rogers, 1989). Quaddus and Hofmeyer (2007)
discovered significant statistical evidence that points to a positive relationship between awareness
of innovation and the influence of the vendors of business-to-business trading exchanges in the
context of small businesses in Western Australia. The study found that small business
organisational characteristics are likely to exert an influence on the business’ attitude towards
adopting a business-to-business trading exchange. The study asserted that awareness is a
considerable perception factor. Specifically, it found that vendors of an innovation influenced the
awareness of that innovation.
2.5.2.3 Government Policies and Support
A survey of the literature shows a favourable relationship between IT adoption and government
support (Yap, and Raman, 1994 Thong and Tilley, 2000; Ahuja, and Shankar, 2009; Tan et al.,
2009). Government actions and programs could directly and/or indirectly stimulate the
enhancement of IT infrastructure and information provision to energize faster technology diffusion.
Ghobakhloo, Arias-Aranda and Benitez-Amado (2011) in a study of IT adoption by Chinese
companies suggested that government policies can have a significant influence on a firm’s IT
infrastructure construction and management, but cannot directly influence firm’s IT usage.
Other studies have indicated that government assistance is generally unhelpful. A study by Dutta
and Evrard (1999) on small businesses in six different European countries indicates that despite
government attempts to assist SMEs in adopting IT by increasing public spending on technology
projects, there are adoption barriers in the governmental agencies’ mechanisms to help these
businesses. This finding is consistent with a study by Yap, and Raman (1994), which compared the
computerisation experience of 40 small businesses through a government incentive program with
another 40 small businesses computerized autonomously (without government assistance). The
study found that participation in a government computerisation program does not necessarily result
70
in a more effectual IS. Furthermore, Fink (1998) found that government grants do not appear to be
a significant factor supporting IT adoption within Australian SMEs.
Murad and Thomson (2011) stated that, when considering government policies, one must look for
actions or regulations that may ultimately affect technology adoption in a nation - such as
investment tax credits aimed at making adoption easier or more accessible to certain groups of
organisations. Government legislation and policies on economic development, technology transfer,
and employee relations are among the wider political influences on technological and
organisational decisions (Kossek et al., 1994; Williams and Edge, 1996). On the topic of employee
relations, the presence of a union in an organisation that wants to undertake more organisational
innovation can be very beneficial. Workers in unionized businesses may be more willing to
participate in employee involvement programs since they feel the union will protect their overall
employment security. However, Ichniowski and Prennushi (1995) and Freeman and Kleiner (2000)
found that workers’ desire to unionize decreases if the firm at which they are employed already has
an employee involvement program, as this generates the feeling that they already have some voice
in the firm. Additionally, unions may view the introduction of alternative channels for worker voice
as a challenge to their authority and a way to limit their power and influence.
The exact relationship between unionisation and employee involvement program remains unclear.
While Freeman and Kleiner (2007) and Ichniowski, Shaw and Prennushi (1995) found a negative
association between unionisation and the likelihood of introducing an employee involvement
program, Osterman (1994) found no impact. However, Freeman and Kleiner (2007) also found that
once introduced, unionized firms are less likely to terminate such programs. Although this picture
has been changing rapidly during and since the 2000s, businesses within developing countries also
face their own set of issues, including lack of telecommunications infrastructure, lack of skilled
staff, low Internet penetration, and the hesitant adoption behaviours (Huff and Yoong, 2000).
Strohmeier and Kabst (2009) revealed that because many institutions dealing with topics such as
legislation, education, and industrial relations are nationally based, businesses are under pressure to
adapt to their national institutional environment to maintain legitimacy and recognition (Morgan,
2007). National data protection legislation offers a plain example. If rigid national data protection
forbids the transfer of personal data via the Internet, the collaboration function of e-HRM will be
strongly and negatively affected.
2.5.3.4 Network Externalities
This concept holds that the value of use to any single adopter is positively affected by the size of
the network of other users (Katz and Shapiro, 1986). Organisations may apply a new technology
due to a general trend among comparable firms in the market environment that have applied that
particular technology. In the literature these external contingencies have been theorized as the
concept of network externalities or critical mass (Markus, 1990; Rogers, 1991; Katz and Shapiro,
71
1994; Kraut et al., 1998). Katz and Shapiro (1985) found that there are many innovations for which
an adopter’s utility increases with the number of other adopters, which they termed the network
externality concept.
Frambach and Schillewaert (2002) stated that the theory of network externalities claims that the
value of the focal innovation, and hence, its adoption probability, is intrinsically determined by the
number of other users. In the case of organisational innovation adoption, positive network
externalities exist when the intrinsic utility of an innovation increases as a firm’s suppliers,
customers, or other organisations also use the innovation. For example, information systems may
generate greater value and gain importance once a sufficient degree of a firm’s business partners
rely upon these systems as well. Rogers and Singhal (2003) claim that communication between
members of a social network can enhance the speed of innovation adoption.
The extent to which organisational members share information with other organisations is referred
to as their degree of interconnectedness. The greater the level of informal information sharing, the
more likely organisational members will be exposed to new ideas (Wejnert, 2002;Rogers and
Singhal, 2003). Lu and Yu (2005) found a causal relationship between social influence and
intention to adopt innovative mobile technology. Sykes and Gosain (2009) found links between
social network density and employees’ use of technology. Empirical evidence suggests that
external influences are important factors for adoption of innovation (Standen and Sinclair-Jones,
2004; Khoumbat and Irani, 2006).
The fact that a large number of organisations have adopted a new technology can help legitimize its
use and facilitate the adoption of the innovation by others (Abrahamson, 1991). Once legitimacy
concerns are overcome and the innovation proves to be successful, the propensity of an individual
firm to adopt the innovation increases as the number of adopting organisations increases. Assuming
that the innovation proves successful, most organisations will eventually adopt the innovation
(Boeker and Paul Huo, 1998). Several authors on organisation behaviour (e.g., Kraut et al., 1998)
provide the important finding that network externalities seem to be most prevalent when there is a
critical mass of users within an individual’s reference or work group. Similarly, Damanpour (1991)
found a positive relationship between communication and the successful adoption of organisational
innovation. However, the innovation usage by others in an individual’s social environment is also
important for innovations that do not possess interactivity. The innovation usage of a focal
individual’ peers (e.g., superiors, colleagues, customers etc.) may signal the importance and
advantages of the innovation and motivate the individual to imitate and adopt the innovation. The
participation of members of an organisation in an informal network of relations facilitates the
spread of information on a certain innovation and therefore may have a positive influence on its
rate of adoption (Zaltman and Holbek, 1973).

72
It has also been found that the interaction between members of a social system can enhance the
speed and rate of the adoption and diffusion process (Valente, 1995). The participation of
organisation members in informal networks facilitates the spread of information about an
innovation, which may positively influence the probability of an organisation adopting the
innovation. Such an informal network may either connect organisations within the industry or
organisations in separate industries. Several studies have shown that higher levels of network
participation are associated with a higher rates of awareness of an innovation, and thus with a
higher likelihood of adopting it (Abrahamson and Rosenkopf, 1997).
From social, psychological and economic perspectives, two types of social influence are
distinguished: social norms and critical mass. Igbaria, Parasuraman and Baroudi (1996) concluded
that usage levels within the organisation influence computer acceptance. However, it is believed
that organisational members will exhibit more positive attitudes if people in their social
environment also use the specific innovation. As result, social usage may influence acceptance over
and above the attitudes held. Social norms or pressures have also been recognized as determinants
of acceptance behaviour (Davis, 1989). Social norms refer to “a person’s perception that most
people who are important think that he should or should not perform the behaviour in question”
(Fishbein and Ajzen, 1975, p. 302). Social norms may influence an individual’s acceptance
behaviour directly if the focal individual is willing to comply with mandates of important peers
who think an innovation should be accepted. The effects of social norms may also be indirect,
experienced through attitudes. While some studies (Davis, 1989; Mathieson, 1991) found no direct
significant effect of social norms on acceptance, Igbaria, Parasuraman and Baroudi (1996) found
significant direct effects.
Recent debate about the relationship between technology and social organisation has highlighted
the importance of social context in innovation adoption (Dery and Wailes, 2006; Barut and
Dogerlioglu, 2010). Accordingly, theories which can be considered as ‘social constructivist’ play
an important role in the study of technology, as they explicitly recognize that technologies such as
HRIS cannot be evaluated and analysed without having an explicit understanding of the context in
which individuals and groups consequently comprehend, interpret, use, and engage with the new
technology (Williamsz, 1996;Grint and Woolgar, 1997; Orlikowski and Iacono, 2001).
2.6 The limitations of the Previous Studies
In reviewing the academic literature a wide range of firm-level factors that have the potential to
enable technology adoption at the organisational level can be identified. Those factors are
presented and discussed under two broad dimensions: internal and external environmental factors.
Studies of organisational adoption in different disciplines allow us to identify a set of factors that
have been found to influence the acceptance of new practices by organisations. However, It should
be noted previous studies on adoption of innovation at organisational level have examined the

73
determinants processes and consequences of adoption innovation (e.g. Detert and Mauriel, 2000;
Krishna and Bhaskar, 2011), however few of these studies have developed a conceptual
framework.
A review of previous studies has shown that HRIS adoption behaviour remains under-researched
and that the majority of these studies have focused on the status of HRIS use and other HR
applications, which have been integrated as a part of HRIS (Al-dmour, et al 2013;Al-dmour, et al.
2014). Specifically, too little research has been done to address the effect of external factors on the
adoption and implementation of HRIS applications, in order to provide a comprehensive range of
these factors. It is also noted that the majority of these studies have examined the adoption of HRIS
applications as an innovation in service sectors such as public universities, hospitals, banks, and
account offices, while few studies were conducted in manufacturing sectors. Therefore, the
findings of these studies cannot be generalized beyond these sectors.
The studies in general followed a quantitative approach based on survey. The tools employed were
in general: interviews, self-administered questionnaires and online surveys. A variety of models
were employed to examine IS adoption behaviour in various locations worldwide; hence the
generalizability of these models across cultures has not been fully investigated or covered so far in
the literature review (Al-dmour, et al. 2013; Al-dmour, et al 2014).
A review of literature showed that there is general agreement that factors determining technology
adoption depends on the type of technology suggesting that no one-standard approach can be
adopted across technologies and that factors that motivate the adoption of specific technologies
require specific attention (e.g. Walker, 2006). This is consistent with criticism of existing
technology adoption research according to which “search for a universalistic theory may be
inappropriate given the fundamental differences that exist across innovation types’’" Walker, 2006,
P. 311). The adoption process of HRIS applications are also considered highly complex and costly
and might be driven by external environmental factors. The impact of such factors could be more
important in the developing countries such as Jordan than in well- developed countries.
A large number of the previous studies of IT adoption are cross-sectional, employing a survey
method or a case study to assess various factors affecting adoption, including the characteristics of
IT, the organisations, and the external environment (Al-dmour, et al. 2014) t. Generally, they make
use of factors identified from the organisational innovation adoption literature rooted of innovation
theory, assess the relevance of these factors to a particular IT under study, and in some cases
identify additional factors. For example, Wejnert (2002) revealed that the previous studies
demonstrate a broad array of factors can significantly influence the probability of whether an
organisation will adopt HRIS. Analyses of these studies showed that these diffusion factors were
examined independently for the sake of clarity; however, in reality they might exert their effects on
the process of diffusion interactively. The interaction between factors can be either potentiating or

74
mitigating, and the relative weight of each variable may change according to the circumstances
characterizing the innovation and its context (Wejnert, 2002).
Furthermore, reviews of these studies showed that its results are inconsistent and conflicting.
Empirical evidence produced mixed findings regarding many aspects as discussed through the
literature, for example the impact of the firm’s parameters (i.e., size, experience etc.) on the
adoption process. It was also noted that some of these investigations were conducted in isolation,
without benefit from the experience of findings from other studies. It should also be noted that the
majority of these studies are confined to the experience of developed countries such as in Europe
and the US.
It is worth mentioning that despite fifty years of investigating adoption of innovation in
organisations, academic research has not produced compatible theories that can direct management
practice (Tidd, 2001). It is observed that although the adoption process consists of different stages,
most of innovation of IT adoption studies focuses on the dichotomous adoption/ non-adoption
decision. Furthermore, previous studies did not give clear evidence on how the interaction of the
internal factors and external factors can influence the organisation’s adoption of HRIS behaviour
and its implementation level and none of these studies have articulated the differences in the
determinants of the adoption of HRIS and its implementation of applications.
It was observed that in many of these studies, practical implications of research findings are only
stated in general terms, and little attempt has been made to report the reliability of the scales of
measurement used for data collection (Al-dmour et al., 2014). Furthermore, much of the early
research on innovation emphasizes using the individual as the unit of analysis, whereas more recent
research uses the organisation (Rogers, 1995). Innovation takes place in two processes. Innovation
adoption refers to when innovation takes place at the initiation stage, whereas at the
implementation stage it is called innovation diffusion. The study of innovation should be
distinguished between these two processes and needs either cross-sectional or longitudinal
investigation. This study, therefore, has come to bridge this gap by exploring factors determining
the adoption and implementation of HRIS applications and its value in a cross sectional way using
organisation as the unit of analysis. The aim of this study is to overcome the above limitations of
the previous studies and to improve the understandings of the adoption behaviour of HRIS
applications in the environmental context of Jordanian organisational culture, a developing country.
2.7 The Effectiveness of HRIS Studies
A review of literature indicated that a number of studies tried to examine the value and the impact
of IS on the performance of HR functions. The major challenge that HR managers face nowadays
is to assess the effectiveness of HRIS, especially, because they needs to justify the value-added
contribution of the HRIS to achieve the organisation’s objectives and goals in order to justify the

75
initial investment required (Hagood and Friedman, 2002). Adoption and implementation of an
HRIS program may seem an important sub-system for any organisation, but unless it will be an
effective tool for HR operations, it will not help increase effectiveness and may hinder it instead.
The functionality and purpose of an HRIS has become more complicated and complex in the recent
years, in response to greater organisational requirements and demand, as well as more advanced IT
solutions. Beckers and Bsat (2002) observed that increasing demands placed on HR by employees
as well as internal and external forces are making traditional HR management completely
insufficient. According to Tansley and Watson (2000), IS can be considered as a tool for managers
to use in general and in human resourcing functions to increase the capabilities of the organisation.
For this reason, HR managers and IS researchers emphasize the importance of understanding the
factors that help HRIS to be more effective (Hussain, and Cornelius, 2007; Ngai and Wat, 2006).
Wright and Snell (1998) estimate that most HR departments spend approximately 65-75% on
transactional activities, 15-30% on traditional activities, and 5-15% on transformational activities.
One of the major purposes of the design, development and implementation of an HRIS is to reduce
the amount of time HR employees have to spend on transactional activities, allowing the staff to
spend more time on traditional and transformational activities. This notion of using technology to
improve transactional activities and accomplish them more efficiently and provides one of the
primary justifications for a computer-based system.
Ngai and Wat (2006, p.57) state that “organisations are driven by different forces when
implementing their IT management systems. Practically, organisations are hesitated to apply HRIS
unless they are convinced of the benefits that this would bring to their organisations”. Thus, several
effectiveness measures that are illustrated in Table 2.7 have been adopted to assess the effect of
HRIS. For example, according to Beadles and Johns (2005), to examine the effectiveness of HRIS,
two levels can be measured: the administrative use of HRIS and its strategic use, whose ultimate
purpose is to increase organisational value. However, a variety appears when analysing HRIS
usage at these two levels (Ball, 2001). Administrative HRIS is used in day-to-day operations,
usually in the form of records that hold employee information. Administrative HR is much more
efficient when it is used with IT because HR professionals are better able to handle large amounts
of information efficiently. In this regard, Kovach et al. (2002) and Kovach and Cathcart (1999)
argue that HRIS information could be used for administrative purposes that reduce costs and time;
HRIS is used according to them also for more analytical decision support.
Compared to administrative HRIS measures, Beadles and Johns (2005) revealed that strategic
HRIS measures are much more complex to explain because there is no way to make sure that the
benefits have a direct result of strategic use of an HRIS system (Kovach et al., 2002). According to
Kettkey and Reily (2003), the use of technology makes HR activity more efficient, and moreover it
facilitates a change in emphasis for HRM to make it more strategic within the organisation. Shani
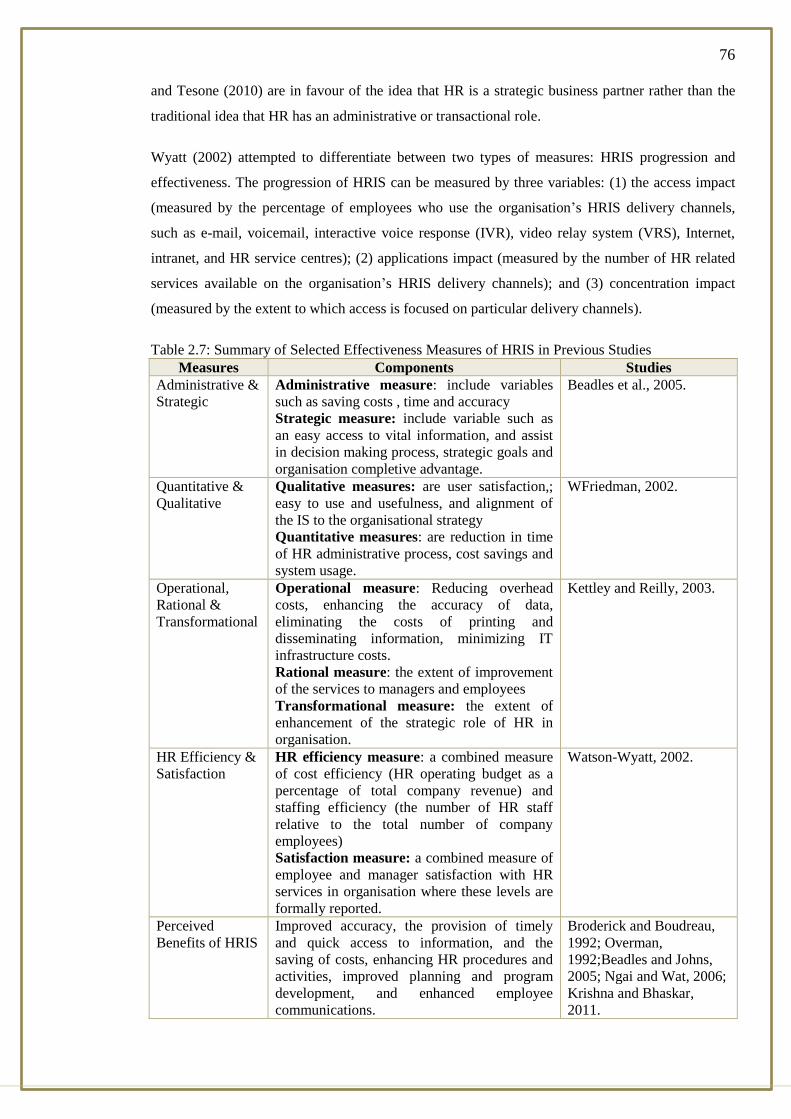
76
and Tesone (2010) are in favour of the idea that HR is a strategic business partner rather than the
traditional idea that HR has an administrative or transactional role.
Wyatt (2002) attempted to differentiate between two types of measures: HRIS progression and
effectiveness. The progression of HRIS can be measured by three variables: (1) the access impact
(measured by the percentage of employees who use the organisation’s HRIS delivery channels,
such as e-mail, voicemail, interactive voice response (IVR), video relay system (VRS), Internet,
intranet, and HR service centres); (2) applications impact (measured by the number of HR related
services available on the organisation’s HRIS delivery channels); and (3) concentration impact
(measured by the extent to which access is focused on particular delivery channels).
Table 2.7: Summary of Selected Effectiveness Measures of HRIS in Previous Studies
Measures Components Studies
Administrative &
Strategic
Administrative measure: include variables
such as saving costs , time and accuracy
Strategic measure: include variable such as
an easy access to vital information, and assist
in decision making process, strategic goals and
organisation completive advantage.
Beadles et al., 2005.
Quantitative &
Qualitative
Qualitative measures: are user satisfaction,;
easy to use and usefulness, and alignment of
the IS to the organisational strategy
Quantitative measures: are reduction in time
of HR administrative process, cost savings and
system usage.
WFriedman, 2002.
Operational,
Rational &
Transformational
Operational measure: Reducing overhead
costs, enhancing the accuracy of data,
eliminating the costs of printing and
disseminating information, minimizing IT
infrastructure costs.
Rational measure: the extent of improvement
of the services to managers and employees
Transformational measure: the extent of
enhancement of the strategic role of HR in
organisation.
Kettley and Reilly, 2003.
HR Efficiency &
Satisfaction
HR efficiency measure: a combined measure
of cost efficiency (HR operating budget as a
percentage of total company revenue) and
staffing efficiency (the number of HR staff
relative to the total number of company
employees)
Satisfaction measure: a combined measure of
employee and manager satisfaction with HR
services in organisation where these levels are
formally reported.
Watson-Wyatt, 2002.
Perceived
Benefits of HRIS
Improved accuracy, the provision of timely
and quick access to information, and the
saving of costs, enhancing HR procedures and
activities, improved planning and program
development, and enhanced employee
communications.
Broderick and Boudreau,
1992; Overman,
1992;Beadles and Johns,
2005; Ngai and Wat, 2006;
Krishna and Bhaskar,
2011.

77
The effectiveness of HRIS can be measured by two variables: (1) HR efficiency, which is a
combined measure of cost efficiency (HR operating budget as a percentage of total company
revenue) and staffing efficiency (the number of HR staff relative to the total number of company
employees); and (2) satisfaction, a combined measure of employee and manager satisfaction with
HR services in organisation where these levels are formally reported. Beside these HRIS
progression and performance measures, Watso-Wyatt (2002) suggested usage of information about
the organisation’s HRIS strategy, business case, performance metrics and practices, concluding that
more HRIS progression does not necessary lead to better HR performance. The study revealed that
implementation effectiveness could be a necessary but not enough condition for HRIS
effectiveness.
When assessing the effectiveness of an HRIS, Hagood and Friedman (2002) suggested two types of
measures: qualitative and quantitative parameters. The main components of the qualitative measure
are: user satisfaction, while reflects attitudes and beliefs toward the IS; ease of use and usefulness,
which are positively related to user satisfaction; and alignment of the IS to the organisational
strategy. The components of quantitative measure, on the other hand, are reduction in time of HR
administrative process, cost savings and system usage. The implementation of information systems
should ultimately improve business results of the organisations and therefore long-term
performance of key business indicators such as gross margin is the basis for the ideal measurement
of success (Nicolaou, 2004).
According to Kettley and Reilly (2003), the perceived impact and advantages of HRIS can be
examined by: (1) operational value (i.e., cost effectiveness is intended by enhancing the accuracy
of data and reducing the headcount and the cost of the services); (2) Rational value (i.e., improving
the services to managers and employees, who are increasingly demanding); and (3)
transformational value, which concentrates on the critical strategic facets of the organisation
(Shrivastava and Shaw, 2003). Overman (1992) revealed that the potential benefits of HRIS are
faster information processing, greater information accuracy, improved planning and program
development, and enhanced employee communications.
According to Broderick and Boudreau (1992) HRIS affects effectiveness in four different ways: it
emphasises the increased productivity of the workforce, recruitment, short term working,
temporary, and less redundancies; it deals with the increasing demands made by legislation, which
is related to HR practices and the increased need to produce statistics for government purposes; it
concerns the rate of the development in computer technology and HRIS is increasingly low cost.
The professional body argued that effective HRIS use leads to efficiency (Krishna and Bhaskar,
2011).
Beckers and Bsat (2002) mentioned four values for implementing HRIS, related to the facts that
HRIS helps organisations: (1) to increase competitiveness by developing and enhancing HR
78
procedures and activities; (2) to generate or create a greater and a range of many HRM reports; (3)
to shift the role of HRM from transactions to (SHRM); and (4) to reengineer the whole
HRM\personnel department\section of organisations (Beckers and Bsat, 2002). Ngai and Wat
(2006) argue that improved accuracy, providing timely and quick access to information, and saving
costs are the most mentioned influence of HRIS in previous studies. Additionally, HRIS is used to
support strategic decision making, to evaluate programs or policies, or to support daily operating
concerns (Kundu and Kumar, 2007).
Mathis (2003, p. 74) explained HRIS as “an integrated system providing information used in HR
decision making”. An HRIS serves two major purposes in organisations: (1) improves the
efficiency with which data on employees and HR activities are compiled; (2) having accessible data
enables HR planning and managerial decisions making to be based to a greater degree on
information rather than relying on managerial perceptions or intuitions (Jackson et al., 2003).
Furthermore, Walker (2001) and Lengnick-Hall and Moritz (2003) revealed that the
implementation of HRIS will create informational efficiencies and cost savings such that HR
departments can turn their attention to providing better analysis of current data and creative uses of
the HRIS to provide better and more accurate data upon which to base strategic decisions.
Likewise, Haines and Petit (1997) argue that the human resource professionals develop a service
orientation and participate more in making strategic decisions due to HRIS, since their time is not
dominated by routine paper handling tasks.
Delone and McLean (2003) conducted a comprehensive review of previous studies and suggested
an IS success model. The important variables in their model of IS effectiveness included system
quality, information quality, system use, user satisfaction, individual impact of IS and
organisational impact of IS. They agree that the main goal of the HRIS is strategic. This attributed
to the quality and value of the information provided to managers and HR staff for decision making
purposes and the need to assist HR managers to be more focused on strategic HR activities, such as
facilitating organisational transformation and supporting in knowledge management (Kovach et al.,
2002; Shrivastava and Shaw, 2003).
It has been recognized that the most important problem with deciding whether HRIS benefits the
organisation is measuring the effect of HR (and more particularly HRIS) on the bottom line.
Beadles and Johns (2005) argued that clear cut ways to assess the value of HRIS are few. Mayfield
and Lunce (2003) believe that there are some measurements for administrative HRIS, such as cost
reductions in the HR department. On the other hand, they believe it is not easy to measure exactly
the return on investment (ROI) and specific improvements in productivity within the HR
departments. The ideal assessment of HRIS success might include hard measures such as ROI; the
control of extraneous variables makes this type of measurement of success difficult or even

79
impossible. This is why user satisfaction and perception of the system has often been used as a
proxy measure for the effectiveness of the system (Haines and Petit, 1997).
It is obvious from the existing studies that there is no one single and clear measure for assessing the
effect of HRIS on the performance of HR functions. Choosing the appropriate measure of
effectiveness is mainly based on the purpose of its use and availability. The existing studies on
HRIS suggest that they have different impacts on HR across organisations, but provide little
explanation for this variation. Furthermore, there is no clear evidence whether the perceived of
these potential benefits of HRIS or improvements will be static or dynamic according to the level
of implementation or practicing of HRIS applications. Therefore, this study will try overcome such
problems by examining the effect of HRIS on HR performance based on the level of
implementation of such applications in business organisations in Jordan, a developing country.
2.8 Chapter Summary
In this Chapter, a review of adoption innovation theories at the organizational level was presented
as a basis of theoretical background for the purpose of the study. A discussion of empirical studies
in adoption and implementation of HRIS then followed to identify the variables which are likely to
have an impact of the firm's adoption of HRIS and its level of implementation of HRIS applications
and effectiveness.
The diffusion on innovation (DOI) theory, the technology, organization, and environment (TOE)
framework and unified theory of acceptance and use of technology (UTAUT) were presented and
discussed simultaneously as theoretical perspectives for the purpose of the study. The firm’s
adoption behaviour of IT innovation is viewed as an interaction between its internal characteristics
and factors that exist in its external environment.
For the purpose of this study, the content analysis of findings of the previous studies concerning
these factors is presented and discussed under three sections: (1) The firm's internal environmental
factors (2)The firm's external environmental factors and (3) The HRIS effectiveness studies. The
factors that are concerned with firm's internal environment are further presented under nine
headings (1) Organization’s Readiness and Competences (2) Organization's Demographic
Characteristics (3) Organizational Structures (4) Top Management Support and Commitment (5)
Organization Culture (6) Perception of IT Classical Innovation Characteristics (7) Perceived
Benefits/Motives of adoption of HRIS (8) Perceived Barriers to the adoption of HRIS (8) Scio-
Demographic Characteristics of Decision-makers/leaders.
The studies that are related to the firm's external environmental factors, are few in nature and
fragmented, therefore, to a greater extent much of the work of this section is drawn from the IT
innovation adoption models and literature review. For the purpose of this study, the constructs of

80
the firm's external environmental factors are presented and discussed under the following headings:
(1) Competitive Pressure or Epidemic factors (2) Vendor Support and Marketing Activities (3)
Government Policies and Support and (4) Social Network (Network Externalities). With regard to
HRIS effectiveness, several studies were also presented and discussed. The following chapter is
dedicated to the presentation and discussion of the nature of the conceptual framework for this
study, its main constructs and the expected relationships among them, and it presents the proposed
hypotheses.
81
CONCEPTUAL FRAMEWORK CHAPTER 3:
3.1 Introduction
In the previous chapter the literature review related to adoption and implementation level of
HRIS and its effectiveness were presented and discussed. This chapter discusses the conceptual
framework for this study, its main constructs and the expected relationships among them as well as
it present the proposed hypotheses.
3.2 The Nature of the Conceptual Framework
In the previous chapter, empirical studies on the adoption and implementation of technology
innovation and HRIS as well as the relevant theoretical literature on adoption theories at the
organisational level were reviewed and integrated to develop a conceptual framework to guide this
study. The proposed framework has tied together the factors (i.e., constructs) which are postulated
to determine organisational adoption or level of implementing HRIS applications and its
effectiveness. These factors are mainly derived from two broad dimensions: the organisation’s
internal and external environment. According to the organisational behavioural theories,
organisational business behaviour is linked to the environment in which it takes place; therefore,
the organisation’s adoption behaviour with HRIS is thought to be a function of the interaction of
the constructs of both internal and external environmental dimensions. However, the effect of the
latter has been given little attention in previous HRIS adoption studies. In other words, the effect of
internal environmental dimension was the main focus of the previous studies in this field.
The model proposed here is used to investigate the previous adoptions and to isolate the factors that
are likely to lead to future successful adoptions. Using theoretical foundations from established
information systems implementation research and innovation diffusion theories (e.g. Innovation
Diffusion Theory (ID), Unified Theory of Acceptance and Use of Technology (UTAUT),
Technology-Organisation-Environment (TOE) framework) and HRIS literature, this research seeks
to explain HRIS implementation success by examining factors that may be influencing the
adoption, and its effectiveness Table 3.1. The expected relationships of these factors with the
adoption of HRIS applications and its effectiveness are shown in (Figure 3.1). Consequently,
technological innovation adoption has importantly been a major theory for this study. The
framework focuses on IT diffusion and adoption in terms of technology (HRIS applications),
organisational aspects, and inter-organisational aspects in order to see who might be the real
beneficiaries of technology adoption. The following definitions of adoption and diffusion have
been chosen to distinguish these two key concepts. “Adoption” is a decision to make full use of an
innovation as the best course of action, whereas rejection is a decision not to adopt an available
innovation (Rogers 1983, p. 21; Rogers and Shoemaker, 1983).

82
Table 3.1: Main constructs of the Study’s Conceptual Framework Construct Elements DOI
Model
UTAUT
Model
TOE
Model
Prior
Studies
(e.g.)
Internal Constructs
Management
expectation &
perceived
characteristics
Motives/benefits
of HRIS adoption
Perceived
characteristics
for innovation
Performance
expectancy
Performance
expectancy
Nagai and
Wat, 2004
Organisation’s
dynamic
capabilities,
readiness&
competences
Size &
employment
structure
Size Size Nagai and
Wat, 2004
Business
experience
Teo and
Fedric, 2001
Configuration of
HR
Effort
expectancy
Nagai and
Wat, 2004
Organisation
resources
Organisation
slack
Organisation
slack
Bakker, 2010
IT experience &
capabilities
Internal
facilitating
condition
Molla and
Licker, 2005
Organisation
structure
Organisation
structure
Formalisation,
centralisation,
specialisation
Formal &
linking structure
Eder and
Igbaria, 2001.
Management
commitment
& corporate
culture
Top management
support
Attitude toward
change
Urbano and
Yordanova,
2008
Intra-organisation
communication
Type & source
of
communication
Communication
process
Murphy and
Southey, 2003
Corporate culture Attitude toward
change
Martins and
Terblanche,
2003
Socio-
demographic
characteristics
of decision
maker
Individual
(leader)
characteristics
Individual
(leader)
characteristics
Murphy and
Southey, 2003
External constructs
Industry
characteristics
& Market
structure
Industry IT
supplier support
External
facilitating
condition
Technology
support
infrastructure
Kim and
Galliers, 2004
Al-Dmour and
Shannak, 2012
Market Structure
Competition
Chaveesuk,
2010
Social
influences
(externalities
network)
System openness
Social influence
Barut and
Dogerlioglu,
2010; Dery,
Hall and
Wailes, 2006
; Al-Dmour
and Shannak,
2012
Government
policies &
support
Government
policies
Government
regulation
Tan et al.,
2009; Al-
Dmour and
Shannak, 2012
Developed by the Researcher
These are some examples of previous studies for more details (see Chapter two and Appendix 4)
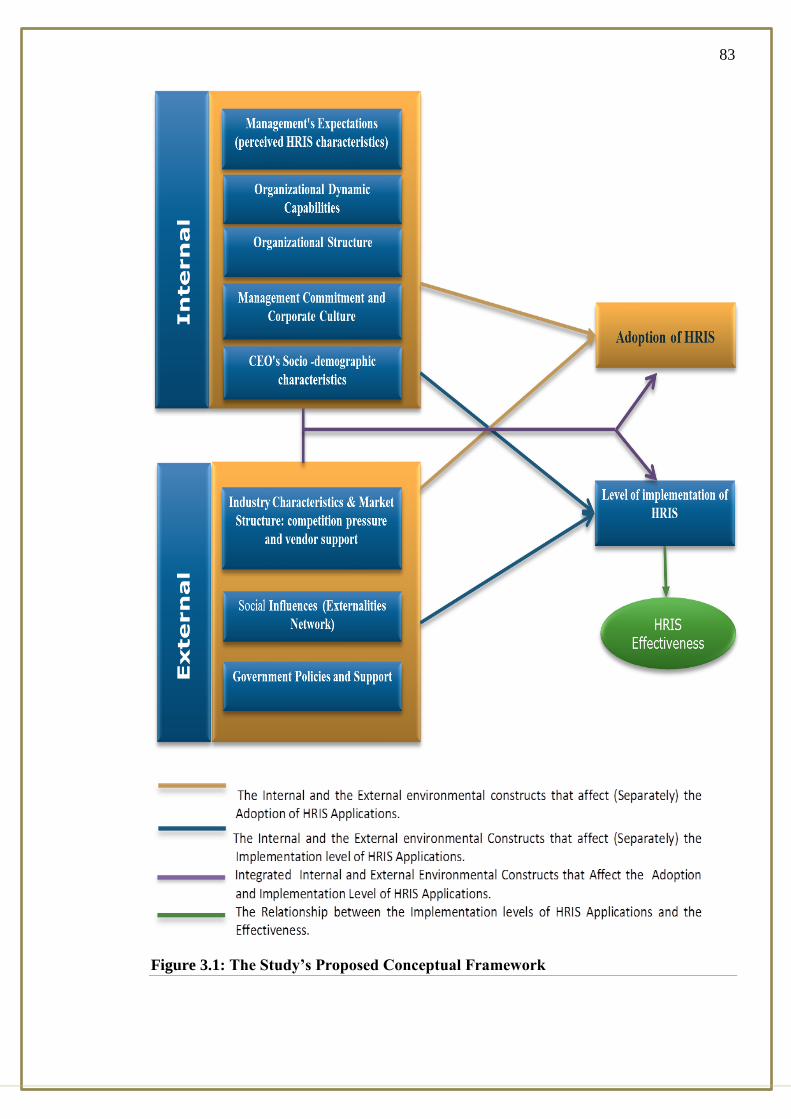
83
Figure 3.1: The Study’s Proposed Conceptual Framework
84
In the context of this study, adoption is defined as the decision by the Jordanian business
organisations to apply and implement HRIS for performing HR functions. In contrast, rejection
means the decision not to adopt HRIS in HR functions and operations. There are two levels of
adoption. Initially, the innovation must be purchased, adopted, and acquired by an organisation.
Subsequently, it must be accepted by the end users in that organisation (Manross and Rice, 1986).
In this study, it is proposed that several internal and external environmental factors influence
different levels of HRIS adoption and implementation for HRM activities such as planning,
staffing, compensation, etc.
In their recent systematic review, Rye and Kimberly (2007) differentiate between thinking about
adoption as a distinct organisational event or as including both the adoption decision and
implementation. The ‘key dimension’ of adoption for them is ‘that the focal organisation secures or
maintains access to innovations’. They defined organisational adoption as ‘the discrete
organisational decision to accept or reject an innovation… by using the phrase “discrete
organisational decision’. This study will be limited to examining adoption as a relatively distinct
organisational event and it is believed that the processes of adoption and implementation are
fundamentally different.
This study examines eight types of constructs/factors that are considered to be relevant to the
adoption and implementation of HRIS. The classification of the constructs is illustrated in (
Figure 3.1) and further elaborated in the following sections. Some of these constructs may be
more important at the time the organisation is to decide whether to adopt HRIS than at the time of
influencing the extent to which HRIS is implemented in the organisation, or vice-versa. On the
other hand, some constructs may be important in both the adoption decision and the subsequent
implementation. Many of the constructs identified here are suggested by the literature, which
attempts to distinguish adopters from non-adopters; many of these same factors may also impact
the adoption decision and the extent to which HRIS is implemented.
The conceptual framework here suggests that the firm’s adoption behaviour of HRIS and its level
of implementing HRIS applications are thought to be a function of the interaction between the
internal and external environment. For example, the extent of the management’s commitment to the

85
adoption of HRIS applications (i.e., willingness of management to allocate resources to adopt HRIS
applications) is assumed to be a function of management’s expectations (i.e. favourable perceptions
of HRIS characteristics). These perceptions interact with the managers’ socio-demographic
characteristics such as attitudes, beliefs, experience, goals and aspirations, which results in an
overall impression of the desirability of the adoption of HRIS. Similarly, the level of implementing
HRIS applications is also thought to be a function of the manager’s perceptions of: (1) the firm’s
adoption capabilities of HRIS; (2) the favourable perceptions of HRIS classical characteristics; (3)
the extent of commitment to implement HRIS activities; and (4) the favourable perception of
external environmental conditions. The HRIS effectiveness (operational, relational and
transformational) is assumed here to be a function of the level of implementation of HRIS
applications.
3.3 The Main constructs of the Study’s Conceptual Framework
The constructs of each dimension are presented below with discussion of studies which were
concerned with them, Furthermore, the expected relationship among these dimensions are clearly
defined and discussed throughout the presentation of each constructs.
3.3.1 The Organisation’s Adoption and the Level of Implementing HRIS
There are two indicators (dependent variables) used here separately to achieve the study’s
objectives: the adoption and the level of implementation of HRIS applications. In this study,
adoption of HRIS applications is operationalized as a dichotomy: whether the business has or has
not adopted HRIS. The HRIS applications are the number of HR-related services available on the
organisation’s HRIS delivery channels.
Concerning adoption, it has been recognized among researchers that adoption could be studied at
three levels: the individual level, i.e. technology adoption by individual persons (Type I); at the
individual user or work group level (Type II); and at the organisational level, i.e. technology
adoption by organisations or organisational units (Type III). Since the current study focuses on the
organisational level, the subsequent definition refers to organisational adoption, however without
ignoring possible level interaction between the two levels. Adoption of technology studies (e.g.
Jeyaraj, Rottman and Lacity, 2006) indicated that there was no agreement on how best the adoption
and implementation can be measured, and furthermore, it is generally agreed that the adoption
process comprises several phases (Jeyaraj et al., 2006). Suggestion, initiation and implementation
can be seen as major phases of adoption (Rogers and Singhal, 2003). The organisational adoption
of HRIS can be identified as the process of initiating and implementing of IS in order to perform
HR tasks.

86
These subsequent steps may be enforced and performed by different internal and/or external actors
and/or units. It should be noted that the adoption process in organisations is not a one-off, all-or-
nothing event but a complex (and adaptive) process. ‘Adoption’ does not always result in
widespread usage of technological innovation in an organisation; after it is adopted ‘it needs to be
accepted, adapted, routinized and institutionalized’ (Zhu et al., 2006). Kamal (2006) indicated that
simply acquiring or adopting a technology is not sufficient; in order to obtain the anticipated
benefits, it must be deployed and used appropriately by the organisation and its intended users.
Damanpour and Schneider (2006) summarized how the process of adoption of innovation in
organisations has been divided into a variety of phases by several authors; for instance, evaluation,
initiation, implementation and routinisation (Hage and Aiken, 1967); awareness, selection,
adoption, implementation and routinisation (Klein and Sorra, 1996); knowledge awareness,
attitudes formation, decision, initial implementation and sustained implementation (Zaltman,
Duncan and Holbek, 1973); and initiation, development, implementation and termination (Angle
and Van de Van, 2000). Grouping these into three more general phases of pre-adoption, adoption
decision and post-adoption has been suggested, often referred to as initiation, adoption (decision)
and implementation (Pierce and Delbecq, 1977; Zmud, 1982 Rogers, 1995).
Furthermore, Attewell (1992) indicated that most studies on innovations have used two concepts
for analysis – adoption and diffusion. While studies using the adoption concept evaluate the
characteristics of an organisation that make it receptive to innovation and change, studies using the
diffusion concept attempt to understand why and how an innovation spreads and what
characteristics of the innovation lead to widespread acceptance. After an organisation has formally
adopted an innovation, use of the innovation has to spread within the organisation for the
innovation to provide its full benefits. Some innovations, because of their fad value or other
organisational or environmental pressures, may be adopted in organisations, but because of
constraints like lack of top management support, their use may not spread within the organisation.
This study attempts to address both areas by examining factors associated with the adoption of
HRIS and the extent of implementation of HRIS.
According to Rogers and Shoemaker (1983), diffusion is the process during which an innovation is
communicated through certain channels over time among members of a social system. However,
prior to that, decision has to be made on whether or not the organisation should uptake a new
innovation or practice of business. Rogers also distinguished diffusion from adoption by stating
that adoption is a decision to make full use of an innovation as the best course of action, whereas
rejection is a decision not to adopt an available innovation (Rogers, 1983, p. 21; Rogers and
Shoemaker, 1983). In this study, adoption is therefore defined as the decision to make use of HRIS
applications to perform HR functions.
87
The HRIS adoption variables which have been used in previous studies are mostly categorical (i.e.
adopter and non-adopter). In some studies, partial adopter and full adopter are used for these terms.
The level of implementation of HRIS applications is used to indicate the extent to which an
organisation uses and practices HRIS applications in performing HR functions. Kristine and David
(2009) identified that the implementation of HRIS has been undertaken with the aim of utilizing
HRM functions. The extent of HRIS implementation can be used to measure the contribution of
HRIS to the organisation (Tye and Chau, 1995), i.e. the extent of HRIS implementation is the type
of applications adopted in the organisation. In this study, the uses of HRIS for ten HRM activities
are identified. These are selected as they are the most common applications frequently mentioned
in HRIS books and HR magazines. The HRIS applications include various facets from employee
information, applicant alignment; recruiting; equal employment opportunity/affirmative action;
position control; performance management; compensation; payroll; benefits; training; to square
development/skill inventory; and human resource planning.
However, the use of this measure is not without criticisms, such as the time lapse between the use
of this measure and the time of the data collection. In other words, the use of such measures may
not be representative of the level of implementing HRIS applications. Nevertheless, the researcher
believes that time is not a problem; because any major change in the firm’s environment takes a
long time to filter through.
The firm’s adoption of HRIS is used here as an indicator of the differences between adopters and
non-adopters on the basis of their environmental measures (internal and external); in other words,
why some firms have adopted HRIS applications and others have not. Although this measure
(adoption of HRIS) is used in dichotomous categories (adopters vs. non-adopters), it is employed
here for the following reasons:
To facilitate the comparison between the findings of using it and the findings of using the
other measures (i.e., the level of implementations of HRIS applications). This comparison
will help policy-makers to take the appropriate actions for enhancing the level of
implementations of HRIS applications and its value.
Understanding the differences between the adopters and non-adopters of HRIS could be
important to the supplier /vendors of HRIS as well as the decision-makers of non-adopters
of HRIS who wish to adopt such system in their organisations. This comparison might help
them to identify the types of changes which should be implemented within their
organisations in order to become fully adopting HRIS applications.
To facilitate the comparison between the findings of this study and the findings of previous
works in this field (i.e. adoption of HRIS or IT innovations).

88
Examining the discontinuity from non-adoption to adoption can provide useful insights on
the factors that trigger initial adoption. It is necessary to complement this by understanding
why adopting organisations differ in their levels of adoption.
It should be noted that there are some limitations needed to be realized when interpreting
the findings from this study. Firstly, although there are many different forms of HRIS (such
as Web-based HRIS, intranets, employee self-service and interactive voice response (IVR)
kiosks), in this study, HRIS is simply viewed as the use of computer hardware and
software applications to perform HRM activities. Since the results may vary in case of
different types of HRIS, future research can perhaps examine the adoption of specific types
of HRIS.
3.3.2 HRIS Effectiveness
One of the aims of this study is to find out the relationship between the level of implementation of
HRIS applications and its effectiveness. As it was indicated in chapter two, the main goal of
investment in HRIS is to improve HR performance, and ultimately organisational effectiveness
(Raymond, 1990). Management is usually willing to know how such system performs well, in
order to then assess the degree to which investment in the system has paid off, to take action (if
needed) to improve the system performance, and to learn from the past experience in planning for
the future. Nagai and Wat state that “organisations are driven by different forces when
implementing their IT management systems. Practically, organisations are hesitating to apply HRIS
applications unless they are fully convinced of the benefits that these applications will bring to their
organisations” (Ngai and Wat, 2006).
The evaluation of HRIS practices, policies, and procedures requires an effectiveness measure
against which various strategies can be tested. Measurement of systems’ effectiveness is
particularly important in Jordanian organisations where IT implementation level, managerial
practices, organisational resources (e.g., financial, technical, and skilled human resources), and
cultural characteristics differ from those in developed countries. However, without well-defined
dependent variables, much of the information systems’ effectiveness research becomes highly
speculative (DeLone and McLean, 1992). The difficulty encountered in developing direct and
objective measures to assess systems’ effectiveness has led researchers to adopt surrogate
constructs that are more easily measurable. Different perspectives of systems’ effectiveness have
been adopted, and varying definitions and measures have been proposed (as explained in chapter
2). Approaches that have been suggested and used to measures systems’ effectiveness include
cost/benefit analysis, improvement in decision making, user information satisfaction, and systems
usage (Garrity and Sanders, 1998).
Many measures have been proposed and used by IS researchers, depending on the objectives and
focus of their research. System usage and user satisfaction are the two surrogate measures of
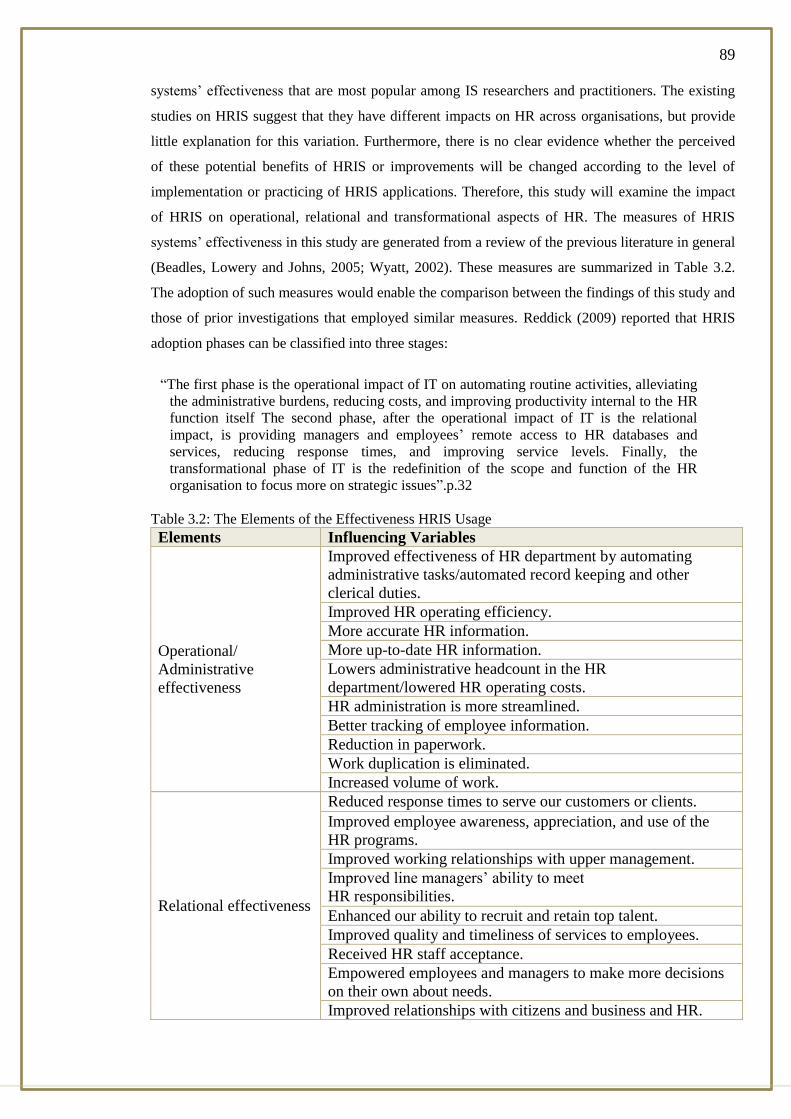
89
systems’ effectiveness that are most popular among IS researchers and practitioners. The existing
studies on HRIS suggest that they have different impacts on HR across organisations, but provide
little explanation for this variation. Furthermore, there is no clear evidence whether the perceived
of these potential benefits of HRIS or improvements will be changed according to the level of
implementation or practicing of HRIS applications. Therefore, this study will examine the impact
of HRIS on operational, relational and transformational aspects of HR. The measures of HRIS
systems’ effectiveness in this study are generated from a review of the previous literature in general
(Beadles, Lowery and Johns, 2005; Wyatt, 2002). These measures are summarized in Table 3.2.
The adoption of such measures would enable the comparison between the findings of this study and
those of prior investigations that employed similar measures. Reddick (2009) reported that HRIS
adoption phases can be classified into three stages:
“The first phase is the operational impact of IT on automating routine activities, alleviating
the administrative burdens, reducing costs, and improving productivity internal to the HR
function itself The second phase, after the operational impact of IT is the relational
impact, is providing managers and employees’ remote access to HR databases and
services, reducing response times, and improving service levels. Finally, the
transformational phase of IT is the redefinition of the scope and function of the HR
organisation to focus more on strategic issues”.p.32
Table 3.2: The Elements of the Effectiveness HRIS Usage
Elements Influencing Variables
Operational/
Administrative
effectiveness
Improved effectiveness of HR department by automating
administrative tasks/automated record keeping and other
clerical duties.
Improved HR operating efficiency.
More accurate HR information.
More up-to-date HR information.
Lowers administrative headcount in the HR
department/lowered HR operating costs.
HR administration is more streamlined.
Better tracking of employee information.
Reduction in paperwork.
Work duplication is eliminated.
Increased volume of work.
Relational effectiveness
Reduced response times to serve our customers or clients.
Improved employee awareness, appreciation, and use of the
HR programs.
Improved working relationships with upper management.
Improved line managers’ ability to meet
HR responsibilities.
Enhanced our ability to recruit and retain top talent.
Improved quality and timeliness of services to employees.
Received HR staff acceptance.
Empowered employees and managers to make more decisions
on their own about needs.
Improved relationships with citizens and business and HR.
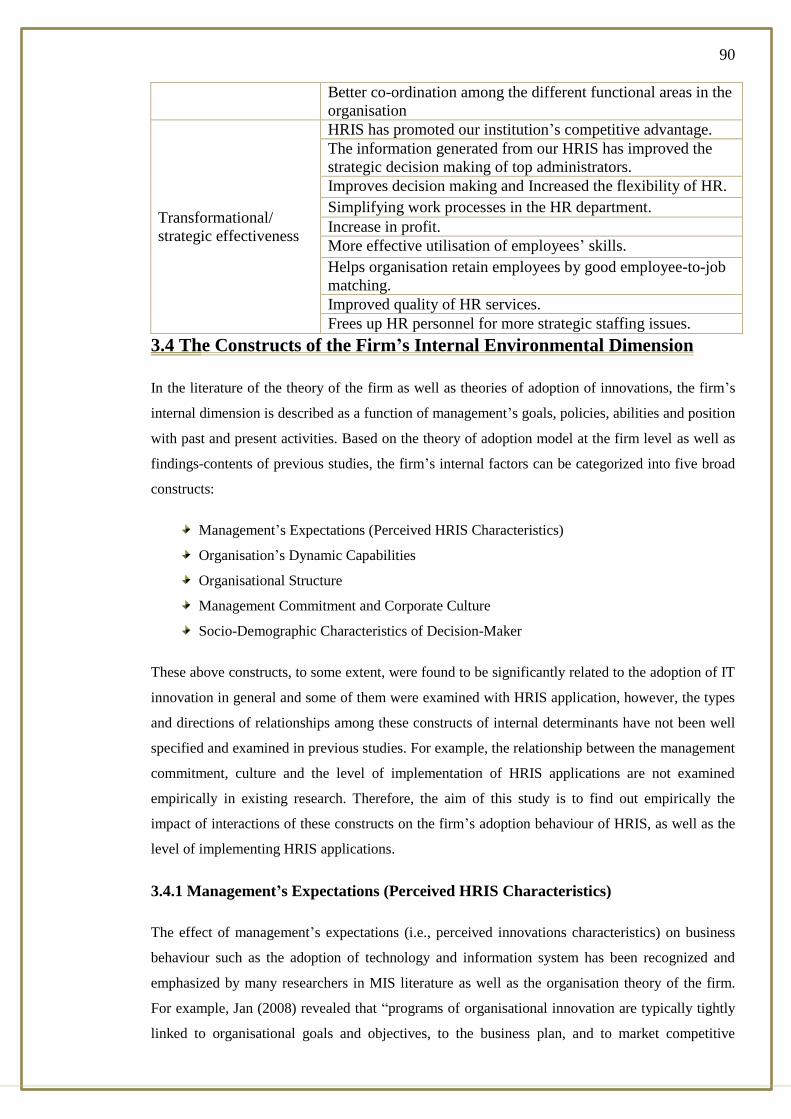
90
Better co-ordination among the different functional areas in the
organisation
Transformational/
strategic effectiveness
HRIS has promoted our institution’s competitive advantage.
The information generated from our HRIS has improved the
strategic decision making of top administrators.
Improves decision making and Increased the flexibility of HR.
Simplifying work processes in the HR department.
Increase in profit.
More effective utilisation of employees’ skills.
Helps organisation retain employees by good employee-to-job
matching.
Improved quality of HR services.
Frees up HR personnel for more strategic staffing issues.
3.4 The Constructs of the Firm’s Internal Environmental Dimension
In the literature of the theory of the firm as well as theories of adoption of innovations, the firm’s
internal dimension is described as a function of management’s goals, policies, abilities and position
with past and present activities. Based on the theory of adoption model at the firm level as well as
findings-contents of previous studies, the firm’s internal factors can be categorized into five broad
constructs:
Management’s Expectations (Perceived HRIS Characteristics)
Organisation’s Dynamic Capabilities
Organisational Structure
Management Commitment and Corporate Culture
Socio-Demographic Characteristics of Decision-Maker
These above constructs, to some extent, were found to be significantly related to the adoption of IT
innovation in general and some of them were examined with HRIS application, however, the types
and directions of relationships among these constructs of internal determinants have not been well
specified and examined in previous studies. For example, the relationship between the management
commitment, culture and the level of implementation of HRIS applications are not examined
empirically in existing research. Therefore, the aim of this study is to find out empirically the
impact of interactions of these constructs on the firm’s adoption behaviour of HRIS, as well as the
level of implementing HRIS applications.
3.4.1 Management’s Expectations (Perceived HRIS Characteristics)
The effect of management’s expectations (i.e., perceived innovations characteristics) on business
behaviour such as the adoption of technology and information system has been recognized and
emphasized by many researchers in MIS literature as well as the organisation theory of the firm.
For example, Jan (2008) revealed that “programs of organisational innovation are typically tightly
linked to organisational goals and objectives, to the business plan, and to market competitive
91
positioning”p.32. For example, one driver for innovation programs in corporations is to achieve
growth objectives. As Davila, Epstein and Shelton (2006) noted, “companies cannot grow through
cost reduction and reengineering alone. Innovation is the key element in providing aggressive top-
line growth and for increasing bottom-line results”. According to Kochanski and Ruse (1996), the
HR function has been under pressure to reduce costs, to improve its services, to increase its impact
and to provide a more satisfying work experience for its own employees, even as the proven ways
of organizing the people prove insufficient to meet the new challenges facing human resources.
These HRIS goals could be directed to justification for the adoption and implementation of HRIS,
could relate to the desired “complexity” of HRIS, could be directed towards more easiness
regarding user application or could be directed towards an increase of efficiency and effectiveness
(Ruël, and Looise, 2004; Bell and Yeung, 2006; Panayotopoulou and Galanaki, 2007; Strohmeier,
2007).
The literature review revealed several arguments for the adoption and implementation of HRIS
applications, varying from “reductions in administrative and process costs” to “efficiency gains by
more control and tracking of HR actions” and “fundamentally affect revenue channels” (Lengnick-
Hall and Moritz, 2003). The arguments provided by businesses indicate that HRIS is guiding
towards a new avenue for revenues, efficiency and savings (as indicated in chapter 2). The
perception of innovation’s classical characteristics such as relative advantages, complexity and
compatibility have been recognized and emphasized by many researchers in adoption innovations
literature, and in the diffusion models (Rogers, 1995). There have been several attempts to measure
empirically the significance of the influence of the perceived the innovation attributes upon the
adoption of HRIS in public and private business organisations (see chapter 2).
In the adoption of innovation behaviour, management expectations are proposed here as the
managers’ subjective evaluations of potential benefits of adoption of HRIS for their organisations,
and is based upon their own experience or other firm’s experience as well as their perception of the
potential impact of the dynamic technology environment on their firms.
Several researchers have reported a strong relationship between the management’s expectations of
IT innovation classical attributes (relative advantages, complexity and compatibility) and the
adoption of HRIS. However, they did not specify any relationship between the construct of
management’s expectations and the level of implementations of HRIS applications.
Therefore, the aims of the study are: (1) to investigate the influence of interactions of the
management’s expectations of HRIS classical characteristics and other constructs of this study’s
model upon the firm’s adoption behaviour (adopter vs. non-adopters) and the level of
implementation of HRIS applications and its effectiveness; and (2) to find out whether the existing
relationship between the adoption behaviour of HRIS and the management’s expectations can be
extended to firms investigated here. Based upon the review of literature, the elements of
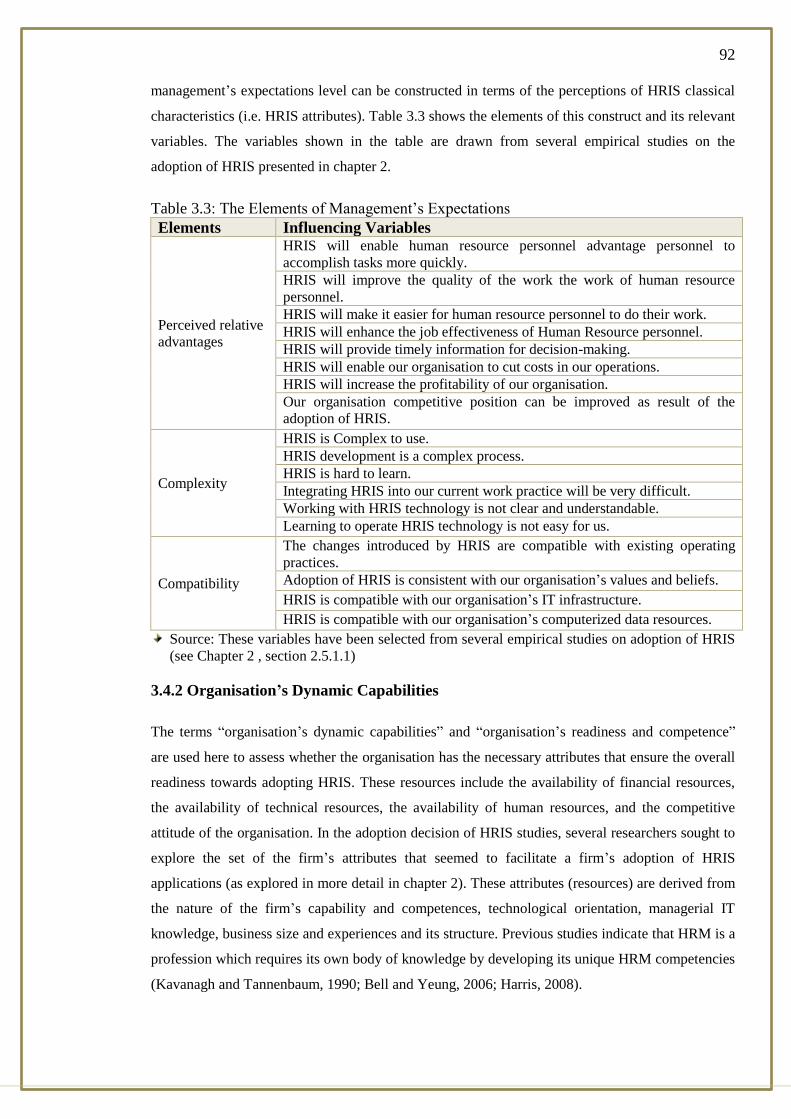
92
management’s expectations level can be constructed in terms of the perceptions of HRIS classical
characteristics (i.e. HRIS attributes). Table 3.3 shows the elements of this construct and its relevant
variables. The variables shown in the table are drawn from several empirical studies on the
adoption of HRIS presented in chapter 2.
Table 3.3: The Elements of Management’s Expectations
Elements Influencing Variables
Perceived relative
advantages
HRIS will enable human resource personnel advantage personnel to
accomplish tasks more quickly.
HRIS will improve the quality of the work the work of human resource
personnel.
HRIS will make it easier for human resource personnel to do their work.
HRIS will enhance the job effectiveness of Human Resource personnel.
HRIS will provide timely information for decision-making.
HRIS will enable our organisation to cut costs in our operations.
HRIS will increase the profitability of our organisation.
Our organisation competitive position can be improved as result of the
adoption of HRIS.
Complexity
HRIS is Complex to use.
HRIS development is a complex process.
HRIS is hard to learn.
Integrating HRIS into our current work practice will be very difficult.
Working with HRIS technology is not clear and understandable.
Learning to operate HRIS technology is not easy for us.
Compatibility
The changes introduced by HRIS are compatible with existing operating
practices.
Adoption of HRIS is consistent with our organisation’s values and beliefs.
HRIS is compatible with our organisation’s IT infrastructure.
HRIS is compatible with our organisation’s computerized data resources.
Source: These variables have been selected from several empirical studies on adoption of HRIS
(see Chapter 2 , section 2.5.1.1)
3.4.2 Organisation’s Dynamic Capabilities
The terms “organisation’s dynamic capabilities” and “organisation’s readiness and competence”
are used here to assess whether the organisation has the necessary attributes that ensure the overall
readiness towards adopting HRIS. These resources include the availability of financial resources,
the availability of technical resources, the availability of human resources, and the competitive
attitude of the organisation. In the adoption decision of HRIS studies, several researchers sought to
explore the set of the firm’s attributes that seemed to facilitate a firm’s adoption of HRIS
applications (as explored in more detail in chapter 2). These attributes (resources) are derived from
the nature of the firm’s capability and competences, technological orientation, managerial IT
knowledge, business size and experiences and its structure. Previous studies indicate that HRM is a
profession which requires its own body of knowledge by developing its unique HRM competencies
(Kavanagh and Tannenbaum, 1990; Bell and Yeung, 2006; Harris, 2008).
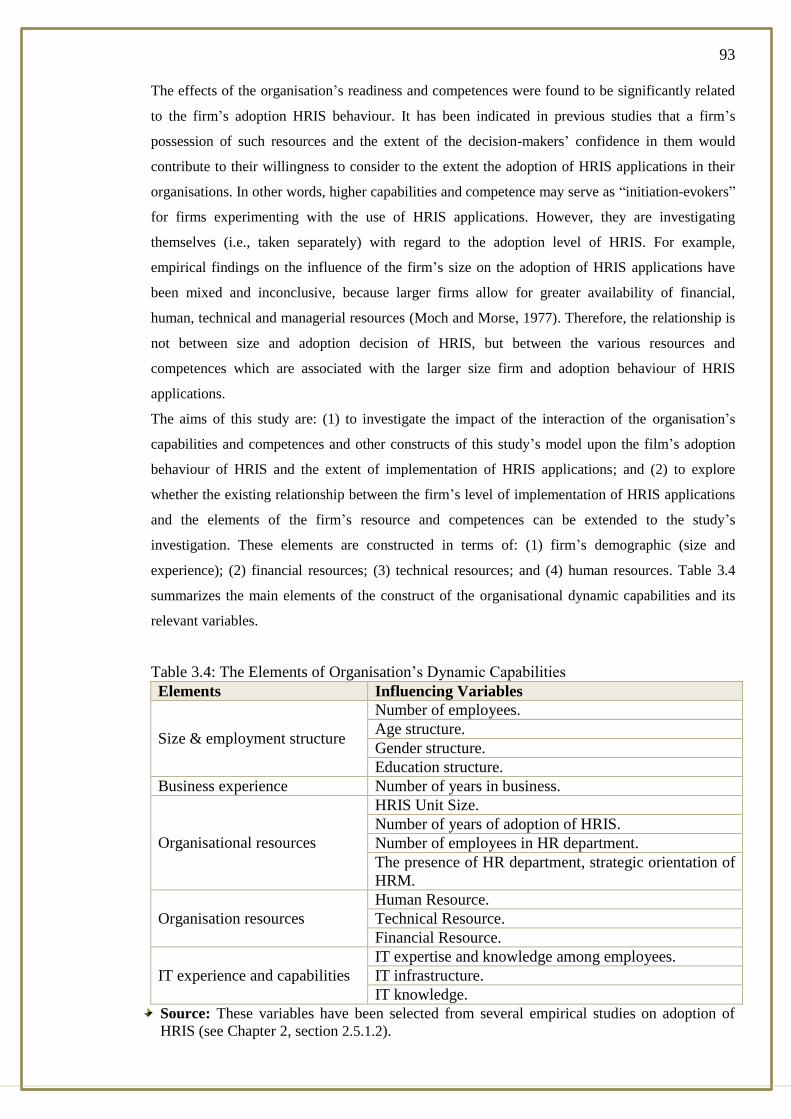
93
The effects of the organisation’s readiness and competences were found to be significantly related
to the firm’s adoption HRIS behaviour. It has been indicated in previous studies that a firm’s
possession of such resources and the extent of the decision-makers’ confidence in them would
contribute to their willingness to consider to the extent the adoption of HRIS applications in their
organisations. In other words, higher capabilities and competence may serve as “initiation-evokers”
for firms experimenting with the use of HRIS applications. However, they are investigating
themselves (i.e., taken separately) with regard to the adoption level of HRIS. For example,
empirical findings on the influence of the firm’s size on the adoption of HRIS applications have
been mixed and inconclusive, because larger firms allow for greater availability of financial,
human, technical and managerial resources (Moch and Morse, 1977). Therefore, the relationship is
not between size and adoption decision of HRIS, but between the various resources and
competences which are associated with the larger size firm and adoption behaviour of HRIS
applications.
The aims of this study are: (1) to investigate the impact of the interaction of the organisation’s
capabilities and competences and other constructs of this study’s model upon the film’s adoption
behaviour of HRIS and the extent of implementation of HRIS applications; and (2) to explore
whether the existing relationship between the firm’s level of implementation of HRIS applications
and the elements of the firm’s resource and competences can be extended to the study’s
investigation. These elements are constructed in terms of: (1) firm’s demographic (size and
experience); (2) financial resources; (3) technical resources; and (4) human resources. Table 3.4
summarizes the main elements of the construct of the organisational dynamic capabilities and its
relevant variables.
Table 3.4: The Elements of Organisation’s Dynamic Capabilities
Elements Influencing Variables
Size & employment structure
Number of employees.
Age structure.
Gender structure.
Education structure.
Business experience Number of years in business.
Organisational resources
HRIS Unit Size.
Number of years of adoption of HRIS.
Number of employees in HR department.
The presence of HR department, strategic orientation of
HRM.
Organisation resources
Human Resource.
Technical Resource.
Financial Resource.
IT experience and capabilities
IT expertise and knowledge among employees.
IT infrastructure.
IT knowledge.
Source: These variables have been selected from several empirical studies on adoption of
HRIS (see Chapter 2, section 2.5.1.2).
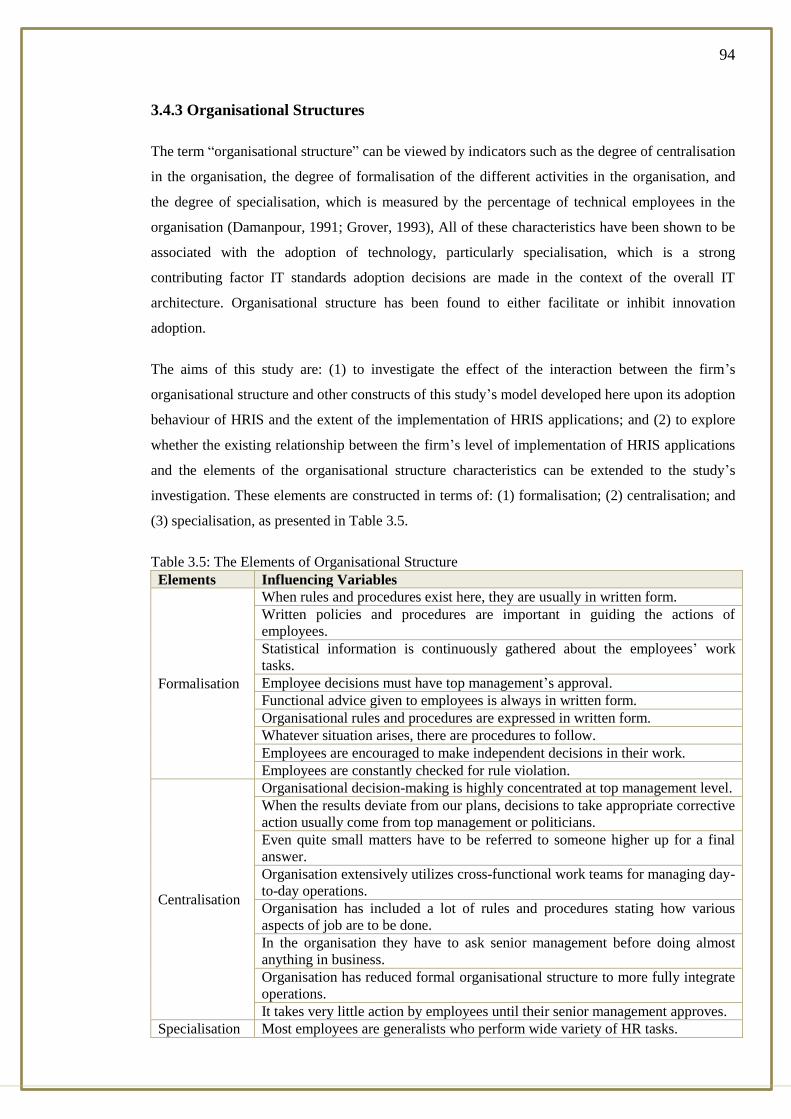
94
3.4.3 Organisational Structures
The term “organisational structure” can be viewed by indicators such as the degree of centralisation
in the organisation, the degree of formalisation of the different activities in the organisation, and
the degree of specialisation, which is measured by the percentage of technical employees in the
organisation (Damanpour, 1991; Grover, 1993), All of these characteristics have been shown to be
associated with the adoption of technology, particularly specialisation, which is a strong
contributing factor IT standards adoption decisions are made in the context of the overall IT
architecture. Organisational structure has been found to either facilitate or inhibit innovation
adoption.
The aims of this study are: (1) to investigate the effect of the interaction between the firm’s
organisational structure and other constructs of this study’s model developed here upon its adoption
behaviour of HRIS and the extent of the implementation of HRIS applications; and (2) to explore
whether the existing relationship between the firm’s level of implementation of HRIS applications
and the elements of the organisational structure characteristics can be extended to the study’s
investigation. These elements are constructed in terms of: (1) formalisation; (2) centralisation; and
(3) specialisation, as presented in Table 3.5.
Table 3.5: The Elements of Organisational Structure
Elements Influencing Variables
Formalisation
When rules and procedures exist here, they are usually in written form.
Written policies and procedures are important in guiding the actions of
employees.
Statistical information is continuously gathered about the employees’ work
tasks.
Employee decisions must have top management’s approval.
Functional advice given to employees is always in written form.
Organisational rules and procedures are expressed in written form.
Whatever situation arises, there are procedures to follow.
Employees are encouraged to make independent decisions in their work.
Employees are constantly checked for rule violation.
Centralisation
Organisational decision-making is highly concentrated at top management level.
When the results deviate from our plans, decisions to take appropriate corrective
action usually come from top management or politicians.
Even quite small matters have to be referred to someone higher up for a final
answer.
Organisation extensively utilizes cross-functional work teams for managing day-
to-day operations.
Organisation has included a lot of rules and procedures stating how various
aspects of job are to be done.
In the organisation they have to ask senior management before doing almost
anything in business.
Organisation has reduced formal organisational structure to more fully integrate
operations.
It takes very little action by employees until their senior management approves.
Specialisation Most employees are generalists who perform wide variety of HR tasks.
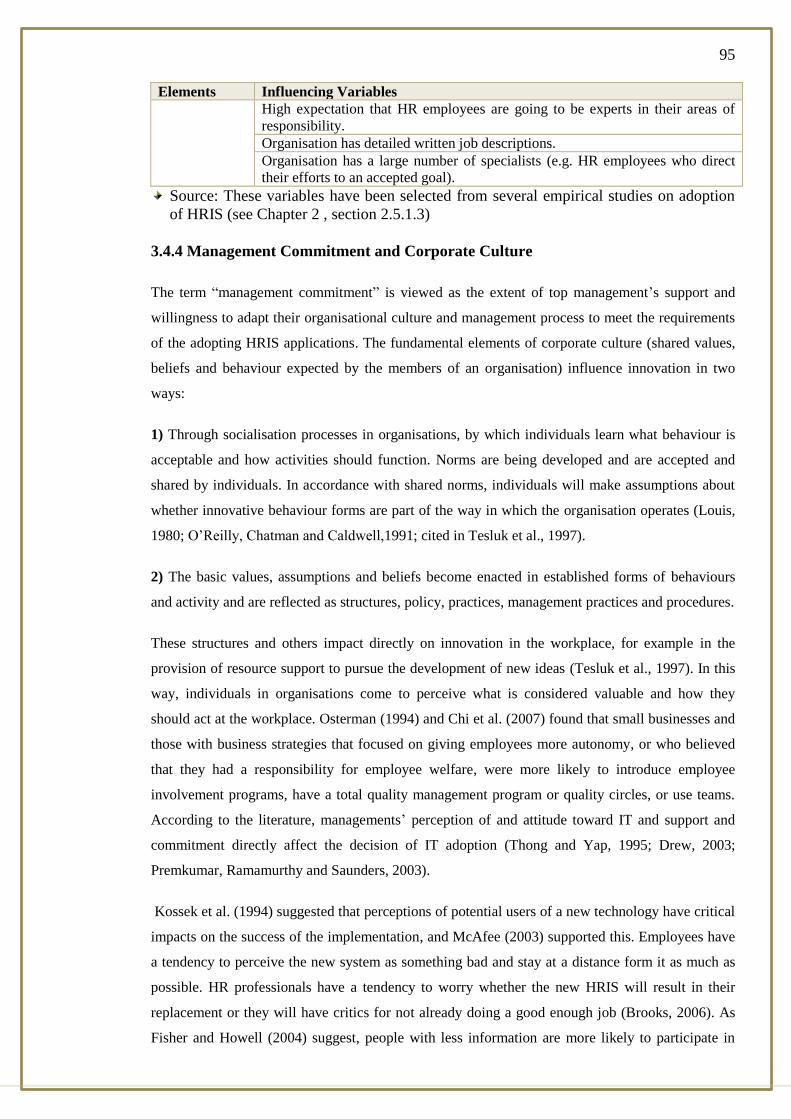
95
Elements Influencing Variables
High expectation that HR employees are going to be experts in their areas of
responsibility.
Organisation has detailed written job descriptions.
Organisation has a large number of specialists (e.g. HR employees who direct
their efforts to an accepted goal).
Source: These variables have been selected from several empirical studies on adoption
of HRIS (see Chapter 2 , section 2.5.1.3)
3.4.4 Management Commitment and Corporate Culture
The term “management commitment” is viewed as the extent of top management’s support and
willingness to adapt their organisational culture and management process to meet the requirements
of the adopting HRIS applications. The fundamental elements of corporate culture (shared values,
beliefs and behaviour expected by the members of an organisation) influence innovation in two
ways:
1) Through socialisation processes in organisations, by which individuals learn what behaviour is
acceptable and how activities should function. Norms are being developed and are accepted and
shared by individuals. In accordance with shared norms, individuals will make assumptions about
whether innovative behaviour forms are part of the way in which the organisation operates (Louis,
1980; O’Reilly, Chatman and Caldwell,1991; cited in Tesluk et al., 1997).
2) The basic values, assumptions and beliefs become enacted in established forms of behaviours
and activity and are reflected as structures, policy, practices, management practices and procedures.
These structures and others impact directly on innovation in the workplace, for example in the
provision of resource support to pursue the development of new ideas (Tesluk et al., 1997). In this
way, individuals in organisations come to perceive what is considered valuable and how they
should act at the workplace. Osterman (1994) and Chi et al. (2007) found that small businesses and
those with business strategies that focused on giving employees more autonomy, or who believed
that they had a responsibility for employee welfare, were more likely to introduce employee
involvement programs, have a total quality management program or quality circles, or use teams.
According to the literature, managements’ perception of and attitude toward IT and support and
commitment directly affect the decision of IT adoption (Thong and Yap, 1995; Drew, 2003;
Premkumar, Ramamurthy and Saunders, 2003).
Kossek et al. (1994) suggested that perceptions of potential users of a new technology have critical
impacts on the success of the implementation, and McAfee (2003) supported this. Employees have
a tendency to perceive the new system as something bad and stay at a distance form it as much as
possible. HR professionals have a tendency to worry whether the new HRIS will result in their
replacement or they will have critics for not already doing a good enough job (Brooks, 2006). As
Fisher and Howell (2004) suggest, people with less information are more likely to participate in

96
sense-making or signalling processes. According to them, these interpretations may or may not
receive confirmation. The resulting impression assumes an aura of truth, whether or not the
impressions match reality. These resulting impressions can influence emotional reactions and
behaviours and accordingly the success of organisational systems and interventions. Therefore,
organisations should be ready to address possible interpretations at all stages of an organisational
change (Fisher and Howell, 2004). According to the findings of the literature review, the lack of
reliable source of information to gain knowledge in HRIS applications as well as insufficient
knowledge and experience in communicating information about such applications may hinder their
adoption. The communication processes which organisations used to communicate knowledge and
persuasion of technology adoption have been studied extensively.
Following the work of Rogers and Shoemaker (1983), other scholars argued that the adoption of a
new technology is influenced by communication channel types (mass media vs. interpersonal
channels), information sources (external source vs. internal source) and communication amount
(Brancheau and Wetherbe, 1990; Nilankantan and Scamell, 1990). Therefore, the communication
tools are included in this construct.
The effect of the “management commitment” and “corporate culture” upon success or failure in the
adoption of information systems has been recognized by many researchers. They assert that top
management’s support of innovation (e.g. providing resources and training, and addressing
information and security concerns) facilitates adoption or early adoption (King and Teo, 1996;
Raymond and Bergeron, 1996), while lack of top management’s commitment inhibits adoption.
Kossek (1987) argues that if the top management does not view HRM innovation favourably, it
will simply not occur. Tansley and Watson (2000) indicated that the clear HR vision and mission
statement and the strategic fit between HRIS and HR and corporate strategy play a significant role
in the development of an HRIS project. Premkumar and Roberts (1999) believe that top
management’s support is essential for creating a supportive climate and providing adequate
resources for the adoption and implementation of new technologies. Visible top management
support also sends signals about the importance of the innovation and hence contributes to its
success in overcoming organisational resistance to existing work procedures (Weill, 1992). By
virtue of their leadership role, top management would also be able to ensure that adequate
resources will be allocated if the innovation is adopted. In addition, the continued success of the
HRIS requires top management’s support. A major problem during implementation is the
resistance of users to change and the conflict between HR departments and IS departments over the
implementation and maintenance of the HRIS (Kavanagh and Tannenbaum, 1990). Hence, top
management’s support will be crucial to overcome user resistance and handle any conflicts that
may arise.

97
Commitment to the adoption the HRIS application requires that the management devotes human
and financial resources as well as its willingness to carry out tasks that are new to the firm, and for
building the infrastructure of HRIS. HR functions need to be re-designed and formulated and the
new role of HR needs to be promoted and employees need to be trained and motive to use the new
system. Although the commitment of the top management was found to be significant in
determining the firm’s adoption HRIS behaviour, there is still an argument whether such a
relationship can be confirmed in the present study’s investigation. It is believed that the degree of
management’s commitment to adopting and implementing the HRIS applications is not widespread
among firms operating in developing countries such as Jordan.
As far as the degree of the management’s commitment is concerned, there is a need to find out the
effect of the interaction of management’s commitment to HRIS activities and other constructs of
this study’s model upon the firm’s adoption of HRIS behaviour and the level of implementing
HRIS applications. The relevant variables that are related to management’s commitment to HRIS
are presented in Table 3.6.
Table 3.6: The Elements of Management Commitment and Culture
Elements Influencing Variables
Top
management
willingness to
support
Top management is likely to consider the adoption of the HRIS applications as
strategically important.
Top management enthusiastically supports the adoption of HRIS.
Top management allocates adequate resources for the adoption of HRIS.
Top management is aware of the benefits of HRIS.
Top management actively encourages HR personnel to use HRIS in their daily
tasks.
Top management open attitude toward technological changes in HR.
Firm’s leaders encourage employees to learn new technology in HR.
Top management have positive attitudes toward HRIS.
Willingness to change culture to meet the requirements of HRIS.
Top management is likely to invest funds in HRIS applications.
The firm’s Management willing to investment in new IT application in HRIS.
Intra-
organisation
communication
Quality of communication channel types.
Sources of information.
Number of information source.
Extent of internal communication.
Communication amount.
Organisational
sharing culture
Values emphasized collaboration and support.
Organisational corporate culture opens to innovation and change.
Concern for people issues.
Fairness, collaboration, enthusiasm for job, values emphasized (collaboration
and support).
Concern for efficiency.
The degree to which workers are fair and helpful to one another.
Emphasis on developing people resources.
Information distribution.
Source: These variables have been selected from several empirical studies on adoption of HRIS
(see Chapter 2 , section 2.5.1.4)

98
3.4.5 The Socio-Demographic Characteristics of Decision-Makers
Previous research conducted at the individual or team levels of analysis reveals that decision-
makers’ characteristics gain decision influenced because of certain demographics they or their
department may possess (Provan and Skinner, 1989) and activities they are engaged in which may
enhance their ability to influence the adoption decision. Academic articles in information systems
also emphasize the decision-makers’ importance. Levy and Yetton (2001) evoked the managerial
limits concerning the IS development related to the leader’s age, experience, interest in this field,
lack of time, lack of confidence towards consultants and budget problems (financial, human,
material).
In adoption of innovation (technology) behaviour, the socio-demographic characteristics of the
CEO (decision-maker), such as age, experience, educational level, their ability to develop
networking and communication skills, the power of authority and their attitude toward adoption are
found to critical not only to adoption initiation but are also significantly related to the level of
adopting innovation behaviour. However, some of them were found insignificant themselves
(acting separately) to initiate adoption of innovation Table 3.7.
The adoption of HRIS applications and the extent to which they are used and implemented could
depend on the existence of an HR champion within the firm. HR managers’ knowledge and skills
in HRM field have long been realized as crucial resource for the successful implementation of
HRIS activities. The knowledge about HRIS applications might affect the extent to which HRIS
practices are implemented and used. Within this context, however, previous studies produced
conflicting results concerning the effect of these characteristics. This might be related to the fact
that these characteristics are investigated separately (i.e., as a constant factor) rather than as
concomitant variables (as a group). Therefore, it is expected that these characteristics of the
decision-makers taken together are more likely to have a large impact on the firm’s adoption of
HRIS behaviour (adopter vs. non-adopters) and the level of implementing HRIS applications.
This study aims to find out whether there is any relationship between the firm’s level of adopting
HRIS and the characterizes among firm investigated and to find out whether there is any
relationship between the decision-maker characteristics (taken together) and other constructs of the
study’s model upon the firm’s adoption of innovation behaviour (adopter vs. non-adopters).
Table 3.7: The Elements of Socio-Demographic Characteristics of Decision-Maker
Elements Influencing Variables
Demographic characteristics
Age
Level of education
Functional experience
Professionalism
Social and technological skills
Technical and IT knowledge
Attitude toward IS
Social network skills

99
Leadership style
Management tenure and value
Decision-making style for IT adoption
People oriented vs. work oriented
Source: These variables have been selected from several empirical studies on adoption of HRIS
(see Chapter2 , section 2.5.1.5)
3.5 The Constructs of the Firm’s External Environment Dimension
As discussed in previously, empirical adoption of innovation studies with regard to the effect of the
external environment upon the firm’s adoption of HRIS behaviour and its level of implementing
HRIS applications remain few and fragmented. Therefore, much of the work here is based to a
large extent on the firm’s organisational adoption of innovation studies. The purpose of this study
is to empirically address this research gap.
As noted in chapter two, external environmental or contextual influence factors represent a
category of characteristics resulting from the context out of which the organisation emerged and/or
within which it operated. IT vendor characteristics, competition pressure, government support and
policies and network externalities are identified as key contextual factors. These factors were
reviewed to demonstrate their utility as a basis for influencing the likelihood of adoption of HRIS
applications.
Based on the adoption model at the organisational level, these factors can be categorized under
three constructs: (1) industry characteristics and market structure; (2) government support policies;
and (3) the social influence (externalities network). The purpose of this study is to explore whether
there is any relationship between the firm’s external environmental constructs and its level of
implementing HRIS applications and to find out the effect of interaction between the internal
environmental factors and the external environmental factors upon the firm’s adoption of HRIS
behaviour (adopters vs. non-adopters) and its level of implementing HRIS applications.
3.5.1 Industry Characteristics and Market Structure
Many organisational theorists have considered the role of industry characteristics in organisational
innovation and change (e.g. Cyert and March, 1963). Industrial characteristics are assumed to be
relevant because innovation adoption is likely to vary depending on the type of industry and the
nature of the competitive landscape. Based upon a review of the adoption of IT studies, the industry
characteristics (e.g. external facilitating conditions and supply IT activities) and market structure
(e.g. competition pressure and other indicators) tend to have a greater impact on the firm’s adoption
of IT behaviour and implementation (Cragg and King, 1993; Fink, 1998). Therefore, one could
expect the firm’s adoption of HRIS behaviour can be viewed as a result of external facilitating
conditions (e.g. the availability and quality of IT vendors consultants and support and the
availability of IT infrastructure) and the competition conditions that exist in its environment.
100
According to Rogers and Shoemaker (1983), business activities and competitive strategies play an
important part in the adoption of innovations. It has been found that vendors play a significant role
i8n determining adoption decision (Dash, 2001).
The effect of the external facilitating conditions on the firm’s adoption of IT behaviour and its level
of implementing HRIS applications may also take two forms: as motivator or as a barrier. For
example, while the availability of IT vendor consultant and support may serve as a motivator for
firms to adopt the IT applications, the lack of IT expertise and support may act as a hindrance for
firms wishing to adopt such systems. In this study, it is expected that the external facilitating
conditions will have a greater effect on the firm’s adoption of HRIS behaviour and its level of
implementations.
Many empirical studies also show that competitive pressure is seen as a powerful driver of IT
adoption and diffusion Zhu, Kraemer and Xu, 2003; Hollenstein, 2004; Gibbs and Kraemer, 2004).
According to Kochanski and Ruse (1996), the HR function has been under pressure to reduce costs,
to improve HR services, to increase its impact and to provide a more satisfying work experience for
its own employees, even as the proven ways of organizing the people prove insufficient to meet the
new challenges facing human resources. McMahan (1996), in his study of 130 large companies,
found that as corporations adopted new strategies and redesigned themselves to deal with the
competitive pressures they were feeling, their HR functions were also redesigning themselves to
support the changing business.
The IT adoption literature assessed that the local market conditions including the structure of
competition and commercial infrastructure and other industry characteristics tend to have a greater
impact on many aspect of business behaviour. It tends to determine the extent to which the firms
are committed to do the required actions. Therefore, the degree of competition pressure in the local
market is very likely to determine the level of firm’s implication of IT adoption. Competition is
viewed as the number of organisations within a market area that vie for acquisition of resource
inputs and for disposition of outputs (Feldstein, 1999). The more competitors adopt an innovation,
the greater the pressure on non-adopters of the innovation to conform. The importance of
competitive pressures in fuelling innovation adoption has been cited due to its importance in
maintaining market position or risking competitive disadvantage and consequent loss of market
standing. Thus, on theoretical grounds, one could expect that the more competitors that have
adopted an innovation, the greater the likelihood of adoption by non-adopters. However, empirical
findings on the impact of competition pressures on the adoption of IT have been mixed, for
example Teo et al. (2007) concluded that “competition was not found to be a significant factor
influencing the adoption of HRIS. This means that the competition does not really provide any
direct ‘push’ for organisations to adopt HRIS. This result might be due to the fact that many of top
managers and board of directors perceive HRIS as more administrative than strategic and therefore
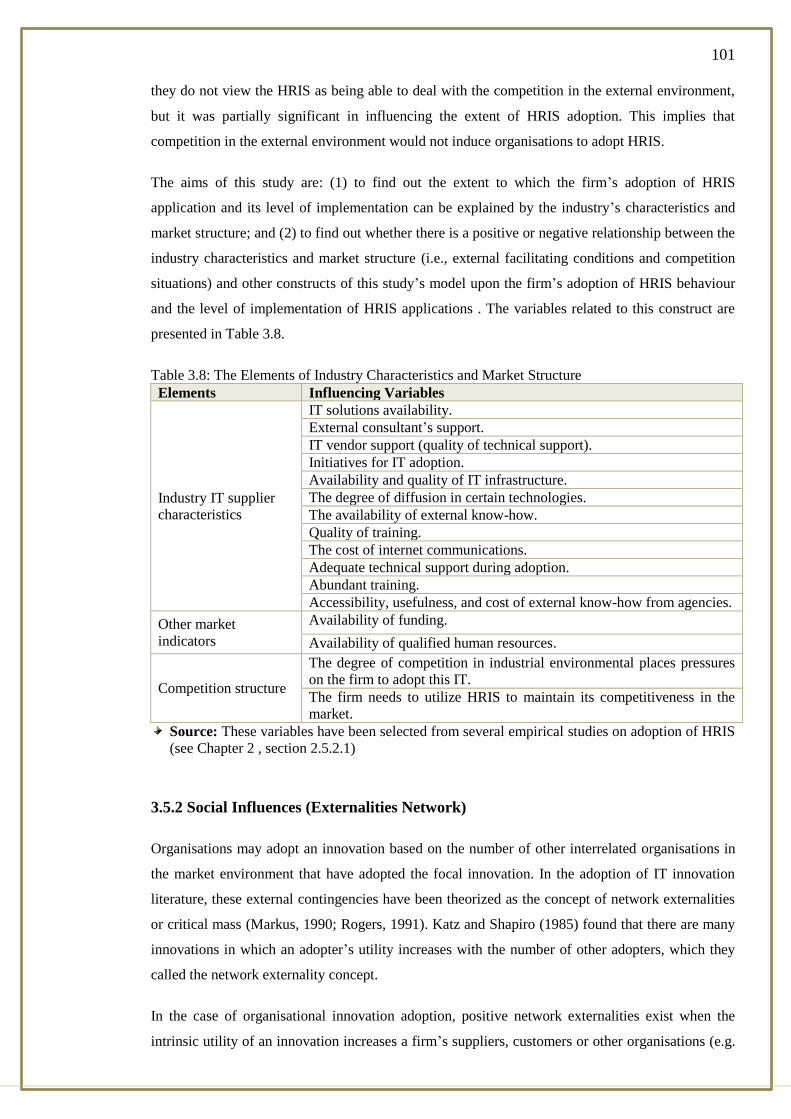
101
they do not view the HRIS as being able to deal with the competition in the external environment,
but it was partially significant in influencing the extent of HRIS adoption. This implies that
competition in the external environment would not induce organisations to adopt HRIS.
The aims of this study are: (1) to find out the extent to which the firm’s adoption of HRIS
application and its level of implementation can be explained by the industry’s characteristics and
market structure; and (2) to find out whether there is a positive or negative relationship between the
industry characteristics and market structure (i.e., external facilitating conditions and competition
situations) and other constructs of this study’s model upon the firm’s adoption of HRIS behaviour
and the level of implementation of HRIS applications . The variables related to this construct are
presented in Table 3.8.
Table 3.8: The Elements of Industry Characteristics and Market Structure
Elements Influencing Variables
Industry IT supplier
characteristics
IT solutions availability.
External consultant’s support.
IT vendor support (quality of technical support).
Initiatives for IT adoption.
Availability and quality of IT infrastructure.
The degree of diffusion in certain technologies.
The availability of external know-how.
Quality of training.
The cost of internet communications.
Adequate technical support during adoption.
Abundant training.
Accessibility, usefulness, and cost of external know-how from agencies.
Other market
indicators
Availability of funding.
Availability of qualified human resources.
Competition structure
The degree of competition in industrial environmental places pressures
on the firm to adopt this IT.
The firm needs to utilize HRIS to maintain its competitiveness in the
market.
Source: These variables have been selected from several empirical studies on adoption of HRIS
(see Chapter 2 , section 2.5.2.1)
3.5.2 Social Influences (Externalities Network)
Organisations may adopt an innovation based on the number of other interrelated organisations in
the market environment that have adopted the focal innovation. In the adoption of IT innovation
literature, these external contingencies have been theorized as the concept of network externalities
or critical mass (Markus, 1990; Rogers, 1991). Katz and Shapiro (1985) found that there are many
innovations in which an adopter’s utility increases with the number of other adopters, which they
called the network externality concept.
In the case of organisational innovation adoption, positive network externalities exist when the
intrinsic utility of an innovation increases a firm’s suppliers, customers or other organisations (e.g.
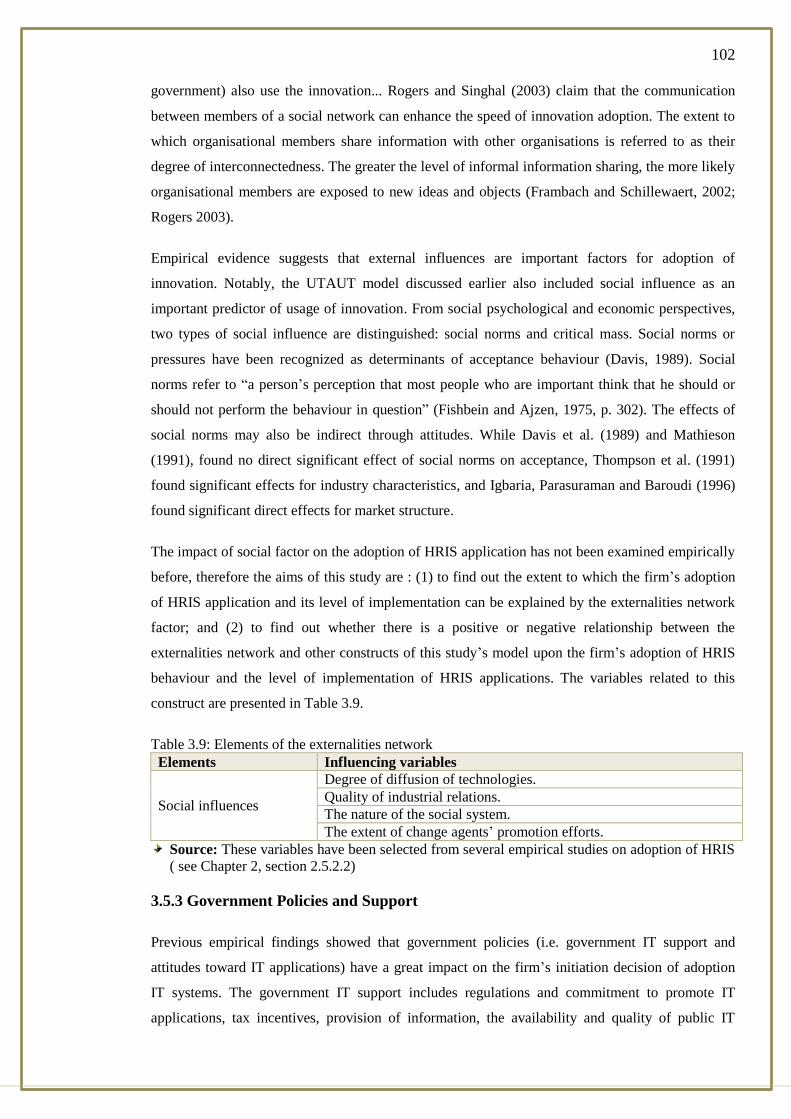
102
government) also use the innovation... Rogers and Singhal (2003) claim that the communication
between members of a social network can enhance the speed of innovation adoption. The extent to
which organisational members share information with other organisations is referred to as their
degree of interconnectedness. The greater the level of informal information sharing, the more likely
organisational members are exposed to new ideas and objects (Frambach and Schillewaert, 2002;
Rogers 2003).
Empirical evidence suggests that external influences are important factors for adoption of
innovation. Notably, the UTAUT model discussed earlier also included social influence as an
important predictor of usage of innovation. From social psychological and economic perspectives,
two types of social influence are distinguished: social norms and critical mass. Social norms or
pressures have been recognized as determinants of acceptance behaviour (Davis, 1989). Social
norms refer to “a person’s perception that most people who are important think that he should or
should not perform the behaviour in question” (Fishbein and Ajzen, 1975, p. 302). The effects of
social norms may also be indirect through attitudes. While Davis et al. (1989) and Mathieson
(1991), found no direct significant effect of social norms on acceptance, Thompson et al. (1991)
found significant effects for industry characteristics, and Igbaria, Parasuraman and Baroudi (1996)
found significant direct effects for market structure.
The impact of social factor on the adoption of HRIS application has not been examined empirically
before, therefore the aims of this study are : (1) to find out the extent to which the firm’s adoption
of HRIS application and its level of implementation can be explained by the externalities network
factor; and (2) to find out whether there is a positive or negative relationship between the
externalities network and other constructs of this study’s model upon the firm’s adoption of HRIS
behaviour and the level of implementation of HRIS applications. The variables related to this
construct are presented in Table 3.9.
Table 3.9: Elements of the externalities network
Elements Influencing variables
Social influences
Degree of diffusion of technologies.
Quality of industrial relations.
The nature of the social system.
The extent of change agents’ promotion efforts.
Source: These variables have been selected from several empirical studies on adoption of HRIS
( see Chapter 2, section 2.5.2.2)
3.5.3 Government Policies and Support
Previous empirical findings showed that government policies (i.e. government IT support and
attitudes toward IT applications) have a great impact on the firm’s initiation decision of adoption
IT systems. The government IT support includes regulations and commitment to promote IT
applications, tax incentives, provision of information, the availability and quality of public IT

103
infrastructure, IT training and workshops, laws to protect privacy and security of information, laws
to combat cybercrime and other activities Table 3.10.
In adoption of IT behaviour, the government activities, policies and procedures can either promote
or inhibit the firm’s adoption of IT innovation. The government can act as a promoter through its
support and subsides, commitment to IT innovation and so on, and as a hindrance in case of lack of
telecommunication infrastructure, low tax incentives, low internet penetration, rigid national data
protection and so on. The impact of government policies and initiatives has been proven to
engender direct and indirect stimuli to the supply of information, which produces faster technology
diffusion (Stoneman and David, 1986). In addition, as computers and telecommunication
technology have progressed, many governments are now refocusing their attention from traditional
“brick and mortar” infrastructure development to electronic communications and transport projects.
As for the effect of government support and regulations with regard to adoption of IT applications
such as HRIS by business firms in Jordan , it can be expected that the more government
commitment and support is given to the adoption IT innovation, the greater the likelihood of
adoption by non-adopters. It should be noted that previous studies did not give any evidence about
the effect of government’s support and policies on the level of the firm’s implementation of HRIS
applications.
Therefore, the study will attempt to find out if there is any relationship between the firm’s level of
implementation of HRIS and the degree of importance attached to the government’s support and
policies. It will also try to investigate whether there is a significant difference between adopters and
non-adopters of HRIS in terms of their evaluation of these government’s support forms.
Table 3.10: Elements of government policies and support
Elements Influencing Variables
Government
regulations and support
Government security and protection.
Government attitudes toward technology.
Adequate financial assistance from government (e.g. tax deduction,
tariffs, financial subsidy).
Government aids in human-resource training and programs.
Source: These variables have been selected from several empirical studies on adoption of HRIS
(see Chapter 2, section 2.5.2.3…)
3.6 Research hypotheses
Based upon the study’s conceptual framework, the study hypotheses are formulated and proposed
as shown in Table 3.11:
Table 3.11: Research hypotheses (null)
H1: There is a significant difference between the two groups (i.e., adopters and non-
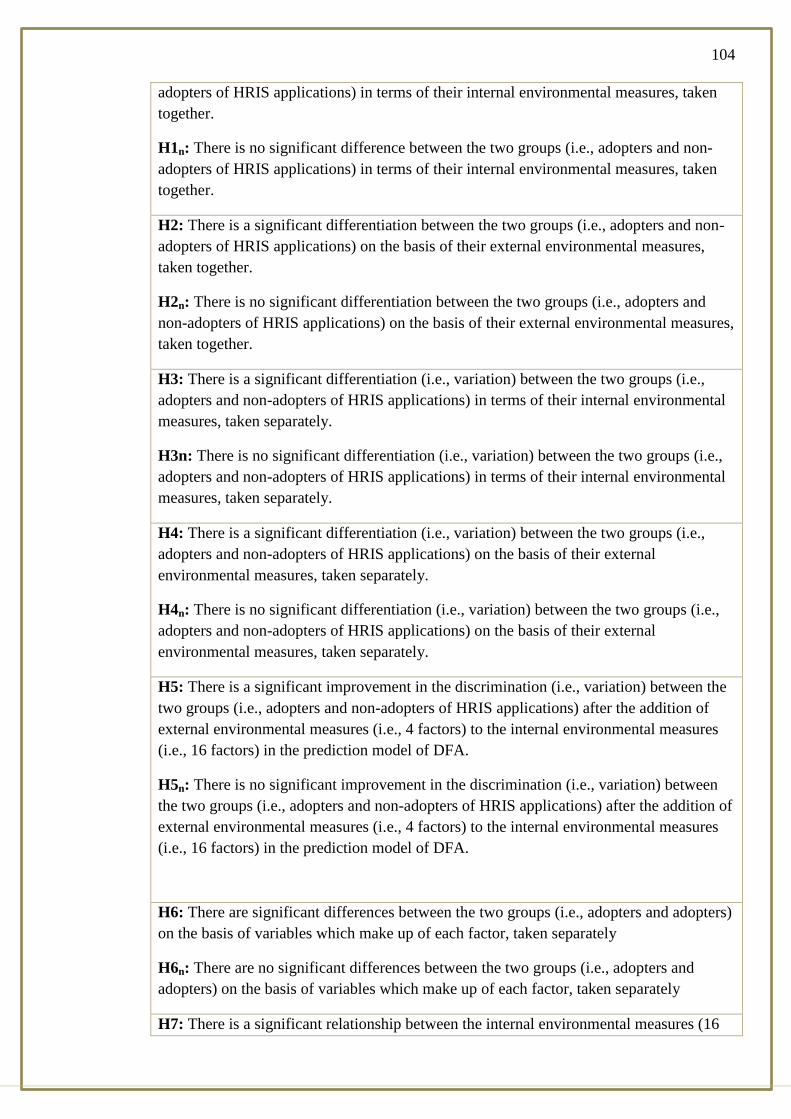
104
adopters of HRIS applications) in terms of their internal environmental measures, taken
together.
H1n: There is no significant difference between the two groups (i.e., adopters and non-
adopters of HRIS applications) in terms of their internal environmental measures, taken
together.
H2: There is a significant differentiation between the two groups (i.e., adopters and non-
adopters of HRIS applications) on the basis of their external environmental measures,
taken together.
H2n: There is no significant differentiation between the two groups (i.e., adopters and
non-adopters of HRIS applications) on the basis of their external environmental measures,
taken together.
H3: There is a significant differentiation (i.e., variation) between the two groups (i.e.,
adopters and non-adopters of HRIS applications) in terms of their internal environmental
measures, taken separately.
H3n: There is no significant differentiation (i.e., variation) between the two groups (i.e.,
adopters and non-adopters of HRIS applications) in terms of their internal environmental
measures, taken separately.
H4: There is a significant differentiation (i.e., variation) between the two groups (i.e.,
adopters and non-adopters of HRIS applications) on the basis of their external
environmental measures, taken separately.
H4n: There is no significant differentiation (i.e., variation) between the two groups (i.e.,
adopters and non-adopters of HRIS applications) on the basis of their external
environmental measures, taken separately.
H5: There is a significant improvement in the discrimination (i.e., variation) between the
two groups (i.e., adopters and non-adopters of HRIS applications) after the addition of
external environmental measures (i.e., 4 factors) to the internal environmental measures
(i.e., 16 factors) in the prediction model of DFA.
H5n: There is no significant improvement in the discrimination (i.e., variation) between
the two groups (i.e., adopters and non-adopters of HRIS applications) after the addition of
external environmental measures (i.e., 4 factors) to the internal environmental measures
(i.e., 16 factors) in the prediction model of DFA.
H6: There are significant differences between the two groups (i.e., adopters and adopters)
on the basis of variables which make up of each factor, taken separately
H6n: There are no significant differences between the two groups (i.e., adopters and
adopters) on the basis of variables which make up of each factor, taken separately
H7: There is a significant relationship between the internal environmental measures (16

105
factors) and the level of implementation of HRIS applications, taken together.
H7n: There is no significant relationship between the internal environmental measures (16
factors) and the level of implementation of HRIS applications, taken together.
H8: There is a significant relationship between the external environmental measures (4
factors) and the level of implementation of HRIS applications, taken together.
H8n: There is no significant relationship between the external environmental measures (4
factors) and the level of implementation of HRIS applications, taken together.
H9: There is a significant relationship between the two environmental measures (20
factors) and the level of implementation of HRIS applications, taken together.
H9n: There is no significant relationship between the two environmental measures (20
factors) and the level of implementation of HRIS applications, taken together.
H10: There is a significant relationship between each independent factor (i.e., internal and
external factors) and the level of implementation of HRIS applications, taken separately.
H10n: There is no significant relationship between each independent factor (i.e., internal
and external factors) and the level of implementation of HRIS applications, taken
separately.
H11: There is significant relationship between the variables which comprise each factor
and the level of implementation of HRIS applications, taken separately.
H11n: There is no significant relationship between the variables which comprise each
factor and the level of implementation of HRIS applications, taken separately.
H12: There is a significant relationship between the level of implementation of HRIS
applications and the perceived component of the HRIS effectiveness measures
(operational/administrative effectiveness and relational effectiveness and
transformational/strategic effectiveness), taken together.
H12n: There is no significant relationship between the level of implementation of HRIS
applications and the perceived component of the HRIS effectiveness measures
(operational/administrative effectiveness and relational effectiveness and
transformational/strategic effectiveness), taken together.
H13: There is a significant relationship between the level of implementation of HRIS
applications and the perceived component of the HRIS effectiveness measures
(operational/administrative effectiveness and relational effectiveness and
transformational/strategic effectiveness), taken separately.
H13n: There is no significant relationship between the level of implementation of HRIS
applications and the perceived component of the HRIS effectiveness measures
(operational/administrative effectiveness and relational effectiveness and

106
transformational/strategic effectiveness), taken separately.
H14: There is a significant relationship between the level of implementation of HRIS
applications and the variables which comprise each factor of its effectiveness measures,
taken separately.
H14n: There is no significant relationship between the level of implementation of HRIS
applications and the variables which comprise each factor of its effectiveness measures,
taken separately.
3.7 Summary
In this Chapter, the conceptual framework for this study has been developed through the integration
of the factors that are assumed to influence the firm’s adoption behaviour of HRIS (adopters vs.
non-adopters) and the level of implementing HRIS applications and its effectiveness. Two broad
dimensions are constructed to be related to the firm’s adoption of HRIS and its level of
implementation i.e., internal and external environments. The constructs of each dimension and the
expected relationship among their constructs were discussed.
Figure (3.2) represents a summary of the expected relationships investigated in this study. The
generalized relationship stipulates that the adoption behaviour of HRIS (adopters vs. non-adopters)
is a function of interaction of the internal variable and the external variables. The relationship is
also applied to the firm’s level of implementing of HRIS applications. The combination of these
relationships represent the present study’s framework, they are:
1. The adoption of HRIS /the level of implementing HRIS applications are a function of
the internal variables.
2. The adoption of HRIS /the level of implementing HRIS applications are a function of
the external variables.
3. The adoption of HRIS /the level of implementing HRIS applications are a function of
the interaction of the internal and external variables.
The Main Dimensions of the study’s framework:
1. The adoption of HRIS = adopters vs. non adopters.
2. The level of HRIS implementations
3. The HRIS effectiveness.
4. Internal Dimension:
Management Expectations
Organisation’s Dynamic Capabilities
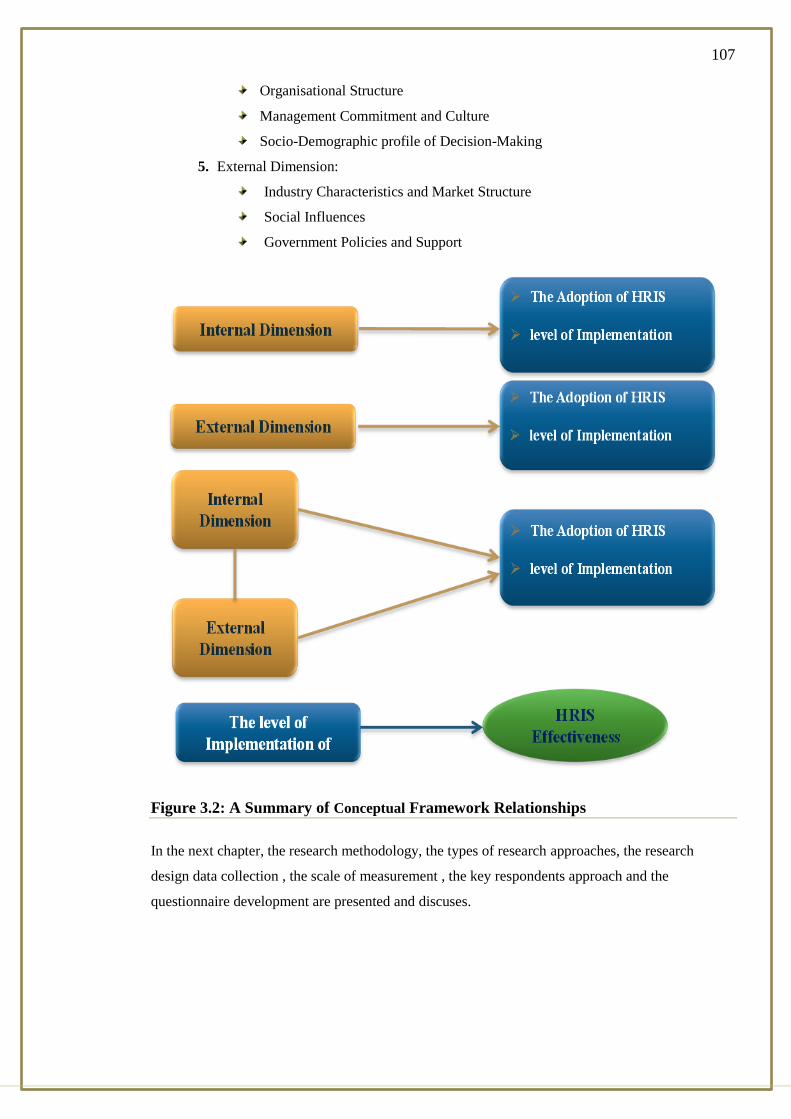
107
Organisational Structure
Management Commitment and Culture
Socio-Demographic profile of Decision-Making
5. External Dimension:
Industry Characteristics and Market Structure
Social Influences
Government Policies and Support
Figure 3.2: A Summary of Conceptual Framework Relationships
In the next chapter, the research methodology, the types of research approaches, the research
design data collection , the scale of measurement , the key respondents approach and the
questionnaire development are presented and discuses.

108
RESEARCH DESIGN AND DATA COLLECTION CHAPTER 4:
4.1 Introduction
In the previous chapter, the conceptual model and hypotheses of the study were presented. This
chapter is designed to set out the research methodology that was adopted in order to answer the
research questions. According to Sekaran & Bougie (2010), research methodology is “a structured
set of guidelines or activities to assist in generating valid and reliable research results". Thus, to
measure the constructs and to empirically test the hypotheses that have been derived from the
research model,we shall explain in this chapter the selection of an appropriate research
methodology and design for examining the model of this study.
In this chapter, the types of research approaches (Quantitative and qualitative) research followed by
research paradigms are discussed. Next the research design in terms of its definition, concepts and
approaches are presented. Special emphasis is placed upon the data types and source, data
collection methods, questionnaire design, scale of measurement and the domains of the study. The
chapter also includes the data collection procedures followed in this investigation. The chapter has
concluded with the steps followed to prepare the collected data for the purpose of the analysis.
4.2 Research Approaches
The research methodology and approaches in this study were carefully chosen in order to
successfully achieve its objectives. Generally speaking, two research approaches are used in social
science research studies including information systems (IS). Each of quantitative and qualitative
research has its distinctive approach, yet they also have similarities and areas of mixed approaches,
and can be brought together in various ways. Depending on the definition of the problem and the
nature of the information being sought, researchers usually choose one of these two approaches, or
a combination of them (Punch, 1998). Quantitative research is generally considered to be more
formalized and structured than qualitative research. The quantitative approach is summarized by
(Crestwell, 1994) as: “an inquiry process of understanding a social or human problem, based on
building a complex, holistic picture, formed with words, reporting detailed views of informants,
and conducted in a natural setting"(p.15).
Quantitative methods involve numerical representation and manipulation of observations for the
purpose of describing, explaining, and testing hypotheses (Creswell et al., 2003). On the other
hand, qualitative research involves non-numerical examination and interpretation of observations
for the purpose of discovering the underlying meanings and patterns of relationships (Creswell et
al., 2003). It emphasizes the processes and meanings which are not rigorously examined or
measured in terms of quantity, amount, intensity or frequency. This can be conducted through in-

109
depth interviews, focus groups, participant observations and case studies (Cavana and Sekaran,
2001). However, the results generated by using the qualitative approach can vary from one research
to another, and this can be problematic, especially when researchers become fixated on exploratory
research and do not progress beyond this to the hypothesis testing stage (Cherry, 1999,).
According to Biga and Neuman(2006), variables and relationships which lie at the heart of
quantitative research are useful in providing not only the necessary detailed planning prior to data
collection and analysis, but also the tools needed for measuring concepts, planning design stages,
and dealing with population or sampling issues. In addition, this approach utilizes a deductive
mode in testing the relationship between variables so as to provide evidence for or against pre-
specified hypotheses (Biga and Neuman, 2006).
As discussed in Chapter 2, innovation adoption literature indicates that there are relationships
between adoption factors such as internal organisational and environmental factors. This study
attempts to investigate these relationships in a Jordanian innovation context by testing the proposed
hypotheses. Drawing on the existing literature of adoption of innovation technology including
IS/IT/HRIS, this study developed a theoretical model to test the research questions and the
hypotheses. Punch (1998) maintained that the method used to conduct the research should be in
line with the research questions. Thus, this thesis employs quantitative method to test the
hypotheses first, and then to answer the research questions.
4.3 Research Paradigms
Prior to discussing the method applied in the current research, it is important to consider the
paradigm that is most suitable to the study. Selecting the appropriate research paradigm is vital to
the research process in all areas of the study (Mangan, Lalwani and Gardner, 2004), as it helps in
understanding the phenomenon in question, especially if it is related to human and social sciences
(Creswell, 2009). Paradigms are defined as "patterns of beliefs and practices that regulate inquiry
within a discipline by providing lenses, frames and processes through which investigation is
accomplished" (Weaver and Olson, 2006, p.460).
A paradigm serves a number of purposes: "(1) it guides professionals as it indicates important
issues challenging any discipline; (2) it develops models and theories that permit practitioners solve
these issues; (3) it establishes criteria for tools such as methodology, instruments, and data
collection that would enable solving these issues; (4) it provides the principles, procedures, and
methods to be considered when similar issues (phenomena) appear again" (Filstead, 1979 cited in
Deshpande, 1983, p.33).
As research paradigms guide researchers to identify the relationship between variables to specify
appropriate methods for conducting particular research (Guba and Lincoln, 1994), the positivism

110
paradigm has been considered the oldest and most popular philosophical approach in the physical
and social sciences than other paradigm types, such as post-positivism, critical theory, and
constructivism (Eastin, 2002). According to Neuman (2006), positivist social science is used
widely and the positivism paradigm forms the basis of natural science and has influenced scholars
as a rational system.
Within this paradigm, researchers focus on facts and search for direct cause and effect while
remaining external to the events being examined. This paradigm involves formulating hypotheses
as a process of problem solving. These are subject to empirical testing through a quantitative
approach (Buttery & Buttery, 1992). The quantitative approach provides objective, value-free and
unambiguous interpretation of reality (Guba and Lincoln, 1994). In the line of this, information
system research has been classified as positivist as long as there were evidence of formal
propositions, quantifiable measures of variances, hypothesis testing, and the drawing of inferences
about a phenomenon from the population sample (Orlikowski and Baroudi, 1991).
Discussed by the underpinning of the positivism paradigm and based on the idea that research
questions should interact with the methods used to conduct the research (Punch, 1998), the study
seeks to measure underlying variables, as the “measurement of the variables in the theoretical
framework is an integral part of research and an important aspect of quantitative research design”
(Cavana and Sekaran, 2001, p. 186). In positivism, the aim of research is explanation leading to
prediction and finally control of the phenomena being researched (Guba and Lincoln, 1994). From
this point of view in this research, positivism applies quantitative method to test hypothetical
deductive generalisations of the theory. Although the quantitative approach has been criticized for
its ability to produce theory and generate in-depth explanations of qualitative enquiry, it can verify
the hypotheses and provide strong validity and reliability (Cavana and Sekaran, 2001). Prior studies
have applied this methodology which has been successfully used in similar studies (Ramamurthy,
Sen and Sinha, 2008& Buonanno et al., 2005). Consequently, this methodology was mainly seen as
suitable given that the objective of the research is to empirically investigate causal relationships
among the underlying constructs.
Based on the above justification, this study is best classified as using a positivism paradigm and,
therefore, the researcher decided to choose a quantitative rather than qualitative approach for this
study.
4.4 Research Design Process
As quantitative method is considered to be appropriate for this research, the research design
involves a series of rational decision-making alternatives which suggested by Sekaran (2003), are
generally related to the purpose of the study (exploratory, descriptive, hypothesis testing), its
location (i.e., the study setting), the type of investigation, the extent of researcher interference, time

111
horizon, and the level to which the data will be analysed (unit of analysis). In addition, decisions
have to be made regarding the sampling design, how data is to be collected (data collection
methods), and how variables will be measured and analysed to test the hypotheses (data analysis).
Bryman & Bell (2007) argued that research design provides a framework for the collection and
analysis of data, stating that design reflects decisions about the priority being given to a range of
dimensions of the research process. However, they considered research methods as the techniques
for collecting data which can involve specific instruments such as self-completed questionnaires or
structured interviews. De Vaus (2001) argued that “the function of a research design is to ensure
that the evidence obtained enables us to answer the initial question as unambiguously as possible”
(p.9).
According to Sekaran (2003), the methods are part of the design; thus, she agrees with Bryman and
Bell (2007) that methods are meant to describe data collection. Correspondingly and based on
Sekaran’s definition of research design, this study is conducted for the purpose of testing the
hypotheses derived from the conceptual framework presented. It is believed that studies employing
hypotheses testing purpose usually tend to explain the nature of certain relationships, or establish
the differences among groups or the independence of two factors or more in a situation. Hypotheses
testing offers enhanced understanding of the relationships that exist among variables.
As for the type of investigation, a correlation study is chosen to delineate the variables associated
with the research objectives and identify the important determinants of adoption of HRIS behaviour
in Jordanian business organisations. In terms of the settings, this study is conducted in a non-
contrived setting. It is considered a field study with minimal interference from the researcher. The
study’s horizon refers to conducting a longitudinal versus cross-sectional study. A cross-sectional,
also called one-shot, study is done when data is gathered just once over a period of time such as
days, weeks, or months in order to answer a research question. When data is collected at more than
one point in time, the study is considered longitudinal (Creswell et al., 2003).
According to De Vaus (2001), longitudinal studies are more feasible when there is a need to
describe the pattern and direction of change and stability (at an organisational level). Additionally,
they can be used to establish a temporal order of events, unlike cross-sectional studies that only
reveal the correlation among variables without explaining the links between them. Longitudinal
studies establish developmental as well as historical effects. Cross-sectional designs have three
distinctive features: there is no time dimension, only differences between groups rather than change
are measured; there is reliance on existing differences rather than the change following intervention
and there is no allowance for differences to emerge over time; and the process of grouping
individuals in the sample is based either on existing differences or the category of the independent
variable to which they happen to belong rather than random allocation. This study is a cross-
sectional survey where data is collected at one point in time from the population to determine

112
relationships between variables at the time of the study. Even though the researcher acknowledges
the limitations of this type of investigation, it is beyond the timeframe of this research project to
make use of a longitudinal study.
In conclusion, a research design is viewed as a bridge between what has been established (the
research problem and objectives) and what is to be done in the conduct of the study. If there was no
explicit design, the researcher would have only foggy notions about what to do. Based upon the
research objectives and hypotheses, the research design for this study involves the following
process in (Figure 4.1).
Figure 4.1: process involved in this study
4.4.1 Deciding on the Alternative Data Collection Methods
The data required for this study is categorized into two main types: secondary and primary data.
Secondary data is defined as “data already collected and published for purposes other than the
specific research needs at hand“(Cooper and Schminler, 2008, p.43). Besides time and cost saving,
secondary data has other advantages over primary data. These include:
113
1. Helping to understand the problem under investigation
2. Suggesting improved methods to tackle the problem
3. Providing comparative data by which primary data can be interpreted and evaluated more
meaningfully (Gattoufi et al., 2004).
The secondary data used in this study is related to the existing literature concerned with the
research problem. The purpose of using those sources of information was to have a better
understanding of the problem, and to determine the required data as well as the suitable method for
data collection. However, in spite of its importance, and the necessity for using it, as mentioned
above, it was found that secondary data was not sufficient to solve the research problem. This was
due to the limitations of secondary data which may not be accurate or relevant to the study.
Therefore, and despite time and cost, there was no alternative but to conduct a field study to collect
the primary data required for this study.
Figure 4.2: The Process of Selecting the Appropriate Type of Data and the Appropriate Data
Collection Method
Primary data can be obtained through experimentation, analogies and respondents (Anonymous).
The experimentation and analogous methods were unsuitable because of the limits of time and
budget. Consequently, the respondent’s method was chosen. Blumberg, Cooper and Schindler
(2008) classified the primary data collection methods into two broad categories: questioning and
observation. In the questioning approach respondents play an active role, while in the observing
approach respondents do not directly interact, or communicate with the research. The

114
communication (questioning) approach was considered more appropriate for this study because of
time limitations along with the numbers of and types of variables that needed to be measured. A
key strength of the observation method is that it is more likely to provide more accurate data, since
distortions deriving from respondents will be much lower than in studies employing questioning
methods. Questioning methods are also less conventional (Sekaran and Bougie, 2010).
4.4.2 Deciding on the Most Appropriate Type of Questioning Methods
According to McDaniel & Gates (2006), MIS research employs different methods for collecting
data. In addition to focus groups and depth interviews, surveys are also common and popular.
Surveys range between the use of non-Internet survey forms and Internet survey methods. The first
type of surveys can be administered through a number of techniques: door –to-door interviews
(rarely used today) and the equivalent “executive interviews” when the sample consists of
managers, mall intercept interviews, telephone interviews, self-administered questionnaires, ad hoc
mail surveys, and mail panels. (Sekaran and Bougie, 2010) adds observing people and phenomena
as means to survey data collection methods, stating that each method has its advantages and
disadvantages.
Table 4.1: Questionnaire Mode of Data Collection

115
Figure 4.3: Deciding on the Appropriate Communication Methods
In this research, personally administered and electronic questionnaires were preferred to the postal
interview alternative. There are seven major reasons for this decision:
1. The postal survey questionnaire would almost certainly remain unanswered by the firms
in Jordan, due to a general lack of acceptance and familiarity with this means of gathering
information, combined with a cultural reluctance to give written information to an
unknown person.
2. The personal interview questionnaire and permitted us to ask a relatively larger number of
questions. Clarification and follow up remarks were also possible to supplement the
knowledge gathered.
3. One of the purposes of this questionnaire was to obtain information that could be coded
(i.e. made confidential) by some firms such as the type of HRIS applications, company IT
resources, IT budget, and so forth. This type of information is less likely to be secured by
the postal questionnaire.
4. The personal interview questionnaire allows better clarification of the meaning of terms
or misunderstanding.
5. The appointments were pre-arranged by telephone calls directly with the persons
concerned. Thus, and by personal interview, we derived a relatively higher percentage of
response, about 73.6% of the population surveyed.

116
6. Identity of the respondents could be ascertained, and we could also obtain general
information about the respondents.
7. Furthermore, it was expected that people would be more forthcoming in face-to-face
interviews. In fact, the researcher's prior experience in Jordan indicates that Jordanian
business people would feel more comfortable with personal contact than indirect
approaches.
8. Due to the availability of e –mail addresses for some of the study's population, it was
possible to use electronic survey as another alternative tool of data collection.
The disadvantages of a personal interview using direct questionnaires are relatively limited. The
most important disadvantage can be overcome by presenting the respondent with the questionnaire
and asking them to complete it by themselves.
4.4.3 Deciding on the Appropriate Structure of the Interview
There are two broad types of interviews: structured and unstructured, or standardized and
unstandardized (Sekaran, U. & Bougie, R., 2010).Structure was defined by Sekaren and Bougie
(2010) as the degree of standardisation imposed on the questionnaire. Directness is the amount of
knowledge about the purpose of a study communicated to a respondent.
The structured- direct technique is used in this research. This technique necessitates the questions
be presented with exactly the same wording and in exactly the same order to all respondents. The
reason for standardisation is to ensure that all the respondents are replying to the same questions
(Sekaran & Bougie 2010). Simplicity of administration and ease of tabulation and analysis are
among the major advantages of using the standardized - direct interview.
4.4.4 Deciding on the Domain of Respondents
As discussed in the previous section, it is decided that a field study is necessary for the current
study's objectives. Because this study is mainly concerned with the investigation of the adoption
behaviour of HRIS in enterprises, non-business organisations will be excluded from the study, such
as public organisations.
The survey units in this study are the individual business firms which were chosen in light of the
nature and the objectives of the study. In other words, the investigation was conducted at the micro
level. Furthermore, this choice was supported by the concept of the firm. For example, Cyert and
March (1963) suggested that, “the individual firm is a unit which coordinated and undertook
critical aspects of economic activity" (p.15).
Recognizing the individual business firms in the country (Jordan) could be done by obtaining
names of all firms, as well as their addresses, from a variety of private and public sources in order
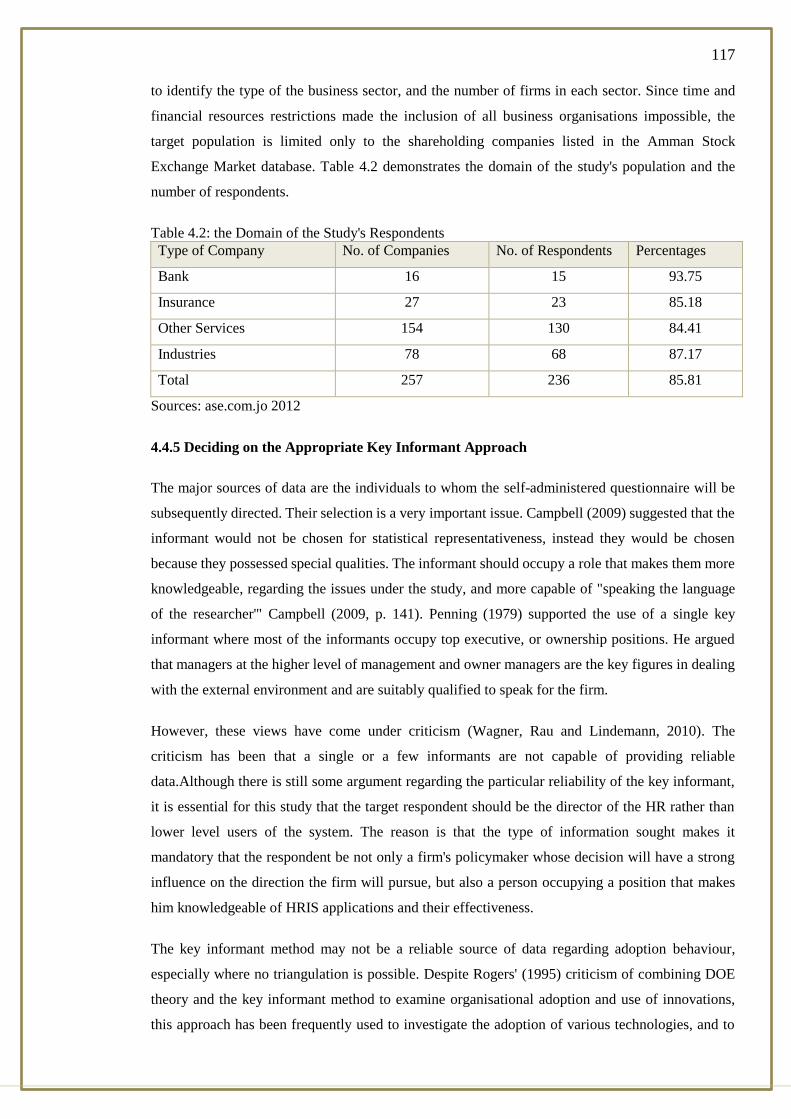
117
to identify the type of the business sector, and the number of firms in each sector. Since time and
financial resources restrictions made the inclusion of all business organisations impossible, the
target population is limited only to the shareholding companies listed in the Amman Stock
Exchange Market database. Table 4.2 demonstrates the domain of the study's population and the
number of respondents.
Table 4.2: the Domain of the Study's Respondents
Type of Company No. of Companies No. of Respondents Percentages
Bank 16 15 93.75
Insurance 27 23 85.18
Other Services 154 130 84.41
Industries 78 68 87.17
Total 257 236 85.81
Sources: ase.com.jo 2012
4.4.5 Deciding on the Appropriate Key Informant Approach
The major sources of data are the individuals to whom the self-administered questionnaire will be
subsequently directed. Their selection is a very important issue. Campbell (2009) suggested that the
informant would not be chosen for statistical representativeness, instead they would be chosen
because they possessed special qualities. The informant should occupy a role that makes them more
knowledgeable, regarding the issues under the study, and more capable of "speaking the language
of the researcher'" Campbell (2009, p. 141). Penning (1979) supported the use of a single key
informant where most of the informants occupy top executive, or ownership positions. He argued
that managers at the higher level of management and owner managers are the key figures in dealing
with the external environment and are suitably qualified to speak for the firm.
However, these views have come under criticism (Wagner, Rau and Lindemann, 2010). The
criticism has been that a single or a few informants are not capable of providing reliable
data.Although there is still some argument regarding the particular reliability of the key informant,
it is essential for this study that the target respondent should be the director of the HR rather than
lower level users of the system. The reason is that the type of information sought makes it
mandatory that the respondent be not only a firm's policymaker whose decision will have a strong
influence on the direction the firm will pursue, but also a person occupying a position that makes
him knowledgeable of HRIS applications and their effectiveness.
The key informant method may not be a reliable source of data regarding adoption behaviour,
especially where no triangulation is possible. Despite Rogers' (1995) criticism of combining DOE
theory and the key informant method to examine organisational adoption and use of innovations,
this approach has been frequently used to investigate the adoption of various technologies, and to

118
identify the factors that influence such innovative behaviour. Given the validity and reliability
issues raised in such key informant research, the founder of the diffusion of innovation theory,
Everett Rogers, decried the use of this method to understand organisational innovativeness. Rogers
even explained his actions to "lead an intellectual revolt against them” (p.27) .The question
troubling any diffusion scholar who depends solely on data from the top leader in an organisation is
how fully such information can describe the organisation's innovation behaviour. Not very fully,
"the available evidence suggests that in essence [data from] each organisation in these diffusion
studies was reduced to the equivalent of an individual..." [There was no way to determine how
adequately these data truly represented the entire organisation's behaviour with regards to
technological innovation]. (Rogers and Shoemaker, 1983, p. 122).
Furthermore, the relatively small size of Jordan's shareholdings companies (in terms of the number
of employees and capital assets) compared to their counterparts in the Western countries, as well as
the relatively long time and high cost associated with the use of the multiple informant approach
made it is essential to rely upon a single informant for collecting data for this study. In addition,
previous works on the adoption of HRIS supported this notion by claiming that the directors or
managers of HR should be the key informant in this type of study (Campbell (2009). They are also
selected because they are supposed to be well-informed about the questions under investigation. As
a result, an effort was made to access the person at the higher level of management of the
individual firm, i.e., the general manager or the director of HR.
4.4.6 Deciding on the Appropriate Instrument of Measurement
Measurement is defined as “the rules for assigning of numbers to objects in such a way as to
represent quantities of attribute" (Churchill Jr and Iacobucci, 2009, p. 145). There are four general
levels of measurement: nominal, ordinal, interval and ratio. However, the selection of the
appropriate level of measurement is difficult. This arises mainly from disagreement over the
statistics that can legitimately be used at the different levels of measurement.
(Churchill Jr and Iacobucci, 2009, p.146) suggested that the empirical evidence indicated that,
“None of the scaling devices is superior in all instances; each one does not have its place nor is
there one single optimum number of scale positions or single optimum conditions for other
measured characteristics.’’ The nature of the problem, the characteristics of the respondent and the
planned mode of administration will and should affect the choice as to which technique should be
used in a particular instance and what features the scale should possess."
In the first part of the questionnaire, the nominal scale was employed to cover the firm's parameters
as well as the socio – demographic characteristics of the decision- maker. Though this scale is the
simplest amongst those available, it is appropriate for such data category (e.g., the type of business,

119
type of education, etc.). The questions in the nominal scale cannot be used for normal arithmetic
calculating, adding, subtracting, multiplying or dividing.
The 5 point rating scale was used in the second and third parts of the questionnaire. The
justification for using this type of scale was as follows: (1) it is relatively easy to construct and
administer, and (2) subjects generally find it easy to respond to because the response categories
allow sufficient expression of intensity of feeling (Aaker, 2011).
Furthermore, the selection of the 5 point rating scale is based on the fact that empirical studies,
such as the one conducted by Aaker (2011), have suggested that scales with three or more points
can, and do, provide a valid measure. Also in discussing the validity and reliability of different
scales, (Sekaran and Bougie, 2010) concluded that the reliability of different scale as well as the
number of the scale points increased.
On the one hand, any rating fewer than five points would reduce the scale's ability to discriminate,
since the respondent would be less able to express refined gradations.
Conversely, more than a seven point scale would be less than the optimum, because of the limited
increase in information gathered. Lehmann and Hulbert (1972, p.114) commented: “. Increasing the
number of scale points reduces the rounding error as benefit, but may also increase the cost of
administration, non- respondent bias and respondent fatigue, since averaging tends to reduce the
rounding error. When scale points aim to be averaged, the cost of increasing the number of scale
points will usually out-weight the benefit."
4.5 The Questionnaire Development Process
The questionnaire development process used here was suggested by Churchill (2009) see figure
(4.4) The Statistical Methods Used for Testing Research Hypotheses). Steps (1): type of
information sought and (2) type of questions were presented in the previous section.
Step (3) determines the content of the individual question: the content of the questionnaire
depends on the type of data required to be collected, data collection methods, and the
ultimate use of the results. Since this study is concerned with the impact of the firm's
environmental factors (external and internal) upon its adoption of HRIS and the level of
its implementation, it is necessary that the main constructs of both external and internal
environments be covered in the questionnaire. Each respondent will be asked about each
of the variables which constitute each construct. These variables were drawn from the
literature review, review as well as from a series of informal interviews. All unnecessary
or confusing questions were either altered or changed during the pre-test stage.
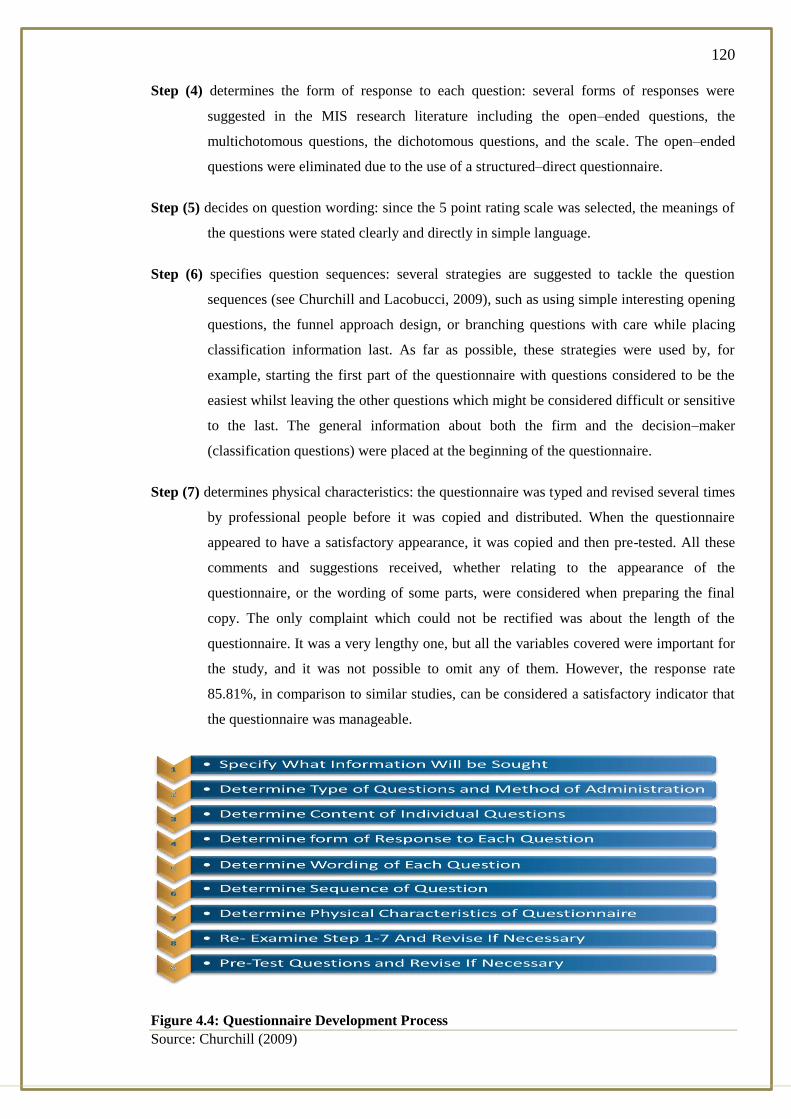
120
Step (4) determines the form of response to each question: several forms of responses were
suggested in the MIS research literature including the open–ended questions, the
multichotomous questions, the dichotomous questions, and the scale. The open–ended
questions were eliminated due to the use of a structured–direct questionnaire.
Step (5) decides on question wording: since the 5 point rating scale was selected, the meanings of
the questions were stated clearly and directly in simple language.
Step (6) specifies question sequences: several strategies are suggested to tackle the question
sequences (see Churchill and Lacobucci, 2009), such as using simple interesting opening
questions, the funnel approach design, or branching questions with care while placing
classification information last. As far as possible, these strategies were used by, for
example, starting the first part of the questionnaire with questions considered to be the
easiest whilst leaving the other questions which might be considered difficult or sensitive
to the last. The general information about both the firm and the decision–maker
(classification questions) were placed at the beginning of the questionnaire.
Step (7) determines physical characteristics: the questionnaire was typed and revised several times
by professional people before it was copied and distributed. When the questionnaire
appeared to have a satisfactory appearance, it was copied and then pre-tested. All these
comments and suggestions received, whether relating to the appearance of the
questionnaire, or the wording of some parts, were considered when preparing the final
copy. The only complaint which could not be rectified was about the length of the
questionnaire. It was a very lengthy one, but all the variables covered were important for
the study, and it was not possible to omit any of them. However, the response rate
85.81%, in comparison to similar studies, can be considered a satisfactory indicator that
the questionnaire was manageable.
Figure 4.4: Questionnaire Development Process
Source: Churchill (2009)

121
Step (8) re-examines and revises the questionnaire: Churchill (2009) suggested that each question
should be reviewed to ensure that the question was not confusing or ambiguous, potentially
offensive to the respondent, misleading, or biased, and that it was easy to answer. The
questionnaire was pre-tested at three different stages. Areas covered by the pre-test were:
1. The content validity of the questionnaire.
2. The ease of understanding the content.
3. The willingness and ability of executives to respond to the questions.
4.5.1 Pilot Study: Methodology and Findings
As indicated in the previous section, the content of the study's questionnaire is based on a review of
related literature on innovation adoption of IT and HRIS, as well as on the results of preliminary
interviews, and a number of initial responses provided by subjects from the manufacturing firms in
Jordan. In the first stage, the first copy of the questionnaire which was developed, designed and
translated into English, was reviewed by the researcher's supervisors. The questionnaire was then
redesigned in the light of their suggestions and comments. At the second stage of the pre-test,
faculty members of the Department of Business at the University of Jordan, who are
knowledgeable in MIS and HRIS in questionnaire design, reviewed the questionnaire and
commented on its clarity and relevance.
After incorporating their comments in a revised questionnaire, stage three of the pre-test was
carried out on few responding firms. The HR managers of 20 companies were contacted, while 18
of them were able and willing to participate in the interview. The Feedback from all the
responses unanimously showed that participants agreed on the clarity of the
instructions of the questionnaire, simplicity of the questions and finally the
attractiveness of the questionnaire layout.
The validity and the content of the questionnaire were investigated through open–ended interviews.
This procedure allowed the researcher to check for possible misunderstandings, and to assess the
subjects' willingness and ability to respond to the questions. As a result of this stage, the
questionnaire was re-edited for the final stage.
4.6 Development of Questionnaire Items
To draw up appropriate questions for the questionnaires in this study, key variables from the
literature review on innovation adoption at the organisational level were utilized (see chapter 2 and
chapter 3). The constructs, measurement variables, items code, item descriptions and measurement
scale of the questionnaire are summarized with references in Appendix 4. Variables used in the

122
identification of factors affecting the adoption and implementation of HRIS by user organisations
consisted of independent and dependent variables.
4.7 Ethical Considerations
This section describes why maintaining ethical standards must be ensured (Freed-Taylor,
1994) to achieve moral research (Neuman, 2006) and make the right or most appropriate decision
(McMurray, et al., 2004). To achieve these outcomes, the current research followed the ethical
guidelines of the research conducted by Brunel University. Essentially, the study obtained the
committee's ethical approval prior to the data collection process being assumed (see Appendix 2)
Participants were provided with detailed information about the research themes and objectives.
They were also informed that the collected data and findings will not be used for any reasons other
than the research as specified.
4.8 Preparing for Data Analysis
Before starting data analysis process, it was necessary to undertake the preliminary steps of editing,
coding, and tabulating the data.
Editing: This term, as used in marketing research, refers to the process of examining completed
questionnaires and taking whatever corrective action needed to ensure that the data is of a high
quality (Bryman and Bell, 2007). Editing is often done in two stages: field editing and central –
office editing. Field editing is a preliminary check designed to detect and tackle the most obvious
omissions, obscurities, and inaccuracies. In this research, effort has been made to keep the data
accurate. Office editing encompasses a more complete and exacting scrutiny and correction of the
completed and returned questionnaires (Bryman and Bell, 2007).
There are five areas with which the editing function should be concerned.These include: legibility,
completeness, consistency, accuracy, and response classification (Bryman and Bell, 2007).
In this study, most of the editing work was done by the researcher himself. All the questionnaires
were inspected to ensure that they were properly filled in, and that no significant omissions were
made.
Questionnaires that appeared to be hastily filled in (for example, by assigning number 5 for all the
variables) or partially filled out by leaving any questions unanswered were excluded from analysis.
However, if the left out questions in a partially-completed questionnaire were few, the
questionnaire was used in the final analysis and the unanswered questions were assigned a missing
value.

123
Coding and entering the data: coding means translating answers into both class membership and a
symbolic representation of this membership usually by means of a column and position designation
on a punch card used for machine tabulation (occasionally, coding is used in manual tabulation, but
this is more of a type of shorthand of a truly symbolic code).
In this research, the coding was done manually. There was little difficulty in coding the
questionnaire, since most of the questions were to be rated on a scale of five points (Q14 to Q30),
but the other questions related to the firm's parameters as well as the socio-demographic
characteristics of the decision makers were categorically measured. Each edited and coded question
was transferred to a coding sheet. Every completed and edited coding sheet was sent directly to the
computer and copied onto computer diskettes on a mainframe.
4.9 Summary
This chapter described the research design process and data collection methods that were used in
this research. It outlined the types of research approaches: quantitative and qualitative research, as
well as the research paradigms. It also discussed data types and sources, data collection methods,
questionnaire design, scale of measurement, and the domains of the study. The ethical
considerations and the process of data preparation for final analysis were also explained at the end
of this chapter.
Table 4.3: Research Design and Data Collection techniques
Research Methods Techniques
Research Approach Quantitative Research
Research Paradigm Positivism
Research Design /Purpose Testing the Hypotheses
Type of Investigation Correlation Study
Settings Non-Contrived Setting
Time Horizon This Study is Cross-Sectional
Questioning Method Administrated and Electronic Questionnaires
Structure of the Interview The Structured- Direct Technique
Data Type Primary /Secondary
Measurement Nominal/ Likert Scale (5 point rating)
In the next chapter, the statistical analysis techniques that are used to achieve the research
objectives and test its hypotheses are presented and discussed.

124
RESEARCH METHODOLOGY CHAPTER 5:
5.1 Introduction
In the previous chapter, the process of data collection, questionnaire design, and data preparation
for the final stage of analysis were fully presented. The aim of this chapter is to provide a brief
explanation of the statistical analysis techniques that are used to achieve the research objectives and
test its hypotheses.
5.2 Classification of Statistical Techniques
Business research literature suggests different methods for data analysis which can be classified
into three techniques according to the type of data and number of variables (e.g., (Sekaran and
Bougie, 2010); namely, univariate, bivariate, and multivariate. The Univariate technique is used if
there is a single measurement of each of the sample objects or if there are several measurements of
each of the observations, but each variable is to be analysed in isolation of others. The central
tendency measures (mean, median and mode) and the measures of dispersion (standard deviation,
relative and absolute frequencies), as well as the T- test, F- test, , chi-square test and McNemar
analysis are among the suggested techniques which can be used.
The bivariate analysis technique allows the researcher to examine the interaction between variables
taken, two, at a time, e.g. The investigation of the relationship between pairs of variables.
Suggested bivariate techniques are: linear correlation coefficient, rank correlation coefficient,
contingency coefficient lambda, T-test on regression coefficient, Mann- Whiteny U – test,
Kolmogorov- Smirnov test, chi - Square test and others (Blumberg, Cooper and Schindler, 2008).
The variate analysis technique is concerned with the investigation of interaction among a set of
variables. The multivariate technique can be classified as either dependent or independent. The
dependent methods imply that one or more variables are specified as being predicted by a set of
independent variables, while the independent method implies that there is no variable selected as
being a dependent variable.
The dependent method might include analysis of variance (ANOVA), analysis of variance and
covariance (ANCOVA), multiple regressions, automatic interaction detection (AID), multiple
classification analysis (MCA), and discriminant function analysis (DFA). The independent methods
might include cluster analysis, factor analysis, latent structure analysis and non – metric
multidimensional scaling.
The decision was made in the research to use a combination of the above data analysis techniques.
From The univariate statistical methods used in this research were the chi-square test, the Pearson

125
correlation coefficients and the McNemar test with regard to the multivariate techniques, factor
analysis, regression analysis, and discriminate function analysis were employed.
The following criteria were used for selecting these statistical techniques. According to Blumberg,
Cooper and Schindler (2008) the selection of the appropriate technique depends on:
1. The type of data (nominal, ordinal, interval and ratio).
2. The research design (dependency of the observation, number of observations per object,
number of groups being analysed).
3. The assumptions underlying the test statistics.
This research focuses on the investigation of the effect of the firm's internal and external
environmental factors upon its adoption of HRIS and the level of implementation and its
effectiveness. The external and internal environmental variables were measured on a 5 point scale
which was assumed to have an interval property. This necessitated the use of various statistical
techniques suitable for each level.
5.3 Statistical Methods Used for Research objectives
5.3.1 Factor Analysis
Factor analysis is an interference multivariate technique. It can be defined as a procedure that takes
a large number of variables or objects and seeks to see whether they have a small number of factors
in common which accounts for their inter – correlation (Blumberg, Cooper and Schindler, 2008).
The common factor analysis assumes that each variable is a function of the same set of underlying
common factors plus a factor unique to that variable. However, each variable has a different set of
weights associated with the factor analysis (Sekaran and Bougie, 2010). In applying factor analysis,
one is interested in examining the strength of the overall association among the variables in terms
of a smaller set of linear composites of the original variables that preserve most of the information
in the full data (Hair et al., 2010).
In other words, the factor analysis procedure involves finding a way of linearly transforming the
original variables into a new smaller set of independent factors, which when multiplied together in
a special manner will produce the original correlation matrix as closely as possible. Factor analysis
can be applied to serve two major functions. One function is to identify underlying constructs in the
data (Hair et al., 2010) by deriving dimensions in the data which combine each group of similar
variables under specific termed factors. A second function of factor analysis is simply to reduce a
large number of variables to a more manageable set (Cooper & Schindler 2008).
The smaller set of factors expresses what is common among the original variables. Generally
speaking, factor analysis can be useful to the analyst in three ways (Cooper & Schindler 2008).

126
Firstly, it can point out the latent factors or dimensions that determine the relationship among a set
of observed or manifest values. Secondly, factor analysis can be helpful in pointing out the
relationship among the observed values that were there all the time but were not easy to see.
Thirdly, factor analysis is useful when things need to be grouped.
5.3.1.1 Methods of Extracting the Initial Factor
The main objective of the extraction step in exploring factor analysis is to determine the minimum
number of common factors that would satisfactorily produce the correlation among the observed
variables (Sekaran & Bougie 2011).
In this research, the principal component analysis is employed. According to Hair et al. (2010), this
method is appropriate when the objective is to reduce a large number of variables to a smaller set of
uncorrelated Factors for subsequent use in a regression or other prediction techniques, and also
when the researcher has prior knowledge suggesting that unique and error variance represents a
relatively small proportion of the total variance.
In using factor analysis, the researcher must in one way specify the number of factors to be
considered, since we normally begin the analysis without knowing how many factors, or which
factors underlie a set of manifest variables (Kneller and Stevens, 2002).
Stress the importance for the investigator not to leave out any important factors. If this occurs, the
results will be basically worthless. On the other hand, if the researcher instructs the program for
many factors in addition to the important ones, those factors will appear in the program output but
contribute little to the explanatory power of the factor model.
In fact, carrying the analysis too far has penalties; on one hand, this might be time-consuming, and
on the other hand, this may obscure the meaning of the findings An exact quantitative method for
determining the number of factors to rotate has not been developed; therefore, two rules of thumb
are simultaneously used here for this purpose:
1. Interpretability- by this method the smaller factors are retained only if they have
sufficient substantial meaning to be interpreted.
2. Eigenvalue*- by this criterion the analysis is limited to the number of factors with an
eigenvalue greater than one (Blumberg, Cooper and Schindler, 2008). The rationale for
this approach is that any individual factor should account greater for at least the variance
of a single variable if it is to be retained for interpretation (Hair et al., 2010).

127
5.3.1.2 Factor Analysis Input /Output
The input of factor analysis is usually a set of variables values for each individual or object in the
sample. In this present research, the input is a set of attributes that relate to search construct alone.
In other words, the variables which express each construct of the firm's environmental dimensions
were used as inputs for factor analysis. Factor analysis uses a derived matrix of correlation, the
components of which provide a measure of similarity between variables. Factor analysis has value
only when correlation amongst a subset of variables really exists. The higher these inter
correlations are, the better defined are the resulting factor dimensions.
The most important outputs are: factor loading, factor scores and variance explained percentages.
Each of the original variables has a factor loading on each factor. The factor loading is the
correlation between the factors and the variables. These are used to interpret the factors.
Furthermore, the nearer to one the factor loading is, the stronger the association between the
variable and the factor (Blumberg and Schindler, 2008; Cooper & Schindler 2008). Normally,
factor loadings are crystallized by using a rotation procedure, the most commonly used one is the
varimax orthogonal rotation which attempts to produce some high loading and some near zero
loading on each factor. The varimax orthogonal rotation method is preferred when the objective is
to utilize the factors results in a subsequent statistical analysis (Hair et al.2010). This is because the
factors are orthogonal (uncorrelated) and therefore eliminate the collinearity.
The interpretability of factors is facilitated when individual factor loading is high or low. (Cooper
and Schindler, 2003). This also reminds us that while it attempts to maximize the number of
factor/variable correlations that are either high or low, it also minimizes the number of factors with
which a variable is correlated.
5.3.1.3 Use of Factor Analysis in the Study
Factor analysis was used in this study for the following objectives:
1. To find out the main patterns of factors that underlie each construct of the internal and
external environmental dimensions as well as the main patterns of the factors that
underline the effectiveness of HRIS dimensions.
2. To use the output of factor analysis as an intermediate step for further analysis by
regression and discriminating analysis. It is decided that the cut-off point for the factor
leadings should not be less than .30. The rationale for this is that those variables which
load above or equal .30. On any factor are considered significant (Hair et al., 2010).
3. To overcome the potential problem of Inter-correlation among independent variables, i.e.,
the multicollinearity problems.
*Eigenvalue: the column sum of square for a factor; also referred to as the latent root. It
represents the amount of variance accounted for by a factor (Hair et al., 2010)
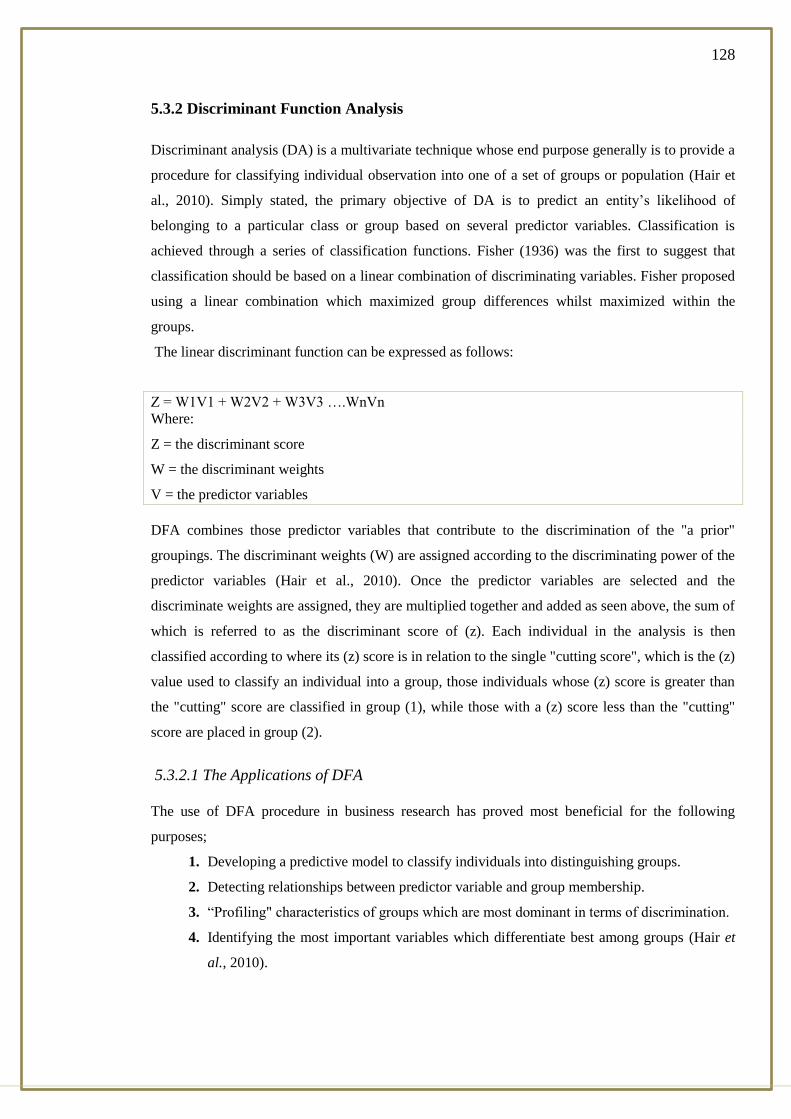
128
5.3.2 Discriminant Function Analysis
Discriminant analysis (DA) is a multivariate technique whose end purpose generally is to provide a
procedure for classifying individual observation into one of a set of groups or population (Hair et
al., 2010). Simply stated, the primary objective of DA is to predict an entity’s likelihood of
belonging to a particular class or group based on several predictor variables. Classification is
achieved through a series of classification functions. Fisher (1936) was the first to suggest that
classification should be based on a linear combination of discriminating variables. Fisher proposed
using a linear combination which maximized group differences whilst maximized within the
groups.
The linear discriminant function can be expressed as follows:
Z = W1V1 + W2V2 + W3V3 ….WnVn
Where:
Z = the discriminant score
W = the discriminant weights
V = the predictor variables
DFA combines those predictor variables that contribute to the discrimination of the "a prior"
groupings. The discriminant weights (W) are assigned according to the discriminating power of the
predictor variables (Hair et al., 2010). Once the predictor variables are selected and the
discriminate weights are assigned, they are multiplied together and added as seen above, the sum of
which is referred to as the discriminant score of (z). Each individual in the analysis is then
classified according to where its (z) score is in relation to the single "cutting score", which is the (z)
value used to classify an individual into a group, those individuals whose (z) score is greater than
the "cutting" score are classified in group (1), while those with a (z) score less than the "cutting"
score are placed in group (2).
5.3.2.1 The Applications of DFA
The use of DFA procedure in business research has proved most beneficial for the following
purposes;
1. Developing a predictive model to classify individuals into distinguishing groups.
2. Detecting relationships between predictor variable and group membership.
3. “Profiling" characteristics of groups which are most dominant in terms of discrimination.
4. Identifying the most important variables which differentiate best among groups (Hair et
al., 2010).
129
5.3.2.2 DFA Date Input/ Output
Discriminant analysis is mostly used to classify and to make predictions in situations where the
criterion variable is in a categorical form (e.g., adopters and non-adopters of HRIS) and the
predictor variable appears in a metric form (interval per ratio). By using the SPSS discriminant
function analysis of two groups, various statistics can be obtained. The key DFA output can be
summarized as follows:
1. Standardized discriminant function coefficients. These coefficients reflect the relative
ability of each predictor variable to discriminate (discrimination power) between groups
where the other predictors are held constant (Tabachnick, Fidell and Osterlind, 2001) .
The absolute magnitude of the standardized discrimination function coefficient (which
is similar to the Beta weight in multiple regression analysis) is used as an indication of
the relative importance of a predictor variable (Tabachnick, Fidell and Osterlind, 2001).
The larger the discriminant coefficients, the more important the variable as a
discrimination.
2. Eigenvalue and canonical correlation. While eigenvalue indicates the discriminating
power of the discriminant function, canonical correlation provides the degree of
association between discriminant function scores and group membership (Tabachnick
and Osterlind, 2001).
3. Statistical significance. All DFA programs provide automatically the significant level of
the discriminant function which has been developed. A chi – Square value with its
degree of freedom and its level of significance is available in the SPSS discrimination
programs. Moreover, the SPSS program of DFA automatically discontinues at or
beyond the 0.05 level (Hair et al., 2010) with the stepwise method which is employed in
this research.
4. Classification or confusion matrix. This matrix helps visualize exactly how accurate the
discriminant functions "predicated" group memberships. It provides sufficient
information for classification of the individual into their appropriate groups. The most
important factor to be considered in the classification matrix is the overall predictive
accuracy of the discriminant function.
5. Group means. The group means is considered very useful in interpreting how a predictor
variable discriminates between groups. For example, if predictor variables were found to
discriminate between group (a) and group (B), it would be worthwhile to compare the
mean of this predictor variable for group (a) with its counterpart mean for group (b).

130
6. All-groups histograms of the discrimination scores. The discriminant function scores for
each group (1 and 2) are plotted in a histogram. The purpose of this histogram is to show
how much two or more groups overlap and to examine the distribution of the
discrimination score.
.
5.3.2.3 Use of DFA in this Study
Multiple discrimination analysis was considered to be the most appropriate statistical technique for
accomplishing the study's objectives (2, 3 and 4), as it fulfils the following requirements:
1. The ability to determine whether or not a statistically significant difference exists
between the two groups (i.e., adopters and non-adopters of HRIS) in terms of their
environmental measures.
2. The ability to predict group membership of firms on the basis of the internal and external
environmental measures, taken together and separately.
3. The ability to identify the degree of association between adopters and non- adopters of
HRIS (i.e., adoption behaviour of HRIS) and their environmental measures, (i.e., internal
and external).
4. The ability to identify those independent variables which account for most of the
differences between groups.
5. To discover whether the addition of the external environmental measure to the internal
environmental measure might improve the prediction of group membership.
5.3.3 Multiple Regression Analysis
Multiple regressions is a multivariate statistical technique through which one can analyse the
relationship between a dependent or criterion variable, and a set of independent or predictor
variables. Multiple regression can be viewed either as a descriptive technique by which the linear
dependence of one variable on another is summarized and decomposed, or as an inferential tool by
which the relationship is the population evaluated from the examination of sample data.
Multiple regression analysis attempts to determine the functional relationship between a single
metric dependent variable (criterion) and a number of independent (explanatory) variables (Bryman
and Bell, 2007). Multiple regression is the appropriate method of analysis when the researcher has
a single dependent variable which is presumed to be a function of other independent variables.
Usually, the dependent variable is predicted or explained by a group of independent variables.
131
Bryman and Bell (2007) have suggested two different concepts of independent variable on the basis
of the study’s goal. Firstly, the independent variables (explanatory), sometimes, called the predictor
variable when prediction is the goal. They help to predict the value of dependent variable
(criterion). Secondly, they are called explanatory variables because they explain variation in the
dependent variable. When constructing the model, the analyst must include all relevant variables. If
an important variable is omitted, the power of the model is reduced. As for variables, the larger the
beta coefficient, the stronger the impact of that variable upon the criterion variable. In addition, the
Beta weight enables the analyst to see how well a set of explanatory variables explain the criterion
variable, and to determine the most influential explanatory variables. The simple R² (the coefficient
of multiple determination) through which one can measure the proportion of the variation in the
dependent variable, tends to overestimate the population value of R². Therefore, adjusted R²
attempts to correct the optimistic bias of the simple R². Adjusted R² does not necessarily increase
as additional variables are added to an equation and is the preferred measure of goodness of fit
because it is not subject to the inflationary bias of unadjusted R².
In summary, multiple regression is often used to gain an understanding of the relationship between
variables by:
1. Finding a function or formula by which one can estimate the value of the criterion
variable from the predictor variable (Hair et al., 2010).
2. Determining which of the independent variables has the greatest influence upon the
dependent variable (Hair et al., 2010).
5.3.3.1 Caution in the Use of Multiple Regression
The use of multiple regression analysis is not without problems. One of the most common
problems in applying regression analysis is the multicollinearity. Multicollinearity refers to the
situation in which some or all of the indecent variables are very highly correlated. In other words,
when independent variables are related to each other and not truly independent of each other,
multicollinearity is said to exist. Such correlation between the explanatory variables in the
regression equation makes the identification of structural relationship difficult or impossible.
Bryman and Bell (2007) distinguished between two forms of multicollinearity. The first form is
perfect Collinearity in which some independent variables regressed against the other independent
variables in the model yield an R² of precisely 1.00. This arises from very small data sets (i.e.,
small samples). The second is less extreme multicollinearity in which the independent variables in
a regression equation are intercorrelated but not perfectly. The study of multicollinearity in data
analysis revolves around two major problems: (1) how it can be deleted, and (2) what can be done
about it. These problems are particular to business research where one often faces the dilemma of
needing a number of variables to achieve accuracy of explanatory variables (Bryman and Bell,
2007).

132
Multicollinearity can be dealt with by different approaches. Hair et al, (2010) suggested several
ways for dealing with such situations. First, it can be ignored, particularity when multicollinearity
may be prominent in only a subset of the explanatory variables and when this subset does not
account for a large proportion of the variance in the data. The second approach is to omit one or
more of the highly correlated predictor variables. This one is recommended when two variables are
clearly measuring the same thing. Thirdly, the correlated variables can be combined or otherwise
transformed, to produce unrelated variables that can be summarized in a set of explanatory factors
using factor analysis. Furthermore, Bryman and Bell (2007) add that another way to avoid
multicollinearity is by increasing the sample size.
In this research, the use of the principal components analysis technique was the only possible way
to overcome the potential problem of multicollinearity.
5.3.3.2 Use of Regression Analysis in this Study
The regression analysis techniques (stepwise regression method) was preferred here since it fulfils
the requirements of the study objectives (5-9) as shown in table 5.1 The primary purposes behind
using this technique are:
1. To find out statistically whether there is a significant relationship between the two sets of
environmental dimension measures (internal and external) and the dependent variable
level of implementation of HRIS applications, taken separately or together.
2. To discover whether the addition of the external environmental dimension measures to
the internal environmental dimension measures would produce a better explanation for
the dependent variable level of exporting.
3. To conclude whether these explanatory variables (taken together) are strongly relevant to
the level of exporting.
4. To determine the most important independent variables explaining the variation of the
dependent variable.

133
Table 5.1: Research Objective and Techniques of Data Analysis
The Research Objectives Techniques of Data
Analysis
1 To develop a theoretical framework through the integration of
Innovation Diffusion Theory and Technology-organisation-
environment model and the relevant studies in the area of
HRM. This framework consists of two broad dimensions: the
firm’s internal environmental factors and the firm's external
environmental factors.
The study Framework
2 To find out the main pattern of factors (i.e., component) that
underlie each construct of both environmental dimensions (i.e.,
internal and external).
Factor Analysis
3 To compare the firm's internal environmental factors with its
counterpart (i.e., the external environment) in terms of their
predictive power of classification of the group membership,
adopters vs. non-adopters
Discriminant Function
Analysis
4 To identify and profile the adopters and non-adopters of HRIS
applications groups on the basis of their evaluation of the
internal and external environmental factors
Discriminant Function
Analysis
5 To identify to which extent the HRIS applications are adopted
and practiced by the business organisations in Jordan. i.e. To
examine the content and context of HRIS in Jordan.
Multiple
Regression
6 To find out the extent of the influence of the firm's internal
environmental factors (taken together or separately) upon its
level of implementations of HRIS applications.
Multiple
Regression
7 To find out which environment, the internal or external or the
interaction of both environments can explain more larger
variations of the level of implementation of HRIS application
among business organisations in Jordan To identify the relationship between the level of
implementation of HRIS and its effectiveness
Multiple
Regression
8 To find out the extent of the influence of the firm's internal
environmental factors (taken together or separately) upon its
level of implementations of HRIS applications
Multiple
Regression
9 To identify the relationship between the level of
implementation of HRIS and its effectiveness Multiple
Regression
5.3.4 Simple Correlation Coefficient
The Pearson correlation coefficient is an appropriate statistical method for measuring the degree of
association between variables that are interval or ratio scaled (Bryman and Bell, 2007). The
correlation coefficient is the standard measure of the linear relationship between two variables and
has the following properties:
1. It is a pure number and independent units of measurement.
2. Its absolute value varies between zero when the variables have no linear relationship, and
one, when each variable is perfectly predicted by the other. The absolute value thus gives
the degree of relationship.

134
3. Its sign indicates the direction of the relationship. A positive sign indicated a tendency or
high value of one of the variables to occur with high values of the other variable. A
negative sign indicates a tendency for the high value of one variable to be associated with
low value of the other. Reversing the direction of measurement of one of the variables
will produce a coefficient of the same absolute value but of the opposite sign. A
coefficient of equal value but opposite sign (e.g., 50 or -.50) thus indicates an equally
strong linear relationship but in the opposite direction (Hair et al., 2010).
The primary purposes behind the use of this technique in the present study are:
1. To identify the strength and the direction of the relationship between each explanatory
independent variable (taken as a factor or as a specific variable) and the dependent
variable in the level of using HRIS applications.
2. To find out whether there is a statistical significant association between the independent
variables and the level of level of implementation of HRIS applications, taken together or
separately.
5.4 Statistical Methods Used for Testing Research Hypotheses
There are alternative statistical tests available for any given research design, and it is necessary to
use some rationale for selecting among them. In hypothesis testing, we must state the hypothesized
value of population parameters before we begin sampling. The assumption we wish to test is the
null hypothesis "Hn". A statistical test is good if it has a small probability of rejecting (Hn) when it
is true, but has greater probability of rejecting (Hn) when it is false. If our sample results fail to
support the null hypothesis, we must conclude that something else is true. In other words, in
applying a statistical test, the researcher must choose between accepting or rejecting the null
hypothesis (Hn). If (Hn) is rejected, then he tends to use this as evidence in favour of (HI) (Siegel,
1956).
Siegel (1956) suggests that there are two major considerations in choosing a statistical test. Firstly,
the researcher must consider the manner in which the sample was drawn and the nature of its
population. Secondly, he must consider the kind of scale of measurement (i.e., nominal. Ordinal,
interval or ratio) which was employed in the definition of the variables involved in the study. Luck
and Rubin (1987) added another consideration which must be taken into account when deciding on
the appropriate statistical test, such as, (1) how many samples are involved in the problem" "one,
two or many (K) samples?" (2) Are the samples independent or related to each other?

135
In this study, four different statistical tests representing parametric and non- parametric statistical
methods were used to test the research hypotheses (i.e., F- test, T- test, chi-square test, and
McNemar test). Table 5.2 illustrates the research hypotheses and the relevant tests.
Table 5.2: Research Hypotheses and their Relevant Statistical Tests
Hypotheses Statistical Test
H1: There is a significant difference between the two groups (i.e.,
adopters and non-adopters of HRIS applications) in terms of their internal
environmental measures, taken together.
H1n: There is no significant difference between the two groups (i.e.,
adopters and non-adopters of HRIS applications) in terms of their internal
environmental measures, taken together.
Chi-Square &
F-test
H2: There is a significant differentiation between the two groups (i.e.,
adopters and non-adopters of HRIS applications) on the basis of their
external environmental measures, taken together.
H2n: There is no significant differentiation between the two groups (i.e.,
adopters and non-adopters of HRIS applications) on the basis of their
external environmental measures, taken together.
Chi-Square &
F-Test
H3: There is a significant differentiation (i.e., variation) between the two
groups (i.e., adopters and non-adopters of HRIS applications) in terms of
their internal environmental measures, taken separately.
H3n: There is no significant differentiation (i.e., variation) between the
two groups (i.e., adopters and non-adopters of HRIS applications) in terms
of their internal environmental measures, taken separately.
T-test
(taken separately)
H4: There is a significant differentiation (i.e., variation) between the two
groups (i.e., adopters and non-adopters of HRIS applications) on the basis
of their external environmental measures, taken separately.
H4n: There is no significant differentiation (i.e., variation) between the
two groups (i.e., adopters and non-adopters of HRIS applications) on the
basis of their external environmental measures, taken separately.
T-test
(taken separately)
H5: There is a significant improvement in the discrimination (i.e.,
variation) between the two groups (i.e., adopters and non-adopters of
HRIS applications) after the addition of external environmental measures
(i.e., 4 factors) to the internal environmental measures (i.e., 16 factors) in
the prediction model of DFA.
H5n: There is no significant improvement in the discrimination (i.e.,
variation) between the two groups (i.e., adopters and non-adopters of
HRIS applications) after the addition of external environmental measures
(i.e., 4 factors) to the internal environmental measures (i.e., 16 factors) in
the prediction model of DFA.
McNemar –test
H6: There are significant differences between the two groups (i.e.,
adopters and adopters) on the basis of variables which make up of each
factor, taken separately
H6n: There are no significant differences between the two groups (i.e.,
adopters and adopters) on the basis of variables which make up of each
factor, taken separately.
T-test (taken
separately)

136
H7: There is a significant relationship between the internal environmental
measures (16 factors) and the level of implementation of HRIS
applications, taken together.
H7n: There is no significant relationship between the internal
environmental measures (16 factors) and the level of implementation of
HRIS applications, taken together.
F-Test
(taken together)
H8: There is a significant relationship between the external
environmental measures (4 factors) and the level of implementation of
HRIS applications, taken together.
H8n: There is no significant relationship between the external
environmental measures (4 factors) and the level of implementation of
HRIS applications, taken together.
F-Test
(taken together)
H9: There is a significant relationship between the two environmental
measures (20 factors) and the level of implementation of HRIS
applications, taken together.
H9n: There is no significant relationship between the two environmental
measures (20 factors) and the level of implementation of HRIS
applications, taken together.
F-Test (taken
together)
H10: There is a significant relationship between each independent factor
(i.e., internal and external factors) and the level of implementation of
HRIS applications, taken separately.
H10n: There is no significant relationship between each independent
factor (i.e., internal and external factors) and the level of implementation
of HRIS applications, taken separately.
T-test
(taken separately)
H11: There is significant relationship between the variables which
comprise each factor and the level of implementation of HRIS
applications, taken separately.
H11n: There is significant relationship between the variables which
comprise each factor and the level of implementation of HRIS
applications, taken separately.
T-test
(taken separately)
H12: There is significant relationship between the level of
implementation of HRIS applications and the perceived component of the
HRIS effectiveness measures (operational/administrative effectiveness
and relational effectiveness and transformational/strategic effectiveness),
taken together.
H12n: There is no significant relationship between the level of
implementation of HRIS applications and the perceived component of the
HRIS effectiveness measures (operational/administrative effectiveness
and relational effectiveness and transformational/strategic effectiveness),
taken together.
F-Test
(taken together)
H13: There is a significant relationship between the level of
implementation of HRIS applications and the perceived component of the
HRIS effectiveness measures (operational/administrative effectiveness
and relational effectiveness and transformational/strategic effectiveness),
taken separately.
H13n: There is no significant relationship between the level of
implementation of HRIS applications and the perceived component of the
HRIS effectiveness measures (operational/administrative effectiveness
and relational effectiveness and transformational/strategic effectiveness),
taken separately.
T-test
(taken separately)
137
H14: There is a significant relationship between the level of
implementation of HRIS applications and the variables which comprise
each factor of its effectiveness measures, taken separately.
H14n: There is no significant relationship between the level of
implementation of HRIS applications and the variables which comprise
each factor of its effectiveness measures, taken separately.
T-test
(taken separately)
(1) T-Test: The T- Test is a parametric statistical test. It is employed for testing hypotheses
(H4/H4n, and H8/H8n) this statistical test is provided by the stepwise regression analysis computer
program. It is also used to measure the significance of the relationship between each independent
variable (the output of principle component analysis), and the level of implementation of HRIS
applications. Furthermore, the T-test is employed to test the significant difference between the
means of the two groups (i.e., adopters and non- adopters of HRIS) in terms of variables
constituting each factor (the factors which underlie each major construct of the firm's internal and
external environmental dimensions), taken separately.
(2) Univariate F- Test: The SPSS statistical package provides the result of the F-test with the
results of some of the statistical techniques (e.g., DFA discriminant function and RA regression
analysis). In this research the F- test is used to test the significance of regression equations, and to
measure the degree of significance of the discriminating power for each predictor variable in the
analysis, taken separately.
(3)The Chi – Square Test: The Chi- square test is employed for testing research hypotheses
(H1/H1n and H2/H2n) Table 5.2. The command DISCRIMINATE, in the SPSS computer program,
routinely prints the chi- square value, the degree of freedom, and the significant level.
(4)The McNemar Test: The McNemar test is used for testing research hypothesis number
(H3/H3n).We seek the significant improvement (or changes) in the classification, and variation
between the two groups in the analysis before and after the addition of the external environmental
measure to internal environmental measure. Therefore, the McNemar test of the significance of
change is appropriate (Hair et al., 2010). To test the significance of any observed change by this
method, one can set up a fourfold table of frequencies to represent the first and second sets of
response from the same individuals. The general features of such a table are pointed out in (Figure
5.1), in which (+) and (-) are used to signify different responses. In the McNemar test, the research
is often interested only in two cells which show change between the first and second treatment. The
sampling distribution associated with this test is chi- square distribution (Siegel, 1956).

138
After
- +
+
Before
-
Figure 5.1 : A Fourfold Table for Use in Testing the Significance of Change
5.5 Reliability and Validity Assessment
Just as it is important to understand whether the variables are measured on an interval or ordinal
scale, it is important to understand that the measurement instruments used in the research should be
evaluated for their reliability and validity. If invalid measures are used, then any conclusions that
might be drawn are meaningless, just as if an inappropriate descriptive procedure were used for
nominal data. Likewise, if the measurements are unreliable, we have little confidence that the same
results would be obtained if the research were repeated. Reliability and validity are two important
characteristics of any measurement procedure involved in the scientific method. Reliability and
validity are related topics but address rather separate aspects of the measurement process
(Tabachnick and Osterlind, 2001).
Reliability identifies the stability or consistency of the research findings if the research activities
were repeated under similar circumstances. Validity, however, refers to how well the research
measures what it claims to measure. It seeks to verify whether the treatment is totally responsible
for the outcome or whether other factors also have some major impact (Hair et al., 2010).
On the other hand, the issues of the reliability and validity assessment are still debatable.
According to Bohrnstedt (1970), not all scientists agree with the interpretations given by the results
of the reliability and validity assessment and the reader should recognize that there is still a debate
about these issues. Undoubtedly, the debate about the meanings of reliability and validity will
continue for some time. This might explain why many researchers are less enthusiastic to assess the
reliability and validity of their work as was reported in the literature (Tabachnick and Osterlind,
2001).
However, in order to be on the safe side we have decided to address the issues of reliability and
validity assessment as they relate to this study. Therefore, in this section, we discuss first reliability
and then validity. The discussion highlights each of these two concepts in terms of: the concern, the

139
different methods, the method employed in the assessment of this search, and the justification for
choosing the particular method of assessment
5.5.1 Testing the Internal Consistency Reliability:
5.5.1.1 The Application of Cornbach's Alpha
The goal of science is to understand relationships among variables. The implementation of this goal
is heavily dependent upon the ability of the researcher to measure his variables with as little error
as possible because error in measurement tends to distort relationships among variables
(Tabachnick and Osterlind, 2001). Reliability reflects the relative absence of measurement errors in
a measuring instrument and is associated with random (or chance) errors. Briefly, there are three
basic statistical methods available to business researchers for assessing the reliability of their
measures (Sekaran and Bougie, 2010):
1. Measures of Stability (e.g., the test – retest procedure).
2. Measures of Equivalence (e.g., the internal consistency methods which include the split-
halves using the Spearman-Brown Prophecy formula, the Kuder- Richardson formulas
KR20 and KR21, the Guttman formula, and Cornbach's alpha which is commonly known
as the alpha correlation coefficient method).
3. Alternative form reliability.
All the above mentioned techniques of reliability assessment attempt to determine the proportion of
variance in a measurement scale that is systematic, they also depend heavily upon correlation
between parallel measures. The higher the correlation, the more reliable the measure is (Bryman
and Bell, 2007). The basic difference among the three methods is in what the scale is to be
correlated with to compute the reliability confident (Bryman and Bell, 2007). In the test-retest
method an identical set of measures is applied to the same subjects at two different times. The two
sets of obtained scores are then correlated. In the internal consistency methods, a measuring scale is
applied to the same subjects at one point in time; subsets of the items within the scale are then
correlated. In the alternative forms, two similar sets of items are applied to the same subjects at two
different times. Scale items on one form are designed to be similar (but not identical) to scale items
on the other form. The resulting scores from the two administrations of the alternative forms are
then correlated (Bryman and Bell, 2007).
In this study, the scale of measurement which could be employed to evaluate the internal and
external environmental factors influencing the adoption of HRIS consists of (126) measures (I, e.,
and all variables) related to two dimensions of the environmental factors, as they affect
implementation of HRIS applications. The two environmental measures are :( a) internal factors
140
which consisting of (98) variables; (b external factors which consisting of (30) variables. Most of
these variables were generated from the literature of both adoption of IT innovation and HRIS.
In order to assess the reliability of these 126 variables, comprising the scale of this study to
evaluate the adoption of HRIS, the decision was made to employ Cornbach's Alpha method. The
justifications for choosing this particular technique rather than the other available methods can be
reported as follows:
1. In the test-retest method of reliability assessment, the same scale is applied a second time
to the same subjects under condition as similar as the investigator can make them. The
scores from the two administrations then are correlated and the resulting index is
interpreted in terms of the stability of performance of the measures over time. A two –
week interval is the generally recommended retest period (Peter, 1979). While test-retest
correlations represent an intuitively appealing procedure by which to assess reliability,
they are not without serious problems. First, different results may be obtained depending
on the length of time between measurement and measurement. In general, the longer the
interval the lower the reliability estimates (Bohrnstedt, 1970). Second, if a change in the
phenomenon occurs between the first and the second administration, there is no way to
distinguish between change and unreliability (Heise, 1969; Heise, 1969), Third, not only
can it be unduly expensive to obtain measurements at multiple points in time, but it can
be impractical as well (Carmines and Zeller, 1979). Fourth, as for the interview survey,
Bailey (1987) reported that, unfortunately, the bulk of studies in the literature have not
consisted of testing and retesting the same mailed questionnaire but rather of comparing
the same questionnaire in emailed versus interview situations. Fifth, if the test-retest
method is employed, it should be supplemented with internal consistency estimates for
each administration (Sekaran and Bougie, 2010).
2. In the split- half approach to reliability, the total number of items in a composite is
divided into two halves, and the two half-scores are then correlated. Since the actual
measure is twice as long as the half-score being correlated, the correlation is usually
inserted into a formula known as the Spearman-Brown prophecy formula (Sekaran and
Bougie, 2010). Although the split-half method is one of earliest variety of equivalence
measures and is the basic form of internal consistency estimate, yet there is pointed
criticism being directed at this method of reliability as the measure of internal consistency
of scale. The criticism focuses on the necessarily arbitrary division of the items into
equivalent halves. Each of the many possible divisions can produce different correlations
between the two forms or different reliabilities. Which division is correct or, alternatively,
what is then the reliability of the scale being measured? It is no wonder that the split-half

141
method began to fall into issue as more precise methods for estimating reliability were
developed. By far the most popular of these reliability estimates is developed by
Cronbach’s in 1951 which is known as the alpha correlation coefficient or simply as
Cronbach's alpha (Carmines and Zeller, 1979). Finally, as for its application in the mail
survey indicated that the split-half reliability procedures would be difficult if not
impossible to administer for a mail questionnaire as a whole.
The alternative form reliability method is, in some ways, similar to the test-retest method in that it
also requires two testing situations with the same subjects (people). However, it differs from the
test-rest method in one very important regard: the same test is not given on the second testing but
an alternative, and presumably equivalent, form of the same test is administered to the same people.
These two forms of measurement are interned to measure the same thing. As in the test-retest
reliability method, the results of the two tests are correlated on an item-by-item basis to obtain a
reliability coefficient (DeVellis, 2003). Although the alternative-form method is superior to the
simple test-retest method, primarily because it reduces the extent to which individual's memory can
inflate the reliability estimate, it suffers from certain basic limitations (DeVellis, 2003). The first
problem is associated with the extra time, expense, and trouble involved in obtaining two truly
equivalent measures (forms) ((DeVellis, 2003). The second problem, which is a technical one, is
related to the development of substantially equivalent alternative measures so that the mean,
variance, and intercorrelation of items on each from must be equivalent.
Though this problem has been overcome to some extent in educational testing, it remains a serious
consideration for the measurement of other behavioural constructs (Peter, 1979). An even more
perplexing problem with the application of the alternative form reliability is the practical difficulty
of constructing two alternative forms that are parallel and proving that the two measures are
equivalent in content. For example, if the correlation between the scores on the two forms is low, it
is difficult to determine whether the measures have intrinsically low reliability or whether one of
the forms is simply not equivalent in content to the other (Nunnally, 1967). The importance of
assessing reliability with the alternative forms depends on the phenomenon under investigation. If
the phenomenon is expected to vary over a relatively short period of time, then the alternative form
measures may be necessary for examining changes (Peter, 1979). Though the alternative form
method may be necessary for the investigation of some marketing constructs, coefficient alpha
usually will provide a close estimate of the alternative forms reliability (Sekaran and Bougie,
2010).
A better approach to internal consistency reliability is known as coefficient alpha. This method, in
effect, produces the mean of all possible split-half coefficients resulting from different splitting of
the measuring instrument. The resulting coefficient alpha can range from 0 to 1. A value of 0.6 or
less is usually considered as unsatisfactory (Churchill Jr and Peter, 1984). At the same time, it is
often too costly in terms of time, money, and efforts to try to obtain a higher reliability coefficient

142
beyond 0.8 (Hair et al., 2010). The key advantages of the alpha correlation coefficient method of
the reliability assessment are as follows: first, it is a very general reliability coefficient
encompassing both the Spearman-Brown prophecy formula as well as the Kuder-Richardson 20
equation. As such it is the most commonly accepted formula for assessing the reliability of a
measurement scale with multi-point items (Bohrnstedt and Felson, 1983). Second, it is particularly
easy to use because it requires only a single test administration, and the minimal effort that is
required to compute alpha is more than repaid by the substantial information that it conveys about
the reliability of a scale (Sekaran and Bougie, 2010). Third, according to Nunnally (1967), the
alpha correlation method is one of the most important deductions form the theory of measurement
errors and it is the single most meaningful measure of internal consistency reliability and therefore,
should routinely be applied to all new tests to assess the quality of the instrument,
Finally, although some aspects of deriving the alpha coefficient have been criticized by few
researchers, it still offers a useful and usable approach to assessing the reliability of measurement
scales in business research.(Sekaran and Bougie, 2010). Since our scales are constructed to
measure two dimensions relating to the adoption of HRIS in Jordanian business sector [i.e., internal
and external dimensions, we had to compute the correlation alpha for the measures (variables) in
each dimension, one at a time. In addition, correlation alpha vas computed for all the two
dimensions, in other words, 23 runs of reliability analysis were performed to assess the ability of
our scale to reduce the random error of measurement in the process of data collection.
5.5.2 Validity Assessment: Content (Face) validity
The validity of a scale is the extent to which it is a true reflection of the underlying variables (s) it
is attempting to measure. Alternatively, it is the extent to which the scale fully captures all aspects
of the construct to be measured. The most common approaches to assess the validity of a
measurement are*: construct validity, criterion- related validity, and content (face) validity. Below
we briefly discuss construct validity and criterion validity content (Face) validity is discussed in
more detail.
Construct Validity – involves understanding the theoretical rationale underlying the obtained
measurement. The approach is to relate the construct of interest to other constructs such that a
theoretical framework is developed for the phenomenon being measured. Construct validity can be
evaluated with other approaches. If a construct exists, it should be successfully measured by
methods that are different or independent. Convergent validity involves the measurement of a
construct with independent measurement techniques and the demonstration of a high correlation
among the measures. Alternatively, if a construct exists, it should be distinguished from constructs
which differ from it.
143
Criterion - related validity- in pursuing the objective of criterion validity, the researcher attempts
to develop or obtain an external criterion against which the scaling results can be matched. (Hair et
al. 2008) The outside criterion may, of course, be another scale. Criterion validity can be assessed
by correlating the set of scaling result under study with some other set, developed from another
instrument. Criterion – related validity can take two forms, based on the time period involved:
concurrent and predictive validity. Concurrent validity involves comparing the results of two
different measures of the same characteristic in the same object at the same object at the same point
in time. Concurrent validation is not limited to comparisons between scores on measurement
instruments. It can also occur between two behaviours or between behaviour and a measurement.
Content (Face) validity- the content of a measurement instrument concerns the substance, matter
and topics included as they relate to the characteristic that is being measured. Since a measuring
instrument includes only a sample of the possible items that could have been included, content
validity is concerned with how representative the scale or instrument is of the universe of the
property or characteristic being measured. By its very nature, content validation is essentially
judgmental.
The researcher ordinarily attempts to measure content validity by the personal judgments of experts
in the field. That is, several content experts may be asked to judge whether the items being used in
the instrument are "representative" of the field being investigated. Establishing a content-valid
measure of factors involves a number of inter-related steps (Kerlinger, 1986). First, a domain of
content must be fully specified. Next, the available literature on the domain of content must be
thoroughly explored, hoping thereby to come to an understanding of the domain. A thorough search
and examination of the literature may suggest, for example, that the domain is properly conceived
of in terms of a number of dimensions.
In addition, it may be useful to further subdivide these dimensions. It is then necessary to construct
items that reflect the meaning associated with each dimension and each subdivision of the domain
being studied. It is impossible to specify exactly how many items need to be developed for any
particular domain of content. But one point can be stated with confidence: it is always preferable to
construct too many items rather than too few; inadequate items can always be eliminated, but one is
rarely in a position to add "good" items at a later stage in the research. Finally, although in
construct or criterion-related validity, a correlation coefficient is generally used to define the degree
to which a test relates to other measures of the same or related variables. In content validity, there
is no external referent and a correlation is meaningless.
Therefore, content validity is a judgmental process, with the investigator or others deciding if the
test seems well constructed and samples its domain adequately (Bear-Lehman and Abreu, 1989).
Accordingly, competent just (experts), on the domain, should judge the content of the items. The

144
domain of content must be clearly defined, and the judges must be furnished with specific
directions for making judgments, as well as with specification of what they are judging. The
consensus of the experts (judges) opinion should be taken into full consideration in particular with
respect to which dimensions or sub-dimension(s) (i.e., variables or sub-variables) to be included in
or deleted from the measure being developed.
To insure that the developed measure has content validity, these steps must be worked out
thoughtfully and meticulously throughout. In this empirical study, the decision was made to
employ content validity for the following reasons. It is impossible to "validate" a measure of a
concept in this sense unless there exists a theoretical network that surrounds the concept (Carmines
and Zeller, 1979) given the relative paucity of a good theory in marketing. Construct validity rarely
receives much attention in marketing research practices (Bear-Lehman and Abreu, 1989). The
greatest difficulty of criterion –related validation is the criterion (Kerlinger, 1986). Criterion
validation cannot be applied to all measurement situations in the social sciences. The most
important limitation is that, for many if not most measures in the social sciences, there simply do
not exist any relevant criterion variables against which a developed measure can be reasonably
evaluated.
Therefore criterion validation procedures have rather limited usefulness in social sciences
(Carmines and Zeller, 1979). Content validity estimates provide an essential but subjective
evaluation of the appropriateness of the measuring instrument for the task at hand (MOSER,). In
addition, the most common use of content validity is with multi-items (questions) that are
combined to represent one dimension. Similarly, other dimensions. The content validity of these
items (questions) is to be determined by having a panel of judges (e.g., supervisor(s), and/or a panel
of experts on the domain of content) to assess the representatives of the items used to measure the
domain of content being studied (Kinnear and Taylor, 1987). Finally, content validity is the most
common form of validation used in business research (Hair et al., 2010).
Sources: discussion on types of validity is based on various sources including: (Hair et al.,
2010) (Tabachnick, Fidell and Osterlind, 2001).
5.6 Summary
Based upon the research objectives and hypotheses, several statistical techniques were preferred to
analyses the data and to achieve the research objectives in addition to testing the research
hypotheses.
The statistical techniques chosen varied from the univariate, the bivariate and the multivariate,
depending on the type of data and the number of variables. The univariate statistical methods used
in this research were the chi-square test, the Pearson correlation coefficients and the McNemar test.
145
With regard to the multivariate techniques, the following were used: factor analysis, multiple-
regression analysis, and discriminant function analysis.
This chapter included a brief description of the alternative statistical techniques which have been
used in this study, the basis for choosing the appropriate statistical techniques, and the reason for
using each technique in this research. Finally, the chapter concluded with a discussion of the
reliability and validity assessment of the research.
The following chapter is dedicated to the presentation and discussion of the research findings of the
use of factor analysis. The purpose of these techniques is to identify the main pattern of factors that
underlie the environmental dimensions and effectiveness. The validity and reliability of data are
also presented.
146
THE FACTOR ANALYSIS, RELIABILITY AND CHAPTER 6:
VALIDITY FINDINGS
6.1 Introduction
In the previous chapter the research methodology and the selected statistical techniques were
presented and discussed This Chapter presents the main findings of the Principal Component
Analysis. The main purpose behind the use of these techniques here is to reduce the large number
of variables that underlie each construct of both dimensions (i.e., internal and external
environments) in addition to extract the main factors underlying effectiveness measures into
orthogonal indices for further analysis by the discriminant (Chapter 7) and regression analysis
(Chapter 8).
Furthermore, by employing the principal component analysis techniques, it may be possible to
explore the patterns of factors that underlie each major construct. It was considered an appropriate
method to overcome the potential problems of multicollinearity among the variables that pertain to
each construct.
In this chapter, a pre-analysis was conducted to examine the appropriateness of the data for factor
analysis. Then, the results of the factor analysis were examined using multiple criteria including,
eigenvalues, interpretability and internal consistency, as recommended by Hair et al., (2010) and
Shi and Wright (2000). Therefore, items with eigenvalues more than one and factor loadings less
than (.30) were determined. This means that the items had little or no relationship with each other,
hence they were discarded (hair et al., 2010). Finally, Cornbach's alpha reliabilities were examined
for each variable. Each coefficient greater than (.60) for adapted and (.70) as recommended by
Nunnally and Bernstein (1994) for existing scales was considered a reliable indicator of the
constructs under study (Hair et al., 2010).
6.2 The Findings of the Factor Analysis
The results of the principal components analysis indicate that twenty factors can be extracted from
the eight major constructs of both environmental dimensions (internal and external). Sixteen factors
are derived from the five constructs of the internal environmental dimension and four factors are
extracted from the three constructs of the external environmental dimension. Table 6.1 presents the
number of factors underlying each construct of both dimensions.
It is decided that the cut off point for the factor loadings should not less than .40. The rational
for these variables which load above or equal .30 on any factor are considered significant (hair et
al. 2010)

147
Table 6.1: Factors Underlying the Internal and External Dimensions
Major
Dimension
Construct Number of
Variables
Number of
Factors
Internal
Management Expectation 17 3
Organisation’s Dynamic Capabilities 23 8
Organisation Structure 22 3
Management Commitment and
Culture
25 3
Socio –Demographic Profile of
Decision-Makers
9 2
External
Industry Characteristics and Market
Structure
19 2
Social Influences 7 1
Government Policies & Support 4 1
Total 126 20
6.2.1 The Interpretation of the Final Factor Analysis
The main patterns of factors underlying each construct of the internal and external dimension and
their interpretations are presented under the following sections:
6.2.1.1 The Constructs of the Internal Environmental Dimension
The organisation's internal environmental constructs consist of five major constructs (For more
details see Chapter Three). These constructs are: (1) Management’s Expectations. (2)
Organisation's Dynamic Capabilities (3) Organisational Structure (4) Management Commitment
and Culture and (5) Socio-Demographic Profile of Decision-Maker. The interpretations of the
results of the principal components analysis are presented for each of these constructs as follows:
1. Management's Expectation Construct Measures:
The management's expectations, (i.e., the perceived characteristics of HRIS applications) are one of
the major constructs of the organisation’s internal environmental measures. It was used to measure
the importance of the adoption and implementation of HRIS applications and its compatibility and
complexity to the company .The management's expectations construct was measured using (17)
items as presented in table 1 see (Appendix 6). An inspection of the correlation matrix indicated in
Table 6.2 that the correlations were all above the acceptable level of .30. The subsequent KMO and
Bartlet's test resulted in significant level of probability (P>.000) and high KMO statistics of (.940)
indicating the factor analysis could be proceed as (94.0%) of the variance in the data can be
explained by the management's expectations constructs.
The varimax rotation version with Kaiser normalisation was used to produce more interpretable
factors. The eigenvalue (>1) criteria was used in order to determine the number of factors

148
Table 6.2: KMO and Bartlett's Test
Kaiser-Meyer-Olkin Measure of Sampling Adequacy. .940
Bartlett's Test of
Sphericity
Approx. Chi-Square 7191.996
Df 171
Sig. .000
The results of the principal of component analysis Table 6.3 indicate that three factors can be
extracted from the variables of this construct. The first factor, which accounts for (31.32%) of the
variance with loadings ranging from .67 to .85, can be identified as a "Perceived advantage” factor.
The second factor, which explains 28.54% of variance with loadings range from.73 to .79, can be
labelled as "compatibility" factor and the third one, which account for (21.62%) of variance can be
named as "complexity "factor. The combinations of these factors account for (81.38%) of the total
variance in the questionnaire data as can be shown in table 6.4. As this measure was adapted from
an existing scale, the computed Cronbach's Alpha level of (.816) indicated the items were highly
reliability as can be seen in Table 1 see (Appendix 6).
Table 6.3: Total Variance Explained
Component/ Factor
Rotation Sums of Squared Loadings
Eigenvalue % of Variance Cumulative %
1 5.912 31.117 31.117
2 5.406 28.451 59.568
3 4.110 21.629 81.197
2. Organisation’s Dynamic Capabilities Construct Measures
The construct organisation's dynamic capabilities measured twenty three items as presented in table
2 see (Appendix6). The initial inspection of the correlation matrix revealed the presence of
correlations well above acceptable limit of .30. An evaluation of the correlation with the Bartlett's
and KMO test indicated that significant probability levels (P>.000) and high KMO statistics of
.915, indicating that the factor analysis could proceed around (.92%) of the variance in the data can
be explained by organisation's dynamic capabilities as presented in table 6.4.
Table 6.4: KMO and Bartlett's Test
Kaiser-Meyer-Olkin Measure of Sampling Adequacy. .915
Bartlett's Test of
Sphericity
Approx. Chi-Square 46791.403
Df 253
Sig. .000
The findings of the principal component analysis reveal that five significant factors accounting for
(67.12%) of the total variance can be extracted from the twenty three items (measures) of the
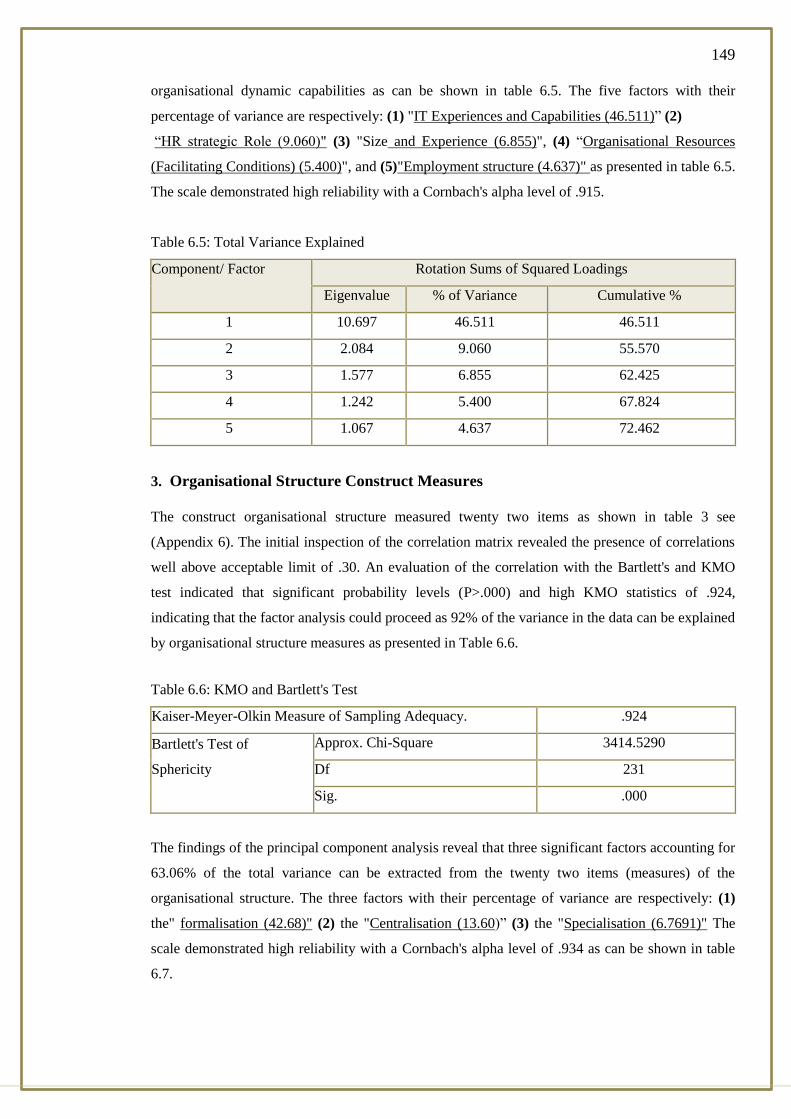
149
organisational dynamic capabilities as can be shown in table 6.5. The five factors with their
percentage of variance are respectively: (1) "IT Experiences and Capabilities (46.511)” (2)
“HR strategic Role (9.060)" (3) "Size and Experience (6.855)", (4) “Organisational Resources
(Facilitating Conditions) (5.400)", and (5)"Employment structure (4.637)" as presented in table 6.5.
The scale demonstrated high reliability with a Cornbach's alpha level of .915.
Table 6.5: Total Variance Explained
Component/ Factor Rotation Sums of Squared Loadings
Eigenvalue % of Variance Cumulative %
1 10.697 46.511 46.511
2 2.084 9.060 55.570
3 1.577 6.855 62.425
4 1.242 5.400 67.824
5 1.067 4.637 72.462
3. Organisational Structure Construct Measures
The construct organisational structure measured twenty two items as shown in table 3 see
(Appendix 6). The initial inspection of the correlation matrix revealed the presence of correlations
well above acceptable limit of .30. An evaluation of the correlation with the Bartlett's and KMO
test indicated that significant probability levels (P>.000) and high KMO statistics of .924,
indicating that the factor analysis could proceed as 92% of the variance in the data can be explained
by organisational structure measures as presented in Table 6.6.
Table 6.6: KMO and Bartlett's Test
Kaiser-Meyer-Olkin Measure of Sampling Adequacy. .924
Bartlett's Test of
Sphericity
Approx. Chi-Square 3414.5290
Df 231
Sig. .000
The findings of the principal component analysis reveal that three significant factors accounting for
63.06% of the total variance can be extracted from the twenty two items (measures) of the
organisational structure. The three factors with their percentage of variance are respectively: (1)
the" formalisation (42.68)" (2) the "Centralisation (13.60)” (3) the "Specialisation (6.7691)" The
scale demonstrated high reliability with a Cornbach's alpha level of .934 as can be shown in table
6.7.
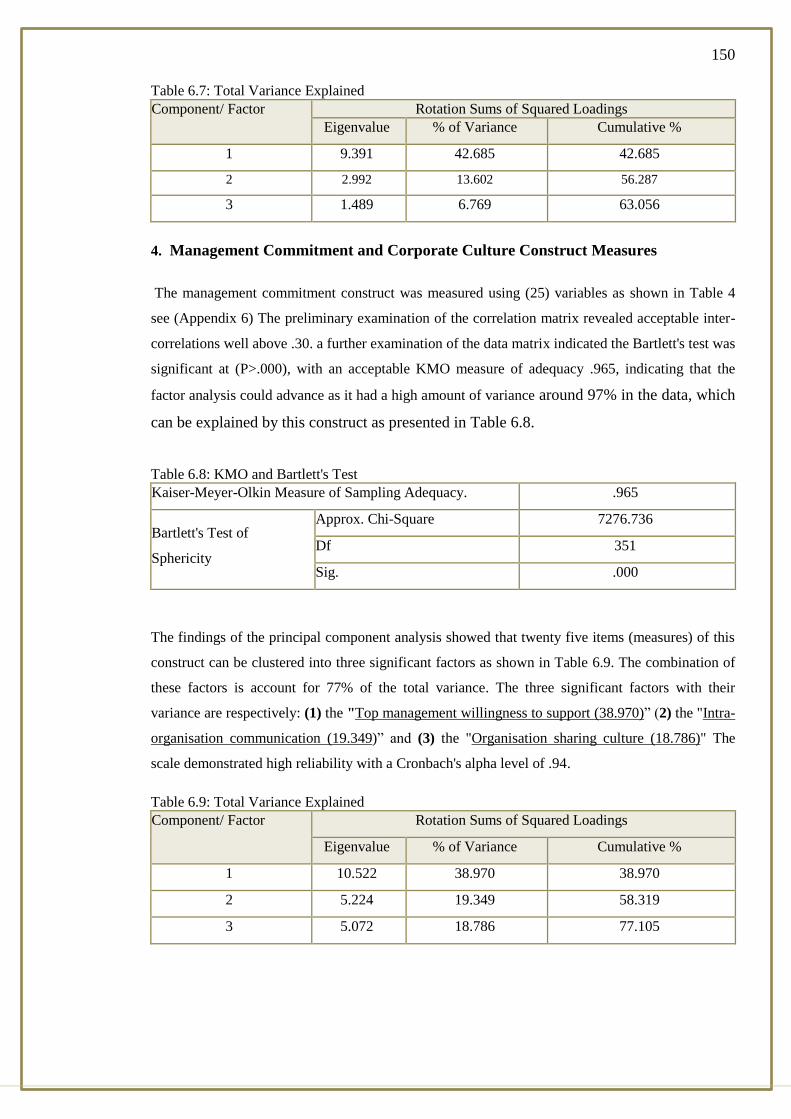
150
Table 6.7: Total Variance Explained
Component/ Factor Rotation Sums of Squared Loadings
Eigenvalue % of Variance Cumulative %
1 9.391 42.685 42.685
2 2.992 13.602 56.287
3 1.489 6.769 63.056
4. Management Commitment and Corporate Culture Construct Measures
The management commitment construct was measured using (25) variables as shown in Table 4
see (Appendix 6) The preliminary examination of the correlation matrix revealed acceptable inter-
correlations well above .30. a further examination of the data matrix indicated the Bartlett's test was
significant at (P>.000), with an acceptable KMO measure of adequacy .965, indicating that the
factor analysis could advance as it had a high amount of variance around 97% in the data, which
can be explained by this construct as presented in Table 6.8.
Table 6.8: KMO and Bartlett's Test
Kaiser-Meyer-Olkin Measure of Sampling Adequacy. .965
Bartlett's Test of
Sphericity
Approx. Chi-Square 7276.736
Df 351
Sig. .000
The findings of the principal component analysis showed that twenty five items (measures) of this
construct can be clustered into three significant factors as shown in Table 6.9. The combination of
these factors is account for 77% of the total variance. The three significant factors with their
variance are respectively: (1) the "Top management willingness to support (38.970)” (2) the "Intra-
organisation communication (19.349)” and (3) the "Organisation sharing culture (18.786)" The
scale demonstrated high reliability with a Cronbach's alpha level of .94.
Table 6.9: Total Variance Explained
Component/ Factor Rotation Sums of Squared Loadings
Eigenvalue % of Variance Cumulative %
1 10.522 38.970 38.970
2 5.224 19.349 58.319
3 5.072 18.786 77.105
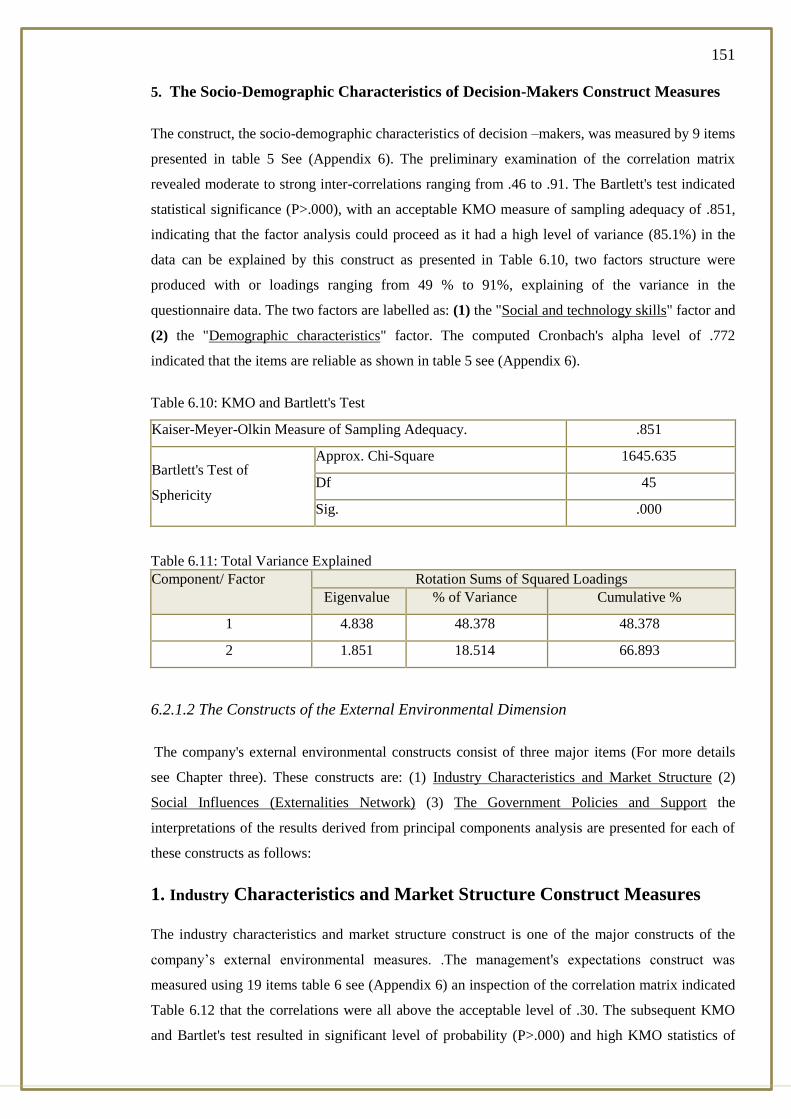
151
5. The Socio-Demographic Characteristics of Decision-Makers Construct Measures
The construct, the socio-demographic characteristics of decision –makers, was measured by 9 items
presented in table 5 See (Appendix 6). The preliminary examination of the correlation matrix
revealed moderate to strong inter-correlations ranging from .46 to .91. The Bartlett's test indicated
statistical significance (P>.000), with an acceptable KMO measure of sampling adequacy of .851,
indicating that the factor analysis could proceed as it had a high level of variance (85.1%) in the
data can be explained by this construct as presented in Table 6.10, two factors structure were
produced with or loadings ranging from 49 % to 91%, explaining of the variance in the
questionnaire data. The two factors are labelled as: (1) the "Social and technology skills" factor and
(2) the "Demographic characteristics" factor. The computed Cronbach's alpha level of .772
indicated that the items are reliable as shown in table 5 see (Appendix 6).
Table 6.10: KMO and Bartlett's Test
Kaiser-Meyer-Olkin Measure of Sampling Adequacy. .851
Bartlett's Test of
Sphericity
Approx. Chi-Square 1645.635
Df 45
Sig. .000
Table 6.11: Total Variance Explained
Component/ Factor Rotation Sums of Squared Loadings
Eigenvalue % of Variance Cumulative %
1 4.838 48.378 48.378
2 1.851 18.514 66.893
6.2.1.2 The Constructs of the External Environmental Dimension
The company's external environmental constructs consist of three major items (For more details
see Chapter three). These constructs are: (1) Industry Characteristics and Market Structure (2)
Social Influences (Externalities Network) (3) The Government Policies and Support the
interpretations of the results derived from principal components analysis are presented for each of
these constructs as follows:
1. Industry Characteristics and Market Structure Construct Measures
The industry characteristics and market structure construct is one of the major constructs of the
company’s external environmental measures. .The management's expectations construct was
measured using 19 items table 6 see (Appendix 6) an inspection of the correlation matrix indicated
Table 6.12 that the correlations were all above the acceptable level of .30. The subsequent KMO
and Bartlet's test resulted in significant level of probability (P>.000) and high KMO statistics of

152
.933 indicating the factor analysis could be proceed as (93.3%) of the variance in the data can be
explained by this construct.
Table 6.12: KMO and Bartlett's Test
Kaiser-Meyer-Olkin Measure of Sampling Adequacy. .933
Bartlett's Test of
Sphericity
Approx. Chi-Square 4589.631
Df 171
Sig. .000
The results of the principal component analysis Table 6.19 indicate that two significant factors can
be extracted from this construct. This construct composed of (19) items (variables) as presented in
Table 6 see (Appendix 6). The first factor, which accounts for (42.141%) of the variance with
loadings ranging from .43 to .85, can be identified as an "Availability of IT suppliers &Activities
"factor. The second factor, which explains 25.085% of variance with loadings range from .69 to
.75, can be labelled as "Competition pressure" factor. The combinations of these factors account for
67.226 of the total variance in the questionnaire data as can be shown in table 6.13. As this measure
was adapted from an existing scale, the computed Cronbach's Alpha level of (.817) indicated the
items were highly reliable.
Table 6.13: Total Variance Explained
Component/ Factor Rotation Sums of Squared Loadings
Eigenvalue % of Variance Cumulative %
1 8.007 42.141 42.141
2 4.766 25.085 67.226
2. Social Influences (Externalities Network)
The social influences (externalities network) were measured by seven items as shown in table 7 see
(Appendix6). The preliminary examination of the correlation matrix revealed the presence of
inter-correlations well above the acceptable limit of .30. An evaluation of the correlation matrix
with the Bartlett's and KMO tests indicated significant probability levels (P>.000) and high KMO
statistics of .894, indicating that the factor analysis could proceed as 89.4% of the variance in the
data can be explained by this construct as shown in table 6.14.
Table 6.14: KMO and Bartlett's Test
Kaiser-Meyer-Olkin Measure of Sampling Adequacy. .894
Bartlett's Test of
Sphericity
Approx. Chi-Square 1397.362
Df 21
Sig. .000
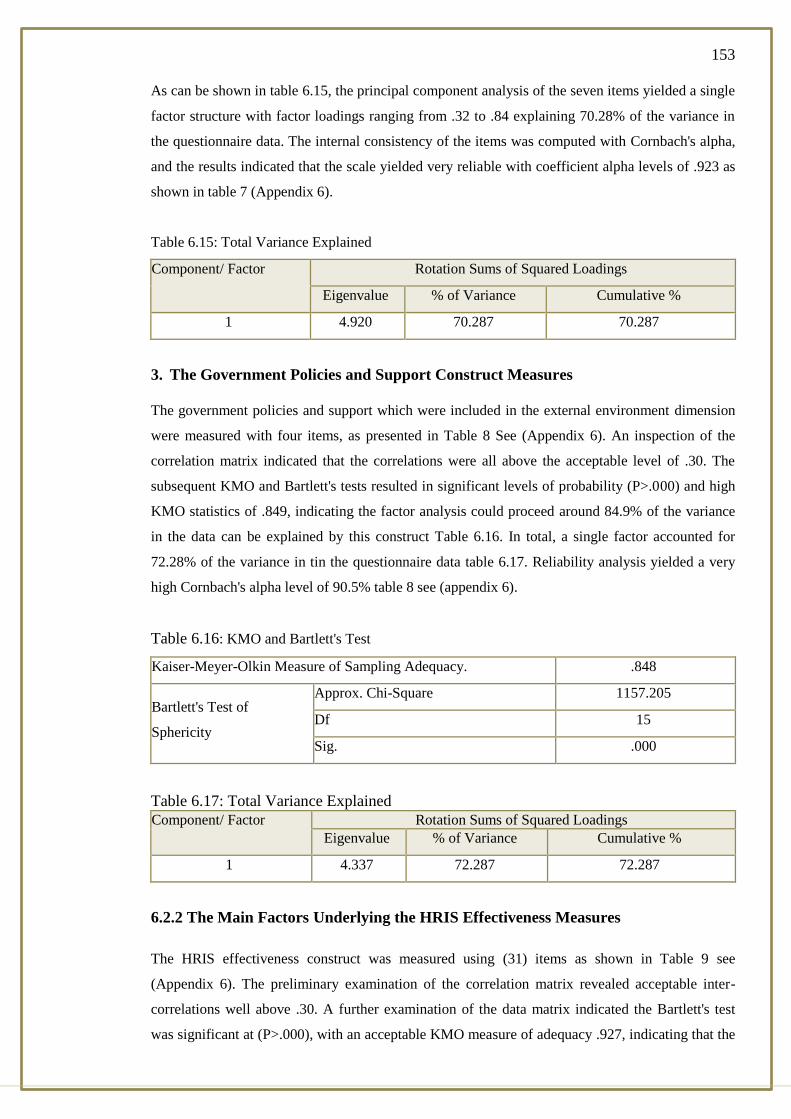
153
As can be shown in table 6.15, the principal component analysis of the seven items yielded a single
factor structure with factor loadings ranging from .32 to .84 explaining 70.28% of the variance in
the questionnaire data. The internal consistency of the items was computed with Cornbach's alpha,
and the results indicated that the scale yielded very reliable with coefficient alpha levels of .923 as
shown in table 7 (Appendix 6).
Table 6.15: Total Variance Explained
Component/ Factor Rotation Sums of Squared Loadings
Eigenvalue % of Variance Cumulative %
1 4.920 70.287 70.287
3. The Government Policies and Support Construct Measures
The government policies and support which were included in the external environment dimension
were measured with four items, as presented in Table 8 See (Appendix 6). An inspection of the
correlation matrix indicated that the correlations were all above the acceptable level of .30. The
subsequent KMO and Bartlett's tests resulted in significant levels of probability (P>.000) and high
KMO statistics of .849, indicating the factor analysis could proceed around 84.9% of the variance
in the data can be explained by this construct Table 6.16. In total, a single factor accounted for
72.28% of the variance in tin the questionnaire data table 6.17. Reliability analysis yielded a very
high Cornbach's alpha level of 90.5% table 8 see (appendix 6).
Table 6.16: KMO and Bartlett's Test
Kaiser-Meyer-Olkin Measure of Sampling Adequacy. .848
Bartlett's Test of
Sphericity
Approx. Chi-Square 1157.205
Df 15
Sig. .000
Table 6.17: Total Variance Explained
Component/ Factor Rotation Sums of Squared Loadings
Eigenvalue % of Variance Cumulative %
1 4.337 72.287 72.287
6.2.2 The Main Factors Underlying the HRIS Effectiveness Measures
The HRIS effectiveness construct was measured using (31) items as shown in Table 9 see
(Appendix 6). The preliminary examination of the correlation matrix revealed acceptable inter-
correlations well above .30. A further examination of the data matrix indicated the Bartlett's test
was significant at (P>.000), with an acceptable KMO measure of adequacy .927, indicating that the
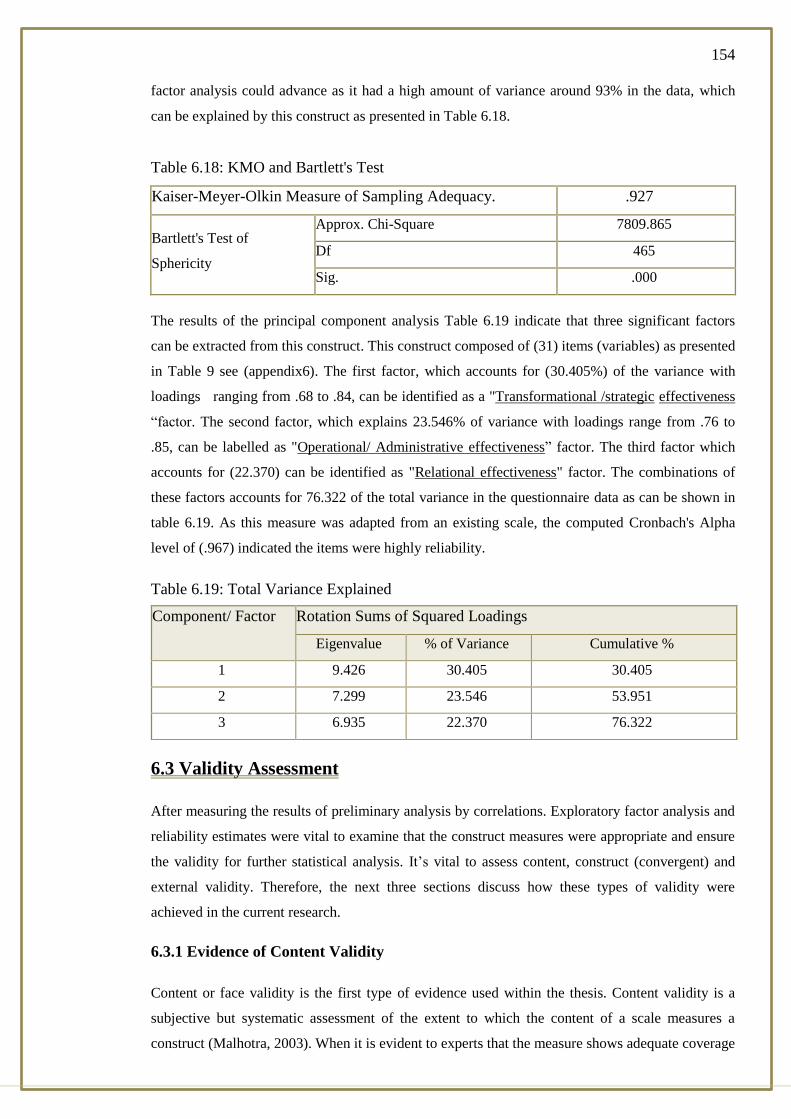
154
factor analysis could advance as it had a high amount of variance around 93% in the data, which
can be explained by this construct as presented in Table 6.18.
Table 6.18: KMO and Bartlett's Test
Kaiser-Meyer-Olkin Measure of Sampling Adequacy. .927
Bartlett's Test of
Sphericity
Approx. Chi-Square 7809.865
Df 465
Sig. .000
The results of the principal component analysis Table 6.19 indicate that three significant factors
can be extracted from this construct. This construct composed of (31) items (variables) as presented
in Table 9 see (appendix6). The first factor, which accounts for (30.405%) of the variance with
loadings ranging from .68 to .84, can be identified as a "Transformational /strategic effectiveness
“factor. The second factor, which explains 23.546% of variance with loadings range from .76 to
.85, can be labelled as "Operational/ Administrative effectiveness” factor. The third factor which
accounts for (22.370) can be identified as "Relational effectiveness" factor. The combinations of
these factors accounts for 76.322 of the total variance in the questionnaire data as can be shown in
table 6.19. As this measure was adapted from an existing scale, the computed Cronbach's Alpha
level of (.967) indicated the items were highly reliability.
Table 6.19: Total Variance Explained
6.3 Validity Assessment
After measuring the results of preliminary analysis by correlations. Exploratory factor analysis and
reliability estimates were vital to examine that the construct measures were appropriate and ensure
the validity for further statistical analysis. It’s vital to assess content, construct (convergent) and
external validity. Therefore, the next three sections discuss how these types of validity were
achieved in the current research.
6.3.1 Evidence of Content Validity
Content or face validity is the first type of evidence used within the thesis. Content validity is a
subjective but systematic assessment of the extent to which the content of a scale measures a
construct (Malhotra, 2003). When it is evident to experts that the measure shows adequate coverage
Component/ Factor Rotation Sums of Squared Loadings
Eigenvalue % of Variance Cumulative %
1 9.426 30.405 30.405
2 7.299 23.546 53.951
3 6.935 22.370 76.322
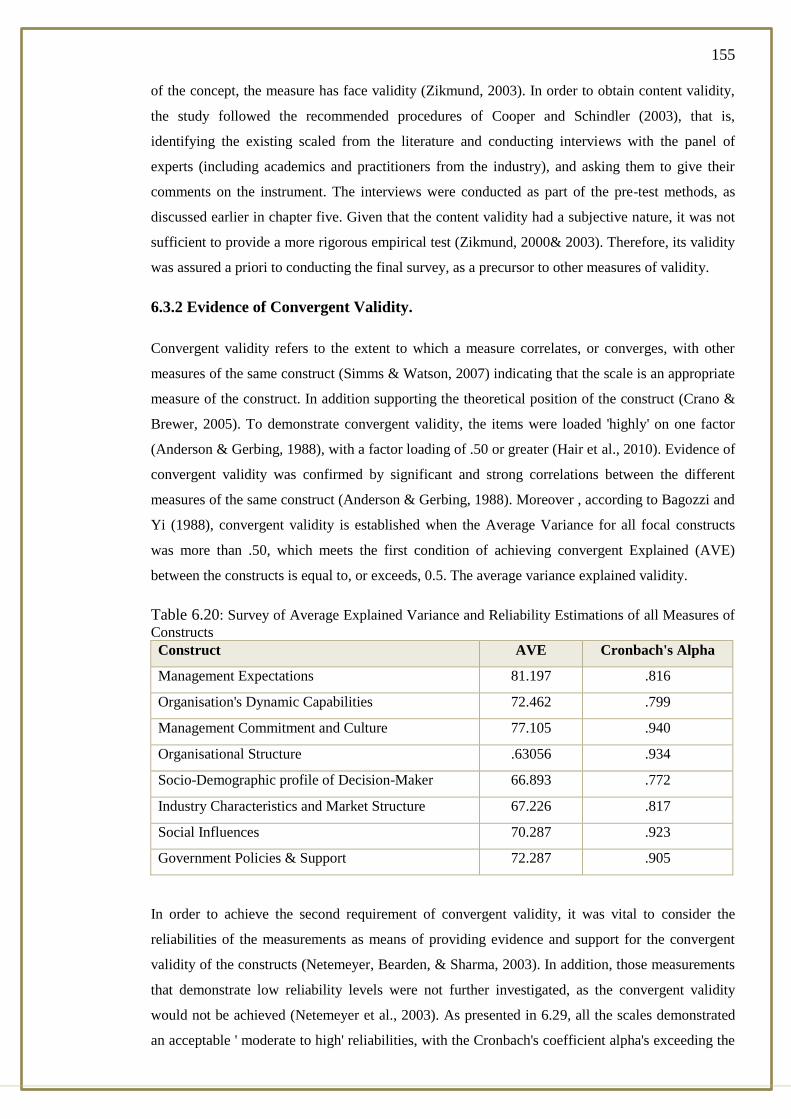
155
of the concept, the measure has face validity (Zikmund, 2003). In order to obtain content validity,
the study followed the recommended procedures of Cooper and Schindler (2003), that is,
identifying the existing scaled from the literature and conducting interviews with the panel of
experts (including academics and practitioners from the industry), and asking them to give their
comments on the instrument. The interviews were conducted as part of the pre-test methods, as
discussed earlier in chapter five. Given that the content validity had a subjective nature, it was not
sufficient to provide a more rigorous empirical test (Zikmund, 2000& 2003). Therefore, its validity
was assured a priori to conducting the final survey, as a precursor to other measures of validity.
6.3.2 Evidence of Convergent Validity.
Convergent validity refers to the extent to which a measure correlates, or converges, with other
measures of the same construct (Simms & Watson, 2007) indicating that the scale is an appropriate
measure of the construct. In addition supporting the theoretical position of the construct (Crano &
Brewer, 2005). To demonstrate convergent validity, the items were loaded 'highly' on one factor
(Anderson & Gerbing, 1988), with a factor loading of .50 or greater (Hair et al., 2010). Evidence of
convergent validity was confirmed by significant and strong correlations between the different
measures of the same construct (Anderson & Gerbing, 1988). Moreover , according to Bagozzi and
Yi (1988), convergent validity is established when the Average Variance for all focal constructs
was more than .50, which meets the first condition of achieving convergent Explained (AVE)
between the constructs is equal to, or exceeds, 0.5. The average variance explained validity.
Table 6.20: Survey of Average Explained Variance and Reliability Estimations of all Measures of
Constructs
Construct AVE Cronbach's Alpha
Management Expectations 81.197 .816
Organisation's Dynamic Capabilities 72.462 .799
Management Commitment and Culture 77.105 .940
Organisational Structure .63056 .934
Socio-Demographic profile of Decision-Maker 66.893 .772
Industry Characteristics and Market Structure 67.226 .817
Social Influences 70.287 .923
Government Policies & Support 72.287 .905
In order to achieve the second requirement of convergent validity, it was vital to consider the
reliabilities of the measurements as means of providing evidence and support for the convergent
validity of the constructs (Netemeyer, Bearden, & Sharma, 2003). In addition, those measurements
that demonstrate low reliability levels were not further investigated, as the convergent validity
would not be achieved (Netemeyer et al., 2003). As presented in 6.29, all the scales demonstrated
an acceptable ' moderate to high' reliabilities, with the Cronbach's coefficient alpha's exceeding the
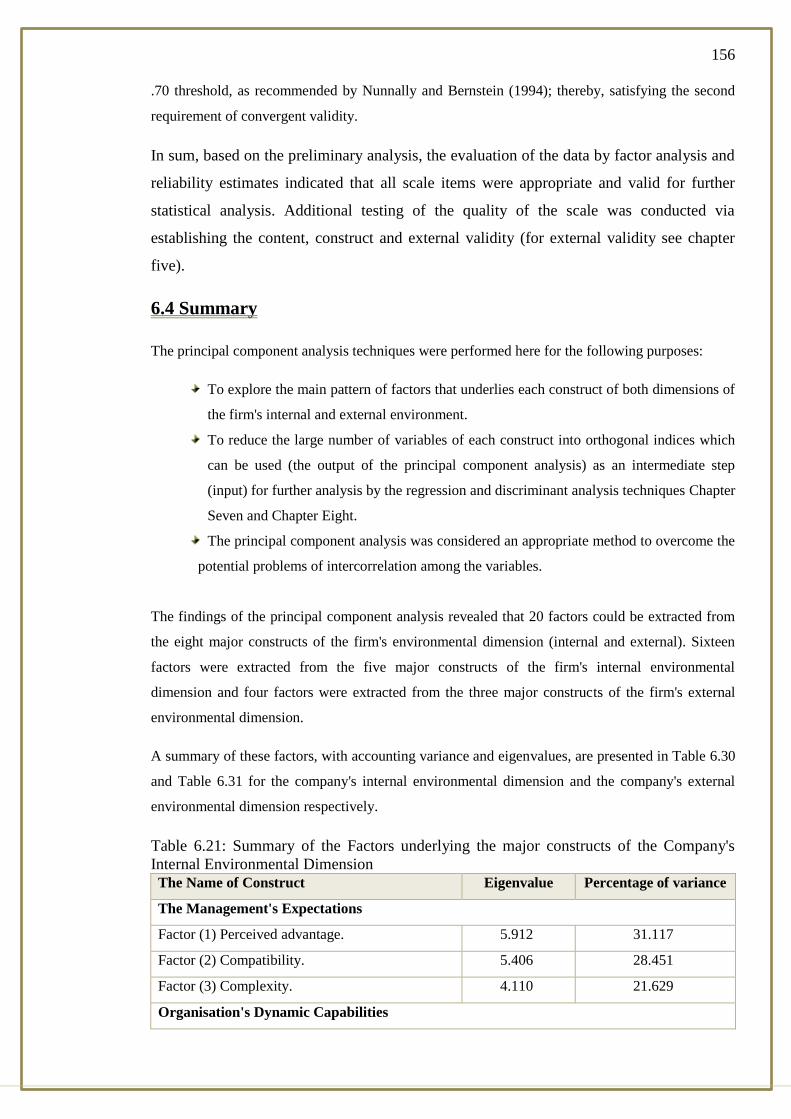
156
.70 threshold, as recommended by Nunnally and Bernstein (1994); thereby, satisfying the second
requirement of convergent validity.
In sum, based on the preliminary analysis, the evaluation of the data by factor analysis and
reliability estimates indicated that all scale items were appropriate and valid for further
statistical analysis. Additional testing of the quality of the scale was conducted via
establishing the content, construct and external validity (for external validity see chapter
five).
6.4 Summary
The principal component analysis techniques were performed here for the following purposes:
To explore the main pattern of factors that underlies each construct of both dimensions of
the firm's internal and external environment.
To reduce the large number of variables of each construct into orthogonal indices which
can be used (the output of the principal component analysis) as an intermediate step
(input) for further analysis by the regression and discriminant analysis techniques Chapter
Seven and Chapter Eight.
The principal component analysis was considered an appropriate method to overcome the
potential problems of intercorrelation among the variables.
The findings of the principal component analysis revealed that 20 factors could be extracted from
the eight major constructs of the firm's environmental dimension (internal and external). Sixteen
factors were extracted from the five major constructs of the firm's internal environmental
dimension and four factors were extracted from the three major constructs of the firm's external
environmental dimension.
A summary of these factors, with accounting variance and eigenvalues, are presented in Table 6.30
and Table 6.31 for the company's internal environmental dimension and the company's external
environmental dimension respectively.
Table 6.21: Summary of the Factors underlying the major constructs of the Company's
Internal Environmental Dimension
The Name of Construct Eigenvalue Percentage of variance
The Management's Expectations
Factor (1) Perceived advantage. 5.912 31.117
Factor (2) Compatibility. 5.406 28.451
Factor (3) Complexity. 4.110 21.629
Organisation's Dynamic Capabilities
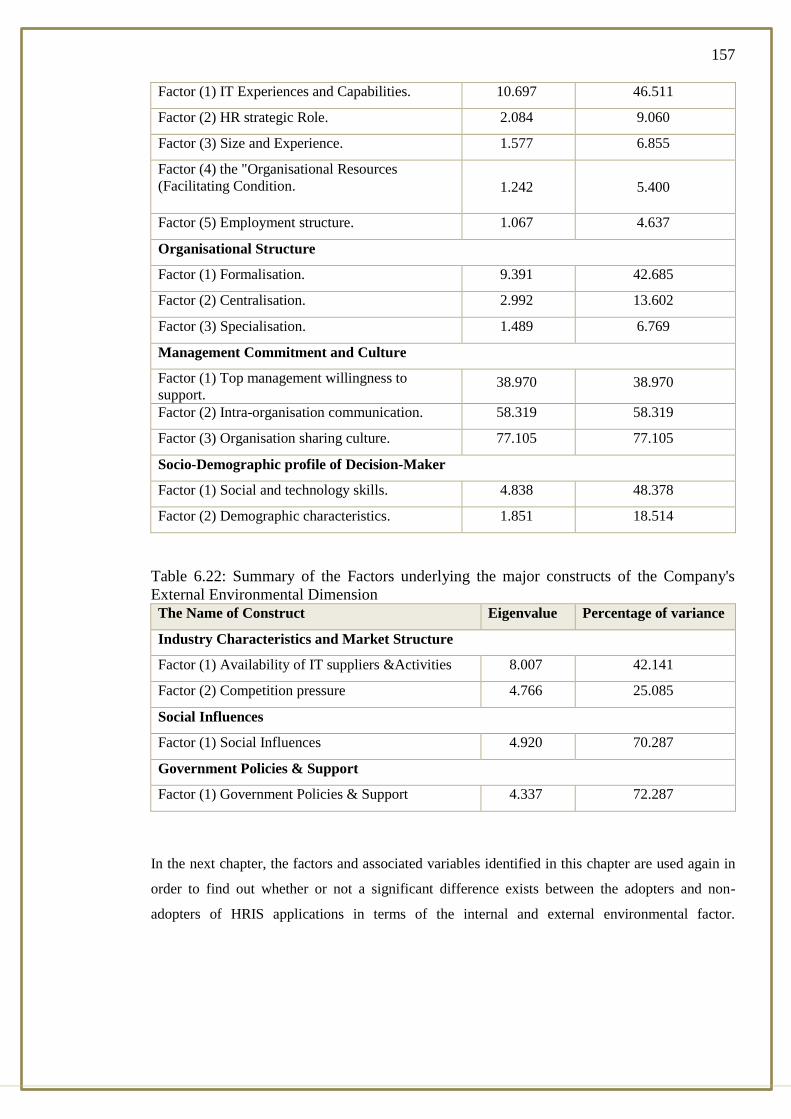
157
Factor (1) IT Experiences and Capabilities. 10.697 46.511
Factor (2) HR strategic Role. 2.084 9.060
Factor (3) Size and Experience. 1.577 6.855
Factor (4) the "Organisational Resources
(Facilitating Condition. 1.242 5.400
Factor (5) Employment structure. 1.067 4.637
Organisational Structure
Factor (1) Formalisation. 9.391 42.685
Factor (2) Centralisation. 2.992 13.602
Factor (3) Specialisation. 1.489 6.769
Management Commitment and Culture
Factor (1) Top management willingness to
support. 38.970 38.970
Factor (2) Intra-organisation communication. 58.319 58.319
Factor (3) Organisation sharing culture. 77.105 77.105
Socio-Demographic profile of Decision-Maker
Factor (1) Social and technology skills. 4.838 48.378
Factor (2) Demographic characteristics. 1.851 18.514
Table 6.22: Summary of the Factors underlying the major constructs of the Company's
External Environmental Dimension
The Name of Construct Eigenvalue Percentage of variance
Industry Characteristics and Market Structure
Factor (1) Availability of IT suppliers &Activities 8.007 42.141
Factor (2) Competition pressure 4.766 25.085
Social Influences
Factor (1) Social Influences 4.920 70.287
Government Policies & Support
Factor (1) Government Policies & Support 4.337 72.287
In the next chapter, the factors and associated variables identified in this chapter are used again in
order to find out whether or not a significant difference exists between the adopters and non-
adopters of HRIS applications in terms of the internal and external environmental factor.

158
DETERMINANTS HRIS ADOPTION CHAPTER 7:
BEHAVIOUR - ADOPTERS VS. NON-
ADOPTERS
7.1 Introduction
In the previous chapter, research findings related to the main pattern of factors that underlie each
construct of firms’ internal and external environmental dimensions were presented, In this chapter,
the 20 factors and associated variables identified in previous chapter are analysed again for the
following purposes:
To find out whether or not a significant difference exists between the adopters and non-
adopters of HRIS applications in terms of the internal and external environmental factors.
To predict group membership of the adoption of HRIS behaviour on the basis of these 20
factors.
To identify the degree of association between the adoption behaviour (i.e., the adopters
and non-adopters of HRIS applications) and the internal environmental measures (i.e., 16
factors).
To identify the degree of association between the adoption behaviour (i.e., the adopters
and non-adopters of HRIS applications) and the external environmental measures (i.e., 4
factors).
To discover whether the addition of the external environmental measures (i.e., 4 factors)
to the internal environmental measures (i.e., 16 factors) might improve the prediction of
the group membership (i.e., classification).
To find out whether the two groups (i.e., the adopters and non-adopters of HRIS
applications) are different in terms of the variables comprising each factors.
The statistical analysis techniques used are the discriminant analysis function, chi-square, F-test,
McNemar test, and the T-test. Factors and variables are analysed and discussed respectively.

159
Figure 7.1: Model used in this chapter
7.2 Testing the Research Hypotheses
7.2.1 Testing the Significant of Discriminant Function (Chi-Square and Univariate F
Ratio)
Before attempting to interpret the output of DFA, it was thought that it would be better to check on
its statistical significance. A statistically significant function means that there is meaningful
differentiations of the groups on the discriminant score (Hair et al., 2010). For testing the solution
of DFA in this study, two key statistics were used: Chi-square test and univariate F ratio.
The chi-square test was employed to determine the significance of the discriminant function for
each dimension (i.e., internal dimension, external dimension, and both), or otherwise the distinction
between adopter’s group and non-adopter’s group of HRIS applications in terms of their internal
and external environmental dimensions. For testing the significance of each discriminator (or
predictive factor), univariate F statistics were also used.
The following tested hypotheses are those pertaining to the significance of the discriminant
function of the components of the internal environmental dimension (16 factors, taken together),
and the components of the external environmental dimension (4 factors, taken together).
The hypotheses were stated as follows:
H1: There is a significant difference between the two groups (i.e., adopters and non-adopters of
HRIS applications) in terms of their internal environmental measures, taken together.
H1n: There is no significant difference between the two groups (i.e., adopters and non-adopters of
HRIS applications) in terms of their internal environmental measures, taken together.
H2: There is a significant differentiation between the two groups (i.e., adopters and non-adopters
of HRIS applications) on the basis of their external environmental measures, taken together.
H2n: There is no significant differentiation between the two groups (i.e., adopters and non-adopters
of HRIS applications) on the basis of their external environmental measures, taken together.
Looking at Table (7.1), for hypothesis (H1/H1n), we find that the computed chi-square is (313.640)
with six degree of freedom, exceeding the critical value at .000 (or far beyond .001 level). The
decision, therefore, is to reject the null hypothesis (H1n), and accept hypothesis (H1), to conclude
that the discriminant is statistically significant. Stated somewhat differently, the internal
environmental measures (16 factors; taken together) do discriminate between adopter and non -
adopters. The results show that the most important factors included in the discriminant equation
are: (1) "Perceived advantage", (2) "Compatibility", (3) "Complexity", (4) "Organisation
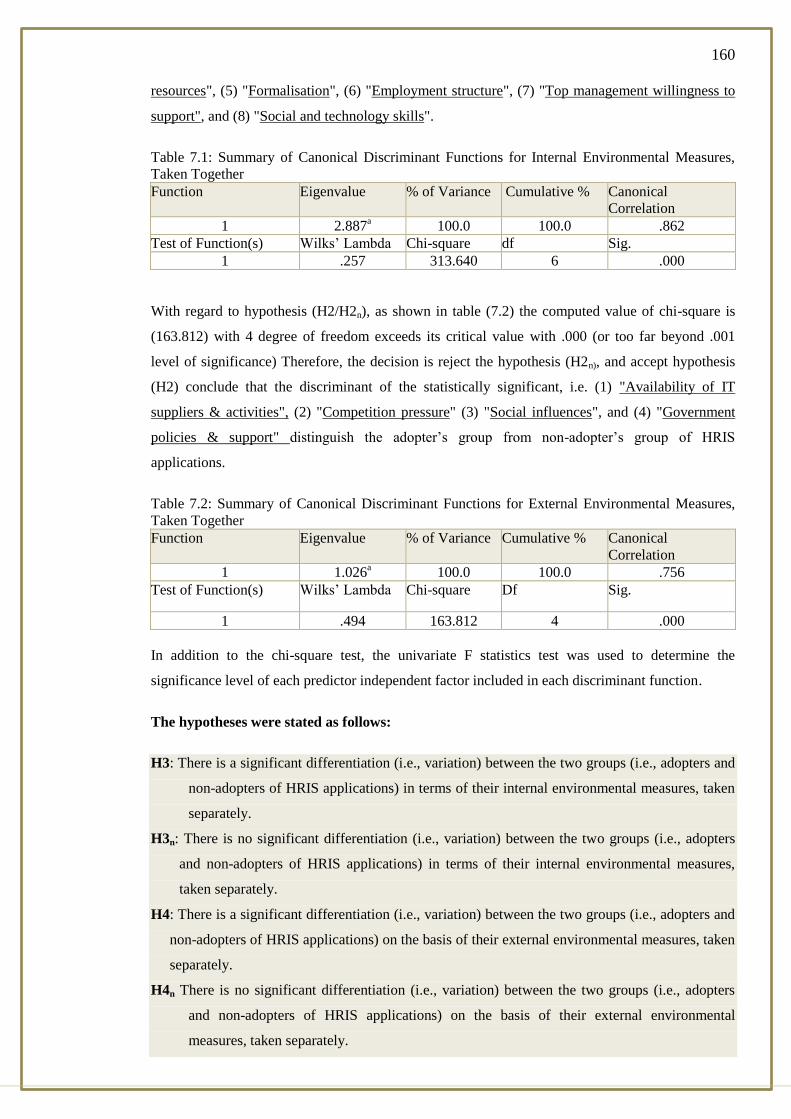
160
resources", (5) "Formalisation", (6) "Employment structure", (7) "Top management willingness to
support", and (8) "Social and technology skills".
Table 7.1: Summary of Canonical Discriminant Functions for Internal Environmental Measures,
Taken Together
Function Eigenvalue % of Variance Cumulative % Canonical
Correlation
1 2.887a 100.0 100.0 .862
Test of Function(s) Wilks’ Lambda Chi-square df Sig.
1 .257 313.640 6 .000
With regard to hypothesis (H2/H2n), as shown in table (7.2) the computed value of chi-square is
(163.812) with 4 degree of freedom exceeds its critical value with .000 (or too far beyond .001
level of significance) Therefore, the decision is reject the hypothesis (H2n), and accept hypothesis
(H2) conclude that the discriminant of the statistically significant, i.e. (1) "Availability of IT
suppliers & activities", (2) "Competition pressure" (3) "Social influences", and (4) "Government
policies & support" distinguish the adopter’s group from non-adopter’s group of HRIS
applications.
Table 7.2: Summary of Canonical Discriminant Functions for External Environmental Measures,
Taken Together
Function Eigenvalue % of Variance Cumulative % Canonical
Correlation
1 1.026a 100.0 100.0 .756
Test of Function(s) Wilks’ Lambda Chi-square Df Sig.
1 .494 163.812 4 .000
In addition to the chi-square test, the univariate F statistics test was used to determine the
significance level of each predictor independent factor included in each discriminant function.
The hypotheses were stated as follows:
H3: There is a significant differentiation (i.e., variation) between the two groups (i.e., adopters and
non-adopters of HRIS applications) in terms of their internal environmental measures, taken
separately.
H3n: There is no significant differentiation (i.e., variation) between the two groups (i.e., adopters
and non-adopters of HRIS applications) in terms of their internal environmental measures,
taken separately.
H4: There is a significant differentiation (i.e., variation) between the two groups (i.e., adopters and
non-adopters of HRIS applications) on the basis of their external environmental measures, taken
separately.
H4n There is no significant differentiation (i.e., variation) between the two groups (i.e., adopters
and non-adopters of HRIS applications) on the basis of their external environmental
measures, taken separately.
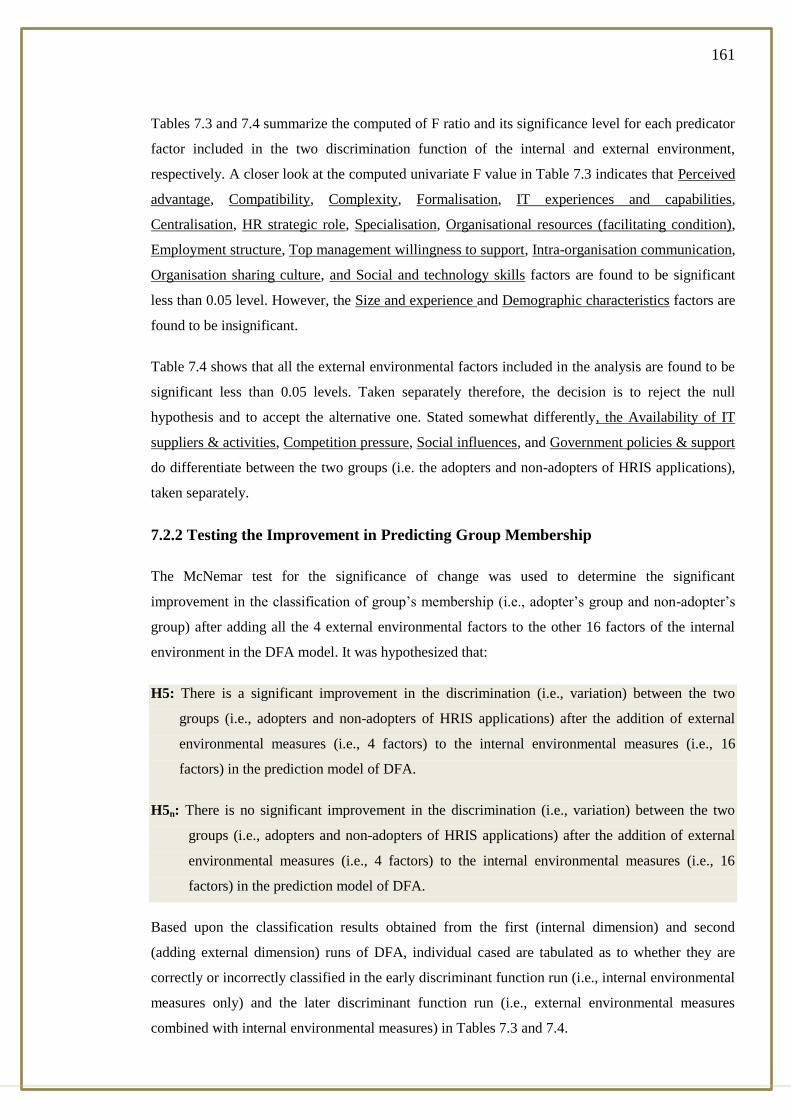
161
Tables 7.3 and 7.4 summarize the computed of F ratio and its significance level for each predicator
factor included in the two discrimination function of the internal and external environment,
respectively. A closer look at the computed univariate F value in Table 7.3 indicates that Perceived
advantage, Compatibility, Complexity, Formalisation, IT experiences and capabilities,
Centralisation, HR strategic role, Specialisation, Organisational resources (facilitating condition),
Employment structure, Top management willingness to support, Intra-organisation communication,
Organisation sharing culture, and Social and technology skills factors are found to be significant
less than 0.05 level. However, the Size and experience and Demographic characteristics factors are
found to be insignificant.
Table 7.4 shows that all the external environmental factors included in the analysis are found to be
significant less than 0.05 levels. Taken separately therefore, the decision is to reject the null
hypothesis and to accept the alternative one. Stated somewhat differently, the Availability of IT
suppliers & activities, Competition pressure, Social influences, and Government policies & support
do differentiate between the two groups (i.e. the adopters and non-adopters of HRIS applications),
taken separately.
7.2.2 Testing the Improvement in Predicting Group Membership
The McNemar test for the significance of change was used to determine the significant
improvement in the classification of group’s membership (i.e., adopter’s group and non-adopter’s
group) after adding all the 4 external environmental factors to the other 16 factors of the internal
environment in the DFA model. It was hypothesized that:
H5: There is a significant improvement in the discrimination (i.e., variation) between the two
groups (i.e., adopters and non-adopters of HRIS applications) after the addition of external
environmental measures (i.e., 4 factors) to the internal environmental measures (i.e., 16
factors) in the prediction model of DFA.
H5n: There is no significant improvement in the discrimination (i.e., variation) between the two
groups (i.e., adopters and non-adopters of HRIS applications) after the addition of external
environmental measures (i.e., 4 factors) to the internal environmental measures (i.e., 16
factors) in the prediction model of DFA.
Based upon the classification results obtained from the first (internal dimension) and second
(adding external dimension) runs of DFA, individual cased are tabulated as to whether they are
correctly or incorrectly classified in the early discriminant function run (i.e., internal environmental
measures only) and the later discriminant function run (i.e., external environmental measures
combined with internal environmental measures) in Tables 7.3 and 7.4.
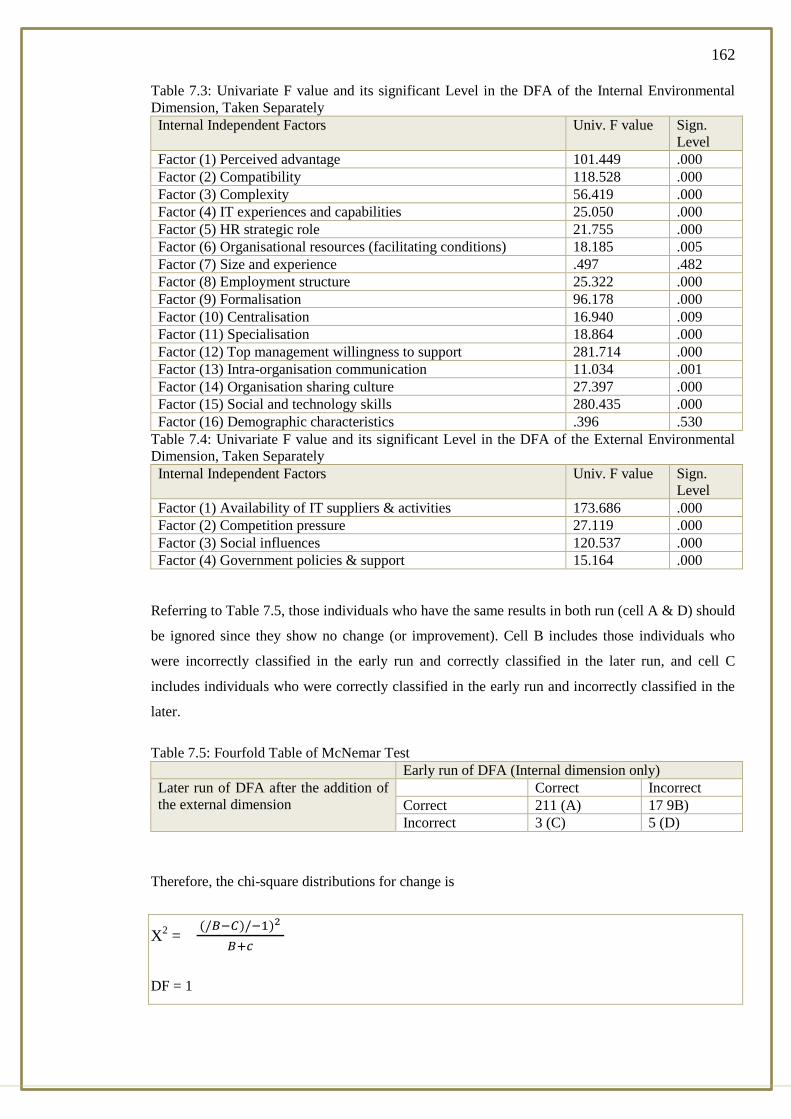
162
Table 7.3: Univariate F value and its significant Level in the DFA of the Internal Environmental
Dimension, Taken Separately
Internal Independent Factors Univ. F value Sign.
Level
Factor (1) Perceived advantage 101.449 .000
Factor (2) Compatibility 118.528 .000
Factor (3) Complexity 56.419 .000
Factor (4) IT experiences and capabilities 25.050 .000
Factor (5) HR strategic role 21.755 .000
Factor (6) Organisational resources (facilitating conditions) 18.185 .005
Factor (7) Size and experience .497 .482
Factor (8) Employment structure 25.322 .000
Factor (9) Formalisation 96.178 .000
Factor (10) Centralisation 16.940 .009
Factor (11) Specialisation 18.864 .000
Factor (12) Top management willingness to support 281.714 .000
Factor (13) Intra-organisation communication 11.034 .001
Factor (14) Organisation sharing culture 27.397 .000
Factor (15) Social and technology skills 280.435 .000
Factor (16) Demographic characteristics .396 .530
Table 7.4: Univariate F value and its significant Level in the DFA of the External Environmental
Dimension, Taken Separately
Internal Independent Factors Univ. F value Sign.
Level
Factor (1) Availability of IT suppliers & activities 173.686 .000
Factor (2) Competition pressure 27.119 .000
Factor (3) Social influences 120.537 .000
Factor (4) Government policies & support 15.164 .000
Referring to Table 7.5, those individuals who have the same results in both run (cell A & D) should
be ignored since they show no change (or improvement). Cell B includes those individuals who
were incorrectly classified in the early run and correctly classified in the later run, and cell C
includes individuals who were correctly classified in the early run and incorrectly classified in the
later.
Table 7.5: Fourfold Table of McNemar Test
Early run of DFA (Internal dimension only)
Later run of DFA after the addition of
the external dimension
Correct Incorrect
Correct 211 (A) 17 9B)
Incorrect 3 (C) 5 (D)
Therefore, the chi-square distributions for change is
X2 =
DF = 1
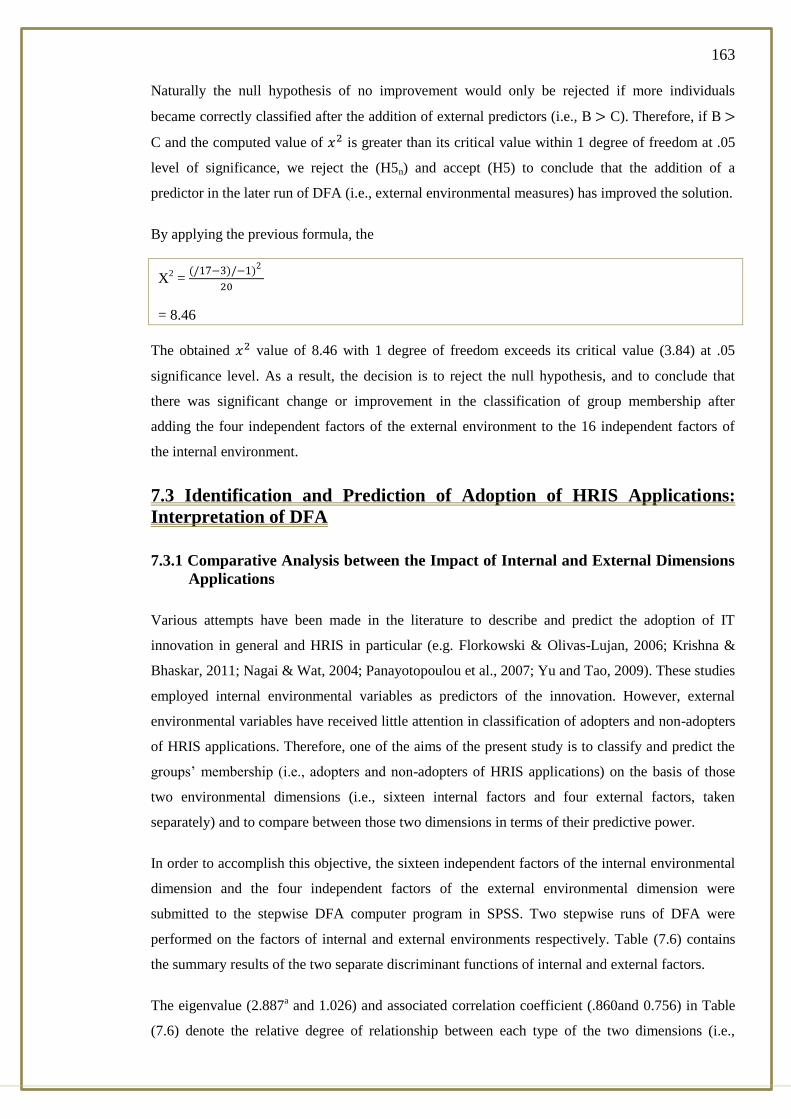
163
Naturally the null hypothesis of no improvement would only be rejected if more individuals
became correctly classified after the addition of external predictors (i.e., B C). Therefore, if B
C and the computed value of is greater than its critical value within 1 degree of freedom at .05
level of significance, we reject the (H5n) and accept (H5) to conclude that the addition of a
predictor in the later run of DFA (i.e., external environmental measures) has improved the solution.
By applying the previous formula, the
X2 =
= 8.46
The obtained value of 8.46 with 1 degree of freedom exceeds its critical value (3.84) at .05
significance level. As a result, the decision is to reject the null hypothesis, and to conclude that
there was significant change or improvement in the classification of group membership after
adding the four independent factors of the external environment to the 16 independent factors of
the internal environment.
7.3 Identification and Prediction of Adoption of HRIS Applications:
Interpretation of DFA
7.3.1 Comparative Analysis between the Impact of Internal and External Dimensions
Applications
Various attempts have been made in the literature to describe and predict the adoption of IT
innovation in general and HRIS in particular (e.g. Florkowski & Olivas-Lujan, 2006; Krishna &
Bhaskar, 2011; Nagai & Wat, 2004; Panayotopoulou et al., 2007; Yu and Tao, 2009). These studies
employed internal environmental variables as predictors of the innovation. However, external
environmental variables have received little attention in classification of adopters and non-adopters
of HRIS applications. Therefore, one of the aims of the present study is to classify and predict the
groups’ membership (i.e., adopters and non-adopters of HRIS applications) on the basis of those
two environmental dimensions (i.e., sixteen internal factors and four external factors, taken
separately) and to compare between those two dimensions in terms of their predictive power.
In order to accomplish this objective, the sixteen independent factors of the internal environmental
dimension and the four independent factors of the external environmental dimension were
submitted to the stepwise DFA computer program in SPSS. Two stepwise runs of DFA were
performed on the factors of internal and external environments respectively. Table (7.6) contains
the summary results of the two separate discriminant functions of internal and external factors.
The eigenvalue (2.887a and 1.026) and associated correlation coefficient (.860and 0.756) in Table
(7.6) denote the relative degree of relationship between each type of the two dimensions (i.e.,

164
internal and external) and adoption of HIS applications (i.e., adopters and non-adopters of HRIS
applications). The internal dimension has a higher degree of association with adoption of HRIS
applications than the external dimension. Moreover, the low wilks’ lambda (0.278) and the high
chi-square value (313.640) associated with the first discriminant function, indicating that the
internal dimension and adoption of HRIS applications are highly related.
Table 7.6: Comparative Results of Two Separate Discriminant Analysis Function
Results Run* 1
Internal dimension
Run* 2
External dimension
Eigenvalue 2.887a 1.026
Canonical Correlation Coefficient .860 .756
Wilk’s Lambda .278 .484
Chi-squared 313.640 163.812
DF 6 4
Level of significance .000 .000
Cases correctly Classified 93.2 86.4
In addition, the classification results obtained from each discriminant function helps to visualize
exactly how accurate each discriminant function was in predicting adopter’s and non-adopter’s
group membership. It can be seen in Table 7.6 that the first discriminant function (internal
dimension) has correctly classified (93.2%) of the respondents into two discriminant groups,
whereas the second discriminant function (external dimension) correctly classified (86.4%). One
way to evaluate the classification from a discriminant function is to compare it to the classification
which one would expect by chance (Hair et al. 2010). The question is, however, how much better
than chance should the accuracy of classification be? One practical approach recommended by Hair
el al. (2010) suggests that in order to be useful the classification accuracy must be at least (25.0%)
greater than chance.
The probabilities associated with chance, in each discriminant function in the research, are given by
the following formula:
C = p2 + (1- p)
2
Where:
C = chance
P = proportion of cases in group 1
1 – P = proportion of cases in group 2
By applying the above formula (in any of the two discriminant function) then:
C = (
)
2 + (1 -
)
2
= 53 % approximately

165
Based on the approach of Hair et al. (2010), this means that a perfectly acceptable classification
level would be at least 25% greater than 53% of that achieved by chance (.53*.25 = 13.25 →
13.25+.53 = 66.25% → 93. 2% - 66.25% = 26.95%) In the discriminant function of the internal
dimension, the classification accuracy level is 26.95% greater, whilst the perfectly acceptable level
(i.e., 86.4% - 66.25% = 20.15%) is greater in the discriminant function of the external dimension.
The survey result indicates that out of 236 companies, 86 firms are not totally adopters. This
comparative analysis between the external and internal environmental dimensions in relation to
adoption of HRIS applications supports the previous IS adoption innovation behaviour studies in
that the firm’s internal environmental measures are more critical to its decision of whether or not to
adopt IS innovation such as HRIS (e.g. Nagai & Wat, 2004, Panayotopoulou et al., 2007).
7.3.2 Validation of the Prediction of Adoption Behaviour (Adopter’s and Non-
Adopters) Group Membership
The question of predictive power is important. As reported previously, "relative-to-chance" is
considered and important way of checking the accuracy of the classification results obtained from
two groups DFA. This procedure is commonly used to test whether the proportion of correctly
classified cases in the sample is significantly different from the correct proportion that would be
expected by chance. However, the "relative-to-chance" measure will be biased if it is applied to the
same sample of data used to estimate the discriminant function coefficient. This bias is due to the
sampling means of the population, as noted by Hair et al. (2010): "the direction of the bias is to
show greater predictive power in classification that actually exists among the true populations. Its
magnitude will decrease as the sample size becomes larger".
In order to check the validity of the prediction of power (classification) of adoption behaviour, two
methods of discriminant validity were used, namely: the Split half and Jacknife methods.
7.3.2.1 Split Half Method
In order to reduce the bias caused by sampling error and increase the efficiency of predictive power
in DFA, one could split the original sample and use one part for analysis (i.e., analysis sample) and
the other for validation (i.e., validation sample). This approach uses the discriminant coefficients
derived from the analysis sample to predict group membership for each number of the validation
sample (Tabachnick, 1983).
Therefore, it was decided to check on the validation prediction of adopter’s and non-adopter’s
group membership obtained from each DFA run. The key steps in conducting the validation
procedures are as follows (Frank and Massy 1965):

166
1. The original sample (236 cases) was split into two subsamples on the basis of odd and
even numbers: one for analysis and the other for validation.
2. The analysis sample used to determine the discriminant coefficients and to generate a
classification table.
3. Using the discriminant coefficients estimated from the analysis sample, predictor of
group membership was made for each member.
4. The differences between the classifications of each sample are perfectly acceptable level
(i.e., 66.25%).
5. The above steps were applied to the three set of data: internal, external, and combined
respectively.
The results of the validation are shown in Table 7.7, based on the H&A approach of Hair et al.
(2010). They confirm our initial findings in that the internal environmental dimension is better than
the external dimension in terms of predicting group membership. Table 7.7 shows that the
percentage of correct classification validation sample was less than its counterpart in the analysis
sample for each discriminant function of the effects of sampling error. However, the discriminant
function of the internal measures is still better than the external dimension measures in predicting
group.
Table 7.7: Validation of the Discriminant Functions: Comparison of the Analysis and Validation
Sample
Discriminant
Function
Analysis sample Validation Sample
% of correct
classification
Less or greater
H&A’s
% of correct
classification
Less or greater
H&A’s
Internal 93.20 + 26.70 90.10 +22.6
External 86.40 + 18.10 84.00 +16.5
Both 97.10 +29. 60 96.60 +29.1
7.3.2.2 Jacknife Method
For further confirmation of the earlier results, the Jacknife method was also applied to validate the
discriminant function of each of the three DFA runs. There is evidence that the Jacknife method is
superior to other discriminant validation methods including the split-sample approach (Eisenbeis,
1977), since unlike the other methods it makes use of all the available data without any serious bias
in the estimating error rate (Dillon and Goldstein, 1984).
Using the Jacknife method to validate a discriminant function involves leaving out each of the
cases in turn, calculating the function based on ( n1 + n2 – 1) case, and then classifying the left-out
cases. This process is repeated until all the cases are classified (Eisenbeis, 1977). Since that the
case which is being classified is not included in the calculation of the discriminant function, the
method yields almost unbiased estimates of the misclassification probabilities (Dillon and
Goldstein, 1984).
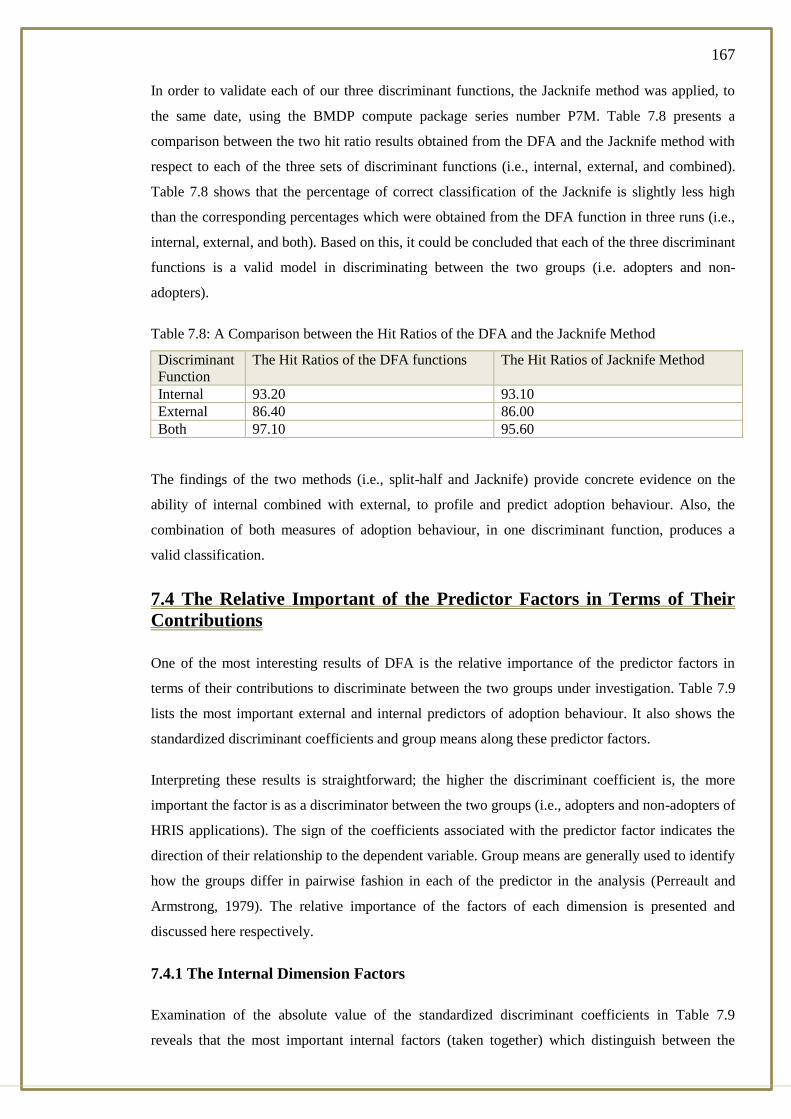
167
In order to validate each of our three discriminant functions, the Jacknife method was applied, to
the same date, using the BMDP compute package series number P7M. Table 7.8 presents a
comparison between the two hit ratio results obtained from the DFA and the Jacknife method with
respect to each of the three sets of discriminant functions (i.e., internal, external, and combined).
Table 7.8 shows that the percentage of correct classification of the Jacknife is slightly less high
than the corresponding percentages which were obtained from the DFA function in three runs (i.e.,
internal, external, and both). Based on this, it could be concluded that each of the three discriminant
functions is a valid model in discriminating between the two groups (i.e. adopters and non-
adopters).
Table 7.8: A Comparison between the Hit Ratios of the DFA and the Jacknife Method
Discriminant
Function
The Hit Ratios of the DFA functions The Hit Ratios of Jacknife Method
Internal 93.20 93.10
External 86.40 86.00
Both 97.10 95.60
The findings of the two methods (i.e., split-half and Jacknife) provide concrete evidence on the
ability of internal combined with external, to profile and predict adoption behaviour. Also, the
combination of both measures of adoption behaviour, in one discriminant function, produces a
valid classification.
7.4 The Relative Important of the Predictor Factors in Terms of Their
Contributions
One of the most interesting results of DFA is the relative importance of the predictor factors in
terms of their contributions to discriminate between the two groups under investigation. Table 7.9
lists the most important external and internal predictors of adoption behaviour. It also shows the
standardized discriminant coefficients and group means along these predictor factors.
Interpreting these results is straightforward; the higher the discriminant coefficient is, the more
important the factor is as a discriminator between the two groups (i.e., adopters and non-adopters of
HRIS applications). The sign of the coefficients associated with the predictor factor indicates the
direction of their relationship to the dependent variable. Group means are generally used to identify
how the groups differ in pairwise fashion in each of the predictor in the analysis (Perreault and
Armstrong, 1979). The relative importance of the factors of each dimension is presented and
discussed here respectively.
7.4.1 The Internal Dimension Factors
Examination of the absolute value of the standardized discriminant coefficients in Table 7.9
reveals that the most important internal factors (taken together) which distinguish between the
168
adopter’s group and the non-adopter’s group in descending order of importance are: (1)"Perceived
advantage", (2)"Compatibility",(3) "Complexity", (4)"Organisation resources",(5) "Employment
structure", (6)"Formalisation", (7)"Top management willingness to support", and (8) "Social and
technology skills".
Looking at Table 7.9, it can be observed that the first three factors (i.e., "Perceived advantage",
"Compatibility" and "Complexity" are regarded the most important factors influence on the
adoption of HRIS applications. These factors are related to the construct of the "Management’s
expectations". The group means’ results indicate that the adopter’s group of the HRIS attached
more important to these factors than their counterparts (i.e., non-adopters’ group). This is
consistent with previous studies of IT adoption behaviour in general and adoption of HRIS in
particular (Bakker, 2010; Clark, 1998; Krishna and Bhaskar, 2011; Ruta, 2005; Smale and
Heikkilä, 2009).
The "Organisation resource" factor is the fourth factor of importance. The result indicates that the
adopter’s group has much more resources their counterpart, the non-adopter’s group. This result is
supported by many studies in this field (Kuan and Chau, 2001; Waarts and Hillegersberg, 2002;
Zhu and Kraemer, 2005).The fifth most important factor of the internal dimension related to
adoption of IT behaviour is "Employment structure”. The result indicates the adopter’s group has
different employment structure from the non-adopter’s group. This result is supported by many
studies (Panayotopoulou, Vakola and Galanaki, 2007; Voermans and van Veldhoven, 2007). These
two factors related to the construct "IT experiences and capabilities"
Next, with regard to "Formalisation" factor which is related to the "Organisation Resource"
construct, the results indicate that the organisational structure of the adopter’s group significantly
differs from their counterpart in respect to this factor. Regarding the sixth factor "Top management
willingness to support" which is related to the "Management commitment and corporate
culture" construct the results indicate that the top management in the adopter’s group is more
willing to support to adoption the HRIS applications than those in the non-adopter’s group. The
least important internal factor which is related to "Soico-Demographic characteristics" construct
was identified as "Social and technology skills". The results indicate that the adopter’s group has
much more social and technology skills than the non-adopter’s group.

169
Table 7.9: Standardized Discriminant Coefficient
Independent Factors *Group Means
*SDC G1 G2
Internal Independent Factors
Factor (1) Perceived advantage .3940157 -.6872366 .830
Factor (2) Compatibility .83460528 -.7088888 .755
Factor (3) Complexity .87764811 -.4990999 .645
Factor (4) Organisation resources .8432121 -.42902311 583
Factor (5) Employment structure .4909079 -.3329789 .451
Factor (6) Formalisation .4383263 -.4947551 .294
Factor (7)Top management Willingness to support .5380001 -.9383723 .211
Factor (8) Social and Technology skills .2134521 -.483723 .141
External Independent Factors
Factor (1) Availability of IT suppliers & activities .4639669 -.8092446 .854
Factor (2) Social Influences .4090131 -.7133950 .489
Factor (3) competition pressure .2317199 -.4041626 .419
Factor (4) Government Policies & Support .1724828 -.3008420 -.392
These factors are presented in descending order of their SDC for each dimension separately.
The group means here show the differences between the means of each group from the means of
the factor score.
7.4.2 The External Dimension Factors
This category of discriminating factors between adopters and non-adopters of HRIS applications
should be the primary concern to the IT suppliers and policy-makers in innovation in general and
HRIS applications in particular.
As shown in Table 7.9, the most important external factors (taken together) which discriminate
between the adopters’ group and their counterpart (i.e., non-adopters) of HRIS applications in
descending order of importance are: (1)"Availability of IT suppliers & activities (85.4) ",(2)
"Social influences (48.9) ",(3) "Competition pressure (41.9) ", and (4) "Government policies &
support (39.1) ".
Looking at Table 7.9, it can be observed that the first factor of the external dimension "Availability
of IT suppliers & activities" which is related to the construct "Industry characteristics and
market structure" is regarded as the most important in disseminating between the two groups (i.e.,
adopter and non-adopter). The result indicates that the adopter’s group attached a higher important
to this factor than the non-adopter’s group. The possible explanation of that might be due to the
lack knowledge of awareness of theses IT supplier’s promotion activities among the non-adopters,
or perhaps the negative attitudes of the non-adopter’s group towards the current IT suppliers. The
"Social influences" factor as it is related to the construct "Social influences "stands out to be
ranked as the second most important among the external factors. The result indicates that the
adopter’s group tends to be more committed to networking activities than the non-adopter’s group.
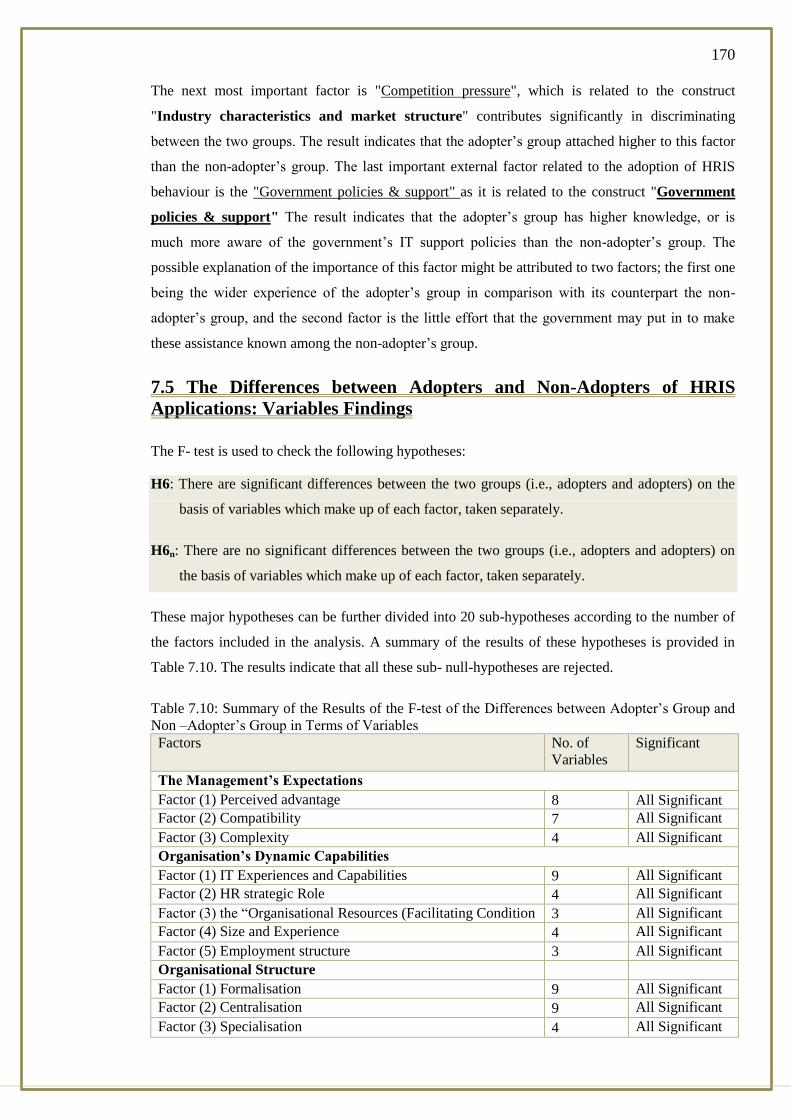
170
The next most important factor is "Competition pressure", which is related to the construct
"Industry characteristics and market structure" contributes significantly in discriminating
between the two groups. The result indicates that the adopter’s group attached higher to this factor
than the non-adopter’s group. The last important external factor related to the adoption of HRIS
behaviour is the "Government policies & support" as it is related to the construct "Government
policies & support" The result indicates that the adopter’s group has higher knowledge, or is
much more aware of the government’s IT support policies than the non-adopter’s group. The
possible explanation of the importance of this factor might be attributed to two factors; the first one
being the wider experience of the adopter’s group in comparison with its counterpart the non-
adopter’s group, and the second factor is the little effort that the government may put in to make
these assistance known among the non-adopter’s group.
7.5 The Differences between Adopters and Non-Adopters of HRIS
Applications: Variables Findings
The F- test is used to check the following hypotheses:
H6: There are significant differences between the two groups (i.e., adopters and adopters) on the
basis of variables which make up of each factor, taken separately.
H6n: There are no significant differences between the two groups (i.e., adopters and adopters) on
the basis of variables which make up of each factor, taken separately.
These major hypotheses can be further divided into 20 sub-hypotheses according to the number of
the factors included in the analysis. A summary of the results of these hypotheses is provided in
Table 7.10. The results indicate that all these sub- null-hypotheses are rejected.
Table 7.10: Summary of the Results of the F-test of the Differences between Adopter’s Group and
Non –Adopter’s Group in Terms of Variables
Factors No. of
Variables
Significant
The Management’s Expectations
Factor (1) Perceived advantage 8 All Significant
Factor (2) Compatibility 7 All Significant
Factor (3) Complexity 4 All Significant
Organisation’s Dynamic Capabilities
Factor (1) IT Experiences and Capabilities 9 All Significant
Factor (2) HR strategic Role 4 All Significant
Factor (3) the “Organisational Resources (Facilitating Condition 3 All Significant
Factor (4) Size and Experience 4 All Significant
Factor (5) Employment structure 3 All Significant
Organisational Structure
Factor (1) Formalisation 9 All Significant
Factor (2) Centralisation 9 All Significant
Factor (3) Specialisation 4 All Significant

171
Management Commitment and Corporate Culture
Factor (1) Top management willingness to support 13 All Significant
Factor (2) Intra-organisation communication 5 All Significant
Factor (3) Organisation sharing culture 7 All Significant
Socio-Demographic profile of Decision-Maker
Factor (1) Social and technology skills 6 All Significant
Factor (2) Demographic characteristics 3 All Significant
Industry Characteristics and Market Structure
Factor (1) Availability of IT suppliers & activities 15 All Significant
Factor (2) competition pressure 4 All Significant
Social Influences
Factor (1) Social Influences 7 All Significant
Government Policies & Support
Factor (1) Government Policies & Support 4 All Significant
7.5.1 The Interpretation of the Variables Findings
The possible interpretation of the results of the variable is presented here in terms of each factor
which they belong, as follows:
7.5.1.1 The “Management’s Expectations” Factors
1. The " Perceived Advantage" Factor: Variables F-Test
This factor consists of eight independent variables Table 7.11, each of which was regarded as
important in differentiating between the two groups.
The result indicates that the adopter’s group perceived advantages of the HRIS attributes much
higher positive than the non-adopter’s group. In comparison to other attributes of this factor, “HRIS
will enable our organisation to cut costs in our operations" is the most important to differentiate
between the two groups. This result is supported by many studies (Carter and Belanger, 2004; Jeon,
Han and Lee, 2006; Kendall et al., 2001; Limthongchai and Speece, 2003).
Table 7.11: F-test between Adopters and Non-adopters of HRIS Application in Terms of Variables
Constituting “Perceived Advantages “Factor
Code
Variables
Group
Means
F- Value
Sig.
G1 G2
RA1 HRIS will enable human resources personnel to
accomplish tasks more quickly.
4.34 3.00 265.879 .000
RA6 HRIS will enable our organisation to cut costs in our
operations.
4.43 3.00 299.507 .000
RA3 HRIS will make it easier for human resources
personnel to do their work.
4.38 2.95 281.901 .000
RA8 HRIS will improve our organisation competitive
position.
4.36 2.86 242.899 .000

172
RA2 HRIS will improve the quality of the work of human
resources personnel.
4.34 2.92 204.312 .000
RA4 HRIS will enhance the job effectiveness of Human
Resources personnel.
4.25 2.77 263.785 .000
RA7 HRIS will increase the profitability of our
organisation.
4.22 2.73 223.552 .000
RA5 HRIS will provide timely information for decision-
making.
4.17 2.74 269.084 .000
Therefore, it may be concluded that the positive perceived advantages of HRIS attributes (taken
together or separately) are considered important for the adoption of HRIS applications, in particular
the perceived “HRIS will enable our organisation to cut costs in our operations”. This result
appears to agree with previous studies (Carter and Belanger, 2004; Limthongchai and Speece,
2003; Raymond and Bergeron, 1996).
2. The "Compatibility" Factor: Variables F-Test
Each of the variables which comprising the “Compatibility” factor is found to be important in
discriminating between the two groups Table 7.12. The results indicate that the adopter’s group
perceived the attributes of this factor more positively than their counterpart’s, the non-adopter’s
group. The most important one is the "HRIS is compatible with our organisation’s computerized
data resources". This result appears to agree with previous work (Alan et al., 2009; Carter and
Belanger, 2004; Limthongchai and Speece, 2003; Raymond and Bergeron, 1996).
Table 7.12: F-test between Adopters and Non-adopters of HRIS Application in Terms of Variables
Constituting “Compatibility” Factor
Code Variables Group Means F- Value Sig.
G1 G2
COM1
The changes introduced by HRIS are compatible
with existing operating practices.
4.07 2.85 214.670 .000
COM2 Adoption of HRIS is consistent with our
organisation’s values and beliefs.
4.16 2.91 190.505 .000
COM3 HRIS is compatible with our organisation’s IT
infrastructure.
4.14 3.00 264.551 .000
COM4 HRIS is compatible with our organisation’s
computerized data resources.
4.14 2.72 257.878 .000
COM5 HRIS fits well our organisation beliefs. 4.17 2.69 224.520 .000
3. The "Complexity" Factor: Variables F-Test
The perceived "Complexity" factor consists of four variables Table 7.13. The results indicate that
the non-adopter’s group attaches higher importance of each of these attributes than the adopter’s
group. In comparison of other variable of this factor, the "Integrating HRIS into our current work
will be very difficult" is considered the most important one in disseminating between the two
groups. The attributes of this factor (taken together) are also found be related to adoption IT

173
behaviour. The result is in line with many previous works (Carter and Belanger, 2004; Cooper and
Zmud, 1990).
Table 7.13: F-test between Adopters and Non-adopters of HRIS Application in Terms of Variables
Constituting “Complexity” Factor
Code Variables Group Means F- Value Sig.
G1 G2
CPX3 HRIS is hard to learn. 1.89 3.55 157.743 .000
CPX2 HRIS development is a complex process. 1.97 3.64 187.171 .000
CPX1 HRIS is complex to use. 2.03 3.55 149.820 .000
CPX4 Integrating HRIS into our current work will be
very difficult.
2.01 3.55 189.188 .000
7.5.1.2 Organisation’s Dynamic Capabilities Construct Factors
1. The "IT Experiences and Capabilities" Factor: Variables F-Test
Each of the variables comprising the "IT experiences and capabilities” factor is found to be
important in discriminating between the two groups Table 7.14. The result indicates that the
adopter’s group perceived the attributes of this factor more positively than their counterpart’s, the
non-adopter’s group. The most important one is the “A specific person (or group) is available for
assistance with HRIS technology". This result appears to agree with previous work (Bassellier,
Benbasat and Reich, 2003; Brynjolfsson and Hitt, 2000; Kinnie and Arthurs, 1993; Molla and
Licker, 2005).
Table 7.14: F-test between Adopters and Non-adopters of HRIS Application in Terms of Variables
Constituting “IT Experiences and Capabilities)” Factor
Code Variables Group Means F- Value Sig.
G1 G2
IT2 Human resources personnel’s’ understanding of
computers is good compared with other
organisations in the industry.
4.10 3.19 73.927 .000
IT5 Our employees possess abilities to use computer to
solve problems.
4.11 3.19 81.315 .000
IT1 A specific person (or group) is available for
assistance with HRIS technology
4.12 3.15 94.628 .000
IT7 We have a good quality of IT infrastructure. 4.15 3.21 63.619 .000
IT6 Our employees can learn new technologies easily. 4.09 3.26 63.612 .000
IT8 Availability or adequacy of existing technology and
tools.
4.07 3.21 60.273 .000
IT9 Access to network services or infrastructure to
support Web and Internet Technologies.
4.14 3.26 62.329 .000
IT4 All human resources personnel are computer literate. 4.09 3.03 99.796 .000
IT3 There is at least one computer expert in the human
resources department.
4.08 3.01 82.938 .000
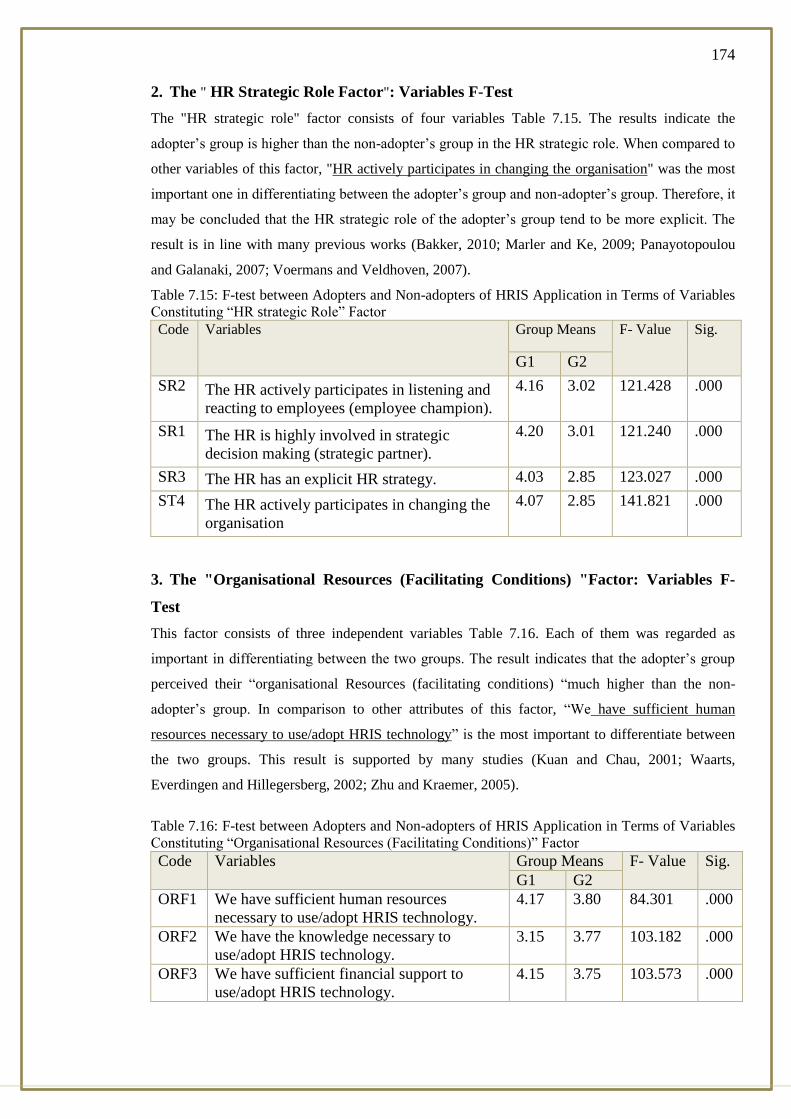
174
2. The " HR Strategic Role Factor": Variables F-Test
The "HR strategic role" factor consists of four variables Table 7.15. The results indicate the
adopter’s group is higher than the non-adopter’s group in the HR strategic role. When compared to
other variables of this factor, "HR actively participates in changing the organisation" was the most
important one in differentiating between the adopter’s group and non-adopter’s group. Therefore, it
may be concluded that the HR strategic role of the adopter’s group tend to be more explicit. The
result is in line with many previous works (Bakker, 2010; Marler and Ke, 2009; Panayotopoulou
and Galanaki, 2007; Voermans and Veldhoven, 2007).
Table 7.15: F-test between Adopters and Non-adopters of HRIS Application in Terms of Variables
Constituting “HR strategic Role” Factor
Code Variables Group Means F- Value Sig.
G1 G2
SR2 The HR actively participates in listening and
reacting to employees (employee champion).
4.16 3.02 121.428 .000
SR1 The HR is highly involved in strategic
decision making (strategic partner).
4.20 3.01 121.240 .000
SR3 The HR has an explicit HR strategy. 4.03 2.85 123.027 .000
ST4 The HR actively participates in changing the
organisation
4.07 2.85 141.821 .000
3. The "Organisational Resources (Facilitating Conditions) "Factor: Variables F-
Test
This factor consists of three independent variables Table 7.16. Each of them was regarded as
important in differentiating between the two groups. The result indicates that the adopter’s group
perceived their “organisational Resources (facilitating conditions) “much higher than the non-
adopter’s group. In comparison to other attributes of this factor, “We have sufficient human
resources necessary to use/adopt HRIS technology” is the most important to differentiate between
the two groups. This result is supported by many studies (Kuan and Chau, 2001; Waarts,
Everdingen and Hillegersberg, 2002; Zhu and Kraemer, 2005).
Table 7.16: F-test between Adopters and Non-adopters of HRIS Application in Terms of Variables
Constituting “Organisational Resources (Facilitating Conditions)” Factor
Code Variables Group Means F- Value Sig.
G1 G2
ORF1 We have sufficient human resources
necessary to use/adopt HRIS technology.
4.17 3.80 84.301 .000
ORF2 We have the knowledge necessary to
use/adopt HRIS technology.
3.15 3.77 103.182 .000
ORF3 We have sufficient financial support to
use/adopt HRIS technology.
4.15 3.75 103.573 .000

175
4. The “Size & Experience” Factor: Variables F-Test
This factor consists of four independent variables Table 7.17. Each of them was regarded as
important in differentiating between the two groups. The results indicate that the adopter’s group in
terms of the attributes of this factor is much higher than the non-adopter’s group, "Number of IT
technical specialists "was the most important in differentiating between the adopter’s group and
non-adopter’s group. Which is supported by many studies (Bakker, 2010; Hussain, Wallace and
Cornelius, 2007; Teo, Soon and Fedric, 2001).
Table 7.17: F-test between Adopters and Non-adopters of HRIS Application in Terms of Variables
“Size & Experience” Factor
Code Variables Group Means F- Value Sig.
G1 G2
SZE3 Number of IT technical specialists. 2.87 2.16 45.514 000
SZE1 Number of employees in the organisation. 3.54 2.98 9.543 000
SZE4 Number of HR employees. 2.15 1.51 29.444 000
SZE2 Number of years in business (experience). 3.41 2.67 24.932 000
5. The “Employment Structure” Factor: Variables F-Test
The “Employment structure” factor consists of three variables Table 7.18. The results indicate the
adopter’s group is higher than the non-adopter’s group in “Employment structure". When
compared to other variables of this factor, "The percentage of employees who are older than 45
years at the organisation" was the most important in differentiating between the adopter’s group
and non-adopter’s group. Therefore, it may be concluded that the employment structure of the
adopter’s group is significantly different from that of the non-adopter’s group. The result is in line
with many previous works, such as (Panayotopoulou and Galanaki, 2007; Ruël and Looise, 2004;
Shrivastava and Shaw, 2003; Voermans and Veldhoven, 2007).
Table 7.18: F-test between Adopters and Non-adopters of HRIS Application in Terms of Variables
which constitute the Constituting “Employment Structure “Factor
Code Variables Group Means F- Value Sig.
G1 G2
EMP1 The cumulative percentage of graduates and
postgraduates in the organisation.
3.54 3.23 25.655 .000
EMP2 The percentage of employees who are older than
45 years at the organisation.
2.85 3.86 57.709 .000
EMP3 The percentage of female employees in the
organisation.
2.76 1.91 54.998 .000
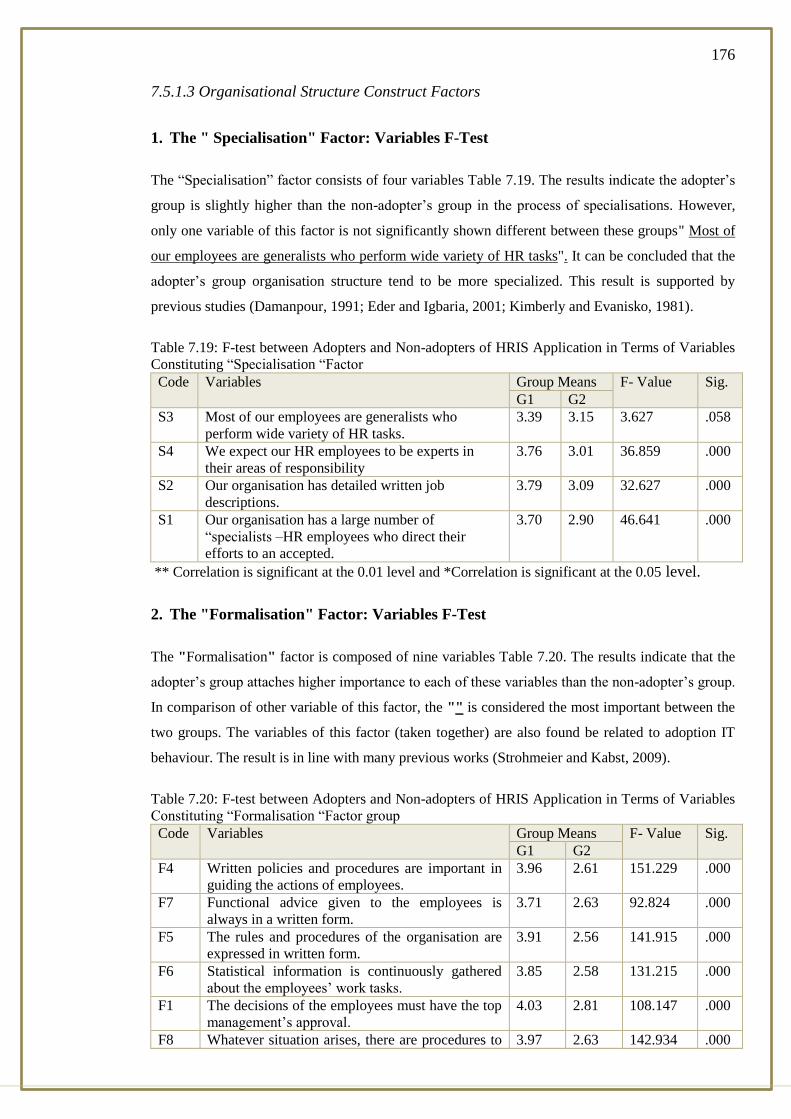
176
7.5.1.3 Organisational Structure Construct Factors
1. The " Specialisation" Factor: Variables F-Test
The “Specialisation” factor consists of four variables Table 7.19. The results indicate the adopter’s
group is slightly higher than the non-adopter’s group in the process of specialisations. However,
only one variable of this factor is not significantly shown different between these groups" Most of
our employees are generalists who perform wide variety of HR tasks". It can be concluded that the
adopter’s group organisation structure tend to be more specialized. This result is supported by
previous studies (Damanpour, 1991; Eder and Igbaria, 2001; Kimberly and Evanisko, 1981).
Table 7.19: F-test between Adopters and Non-adopters of HRIS Application in Terms of Variables
Constituting “Specialisation “Factor
Code Variables Group Means F- Value Sig.
G1 G2
S3 Most of our employees are generalists who
perform wide variety of HR tasks.
3.39 3.15 3.627 .058
S4 We expect our HR employees to be experts in
their areas of responsibility
3.76 3.01 36.859 .000
S2 Our organisation has detailed written job
descriptions.
3.79 3.09 32.627 .000
S1 Our organisation has a large number of
“specialists –HR employees who direct their
efforts to an accepted.
3.70 2.90 46.641 .000
** Correlation is significant at the 0.01 level and *Correlation is significant at the 0.05 level.
2. The "Formalisation" Factor: Variables F-Test
The "Formalisation" factor is composed of nine variables Table 7.20. The results indicate that the
adopter’s group attaches higher importance to each of these variables than the non-adopter’s group.
In comparison of other variable of this factor, the "" is considered the most important between the
two groups. The variables of this factor (taken together) are also found be related to adoption IT
behaviour. The result is in line with many previous works (Strohmeier and Kabst, 2009).
Table 7.20: F-test between Adopters and Non-adopters of HRIS Application in Terms of Variables
Constituting “Formalisation “Factor group
Code Variables Group Means F- Value Sig.
G1 G2
F4 Written policies and procedures are important in
guiding the actions of employees.
3.96 2.61 151.229 .000
F7 Functional advice given to the employees is
always in a written form.
3.71 2.63 92.824 .000
F5 The rules and procedures of the organisation are
expressed in written form.
3.91 2.56 141.915 .000
F6 Statistical information is continuously gathered
about the employees’ work tasks.
3.85 2.58 131.215 .000
F1 The decisions of the employees must have the top
management’s approval.
4.03 2.81 108.147 .000
F8 Whatever situation arises, there are procedures to 3.97 2.63 142.934 .000

177
follow in dealing with the situation.
F3 The employees are encouraged to make
independent decisions in their work.
3.82 2.56 113.558 .000
F9 The employees in your organisation are
constantly checked for rule violation.
3.88 2.63 109.020 .000
F2 When rules and procedures exist here, they are
usually in written form.
3.94 2.74 102.276 .000
3. The "Centralisation" Factor: Variables F-Test
The "Centralisation" factor consists of nine attributes Table 7 .21. The results indicate that each of
these variables is relatively considered as important by the two groups. When compared to other
variables of this factor, “the decision-making is highly concentrated at top management level "was
the most important in differentiating between the adopter’s group and non-adopter’s group.
Therefore, it may be concluded that the organisation structure of the adopter’s group tend to be
more centralized. The result is in line with many previous works (Damanpour, 1991; Grover, 1993;
Kwon and Zmud, 1987).
Table 7.21: F-test between Adopters and Non-adopters of HRIS Application in Terms of Variables
Constituting “Centralisation” Factor
Code Variables Group Means F- Value Sig.
G1 G2
C6 Our organisation decision-making is highly
concentrated at top management level.
3.92 3.40 40.358 .000
C1 When our results deviate from our plans, the
decisions to take appropriate corrective action
usually comes from top management or
politicians.
3.85 3.26 22.543 .000
C4 Our organisation extensively utilizes cross-
functional work teams for managing day-to-day
operations.
3.68 3.09 25.058 .000
C3 In my experience with my organisation, even
quite small matters have to be referred to
someone higher up for a final answer.
3.60 3.21 8.195 .005
C7 Our organisation has reduced formal
organisational structure to more fully integrate
operations.
3.79 3.06 40.345 .000
C8 In our organisation we have to ask senior
management before doing almost anything in
business.
3.68 3.13 16.227
C5 My experience with my organisation has
included a lot of rules and procedures stating
how various aspects of my job are to be done.
3.93 3.26 34.558 .000
C9 We can take very little action by ourselves until
the senior management approves.
3.64 3.23 11.546 .001
C2 The employees are their own bosses in most
matters.
3.69 2.78 50.587 .000
178
7.5.1.4 Management Commitment and Corporate Culture Construct Factors
1. The "Top Management Willingness to Support" Factor: Variables F-Test
The "Top management willingness to support" factor consists of thirteen variables Table 7.22. The
results indicate the top management of the adopter’s group is more willing to support the adoption
of HRIS s system than the non-adopter’s group. When compared to other variables of this factor,
the “Top management enthusiastically supports the adoption of HRIS” was the most important in
differentiating between the adopter’s group and non-adopter’s group. Therefore, it may be
concluded that the “Top management willingness to support” plays an important role in
differentiating between the two groups. The result contradicts the findings of previous studies (Teo
and Pian, 2003; Thong, 1999).
Table 7.22: F-test between Adopters and Non-adopters of HRIS Application in Terms of Variables
Constituting “Top Management Willingness to Support” Factor
Code Variables Group Means F- Value Sig.
G1 G2
TP4 Top management is aware of the benefits of
HRIS.
4.14 2.67 219.887 .000
TP1 Top management is likely to consider the
adoption of the HRIS applications as
strategically important.
4.17 2.63 255.452 .000
TP2 Top management enthusiastically supports the
adoption of HRIS.
4.23 2.64 268.182 .000
TP6 Top management actively encourages human
resources personnel to use HRIS in their daily
tasks.
4.18 2.53 258.388 .000
TP9 Top management has positive attitudes toward
HRIS.
4.11 2.52 244.021 .000
TP3 Top management has allocated adequate
financial resources for the adoption of HRIS.
4.15 2.56 227.325 .000
TP7 The top management has an open attitude
toward technological changes in HR.
4.04 2.57 224.267 .000
TP10 Willingness to change culture to meet the
requirements of HRIS.
4.11 2.50 243.768 .000
TP8 Our Organisation’s leaders encourage
employees to learn new technology in HR.
4.11 2.48 236.390 .000
TP11 Top management is likely to invest funds in
HRIS applications.
4.05 2.47 204.995 .000
TP5 The organisation’s management is willing to
make large investments into new IT
application in HRIS.
3.97 2.50 161.995 .000
TP12 Top management in this organisation is not
afraid to take risks.
3.91 2.50 154.142 .000
TP13 Our organisation provides supports for
employees to learn technology in HR.
3.71 2.53 80.382 .000
179
2. The "Intra-Organisation Communication" Factor: Variables F-Test
Each of the variables comprising the “Intra-organisation communication” factor is found to be
important in discriminating between the two groups Table 7.23. The results indicate that the
adopter’s group perceived the attributes of this factor more positively than their counterparts the
non-adopter’s group. The most important one is the "Quality of communication channel types in
our organisation encourage us use/adopt HRIS applications". This result appears to agree with
previous work (Murphy and Southey, 2003; Ruta, 2005; Shrivastava and Shaw, 2003).
Table 7.23: F-test between Adopters and Non-adopters of HRIS Application in Terms of Variables
Constituting “Intra-Organisation Communication “ Factor
Code Variables Group Means F- Value Sig.
G1 G2
INT1 Availability of multi sources of information,
encourage us to use /adopt HRIS applications.
3.96 3.14 51.225 .000
INT2 The Quality of communication channel types in our
organisation encourage us use /adopt HRIS
applications.
3.98 3.13 54.328 .000
INT3 Our organisation has built database of related
technologies in HRIS.
3.92 3.01 52.763 .000
INT4 Our vision of HRIS activities is widely
communicated and understood throughout the
organisation.
3.90 3.07 52.351 .000
INT5 Employees in our organisation can share knowledge
with each other.
4.07 3.15 67.464 .000
3. The " Organisation Sharing Culture" Factor: Variables F-Test
The "Organisation sharing culture" factor consists of seven variables Table 7.24. The results
indicate the “Organisation sharing culture” of the adopter’s group is significantly different from
that of the non-adopter’s group. When compared to other variables of this factor, “the history,
values and norms supporting adoption of innovative technology such as HRIS applications in the
organisations" was the most important one in differentiating between the adopter’s group and non-
adopter’s group. Therefore, it may be concluded that the “Organisation sharing culture” factor
plays an important role in determining the adoption behaviour. This result is in line with many
previous works (Hooi, 2006; Martins and Terblanche, 2003).
Table 7.24: F-test between Adopters and Non-adopters of HRIS Application in Terms of Variables
which constitute The Constituting “Organisation sharing culture “Factor
Code Variables Group Means F- Value Sig.
G1 G2
OS2 Our organisation values emphasized
collaboration and support.
4.07 2.94 105.712 .000
OS5 The willingness of the organisation to tolerate
risk and failure.
3.80 2.88 50.455 .000
OS3 The corporate culture of the organisation
toward innovation and change.
4.00 2.97 83.075 .000
OS4 In our organisation, we believe that a new 4.01 2.92 89.377 .000

180
Code Variables Group Means F- Value Sig.
G1 G2
technology in HR achieve efficiency in
managerial process.
OS6 Our employees accommodate themselves very
quickly to technological changes.
3.96 2.97 79.796 .000
OS1 The history, values and norms supporting
adoption of innovative technology such as
HRIS applications in the organisations.
4.05 2.48 110.106 .000
OS7 HRM plays an important strategic role in the
organisation.
4.01 2.86 104.746 .000
7.5.1.5 The Socio-Demographic Characteristics of Decision-Makers Construct Factors
1. The “Social and Technology Skills” Factor: Variables F-Test
This factor consists of six independent variables Table 7.25. Each of them was regarded as
important in differentiating between the two groups. “The CEO’s extent social network skills
compared to other people in similar positions" was the most important one in differentiating
between the adopter’s group and non-adopter’s group. The result indicates that the adopter’s group
in terms of the attributes of this factor is much higher than the non-adopter’s group. This result is
supported by many studies, such as Brand and Huizingh (2008), Amabile, (1988) and Huselid et al.
(1997).
Table 7.25: F-test between Adopters and Non-adopters of HRIS Application in Terms of Variables
Constituting “Social and technology skills “Factor
Code Variables Group Means F- Value Sig.
G1 G2 STS5 The CEO management’s actions show support for
the use of new technology.
4.05 2.76 144.259 .000
STS6 The CEO has the ability to gain consensus on
ideas.
4.04 2.74 153.264 .000
STS4 The CEO management’s visibility and exhibited
commitment to adoption of IT applications.
3.99 2.77 127.332 .000
STS2 The CEO’s extent social network skills compared
to other people in similar positions.
4.23 2.88 170.709 .000
STS1 The CEO’s extent of technical and knowledge of
IT compared to other people in similar positions.
4.21 2.92 168.031 .000
STS3 The CEO’s decision making style for IT adoption
tends to be people oriented rather than work
oriented.
3.89 2.76 96.131 .000
2. The “Demographic Characteristics” Factor: Variables F-Test
This factor consists of three independent variables Table 7.26. Each of them was regarded as
important in differentiating between the two groups. The result indicates that the adopter’s group in

181
terms of the attributes of this factor is much higher than the non-adopter’s group. Educational
level. was the most important one in differentiating between the adopter’s group and non-adopter’s
group This result is supported by many studies, such as Bassellier et al. (2003), Thong
(1999Murphy and Southy (2003) and Damanpour and Schneider (2006).
Table 7.26: F-test between Adopters and Non-adopters of HRIS Application in Terms of Variables
Constituting “CEO’s Demographic Characteristics “Factor
Code Variables Group Means F- Value Sig.
G1 G2
DS1 Age. 3.43 2.83 24.451 .000
DS3 Business experience. 2.96 2.64 3.554 0.06
DS2 Educational level. 3.27 2.43 90.130 .000
7.5.1.6 The “Industry Characteristics and Market Structure Construct” Factors
1. The “Availability of IT Suppliers & Activities” Factor: Variables F-Test
The “Availability of IT suppliers & activities” factor consists of fifteen variables Table 7.27. The
results indicate the “Availability of IT suppliers & activities” of the adopter’s group is significantly
different from that of the non-adopter’s group. When compared to other variables of this factor,
“technological diffusion in HRIS is quite large in our area of business” was the most important one
in differentiating between the adopter’s group and non-adopter’s group. Therefore, it may be
concluded that the “Availability of IT suppliers & activities” factor plays an important role in
determining the adoption behaviour. This result is in line with many previous works, such as Chi. rt
al. (2007), Ichniowsk and Shaw (1995), Murad and Thomson (2011).
Table 7.27: F-test between Adopters and Non-adopters of HRIS Application in Terms of Variables
Constituting Availability of IT suppliers & activities “Factor
Code Variables Group Means F- Value Sig
G1 G2
IND1 IT solutions availability motivates us to adopt IT
applications.
4.07 2.92 111.746 .000
IND2 External consultant support encourages us to adopt
HRIS applications.
3.93 2.80 102.445 .000
IND3 Local vendor supports in terms of quality of
technical encourages us to adopt HRIS.
3.77 2.74 94.958 .000
IND7 We can usually find help quickly when having
questions on how to work with these applications.
3.81 2.81 81.997 .000
IND4 Availability and quality of IT infrastructure in
local market encourages us to adopt IT
applications.
4.04 3.59 105.756 .000
IND6 The cost of internet communications encourages
us to use HRIS applications.
3.79 2.74 88.232 .000
IND12 Accessibility, usefulness, and cost of external
know-how from agencies.
3.93 2.66 142.466 .000
182
Code Variables Group Means F- Value Sig
G1 G2
IND8 We can use specialists hired from outside the
organisation to control our resources during HRIS
adoption.
3.85 2.71 104.299 .000
IND10 The availability of qualified human resources
locally encourages our organisation to use HRIS.
3.99 2.80 119.731 .000
IND13 The extent of change agents’ promotion efforts
motivates us to use HRIS.
3.93 2.77 109.102 .000
IND9 Technological diffusion in HRIS is quite large in
our area of business.
3.97 2.77 146.177 .000
IND14 The quality of industrial relations encourages our
organisation to adopt HRIS.
3.90 2.76 110.622 .000
IND15 The quality of local work force encourages our
organisation to use IT applications in HRM.
3.92 2.77 111.498 .000
IND11 The availability of capital encourages us to extend
the use of HRIS.
3.93 2.79 109.151 .000
IND5 The availability of external know-how concerning
IT applications is important to use HRIS in our
organisation.
3.96 2.86 19.843 .000
2. The "Competition Pressure" Factor: Variables F-Test
Each of the variables comprising the "Competition pressure" factor is found to be important in
discriminating between the two groups Table 7.28. The results indicate that the adopter’s group
perceived the attributes of this factor more important than their counterpart’s, the non-adopter’s
group. The most important one is the "degree of competition in industrial environmental places
pressures on the firm to adopt HRIS". This result appears to agree with previous work, such as
Gibbs et al. (2004), Hollenstein (2004), Zhu et al. (2003), Scupola (2003) and Sadowski, Maitland
and Van Dongen (2002).
Table 7.28: F-test between Adopters and Non-adopters of HRIS Application in Terms of Variables
Constituting “Competition Pressure” Factor
Code Variables Group Means F- Value Sig.
G1 G2
CPS2 The firm needs to utilize HRIS to maintain its
competitiveness in the market.
4.04 3.31 42.116 .000
CPS3 It is a strategic necessity to use HRIS in the
workplace.
4.08 3.21 60.273 .000
CPS4 Competitors’ adoption of HRIS places pressure on
our organisation to adopt HRIS.
3.94 3.30 29.121 .000
CPS1 The degree of competition in industrial
environmental places pressures on the firm to
adopt this IT.
4.09 3.13 61.182 .000
183
7.5.1.7 the Social Influences (Externalities Network) Construct” Factor
1. The “Social Influences" Factor: Variables F-Test
The “Social influences” factor consists of seven independent variables Table 7.29. The results
indicate the attributes of this factor are more influential on the adopter’s group than the non-
adopter’s group to adopt HRIS. The attribute “People who influence our organisation’s behaviour
think that we should use HRIS technology” was the most important in differentiating between the
adopter’s group and non-adopter’s group. Therefore, it may be concluded that the “Social
influences" plays an important role in the adoption of HRIS applications the result is in line with
many previous works, such as Khoumbati and Irani (2006) and Standen and Sinclair-Jones (2004).
Table 7.29: F-test between Adopters and Non-adopters of HRIS Application in Terms of Variables
Constituting “Social Influences “Factor
Code
Variables
Group Means
F- Value
Sig. G1 G2
SI3 The senior management of this business has been
helpful in the use of the HRIS technology.
3.82 2.88 75.367 .000
S14 In general, the organisation has supported the use
of HRIS technology.
3.88 2.89 81.857 .000
SI2 The desire of organisation to be seen as good
corporate citizen socially responsive in the case
of HR employee’s choice.
3.76 2.87 64.248 .000
SI6 People who are important to our organisation
think that we should use the HRIS technology.
3.90 2.98 73.941 .000
SI1 The nature of social system in Jordan motivates
our organisation to speed the use of IT
applications in HRM.
3.75 2.90 53.519 .000
SI5 People who influence our organisation’s
behaviour think that we should use HRIS
technology.
4.01 3.67 88.106 .000
SI7 Our organisation actively keeps track of new and
innovative uses of technology by competitors.
3.87 3.16 33.233
.000
7.5.1.8 The Government Policies and Support Construct Factor
2. The " Government Policies and Support" Factor: Variables F-Test
Each of the variables comprising the “Government policies and support” factor is found to be
important in discriminating between the two groups Table 7.30. The results indicate that the
adopter’s group perceived the attributes of this factor more positively than the non-adopter’s group.
The most important one is the “The availability of government security and protection to adopt and
use IT applications HRIS applications". This result appears to agree with previous work, such as
Murad and Thomson (2011).
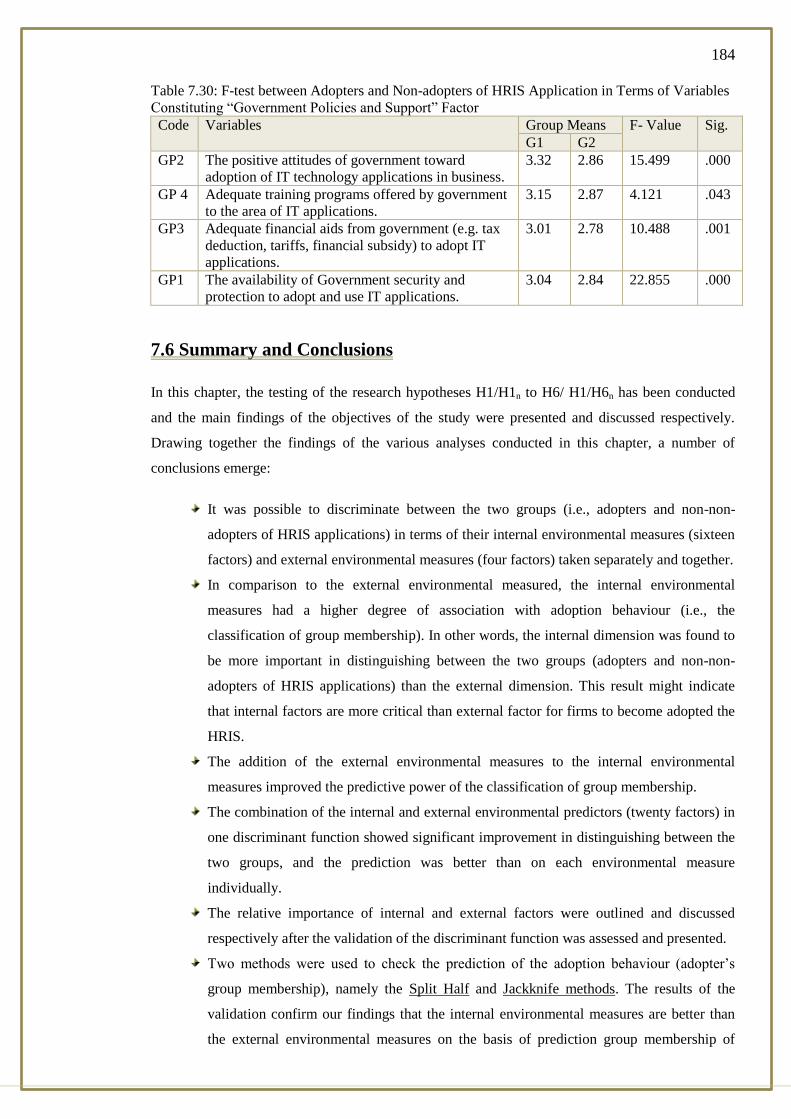
184
Table 7.30: F-test between Adopters and Non-adopters of HRIS Application in Terms of Variables
Constituting “Government Policies and Support” Factor
Code Variables Group Means F- Value Sig.
G1 G2
GP2 The positive attitudes of government toward
adoption of IT technology applications in business.
3.32 2.86 15.499 .000
GP 4 Adequate training programs offered by government
to the area of IT applications.
3.15 2.87 4.121 .043
GP3 Adequate financial aids from government (e.g. tax
deduction, tariffs, financial subsidy) to adopt IT
applications.
3.01 2.78 10.488 .001
GP1 The availability of Government security and
protection to adopt and use IT applications.
3.04 2.84 22.855 .000
7.6 Summary and Conclusions
In this chapter, the testing of the research hypotheses H1/H1n to H6/ H1/H6n has been conducted
and the main findings of the objectives of the study were presented and discussed respectively.
Drawing together the findings of the various analyses conducted in this chapter, a number of
conclusions emerge:
It was possible to discriminate between the two groups (i.e., adopters and non-non-
adopters of HRIS applications) in terms of their internal environmental measures (sixteen
factors) and external environmental measures (four factors) taken separately and together.
In comparison to the external environmental measured, the internal environmental
measures had a higher degree of association with adoption behaviour (i.e., the
classification of group membership). In other words, the internal dimension was found to
be more important in distinguishing between the two groups (adopters and non-non-
adopters of HRIS applications) than the external dimension. This result might indicate
that internal factors are more critical than external factor for firms to become adopted the
HRIS.
The addition of the external environmental measures to the internal environmental
measures improved the predictive power of the classification of group membership.
The combination of the internal and external environmental predictors (twenty factors) in
one discriminant function showed significant improvement in distinguishing between the
two groups, and the prediction was better than on each environmental measure
individually.
The relative importance of internal and external factors were outlined and discussed
respectively after the validation of the discriminant function was assessed and presented.
Two methods were used to check the prediction of the adoption behaviour (adopter’s
group membership), namely the Split Half and Jackknife methods. The results of the
validation confirm our findings that the internal environmental measures are better than
the external environmental measures on the basis of prediction group membership of

185
adoption behaviour. Also, they confirm the result that the combination of the two
dimensions was better than taking each dimension acting separately in term of prediction
and classification of the group membership.
The integration approach of the two environmental dimensions (internal and external)
allows us to delineate a feasible profile for the two groups, and in turn, to answer the
question of who are adopters and non-adopters. A summary profile for the differences
between the adopter’s group and the non-adopter’s group is given in Chapter Nine.
The results of differences between the two groups in terms of their means score on the
variables (taken separately) consisting of each independent factor were presented and
discussed respectively. The results indicated that all the attributes (i.e., variables) of
twenty factors were found to be important in differentiating between the two groups.
The results showed some disagreement with previous works in respect of the attributes of
top management willingness to support the adoption of HRIS applications. The possible
explanations for this are: (1) the use of the aggregate measure (i.e., factor), or (2) the
HRIS situations of the companies in the countries under investigations.
The next chapter is dedicated to the determinants of the implementation of HRIS
applications and effectiveness.

186
THE DETERMINANTS OF THE LEVEL OF CHAPTER 8: HRIS IMPLEMENTATION AND ITS EFFECTIVENESS
8.1 Introduction
In the previous chapter the main findings pertaining to the determinants of the adoption behaviour
(i.e. the difference between adopter’s group and non-adopter’s group of HRIS applications) were
analysed and discussed. In this chapter, the twenty factors and associated variables identified are
analysed in terms of their relationships with direction and strength; their ability to predict level of
implementations of HRIS applications (defined here as a dependent variable) and to examined the
relationship between the level of implementation and its effectiveness, to test hypotheses (H7/H7),
(H8/H8n), (H9/H9n), (H10/H10n), (H11/H11n), (H12/H12n) , (H13/H13n)and (H14/H14n). Figure
(8.1) shows the study’s model of HRIS implementation and effectiveness.
The statistical analysis techniques used are multiple regressions and Pearson’s correlation. Factors
and variables are analysed and discussed in this chapter.
Figure 8.1: Model Used in this Chapter
187
8.2 The Extent of the Level of Implantation of HRIS Applications
The measure of extent of HRIS implementation is the type of applications used in the organisation.
In this study, the uses of HRIS for ten HRM activities were identified. These were selected as they
were the most common applications frequently mentioned in HRIS books and HR magazines.
Findings shown in Table 8.1 indicate that the extent of HRIS being practiced is considered to be
good (i.e. 70% or 3.51%). since their mean are more than the mean of the scale, which is 3 (mean
of the scale = Σ Degrees of the scale / 5 = 1+2+3+4+5 / 5 = 3). This implies that there are some
variations among shareholdings companies in terms of their level of implementations of HRIS
applications. This might be due to the fact that some of the management of these companies would
prefer to use these applications for administrative purpose rather than for strategic purposes. This
result is consistent with previous work as many surveys and research on HRIS have found that
HRIS is more commonly used for administrative purposes like employee record-keeping and
payroll rather than for strategic purposes (Ball, 2001, p. 31; Delorme, 2010, p. 416; Hussain, 2007,
p. 203; Kovach, 1999, p. 29; Kovach, 2002, p. 14; Ngai, 2006, p. 14). In this context, Ball (2001),
Ngai (2006) and Kovach (2002) argued that HRIS should not be designed only to automate HRM
activities to gain administrative advantages; rather it should be also used for decision-making and
to provide strategic advantages for organisations.
However, Kundu (2012) reported that many studies have shown that companies have started using
sophisticated HRIS, like training and development, performance management, compensation
management and corporate communication (CedarCrestone, 2006; De Alwis, 2010; Saharan and
Jafri, 2012). CedarCrestone (2006) stated that HCM surveys of US companies broadened the scope
of HRIS applications. Administrative HRIS was still the most popular application (62%),
companies reported an increasing use of strategic applications i.e. talent acquisition services (61%),
performance management (52%), or compensation management (49%) (CedarCrestone, 2006). De
Alwis (2010) in his study on Sri Lankan industry showed that the most commonly used modules in
HR department are training and development, recruitment and selection and performance appraisal,
which were utilized by all companies. A recent study of Indian companies also found that HR
professionals had major applications of HRIS such as recruitment and selection (67.2% and 71.9%,
respectively), pay roll service (67.2%), providing general information (67.2%), compensation
(67.2%), performance appraisal (62.5%) and job analysis and design (62.5%) (Saharan and Jafri,
2012). Also HRIS was quite utilized in corporate communication (48.2%) (Saharan and Jafri,
2012). The most popular future applications of HRIS have been predicted as training and
development (72.5%), career development (60.8%) and performance appraisal/management
(58.8%) (Teo, 2001). There appears to be a shift towards strategic applications of HRIS. The
possible reason could be that most organisations that have used HRIS for a few years now want to
explore possibilities of strategic HRIS applications over the next few years (Teo, 2001).

188
Table 8.1: HRIS Applications
HRIS Applications Mean Percentage Standard
deviation
Employee record-keeping 4.52 90.4 .701
Recruitment/selection 4.20 84 .855
Payroll service and benefits 4.10 82. .774
Benefits management 3.75 75 ,765
Training & development 4.21 84.2 .824
Performance appraisal /reward management 3.80 76 .876
Compensation management 3.47 71.4 1.16
Turnover tracking/job analysis 3.37 67.4 .988
Internal and external communication 3.50 70 .876
Succession HR planning 3.45 69 .804
Average practice 3.51 70.2
8.3: The Multiple Regression Findings: Determinants of the Level of
Implementation of HRIS Applications
The multiple regression analysis technique is used to examine the following hypotheses:
H7: There is a significant relationship between the internal environmental measures (16 factors)
and the level of implementation of HRIS applications, taken together.
H7n: There is no significant relationship between the internal environmental measures (16 factors)
and the level of implementation of HRIS applications, taken together.
H8: There is a significant relationship between the external environmental measures (4 factors) and
the level of implementation of HRIS applications, taken together.
H8n: There is no significant relationship between the external environmental measures (4 factors)
and the level of implementation of HRIS applications, taken together.
H9: There is a significant relationship between the two environmental measures (20 factors) and
the level of implementation of HRIS applications, taken together.
H9n: There is no significant relationship between the two environmental measures (20 factors) and
the level of implementation of HRIS applications, taken together.
Table 8.2 summarizes the results of multiple regression analysis, with the F-ratio test for the three
above hypotheses. The results indicate that each of these hypotheses (H7/H7n, H8/H8n, and
H9/H9n) is correlated significantly with the level of implementation of HRIS applications at .000
level of significant. Accordingly, it may be concluded that there is a significant relationship
between each dimension (i.e., internal, external, and combined) and the level of implementation of
HRIS applications.
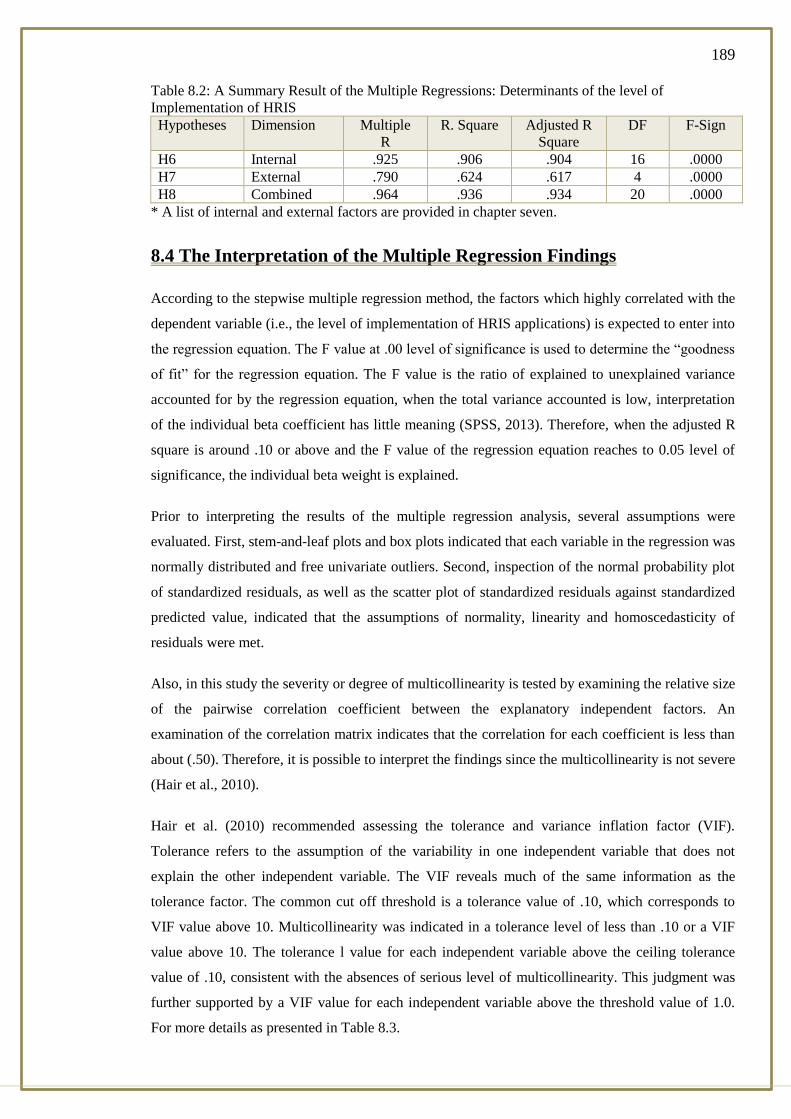
189
Table 8.2: A Summary Result of the Multiple Regressions: Determinants of the level of
Implementation of HRIS
Hypotheses Dimension Multiple
R
R. Square Adjusted R
Square
DF F-Sign
H6 Internal .925 .906 .904 16 .0000
H7 External .790 .624 .617 4 .0000
H8 Combined .964 .936 .934 20 .0000
* A list of internal and external factors are provided in chapter seven.
8.4 The Interpretation of the Multiple Regression Findings
According to the stepwise multiple regression method, the factors which highly correlated with the
dependent variable (i.e., the level of implementation of HRIS applications) is expected to enter into
the regression equation. The F value at .00 level of significance is used to determine the “goodness
of fit” for the regression equation. The F value is the ratio of explained to unexplained variance
accounted for by the regression equation, when the total variance accounted is low, interpretation
of the individual beta coefficient has little meaning (SPSS, 2013). Therefore, when the adjusted R
square is around .10 or above and the F value of the regression equation reaches to 0.05 level of
significance, the individual beta weight is explained.
Prior to interpreting the results of the multiple regression analysis, several assumptions were
evaluated. First, stem-and-leaf plots and box plots indicated that each variable in the regression was
normally distributed and free univariate outliers. Second, inspection of the normal probability plot
of standardized residuals, as well as the scatter plot of standardized residuals against standardized
predicted value, indicated that the assumptions of normality, linearity and homoscedasticity of
residuals were met.
Also, in this study the severity or degree of multicollinearity is tested by examining the relative size
of the pairwise correlation coefficient between the explanatory independent factors. An
examination of the correlation matrix indicates that the correlation for each coefficient is less than
about (.50). Therefore, it is possible to interpret the findings since the multicollinearity is not severe
(Hair et al., 2010).
Hair et al. (2010) recommended assessing the tolerance and variance inflation factor (VIF).
Tolerance refers to the assumption of the variability in one independent variable that does not
explain the other independent variable. The VIF reveals much of the same information as the
tolerance factor. The common cut off threshold is a tolerance value of .10, which corresponds to
VIF value above 10. Multicollinearity was indicated in a tolerance level of less than .10 or a VIF
value above 10. The tolerance l value for each independent variable above the ceiling tolerance
value of .10, consistent with the absences of serious level of multicollinearity. This judgment was
further supported by a VIF value for each independent variable above the threshold value of 1.0.
For more details as presented in Table 8.3.
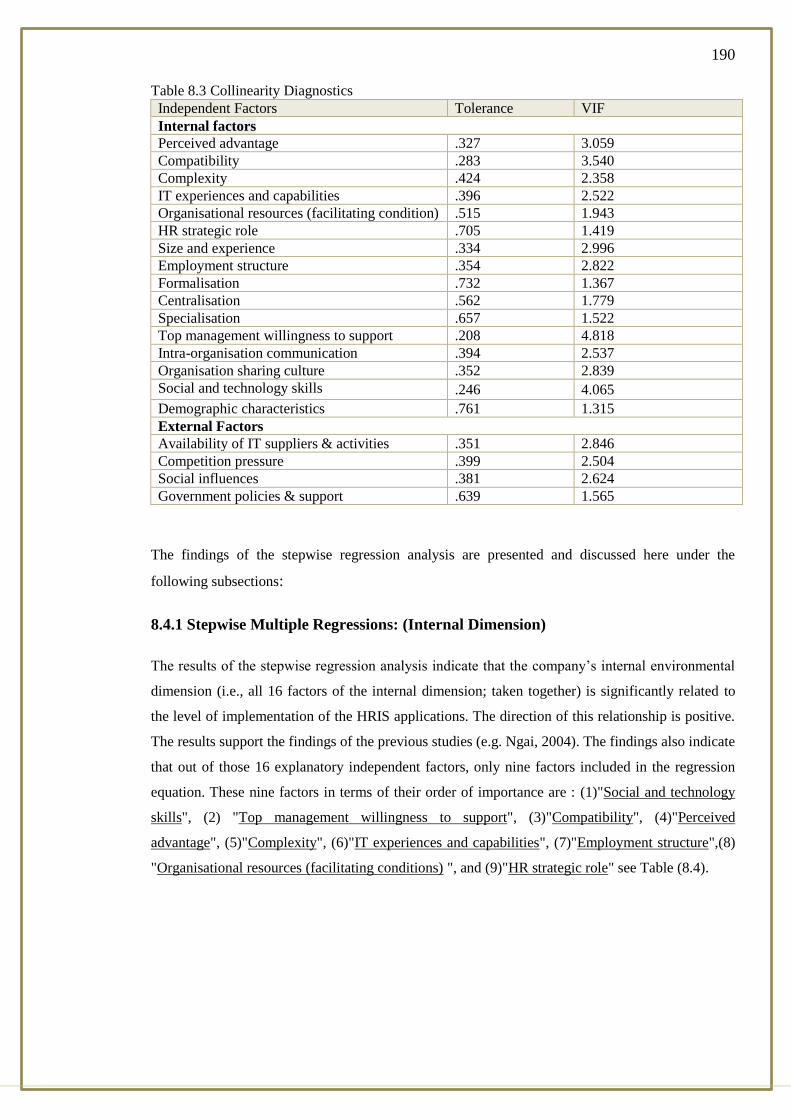
190
Table 8.3 Collinearity Diagnostics
Independent Factors Tolerance VIF
Internal factors
Perceived advantage .327 3.059
Compatibility .283 3.540
Complexity .424 2.358
IT experiences and capabilities .396 2.522
Organisational resources (facilitating condition) .515 1.943
HR strategic role .705 1.419
Size and experience .334 2.996
Employment structure .354 2.822
Formalisation .732 1.367
Centralisation .562 1.779
Specialisation .657 1.522
Top management willingness to support .208 4.818
Intra-organisation communication .394 2.537
Organisation sharing culture .352 2.839
Social and technology skills .246 4.065
Demographic characteristics .761 1.315
External Factors
Availability of IT suppliers & activities .351 2.846
Competition pressure .399 2.504
Social influences .381 2.624
Government policies & support .639 1.565
The findings of the stepwise regression analysis are presented and discussed here under the
following subsections:
8.4.1 Stepwise Multiple Regressions: (Internal Dimension)
The results of the stepwise regression analysis indicate that the company’s internal environmental
dimension (i.e., all 16 factors of the internal dimension; taken together) is significantly related to
the level of implementation of the HRIS applications. The direction of this relationship is positive.
The results support the findings of the previous studies (e.g. Ngai, 2004). The findings also indicate
that out of those 16 explanatory independent factors, only nine factors included in the regression
equation. These nine factors in terms of their order of importance are : (1)"Social and technology
skills", (2) "Top management willingness to support", (3)"Compatibility", (4)"Perceived
advantage", (5)"Complexity", (6)"IT experiences and capabilities", (7)"Employment structure",(8)
"Organisational resources (facilitating conditions) ", and (9)"HR strategic role" see Table (8.4).
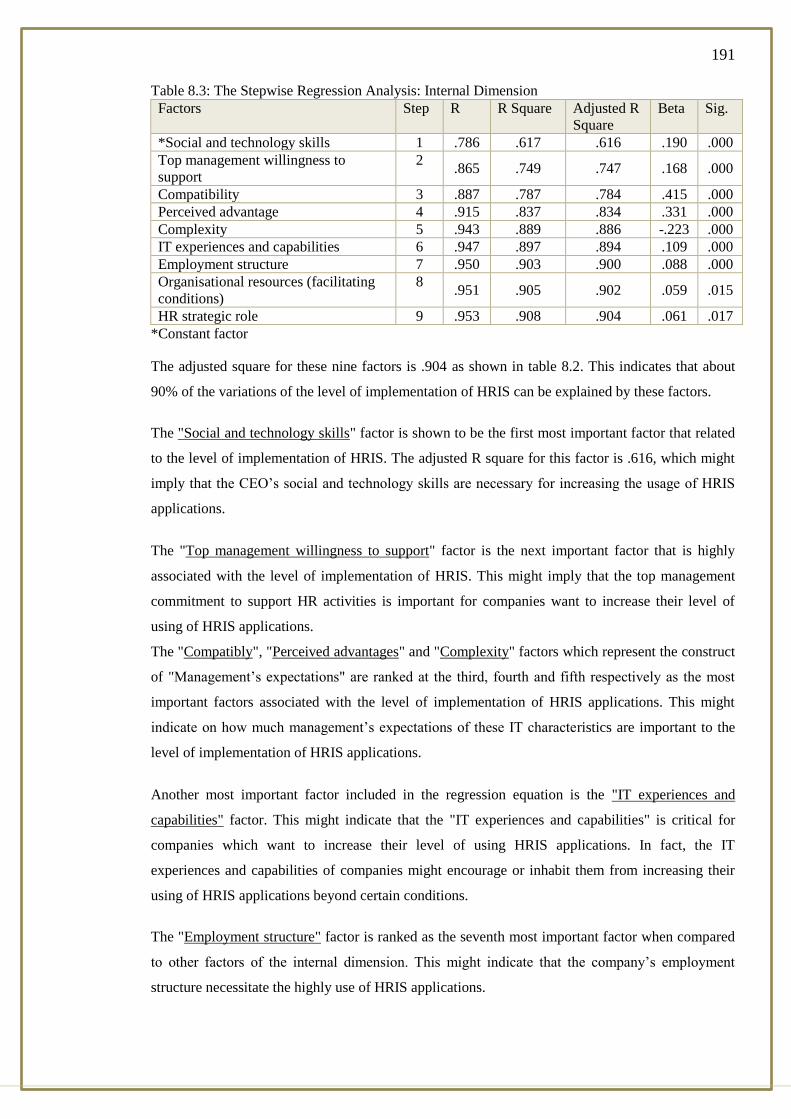
191
Table 8.3: The Stepwise Regression Analysis: Internal Dimension
Factors Step R R Square Adjusted R
Square
Beta Sig.
*Social and technology skills 1 .786 .617 .616 .190 .000
Top management willingness to
support
2 .865 .749 .747 .168 .000
Compatibility 3 .887 .787 .784 .415 .000
Perceived advantage 4 .915 .837 .834 .331 .000
Complexity 5 .943 .889 .886 -.223 .000
IT experiences and capabilities 6 .947 .897 .894 .109 .000
Employment structure 7 .950 .903 .900 .088 .000
Organisational resources (facilitating
conditions)
8 .951 .905 .902 .059 .015
HR strategic role 9 .953 .908 .904 .061 .017
*Constant factor
The adjusted square for these nine factors is .904 as shown in table 8.2. This indicates that about
90% of the variations of the level of implementation of HRIS can be explained by these factors.
The "Social and technology skills" factor is shown to be the first most important factor that related
to the level of implementation of HRIS. The adjusted R square for this factor is .616, which might
imply that the CEO’s social and technology skills are necessary for increasing the usage of HRIS
applications.
The "Top management willingness to support" factor is the next important factor that is highly
associated with the level of implementation of HRIS. This might imply that the top management
commitment to support HR activities is important for companies want to increase their level of
using of HRIS applications.
The "Compatibly", "Perceived advantages" and "Complexity" factors which represent the construct
of "Management’s expectations" are ranked at the third, fourth and fifth respectively as the most
important factors associated with the level of implementation of HRIS applications. This might
indicate on how much management’s expectations of these IT characteristics are important to the
level of implementation of HRIS applications.
Another most important factor included in the regression equation is the "IT experiences and
capabilities" factor. This might indicate that the "IT experiences and capabilities" is critical for
companies which want to increase their level of using HRIS applications. In fact, the IT
experiences and capabilities of companies might encourage or inhabit them from increasing their
using of HRIS applications beyond certain conditions.
The "Employment structure" factor is ranked as the seventh most important factor when compared
to other factors of the internal dimension. This might indicate that the company’s employment
structure necessitate the highly use of HRIS applications.
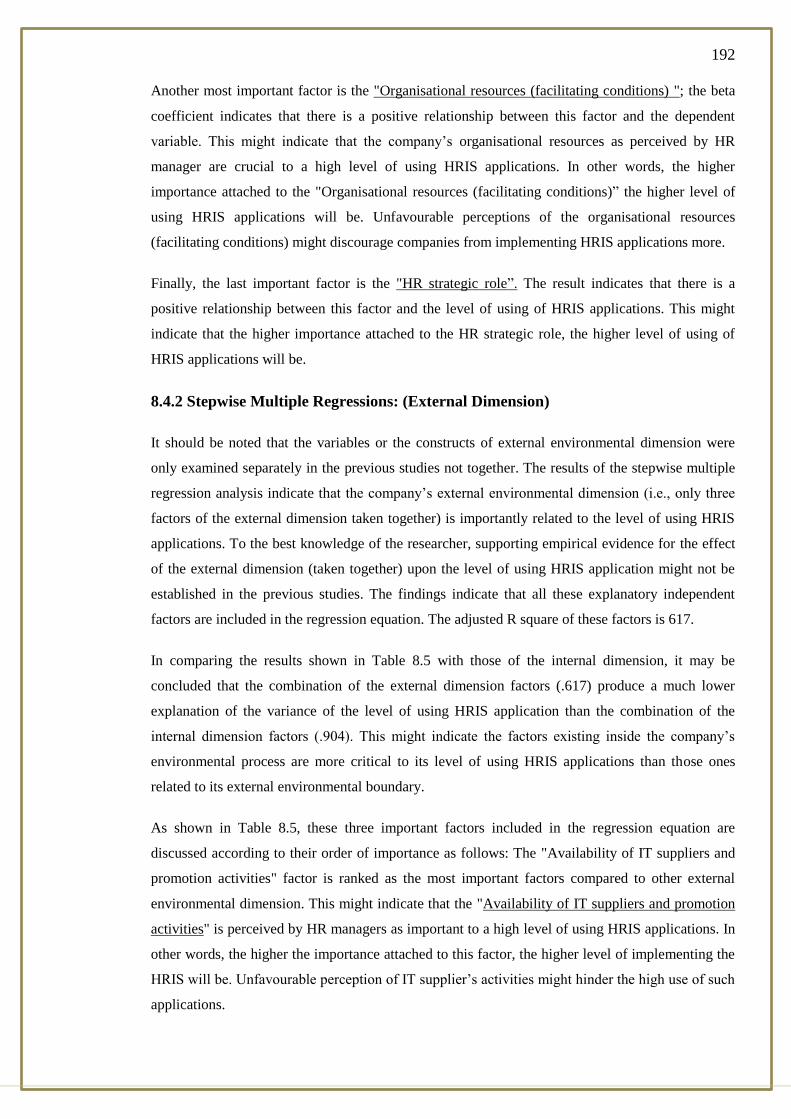
192
Another most important factor is the "Organisational resources (facilitating conditions) "; the beta
coefficient indicates that there is a positive relationship between this factor and the dependent
variable. This might indicate that the company’s organisational resources as perceived by HR
manager are crucial to a high level of using HRIS applications. In other words, the higher
importance attached to the "Organisational resources (facilitating conditions)” the higher level of
using HRIS applications will be. Unfavourable perceptions of the organisational resources
(facilitating conditions) might discourage companies from implementing HRIS applications more.
Finally, the last important factor is the "HR strategic role”. The result indicates that there is a
positive relationship between this factor and the level of using of HRIS applications. This might
indicate that the higher importance attached to the HR strategic role, the higher level of using of
HRIS applications will be.
8.4.2 Stepwise Multiple Regressions: (External Dimension)
It should be noted that the variables or the constructs of external environmental dimension were
only examined separately in the previous studies not together. The results of the stepwise multiple
regression analysis indicate that the company’s external environmental dimension (i.e., only three
factors of the external dimension taken together) is importantly related to the level of using HRIS
applications. To the best knowledge of the researcher, supporting empirical evidence for the effect
of the external dimension (taken together) upon the level of using HRIS application might not be
established in the previous studies. The findings indicate that all these explanatory independent
factors are included in the regression equation. The adjusted R square of these factors is 617.
In comparing the results shown in Table 8.5 with those of the internal dimension, it may be
concluded that the combination of the external dimension factors (.617) produce a much lower
explanation of the variance of the level of using HRIS application than the combination of the
internal dimension factors (.904). This might indicate the factors existing inside the company’s
environmental process are more critical to its level of using HRIS applications than those ones
related to its external environmental boundary.
As shown in Table 8.5, these three important factors included in the regression equation are
discussed according to their order of importance as follows: The "Availability of IT suppliers and
promotion activities" factor is ranked as the most important factors compared to other external
environmental dimension. This might indicate that the "Availability of IT suppliers and promotion
activities" is perceived by HR managers as important to a high level of using HRIS applications. In
other words, the higher the importance attached to this factor, the higher level of implementing the
HRIS will be. Unfavourable perception of IT supplier’s activities might hinder the high use of such
applications.
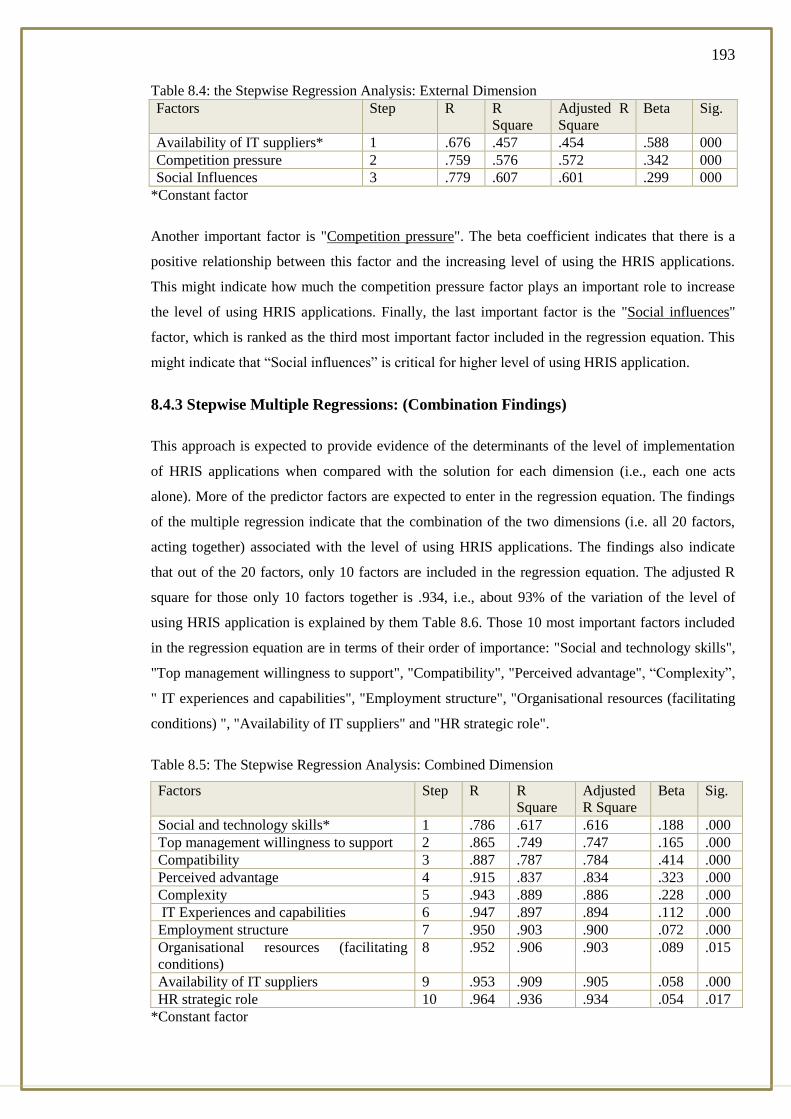
193
Table 8.4: the Stepwise Regression Analysis: External Dimension
Factors Step R R
Square
Adjusted R
Square
Beta Sig.
Availability of IT suppliers* 1 .676 .457 .454 .588 000
Competition pressure 2 .759 .576 .572 .342 000
Social Influences 3 .779 .607 .601 .299 000
*Constant factor
Another important factor is "Competition pressure". The beta coefficient indicates that there is a
positive relationship between this factor and the increasing level of using the HRIS applications.
This might indicate how much the competition pressure factor plays an important role to increase
the level of using HRIS applications. Finally, the last important factor is the "Social influences"
factor, which is ranked as the third most important factor included in the regression equation. This
might indicate that “Social influences” is critical for higher level of using HRIS application.
8.4.3 Stepwise Multiple Regressions: (Combination Findings)
This approach is expected to provide evidence of the determinants of the level of implementation
of HRIS applications when compared with the solution for each dimension (i.e., each one acts
alone). More of the predictor factors are expected to enter in the regression equation. The findings
of the multiple regression indicate that the combination of the two dimensions (i.e. all 20 factors,
acting together) associated with the level of using HRIS applications. The findings also indicate
that out of the 20 factors, only 10 factors are included in the regression equation. The adjusted R
square for those only 10 factors together is .934, i.e., about 93% of the variation of the level of
using HRIS application is explained by them Table 8.6. Those 10 most important factors included
in the regression equation are in terms of their order of importance: "Social and technology skills",
"Top management willingness to support", "Compatibility", "Perceived advantage", “Complexity”,
" IT experiences and capabilities", "Employment structure", "Organisational resources (facilitating
conditions) ", "Availability of IT suppliers" and "HR strategic role".
Table 8.5: The Stepwise Regression Analysis: Combined Dimension
Factors Step R R
Square
Adjusted
R Square
Beta Sig.
Social and technology skills* 1 .786 .617 .616 .188 .000
Top management willingness to support 2 .865 .749 .747 .165 .000
Compatibility 3 .887 .787 .784 .414 .000
Perceived advantage 4 .915 .837 .834 .323 .000
Complexity 5 .943 .889 .886 .228 .000
IT Experiences and capabilities 6 .947 .897 .894 .112 .000
Employment structure 7 .950 .903 .900 .072 .000
Organisational resources (facilitating
conditions)
8 .952 .906 .903 .089 .015
Availability of IT suppliers 9 .953 .909 .905 .058 .000
HR strategic role 10 .964 .936 .934 .054 .017
*Constant factor
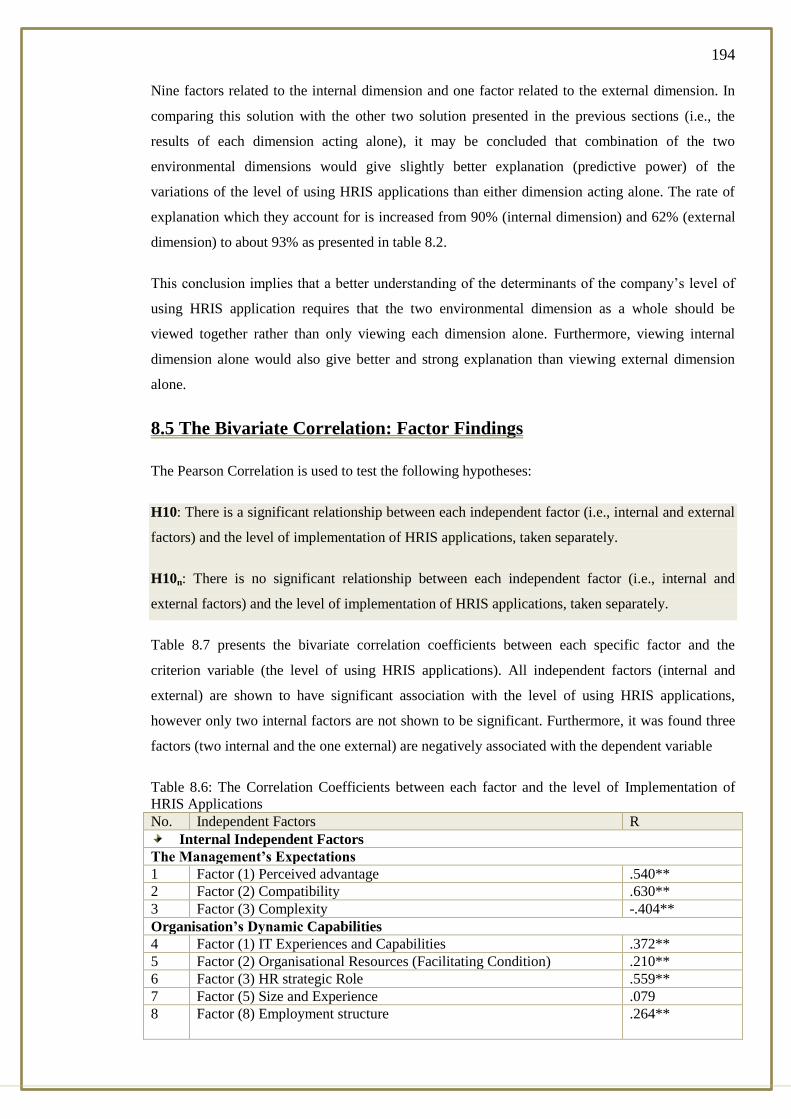
194
Nine factors related to the internal dimension and one factor related to the external dimension. In
comparing this solution with the other two solution presented in the previous sections (i.e., the
results of each dimension acting alone), it may be concluded that combination of the two
environmental dimensions would give slightly better explanation (predictive power) of the
variations of the level of using HRIS applications than either dimension acting alone. The rate of
explanation which they account for is increased from 90% (internal dimension) and 62% (external
dimension) to about 93% as presented in table 8.2.
This conclusion implies that a better understanding of the determinants of the company’s level of
using HRIS application requires that the two environmental dimension as a whole should be
viewed together rather than only viewing each dimension alone. Furthermore, viewing internal
dimension alone would also give better and strong explanation than viewing external dimension
alone.
8.5 The Bivariate Correlation: Factor Findings
The Pearson Correlation is used to test the following hypotheses:
H10: There is a significant relationship between each independent factor (i.e., internal and external
factors) and the level of implementation of HRIS applications, taken separately.
H10n: There is no significant relationship between each independent factor (i.e., internal and
external factors) and the level of implementation of HRIS applications, taken separately.
Table 8.7 presents the bivariate correlation coefficients between each specific factor and the
criterion variable (the level of using HRIS applications). All independent factors (internal and
external) are shown to have significant association with the level of using HRIS applications,
however only two internal factors are not shown to be significant. Furthermore, it was found three
factors (two internal and the one external) are negatively associated with the dependent variable
Table 8.6: The Correlation Coefficients between each factor and the level of Implementation of
HRIS Applications
No. Independent Factors R
Internal Independent Factors
The Management’s Expectations
1 Factor (1) Perceived advantage .540**
2 Factor (2) Compatibility .630**
3 Factor (3) Complexity -.404**
Organisation’s Dynamic Capabilities
4 Factor (1) IT Experiences and Capabilities .372**
5 Factor (2) Organisational Resources (Facilitating Condition) .210**
6 Factor (3) HR strategic Role .559**
7 Factor (5) Size and Experience .079
8 Factor (8) Employment structure .264**
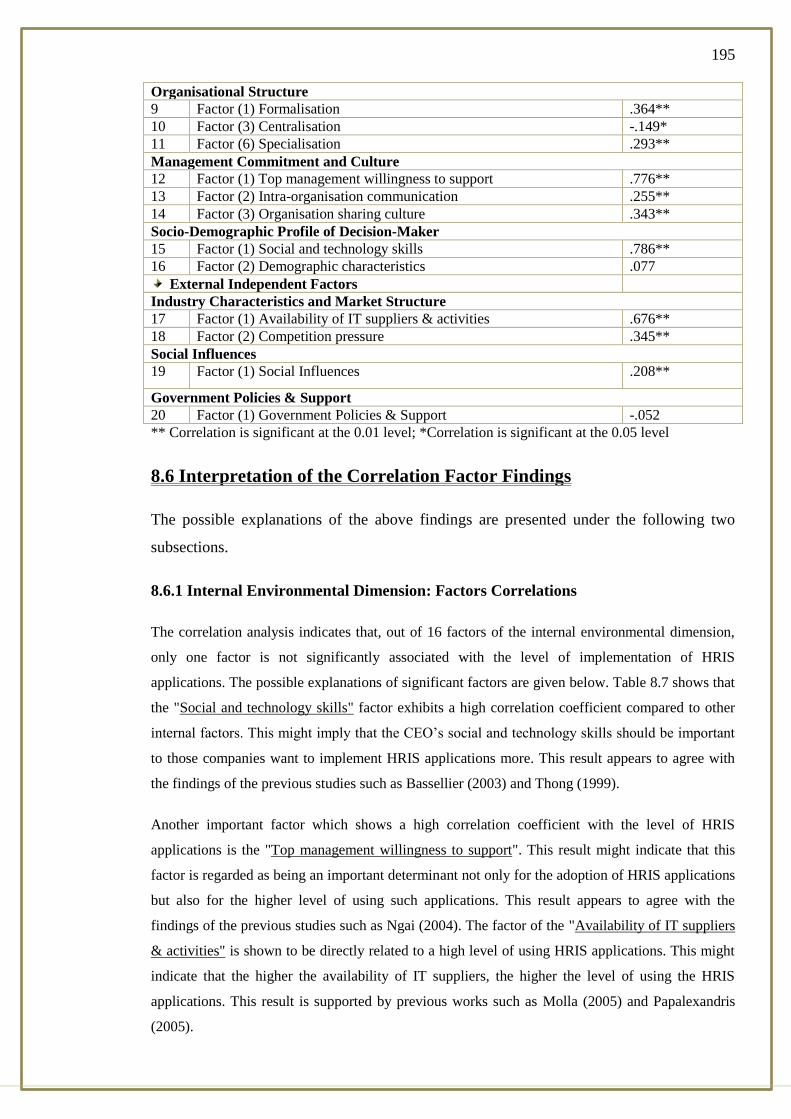
195
Organisational Structure
9 Factor (1) Formalisation .364**
10 Factor (3) Centralisation -.149*
11 Factor (6) Specialisation .293**
Management Commitment and Culture
12 Factor (1) Top management willingness to support .776**
13 Factor (2) Intra-organisation communication .255**
14 Factor (3) Organisation sharing culture .343**
Socio-Demographic Profile of Decision-Maker
15 Factor (1) Social and technology skills .786**
16 Factor (2) Demographic characteristics .077
External Independent Factors
Industry Characteristics and Market Structure
17 Factor (1) Availability of IT suppliers & activities .676**
18 Factor (2) Competition pressure .345**
Social Influences
19 Factor (1) Social Influences .208**
Government Policies & Support
20 Factor (1) Government Policies & Support -.052
** Correlation is significant at the 0.01 level; *Correlation is significant at the 0.05 level
8.6 Interpretation of the Correlation Factor Findings
The possible explanations of the above findings are presented under the following two
subsections.
8.6.1 Internal Environmental Dimension: Factors Correlations
The correlation analysis indicates that, out of 16 factors of the internal environmental dimension,
only one factor is not significantly associated with the level of implementation of HRIS
applications. The possible explanations of significant factors are given below. Table 8.7 shows that
the "Social and technology skills" factor exhibits a high correlation coefficient compared to other
internal factors. This might imply that the CEO’s social and technology skills should be important
to those companies want to implement HRIS applications more. This result appears to agree with
the findings of the previous studies such as Bassellier (2003) and Thong (1999).
Another important factor which shows a high correlation coefficient with the level of HRIS
applications is the "Top management willingness to support". This result might indicate that this
factor is regarded as being an important determinant not only for the adoption of HRIS applications
but also for the higher level of using such applications. This result appears to agree with the
findings of the previous studies such as Ngai (2004). The factor of the "Availability of IT suppliers
& activities" is shown to be directly related to a high level of using HRIS applications. This might
indicate that the higher the availability of IT suppliers, the higher the level of using the HRIS
applications. This result is supported by previous works such as Molla (2005) and Papalexandris
(2005).

196
The "Compatibility" factor is shown to have a direct relationship with the level of implementation
of HRIS. This might indicate that the higher compatibility of HRIS application to the
organisation’s culture, the higher the level of using such application will be. This result appears to
agree with the findings of previous studies (Limthongchai, 2003; Rashid, 2001; Tan, 2000;
Tornatzky, 1982).
The "HR strategic role" factor is also found to be positively correlated with the level of
implementation of HRIS applications. The might indicate that the higher importance attaché to the
role of HR strategic, the higher of using HRIS application. This result is supported by studies such
as Bakker (2011), Bakker and Yorrick (2010) and Lengnick-Hall (2003).
Among the groups of factors which were extracted from the construct of "Management’s
Expectations", the "Perceived advantages" factor was found to be directly related to the level of
implementation of HRIS. This might indicate that the higher perceived the advantages of HRIS
applications are, the higher the level of using such applications will be. This result appears to be in
line with previous studies (Carter, 2004; Jeon, 2006; Kendall, 2001; Limthongchai, 2003).
The "Complexity" factor is found to be negatively associated with the level of implementation of
HRIS applications. This result might indicate that the higher perception of the complexity of HRIS
applications, the lower level of using them will be. This result is supported by studies such as
Rogers (1983) and Tan (2009).
The "IT experiences and capabilities" factor is shown to have a direct relationship with the level of
using HRIS applications. This might indicate the higher availability of IT experiences and
capabilities, the higher the level of implementation of HRIS will be. This result appears to be in
line with Molla (2005) and Papalexandris (2005).
The "Formalisation" factor is found to be positively related with the level of using of HRIS
applications. The might indicate that the higher degree of formalisation of the different activities in
the organisation, the higher will be the level of using the HRIS applications. It appears to be in
agreement with previous works, such as Damanpour (1991), Grover (1993) and Patterson (2003).
The "Organisation sharing culture" factor is also found to be directly correlated with the level of
implementation of HRIS. This result might indicate that a supportive climate and positive
organisational culture, the higher of using HRIS applications will be. This result is supported by
studies such as Drew (2003),Premkumar (2003) and Thong (1995).
The factor of "Specialisation" is shown to be directly related to a high level of using HRIS
applications. This result indicate that the higher degree of specialisation of tasks in organisation,
the higher level of using HRIS applications. This result is supported by previous studies, such as
Damanpour (1991) and Frambach (1993).
197
Another important factor which shows a positive correlation coefficient with the level of HRIS
application is the "Employment structure". This result might indicate that this factor is regarded an
important determinant of the level of using HRIS applications. This result is in agreement with
studies such as Panayotopoulou (2007), Ruël (2004), Shrivastava (2003) and Voermans (2007).
The last important factor, "Centralisation", is shown to be adversely associated with the level of
using HRIS applications. This might indicate that the lower degree of centralisation in the
organisation, the higher of using HRIS applications are expected to be. This result is supported by
Damanpour (1991) and Frambach (1993), who noted that the lack of significance for other factors
(i.e., “Size and experience”, and “CEO’s demographic characteristics”) might be attributed to the
fact that they may be more important to the firm’s HRIS adoption behaviour (i.e. the differences
between adopter and non-adopter) rather than levels of actual use.
8.6.2 External Environmental Dimension: Factors Correlations
The interpretation of the four significant factors of the external environmental dimension is
presented and discussed in terms of their level of the correlations and their level of significance
Table 8.6 as follows:
The "Availability of IT suppliers & activities" factor stands out as the highest external factor
correlated with the level of implementation of HRIS. This might indicate the higher the perception
of the importance attached to the availability of IT suppliers and activities, the higher level of using
HRIS application will be. It is not surprising this factor is found to be crucial to the level of using
HRIS applications, because if the availability of IT suppliers is positively perceived, the level of
using HRIS applications is expected to be at its highest. This result is supported by many previous
studies (Gable, 1991; Morgan, 2006; Nguyen, 2009; Premkumar, 1999; Soh, 1992; Thong, 2001;
Walczuch, 2000).
Another important determinant factor of the level of HRIS application is the "Competition
pressure". This result might indicate that the higher importance attached to the competition
pressure, the higher expectation of using the HRIS applications. It appears to be in agreement with
previous work, such as Gibbs (2004), Hollenstein (2004), Zhu (2003), Scupola (2003) and
Sadowski (2002). The last important factor, "Social influences", is shown to have a direct
association with the level of using HRIS applications. This might indicate that the higher degree of
social networking, the higher of using HRIS application is expected. The lack of significance for
the "Government policies & support" factors might be attributed to the fact that they may be
important in determining the adoption behaviour (i.e., the differences between adopters and non-
adopters) rather the level of implementation of HRIS applications.
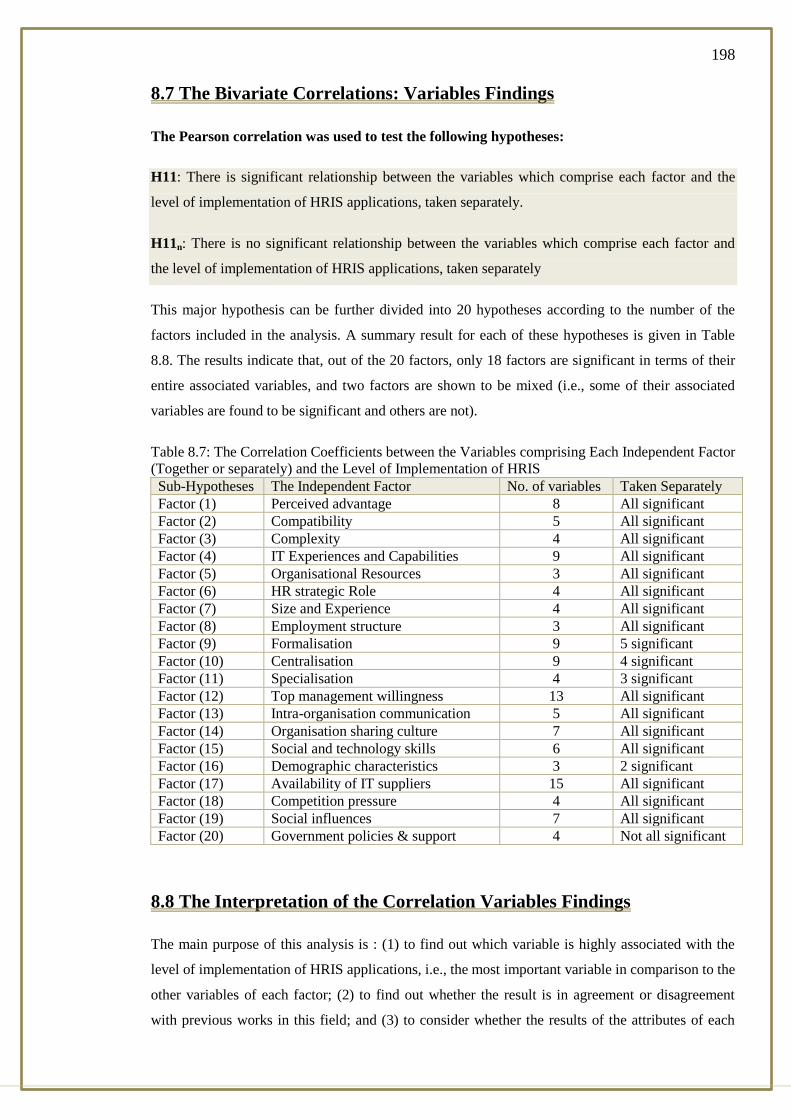
198
8.7 The Bivariate Correlations: Variables Findings
The Pearson correlation was used to test the following hypotheses:
H11: There is significant relationship between the variables which comprise each factor and the
level of implementation of HRIS applications, taken separately.
H11n: There is no significant relationship between the variables which comprise each factor and
the level of implementation of HRIS applications, taken separately
This major hypothesis can be further divided into 20 hypotheses according to the number of the
factors included in the analysis. A summary result for each of these hypotheses is given in Table
8.8. The results indicate that, out of the 20 factors, only 18 factors are significant in terms of their
entire associated variables, and two factors are shown to be mixed (i.e., some of their associated
variables are found to be significant and others are not).
Table 8.7: The Correlation Coefficients between the Variables comprising Each Independent Factor
(Together or separately) and the Level of Implementation of HRIS
Sub-Hypotheses The Independent Factor No. of variables Taken Separately
Factor (1) Perceived advantage 8 All significant
Factor (2) Compatibility 5 All significant
Factor (3) Complexity 4 All significant
Factor (4) IT Experiences and Capabilities 9 All significant
Factor (5) Organisational Resources 3 All significant
Factor (6) HR strategic Role 4 All significant
Factor (7) Size and Experience 4 All significant
Factor (8) Employment structure 3 All significant
Factor (9) Formalisation 9 5 significant
Factor (10) Centralisation 9 4 significant
Factor (11) Specialisation 4 3 significant
Factor (12) Top management willingness 13 All significant
Factor (13) Intra-organisation communication 5 All significant
Factor (14) Organisation sharing culture 7 All significant
Factor (15) Social and technology skills 6 All significant
Factor (16) Demographic characteristics 3 2 significant
Factor (17) Availability of IT suppliers 15 All significant
Factor (18) Competition pressure 4 All significant
Factor (19) Social influences 7 All significant
Factor (20) Government policies & support 4 Not all significant
8.8 The Interpretation of the Correlation Variables Findings
The main purpose of this analysis is : (1) to find out which variable is highly associated with the
level of implementation of HRIS applications, i.e., the most important variable in comparison to the
other variables of each factor; (2) to find out whether the result is in agreement or disagreement
with previous works in this field; and (3) to consider whether the results of the attributes of each

199
factor taken together or separately are similar with respect to the level of implementation of HRIS.
Results of the variables analysis are presented and discussed in terms of each factor to which they
belong, as follows:
The "Perceived Advantages" Factor: Variables Correlations
The "Perceived Advantages" factor is composed of eight variables Table 8.9. The results indicate
that each of these independent variables is related to a high level of implementation of HRIS. An
examination of the direction of the relationship between each variable and dependent variable also
indicates all positively associated with dependent variable. In comparison to other attributes of this
factor, "HRIS will enable our organisation to cut costs in our operations” is shown to the most
attribute related to the higher level of implementation of HRIS. This might indicate that the higher
of management’s expectation to reduce the cost of operation by using HRIS, the higher the level of
implementation of such applications will be. Therefore, it may be concluded that the "perceived
advantage" factor attributes (taken together or separately) are important determinant of the level of
using HRIS application, in particular the ability of HRIS to cut the cost of its operations. The result
is supported by many previous studies (Carter, 2004; Jeon, 2006; Limthongchai, 2003).
Table 8.8: The Correlation Coefficient between the Variables of the “Perceived Advantage” Factor
and the Level of Implementation of HRIS
Code Variables R
RA1 HRIS will enable human resources personnel to accomplish tasks more quickly. .198*
RA6 HRIS will enable our organisation to cut costs in our operations. .476**
RA3 HRIS will make it easier for human resources personnel to do their work. .443**
RA8 HRIS will improve our organisation competitive position. .439**
RA2 HRIS will improve the quality of the work of human resources personnel. .379**
RA4 HRIS will enhance the job effectiveness of Human Resources personnel. .197*
RA7 HRIS will increase the profitability of our organisation. .402**
RA5 HRIS will provide timely information for decision-making. .418**
** Correlation is significant at the 0.01 level; *Correlation is significant at the 0.05 level
The "Compatibility" Factor: Variables Correlations
The "Compatibility" factor consists of five variables Table 8.10. The results indicate that the each
of these variables is shown to have a positive association with the level of implementation of HRIS.
Among the classes of compatibility, "HRIS fits well our organisation beliefs" is found to be the
most important one related to the dependent variable. This implies that the extent of fitness of
HRIS with the organisation’s belief and value is considered an important determinant of a high
level of using it. The attributes of the "Compatibility" factor (taken together or separately) are also
found importantly related to the level of using the HRIS applications. The possible explanation of
this might be the high perception of compatibility of the HRIS with organisation’s beliefs and
value, the higher the level of using it.

200
There is a strong support for this result, indeed, it was revealed by many of the previous studies that
the compatibility of HRIS with organisation’s system will positively determine the firm’s level of
using it (Limthongchai, 2003; Rashid, 2001; Tan, 2000; Tonatzky, 1982).
Table 8.9: The Correlation Coefficient between the Variables of the “Compatibility” Factor and the
Level of Implementation of HRIS
Code Variables R
COM1 The changes introduced by HRIS are compatible with existing operating
practices.
.345**
COM2 Adoption of HRIS is consistent with our organisation’s values and beliefs. .400**
COM3 HRIS is compatible with our organisation’s IT infrastructure. .396**
COM4 HRIS is compatible with our organisation’s computerized data resources. .419**
COM5 HRIS fits well our organisation beliefs. .432**
** Correlation is significant at the 0.01 level; *Correlation is significant at the 0.05 level
The " Complexity " Factor: Variables Correlations
The "Complexity" factor is composed of four variables Table8.11. The results show that all
independent variables are significantly and negatively correlated with of the dependent variable,
the result of the "Complexity" acting as a factor was found to be importantly related to the level of
using HRIS applications. This result is in line with many previous studies (e.g. Rashid, 2001; Teo,
2001).
Table 8.10: The Correlation Coefficient between the Variables of the “Complexity” Factor and the
Level of Implementation of HRIS
Code Variables R
CPX3 HRIS is hard to learn. -.192*
CPX2 HRIS development is a complex process. -.170*
CPX1 HRIS is complex to use. -.162*
CPX4 Integrating HRIS into our current work will be very difficult. .171*
The "IT Experiences and Capabilities" Factor: Variables Correlations
The "IT Experiences and Capabilities" factor is composed of nine independent variables. An
examination of table 8.12 indicates that each of these variables is shown to have a relationship with
the level of using HRIS. When compare with other variables of this factor, the "a specific person
(or group) is available for assistance with HRIS technology" attribute is the most important
determinant of the level of implementation of HRIS applications. It appears that the variability of
IT champion for assistance with IT technology is an important for using HRIS. Also, the attributes
of this factor as taken together are found to be importantly related to a high level of implementation
of HRIS. Therefore, it may be concluded that the attributes of this factor are important
determinants of the level of using HRIS. This result is supported by many studies (Molla, 2005;
Papalexandris, 2005).

201
Table 8.11: The Correlation Coefficient between the Variables of the “IT Experiences and
Capabilities” Factor and the Level of Implementation of HRIS
Code Variables R
IT2 Human resources personnel’s’ understanding of computers is good compared
with other organisations in the industry.
.336**
IT5 Our employees possess abilities to use computer to solve problems. .409**
IT1 A specific person (or group) is available for assistance with HRIS technology .432**
IT7 We have a good quality of IT infrastructure. .378**
IT6 Our employees can learn new technologies easily. .313**
IT8 Availability or adequacy of existing technology and tools. .364**
IT9 Access to network services or infrastructure to support Web and Internet
Technologies.
.338**
IT4 All human resources personnel are computer literate. .408**
IT3 There is at least one computer expert in the human resources department. .369**
** Correlation is significant at the 0.01 level; *Correlation is significant at the 0.05 level
The "Organisational Resources (Facilitating Conditions) " Factor: Variables
Correlations
The firm’s "Organisational resources" factor consists of three variables Table 8.13. The results
reveal that each of these variables is found to be directly associated with the level of
implementation of HRIS. This result might indicate that the higher available of internal facilitating
conditions in the organisation (i.e., human resources, financial and technology resources), the
higher the use of HRIS applications. This result is highly supported by studies such as Walczuch
(2000) and Nguyen (2009).
Table 8.12: The Correlation Coefficient between the Variables of the “Organisational Resources
(Facilitating Conditions)” Factor and the Level of Implementation of HRIS
Code Variables R
ORF1 We have sufficient human resources necessary to use/adopt HRIS technology. .397**
ORF2 We have the knowledge necessary to use/adopt HRIS technology. .430**
ORF3 We have sufficient financial support to use/adopt HRIS technology. .415**
** Correlation is significant at the 0.01 level; *Correlation is significant at the 0.05 level
The " HR strategic Role" Factor: Variables Correlations
As shown in Table 8.14, the "HR strategic role" factor consists of four attributes. The result of
Pearson correlation indicates that each of attribute is directly and positively associated with the
level of using HRIS applications except one: "the HR actively participates in changing the
organisation". The explanation might be attributed to the weak role of participation of HRM in
some investigated organisations. The results also indicate that taken these attributes together are
stronger than taken each one separately. This result still needs further investigation.

202
Table 8.13: The Correlation Coefficient between the Variables of the “HR Strategic Role” Factor
and the Level of Implementation of HRIS
Code Variables R
SR2 The HR actively participates in listening and reacting to employees (employee
champion).
.442**
SR1 The HR is highly involved in strategic decision making (strategic partner). .366**
SR4 The HR has an explicit HR strategy. .463**
SR3 The HR actively participates in changing the organisation (Change agent). .083
** Correlation is significant at the 0.01 level; *Correlation is significant at the 0.05 level
The " Size & Experience " Factor: Variables Correlations
As can be seen in Table 8.15, the "Size and experience" factor consists of four variables: number of
IT technical specialists, number of employees in the organisation, "Number of HR employees", and
number of years in business (experience). The result indicates that each of these variables is
directly correlated with the level of using HRIS applications. The number of HR employees is the
most important attribute that correlated with the dependent variable (i.e., the level of using HRIS).
However, these attributes of this factor are shown to be insignificant when taken together. This
might be due the different types of business which considered firms undertake.
Table 8.14: The Correlation Coefficient between the Variables of the “Size & Experience” Factor
and the Level of Implementation of HRIS
Code Variables R
SZE3 Number of IT technical specialists. .235**
SZE1 Number of employees in the organisation. .177*
SZE4 Number of HR employees. .294**
.
SZE2 Number of years in business (experience). .208**
** Correlation is significant at the 0.01 level; *Correlation is significant at the 0.05 level.
The " Employment Structure " Factor: Variables Correlations
The "Employment structure" is composed of three variables, as presented in Table 8.16. The results
indicate that only two independent variables are correlated with the level of implementation of
HRIS. The variables insignificantly associated with the level of using HRIS are the "cumulative
percentage of graduate and postgraduate in the organisation". The results also indicate that the
"percentage of female employees in the organisation" is positively associated with the level of
implementation of HRIS while "the percentage of employees who are older than 45 years" at the
organisation is negatively associated with level of using HRIS applications.
However, the attributes of this factor taken together are found to be more related to a high level of
using HRIS application rather than taken them separately. This result needs further investigation.
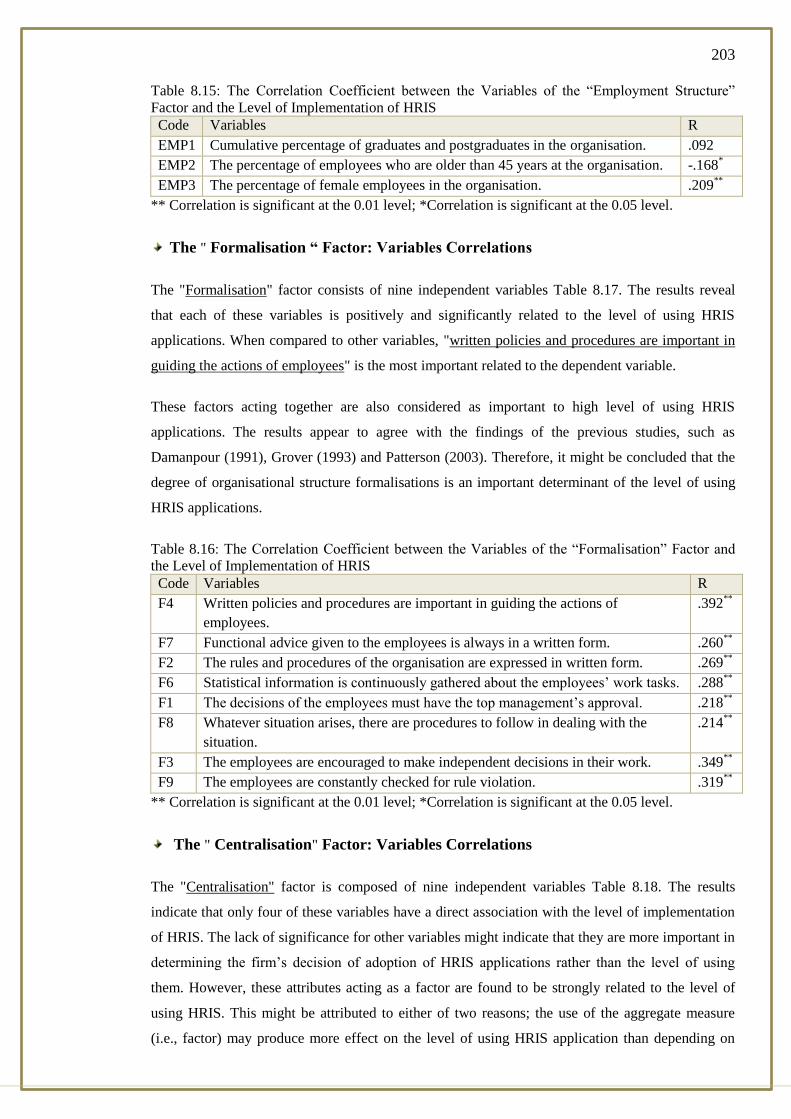
203
Table 8.15: The Correlation Coefficient between the Variables of the “Employment Structure”
Factor and the Level of Implementation of HRIS
Code Variables R
EMP1 Cumulative percentage of graduates and postgraduates in the organisation. .092
EMP2 The percentage of employees who are older than 45 years at the organisation. -.168*
EMP3 The percentage of female employees in the organisation. .209**
** Correlation is significant at the 0.01 level; *Correlation is significant at the 0.05 level.
The " Formalisation “ Factor: Variables Correlations
The "Formalisation" factor consists of nine independent variables Table 8.17. The results reveal
that each of these variables is positively and significantly related to the level of using HRIS
applications. When compared to other variables, "written policies and procedures are important in
guiding the actions of employees" is the most important related to the dependent variable.
These factors acting together are also considered as important to high level of using HRIS
applications. The results appear to agree with the findings of the previous studies, such as
Damanpour (1991), Grover (1993) and Patterson (2003). Therefore, it might be concluded that the
degree of organisational structure formalisations is an important determinant of the level of using
HRIS applications.
Table 8.16: The Correlation Coefficient between the Variables of the “Formalisation” Factor and
the Level of Implementation of HRIS
Code Variables R
F4 Written policies and procedures are important in guiding the actions of
employees.
.392**
F7 Functional advice given to the employees is always in a written form. .260**
F2 The rules and procedures of the organisation are expressed in written form. .269**
F6 Statistical information is continuously gathered about the employees’ work tasks. .288**
F1 The decisions of the employees must have the top management’s approval. .218**
F8 Whatever situation arises, there are procedures to follow in dealing with the
situation.
.214**
F3 The employees are encouraged to make independent decisions in their work. .349**
F9 The employees are constantly checked for rule violation. .319**
** Correlation is significant at the 0.01 level; *Correlation is significant at the 0.05 level.
The " Centralisation" Factor: Variables Correlations
The "Centralisation" factor is composed of nine independent variables Table 8.18. The results
indicate that only four of these variables have a direct association with the level of implementation
of HRIS. The lack of significance for other variables might indicate that they are more important in
determining the firm’s decision of adoption of HRIS applications rather than the level of using
them. However, these attributes acting as a factor are found to be strongly related to the level of
using HRIS. This might be attributed to either of two reasons; the use of the aggregate measure
(i.e., factor) may produce more effect on the level of using HRIS application than depending on
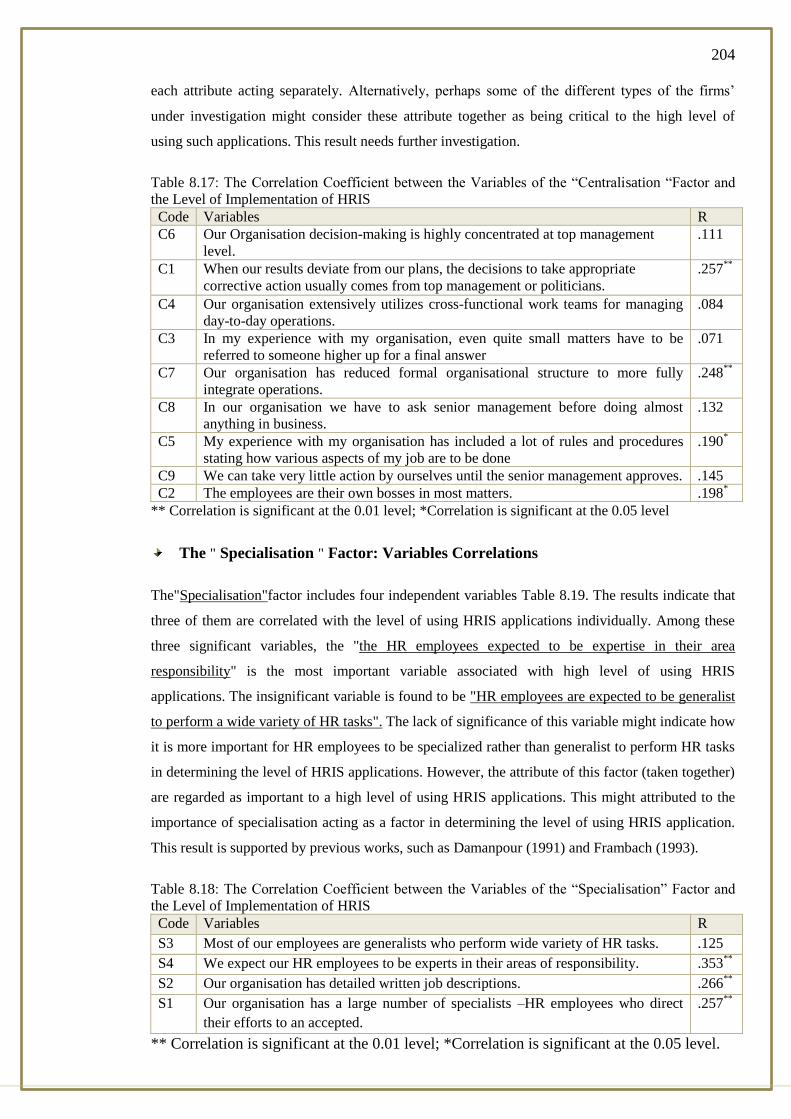
204
each attribute acting separately. Alternatively, perhaps some of the different types of the firms’
under investigation might consider these attribute together as being critical to the high level of
using such applications. This result needs further investigation.
Table 8.17: The Correlation Coefficient between the Variables of the “Centralisation “Factor and
the Level of Implementation of HRIS
Code Variables R
C6 Our Organisation decision-making is highly concentrated at top management
level.
.111
C1 When our results deviate from our plans, the decisions to take appropriate
corrective action usually comes from top management or politicians.
.257**
C4 Our organisation extensively utilizes cross-functional work teams for managing
day-to-day operations.
.084
C3 In my experience with my organisation, even quite small matters have to be
referred to someone higher up for a final answer
.071
C7 Our organisation has reduced formal organisational structure to more fully
integrate operations.
.248**
C8 In our organisation we have to ask senior management before doing almost
anything in business.
.132
C5 My experience with my organisation has included a lot of rules and procedures
stating how various aspects of my job are to be done
.190*
C9 We can take very little action by ourselves until the senior management approves. .145
C2 The employees are their own bosses in most matters. .198*
** Correlation is significant at the 0.01 level; *Correlation is significant at the 0.05 level
The " Specialisation " Factor: Variables Correlations
The"Specialisation"factor includes four independent variables Table 8.19. The results indicate that
three of them are correlated with the level of using HRIS applications individually. Among these
three significant variables, the "the HR employees expected to be expertise in their area
responsibility" is the most important variable associated with high level of using HRIS
applications. The insignificant variable is found to be "HR employees are expected to be generalist
to perform a wide variety of HR tasks". The lack of significance of this variable might indicate how
it is more important for HR employees to be specialized rather than generalist to perform HR tasks
in determining the level of HRIS applications. However, the attribute of this factor (taken together)
are regarded as important to a high level of using HRIS applications. This might attributed to the
importance of specialisation acting as a factor in determining the level of using HRIS application.
This result is supported by previous works, such as Damanpour (1991) and Frambach (1993).
Table 8.18: The Correlation Coefficient between the Variables of the “Specialisation” Factor and
the Level of Implementation of HRIS
Code Variables R
S3 Most of our employees are generalists who perform wide variety of HR tasks. .125
S4 We expect our HR employees to be experts in their areas of responsibility. .353**
S2 Our organisation has detailed written job descriptions. .266**
S1 Our organisation has a large number of specialists –HR employees who direct
their efforts to an accepted.
.257**
** Correlation is significant at the 0.01 level; *Correlation is significant at the 0.05 level.
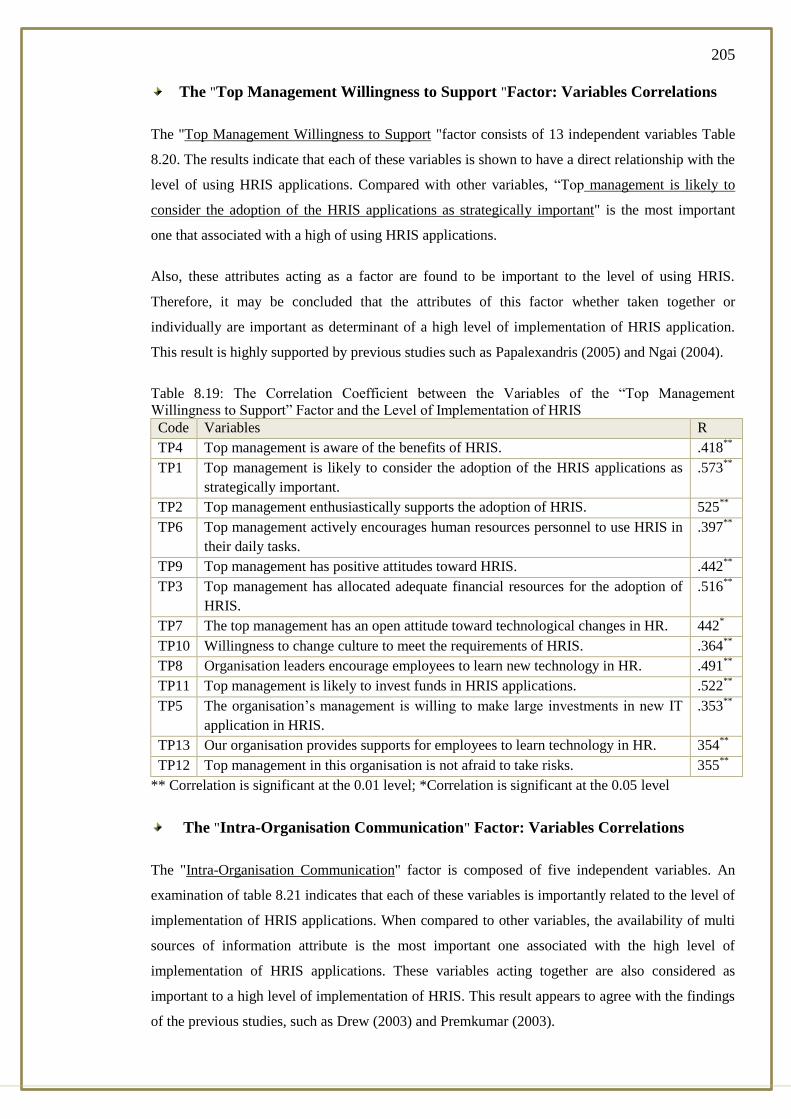
205
The "Top Management Willingness to Support "Factor: Variables Correlations
The "Top Management Willingness to Support "factor consists of 13 independent variables Table
8.20. The results indicate that each of these variables is shown to have a direct relationship with the
level of using HRIS applications. Compared with other variables, “Top management is likely to
consider the adoption of the HRIS applications as strategically important" is the most important
one that associated with a high of using HRIS applications.
Also, these attributes acting as a factor are found to be important to the level of using HRIS.
Therefore, it may be concluded that the attributes of this factor whether taken together or
individually are important as determinant of a high level of implementation of HRIS application.
This result is highly supported by previous studies such as Papalexandris (2005) and Ngai (2004).
Table 8.19: The Correlation Coefficient between the Variables of the “Top Management
Willingness to Support” Factor and the Level of Implementation of HRIS
Code Variables R
TP4 Top management is aware of the benefits of HRIS. .418**
TP1 Top management is likely to consider the adoption of the HRIS applications as
strategically important.
.573**
TP2 Top management enthusiastically supports the adoption of HRIS. 525**
TP6 Top management actively encourages human resources personnel to use HRIS in
their daily tasks.
.397**
TP9 Top management has positive attitudes toward HRIS. .442**
TP3 Top management has allocated adequate financial resources for the adoption of
HRIS.
.516**
TP7 The top management has an open attitude toward technological changes in HR. 442*
TP10 Willingness to change culture to meet the requirements of HRIS. .364**
TP8 Organisation leaders encourage employees to learn new technology in HR. .491**
TP11 Top management is likely to invest funds in HRIS applications. .522**
TP5 The organisation’s management is willing to make large investments in new IT
application in HRIS.
.353**
TP13 Our organisation provides supports for employees to learn technology in HR. 354**
TP12 Top management in this organisation is not afraid to take risks. 355**
** Correlation is significant at the 0.01 level; *Correlation is significant at the 0.05 level
The "Intra-Organisation Communication" Factor: Variables Correlations
The "Intra-Organisation Communication" factor is composed of five independent variables. An
examination of table 8.21 indicates that each of these variables is importantly related to the level of
implementation of HRIS applications. When compared to other variables, the availability of multi
sources of information attribute is the most important one associated with the high level of
implementation of HRIS applications. These variables acting together are also considered as
important to a high level of implementation of HRIS. This result appears to agree with the findings
of the previous studies, such as Drew (2003) and Premkumar (2003).

206
Table 8.20: The Correlation Coefficient between the Variables of the “Intra-Organisation
Communication” Factor and the Level of Implementation of HRIS
Code Variables R
INT1 Availability of multi sources of information, encourage us to use /adopt HRIS
applications.
.386**
INT2 The quality of communication channel types in our organisation encourage us
use /adopt HRIS applications.
.355**
INT3 Our organisation has built database of related technologies in HRIS .335**
INT4 Our vision of HRIS activities is widely communicated and understood
throughout the organisation.
.377**
INT5 Employees in our organisation can share knowledge with each other. .324**
** Correlation is significant at the 0.01 level; *Correlation is significant at the 0.05 level
The "Organisation Sharing Culture" Factor: Variables Correlations
The "Organisation Sharing Culture "factor is composed of seven independent variables. An
examination of Table 8.22 indicates that each of these variables is importantly related to the level
of implementation of HRIS applications. When compared to other variables, "the corporate culture
of the organisation toward innovation and change "attribute is the most important one associated
with the high level of implementation of HRIS applications. These variables acting as a factor are
also considered as important to a high level of implementation of HRIS. This result appears to
agree with the findings of the previous studies, such as Drew (2003), Premkumar (2003) and Thong
(1995).
Table 8.21: The Correlation Coefficient between the Variables of the “Organisation Sharing
Culture” Factor and the Level of Implementation of HRIS
Code Variables R
OS2 Our organisation values emphasized collaboration and support. .405**
OS5 The willingness of the organisation to tolerate risk and failure.
OS3 The corporate culture of the Organisation toward innovation and change. .489**
OS4 In our organisation, we believe that a new technology in HR achieve efficiency in
managerial process.
.260**
OS6 Our employees accommodate themselves very quickly to technological changes. .322**
OS1 The history, value, norms supporting adoption of Innovative technology such as
HRIS applications in the organisations.
.306**
OS7 HRM plays an important strategic role in the organisation. .478**
** Correlation is significant at the 0.01 level; *Correlation is significant at the 0.05 level
The "Social and Technology Skills" Factor: Variables Correlations
The CEO’s "Social and Technology Skills" factor consists of six independent variables, as
presented in Table 8.23. The results indicate that each of these variables is shown to have a direct
relationship with the level of using HRIS applications. Compared with other variables, "The CEO’s
decision making style for IT adoption tend to be people oriented rather than work oriented”. Is the
most important one that associated with a high of using HRIS applications.

207
Also, these attributes acting as a factor are found to be important to the level of using HRIS.
Therefore, it may be concluded that the attributes of this factor whether taken together or
individually are important as determinant of a high level of implementation of HRIS application.
This result is supported by previous studies (Bassellier, 2003; Murphy, 2003; Robbins, 1994;
Thong, 1999; Wu, 2008).
Table 8.22: The Correlation Coefficient between the Variables of the “Social and Technology
Skills” Factor and the Level of Implementation of HRIS
Code Variables R
STS5 The CEO management’s actions show support for the use of new technology. .469**
STS6 The CEO has the ability to gain consensus on ideas. .407**
STS4 The CEO management’s visibility and exhibited commitment to adoption of IT
applications.
.429**
STS2 The CEO’s extent social network skills compared to other people in similar
positions.
.363**
STS1 The CEO’s extent of technical and knowledge of IT compared to other people in
similar positions.
.504**
STS3 The CEO’s decision making style for IT adoption tends to be people oriented
rather than work oriented.
588**
** Correlation is significant at the 0.01 level; *Correlation is significant at the 0.05 level
The " Demographic Characteristics " Factor: Variables Correlations
The CEO’s "Demographic Characteristics" factor consists of three types of demographics: age,
business experience, and education level. An examination of Table 8.24 indicates that "age" is the
only variable not associated with the level of using HRIS applications. The lack of significance for
this variable might be related to be the firm’s decision to adopt HRIS. Furthermore these attributes
acting together are found to be insignificant. Therefore, it can be concluded that the age of
managers is not significantly related to the high level of HRIS either taken alone or with other
demographic characteristics of CEO (i.e., education and experience). This result is supported by
Thong and Yab (1995).
Table 8.23: The Correlation Coefficient between the Variables of the “Demographic
Characteristics” Factor and the Level of Implementation of HRIS
Code Variables R
DS1 Age -.154
DS Business experience .240**
DS2 Educational level .315**
** Correlation is significant at the 0.01 level; *Correlation is significant at the 0.05 level.
The "Availability of IT Suppliers & Activities" Factor: Variables Correlations
The "Availability of IT suppliers & activities” factor is composed of fifteen independent variables.
An examination of Table 8.25 indicates that each of these variables is shown to have a relationship
with the level of using HRIS. When compared with other variables of this factor, the
"Accessibility, usefulness, and cost of external know-how from agencies" attribute is the most

208
important determinant of the level of implementation of HRIS applications. It appears that
accessibility, usefulness, and cost of external know-how from agencies, with IT technology, are
important for using HRIS.
Also, the attributes of this factor as taken together are found to be importantly related to a high
level of implementation of HRIS. Therefore, it may be concluded that the attributes of this factor
are important determinants of the level of using HRIS. This result is supported by many studies
(Gable, 1991; Morgan, 2006; Nguyen, 2009; Premkumar, 1999; Soh, 1992; Thong, 2001;
Walczuch, 2000).
Table 8.24: The Correlation Coefficient between the Variables of the “Availability of IT
Suppliers & Activities” Factor and the Level of Implementation of HRIS
Code Variables R IND1 IT solutions availability motivates us to adopt IT applications. .252
**
IND2 External consultant support encourages us to adopt HRIS applications. .233**
IND3 Local vendor supports in terms of quality of technical encourages us to adopt
HRIS. .244
**
IND7 We can usually find help quickly when having questions on how to work with
these applications. .357
**
IND4 Availability and quality of IT infrastructure in local market encourages us to
adopt IT applications. .227
**
IND5 The availability of external know-how concerning IT applications is important
to use HRIS in our organisation. .226
**
IND6 The cost of internet communications encourages us to use HRIS applications. .260**
IND12 Accessibility, usefulness, and cost of external know-how from agencies. .370
**
IND8 We can use specialists hired from outside the organisation to control our
resources during HRIS adoption. .297
**
IND10 The availability of qualified human resources locally encourages our
organisation to use HRIS. .242
**
IND11 The availability of capital encourages us to extend the use of HRIS. .243**
IND13 The extent of change agents’ promotion efforts motivates us to use HRIS. .353
**
IND9 Technological diffusion in HRIS is quite large in our area of business. .253**
IND14 The quality of industrial relations encourages our organisation to adopt HRIS. 311
*
IND15 The quality of local work force encourages our organisation to use IT
applications in HRM. .292
**
IND11 The availability of capital encourages us to extend the use of HRIS. .267**
** Correlation is significant at the 0.01 level; *Correlation is significant at the 0.05 level
The “Competition Pressure " Factor: Variables Correlations
The "Competition Pressure" factor is composed of four independent variables. An examination of
Table (8.26) indicates that each of these variables is shown to have a relationship with the level of
using HRIS. Also, the attributes of this factor as taken together are found to be importantly related
to a high level of implementation of HRIS. Therefore, it may be concluded that the attributes of
competition pressure are important determinants of the level of using HRIS. This result is
supported by many studies such as Hollenstein (2004), Zhu (2003) and Sadowski (2002).
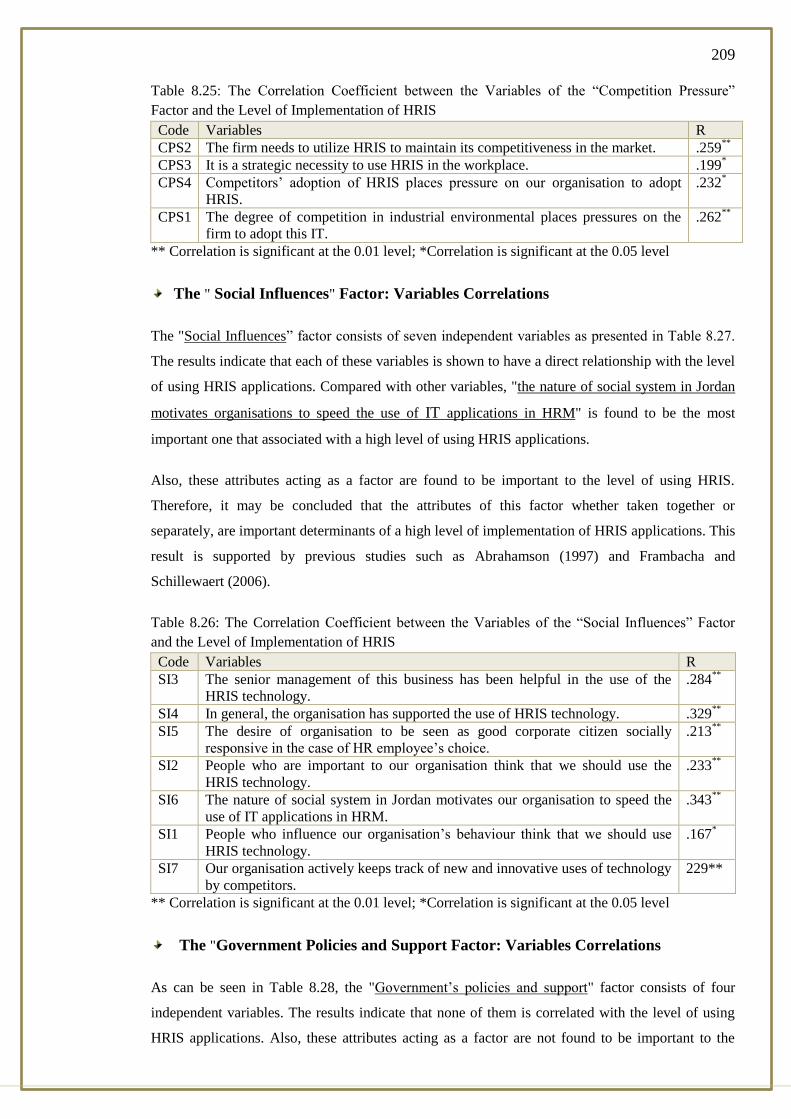
209
Table 8.25: The Correlation Coefficient between the Variables of the “Competition Pressure”
Factor and the Level of Implementation of HRIS
Code Variables R
CPS2 The firm needs to utilize HRIS to maintain its competitiveness in the market. .259**
CPS3 It is a strategic necessity to use HRIS in the workplace. .199*
CPS4 Competitors’ adoption of HRIS places pressure on our organisation to adopt
HRIS.
.232*
CPS1 The degree of competition in industrial environmental places pressures on the
firm to adopt this IT.
.262**
** Correlation is significant at the 0.01 level; *Correlation is significant at the 0.05 level
The " Social Influences" Factor: Variables Correlations
The "Social Influences” factor consists of seven independent variables as presented in Table 8.27.
The results indicate that each of these variables is shown to have a direct relationship with the level
of using HRIS applications. Compared with other variables, "the nature of social system in Jordan
motivates organisations to speed the use of IT applications in HRM" is found to be the most
important one that associated with a high level of using HRIS applications.
Also, these attributes acting as a factor are found to be important to the level of using HRIS.
Therefore, it may be concluded that the attributes of this factor whether taken together or
separately, are important determinants of a high level of implementation of HRIS applications. This
result is supported by previous studies such as Abrahamson (1997) and Frambacha and
Schillewaert (2006).
Table 8.26: The Correlation Coefficient between the Variables of the “Social Influences” Factor
and the Level of Implementation of HRIS
Code Variables R
SI3 The senior management of this business has been helpful in the use of the
HRIS technology.
.284**
SI4 In general, the organisation has supported the use of HRIS technology. .329**
SI5 The desire of organisation to be seen as good corporate citizen socially
responsive in the case of HR employee’s choice.
.213**
SI2 People who are important to our organisation think that we should use the
HRIS technology.
.233**
SI6 The nature of social system in Jordan motivates our organisation to speed the
use of IT applications in HRM.
.343**
SI1 People who influence our organisation’s behaviour think that we should use
HRIS technology.
.167*
SI7 Our organisation actively keeps track of new and innovative uses of technology
by competitors.
229**
** Correlation is significant at the 0.01 level; *Correlation is significant at the 0.05 level
The "Government Policies and Support Factor: Variables Correlations
As can be seen in Table 8.28, the "Government’s policies and support" factor consists of four
independent variables. The results indicate that none of them is correlated with the level of using
HRIS applications. Also, these attributes acting as a factor are not found to be important to the

210
level of implementation HRIS. It can be concluded that government policies and supports are not
important determinant of the level of Using HRIS either taken together or separately. This result
needs further investigation.
Table 8.27: The Correlation Coefficient between the Variables of the “Government Policies and
Support” Factor and the Level of Implementation of HRIS
Code Variables R
GP2 The positive attitudes of government toward adoption of IT technology
applications in business.
.099
GP4 Adequate training programs offered by government to the area of IT
applications.
.080
GP3 Adequate financial aids from government (e.g. tax deduction, tariffs, financial
subsidy) to adopt IT applications.
.033
GP1 The availability of government security and protection to adopt and use IT
applications.
.050
** Correlation is significant at the 0.01 level; *Correlation is significant at the 0.05 level.
8.9 The Multiple Regression Findings: Effectiveness of HRIS
Multiple regression analysis technique was used to examine the following hypotheses:
H12: There is significant relationship between the level of implementation of HRIS applications
and the perceived component of the HRIS effectiveness measures (operational/administrative
effectiveness and relational effectiveness and transformational/strategic effectiveness), taken
together.
H12n: There is no significant relationship between the level of implementation of HRIS
applications and the perceived component of the HRIS effectiveness measures
(operational/administrative effectiveness and relational effectiveness and transformational/strategic
effectiveness), taken together.
H13: There is a significant relationship between the level of implementation of HRIS applications
and the perceived component of the HRIS effectiveness measures (operational/administrative
effectiveness and relational effectiveness and transformational/strategic effectiveness), taken
separately.
H13n: There is no significant relationship between the level of implementation of HRIS
applications and the perceived component of the HRIS effectiveness measures
(operational/administrative effectiveness and relational effectiveness and transformational/strategic
effectiveness), taken together.
The main objective of analysis here is to understand the extent to which HRIS is being used in
enhancing administrative, relational and strategic roles of the HR department A summary of the
results of multiple regression analysis, with the F-ratio test, for the first above hypothesis is
presented in Table 8.29. The results indicate that there is a significant and positive relationship
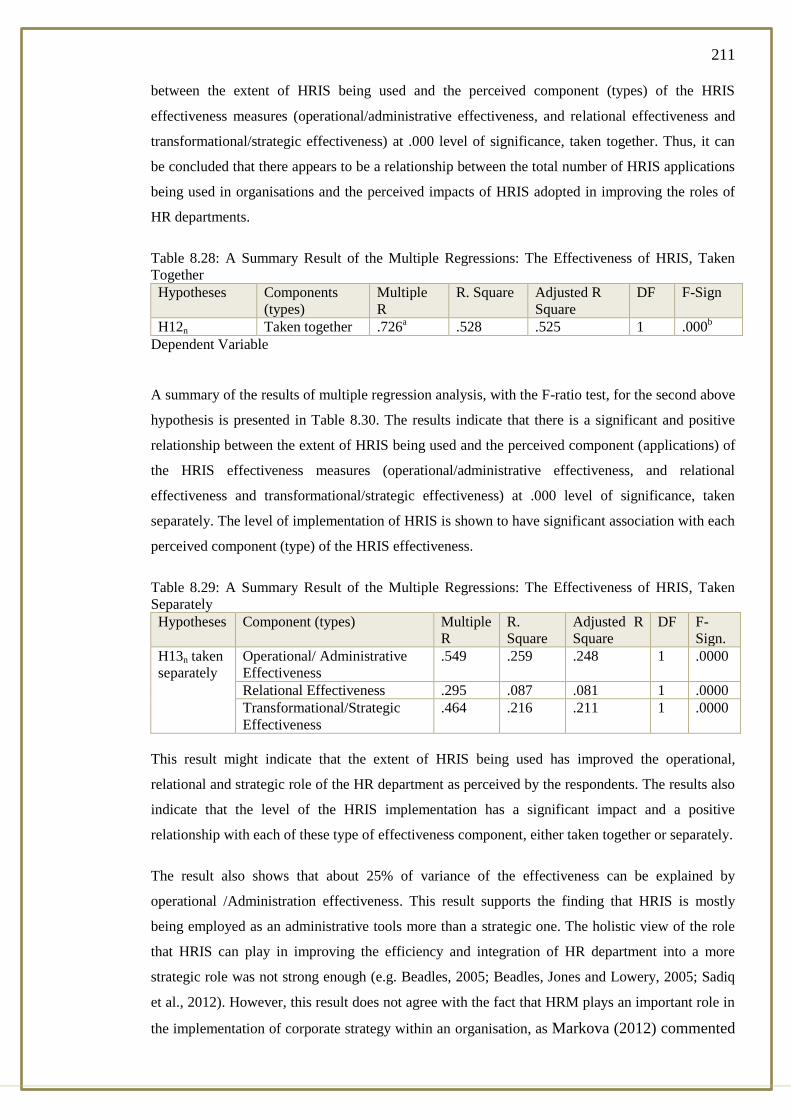
211
between the extent of HRIS being used and the perceived component (types) of the HRIS
effectiveness measures (operational/administrative effectiveness, and relational effectiveness and
transformational/strategic effectiveness) at .000 level of significance, taken together. Thus, it can
be concluded that there appears to be a relationship between the total number of HRIS applications
being used in organisations and the perceived impacts of HRIS adopted in improving the roles of
HR departments.
Table 8.28: A Summary Result of the Multiple Regressions: The Effectiveness of HRIS, Taken
Together
Hypotheses Components
(types)
Multiple
R
R. Square Adjusted R
Square
DF F-Sign
H12n Taken together .726a .528 .525 1 .000
b
Dependent Variable
A summary of the results of multiple regression analysis, with the F-ratio test, for the second above
hypothesis is presented in Table 8.30. The results indicate that there is a significant and positive
relationship between the extent of HRIS being used and the perceived component (applications) of
the HRIS effectiveness measures (operational/administrative effectiveness, and relational
effectiveness and transformational/strategic effectiveness) at .000 level of significance, taken
separately. The level of implementation of HRIS is shown to have significant association with each
perceived component (type) of the HRIS effectiveness.
Table 8.29: A Summary Result of the Multiple Regressions: The Effectiveness of HRIS, Taken
Separately
Hypotheses Component (types) Multiple
R
R.
Square
Adjusted R
Square
DF F-
Sign.
H13n taken
separately
Operational/ Administrative
Effectiveness
.549 .259 .248 1 .0000
Relational Effectiveness .295 .087 .081 1 .0000
Transformational/Strategic
Effectiveness
.464 .216 .211 1 .0000
This result might indicate that the extent of HRIS being used has improved the operational,
relational and strategic role of the HR department as perceived by the respondents. The results also
indicate that the level of the HRIS implementation has a significant impact and a positive
relationship with each of these type of effectiveness component, either taken together or separately.
The result also shows that about 25% of variance of the effectiveness can be explained by
operational /Administration effectiveness. This result supports the finding that HRIS is mostly
being employed as an administrative tools more than a strategic one. The holistic view of the role
that HRIS can play in improving the efficiency and integration of HR department into a more
strategic role was not strong enough (e.g. Beadles, 2005; Beadles, Jones and Lowery, 2005; Sadiq
et al., 2012). However, this result does not agree with the fact that HRM plays an important role in
the implementation of corporate strategy within an organisation, as Markova (2012) commented

212
that “for a long time, HRM has been seen as a key functional area that assures strategy
implementation”.
8.10 The Bivariate Correlations: Effectiveness Variables Findings
The Pearson correlation was used to test the following hypotheses:
H14: There is a significant relationship between the level of implementation of HRIS applications
and the variables which comprise each factor of its effectiveness measures, taken separately.
H14n: There is no significant relationship between the level of implementation of HRIS
applications and the variables which comprise each factor of its effectiveness measures, taken
separately.
Respondents who reported that their organisation had adopted HRIS (either fully or partially) were
asked to indicate their perceptions of the influence of HRIS implementation level on their
organisations. This major hypothesis (i.e. H14/H14n) can be further divided into three sub-
hypotheses according to the number of the types of effectiveness (i.e., Operational/administrative
effectiveness, and relational effectiveness and transformational/strategic effectiveness) included in
the analysis. A summary result of bivariate analysis for each of these hypotheses is given in section
(8.7). It specifically examines the operational impacts, improvements in organisational
relationships, and the transformational impacts of HRIS. Many of the arguments articulated for the
benefits of adopting IT in the HR function can be grouped within these three broad categories
(factors).
8.10.1 The "Operational/Administrative Effectiveness" Factor: Variables
Correlations
The "Operational/administrative effectiveness" factor is composed of nine variables Table 8.31.
The results indicate that the extent of HRIS being used has a positive correlation with each variable
of this factor. This result might indicate that the level of using HRIS is significantly enhancing the
operational role of HR department.
In comparison to other attributes of this factor, the "HRIS has improved HR operating efficiency"
is shown to be the attribute most related to the higher level of implementation of HRIS. Therefore,
it may be concluded that the “Operational/administrative effectiveness” factor attributes (taken
together or separately) could be enhanced in an organisation by the extent to which HRIS
applications being used, in particular the ability of HRIS to enhance the operating efficiency of HR
department. The result is supported by many previous studies such a (Kumari, P.V. 2013) and
,Thompson, S. H., Teo, Lim, Ghee, Soon, Sherin, Ann, & Fedric. (2012).

213
Table 8.30: The Correlation Coefficient between the Level of Implementation of HRIS and the
variables of “Operational/Administrative Effectiveness” Factor
No. Items (variables) Mean F. ratio
OP1 The HRIS has improved effectiveness of HR department by automating
administrative tasks/ automated record keeping and other clerical duties. 4.28 .535**
OP2 The HRIS has improved HR operating efficiency. 4.32 .578**
OP3 The HRIS has more accurate HR information. 4.28 .544**
OP4 The HRIS has more up-to-date HR information. 4.28 .496**
OP5 Has lowered administrative headcount in the HR department/ lowered
HR operating costs. 4.22 .552**
OP6 The HRIS has made HR administration more streamlined 4.17 .562**
OP7 The HRIS has better tracking of employee information. 4.17 .554**
OP8 The HRIS has reduced in paperwork. 4.14 .574**
OP9 The HRIS has eliminated duplication. 4.15 .573**
8.10.2 The “Relational Effectiveness” Factor: Variables Correlations
As can be seen in Table 8.32, the “Relational effectiveness” factor consists of ten variables. The
results indicate that each of them is correlated with the level of using HRIS applications. Also,
these attributes acting as a factor are t found to be important to the level of implementation HRIS.
It can be concluded that “Relational effectiveness” in organisation can be enhanced by the extent of
HRIS being used.
Table 8.31: The Correlation Coefficient between the Level of Implementation of HRIS and the
variables of “Relational effectiveness “Factor
No. Items (variables) Mean F.
ratio
RL1 The HRIS has reduced response times to serve our customers or
clients. 3.85 .462**
RL2 The HRIS improved employee awareness, appreciation, and use of HR
programs. 3.88 .602**
RL3 The HRIS has improved working relationships with upper
management. 3.75 .510**
RL4 The HRIS has improved line managers’ ability to meet HR
responsibilities. 3.88 .601**
RL5 The HRIS has enhanced our ability to recruit and retain top talent. 3.74 .534**
RL6 The HRIS has improved quality and timeliness of services to
employees. 3.77 .489**
RL7 The HRIS has received HR staff acceptance. 3.80 .517**
RL8 The HRIS has empowered employees and managers to make more
decisions on their own about needs. 3.69 .533**
RL9 The HRIS has improved relationships with citizens and business and
HR. 3.67
.568**
RL10 The HRIS has better co-ordination among the different functional
areas in the organisation. 3.72 .564**
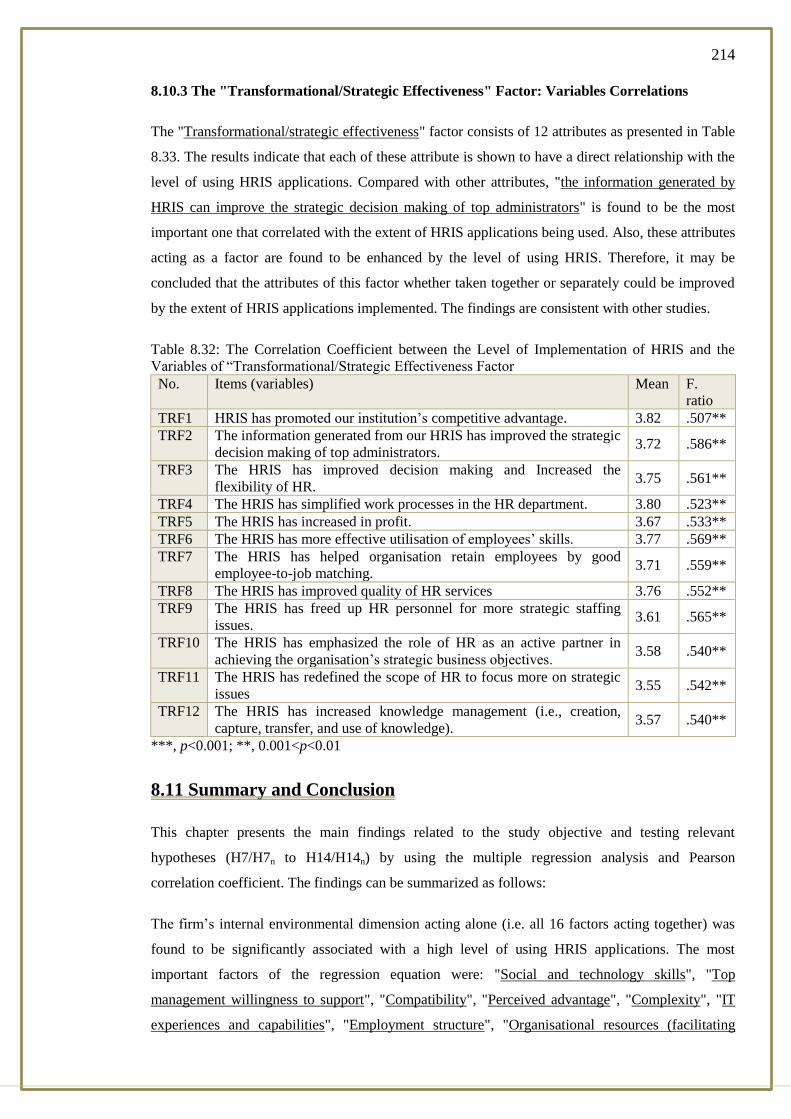
214
8.10.3 The "Transformational/Strategic Effectiveness" Factor: Variables Correlations
The "Transformational/strategic effectiveness" factor consists of 12 attributes as presented in Table
8.33. The results indicate that each of these attribute is shown to have a direct relationship with the
level of using HRIS applications. Compared with other attributes, "the information generated by
HRIS can improve the strategic decision making of top administrators" is found to be the most
important one that correlated with the extent of HRIS applications being used. Also, these attributes
acting as a factor are found to be enhanced by the level of using HRIS. Therefore, it may be
concluded that the attributes of this factor whether taken together or separately could be improved
by the extent of HRIS applications implemented. The findings are consistent with other studies.
Table 8.32: The Correlation Coefficient between the Level of Implementation of HRIS and the
Variables of “Transformational/Strategic Effectiveness Factor
No. Items (variables) Mean F.
ratio
TRF1 HRIS has promoted our institution’s competitive advantage. 3.82 .507**
TRF2 The information generated from our HRIS has improved the strategic
decision making of top administrators. 3.72 .586**
TRF3 The HRIS has improved decision making and Increased the
flexibility of HR. 3.75 .561**
TRF4 The HRIS has simplified work processes in the HR department. 3.80 .523**
TRF5 The HRIS has increased in profit. 3.67 .533**
TRF6 The HRIS has more effective utilisation of employees’ skills. 3.77 .569**
TRF7 The HRIS has helped organisation retain employees by good
employee-to-job matching. 3.71 .559**
TRF8 The HRIS has improved quality of HR services 3.76 .552**
TRF9 The HRIS has freed up HR personnel for more strategic staffing
issues. 3.61 .565**
TRF10 The HRIS has emphasized the role of HR as an active partner in
achieving the organisation’s strategic business objectives. 3.58 .540**
TRF11 The HRIS has redefined the scope of HR to focus more on strategic
issues 3.55 .542**
TRF12 The HRIS has increased knowledge management (i.e., creation,
capture, transfer, and use of knowledge). 3.57 .540**
***, p<0.001; **, 0.001<p<0.01
8.11 Summary and Conclusion
This chapter presents the main findings related to the study objective and testing relevant
hypotheses (H7/H7n to H14/H14n) by using the multiple regression analysis and Pearson
correlation coefficient. The findings can be summarized as follows:
The firm’s internal environmental dimension acting alone (i.e. all 16 factors acting together) was
found to be significantly associated with a high level of using HRIS applications. The most
important factors of the regression equation were: "Social and technology skills", "Top
management willingness to support", "Compatibility", "Perceived advantage", "Complexity", "IT
experiences and capabilities", "Employment structure", "Organisational resources (facilitating
215
conditions) " , and "HR strategic role". The adjusted R square result indicated that about (.904) of
the variation on the dependent variable level of using HRIS application should be explained by
above significant factor, acting together.
The firm’s external environmental dimension acting alone (i.e. four factors acting together) was
found to be significantly associated with a high level of using HRIS applications. The most
important factors of the regression equation were: "Availability of IT suppliers", "Competition
pressure" and "Social influences". The adjusted R square result indicated that about (.617) of the
variation on the dependent variable level of using HRIS application should be explained by above
significant factor, acting together.
Comparing between the previous two findings, it might be concluded that variation of the extent of
HRIS being used is more explained by factors inside the boundary of the firm, i.e., the firm’s
internal environmental dimension than its external environmental dimensions.
The combination of the two dimensions (i.e., all 20 factors acting together) was found to be
significantly related to a high level of using HRIS applications. Nine factors were included in the
regression equation: "Social and technology skills", "Top management willingness to support",
"Compatibility", "Perceived advantage", "Complexity", "IT experiences and capabilities",
"Employment structure", "Organisational resources (facilitating conditions) ", "Availability of IT
suppliers" and "HR strategic role". The adjusted R square result indicated that about (90%) of the
variation on the dependent variable level of using HRIS application could be explained by above
significant factor, acting together.
Of the 20 explanatory independent factors, only three were found to be insignificantly associated
with the level of using HRIS applications: "Demographic", "Size and experience", and
"Government policies and support".
The results of the relationship between the variables constituting each independent factor and the
level of using HRIS application were presented and discussed.
The combinations of three factors for measuring HRIS effectiveness (namely
transformational/strategic; operational/administrative; and relational) accounted for .726 of the total
variance in the questionnaire data. The influence of the scope of HRIS applications on the three
factors of HRIS effectiveness was investigated. The regression analysis indicates that the scope of
HRIS applications moderate and positively influences the three factors of HRIS effectiveness,
either taken together or separately. This result is supported by the previous studies such as Cathcart
(1999), Kovach et al. (2002) and Reddick (2009). The results also showed that the variations in
HRIS effectiveness were not due to the type of business sectors, but were related only to the
"Transformational/strategic effectiveness" factor. This might indicate that some type of business

216
sectors apply HRIS applications more than others for strategic purposes. However, the size of the
organisation did show any significant variations in the HRIS effectiveness. This result might
indicate that the size of organisations does not play an important role on the impact of the HRIS on
the HR functions. Finally, the results revealed that the business organisations which have a higher
experience felt the HRIS improves and enhances HR functions (i.e., operational, relational, and
strategic effectiveness) more than others with lower business experience. In other words, it was
found that the impact of HRIS applications on the effectiveness of HR functions can be achieved
for organisations by time.
This result indicates that the extent of HRIS being used has improved the operational, relational
and strategic role of the HR department as perceived by the respondents. The results also indicate
that the level of the HRIS implementation has a significant impact and a positive relationship with
each of these type of effectiveness component, either taken together or separately.
In the next chapter, the conclusion, theoretical and practical contributions, and future studies are
discussed and presented.
217
SUMMARY, CONCLUSIONS, CONTRIBUTIONS CHAPTER 9: AND FUTURE STUDIES
9.1 Summary
In this research investigated the influence of the firm’s internal and external environmental
measures upon its adoption behaviour and the level of implementation of HRIS applications. The
specific objectives of this study have been explicitly presented in the first chapter. The main focus
of this study was to gain an insight into the current status of HRIS adoption in organisations in
Jordan, the determinants of the adoption of HRIS, the level of using it and its effectiveness.
In order to achieve the study objectives, and to conduct the research in a systematic approach, a
conceptual framework was developed. The conceptual framework ties together the major factors
proposed to influence the firm’s adoption level of implementing HRIS applications. The key
constructs were presented under the two broad dimensions of internal and external.
The firm’s internal environmental dimension was proposed under five major constructs:
Management’s Expectations.
Organisation’s Dynamic Capabilities.
Organisational Structure.
Management’s Commitment and Corporate Culture.
Socio-Demographic Profile of the Decision Maker.
The firm’s external environment dimension was suggested under three major constructs:
Industry Characteristics and Market Structure.
Social Influences.
Government Policies and Support.
The research design is based upon 14 hypotheses regarding the adoption, implementation and
effectiveness of HRIS. The data for this research were collected through structured-directed
interview with 236 respondents. The target respondents were shareholding companies in Jordan,
and the key respondent approach was employed.
Since the aspects of reliability and validity have become prerequisite to any empirical study
conducted in the spirit of scientific research, it was decided to test the reliability and validity of all
the variables generated for investigation. Therefore, the internal consistency reliability and content
validity of the variables included in the survey were tested via the correlation alpha method.
Primary data were analysed using a variety of multivariate statistical techniques, including stepwise
multiple, regression statistical technique, discriminant function analysis, the Jacknife and Split-Half

218
methods for validating the DFA functions, correlation analysis (using the Pearson Correlation
Coefficient), the chi-square test, the Univariate F-ratio test, McNemar test and the t-test.
The findings of this study have been presented and discussed in detail in chapters 6, 7 and 8.
Chapter 6 outlined the main findings of a factor analysis (i.e., the factors that underlie each
construct of the internal and external dimensions). Chapter 7 dealt with the determinants of the
firm’s adoption behaviour (i.e., adopters versus non-adopters), and chapter 8 was devoted to the
determinants of the firm’s level of implementing HRIS applications and its effectiveness.
In conclusion, the author presents here how the current research objectives have been realized in
light of the previous elaborated discussion of results and the extent of the applicability of HRIS
models in Jordan as a non-western country.
9.2 Main Conclusions of the Research Findings
Twenty factors were extracted from the eight major constructs of the internal and external
environmental dimensions. Sixteen of them were derived from the five constructs of the internal
dimension: management’s expectations (3 factors), organisation’s dynamic capabilities (5 factors),
organisational structure (3 factors), management’s commitment and corporate culture (3 factors)
and "socio-demographic characteristics (2 factors). The other four factors were extracted from the
three constructs of the external dimension: industry characteristics and market structure (2 factors)
social influences (1 factor) and government policies and support (1 factor). These 20 factors were
successfully identified and labelled, and subsequently used to answer the research questions by
using regression and discriminant analysis.
The analysis provides empirical evidence that the integration approach of the firm’s internal and
external environmental factors better explains not only the prediction of adoption of HRIS
behaviour (i.e., classification of adoption group membership), but also of the prediction of the level
of using HRIS applications(implementation level). This result supports the theories of the firm’s IT
adoption behaviour, which stresses that organisational behaviour is inseparably linked to the
environment in which it takes place. Therefore, a better understanding of adoption IT behaviour (or
HRIS implementation level) requires that the firm’s environmental factors to be viewed as a whole
(i.e., the interaction of internal and external environments) rather than isolated fragments (e.g., only
a single environmental dimension).
The results indicate that factors existing within the firm (internal environment) are more critical for
its level of implementation of HRIS than those related to its external environment. Furthermore, in
order to adopt such HR system, the internal factors are also more important than those existing in
external environment.

219
The study’s findings show that factors determining the firm’s level of implementing HRIS are quite
different from the ones that distinguish adopters from non-adopters at the aggregate level. For
example, while the perceived "government policies and support" factor is not shown to be
importantly related to the level of implementing of HRIS, it is regarded as one of the most
important external factors that distinguish adopters from non-adopters. This result is of particular
importance to public policy decision-makers who want to encourage firms to become involved in
injecting such IT systems in their operations. Similarly, while the level of HRIS implementation is
moderately influenced by "IT experience and capabilities" factor in the internal environment, it was
not important to the decision of adopting HRIS. The moderate explanatory power of the extent of
HRIS implementation model suggests that there may be other factors which need to be included to
better explain the diffusion of the HRIS. Furthermore, the results indicate that some factors are
shown to be unimportant to the decision of adopting and implementing of HRIS applications such
as centralisation, formalisation, intra-organisational communication, organisational sharing culture,
and demographic characteristics factors. These results support the study’s model in that there are
differences between the main factors influencing the adoption of HRIS and the main factors
influencing the implementation of HRIS applications at the aggregate level. Table 9.1 shows a
summary of the main factors influencing the adoption and implementation of HRIS applications in
terms of their order of importance at the aggregate level.
The study’s findings also show that factors determining the firm’s adoption of HRIS are somewhat
different from the ones determining the implementation of HRIS applications at the individual level
(i.e., taken separately). For example, while the perceived "complexity" factor was not shown to be
importantly related to the level of implementing of HRIS, it was regarded as one of the important
internal factors that distinguish the adopters’ group from the non-adopters’ group; when taken
separately. Moreover, while the "organisational resources" factor was proved important to
distinguish the adopters’ group from non-adopters’ group of HRIS, it was not regarded as an
important factor in determining the implementation of HRIS applications. Furthermore, the results
indicate that the "size and experience", "intra-organisational communication" and "demographic
characteristics" as internal factors were not regarded important determinants either to the decision
of adoption of HRIS, or to the implementation of HRIS applications.
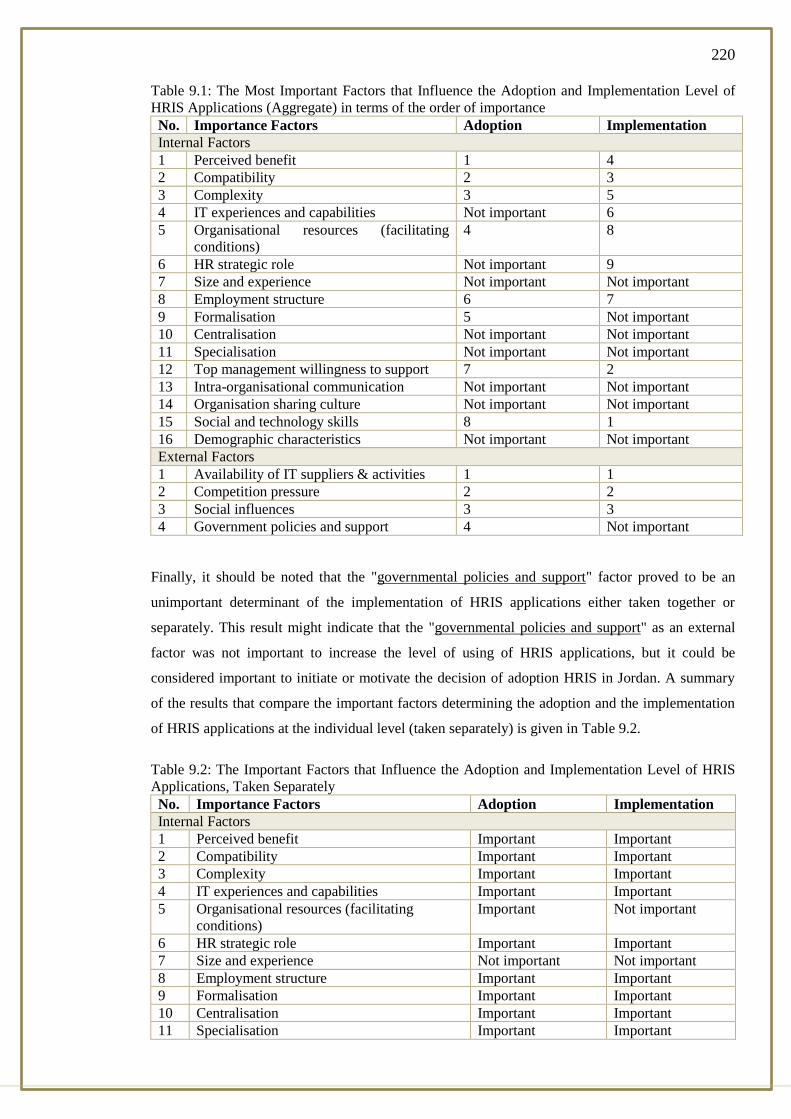
220
Table 9.1: The Most Important Factors that Influence the Adoption and Implementation Level of
HRIS Applications (Aggregate) in terms of the order of importance
No. Importance Factors Adoption Implementation
Internal Factors
1 Perceived benefit 1 4
2 Compatibility 2 3
3 Complexity 3 5
4 IT experiences and capabilities Not important 6
5 Organisational resources (facilitating
conditions)
4 8
6 HR strategic role Not important 9
7 Size and experience Not important Not important
8 Employment structure 6 7
9 Formalisation 5 Not important
10 Centralisation Not important Not important
11 Specialisation Not important Not important
12 Top management willingness to support 7 2
13 Intra-organisational communication Not important Not important
14 Organisation sharing culture Not important Not important
15 Social and technology skills 8 1
16 Demographic characteristics Not important Not important
External Factors
1 Availability of IT suppliers & activities 1 1
2 Competition pressure 2 2
3 Social influences 3 3
4 Government policies and support 4 Not important
Finally, it should be noted that the "governmental policies and support" factor proved to be an
unimportant determinant of the implementation of HRIS applications either taken together or
separately. This result might indicate that the "governmental policies and support" as an external
factor was not important to increase the level of using of HRIS applications, but it could be
considered important to initiate or motivate the decision of adoption HRIS in Jordan. A summary
of the results that compare the important factors determining the adoption and the implementation
of HRIS applications at the individual level (taken separately) is given in Table 9.2.
Table 9.2: The Important Factors that Influence the Adoption and Implementation Level of HRIS
Applications, Taken Separately
No. Importance Factors Adoption Implementation
Internal Factors
1 Perceived benefit Important Important
2 Compatibility Important Important
3 Complexity Important Important
4 IT experiences and capabilities Important Important
5 Organisational resources (facilitating
conditions)
Important Not important
6 HR strategic role Important Important
7 Size and experience Not important Not important
8 Employment structure Important Important
9 Formalisation Important Important
10 Centralisation Important Important
11 Specialisation Important Important
221
12 Top management willingness to support Important Important
13 Intra-organisation communication Important important
14 Organisation sharing culture Important Important
15 Social and technology skills Important Important
16 Demographic characteristics Not important Not important
External Factors
1 Availability of IT suppliers and activities Important Important
2 Competition pressure Important Important
3 Social influences Important Important
4 Government policies and support Important Not important
9.2.1 The Determinants of the Firm’s Adoption Behaviour: The Finding of the first
objective
The results obtained from applications of the Split Half and Jacknife to the validity of the
discriminant functions of the three sets of dimension (i.e., internal, external, and combined) provide
strong evidence that each of these discriminant functions is a valid model in discriminating
between adopters and non-adopters (for more details, see Chapter Seven).
The application of Discriminant Function Analysis indicated that there is a strong relationship
between the values of 16 factors of the internal dimension and the classification of the adoption
HRIS group membership. The analysis shows that the internal factors are able to correctly classify
(93.2%) of the population of the study into the adopter and non-adopter groups. This result should
represent a primary concern for organisations who want to adopt HRIS, since by comparing
themselves with those already involved in adopting HRIS they can implement the required changes
within their organisations.
The Discriminant Function Analysis shows that there is also a relationship between the four factors
of the external dimension and the classification of the adoption of HRIS group membership. The
analysis shows that the external factors are able to correctly classify (86.4%) of the same
population into adopters and non-adopter groups.
Comparison between the solutions produced by the internal and external dimensions in respect of
the classification of adoption group membership shows that the factors related to the internal
processes of the firms are more critical in the adoption of HRIS applications than the external ones.
This is in line with other adoption behaviour studies (Teo et al., 2007; Krishna, 2011; Kundu and
Kadian, 2012; Saharan and Jafri, 2012; Samkarpad, 2013; Al-dmour, et al 2013;Al-dmour, et al
2014). This study indicates that the real barriers to adoption of HRIS are more related to the aspects
under the control of the organisation.
The integration approach of the internal and external dimension provides empirical evidence that
adoption behaviour is better predicted by the combination (interaction) of these dimensions than by
each dimension acting alone. The analysis shows that the addition of the four factors of the external

222
dimension to the sixteen factors of the internal dimensions produces a significant improvement in
the classification of group membership, and is able to correctly classify about (97%) of the same
population as adopters or non-adopters. This result supports the behaviour theories of the firm,
which suggest that organisational behaviour is a function of the interaction of the firm’s internal
and external environments. It also gives a better understanding of adoption of IT behaviour by
viewing the organisation as a whole rather than isolated fragments (previous studies largely
covered the internal environment).
The analysis of the discriminant analysis function also shows that out of the twenty factors of the
combination, twelve factors could be considered as significant discriminators between adopters and
non-adopters. These twelve factors comprise eight factors of the internal environmental dimension
and four of the external.
With regard to the factors related to the internal environmental dimension, the eight most important
factors, in descending order of importance, are: (1) "Perceived advantage” (2) "Compatibility" (3)
"Complexity" (4) "Organisation resources" (5) "Formalisation" (6) "Employment structure" (7)
"Top management willingness to support", and (8) "Social and technology skills".
The four most important factors related to the firm’s external environmental dimension in
descending order of importance are: (1) "Availability of IT suppliers and activities"(2)
"Competition pressure" (3) "Social influences" and (4) "Government policies and support".
Individual analysis of the attributes of 20 factors shows significant differences between the results
of taking attributes together (i.e., as a factor) in respect of the differentiating between the adopters’
group and the non-adopters’ group. The possible explanations for this disagreement of results
might be attributed to two factors; the use of the aggregate measure here (i.e., the factor) may
produce more power than in case of using each attribute acting alone, and secondly the different
types of the business organisations under investigation. Some of these types might regard these
attributes taken together as being essential in order to adopt HRIS applications. The research
findings support previous work in this area (Ngai and Wat, 2004; Chong et al., 2009; Al-dmour et
al, (2014).
The study also aimed to identify whether there are any similarities or differences in the
characteristics of the business organisations which adopted HRIS and those which did not, in terms
of their internal and external environmental factors attributes. Findings indicate that there are
significant differences between the adopters and non-adopters in terms of their internal
environmental factors attributes, either taken together or separately. This result implies that it is
possible to differentiate between the two groups (adopters and non-adopters) in terms of their
internal environmental attributes descending order of importance: (1) "Perceived advantage" (2)
"Compatibility" (3) "Complexity" (4) "Organisation’s resources" (5) "Formalisation" (6)

223
"Employment structure" (7) "Top management willingness to support", and (8) "Social and
technology skills". This result is supported by previous studies such as CedarCrestone (2005),
Panayotopoulou et al. (2006) and Teo et al. (2007). This finding is significant because previous
studies on adoption of IT innovations by business organisations have tended to focus on internal
organisational factors separately, without taking them together.
The findings indicate that there are significant differences between the adopters and non-adopters
in terms of their external environmental factors attributes, either taken together or separately. This
result implies that it is possible to discriminate between the two groups (adopters and non-adopters)
in terms of their external environmental factors. In descending order of importance: (1)
"Availability of IT suppliers and activities" (2) "Competition pressure" (3) "Social influences ", and
(4) " Government policies and support". This supports previous studies such as Ngai and Wat
(2004) Boon et al. (2009).
The results demonstrate the greater relative importance of internal organisational factors to the
decision of adopting HRIS. This highlights the importance of organisational initiatives to facilitate
the adoption of new technologies. "Top management support", for example, was found to influence
the decision to adopt HRIS as well as moderately impact the extent of HRIS implementation. This
study also provides some information regarding the criteria (compatibility etc.) that adopters utilize
to evaluate decisions regarding adoption and extent of implementation of HRIS. Hence, change
agents such as HRIS vendors and champions should tailor their HRIS demonstrations, marketing
efforts and training programs to emphasize these criteria. Knowing which criteria are important for
adoption and for diffusion enables change agents to employ more targeted implementation efforts
at each phase of the adoption process, enhancing the efficiency and effectiveness of adoption.
9.2.2 The Determinants of the Level of Implementation of HRIS Applications: The
findings of the Second objective
The measure of extent of HRIS implementation is the type of applications used in the organisation.
In this study, the uses of HRIS for ten HRM activities were identified Table 9.3. These were
selected as they were the most common applications frequently mentioned in HRIS books and HR
journals. Findings indicate (9.3) that the extent of HRIS being practiced is considered to be
moderate (i.e. 70% or 3.51%). Since their means are more than the mean of the scale, which is 3
(Mean of the scale = Σ Degrees of the scale / 5 = 1+2+3+4+5 / 5 = 3) Table 9.3. This implies that
there are some variations among business organisations in terms of their level of implementing of
HRIS applications. This might be due to the fact that some of the managements of these business
organisations would prefer to use these applications for administrative rather than strategic
purposes. This result is consistent with previous work, as many surveys on HRIS have found that
HRIS is more commonly used for administrative purposes like employee record-keeping and
payroll rather than for strategic purposes (Ngai and Wat, 2006;Ball, 2001; Kovach et al., 2002 ;

224
Hussain et al., 2007;Delorme and Arcand, 2010; Masum et al., 2013; Al-dmour, 2014). In this
context, Ball (2001), Ngai and Wat (2006) and Kovach et al.(2002) argue that HRIS should not
only be designed to automate HRM activities to gain administrative advantages; rather, it should
also be used for decision-making and to provide strategic advantages for organisations.
However, Kundu and Kadian (2012) reported that many studies have shown that companies have
started using sophisticated HRIS applications for training and development, performance
management, compensation management and corporate communication (CedarCrestone, 2006; De
Alwis, 2010; ; Saharan and Jafri, 2012;Masum, et al. 2013). CedarCrestone (2006) in HCM
Surveys on US companies broadened the scope of HRIS applications. Administrative HRIS was
still the most popular application (62%), and companies reported an increasing use of strategic
applications, including for talent acquisition services (61%), performance management (52%) and
compensation management (49%) (CedarCrestone, 2009). De Alwis (2010) in his study on Sri
Lankan industry shows that the most commonly used modules in HR department are training and
development, recruitment and selection, and performance appraisal, which were being utilized by
all the companies in the sample.
Table 9.3: HRIS Applications
HRIS applications Mean Standard deviation
Employee record-keeping 4.42 .701
Recruitment/selection 4.20 .855
Payroll service and benefits 3.99 .774
Benefits management 3.45 .765
Training and development 4.11 .824
Performance appraisal /reward management 3.80 .876
Compensation management 3.37 1.166
Turnover tracking/job analysis 3.27 .988
Internal and external communication 3.20 .876
Succession HR planning 3.15 .804
Average *3.51
A recent study on Indian companies also found that HR professionals had major applications of
HRIS as recruitment and selection (67.2% and 71.9%, respectively), pay roll service (67.2%),
providing general information (67.2%), compensation (67.2%), performance appraisal (62.5%) as
well as job analysis and design (62.5%) (Saharan and Jafri, 2012; Al-dmour, et al., 2014). Also,
HRIS was found to be widely deployed in corporate communication (48.2%) (Saharan and Jafri,
2012). The most popular future applications of HRIS had been predicted as training and
development (72.5%), career development (60.8%) and performance appraisal/management
(58.8%), as indicated by (Teo et al., 2001). There appears to be a shift towards strategic
applications of HRIS. The possible reason could be that most of the organisations which have been
using HRIS for some years now want to explore wider possibilities of strategic HRIS applications
225
over the next few years, both in order to streamline and enhance organisational processes and to
increase the ROI from the original HRIS adoption (Teo et al., 2001).
The application of the Stepwise Multiple Regression analysis indicates that external factors are
important determinants of the level of implementing HRIS applications, in addition to its internal
environmental factors. This result is of particular importance to business’ decision-makers, to
identify the types of change required within their organisations in order to enhance the degree of
using HRIS applications.
By the integration of the firm’s internal environmental factors (i.e., 16 factors), only nine factors
are shown to be significantly related to the firm’s extent of HRIS applications being used. In
descending order of importance, they are: (1) "Social and technology skills" (2) "Top management
willingness to support" (3) "Compatibility" (4) "Perceived advantage" (5) "Complexity" (6) "IT
experiences and capabilities" (7) "Employment structure" (8) "Organisational resources (facilitating
conditions) " , and (9) "HR strategic role". The empirical evidence supports the impact of internal
organisational factors that act as antecedent factors in influencing the implementation of HRIS
applications. Thus, the study adds to the literature on internal organisational factors influencing the
implementation of HRIS applications that needs more emphasis (Delone and McLean, 2003).
By the integration of the firm’s external environment factors (four factors), only three factors are
shown to be significantly related to the level of implementation of HRIS applications. In
descending order of importance, they are: (1) "Availability of IT suppliers" (2) "Competition
pressure", and (3) "Social influences".
The research results indicate that the internal environmental dimension produces better explanation
of the variation of the level of implementing of HRIS applications than the external environmental
dimension. In other words, internal factors are more critical to the firm’s level of implementing of
HRIS applications than external ones. This result is of central concern for business decision-makers
to consider any changes or actions with regard to their HR current statues in order to improve their
level of using HRIS applications.
Integration of the internal and external dimensions (20 factors) produces a better prediction and
explanation of the variation of the level of implementing of HRIS applications than in case each
dimension acting alone. The results show that (96.4%) of variance in the level of implementation of
HRIS applications could be explained by this combination, while the internal and external
dimensions individually could only explain (92.5%) and (79%) of the variance (respectively). This
provides empirical evidence that the level of implementing of HRIS applications could be better
explained through the combination of internal and external organisational factors.
226
Individual analysis of the attributes of the internal and external factors (20 factors) shows some
differences from the aggregate analysis in regard to the implementation level of HRIS applications.
The possible explanations for this disconnect might be attributed either to the use of the aggregate
measure (i.e., factor) which may produce more power than in case each of their attributes acting
alone, or perhaps the different types of industrial firms under investigation. Some of these types
might consider these attributes taken together as being critical in order to improve their level of
implementing of HRIS applications.
The analysis shows that out of 20 factors, all the attributes of fourteen factors and some attributes
of five factors are important to the level of implementation of HRIS applications (for more details
see Chapter 8). This potentially allows identification of necessary changes that organisations can
make to improve the level of implementing of HRIS applications. For example, compared to other
attributes in the” IT experiences and capabilities" factor, a specific person (or group) is available
for assistance with HRIS technology to a high level of implementation of HRIS applications. This
implies that companies which want to improve their level of implementation of HRIS applications
might need to have a specific person (or group) with HRIS technology .
While many of this study’s findings support previous research, the results of the following two
attributes and two factors are found to be in conflict: (1) "government policies and support", and
(2) the "percentage of graduate employees", Little or no relationship was found between these
factors and HRIS adoption by previous studies (Fillis et al., 2003; Kovach et al. 2007; Lai, Wan
and Hooi, 2006; Ngai and Wat, 2006; Panayotopoulou, 2005).
(Figure 9.1) (Below) illustrates the research model adjusted according to independent variables’ R
square value. Each significant variable within the internal and external factors is listed in a
descending order reflecting its significance in implementing HRIS. In addition, R square values are
presented for the internal factors taken together and the external factors taken together.
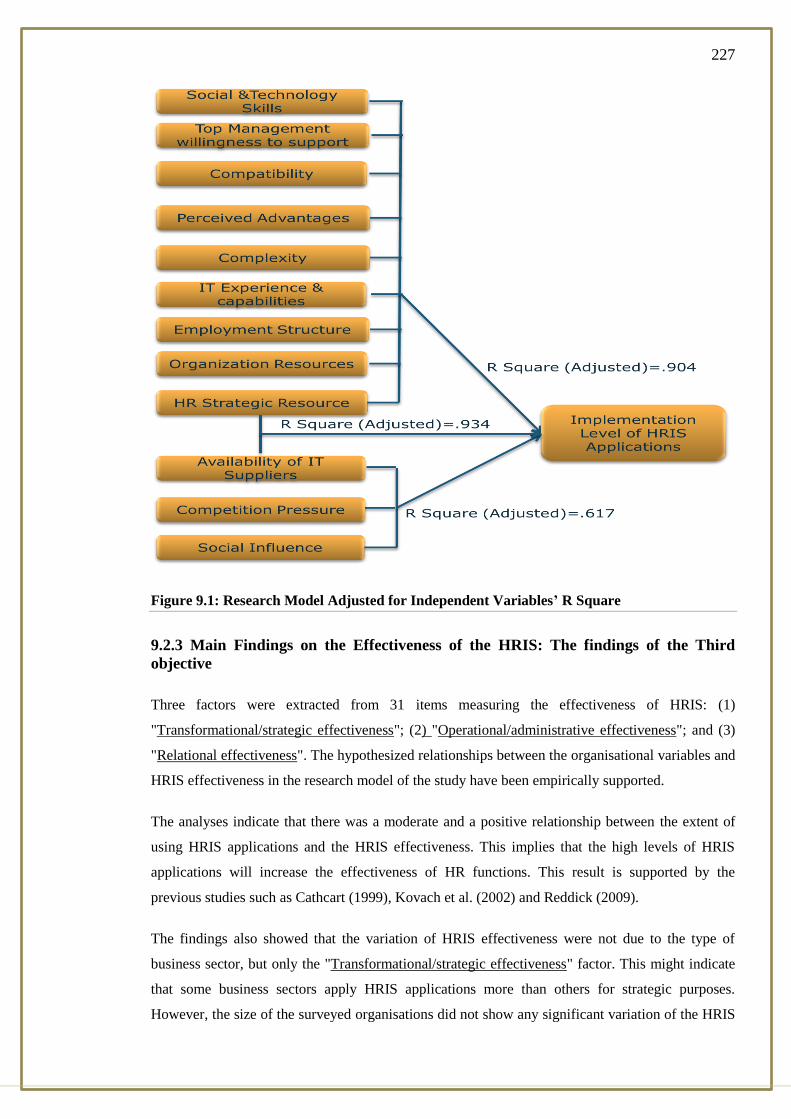
227
Figure 9.1: Research Model Adjusted for Independent Variables’ R Square
9.2.3 Main Findings on the Effectiveness of the HRIS: The findings of the Third
objective
Three factors were extracted from 31 items measuring the effectiveness of HRIS: (1)
"Transformational/strategic effectiveness"; (2) "Operational/administrative effectiveness"; and (3)
"Relational effectiveness". The hypothesized relationships between the organisational variables and
HRIS effectiveness in the research model of the study have been empirically supported.
The analyses indicate that there was a moderate and a positive relationship between the extent of
using HRIS applications and the HRIS effectiveness. This implies that the high levels of HRIS
applications will increase the effectiveness of HR functions. This result is supported by the
previous studies such as Cathcart (1999), Kovach et al. (2002) and Reddick (2009).
The findings also showed that the variation of HRIS effectiveness were not due to the type of
business sector, but only the "Transformational/strategic effectiveness" factor. This might indicate
that some business sectors apply HRIS applications more than others for strategic purposes.
However, the size of the surveyed organisations did not show any significant variation of the HRIS

228
effectiveness. This result might indicate that the size of organisations does not play an important
role on the impact of the HRIS on the HR functions.
The results revealed that the business organisations which have more experience had a more
positive perception of improvements arising from HRIS adoption and its enhancement of HR
functions (i.e., operational, relational, and strategic effectiveness). This suggests that greater
positive impacts of HRIS applications on HR function can be accrued by organisations over time.
9.3 Research Contributions
Several contributions to existing knowledge are made in this research. These contributions are
theoretical, methodological and practical implications. The theoretical contributions refer to the
type of contributions that are made to enhance the conceptualisation and to further enhance the
understanding of the issues being studied. The methodological contributions refer to the type of
conclusions that are made on the procedures employed to achieve the research objectives. The
practical contributions refer to the type of contribution that can be made useful for present and
future practical purposes. This research has some contributions to adoption behaviour of innovation
in general and to the HRIS literature in particular.
9.3.1 Theoretical and Methodological Contributions
This study has extended the understanding of adoption behaviour by testing the phenomenon in a
new environment. In the literature review, it was pointed out that most of the research in this area
was conducted in developed countries. Firm-level adoption behaviour of HRIS has never been
investigated in Jordan and very little research has been conducted in similar developing countries,
particularly within MENA.
This study contributes to the existing body of knowledge by enhancing current understanding of the
organisational adoption of HRIS, which is an under-researched area in Jordan as a developing
country. By employing analytical tools based on Rogers’s Innovation Diffusion Theory (Rogers
1995), UTAUT, TOE (Tornatzky and Fleischer, 1990), and the findings of empirical studies of IT
adoption, evidence confirms that the adoption of HRIS in the business organisations depends
largely on interaction of internal and external environmental factors and the findings support the
need for an integrated view of the adoption phenomenon. The technological innovation field
presents IS researchers with a new avenue for studying IT adoption, diffusion, and implementation
and effectiveness.
In comparison with the previous studies conducted in the same field, this study might be considered
to be more comprehensive in terms of the number of variables investigated, particularly with regard
to the internal and external environment measures. In other words, the study presents a seminal
investigation of 126 variables separately and in aggregate (20 factors).

229
This study has been conducted in a systematic manner, guided by the conceptual framework, which
was based on the integration of the internal and external factors thought to influence adoption
behaviour and the level of using HRIS applications. The research has also developed the
understanding of firms’ external environment, in particular the measures of the political-legal
environment as well as social influences measures. To the best of the researcher’s knowledge, these
measures have not been previously used in HRIS adoption studies.
The findings of this study reinforce many findings of the previous works in this area. However,
some conflicting results were also reported, for example, the age of the decision- maker was
irrelevant either to the level of using HRIS or adoption behaviour. These differences raise new
explanations of when variables are, or are not, relevant to innovation adoption behaviour at the
organisational level.
To the researcher’s knowledge, this research might be one of the few studies in this area testing the
reliability of the scale of measurement of data collection. The McNemar test has been employed in
a pioneering initiative for export behaviour studies, namely to test the improvement in the
classification of group membership after the addition of the external environmental measures to the
internal environment measures.
The present study also has important implications for studies aimed to understanding HRIS
implementation in developing countries. However, explanations of several findings above indicate
the importance of contextual factors within organisation and its environment. By highlighting the
significance of several contextual factors, this study also hopes to expand the focus of HRIS. This
study provides some insights into the implementation of HRIS by Jordanian shareholding
companies, which should help HR practitioners, acquire a better understanding of the current HRIS
implementation status and applications.
9.3.2 Practical Contributions
The practical contributions of this study relate to management. The present study has many
important implications for HR practitioners and top managers in the surveyed companies and in
similar organisations.
The author believes that the decision-makers of business organisations could benefit from this
study’s findings with a better understanding of the factors determining adoption IT behaviour and
the level of implementation of HRIS and its effectiveness, which will assist them in implementing
the required changes within their organisations. Decision-makers should also be aware of different
factors affecting the diffusion and adoption of HRIS applications and its effectiveness, so that they
can better prepare themselves for the possible problems in IT innovation implementation.

230
A comparison between the results of the determinants of the level of implementing HRIS and the
determinants of adoption IT behaviour was also reported. This comparison will help business
organisations in Jordan to implement the required changes within their organisations for the
purpose(s) of either to improve to the level of implementation of HRIS applications or to encourage
business organisations to adopt the HRIS applications.
This study is expected to be helpful to the managers in planning and implementing HRIS where
extensive attention needs be given to HRIS applications, which must be focused on aspects
required for supporting the decision-making process, rather than being limited to some
administrative applications.
Furthermore, managers should also comprehensively understand external environmental factors
before making decisions on technology adoption such as HRIS applications. Furthermore, the
Jordanian Government should consider these factors when giving assistance to business
organisations regarding technology adoption. To enhance the transformation of traditional HRM
practices to HRIS, the government has an important role to play. The provision of financial
assistance, infrastructure facilities and support services by the government is very much
encouraged. More aggressive promotional efforts could be undertaken to encourage companies to
participate in training programs that are aligned with the adoption of HRIS applications. Trade
unions, industrial organisations and chambers of commerce can enhance their support by
encouraging the participation of more companies in conferences on HR issues to keep up with the
current trends.
As for the role of HRIS in the future of HRM, it can be argued that HRIS is a tool that can facilitate
the transition from an administrative to a more strategic role for HRM, enabling it to improve the
quality of its services. Within this context, HRIS adoption and use can be facilitated through
cultivating an organisational culture, which facilitates the integration of technology in
organisational processes and functions in addition to its role in promoting the collaboration
between different departments, such as HR and IT, in order to institutionalize and consolidate this
change. In addition, employees’ IT skills and attitudes play a crucial role in the above-mentioned
integration, so HRM needs to invest in supporting people to develop the necessary skills and
attitudes in order to actively participate and use the new services, and the benefits of these services
must be effectively communicated in order to eliminate any resistance or reluctance to use the new
services.
HR managers should play a proactive role to support HRIS implementation in their organisations.
They should convince top managers of the importance of HRIS implementation, so that time and
budget required for implementing HRIS can be allocated. Furthermore, management commitment
is crucial for both supporting adoption initiatives and ensuring that resources are made available for
sustaining adoption efforts, including the development of human capabilities, which is
231
characterized by the combination of specific HR domain knowledge, technical IT/IS and
communications skills.
Top managers need to be convinced by the values and the strategic benefits of HRIS in order to
grant the required financial and non-financial support for HRIS implementation. This of course
implies further promotional efforts as well as an action plan devised and implemented by HRM
staff to demonstrate the real advantages of using HRIS if top management is to become aware of
the benefits that can be achieved from implementing HRIS.
Wider internal organisational context factors can have a deep impact on HRIS adoption success.
Successful adoptions are also considered to be a driver, suggesting that adoption campaigns
featuring successful adopters are likely to entice non-adopter organisations to strengthen their
business cases for adopting HRIS.
9.4 Research Limitations
This study has several limitations that should be considered when evaluating and generalizing its
conclusions. However, the limitations discussed below can provide a starting point for future
research
The study was conducted in one country, Jordan. Although Jordan is a valid indicator of prevalent
factors in the wider MENA region and developing countries, the lack of external validity of this
research means that any generalisations of the research findings should be taken with caution.
Future research can be orientated in other national and cultural settings and compared with the
results of this study.
The data analysis was cross-sectional. As with all cross sectional studies, the parameters tended to
be static rather than dynamic. This drawback limits the generalisation of the study’s findings to
further situations and beyond the specific population from which the data was gathered. Future
longitudinal studies could provide a better understanding of the adoption of innovation over time.
The study used the single informant approach for data collections. This approach might not provide
the best view of the organisation as a whole. However, by using multiple informant approach in
future research, the problem of aggregate responses should be solved.
9.6 Personal Reflection on the Thesis
My Ph.D. thesis explores the environmental factors influencing the adoption and implementation of
HRIS applications in business organizations. In this thesis I explore, reflect upon and theorize my
experiences as a doctoral student writing a thesis in the field of IS studies. While reflecting on the
experience of writing a thesis, I came to the realization that I truly enjoyed this process, at least

232
most of it. I am the type of person who loves to learn and always seeks to obtain more knowledge
in and out of the classroom. I am especially passionate about learning things that pertain to my
future career in the education.
Actually, there are many, many things that I learned along the thesis writing journey to do with
developing effective thesis management strategies, scholarly writing skills and maintaining a
positive attitude. My research experience was greatly enhanced by my supervisor Dr. Steve Love
who patiently guided me through every stage of my thesis. He managed successfully to maintain
the intricate balance between giving me time and space to do my research and writing, and
monitoring my progress regularly. I feel that this is extremely important for researchers as we have
a time frame within which we have to complete our thesis. Giving postgraduate students too much
independence can sometimes have its adverse repercussions, resulting in incomplete dissertations,
extended deadlines, and rushed, last minute work that sacrifices on quality.
My research experience also taught me the value of discipline and time management because I had
to seek motivation from within myself to complete my thesis, revise it, edit it and prepare it for
submission within the three-year period. Specifically, the research process required extensive
preparation and planning for each stage of the study and each stage of the study had to be
conducted in an organized manner form time perspectives. Furthermore, I learned that accuracy
and celerity are so important. During my research experience, I learned that the researcher should
be smart one; it is all about looking to the whole picture and then goes for more details. The
research component also honed my critical thinking abilities and made me an independent learner. I
find these qualities especially will be useful in the teaching profession because I could encourage
my students to think critically and become independent learners—qualities that are increasingly
being valued in the young. My graduate experience also fuelled my passion for literature,
convinced me that I would be most happy in a teaching environment and encouraged me to
constantly improve myself, with respect to both knowledge and skills.
9.7 Areas for Further Research
Since this is the first study to address the adoption behaviour of HRIS in Jordan, there are many
issues that could not be covered in this research that warrant further investigation. The suggested
areas for further study are as follows.
The external validation of the current research findings is important for future research directed
towards replication of the findings of this research. It is suggested that future researchers should
use the same dimensions of the internal and external environment.

233
This research was conducted at a single point in time. Future work could use a longitudinal
research design to fully investigate the causal effect of various factors and their relationships over
time.
This research has been conducted in Jordan and further research should be carried out to investigate
whether the results from this research will be consistent with findings from different countries in
various business organisations. This may provide deeper insights into innovation adaptation and
usage in varying organisational and cultural contexts. In general, our knowledge of IT adoption
might be further improved by more studies in both developed and developing countries. Therefore,
researchers can further look into factors influencing the extent of HRIS adoption and determine if
the same or a different set of factors is relevant in explaining the extent of HRIS adoption. In
addition, researchers can also adopt other research methodologies such as focus group interviews or
longitudinal study which may provide a richer set of data rather than the survey methodology used
in this study. This research was conducted at a single point in time.
The theoretical framework tested in this research identified external environmental variables as an
additional source of influence on perception and use of an innovation. As with many adoption
models, there is a risk that additional significant factors have not been included in the framework.
Additional variables such as these variables which have been conducted in existing studies in HRIS
adoption can be further examined in future study. Future research is required to develop multiple
measures for the level of implementation of HRIS and its effectiveness. The purpose would be to
find out whether there are any differences of using one criterion and the results of using multiple
criteria together.
While this study advances the investigation of factors affecting the adoption of HRIS applications
and current status of adopting HRIS in business organisations in Jordan, it is just a first step. Future
research models could also focus on the question of whether there are constructs, or variables other
than those studied here that affect systems’ effectiveness in developing countries like Jordan. Also,
a logical extension of this study is to focus on specific types of user involvement to determine
which types and under what conditions they have the greatest influence on systems effectiveness,
especially in developing countries. A contingency approach could be very useful in understanding
the true nature of user involvement and systems’ effectiveness in Jordan and in similar settings.
Additional studies of systems’ effectiveness and its determinants in different cultures and countries
are indispensable. The accumulation of such studies will enable IS researchers to make
comparisons and to integrate findings into existing or new frameworks that enhance our
understanding of global information systems’ effectiveness.
234
References
Aaker, D.A. (2011) Building strong brands, Simon and Schuster.
Abrahamson, E. (1991). Managerial fads and fashions: The diffusion and rejection of
innovations. Academy of management review, vol.16,no.3, pp.586-612.
Adamson, L., & Zampetti, R. (2001). ''Web-based manager self-service: adding value to the
work''. Web-Based Human Resources, McGraw-Hill, New York, NY, 24-35.
Ahuja, V., Yang, J. and Shankar, R. (2009) "Study of ICT adoption for building project
management in the Indian construction industry", Automation in Construction, vol. 18, no. 4,
pp. 415-423.
Aiken, M., Bacharach, S.B. and French, J.L. (1980) "Organisational structure, work process, ad
proposal making in administrative bureaucracies", Academy of management journal, vol. 23,
no. 4, pp. 631-652.
Ajzen, I. (1991) "The theory of planned behavior", Organisational behavior and human decision
processes, vol. 50, no. 2, pp. 179-211.
Ajzen, I. (1985) "From intentions to actions: A theory of planned behavior. In J . Kuhl & J .
Beckman (Eds.), Action-control: From cognition t o behavior", , no. Heidelberg, Germany:
Springer, pp. 11-39.
Alan R. Nankervis, Fang Lee Cooke, Samir R. Chatterjee and Malcolm Warner (2009) "Identifying
acceptable performance appraisal criteria: An international perspective", Asia Pacific Journal
of Human Resources, vol. 47, no. 1, pp. 25-102.
Aldag, R. and Stearns, T. "Management,(1991)", South-Western, OH, .
Altaf, A., Agha, A., Holte-McKinzie, M., Abbas, Q., Jafri, S.B., Emmanuel, F., Bridges, J., Searle,
S., Selck, F. and Martinson, N. (2012) "Size estimation HIV prevalence and risk behaviours of
female sex workers in Pakistan.", JPMA.Journal of the Pakistan Medical Association, vol. 62,
no. 6, pp. 551-557.
Al-Dmour, R.H. and Shannak, R.O. (2012) "Determinants of the Implementation Level Of
Electronic Human Resources Management (E-HRM) In Jordanian Shareholding Companies",
European Scientific Journal, vol. 8, no. 17.
AL-Dmour, .R H., and Al-Zu'bi, Z. (2014) ‘Factors Inhabiting and Motivating the Adoption of
HRIS in Business Organization ’, International Business Research, Vol. 7, No. 7, p139.
AL-Dmour, .R H., and Al-Zu'bi, Z. (2014) ‘Factors Inhabiting and Motivating the Adoption of
HRIS in Business Organization ’, International Business Research, Vol. 7, No. 7, p139.
Amabile, T. M. (1988). "A model of creativity and innovation in organisations". In B. M. Staw &
L. L. Cummings (Eds.), Research in organisational behaviorVol. 10, pp. 123-167.
Anderson, A., Proudfoot, J.G. and Harris, M. (2009) "Medical assistants: a primary care workforce
solution?", Australian Family Physician, vol. 38, no. 8, pp. 623.

235
Ang, C.L., Davies, M.A. and Finlay, P.N. (2001) "An empirical model of IT usage in the
Malaysian public sector", The Journal of Strategic Information Systems, vol. 10, no. 2, pp.
159-174.
Ang, S. and Slaughter, S. (2004) "Turnover of information technology professionals: the effects of
internal labor market strategies", ACM SIGMIS Database, vol. 35, no. 3, pp. 11-27.
Arad, S., Hanson, M.A. and Schneider, R.J. (1997) "A framework for the study of relationships
between organisational characteristics and organisational innovation", The Journal of Creative
Behavior, vol. 31, no. 1, pp. 42-58.
Attewell, P. (1992) "Technology diffusion and organisational learning: The case of business
computing", Organisation Science, , vol. 3, no. 1 pp. 1-19.
Baer, M. and Frese, M. (2003) "Innovation is not enough: Climates for initiative and psychological
safety, process innovations, and firm performance", Journal of Organisational Behavior, vol.
24, no. 1, pp. 45-68.
Bailey, K.R. (1987) "Inter‐study differences: How should they influence the interpretation and
analysis of results?", Statistics in medicine, vol. 6, no. 3, pp. 351-358.
Bakker, Y. (2010) "Back to the Future of Human Resource Information Systems?“A survey
towards the role of country differences regarding adoption and deployment outcomes of e-
HRM”", .
Ball, K.S. (2001) "The use of human resource information systems: a survey", Personnel Review,
vol. 30, no. 6, pp. 677-693.
Baloh, P. and Trkman, P. (2003) "Influence of internet and information technology on work and
human resource management", Informing Science, June, , pp. 498-505.
Bantel, K.A. and Jackson, S.E. (1989) "Top management and innovations in banking: does the
composition of the top team make a difference?", Strategic Management Journal, vol. 10, no.
S1, pp. 107-124.
Barbosa, D.H. and Musetti, M.A. (2010) "Logistics information systems adoption: an empirical
investigation in Brazil", Industrial Management & Data Systems, vol. 110, no. 6, pp. 787-804.
Barney, J.B. and Wright, P.M. (1998) "On becoming a strategic partner: The role of human
resources in gaining competitive advantage", Human resource management, vol. 37, no. 1, pp.
31-46.
Bass, B.M., Avolio, B.J. and Pointon, J. (1990) The implications of transactional and
transformational leadership for individual, team, and organisational development, .
Bassellier, G., Benbasat, I. and Reich, B.H. (2003) "The influence of business managers' IT
competence on championing IT", Information Systems Research, vol. 14, no. 4, pp. 317-336.
Beadles, N., Lowery, C.M. and Johns, K. (2005) "The impact of human resource information
systems: an exploratory study in the public sector", Communications of the IIMA, vol. 5, no. 4,
pp. 39-46.
Bear-Lehman, J. and Abreu, B.C. (1989) "Evaluating the hand: issues in reliability and validity",
Physical Therapy, vol. 69, no. 12, pp. 1025-1033.
236
Beatty, S., Murray, I.J., Henson, D.B., Carden, D., Koh, H. and Boulton, M.E. (2001) "Macular
pigment and risk for age-related macular degeneration in subjects from a Northern European
population", Investigative ophthalmology & visual science, vol. 42, no. 2, pp. 439-446.
Beckers, A.M. and Bsat, M.Z. (2002) "A DSS classification model for research in human resource
information systems", Information Systems Management, vol. 19, no. 3, pp. 1-10.
Bell, B.S., Lee, S. and Yeung, S.K. (2006) "The impact of e‐HR on professional competence in
HRM: Implications for the development of HR professionals", Human resource management,
vol. 45, no. 3, pp. 295-308.
Berry, F.S., Berry, W.D. and Foster, S.K. (1998) "The determinants of success in implementing an
expert system in state government", Public administration review, , pp. 293-305.
Beynon‐Davies, P. and Williams, M.D. (2003) "Evaluating electronic local government in the UK",
Journal of Information Technology, vol. 18, no. 2, pp. 137-149.
Biga, C.F. and Neuman, W.L. (2006) Instructor's Manual and Test Bank for Neuman, Social
Research Methods, Qualitative and Quantitative Approaches, Pearson Allyn and Bacon.
Blumberg, B., Cooper, D.R. and Schindler, P.S. (2008) Business research methods, McGraw-Hill
Higher Education New York.
Boeker, W. and Paul Huo, Y. (1998) "Innovation adoption by established firms: unresolved issues",
The Journal of High Technology Management Research, vol. 9, no. 1, pp. 115-130.
Bohrnstedt, G.W. (1970) "Reliability and validity assessment in attitude measurement", Attitude
measurement, , pp. 80-99.
Bohrnstedt, G.W. and Felson, R.B. (1983) "Explaining the relations among children's actual and
perceived performances and self-esteem: A comparison of several causal models.", Journal of
personality and social psychology, vol. 45, no. 1, pp. 43.
Boon, C., Paauwe, J., Boselie, P. and Den Hartog, D. (2009) "Institutional pressures and HRM:
developing institutional fit", Personnel Review, vol. 38, no. 5, pp. 492-508.
Boyne, G.A., Gould-Williams, J.S., Law, J. and Walker, R.M. (2005) "Explaining the adoption of
innovation: An empirical analysis of public management reform", Environment and Planning
C: Government & Policy, vol. 23, no. 3, pp. 419-435.
Boynton, A.C., Zmud, R.W. and Jacobs, G.C. (1994) "The influence of IT management practice on
IT use in large organisations", Mis Quarterly, , pp. 299-318.
Bradford, M. and Florin, J. (2003) "Examining the role of innovation diffusion factors on the
implementation success of enterprise resource planning systems", International Journal of
Accounting Information Systems, vol. 4, no. 3, pp. 205-225.
Brancheau, J.C. and Wetherbe, J.C. (1990b) "The adoption of spreadsheet software: testing
innovation diffusion theory in the context of end-user computing", Information Systems
Research, vol. 1, no. 2, pp. 115-143.
Brand, M.J. and Huizingh, E.K. (2008) "Into the drivers of innovation adoption: What is the impact
of the current level of adoption?", European Journal of Innovation Management, vol. 11, no.
1, pp. 5-24.
237
Brooks/Cole. Grier, W H(2006), Management of Organisational Behavior: Utilizing Human
Resources, 3rd ed. Englewood .
Brown, C.V. and Bostrom, R.P. (1994) "Organisation designs for the management of end-user
computing: Reexamining the contingencies", Journal of Management Information Systems, ,
pp. 183-211.
Bryman, A. and Bell, E. (2007) Business research methods, Oxford university press.
Brynjolfsson, E. and Hitt, L.M. (2000) "Beyond computation: Information technology,
organisational transformation and business performance", The Journal of Economic
Perspectives, vol. 14, no. 4, pp. 23-48.
Buonanno, G., Faverio, P., Pigni, F., Ravarini, A., Sciuto, D. and Tagliavini, M. (2005) "Factors
affecting ERP system adoption: a comparative analysis between SMEs and large companies",
Journal of Enterprise Information Management, vol. 18, no. 4, pp. 384-426.
Burns, T. and Stalker, G.M. (1961) "The management of innovation", University of Illinois at
Urbana-Champaign's Academy for Entrepreneurial Leadership Historical Research
Reference in Entrepreneurship, .
Buttery, E. and Buttery, A. (1992) Business Networks: Reaching New Markets with Cost Effective
Strategies. Melbourne: Longman.
Byars, L.L. and Rue, L.W. (2004) "Human reserved supply Management, 7e", .
Carlsson, C., Carlsson, J., Hyvonen, K., Puhakainen, J. and Walden, P. (2006) "Adoption of mobile
devices/services—searching for answers with the UTAUT", System Sciences, 2006.
HICSS'06. Proceedings of the 39th Annual Hawaii International Conference onIEEE, , pp.
132a.
Carmines, E.G. and Zeller, R.A. (1979) Reliability and validity assessment, Sage.
Carter, L. and Belanger, F. (2004) "Citizen adoption of electronic government initiatives", System
Sciences, 2004. Proceedings of the 37th Annual Hawaii International Conference onIEEE, ,
pp. 10 pp.
Casile, M. and Davis-Blake, A. (2002) "WHEN ACCREDITATION STANDARDS CHANGE:
FACTORS AFFECTING DIFFERENTIAL RESPONSIVENESS OF PUBLIC AND
PRIVATE ORGANISATIONS.", Academy of Management Journal, vol. 45, no. 1, pp. 180-
195.
Cavana, R.Y., Delahaye, B.L. and Sekaran, U. (2001) "Applied business research", Qualitative and
Quantitative Methods, .
Chan, P. and Mills, A. (2002) "Motivators and inhibitors of e-commerce technology adoption:
Online stock trading by small brokerage firms in New Zealand", Journal of Information
Technology Case and Application Research, vol. 3, pp. 38-56.
Chau, P.Y.K. and Tam, K.Y. (1997) "Factors affecting the adoption of open systems: an
exploratory study", Mis Quarterly, , pp. 1-24.
Chau, P.Y. (1996) "An empirical assessment of a modified technology acceptance model", Journal
of Management Information Systems, vol. 13, no. 2, pp. 185-204.

238
Chaveesuk, S. (2010) The Determinants of the Adoption and Application of Business Intelligence:
An ERP Perspective, .
Chen, S. (2004) "Adoption of electronic commerce by SMEs of Taiwan", Electronic Commerce
Studies, vol. 2, no. 1, pp. 19-34.
Cherry, A.L. A (2013) research primer for the helping professions: Methods, statistics, and
writing, Wadsworth/Thomson Learning.
Chmielecki, M HR challenges in China Journal of Intercultural Management
Vol. 4, No. 3, September 2012, pp. 49–55.
Chong, A.Y.L., Ooi, K.B. and Sohal, A. (2009) "The relationship between supply chain factors and
adoption of e-Collaboration tools: An empirical examination", International Journal of
Production Economics, vol. 122, no. 1, pp. 150-160.
Churchill Jr, G.A. and Iacobucci, D. (2009) Marketing research: methodological foundations,
Cengage Learning.
Churchill Jr, G.A. and Peter, J.P. (1984) "Research design effects on the reliability of rating scales:
a meta-analysis", Journal of Marketing Research, , pp. 360-375.
Clark, I. (1998) "Designing and sustaining an entrepreneurial role for the human resource function:
strategic choice or competitive conditions?: Evidence from engineering process plant
contracting", International Journal of Entrepreneurial Behaviour & Research, vol. 4, no. 1,
pp. 51-70.
Clark, P.A., Staunton, N. and Rogers, E. (1989) Innovation in technology and organisation,
Routledge London.
Clark, S.S., McLaughlin, J., Timmons, M., Pendergast, A.M., Ben-Neriah, Y., Dow, L.W., Crist,
W., Rovera, G., Smith, S.D. and Witte, O.N. (1988) "Expression of a distinctive BCR-ABL
oncogene in Ph1-positive acute lymphocytic leukemia (ALL)", Science, vol. 239, no. 4841,
pp. 775-777.
Clark, T., Grant, D. and Heijltjes, M. (1999) "Researching comparative and international human
resource management: key challenges and contributions", International Studies of
Management & Organisation, vol. 29, no. 4, pp. 6-23.
Cooper, D.R. and Schindler, P.S. (2003) "Business research methods", .
Cooper, R.B. and Zmud, R.W. (1990) "Information technology implementation research: a
technological diffusion approach", Management science, , pp. 123-139.
Cragg, P.B. and King, M. (1993) "Small-firm computing: motivators and inhibitors", MIS
quarterly, , pp. 47-60.
Cragg, P.B. and Zinatelli, N. (1995) "The evolution of information systems in small firms",
Information & Management, vol. 29, no. 1, pp. 1-8.
Crano, W.D., Brewer, M.B. and Lac, A. (2005) Principles and methods of social research,
Psychology Press.
Crestwell, J. (1994) "Research Design: Qualitative & Quantitative Design Approaches", .
239
Creswell, J.W., Plano Clark, V.L., Gutmann, M.L. and Hanson, W.E. (2003) "Advanced mixed
methods research designs", Handbook of mixed methods in social and behavioral research, ,
pp. 209-240.
Cyert, R.M. and March, J.G. (1963) "A behavioral theory of the firm", Englewood Cliffs, NJ, vol.
2.
Daellenbach, U.S., McCarthy, A.M. and Schoenecker, T.S. (1999) "Commitment to innovation:
The impact of top management team characteristics", R&D Management, vol. 29, no. 3, pp.
199-208.
Daft, R.L. and Lengel, R.H. (1986) "Organisational information requirements, media richness and
structural design", Management science, vol. 32, no. 5, pp. 554-571.
Damanpour, F. (1992) "Organisational size and innovation", Organisation Studies, vol. 13, no. 3,
pp. 375-402.
Damanpour, F. (1991) "Organisational innovation: A meta-analysis of effects of determinants and
moderators", Academy of management journal, , pp. 555-590.
Damanpour, F. and Schneider, M. (2006) "Phases of the adoption of innovation in organisations:
Effects of environment, organisation and top Managers1", British Journal of Management,
vol. 17, no. 3, pp. 215-236.
Damanpour, F. and Schneider, M. (2009) "Characteristics of innovation and innovation adoption in
public organisations: Assessing the role of managers", Journal of public administration
research and theory, vol. 19, no. 3, pp. 495-522.
Daniel, E. (1998) "Online banking: winning the majority", Journal of Financial Services
Marketing, vol. 2, no. 3, pp. 259-270.
Dash, J. (2001) "IBM, Intel push wireless health care", Computerworld, vol. 35, no. 21, pp. 10.
Davila, T., Epstein, M.J. and Shelton, R.D. (2006) The Creative Enterprise [Three Volumes],
Greenwood International.
Davis, F.D. (1989) "Perceived usefulness, perceived ease of use, and user acceptance of
information technology", MIS quarterly, , pp. 319-340.
De Alwis, A.C. (2010) "The impact of electronic human resource management on the role of
human resource managers", E M Ekonomie a Management, vol. 4, pp. 47-60.
De Vaus, D. (2001) Research design in social research, Sage.
Dedrick, J. and West, J. (2004) "An exploratory study into open source platform adoption", System
Sciences, 2004. Proceedings of the 37th Annual Hawaii International Conference on IEEE,
pp. 10 pp.
CedarCrestone (2009), CedarCrestone 2009-2010 HR Systems Survey: HR Technologies,
Deployment Approaches, Value, and Metrics, 12th annual ed., CedarCrestone, Alpharetta,
GA, available at: www.cedarcrestone.com/research.php (accessed September 30, 2009).
Del Aguila-Obra, A.R. and Padilla-Melendez, A. (2006) "Organisational factors affecting Internet
technology adoption", Internet Research, vol. 16, no. 1, pp. 94-110.
240
Delone, W.H. and McLean, E.R. (2003) "The DeLone and McLean model of information systems
success: A ten-year update", Journal of Management Information Systems, vol. 19, no. 4, pp.
9-30.
DeLone, W.H. (1981) "Firm size and the characteristics of computer use", Mis Quarterly, , pp. 65-
77.
DeLone, W.H. and McLean, E.R. (1992) "Information systems success: the quest for the dependent
variable", Information systems research, vol. 3, no. 1, pp. 60-95.
Delorme, M. and Arcand, M. (2010) "HRIS implementation and deployment: a conceptual
framework of the new roles, responsibilities and competences for HR professionals",
International Journal of Business Information Systems, vol. 5, no. 2, pp. 148-161.
Depietro, R., Wiarda, E. and Fleischer, M. (1990) "The context for change: Organisation,
technology and environment", The processes of technological innovation, , pp. 151-175.
Dery, K., Grant, D. and Wiblen, S. (2009) "Human resource information systems (HRIS):
Replacing or enhancing HRM", Proceedings of the 15th World Congress of the International
Industrial Relations Association IIRA.
DeSanctis, G. (1986) "Human resource information systems: a current assessment", MIS Quarterly,
, pp. 15-27.
Deshpande, R. (1983) "" Paradigms Lost": On Theory and Method in Research in Marketing", The
Journal of Marketing, , pp. 101-110.
Deshpande, R. and Webster Jr, F.E. (1989) "Organisational culture and marketing: defining the
research agenda", The Journal of Marketing, , pp. 3-15.
Detert, J.R., Schroeder, R.G. and Mauriel, J.J. (2000) "A framework for linking culture and
improvement initiatives in organisations", Academy of management Review, vol. 25, no. 4, pp.
850-863.
DeVellis, R.F. (2003) "Scale Development: Theory and Applications Second Edition (Applied
Social Research Methods)", .
Dewar, R.D. and Dutton, J.E. (1986) "The adoption of radical and incremental innovations: an
empirical analysis", Management science, , pp. 1422-1433.
Dillon, W.R. and Goldstein, M. (1984) Multivariate analysis, Wiley New York.
DiTomaso, N. and Farris, G.F. (1992) "Diversity in the high-tech workplace: diversity and
performance in R&D", Spectrum, IEEE, vol. 29, no. 6, pp. 21-24.
Doolin, B. and Troshani, I. (2007) "Organisational adoption of XBRL", Electronic Markets, vol.
17, no. 3, pp. 199-209.
Downs Jr, G.W. and Mohr, L.B. (1976) "Conceptual issues in the study of innovation",
Administrative Science Quarterly, , pp. 700-714.
Drazin, R. and Schoonhoven, C.B. (1996) "Community, population, and organisation effects on
innovation: a multilevel perspective", Academy of Management Journal, vol. 39, no. 5, pp.
1065-1083.

241
Drew, S. (2003) "Strategic uses of e-commerce by SMEs in the east of England", European
Management Journal, vol. 21, no. 1, pp. 79-88.
Dutta, S. and Evrard, P. (1999) "Information technology and organisation within European small
enterprises", European Management Journal, vol. 17, no. 3, pp. 239-251.
Easingwood, C. and Beard, C. (1989) "High technology launch strategies in the UK", Industrial
Marketing Management, vol. 18, no. 2, pp. 125-138.
Eastin, M.S. (2002) "Diffusion of e-commerce: an analysis of the adoption of four e-commerce
activities", Telematics and Informatics, vol. 19, no. 3, pp. 251-267.
Eder, L.B. and Igbaria, M. (2001) "Determinants of intranet diffusion and infusion", Omega, vol.
29, no. 3, pp. 233-242.
Eisenbeis, R.A. (1977) "Pitfalls in the application of discriminant analysis in business, finance, and
economics", The Journal of Finance, vol. 32, no. 3, pp. 875-900.
Ellis, R.W., Jones, M.C. and Arnett, K.P. (1994) "Local area network adoption: An empirical
assessment", Information Resources Management Journal (IRMJ), vol. 7, no. 4, pp. 20-29.
Ellsworth, J.B. (2000) Surviving Change: A Survey of Educational Change Models. ERIC.
Ensher, E.A., Nielson, T.R. and Grant-Vallone, E. (2002) "Effects of the internet and technology
on HR processes", Organisational dynamics, vol. 31, no. 3, pp. 224-244.
Ettlie, J.E., Bridges, W.P. and O'keefe, R.D. (1984) "Organisation strategy and structural
differences for radical versus incremental innovation", Management science, vol. 30, no. 6,
pp. 682-695.
Ezzamel, M., Gwilliam, D.R. and Holland, K. (1996) "Some empirical evidence from publicly
quoted UK companies on the relationship between the pricing of audit and non-audit
services", Accounting and Business Research, vol. 27, no. 1, pp. 3-16.
Feldstein, M. (1999) "Tax avoidance and the deadweight loss of the income tax", Review of
Economics and Statistics, vol. 81, no. 4, pp. 674-680.
Ferratt, T.W., Agarwal, R., Brown, C.V. and Moore, J.E. (2005) "IT human resource management
configurations and IT turnover: Theoretical synthesis and empirical analysis", Information
Systems Research, vol. 16, no. 3, pp. 237-255.
Fichman, R.G. (2000) "The diffusion and assimilation of information technology innovations",
Framing the domains of IT management: Projecting the future through the past, , pp. 105-
128.
Fichman, R.G. (1992) "Information technology diffusion: a review of empirical research",
Proceedings of the International Conference on Information SystemsSOCIETY FOR
INFORMATION MANAGEMENT, , pp. 195.
Fichman, R.G. and Kemerer, C.F. (1999) "The illusory diffusion of innovation: An examination of
assimilation gaps", Information Systems Research, vol. 10, no. 3, pp. 255-275.
Filstead, W.J. (1979) "Qualitative methods: A needed perspective in evaluation research",
Qualitative and quantitative methods in evaluation research, , pp. 33-48.
242
Fink, D. (1998) "Guidelines for the successful adoption of information technology in small and
medium enterprises", International Journal of Information Management, vol. 18, no. 4, pp.
243-253.
Fishbein, M. and Ajzen, I. (1975) Belief, attitude, intention and behaviour: An introduction to
theory and research, Addison-Wesley.
Fishbein, M. and Ajzen, I. (1972) "Attitudes and opinions", Annual Review of Psychology, vol. 23,
no. 1, pp. 487-544.
Fisher, R.A. (1936) "The use of multiple measurements in taxonomic problems", Annals of
eugenics, vol. 7, no. 2, pp. 179-188.
Fisher, S.L. and Howell, A.W. (2004) "Beyond user acceptance: An examination of employee
reactions to information technology systems", Human resource management, vol. 43, no. 2‐3,
pp. 243-258.
Fliegel, F.C. and Kivlin, J.E. (1966) "Attributes of innovations as factors in diffusion", American
Journal of Sociology, , pp. 235-248.
Florkowski, G.W. and Olivas-Luján, M.R. (2006) "The diffusion of human-resource information-
technology innovations in US and non-US firms", Personnel Review, vol. 35, no. 6, pp. 684-
710.
Floyd, S.W. and Lane, P.J. (2000) "Strategizing throughout the organisation: Managing role
conflict in strategic renewal", Academy of Management Review, , pp. 154-177.
Fox, R.L. and Schuhmann, R.A. (1999) "Gender and local government: A comparison of women
and men city managers", Public administration review, , pp. 231-242.
Frambach, R.T. (1993) "An integrated model of organisational adoption and diffusion of
innovations", European Journal of Marketing, vol. 27, no. 5, pp. 22-41.
Frambach, R.T., Barkema, H.G., Nooteboom, B. and Wedel, M. (1998) "Adoption of a service
innovation in the business market: an empirical test of supply-side variables", Journal of
Business Research, vol. 41, no. 2, pp. 161-174.
Frambach, R.T. and Schillewaert, N. (2002) "Organisational innovation adoption: A multi-level
framework of determinants and opportunities for future research", Journal of Business
Research, vol. 55, no. 2, pp. 163-176.
Frank, R.E., Massy, W.F. and Morrison, D.G. (1965) "Bias in multiple discriminant analysis",
Journal of Marketing Research, , pp. 250-258.
Freed-Taylor, M. (1994) "Ethical considerations in European cross-national research",
International Social Science Journal, vol. 142, pp. 523-532.
Freeman, R.B. and Kleiner, M.M. (2000) "Who benefits most from employee involvement: Firms
or workers?", American Economic Review, vol. 90, no. 2, pp. 219-223.
Freeman, R., Chi, W. and Kleiner, M. (2007) "Adoption and Termination of Employee
Involvement Programs", .
Gable, G.G. (1991) "Consultant engagement for computer system selection: a pro-active client role
in small businesses", Information & Management, vol. 20, no. 2, pp. 83-93.
243
Galanaki, E. (2002) "The decision to recruit online: a descriptive study", Career Development
International, vol. 7, no. 4, pp. 243-251.
Gardner, C. and Amoroso, D.L. (2004) "Development of an instrument to measure the acceptance
of internet technology by consumers", System Sciences, 2004. Proceedings of the 37th Annual
Hawaii International Conference onIEEE, , pp. 10 pp.
Garrity, E.J. and Sanders, G.L. (1998) Information systems success measurement, IGI Global.
Gattoufi, S., Oral, M., Kumar, A. and Reisman, A. (2004) "Content analysis of data envelopment
analysis literature and its comparison with that of other OR/MS fields", Journal of the
Operational Research Society, vol. 55, no. 9, pp. 911-935.
Gerbing, D.W. and Anderson, J.C. (1988) "An updated paradigm for scale development
incorporating unidimensionality and its assessment", Journal of Marketing Research, , pp.
186-192.
Ghobakhloo, M., Arias-Aranda, D. and Benitez-Amado, J. (2011) "Adoption of e-commerce
applications in SMEs", Industrial Management & Data Systems, vol. 111, no. 8, pp. 1238-
1269.
Gibbs, J.L. and Kraemer, K.L. (2004) "A Cross‐Country Investigation of the Determinants of
Scope of E‐commerce Use: An Institutional Approach", Electronic Markets, vol. 14, no. 2, pp.
124-137.
Ginzberg, M.J. (1981) "Early diagnosis of MIS implementation failure: promising results and
unanswered questions", Management Science, , pp. 459-478.
Gopalakrishnan, S. and Damanpour, F. (1997) "A review of innovation research in economics,
sociology and technology management", Omega, vol. 25, no. 1, pp. 15-28.
Gopalakrishnan, S. and Damanpour, F. (1994) "Patterns of generation and adoption of innovation
in organisations: Contingency models of innovation attributes", Journal of Engineering and
Technology Management, vol. 11, no. 2, pp. 95-116.
Gremillion, L.L. (1984) "Organisation size and information system use: An empirical study",
Journal of Management Information Systems, , pp. 4-17.
Grint, K. and Woolgar, S. (1997) The machine at work: Technology, work, and organisation,
Polity.
Grover, V. (1993) "An Empirically Derived Model for the Adoption of Customer‐based
Interorganisational Systems*", Decision Sciences, vol. 24, no. 3, pp. 603-640.
Guba, E.G. and Lincoln, Y.S. (1994) "Competing paradigms in qualitative research", Handbook of
qualitative research, vol. 2, pp. 163-194.
Hage, J. and Dewar, R. (1973) "Elite values versus organisational structure in predicting
innovation", Administrative Science Quarterly, , pp. 279-290.
Hage, J. and Aiken, M. (1970) Social change in complex organisations, Random House New York.
Hage, J. and Aiken, M. (1969) "Routine technology, social structure, and organisation goals",
Administrative Science Quarterly, , pp. 366-376.
244
Hage, J. and Aiken, M. (1967) "Program change and organisational properties a comparative
analysis", American Journal of Sociology, , pp. 503-519.
Hagood, W.O. and Friedman, L. (2002) "Using the balanced scorecard to measure the performance
of your HR information system", Public Personnel Management, vol. 31, no. 4, pp. 543-558.
Haines, V.Y. and Petit, A. (1997) "Conditions for successful human resource information systems",
Human resource management, vol. 36, no. 2, pp. 261-275.
Hair Jr, J. "Black, WC/Babin, BJ/Anderson, RE & Tatham, RL (2006): Multivariate Data
Analysis", Upper-Saddle River, New Jersey: Prentice Hall, .
Hair, J.F., Black, W.C., Babin, B.J., Anderson, R.E. and Tatham, R.L. (2010) Multivariate data
analysis, Prentice Hall Upper Saddle River, NJ.
Hambrick, D.C. and Mason, P.A. (1984) "Upper echelons: The organisation as a reflection of its
top managers", Academy of management review, , pp. 193-206.
Hansen, M.T. and Deimler, M.S. (2001) "Cutting costs while improving morale with B2E
management", MIT Sloan Management Review, vol. 43, no. 1, pp. 96-100.
Harris, M.M. (2008) Handbook of research in international human resource management, Taylor
& Francis.
Hausdorf, P.A. and Duncan, D. (2004) "Firm size and Internet recruiting in Canada: A preliminary
investigation", Journal of Small Business Management, vol. 42, no. 3, pp. 325-334.
Hedberg, B.L., Bystrom, P.C. and Starbuck, W.H. (1976) "Camping on seesaws: Prescriptions for a
self-designing organisation", Administrative Science Quarterly, , pp. 41-65.
Heise, D.R. (1969) "Separating reliability and stability in test-retest correlation", American
Sociological Review, , pp. 93-101.
Hendrickson, A.R. (2003) "Human resource information systems: Backbone technology of
contemporary human resources", Journal of Labor Research, vol. 24, no. 3, pp. 382-394.
Hoffman, N. and Klepper, R. (2000) "Assimilating new technologies: The role of organisational
culture", Information Systems Management, vol. 17, no. 3, pp. 1-7.
Hofstede, G. (1998) "Attitudes, values and organisational culture: Disentangling the concepts",
Organisation Studies, vol. 19, no. 3, pp. 477-493.
Hofstede, G.H. (2001) Culture's consequences: Comparing values, behaviors, institutions and
organisations across nations, Sage.
Hollenstein, H. (2004) "Determinants of the adoption of information and communication
technologies (ICT): an empirical analysis based on firm-level data for the Swiss business
sector", Structural Change and Economic Dynamics, vol. 15, no. 3, pp. 315-342.
Hooi, L.W. (2006) "Implementing e-HRM: the readiness of small and medium sized manufacturing
companies in Malaysia", Asia Pacific Business Review, vol. 12, no. 4, pp. 465-485.
Hooijberg, R. and DiTomaso, N. (1996) "Leadership in and of demographically diverse
organisations", The Leadership Quarterly, vol. 7, no. 1, pp. 1-19.
245
Huber, G.P., Sutcliffe, K.M., Miller, C.C. and Glick, W.H. (1993) "Understanding and predicting
organisational change", Organisational change and redesign: Ideas and insights for
improving performance, , pp. 215-254.
Huff, S.L. and Yoong, P. (2000) SME and E-commerce: Current Issues and Concerns: a
Preliminary Report, Victoria University of Wellington.
Humphrey, J., Mansell, R., Paré, D. and Schmitz, H. (2003) "Reality of e-commerce with
developing countries", .
Huselid, M.A., Jackson, S.E. and Schuler, R.S. (1997) "Technical and strategic human resources
management effectiveness as determinants of firm performance", Academy of Management
journal, vol. 40, no. 1, pp. 171-188.
Hussain, Z., Wallace, J. and Cornelius, N.E. (2007) "The use and impact of human resource
information systems on human resource management professionals", Information &
Management, vol. 44, no. 1, pp. 74-89.
Ichniowski, C., Shaw, K. and Prennushi, G. (1995) The effects of human resource management
practices on productivity, .
Igbaria, M., Parasuraman, S. and Baroudi, J.J. (1996) "A motivational model of microcomputer
usage", Journal of Management Information Systems, , pp. 127-143.
Irani, Z., Love, P.E., Elliman, T., Jones, S. and Themistocleous, M. (2005) "Evaluating e‐government: learning from the experiences of two UK local authorities", Information Systems
Journal, vol. 15, no. 1, pp. 61-82.
Iwu, C. and Benedict, H. (2013) "Economic recession and investment on human resource
information systems (HRIS): Perspectives on some South African firms", Journal of
Management Development, vol. 32, no. 4, pp. 404-418.
Jackson, S. (2011) "Organisational culture and information systems adoption: a three-perspective
approach", Information and Organisation, vol. 21, no. 2, pp. 57-83.
Jan, M.2. (2008) "Theorizing Adoption of Innovation in Organisation,Global Media Journal ",
Global Media Journal, vol. 1, no. 2, pp. 24-35.
Jarvenpaa, S.L. and Ives, B. (1991) "Executive involvement and participation in the management
of information technology", MIS quarterly, vol. 15, no. 2, pp. 205-227.
Jayasingam, S., Ansari, M.A. and Jantan, M. (2010) "Influencing knowledge workers: the power of
top management", Industrial Management & Data Systems, vol. 110, no. 1, pp. 134-151.
Jenkins, M.L. and Lloyd, G. (1985) "How corporate philosophy and strategy shape the use of HR
information systems", Personnel, vol. 62, no. 5, pp. 28-38.
Jeon, B.N., Han, K.S. and Lee, M.J. (2006) "Determining factors for the adoption of e-business: the
case of SMEs in Korea", Applied Economics, vol. 38, no. 16, pp. 1905-1916.
Jeyaraj, A., Rottman, J.W. and Lacity, M.C. (2006) "A review of the predictors, linkages, and
biases in IT innovation adoption research", Journal of Information Technology, vol. 21, no. 1,
pp. 1-23.

246
Johannessen, J. (1994) "Information technology and innovation: identifying critical innovation
factors", Information management & computer security, vol. 2, no. 2, pp. 4-9.
John W. Creswell (2009) Research design: Qualitative, quantitative, and mixed methods
approaches, Sage.
Jones, M.C. and Arnett, K.P. (1994) "Linkages between the CEO and the IS environment: an
empirical assessment", Information Resources Management Journal (IRMJ), vol. 7, no. 1, pp.
20-33.
Julnes, P.L. and Holzer, M. (2001) "Promoting the utilisation of performance measures in public
organisations: An empirical study of factors affecting adoption and implementation", Public
administration review, vol. 61, no. 6, pp. 693-708.
Junaid, Z., Muhammad, S. and Norazuwa, M. (2010) "An Analysis of E-Human Resource
Management Practices: A Case Study of State Bank of Pakistan", European Journal of Social
Sciences, vol. 15, no. 1, pp. 18-26.
Kamal, M.M. (2006) "IT innovation adoption in the government sector: identifying the critical
success factors", Journal of Enterprise Information Management, vol. 19, no. 2, pp. 192-222.
Kapurubandara, M. and Lawson, R. (2008) "Availability of e-commerce support for SMEs in
developing countries", International Journal on Advances in ICT for Emerging Regions
(ICTer), vol. 1, no. 1, pp. 3-11.
Karahanna, E., Straub, D.W. and Chervany, N.L. (1999) "Information technology adoption across
time: a cross-sectional comparison of pre-adoption and post-adoption beliefs", Mis Quarterly,
, vol.23, no. 2,pp. 183-213.
Karakanian, M. (2000) "Are human resources departments ready for e-HR?", Information Systems
Management, vol. 17, no. 4, pp. 1-5.
Katz, M.L. and Shapiro, C. (1994) "Systems competition and network effects", The Journal of
Economic Perspectives, vol. 8, no. 2, pp. 93-115.
Katz, M.L. and Shapiro, C. (1986) "Technology adoption in the presence of network externalities",
The journal of political economy, , pp. 822-841.
Katz, M.L. and Shapiro, C. (1985) "Network externalities, competition, and compatibility", The
American Economic Review, vol. 75, no. 3, pp. 424-440.
Kavanagh, M.J., Gueutal, H.G. and Tannenbaum, S.I. (1990) Human resource information
systems: Development and application, PWS-Kent Publishing Company Boston.
Kearney, R.C., Feldman, B.M. and Scavo, C.P.F. (2000) "Reinventing government: City manager
attitudes and actions", Public administration review, vol. 60, no. 6, pp. 535-548.
Kendall, J.D., Tung, L.L., Chua, K.H., Ng, C.H.D. and Tan, S.M. (2001) "Receptivity of
Singapore's SMEs to electronic commerce adoption", The Journal of Strategic Information
Systems, vol. 10, no. 3, pp. 223-242.
Kerlinger, F.N. (1986) "Foundations of Behavioral Research . Chicago: Holt, Rinehart and
Winston", Inc.Gulati, Bristow, and Don, vol. 85.
247
Kettley, P., Reilly, P. and University of Sussex. Institute for Employment Studies (United
Kingdom) (2003) "eHR: An introduction", REPORT-INSTITUTE FOR EMPLOYMENT
STUDIES, .
Khoumbati, K., Themistocleous, M. and Irani, Z. (2006) "Evaluating the adoption of enterprise
application integration in health-care organisations", Journal of Management Information
Systems, vol. 22, no. 4, pp. 69-108.
Kim, C. and Galliers, R.D. (2004) "Toward a diffusion model for Internet systems", Internet
Research, vol. 14, no. 2, pp. 155-166.
Kimberly, J.R. and Evanisko, M.J. (1981) "Organisational innovation: The influence of individual,
organisational, and contextual factors on hospital adoption of technological and administrative
innovations", Academy of management journal,vol.24,no.4 , pp. 689-713.
King, W.R. and Teo, T.S.H. (1996) "Key dimensions of facilitators and inhibitors for the strategic
use of information technology", Journal of Management Information Systems,vol 12,no.4 , pp.
35-53.
King, W.R. and Sabherwal, R. (1992) "The factors affecting strategic information systems
applications: an empirical assessment", Information & Management, vol. 23, no. 4, pp. 217-
235.
Kinnear, T.C. and Taylor, J.R. (1987) Marketing research: an applied approach, McGraw-Hill
New York.
Kinnie, N. and Arthurs, A. (1993) "Will personnel people ever learn to love the computer?",
PERSONNEL MANAGEMENT-LONDON-, , pp. 46-46.
Kirrane, D.E. (1990) "Managing Values: A Systematic Approach to Business Ethics.", Training
and development journal, .
Kitchell, S. (1995) "Corporate culture, environmental adaptation, and innovation adoption: a
qualitative/quantitative approach", Journal of the Academy of Marketing Science, vol. 23, no.
3, pp. 195-205.
Klein, K.J. and Sorra, J.S. (1996) "The challenge of innovation implementation", Academy of
management review,vol.21,no.4 , pp. 1055-1080.
Kneller, R., & Stevens, P. A. (2006). Frontier Technology and Absorptive Capacity: Evidence from
OECD Manufacturing Industries*. Oxford Bulletin of Economics and Statistics, vol.68,no.1,
1-21.
Kochanski, J.T. and Ruse, D.H. (1996) "Designing a competency‐based human resources
organisation", Human resource management, vol. 35, no. 1, pp. 19-33.
Kossek, E.E., Young, W., Gash, D.C. and Nichol, V. (1994) "Waiting for innovation in the human
resources department: Godot implements a human resource information system", Human
resource management, vol. 33, no. 1, pp. 135-159.
Kossek, E.E. (1987) "Human resources management innovation", Human resource management,
vol. 26, no. 1, pp. 71-92.
Kovach, K.A. and Cathcart, C.E. (1999) "Human resource information systems (HRIS): Providing
business with rapid data access, information exchange and strategic advantage", Public
Personnel Management, vol. 28, pp. 275-282.
248
Kovach, K.A., Hughes, A.A., Fagan, P. and Maggitti, P.G. (2002) "Administrative and strategic
advantages of HRIS", Employment relations today, vol. 29, no. 2, pp. 43-48.
Kraut, R.E., Rice, R.E., Cool, C. and Fish, R.S. (1998) "Varieties of social influence: The role of
utility and norms in the success of a new communication medium", Organisation Science, ,
pp. 437-453.
Krishna, C. and Bhaskar, S.V. (2011) "Assessment of support and benefits of HRIS in medium-
scale textile industries", International Journal of Research in Economics & Social Sciences,
vol. 1, no. 2, pp. 48-57.
Kuan, K.K.Y. and Chau, P.Y.K. (2001) "A perception-based model for EDI adoption in small
businesses using a technology–organisation–environment framework", Information &
Management, vol. 38, no. 8, pp. 507-521.
Kundu, S. and Kadian, R. (2012) "Applications of HRIS in Human Resource Management in India:
A Study", European Journal of Business and Management, vol. 4, no. 21, pp. 34-41.
Kwon, T.H. and Zmud, R.W. (1987) "Unifying the fragmented models of information systems
implementation", Critical issues in information systems research, , pp. 227-251.
Lado, A.A. and Wilson, M.C. (1994) "Human resource systems and sustained competitive
advantage: A competency-based perspective.", Academy of management review, vol. 19, no.
4, pp. 699-727.
Lai, V.S. and Guynes, J.L. (1997) "An assessment of the influence of organisational characteristics
on information technology adoption decision: a discriminative approach", Engineering
Management, IEEE Transactions on, vol. 44, no. 2, pp. 146-157.
Lau, G. and Hooper, V. (2008) "Adoption of e-HRM in large New Zealand organisations",
Encyclopedia of Human Resource Information Systems, , pp. 31-41.
Lee, G. and Xia, W. (2006) "Organisational size and IT innovation adoption: A meta-analysis",
Information & Management, vol. 43, no. 8, pp. 975-985.
Lee, I. (2005) "The evolution of e-recruiting: a content analysis of Fortune 100 career web sites",
Journal of Electronic Commerce in Organisations (JECO), vol. 3, no. 3, pp. 57-68.
Lehmann, D.R. and Hulbert, J. (1972) "Are three-point scales always good enough?", Journal of
Marketing Research, vol. 9, no. 4, pp. 444-446.
Lengnick-Hall, M.L. and Moritz, S. (2003) "The impact of e-HR on the human resource
management function", Journal of Labor Research, vol. 24, no. 3, pp. 365-379.
Lepak, D.P. and Snell, S.A. (1998) "Virtual HR: Strategic human resource management in the 21st
century", Human resource management review, vol. 8, no. 3, pp. 215-234.
Levy, M., Powell, P. and Yetton, P. (2001) "SMEs: aligning IS and the strategic context", Journal
of Information Technology, vol. 16, no. 3, pp. 133-144.
Limthongchai, P. and Speece, M.W. (2003) "The effect of perceived characteristics of innovation
on e-commerce adoption by SMEs in Thailand", Proceedings of the Seventh International
Conference on Global Business and Economic DevelopmentCiteseer, , pp. 8.

249
Lin, C.Y.Y. (1997) "Human resource information systems: Implementation in Taiwan", Research
and Practice in Human Resource Management, vol. 5, no. 1, pp. 57-72.
Lock, E. and Kirkpatrick, S. (1995) "Promoting creativity in organisations", Creative Action in
Organisations: Ivory Tower Visions and Real World Voices, , pp. 115-120.
Lonti, Z. (2005) "How Much Decentralisation?", The American Review of Public Administration,
vol. 35, no. 2, pp. 122-136.
Louis, M.R. (1980) "Surprise and sense making: What newcomers experience in entering
unfamiliar organisational settings", Administrative Science Quarterly, , pp. 226-251.
Lu, H.P. and Wang, J.Y. (1997) "The relationships between management styles, user participation,
and system success over MIS growth stages", Information & Management, vol. 32, no. 4, pp.
203-213.
Lu, J., Yao, J.E. and Yu, C.S. (2005) "Personal innovativeness, social influences and adoption of
wireless Internet services via mobile technology", The Journal of Strategic Information
Systems, vol. 14, no. 3, pp. 245-268.
Lucas, H.C. (1975) "Performance and the use of an information system", Management Science,
vol. 21, no. 8, pp. 908-919.
Luck, D.J. and Rubin, R.S. (1987) Instructor's Manual with Tests and Transparency Masters
Marketing Research, Prentice-Hall.
Maier, C., Laumer, S., Eckhardt, A. and Weitzel, T. (2013) "Analyzing the impact of HRIS
implementations on HR personnel’s job satisfaction and turnover intention", The Journal of
Strategic Information Systems, vol. 22, no. 3, pp. 193-207.
Mangan, J., Lalwani, C. and Gardner, B. (2004) "Combining quantitative and qualitative
methodologies in logistics research", International Journal of Physical Distribution &
Logistics Management, vol. 34, no. 7, pp. 565-578.
Manross, G.G. and Rice, R.E. (1986) "Don't hang up: organisational diffusion of the intelligent
telephone", Information & Management, vol. 10, no. 3, pp. 161-175.
Mansfield, E. (1986) "Microeconomics of technological innovation", THE POSITIVE SUM
STRATEGY: HARNESSING TECHNOLOGY FOR ECONOMIC GROWTH307, vol. 308, pp.
312-315.
Markova, G. (2012) "Building dynamic capabilities: the case of HRIS", Management Research:
The Journal of the Iberoamerican Academy of Management, vol. 10, no. 2, pp. 81-98.
Markus, M. (1990) "Toward a'Critical Mass' Theory of Interactive Media. Organisations and
Communication Technology. J. Fulk and C. Steinfield", vol. 14, no. 5 , 491-511 .
Marler, J.H., Fisher, S.L. and Ke, W. (2009) "EMPLOYEE SELF‐SERVICE TECHNOLOGY
ACCEPTANCE: A COMPARISON OF PRE‐IMPLEMENTATION AND POST‐IMPLEMENTATION RELATIONSHIPS", Personnel Psychology, vol. 62, no. 2, pp. 327-
358.
Martins, E. and Terblanche, F. (2003) "Building organisational culture that stimulates creativity
and innovation", European Journal of Innovation Management, vol. 6, no. 1, pp. 64-74.
250
Masum, H., Rao, A., Good, B.M., Todd, M.H., Edwards, A.M., Chan, L., Bunin, B.A., Su, A.I.,
Thomas, Z. and Bourne, P.E. (2013) "Ten Simple Rules for Cultivating Open Science and
Collaborative R&D", PLoS computational biology, vol. 9, no. 9.
Mathieson, K. (1991) "Predicting user intentions: comparing the technology acceptance model with
the theory of planned behavior", Information systems research, vol. 2, no. 3, pp. 173-191.
Mathis, R. "Jackson. JH (2003)", Human resource management, .
Mathys, N. and LaVan, H. (1982) "A survey of the human resource information systems (HRIS) of
major companies", Human Resource Planning, vol. 5, no. 2, pp. 83-90.
Mayfield, M., Mayfield, J. and Lunce, S. (2003) "Human resource information systems: A review
and model development", Advances in Competitiveness Research, vol. 11, no. 1, pp. 139-151.
McCloskey, D. (2003) "Evaluating Electronic Commerce Acceptance with the Technology
Acceptance Model.", Journal of Computer Information Systems, vol. 44, no. 2.
McDaniel, C. and Gates, R. (2006) "Marketing Research, 7", Auflage, Hoboken, .
McMurray, A., Pearson, Paul Spoonley David George, Scott, D. and Pace, R.W. (2004) Research:
A commonsense approach, Cengage Learning Australia.
Meade, J. (2000) "Web-based HRIS meets multiple needs", HR Magazine, vol. 45, no. 8, pp. 129-
131.
Mehrtens, J., Cragg, P.B. and Mills, A.M. (2001) "A model of Internet adoption by SMEs",
Information & management, vol. 39, no. 3, pp. 165-176.
Moch, M.K. and Morse, E.V. (1977) "Size, centralisation and organisational adoption of
innovations", American Sociological Review, , pp. 716-725.
Mohrman, S., Lawler, E. and McMahon, G. (1996) "New directions for the human resources
organisation", Los Angeles: Center for Effective Organisations, University of Southern
California, .
Molla, A. and Licker, P.S. (2005) "Perceived e-readiness factors in e-commerce adoption: an
empirical investigation in a developing country", International Journal of Electronic
Commerce, vol. 10, no. 1, pp. 83-110.
Moon, K. and Ngai, E. (2008) "The adoption of RFID in fashion retailing: a business value-added
framework", Industrial Management & Data Systems, vol. 108, no. 5, pp. 596-612.
Moon, M.J. (2001) "Municipal reinvention: Managerial values and diffusion among
municipalities", Journal of Public Administration Research and Theory, vol. 11, no. 3, pp.
327-352.
Moon, M.J. and Norris, D.F. (2005) "Does managerial orientation matter? The adoption of
reinventing government and e‐government at the municipal level*", Information Systems
Journal, vol. 15, no. 1, pp. 43-60.
Mooney, J. (2002) "Pre-Employment Testing on the Internet: Put Candidates a Click Away and
Hire at Modem Speed.", Public Personnel Management, vol. 31, no. 1, pp. 41-52.
251
Moore, G.C. and Benbasat, I. (1991) "Development of an instrument to measure the perceptions of
adopting an information technology innovation", Information systems research, vol. 2, no. 3,
pp. 192-222.
Morgan, A., Colebourne, D. and Thomas, B. (2006) "The development of ICT advisors for SME
businesses: An innovative approach", Technovation, vol. 26, no. 8, pp. 980-987.
Morgan, G. (2007) "National business systems research: Progress and prospects", Scandinavian
journal of Management, vol. 23, no. 2, pp. 127-145.
MOSER, C.Y.K. "G.(1989) Survey methods in social Investigation", Gower, Aldershot, .
Mumford, M.D. (2000) "Managing creative people: strategies and tactics for innovation", Human
resource management review, vol. 10, no. 3, pp. 313-351.
Murad, M.A. and Thomson, J.D. (2011)"External Environment Factors Influencing the Technology
Adoption-Diffusion Decision in Malaysian Manufacturing Small Medium Enterprises
(SMEs)", .
Murphy, G.D. and Southey, G. (2003) "High performance work practices: perceived determinants
of adoption and the role of the HR practitioner", Personnel Review, vol. 32, no. 1, pp. 73-92.
Netemeyer, R.G., Bearden, W.O. and Sharma, S. (2003) Scaling procedures: Issues and
applications, Sage.
Ngai, E.W., Law, C.C. and Wat, F.K. (2008) "Examining the critical success factors in the adoption
of enterprise resource planning", Computers in Industry, vol. 59, no. 6, pp. 548-564.
Ngai, E. and Wat, F. (2006) "Human resource information systems: a review and empirical
analysis", Personnel Review, vol. 35, no. 3, pp. 297-314.
Ngai, E. and Wat, F. (2004) "Dominance approach to risk analysis of computer systems", Decision
Support Systems.v37 i4, , pp. 485-500.
Nguyen, T.H. (2009) "Information technology adoption in SMEs: an integrated framework",
International Journal of Entrepreneurial Behaviour & Research, vol. 15, no. 2, pp. 162-186.
Nicolaou, A.I. (2004) "Firm performance effects in relation to the implementation and use of
enterprise resource planning systems", Journal of Information Systems, vol. 18, pp. 79.
Nunnally, J.C. (2010) Psychometric Theory 3E, Tata McGraw-Hill Education.
Nunnally, J.C., Bernstein, I.H. and Berge, J.M.t. (1967) Psychometric theory, McGraw-Hill New
York.
Nystrom, P.C., Ramamurthy, K. and Wilson, A.L. (2002) "Organisational context, climate and
innovativeness: adoption of imaging technology", Journal of Engineering and Technology
Management, vol. 19, no. 3, pp. 221-247.
O'Connell, S. (1996) "Virtual HR, An Economic Reality", HR MAGAZINE, vol. 41, pp. 37-42.
Oliveira, T. and Martins, M.F. (2011) "Literature Review of Information Technology Adoption
Models at Firm Level", The Electronic Journal Information Systems Evaluation, vol. 14, no.
1, pp. 110-121.

252
O'Reilly, C.A., Chatman, J. and Caldwell, D.F. (1991) "People and organisational culture: A profile
comparison approach to assessing person-organisation fit.", Academy of management journal,
vol. 34, no. 3, pp. 487-516.
Orlikowski, W.J. and Barley, S.R. (2001) "Technology and institutions: what can research on
information technology and research on organisations learn from each other?", MIS quarterly,
vol. 25, no. 2, pp. 145-165.
Orlikowski, W.J. and Baroudi, J.J. (1991) "Studying information technology in organisations:
Research approaches and assumptions", Information systems research, vol. 2, no. 1, pp. 1-28.
Osterman, P. (1994) "How common is workplace transformation and who adopts it?", Industrial
and labor relations review, , pp. 173-188.
Overman, S. (1992) "Reaching for the 21st Century", HR MAGAZINE, vol. 37, pp. 61-61.
Palvia, P., Means Jr, D.B. and Jackson, W.M. (1994) "Determinants of computing in very small
businesses", Information & Management, vol. 27, no. 3, pp. 161-174.
Pan, M. and Jang, W. (2008) "DETERMINANTS OF THE ADOPTION OF ENTERPRISE
RESOURCE PLANNING WITHIN THE TECHNOLOGY-ORGANISATION-
ENVIRONMENT FRAMEWORK: TAIWAN'S COMMUNICATIONS INDUSTRY.",
Journal of Computer information systems, vol. 48, no. 3.
Panayotopoulou, L., Vakola, M. and Galanaki, E. (2007) "E-HR adoption and the role of HRM:
evidence from Greece", Personnel Review, vol. 36, no. 2, pp. 277-294.
Papalexandris, N. and Panayotopoulou, L. (2005a) "Exploring the partnership between line
managers and HRM in Greece", Journal of European Industrial Training, vol. 29, no. 4, pp.
281-291.
Parthasarathy, M. and Bhattacherjee, A. (1998) "Understanding post-adoption behavior in the
context of online services", Information Systems Research, vol. 9, pp. 362-379.
Patterson, K.A., Grimm, C.M. and Corsi, T.M. (2003) "Adopting new technologies for supply
chain management", Transportation Research Part E: Logistics and Transportation Review,
vol. 39, no. 2, pp. 95-121.
Penning,J.M., "Coordination Between Strategically Independent Organisation".In Handbook for
organisation Design ,Nystrow,P.&W.Starback (ed),Amsterdam :Elsever ,(1979).
Perreault, W.D., Behrman, D.N. and Armstrong, G.M. (1979) "Alternative approaches for
interpretation of multiple discriminant analysis in marketing research", Journal of Business
Research, vol. 7, no. 2, pp. 151-173.
Perry, L.A. (2006) "Risk, error and accountability: improving the practice of school leaders",
Educational Research for Policy and Practice, vol. 5, no. 2, pp. 149-164.
Peter, J.P. (1979) "Reliability: a review of psychometric basics and recent marketing practices",
Journal of Marketing Research, , pp. 6-17.
Phang, C.W., Sutanto, J., Kankanhalli, A., Li, Y., Tan, B.C. and Teo, H. (2006) "Senior citizens'
acceptance of information systems: A study in the context of e-government services",
Engineering Management, IEEE Transactions on, vol. 53, no. 4, pp. 555-569.
253
Pierce, J.L. and Delbecq, A.L. (1977) "Organisation structure, individual attitudes and innovation",
Academy of management review, , pp. 27-37.
Pitman, B. (1994) "Critical success factors to organisational change", Journal of Systems
Management, vol. 45, no. 9, pp. 40.
Premkumar, G. and King, W.R. (1994) "Organisational characteristics and information systems
planning: an empirical study", Information Systems Research, vol. 5, no. 2, pp. 75-109.
Premkumar, G. and Roberts, M. (1999) "Adoption of new information technologies in rural small
businesses", Omega, vol. 27, no. 4, pp. 467-484.
Premkumar, G., Ramamurthy, K. and Saunders, C.S. (2003) "Information processing view of
organisations: an exploratory examination of fit in the context of interorganisational
relationships", Journal of Management Information Systems, vol. 22, no. 1, pp. 257-294.
Provan, K.G. and Skinner, S.J. (1989) "INTERORGANISATIONAL DEPENDENCE AND
CONTROL AS PREDICTORS OF OPPORTUNISM IN DEALER-SUPPLIER
RELATIONS.", Academy of management Journal, vol. 32, no. 1, pp. 202-212.
Punch, K. (1998) "Introduction to social research: Quantitative and qualitative methods", .
Quaddus, M. and Hofmeyer, G. (2007) "An investigation into the factors influencing the adoption
of B2B trading exchanges in small businesses", European Journal of Information Systems,
vol. 16, no. 3, pp. 202-215.
Quinn, J.B. (1986) "Technology adoption: The services industries", The Positive Sum Strategy:
Harnessing Technology for Economic Growth, , pp. 357-371.
Ramamurthy, K.R., Sen, A. and Sinha, A.P. (2008) "An empirical investigation of the key
determinants of data warehouse adoption", Decision Support Systems, vol. 44, no. 4, pp. 817-
841.
Rashid, M. and Al-Qirim, N. (2001) "E-commerce technology adoption framework by New
Zealand small to medium size enterprises", Research Letters in the Information and
Mathematical Sciences, vol. 2, no. 1, pp. 63-70.
Raymond, L. (1990) "Organisational context and information systems success: a contingency
approach", Journal of Management Information Systems,vol.6,no.4 , pp. 5-20.
Raymond, L. and Bergeron, F. (1996) "EDI success in small and medium‐sized enterprises: A field
study", Journal of Organisational Computing and Electronic Commerce, vol. 6, no. 2, pp.
161-172.
Razali, M.Z. and Vrontis, D. (2010) "The Reactions of Employees Toward the Implementation of
Human Resources Information Systems (HRIS) as a Planned Change Program: A Case Study
in Malaysia", Journal of Transnational Management, vol. 15, no. 3, pp. 229-245.
Reddick, C. (2009) "Human Resources Information Systems in Texas City Governments: Scope
and Perception of Its Effectiveness", Public Personnel Management, vol. 38, no. 4, pp. 19-34.
Rezaei, A., Asadi, A., Rezvanfar, A. and Hassanshahi, H. (2009) "The impact of organisational
factors on management information system success: An investigation in the Iran's agricultural
extension providers", The International Information & Library Review, vol. 41, no. 3, pp.
163-172.

254
Rivera, M.D., Streib, G. and Willoughby, K.G. (2000) "Reinventing government in council-
manager cities: Examining the role of city managers", Public Performance & Management
Review, , pp. 121-132.
Robbins, S. "P., & Judge, T, A.(2007)", Organisational behaviour, .
Robbins, S. P., & Kotze, R. S. (1994). Management, Canadian. Scarborough, ON: Prentice-Hall
Canada Inc.
Roberts, B. (1999) "Who's in charge of HRIS?", HR Magazine, vol. 44, no. 6, pp. 130-135.
Roberts, E.B. and Berry, C.A. (1984) "Entering new businesses: selecting strategies for success", .
Rogers, E.M. (1995) Diffusion of innovations, Free Pr.
Rogers, E.M. and Shoemaker, F. (1983) "Diffusion of innovation: A cross-cultural approach", New
York, .
Rogers, E.M. (1991) "The ‘critical mass’ in the diffusion of interactive technologies in
organisations", The information systems research challenge: survey research methods, vol. 3,
pp. 245-263.
Rogers, E.M. and Shoemaker, F.F. (1971) "Communication of Innovations; A Cross-Cultural
Approach.", .
Rogers, E.M. and Singhal, A. (2003) "Empowerment and communication: Lessons learned from
organizing for social change", Communication yearbook, vol. 27, pp. 67-86.
Rogers, J.C. and Coleman, J.S. (2003) "Interactions between the Atlantic Multidecadal Oscillation,
El Nino/La Nina, and the PNA in winter Mississippi valley stream flow", Geophysical
Research Letters, vol. 30, no. 10.
Ruël, H., Bondarouk, T. and Looise, J.K. (2004) "e-HRM: innovation or irritation: an explorative
empirical study in five large companies on web-based HRM", Management Revue, vol. 15,
no. 3, pp. 364-380.
Ruppel, C.P. and Howard, G.S. (1998) "Facilitating innovation adoption and diffusion: the case of
telework", Information Resources Management Journal (IRMJ), vol. 11, no. 3, pp. 5-16.
Ruta, C.D. (2005) "The application of change management theory to HR portal implementation in
subsidiaries of multinational corporations", Human resource management, vol. 44, no. 1, pp.
35-53.
Rye, C.B. and Kimberly, J.R. (2007) "The adoption of innovations by provider organisations in
health care", Medical Care Research and Review, vol. 64, no. 3, pp. 235-278.
Sabet, M.G. and Klingner, D. (1993) "Exploring the impact of professionalism on administrative
innovation", Journal of Public Administration Research and Theory, vol. 3, no. 2, pp. 252-
266.
Sadiq, U., Fareed Khan, A., Ikhlaq, K. and Mujtaba, B.G. (2012) "The Impact of Information
Systems on the Performance of Human Resources Department.", Journal of Business Studies
Quarterly, vol. 3, no. 4.

255
Sadowski, B.M., Maitland, C. and van Dongen, J. (2002) "Strategic use of the internet by small-and
medium-sized companies: an exploratory study", Information Economics and Policy, vol. 14,
no. 1, pp. 75-93.
Samkarpad, S. (2013) "Status of Human Resource Information Systems (HRIS) in Universities and
Affiliated Colleges in Hyderabad", The IUP Journal of Organisational Behavior, vol. 12, no.
2, pp. 20-42.
Scupola, A. (2003) "Government intervention in SMEs e-commerce adoption: an institutional
approach", Proceedings of 7th Asia Conference on Information Systems, Adilade, South
Australia, pp. 10.
Sekaran, Uma. "Research Methods for Business: A Skill Building Approach. 2003." John Willey
and Sons, New York.
Sekaran, U. & Bougie, R. " Research methods for business: A skill building approach (5th ed.).
Chichester: John Willey & Sons Ltd ", 2010, .
Sekaran, U. and Bougie, R. (2010) "Research methods for business: A skill building approach.
Wiley", .
Sharma, A. and Citurs, A. (2005) "Radio Frquency Identification (RFID) Adoption Drivers: A
Radical Innovation Adoption Perspective", .
Shore, L.M., Tetrick, L.E., Taylor, M.S., Jaqueline, A., Liden, R.C., Parks, J.M., Morrison, E.W.,
Porter, L.W., Robinson, S.L. and Roehling, M.V. (2004) The employee-organisation
relationship: A timely concept in a period of transition, Emerald Group Publishing Limited.
Shrivastava, S. and Shaw, J.B. (2003) "Liberating HR through technology", Human resource
management, vol. 42, no. 3, pp. 201-222.
Siegel, S. (1956) Nonparametric statistics for the behavioural sciences, McGraw-Hill.
Silva, L., Figueroa B, E. and González-Reinhart, J. (2007) "Interpreting IS alignment: a multiple
case study in professional organisations", Information and Organisation, vol. 17, no. 4, pp.
232-265.
Smale, A. and Heikkilä, J. (2009) "IT-Based Integration of HRM in a Foreign MNC Subsidiary: A
Micro-Political Perspective", Handbook of Research on E-Transformation and Human
Resources Management Technologies: Organisational Outcomes and Challenges, , pp. 153-
170.
Soh, C.P., Yap, C.S. and Raman, K. (1992) "Impact of consultants on computerisation success in
small businesses", Information & Management, vol. 22, no. 5, pp. 309-319.
Southern, A. and Tilley, F. (2000) "Small firms and information and communication technologies
(ICTs): toward a typology of ICTs usage", New technology, work and employment, vol. 15,
no. 2, pp. 138-154.
Stahl, F. and Maass, W. (2006) "Adoption and diffusion in electronic markets: an empirical
analysis of attributes influencing the adoption of paid content", Electronic Markets, vol. 16,
no. 3, pp. 233-244.
Standen, P. and Sinclair-Jones, J. (2004) "eWork in regional Australia", Rural Industries Research
and Development Corporation, Canberra, .

256
Starbuck, W.H. (1983) "Organisations as action generators", American Sociological Review, , pp.
91-102.
Stoneman, P.L. and David, P.A. (1986) "Adoption subsidies vs information provision as
instruments of technology policy", The Economic Journal, vol. 96, pp. 142-150.
Strohmeier, S. (2007) "Research in e-HRM: Review and implications", Human Resource
Management Review, vol. 17, no. 1, pp. 19-37.
Strohmeier, S. and Kabst, R. (2009) "Organisational adoption of e-HRM in Europe: An empirical
exploration of major adoption factors", Journal of Managerial Psychology, vol. 24, no. 6, pp.
482-501.
Strong, J.W., Broun, K.S. and McCormick, C.T. (1999) McCormick on evidence, West Group, pp.
411-37.
StudyText, C. (1996) "Organisational Management and Development, Stage 3, paper 11", .
Sykes, T.A., Venkatesh, V. and Gosain, S. (2009) "Model of acceptance with peer support: A
social network perspective to understand employees' system use", MIS Quarterly, vol. 33, no.
2, pp. 371.
Syrett, M., & Lammiman, J. (1997). From Leanness to fitness. Developing corporate muscle.
Institute of Personnel and Development, London.
Tabachnick, B.G., Fidell, L.S. and Osterlind, S.J. (2001) "Using multivariate statistics", .
Tabachnick, B. "Fidell. LS (1983)", Using multivariate statistics, .
Tan, K.S., Chong, S.C., Lin, B. and Eze, U.C. (2009) "Internet-based ICT adoption: evidence from
Malaysian SMEs", Industrial Management & Data Systems, vol. 109, no. 2, pp. 224-244.
Tan, M. and Teo, T.S. (2000) "Factors influencing the adoption of Internet banking", Journal of the
AIS, vol. 1, no. 1es, pp. 5.
Tan, M. and Teo, T.S. (1998) "Factors influencing the adoption of the Internet", International
Journal of Electronic Commerce, , pp. 5-18.
Tannenbaum, S.I. (1990) "Human resource information systems: User group implications", Journal
of Systems management, vol. 41, no. 1.
Tansley, C. and Watson, T. (2000) "Strategic exchange in the development of human resource
information systems (HRIS)", New Technology, Work and Employment, vol. 15, no. 2, pp.
108-122.
Teo, T.S.H. (2007) "Organisational characteristics, modes of internet adoption and their impact: A
Singapore perspective", Journal of Global Information Management (JGIM), vol. 15, no. 2,
pp. 91-117.
Teo, T.S.H., Soon, L.G. and Fedric, S.A. (2001) "Adoption and impact of human resource
information systems (HRIS)", Research and Practice in Human Resource Management, vol.
9, no. 1, pp. 101-117.
257
Teo, T.S., Lim, G.S. and Fedric, S.A. (2007) "The adoption and diffusion of human resources
information systems in Singapore", Asia Pacific Journal of Human Resources, vol. 45, no. 1,
pp. 44-62.
Teo, T.S. and Pian, Y. (2003) "A contingency perspective on Internet adoption and competitive
advantage", European Journal of Information Systems, vol. 12, no. 2, pp. 78-92.
Tesluk, P.E., Farr, J.L. and Klein, S.R. (1997) "Influences of organisational culture and climate on
individual creativity", The Journal of Creative Behavior, vol. 31, no. 1, pp. 27-41.
Thompson, R.L., Higgins, C.A. and Howell, J.M. (1991) "Personal computing: toward a conceptual
model of utilisation", MIS quarterly, , pp. 125-143.
Thong, J.Y.L. (2001) "Resource constraints and information systems implementation in
Singaporean small businesses", Omega, vol. 29, no. 2, pp. 143-156.
Thong, J.Y.L. and Yap, C.S. (1995) "CEO characteristics, organisational characteristics and
information technology adoption in small businesses", Omega, vol. 23, no. 4, pp. 429-442.
Thong, J.Y. (1999) "An integrated model of information systems adoption in small businesses",
Journal of Management Information Systems, vol. 15, no. 4, pp. 187-214.
Thong, J.Y. and Yap, C. (1995) "CEO characteristics, organisational characteristics and
information technology adoption in small businesses", Omega, vol. 23, no. 4, pp. 429-442.
Thong, J.Y., Yap, C. and Raman, K. (1996) "Top management support, external expertise and
information systems implementation in small businesses", Information systems research, vol.
7, no. 2, pp. 248-267.
Tidd, J. (2001) "Innovation management in context: environment, organisation and performance",
International Journal of Management Reviews, vol. 3, no. 3, pp. 169-183.
Tornatzky, L.G. and Fleischer, M. (1990) The processes of technological innovation, Lexington
Books.
Tornatzky, L.G. and Klein, K.J. (1982) "Innovation characteristics and innovation adoption-
implementation: A meta-analysis of findings", IEEE Transactions on Engineering
Management, vol. 29, no. 1, pp. 28-45.
Trice, H.M. and Beyer, J.M. (1993) The cultures of work orgranisations, Prentice Hall.
Troshani, I., Jerram, C. and Hill, S.R. (2011) "Exploring the public sector adoption of HRIS",
Industrial Management & Data Systems, vol. 111, no. 3, pp. 470-488.
Tushman, M.L., Anderson, P.C. and O’Reilly, C. (1997) "Technology cycles, innovation streams,
and ambidextrous organisations: organisation renewal through innovation streams and
strategic change", Managing strategic innovation and change, , pp. 3-23.
Tye, E.M.N. and Chau, P.Y. (1995) "A study of information technology adoption in Hong Kong",
Journal of Information Science, vol. 21, no. 1, pp. 11-19.
Ulrich, D. (1997) Human resource champions: The next agenda for adding value and delivering
results, Harvard Business Press.

258
Van Beveren, J. and Thomson, H. (2002) "The use of electronic commerce by SMEs in Victoria,
Australia", Journal of Small Business Management, vol. 40, no. 3, pp. 250-253.
Van de Ven, Andrew H, Angle, H.L. and Poole, M.S. (2000) Research on the management of
innovation: The Minnesota studies, Oxford University Press New York.
Venkatesh, V. and Davis, F.D. (2000) "A theoretical extension of the technology acceptance
model: Four longitudinal field studies", Management science, vol. 46, no. 2 , pp. 186-204.
Venkatesh, V., Morris, M.G., Davis, G.B. and Davis, F.D. (2003) "User acceptance of information
technology: Toward a unified view", MIS quarterly,vol.27,no.3 , pp. 425-478.
Verhoeven, H. and Williams, S. (2008) "Advantages and disadvantages of Internet Recruiting: A
UK Study into Employers’ Perceptions", International Review of Business Research Papers,
vol. 4, no. 1, pp. 364-373.
Voermans, M. and van Veldhoven, M. (2007) "Attitude towards E-HRM: an empirical study at
Philips", Personnel Review, vol. 36, no. 6, pp. 887-902.
Waarts, E., Everdingen, Y.M. and Hillegersberg, J. (2002) "The dynamics of factors affecting the
adoption of innovations", Journal of Product Innovation Management, vol. 19, no. 6, pp. 412-
423.
Wagner, B., Fillis, I. and Johansson, U. (2003) "E-business and e-supply strategy in small and
medium sized businesses (SMEs)", Supply Chain Management: An International Journal, vol.
8, no. 4, pp. 343-354.
Wagner, S.M., Rau, C. and Lindemann, E. (2010) "Multiple informant methodology: a critical
review and recommendations", Sociological Methods & Research, vol. 38, no. 4, pp. 582-618.
Walczuch, R., Van Braven, G. and Lundgren, H. (2000) "Internet adoption barriers for small firms
in the Netherlands", European Management Journal, vol. 18, no. 5, pp. 561-572.
Walker, A.J. (1993) Handbook of human resource information systems: Reshaping the human
resource function with technology, McGraw-Hill, Inc.
Walker, R.M. (2006) "Innovation type and diffusion: An empirical analysis of local government",
Public administration, vol. 84, no. 2, pp. 311-335.
Walker, R.M. and Enticott, G. (2004) "Using multiple informants in public administration:
Revisiting the managerial values and actions debate", Journal of Public Administration
Research and Theory, vol. 14, no. 3, pp. 417-434.
Watson, D., O'Hara, M.W., Simms, L.J., Kotov, R., Chmielewski, M., McDade-Montez, E.A.,
Gamez, W. and Stuart, S. (2007) "Development and validation of the Inventory of Depression
and Anxiety Symptoms (IDAS).", Psychological assessment, vol. 19, no. 3, pp. 253.
Weaver, K. and Olson, J.K. (2006) "Understanding paradigms used for nursing research", Journal
of advanced nursing, vol. 53, no. 4, pp. 459-469.
Weill, P. (1992) "The relationship between investment in information technology and firm
performance: A study of the valve manufacturing sector", Information Systems Research, vol.
3, no. 4, pp. 307-333.
259
Wejnert, B. (2002) "Integrating models of diffusion of innovations: a conceptual framework",
Annual review of sociology,vol.28,no.1 , pp. 297-326.
Williams, R. and Edge, D. (1996) "The social shaping of technology", Research policy, vol. 25, no.
6, pp. 865-899.
Wolfe, J.M. (1994) "Guided search 2.0 a revised model of visual search", Psychonomic bulletin &
review, vol. 1, no. 2, pp. 202-238.
Wolfe, M.J., Shanklin, C. and Ortega, L. (1995) High performance compilers for parallel
computing, Addison-Wesley Longman Publishing Co., Inc.
Wong, B., Monaco, J.A. and Louise Sella, C. (1994) "Disaster Recovery Planning: Suggestions to
Top Management & Information Systems Managers", Journal of Systems Management, vol.
45, pp. 28-28.
Wright, P.M. and Dyer, L. (2000) "People in the e-business: new challenges, new solutions", .
Wu, C., Zhao, J., Xia, L. and Zhu, Z. (2008) "Impact of internal factors on information technology
adoption: an empirical investigation of Chinese firms", Tsinghua Science & Technology, vol.
13, no. 3, pp. 318-322.
Wyatt, W. (2002) eHRe: getting results along the journey–2002 survey report, .
Yang, K.H., Lee, S.M. and Lee, S.G. (2007) "Adoption of information and communication
technology: impact of technology types, organisation resources and management style",
Industrial Management & Data Systems, vol. 107, no. 9, pp. 1257-1275.
Yap, C.S., Thong, J.Y.L. and Raman, K. (1994) "Effect of government incentives on
computerisation in small business", European Journal of Information Systems, vol. 3, no. 3,
pp. 191-206.
Yeh, C.Y. (1997) "Human resource information systems: Implementation in Taiwan. Research &
Practice in Human Resource Management , vol. 5,no.11,pp. 57–72.", .
Yeung, A., Brockbank, W. and Ulrich, D. (1994) "Lower cost, higher value: Human resource
function in transformation", Human Resource Planning, vol. 17, no. 3, pp. 1-16.
Yeung, N., Botvinick, M.M. and Cohen, J.D. (2004) "The neural basis of error detection: conflict
monitoring and the error-related negativity.", Psychological review, vol. 111, no. 4, pp. 931.
Yu, C.S. and Tao, Y.H. (2009) "Understanding business-level innovation technology adoption",
Technovation, vol. 29, no. 2, pp. 92-109.
Zaltman, G., Duncan, R. and Holbek, J. (1973) Innovations and organisations, Wiley New York.
Zhu, K., Dong, S., Xu, S.X. and Kraemer, K.L. (2006) "Innovation diffusion in global contexts:
determinants of post-adoption digital transformation of European companies", European
Journal of Information Systems, vol. 15, no. 6, pp. 601-616.
Zhu, K. and Kraemer, K.L. (2005) "Post-adoption variations in usage and value of e-business by
organisations: cross-country evidence from the retail industry", Information Systems
Research, vol. 16, no. 1, pp. 61-84.

260
Zhu, K., Kraemer, K.L. and Dedrick, J. (2004) "Information technology payoff in e-business
environments: An international perspective on value creation of e-business in the financial
services industry", Journal of Management Information Systems, vol. 21, no. 1, pp. 17-54.
Zhu, K., Kraemer, K. and Xu, S. (2003) "Electronic business adoption by European firms: a cross-
country assessment of the facilitators and inhibitors", European Journal of Information
Systems, vol. 12, no. 4, pp. 251-268.
Zikmund, W. (2003) "Business research methods 7th ed., Thomson/South-Western", .
Zmud, R.W. (1982) "Diffusion of modern software practices: influence of centralisation and
formalisation", Management science, vol. 28, no. 12, pp. 1421-1431.
261
APPENDICES
Appendix 1: The Questionnaire
Dear HR Manager,
The main theme of this study is to develop theoretical framework through the integration of Innovation
Diffusion Theory, Technology organisation environment Model, UTAUT Model and the relevant studies in
the area of HRM, For Measuring the Determinants of the adoption and implementation level of HRIS and Its
effectiveness in business organisations.
The research aspires to obtain an overview of HRIS in Jordan, and believed it will be a valuable contribution
to the available literature. Hereby, I am kindly asking for your assistance in completing this research by
answering the attached questionnaire objectively, since your contribution is vital for this research
accomplishment. Kindly note that the questionnaire will not take more than 15 minutes to complete, and all
received information will be confidential and used solely for the research objectives.
It is not compulsory to participate in this study and you may choose to withdraw at any time even if prior
consent has been given. Also you do not have to give reasons for withdrawal and there are no consequences
attached to your decision if you withdraw.
Complaints: If you have any concerns or complaints regarding the ethical elements of this project please
contact [email protected] highly appreciate your precious cooperation in advance.
Respectfully yours,
Rand Hani Al-Dmour

262
PART ONE
GENERAL INFORMATION General Information 1. What type of business are you currently in?
Bank Insurances services Industrial
2. How many employees are currently working at the organisation? Less than 50 50 99 100199 200 299 More than 300
�
3.How long has your organisation been in business (experience)?
Less than 5 year’s 5 – 9 years 10 15 years More than 15 years
4. Does your organisation have a department for human resources management?
YES NO
5. What is the cumulative percentage of graduates and postgraduates in your organisation?
Less than 20% 20%-39% 40%-59% 60%-80% More than 80%
6. What is the percentage of female employees in your organisation?
Less than 10% 11%-20% 21%-30% 31%-40% More than 40%
7. What is the percentage of employees who are older than 45 years at your organisation?
Less than 10% 11%-20% 21%-30% 31%-40% More than 40
8. Has the organisation adopted HRIS?
Fully adopted Partly adopted Not at all
9. If your answer is (yes) in question (9), how many years has your organisation been using/adopting
HRIS application?
Less than one year 14 years 59 years More than 9 years
10. How many employees are working at your organisation’s human resources
department?
Less than 5 employees 5 10 employees 11 20 employees More than 20 employees
11. Number of IT technical specialists at your organisation?
No one 1 – 3 employees 4 – 6 employees More than 7 employees

263
YOUR PROFILE
12. What is your gender?
Male Female
13. Which category below represents your age?
Less 25 years 25 30 years 3140 years 4150 years More than 50 years
14. What is your educational level?
Secondary Postsecondary certificate/diploma Bachelor’s degree Master’s degree
15. What is the job title for your current position? 16. For how long have you been in your current position?
Less than 3 years 36 years 710 years 1114 years More than 14 years
PART TWO
Specific Information
Please indicate to which extent your organisation has implemented /used HRIS
applications:
17.Implementation Not used
at all
Slightly
Used
Moderately
Used
Frequently
Used
Extremely
Used
Employee recordkeeping.
Recruitment and selection.
Training and development
Payroll \ Benefits management.
Performance appraisal
Internal and external communication
Self-service including web portal.
Turnover tracking/analysis.
Career development planning
Worker compensation
PART THREE
Internal Environment
Please indicate to which extent you agree or disagree with the following statem
ents about your internal organisational
18.Management's expectation (HRIS
characteristics) Strongly
Disagree Disagree Neutral Agree Strongly
Agree HRIS will enable human resources personnel to accomplish tasks
more quickly.
HRIS will improve the quality of the work of human resources
personnel.
HRIS will make it easier for human resources personnel to do
their work.
HRIS will enhance the job effectiveness of Human Resources
personnel.
HRIS will provide timely information for decision-making. HRIS will enable our organisation to cut costs in our operations. HRIS will increase the profitability of our organisation.

264
HRIS will improve our organisation competitive position. HRIS is complex to use. HRIS development is a complex process. HRIS is hard to learn. Integrating HRIS into our current work will be very difficult. Working with HRIS technology is not clear and understandable Learning to operate HRIS technology is not easy for us. The changes introduced by HRIS are compatible with existing operating practices.
Adoption of HRIS is consistent with our organisation’s values and
beliefs
HRIS is compatible with our organisation’s IT infrastructure. HRIS is compatible with our organisation’s computerized data reso
urces
HRIS fits well our organisation beliefs.
19. HR Role Strongly
Disagree
Disagree Neutral Agree Strongly
Agree
The HR is highly involved in strategic decision making
(strategic partner).
The HR actively participates in listening and reacting to employees
(employee champion).
The HR actively participates in changing the organisation (change
agent).
The HR has an explicit HR strategy.
20. Organisation Resources
( Facilitating Conditions) Strongly
Disagree Disagree Neutral Agree Strongly
Agree We have sufficient human resources necessary to use/adopt HRIS technology.
We have the knowledge necessary to use/adopt HRIS technology. We have sufficient financial support to use/adopt HRIS technology.
21. IT experiences and capabilities Strongly
Disagree Disagree Neutral Agree Strongly
Agree A specific person (or group) is available for assistance with HRIS t
echnology.
Human resources personnel's’ understanding of computers is good
compared with other organisations in the industry.
There is at least one computer expert in the human resources department.
All human resources personnel are computer literate. Our employees possess abilities to use computer to solve problems. We have a good quality of IT infrastructure. Availability or adequacy of existing technology and tools. Access to network services or infrastructure to support Web and
Internet Technologies.
22. Social and technology skills of CEO Strongly
Disagree Disagree Neutral Agree Strongly
Agree The CEO's extent of technical and knowledge of IT compared to other people in similar positions.
The CEO's extent social network skills compared to other people
in similar positions.
The CEO's decision making style for IT adoption tends to be people oriented rather than work oriented.
The CEO management’s visibility and exhibited commitment to
adoption of IT applications.
The CEO management's actions show support for the use of new technology.
The CEO has the ability to gain consensus on ideas.
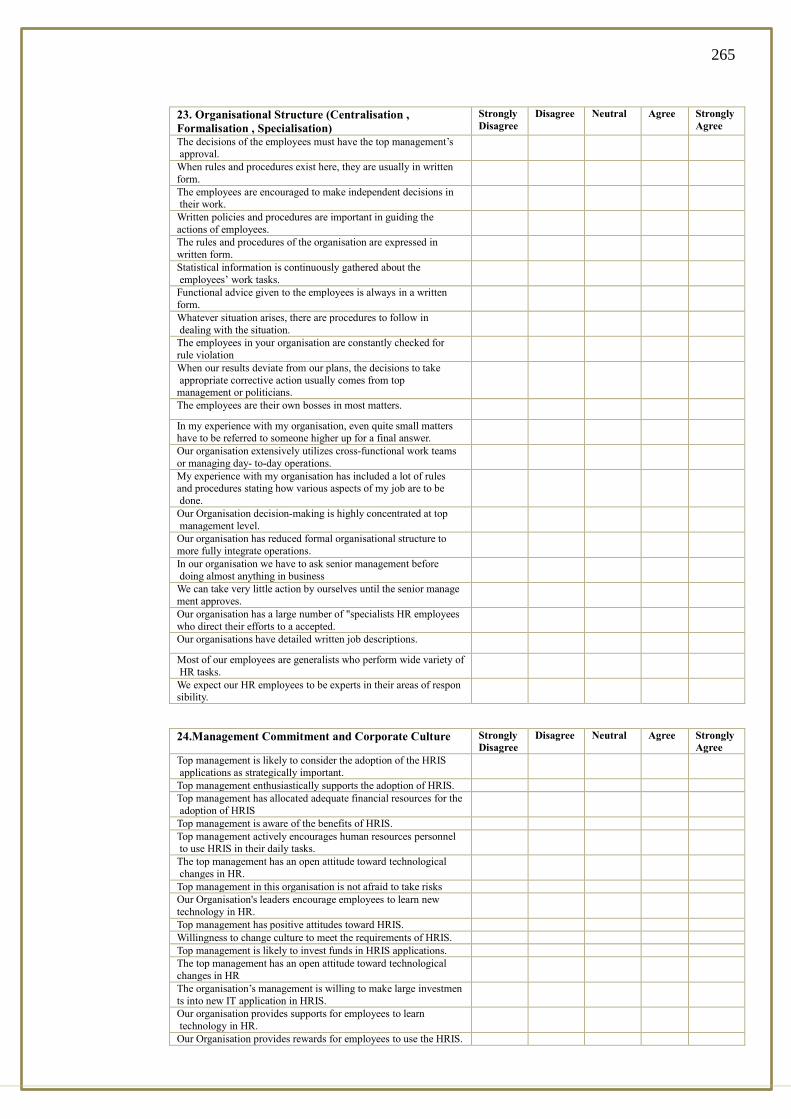
265
23. Organisational Structure (Centralisation ,
Formalisation , Specialisation) Strongly
Disagree Disagree Neutral Agree Strongly
Agree The decisions of the employees must have the top management’s approval. When rules and procedures exist here, they are usually in written
form.
The employees are encouraged to make independent decisions in their work.
Written policies and procedures are important in guiding the
actions of employees.
The rules and procedures of the organisation are expressed in
written form.
Statistical information is continuously gathered about the
employees’ work tasks.
Functional advice given to the employees is always in a written
form.
Whatever situation arises, there are procedures to follow in
dealing with the situation.
The employees in your organisation are constantly checked for
rule violation
When our results deviate from our plans, the decisions to take
appropriate corrective action usually comes from top management or politicians.
The employees are their own bosses in most matters. In my experience with my organisation, even quite small matters have to be referred to someone higher up for a final answer.
Our organisation extensively utilizes crossfunctional work teams
or managing day today operations.
My experience with my organisation has included a lot of rules and procedures stating how various aspects of my job are to be
done.
Our Organisation decision-making is highly concentrated at top
management level.
Our organisation has reduced formal organisational structure to
more fully integrate operations.
In our organisation we have to ask senior management before
doing almost anything in business
We can take very little action by ourselves until the senior manage
ment approves.
Our organisation has a large number of "specialists HR employees
who direct their efforts to a accepted.
Our organisations have detailed written job descriptions. Most of our employees are generalists who perform wide variety of
HR tasks.
We expect our HR employees to be experts in their areas of responsibility.
24.Management Commitment and Corporate Culture Strongly
Disagree
Disagree Neutral Agree Strongly
Agree
Top management is likely to consider the adoption of the HRIS
applications as strategically important.
Top management enthusiastically supports the adoption of HRIS.
Top management has allocated adequate financial resources for the
adoption of HRIS
Top management is aware of the benefits of HRIS.
Top management actively encourages human resources personnel to use HRIS in their daily tasks.
The top management has an open attitude toward technological
changes in HR.
Top management in this organisation is not afraid to take risks
Our Organisation's leaders encourage employees to learn new
technology in HR.
Top management has positive attitudes toward HRIS.
Willingness to change culture to meet the requirements of HRIS.
Top management is likely to invest funds in HRIS applications.
The top management has an open attitude toward technological
changes in HR
The organisation’s management is willing to make large investmen
ts into new IT application in HRIS.
Our organisation provides supports for employees to learn
technology in HR.
Our Organisation provides rewards for employees to use the HRIS.
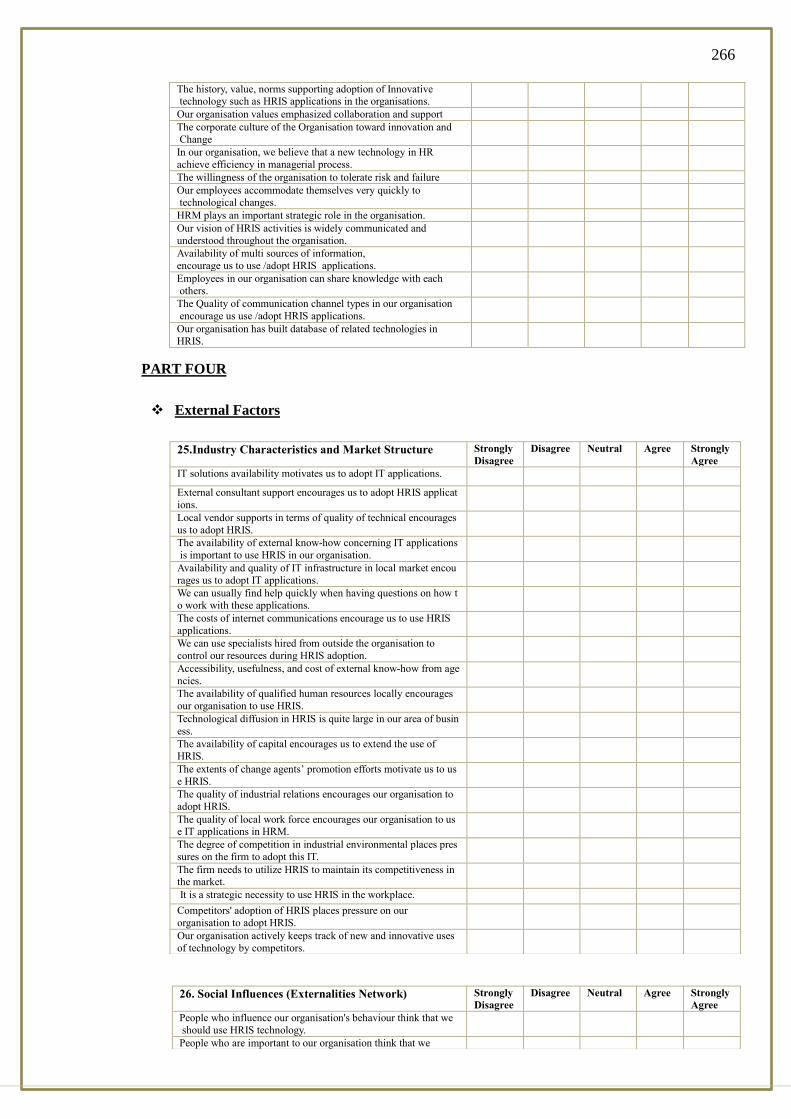
266
The history, value, norms supporting adoption of Innovative
technology such as HRIS applications in the organisations.
Our organisation values emphasized collaboration and support
The corporate culture of the Organisation toward innovation and
Change
In our organisation, we believe that a new technology in HR
achieve efficiency in managerial process.
The willingness of the organisation to tolerate risk and failure
Our employees accommodate themselves very quickly to technological changes.
HRM plays an important strategic role in the organisation.
Our vision of HRIS activities is widely communicated and
understood throughout the organisation.
Availability of multi sources of information,
encourage us to use /adopt HRIS applications.
Employees in our organisation can share knowledge with each
others.
The Quality of communication channel types in our organisation
encourage us use /adopt HRIS applications.
Our organisation has built database of related technologies in
HRIS.
PART FOUR
External Factors
25.Industry Characteristics and Market Structure Strongly
Disagree
Disagree Neutral Agree Strongly
Agree
IT solutions availability motivates us to adopt IT applications.
External consultant support encourages us to adopt HRIS applicat
ions.
Local vendor supports in terms of quality of technical encourages
us to adopt HRIS.
The availability of external knowhow concerning IT applications
is important to use HRIS in our organisation.
Availability and quality of IT infrastructure in local market encou
rages us to adopt IT applications.
We can usually find help quickly when having questions on how t
o work with these applications.
The costs of internet communications encourage us to use HRIS
applications.
We can use specialists hired from outside the organisation to
control our resources during HRIS adoption.
Accessibility, usefulness, and cost of external knowhow from age
ncies.
The availability of qualified human resources locally encourages
our organisation to use HRIS.
Technological diffusion in HRIS is quite large in our area of busin
ess.
The availability of capital encourages us to extend the use of
HRIS.
The extents of change agents’ promotion efforts motivate us to us
e HRIS.
The quality of industrial relations encourages our organisation to
adopt HRIS.
The quality of local work force encourages our organisation to use IT applications in HRM.
The degree of competition in industrial environmental places pres
sures on the firm to adopt this IT.
The firm needs to utilize HRIS to maintain its competitiveness in the market.
It is a strategic necessity to use HRIS in the workplace.
Competitors' adoption of HRIS places pressure on our
organisation to adopt HRIS.
Our organisation actively keeps track of new and innovative uses
of technology by competitors.
26. Social Influences (Externalities Network) Strongly
Disagree
Disagree Neutral Agree Strongly
Agree
People who influence our organisation's behaviour think that we
should use HRIS technology.
People who are important to our organisation think that we

267
PART FIVE
Effectiveness
Please only answer if your company implemented HRIS
Please indicate to which extent you agree or disagree with the following statements
about the effectiveness of HRIS at your organisation:
should use the HRIS technology.
The senior management of this business has been helpful in the
use of the HRIS technology.
In general, the organisation has supported the use of HRIS
technology.
The desire of organisation to be seen as good corporate citizen
socially responsive in the case of HR employees’ choice.
The nature of social system in Jordan motivates our organisation
to speed the use of IT applications in HRM.
27.The Government Policies and Support Strongly
Disagree
Disagree Neutral Agree Strongly
Agree
The availability of Government security and protection
encourage us to adopt and use IT applications.
Adequate financial aids from government (e.g. tax deduction,
tariffs, financial subsidy) encourage us to adopt IT applications.
The local government offers training program to develop human
resources in the area of IT which encourage our organisation to use HRIS.
The local government offers free training program to develop
human resources in the area of IT which encourage our organisation to use HRIS.
The local government offers financial aids (e.g. tax deduction or
financial subsidy) for companies to adopt technology.
28. Operational/ Administrative effectiveness
Strongly
Disagree
Disagree Neutral Agree Strongly
Agree
The HRIS has improved effectiveness of HR department by
automating
Administrative tasks\ Automated record keeping and other cleric
al duties.
The HRIS has improved HR operating efficiency.
The HRIS has more accurate HR information.
The HRIS has more up-to-date HR information
The HRIs has lowered administrative headcount in the HR department/ Lowered HR operating costs.
The HRIS has made HR administration more streamlined.
The HRIS has better tracking of employee information.
The HRIS has reduced in paperwork.
The HRIS has eliminated the work duplication.
29. Relational effectiveness
Strongly
Disagree
Disagree Neutral Agree Strongly
Agree
The HRIS has reduced response times to serve our customers or
clients.
The HRIS improved employee awareness, appreciation, and use
of HR programs.
The HRIS has improved working relationships with upper management.
The HRIS has improved line managers' ability to meet HR
responsibilities.
The HRIS has enhanced our ability to recruit and retain top talent
The HRIS has improved quality and timeliness of services to
employees.
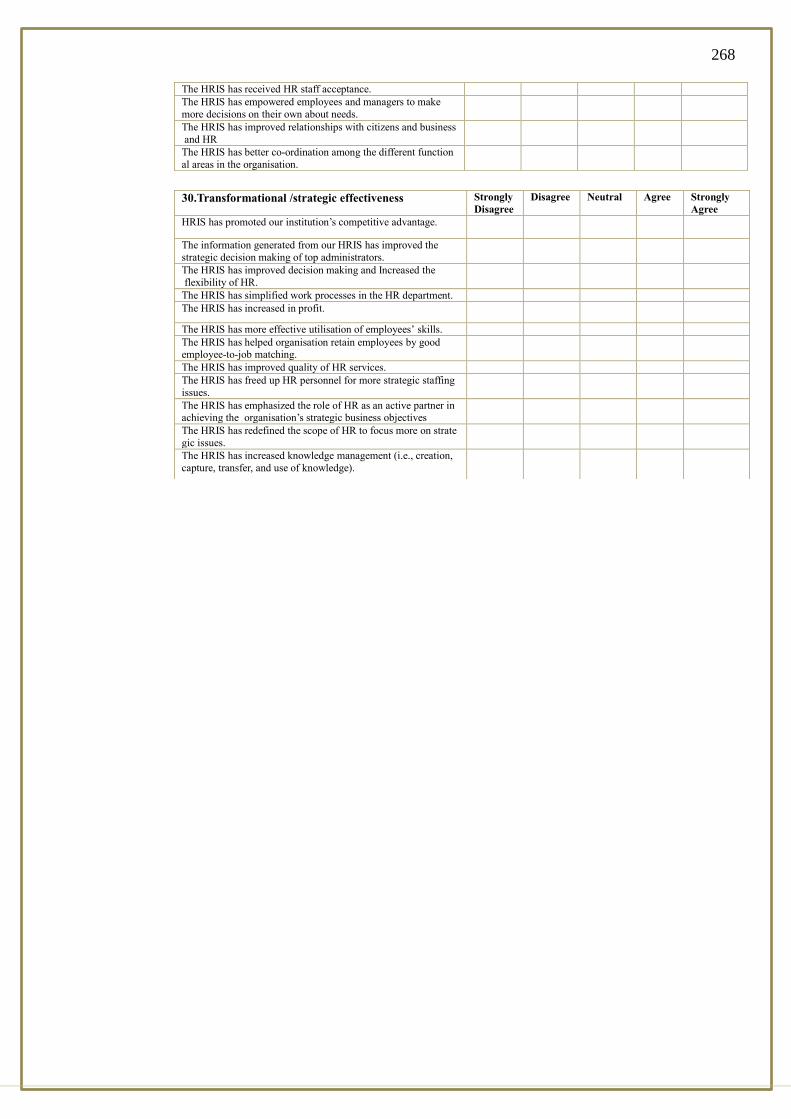
268
The HRIS has received HR staff acceptance.
The HRIS has empowered employees and managers to make
more decisions on their own about needs.
The HRIS has improved relationships with citizens and business
and HR
The HRIS has better coordination among the different function
al areas in the organisation.
30.Transformational /strategic effectiveness Strongly
Disagree
Disagree Neutral Agree Strongly
Agree
HRIS has promoted our institution’s competitive advantage.
The information generated from our HRIS has improved the
strategic decision making of top administrators.
The HRIS has improved decision making and Increased the
flexibility of HR.
The HRIS has simplified work processes in the HR department.
The HRIS has increased in profit.
The HRIS has more effective utilisation of employees’ skills.
The HRIS has helped organisation retain employees by good employeetojob matching.
The HRIS has improved quality of HR services.
The HRIS has freed up HR personnel for more strategic staffing
issues.
The HRIS has emphasized the role of HR as an active partner in achieving the organisation’s strategic business objectives
The HRIS has redefined the scope of HR to focus more on strate
gic issues.
The HRIS has increased knowledge management (i.e., creation,
capture, transfer, and use of knowledge).

269
Appendix 2: Ethical Approval
270
Appendix 3: Translation Approval
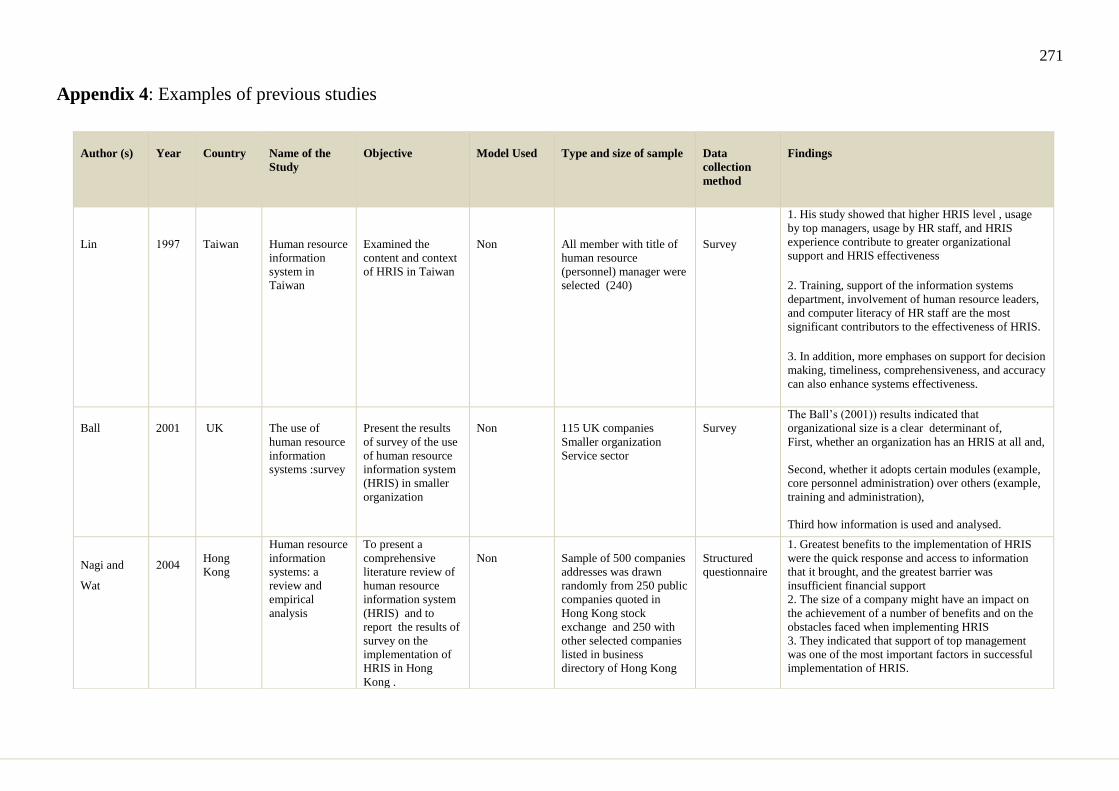
271
Appendix 4: Examples of previous studies
Findings
Data
collection
method
Type and size of sample
Model Used
Objective
Name of the
Study
Country
Year
Author (s)
1. His study showed that higher HRIS level , usage
by top managers, usage by HR staff, and HRIS
experience contribute to greater organizational
support and HRIS effectiveness
2. Training, support of the information systems
department, involvement of human resource leaders,
and computer literacy of HR staff are the most
significant contributors to the effectiveness of HRIS.
3. In addition, more emphases on support for decision
making, timeliness, comprehensiveness, and accuracy
can also enhance systems effectiveness.
Survey
All member with title of
human resource
(personnel) manager were
selected (240)
Non
Examined the
content and context
of HRIS in Taiwan
Human resource
information
system in
Taiwan
Taiwan
7991
Lin
The Ball’s (2001)) results indicated that
organizational size is a clear determinant of,
First, whether an organization has an HRIS at all and,
Second, whether it adopts certain modules (example,
core personnel administration) over others (example,
training and administration),
Third how information is used and analysed.
Survey
115 UK companies
Smaller organization
Service sector
Non
Present the results
of survey of the use
of human resource
information system
(HRIS) in smaller
organization
The use of
human resource
information
systems :survey
UK
2001
Ball
1. Greatest benefits to the implementation of HRIS
were the quick response and access to information
that it brought, and the greatest barrier was
insufficient financial support
2. The size of a company might have an impact on
the achievement of a number of benefits and on the
obstacles faced when implementing HRIS
3. They indicated that support of top management
was one of the most important factors in successful
implementation of HRIS.
Structured
questionnaire
Sample of 500 companies
addresses was drawn
randomly from 250 public
companies quoted in
Hong Kong stock
exchange and 250 with
other selected companies
listed in business
directory of Hong Kong
Non
To present a
comprehensive
literature review of
human resource
information system
(HRIS) and to
report the results of
survey on the
implementation of
HRIS in Hong
Kong .
Human resource
information
systems: a
review and
empirical
analysis
Hong
Kong
4002
Nagi and
Wat
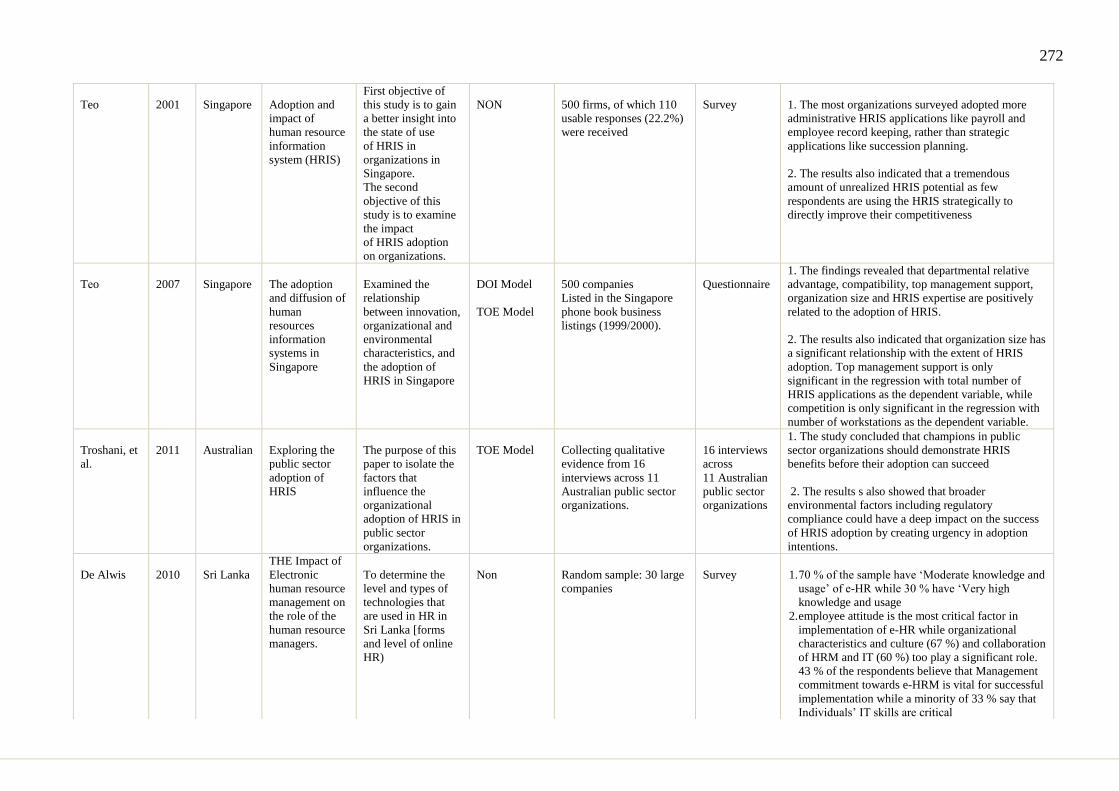
272
1. The most organizations surveyed adopted more
administrative HRIS applications like payroll and
employee record keeping, rather than strategic
applications like succession planning.
2. The results also indicated that a tremendous
amount of unrealized HRIS potential as few
respondents are using the HRIS strategically to
directly improve their competitiveness
Survey
500 firms, of which 110
usable responses (22.2%)
were received
NON
First objective of
this study is to gain
a better insight into
the state of use
of HRIS in
organizations in
Singapore.
The second
objective of this
study is to examine
the impact
of HRIS adoption
on organizations.
Adoption and
impact of
human resource
information
system (HRIS)
Singapore
2001
Teo
1. The findings revealed that departmental relative
advantage, compatibility, top management support,
organization size and HRIS expertise are positively
related to the adoption of HRIS.
2. The results also indicated that organization size has
a significant relationship with the extent of HRIS
adoption. Top management support is only
significant in the regression with total number of
HRIS applications as the dependent variable, while
competition is only significant in the regression with
number of workstations as the dependent variable.
Questionnaire
500 companies
Listed in the Singapore
phone book business
listings (1999/2000).
DOI Model
TOE Model
Examined the
relationship
between innovation,
organizational and
environmental
characteristics, and
the adoption of
HRIS in Singapore
The adoption
and diffusion of
human
resources
information
systems in
Singapore
Singapore
2007
Teo
1. The study concluded that champions in public
sector organizations should demonstrate HRIS
benefits before their adoption can succeed
2. The results s also showed that broader
environmental factors including regulatory
compliance could have a deep impact on the success
of HRIS adoption by creating urgency in adoption
intentions.
16 interviews
across
11 Australian
public sector
organizations
Collecting qualitative
evidence from 16
interviews across 11
Australian public sector
organizations.
TOE Model
The purpose of this
paper to isolate the
factors that
influence the
organizational
adoption of HRIS in
public sector
organizations.
Exploring the
public sector
adoption of
HRIS
Australian
2011
Troshani, et
al.
1. 70 % of the sample have ‘Moderate knowledge and
usage’ of e-HR while 30 % have ‘Very high
knowledge and usage
2. employee attitude is the most critical factor in
implementation of e-HR while organizational
characteristics and culture (67 %) and collaboration
of HRM and IT (60 %) too play a significant role.
43 % of the respondents believe that Management
commitment towards e-HRM is vital for successful
implementation while a minority of 33 % say that
Individuals’ IT skills are critical
Survey
Random sample: 30 large
companies
Non
To determine the
level and types of
technologies that
are used in HR in
Sri Lanka [forms
and level of online
HR)
THE Impact of
Electronic
human resource
management on
the role of the
human resource
managers.
Sri Lanka
2010
De Alwis

273
Complete organizational fit between adopted HRIS
and business processes may be elusive for adopters
suggesting that post-adoption vendor support must be
negotiated if costly customizations are to be
minimized. In addition to various organizational
factors, including management commitment and
human capability The research shows that a large
number of companies are practicing.
Conventional HRM as compared to e-HRM. The
main constraints in the implementation of e-HRM
among the respondent companies are the lack of
Financial resources and expertise
survey
69 small and medium
sized enterprises
Non
To understand the
extent of e-HRM
practiced in the
small and medium
sized enterprises
(SMEs) in the
manufacturing
sector in five main
areas of human
capital
management.
Implementing e-
HRM: The
Readiness of
Small and
Medium Sized
Manufacturing
Companies in
Malaysia
Malaysia
2006
LAI WAN
HOOI
Empirical results in evidenced that exists small
companies' feel the costs of HRIS too high. On other
hand evidenced that HRIS are better used by small
companies.
Survey
40 HR UK organization
Non
human resource
information usage
and impact
The use and
impact of
human resource
information
systems
on human
resource
management
professionals
UK
2007
Hussain et
al
Found out that the day to day work of HRM
practitioners in the civil service revolves round
activities like; Commutation of leave; confirmation in
appointment; preparation of the payroll, deployment
of staff, attending meetings, verification of personnel
data; pension matters, statutory deductions and
arranging for staff training among others.
survey
Ministry of State for
Public Service in Kenya
Non
An exploratory
survey of HRM
practices
Improving the
Management of
Human
Resources in the
Public Service
through
application of
Information and
Communication
Technologies
(ICTs)
Kenya
2010
Wachira
1. Adoption of HRM practices is positively
associated with the presence of an HRM department.
2. SMEs in which the person responsible for HRM
has previous experience in similar positions are
greater adopters of HRM practices.
3. SMEs which cooperate with other organizations
are more likely to implement HRM practices.
survey
Quantitative data from
164 tourism’s SMEs in
Catalonia (Spain).
Conceptual
model.
Source:
adapted from
Kok and
Uhlaner
(2001)
explores the
relationship
between the
adoption of HRM
practices in Small
and Medium-sized
Enterprises (SMEs)
and the
characteristics of
The firm and the
person responsible
for HRM.
Determinants of
the adoption of
HRM practices
in tourism
SMEs in Spain:
an exploratory
study
Spain
2008
Urbano&
Yordanova
Using 14 semi-structured This paper aims to
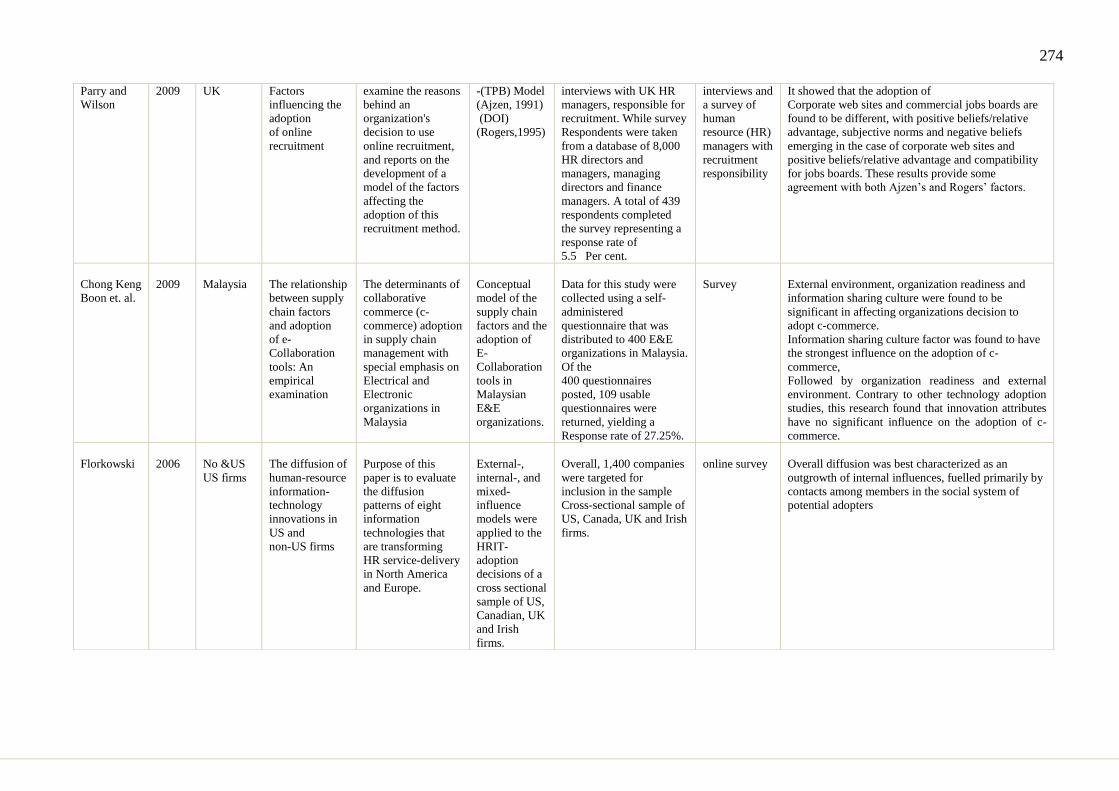
274
It showed that the adoption of
Corporate web sites and commercial jobs boards are
found to be different, with positive beliefs/relative
advantage, subjective norms and negative beliefs
emerging in the case of corporate web sites and
positive beliefs/relative advantage and compatibility
for jobs boards. These results provide some
agreement with both Ajzen’s and Rogers’ factors.
interviews and
a survey of
human
resource (HR)
managers with
recruitment
responsibility
interviews with UK HR
managers, responsible for
recruitment. While survey
Respondents were taken
from a database of 8,000
HR directors and
managers, managing
directors and finance
managers. A total of 439
respondents completed
the survey representing a
response rate of
5.5 Per cent.
-(TPB) Model
(Ajzen, 1991)
(DOI)
(Rogers,1995)
examine the reasons
behind an
organization's
decision to use
online recruitment,
and reports on the
development of a
model of the factors
affecting the
adoption of this
recruitment method.
Factors
influencing the
adoption
of online
recruitment
UK 2009 Parry and
Wilson
External environment, organization readiness and
information sharing culture were found to be
significant in affecting organizations decision to
adopt c-commerce.
Information sharing culture factor was found to have
the strongest influence on the adoption of c-
commerce,
Followed by organization readiness and external
environment. Contrary to other technology adoption
studies, this research found that innovation attributes
have no significant influence on the adoption of c-
commerce.
Survey
Data for this study were
collected using a self-
administered
questionnaire that was
distributed to 400 E&E
organizations in Malaysia.
Of the
400 questionnaires
posted, 109 usable
questionnaires were
returned, yielding a
Response rate of 27.25%.
Conceptual
model of the
supply chain
factors and the
adoption of
E-
Collaboration
tools in
Malaysian
E&E
organizations.
The determinants of
collaborative
commerce (c-
commerce) adoption
in supply chain
management with
special emphasis on
Electrical and
Electronic
organizations in
Malaysia
The relationship
between supply
chain factors
and adoption
of e-
Collaboration
tools: An
empirical
examination
Malaysia
2009
Chong Keng
Boon et. al.
Overall diffusion was best characterized as an
outgrowth of internal influences, fuelled primarily by
contacts among members in the social system of
potential adopters
online survey
Overall, 1,400 companies
were targeted for
inclusion in the sample
Cross-sectional sample of
US, Canada, UK and Irish
firms.
External-,
internal-, and
mixed-
influence
models were
applied to the
HRIT-
adoption
decisions of a
cross sectional
sample of US,
Canadian, UK
and Irish
firms.
Purpose of this
paper is to evaluate
the diffusion
patterns of eight
information
technologies that
are transforming
HR service-delivery
in North America
and Europe.
The diffusion of
human-resource
information-
technology
innovations in
US and
non-US firms
No &US
sm if SU
2006
Florkowski
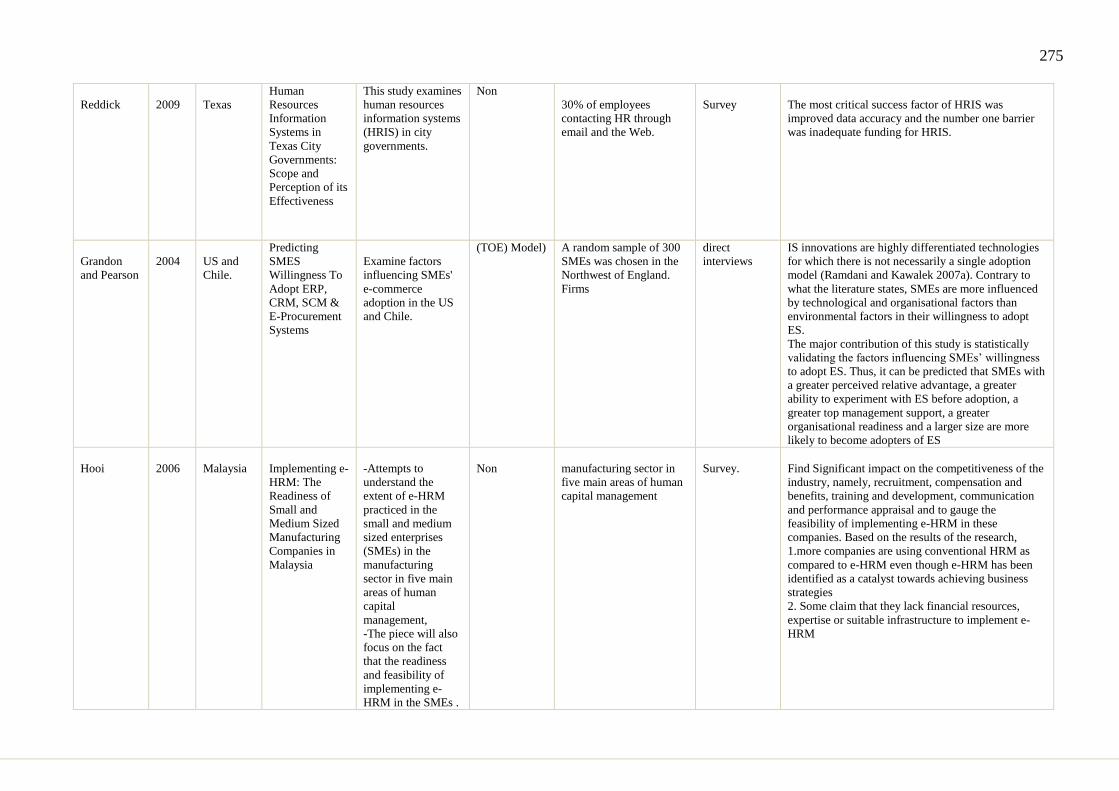
275
The most critical success factor of HRIS was
improved data accuracy and the number one barrier
was inadequate funding for HRIS.
Survey
30% of employees
contacting HR through
email and the Web.
Non This study examines
human resources
information systems
(HRIS) in city
governments.
Human
Resources
Information
Systems in
Texas City
Governments:
Scope and
Perception of its
Effectiveness
Texas
2009
Reddick
IS innovations are highly differentiated technologies
for which there is not necessarily a single adoption
model (Ramdani and Kawalek 2007a). Contrary to
what the literature states, SMEs are more influenced
by technological and organisational factors than
environmental factors in their willingness to adopt
ES.
The major contribution of this study is statistically
validating the factors influencing SMEs’ willingness
to adopt ES. Thus, it can be predicted that SMEs with
a greater perceived relative advantage, a greater
ability to experiment with ES before adoption, a
greater top management support, a greater
organisational readiness and a larger size are more
likely to become adopters of ES
direct
interviews
A random sample of 300
SMEs was chosen in the
Northwest of England.
Firms
(TOE) Model)
Examine factors
influencing SMEs'
e-commerce
adoption in the US
and Chile.
Predicting
SMES
Willingness To
Adopt ERP,
CRM, SCM &
E-Procurement
Systems
US and
Chile.
2004
Grandon
and Pearson
Find Significant impact on the competitiveness of the
industry, namely, recruitment, compensation and
benefits, training and development, communication
and performance appraisal and to gauge the
feasibility of implementing e-HRM in these
companies. Based on the results of the research,
1.more companies are using conventional HRM as
compared to e-HRM even though e-HRM has been
identified as a catalyst towards achieving business
strategies
2. Some claim that they lack financial resources,
expertise or suitable infrastructure to implement e-
HRM
Survey.
manufacturing sector in
five main areas of human
capital management
Non
-Attempts to
understand the
extent of e-HRM
practiced in the
small and medium
sized enterprises
(SMEs) in the
manufacturing
sector in five main
areas of human
capital
management,
-The piece will also
focus on the fact
that the readiness
and feasibility of
implementing e-
HRM in the SMEs .
Implementing e-
HRM: The
Readiness of
Small and
Medium Sized
Manufacturing
Companies in
Malaysia
Malaysia
2006
Hooi

276
Appendix5: Variables Operationalisation's
Dependent Variables I
Constructs Measurement
Variables Items
Code
Items Description Scale of Measurement
References
The Adoption
of HRIS
1.Extent of
Adoption
Adp1
Decision of the adoption of HRIS
Dichotomies:
1) Yes: (fully or
partially).
2) No
(Ngai and Wat,
2006)
The
Implementation
level
1.The extent of
the use of HRIS
applications
Imp1 Employee record-keeping
Likert scale
(five point
scale)
(Jeyaraj, Rottman
and Lacity, 2006)
(Zhu et al., 2006)
(Kamal, 2006)
(Dery, Grant and
Wiblen, 2009)
Imp2 Recruitment and selection
Imp3 Training and development
Imp4 Payroll \ Benefits management
Imp5 Performance appraisal
Imp6 Internal and external communication
Imp7 Self-service including web portal
Imp8 Turnover tracking/analysis
Imp9 Career Development planning
Imp10 Worker compensation.
The Extent of
HRIS
Effectiveness
1. Operational/
Administrative
Effectiveness
Op1 The HRIS has improved effectiveness of HR department by automating
administrative tasks\ Automated record keeping and other clerical duties.
Likert scale
(Wyatt, 2002)
(Beadles, Lowery and
Johns, 2005)
(Reddick, 2009)
Op2 The HRIS has improved HR operating efficiency.
Op3 The HRIS has more accurate HR information.
Op4 The HRIS has more up-to-date HR information.
Op5 The HRIS has lowered administrative headcount in the HR
Department/ Lowered HR operating costs.
Op6 The HRIS has made HR administration more streamlined.
Op7 The HRIS has better tracking of employee information.
Op8 The HRIS has reduced in paperwork.
Op9 The HRIS has eliminated the work duplicate On
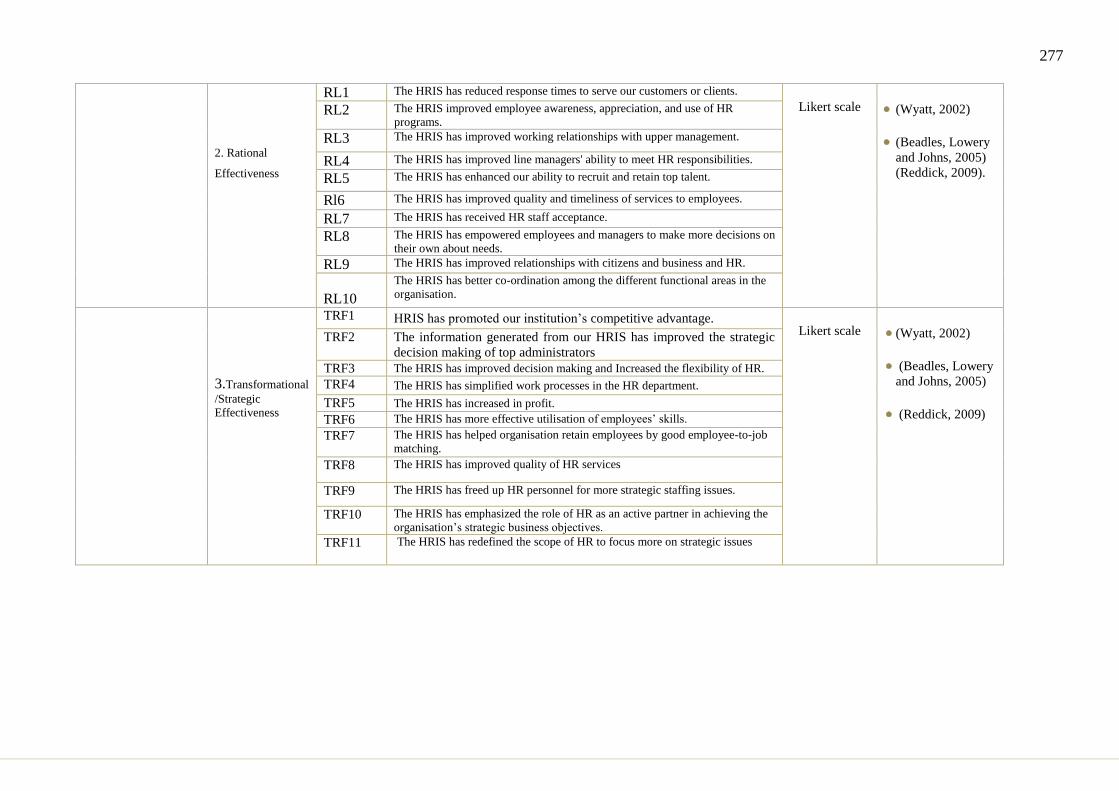
277
2. Rational
Effectiveness
RL1 The HRIS has reduced response times to serve our customers or clients.
Likert scale
(Wyatt, 2002)
(Beadles, Lowery
and Johns, 2005)
(Reddick, 2009).
RL2 The HRIS improved employee awareness, appreciation, and use of HR
programs.
RL3 The HRIS has improved working relationships with upper management.
RL4 The HRIS has improved line managers' ability to meet HR responsibilities.
RL5 The HRIS has enhanced our ability to recruit and retain top talent.
Rl6 The HRIS has improved quality and timeliness of services to employees.
RL7 The HRIS has received HR staff acceptance.
RL8 The HRIS has empowered employees and managers to make more decisions on
their own about needs.
RL9 The HRIS has improved relationships with citizens and business and HR.
RL10
The HRIS has better co-ordination among the different functional areas in the
organisation.
3.Transformational
/Strategic
Effectiveness
TRF1 HRIS has promoted our institution’s competitive advantage.
Likert scale
(Wyatt, 2002)
(Beadles, Lowery
and Johns, 2005)
(Reddick, 2009)
TRF2 The information generated from our HRIS has improved the strategic
decision making of top administrators
TRF3 The HRIS has improved decision making and Increased the flexibility of HR.
TRF4 The HRIS has simplified work processes in the HR department.
TRF5 The HRIS has increased in profit.
TRF6 The HRIS has more effective utilisation of employees’ skills.
TRF7 The HRIS has helped organisation retain employees by good employee-to-job
matching.
TRF8 The HRIS has improved quality of HR services
TRF9 The HRIS has freed up HR personnel for more strategic staffing issues.
TRF10 The HRIS has emphasized the role of HR as an active partner in achieving the
organisation’s strategic business objectives.
TRF11 The HRIS has redefined the scope of HR to focus more on strategic issues
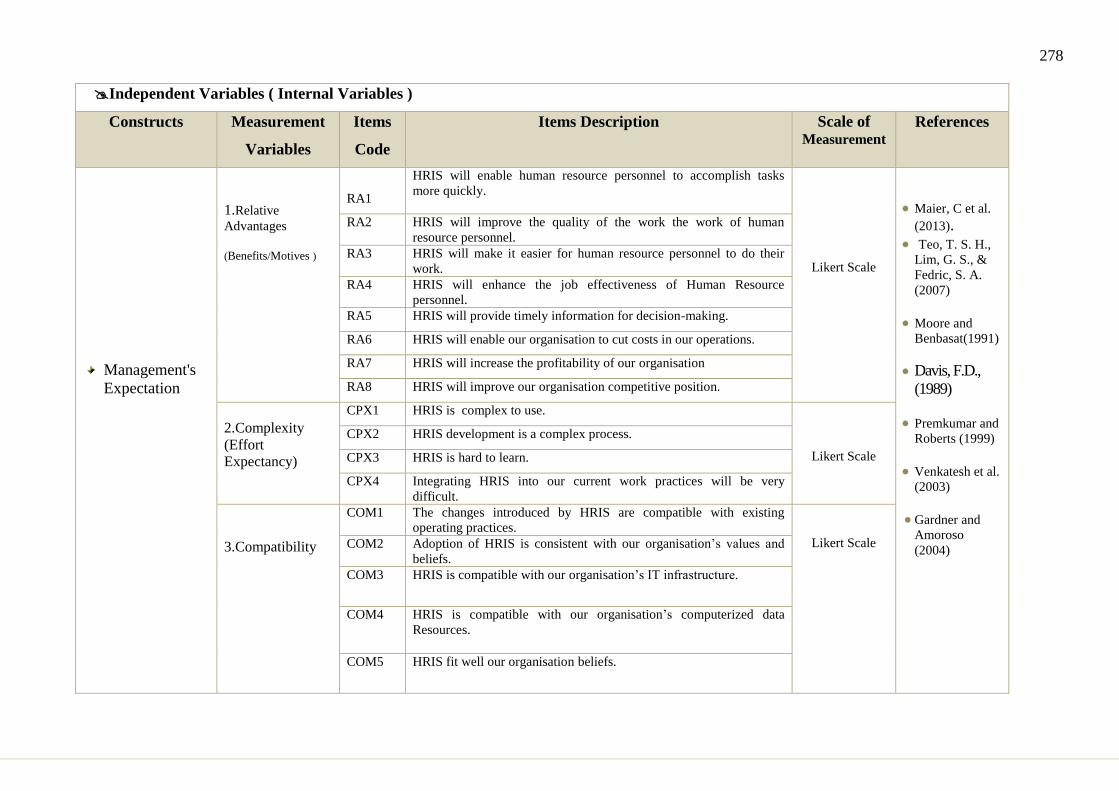
278
Independent Variables ( Internal Variables )
Constructs Measurement
Variables
Items
Code
Items Description Scale of Measurement
References
Management's
Expectation
1.Relative
Advantages
(Benefits/Motives )
RA1
HRIS will enable human resource personnel to accomplish tasks
more quickly.
Likert Scale
Maier, C et al.
(2013).
Teo, T. S. H.,
Lim, G. S., &
Fedric, S. A.
(2007)
Moore and
Benbasat(1991)
Davis, F.D.,
(1989)
Premkumar and
Roberts (1999)
Venkatesh et al.
(2003)
Gardner and
Amoroso
(2004)
RA2 HRIS will improve the quality of the work the work of human
resource personnel.
RA3 HRIS will make it easier for human resource personnel to do their
work.
RA4 HRIS will enhance the job effectiveness of Human Resource
personnel.
RA5 HRIS will provide timely information for decision-making.
RA6 HRIS will enable our organisation to cut costs in our operations.
RA7 HRIS will increase the profitability of our organisation
RA8 HRIS will improve our organisation competitive position.
2.Complexity
(Effort
Expectancy)
CPX1 HRIS is complex to use.
Likert Scale
CPX2 HRIS development is a complex process.
CPX3 HRIS is hard to learn.
CPX4 Integrating HRIS into our current work practices will be very
difficult.
3.Compatibility
COM1 The changes introduced by HRIS are compatible with existing
operating practices.
Likert Scale
COM2 Adoption of HRIS is consistent with our organisation’s values and
beliefs.
COM3 HRIS is compatible with our organisation’s IT infrastructure.
COM4 HRIS is compatible with our organisation’s computerized data
Resources.
COM5 HRIS fit well our organisation beliefs.
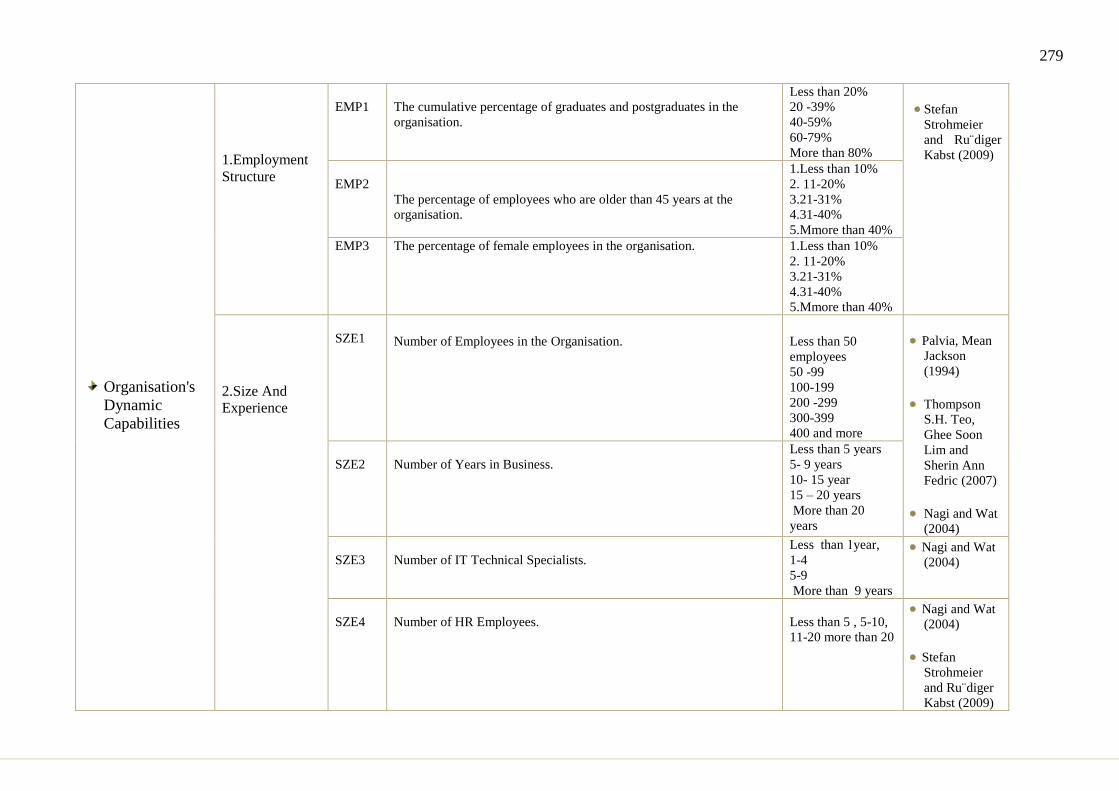
279
Stefan
Strohmeier
and Ru¨diger
Kabst (2009)
Less than 20%
20 -39%
40-59%
60-79%
More than 80%
The cumulative percentage of graduates and postgraduates in the
organisation.
EMP1
1.Employment
Structure
Organisation's
Dynamic
Capabilities
1.Less than 10%
2. 11-20%
3.21-31%
4.31-40%
5.Mmore than 40%
The percentage of employees who are older than 45 years at the
organisation.
EMP2
1.Less than 10%
2. 11-20%
3.21-31%
4.31-40%
5.Mmore than 40%
The percentage of female employees in the organisation. EMP3
Palvia, Mean
Jackson
(1994)
Thompson
S.H. Teo,
Ghee Soon
Lim and
Sherin Ann
Fedric (2007)
Nagi and Wat
(2004)
Less than 50
employees
50 -99
100-199
200 -299
300-399
400 and more
Number of Employees in the Organisation.
SZE1
2.Size And
Experience
Less than 5 years
5- 9 years
10- 15 year
15 – 20 years
More than 20
years
Number of Years in Business.
SZE2
Nagi and Wat
(2004)
Less than 7year,
1-4
5-9
More than 9 years
Number of IT Technical Specialists.
SZE3
Nagi and Wat
(2004)
Stefan
Strohmeier
and Ru¨diger
Kabst (2009)
Less than 5 , 5-10,
11-20 more than 20
Number of HR Employees.
SZE4
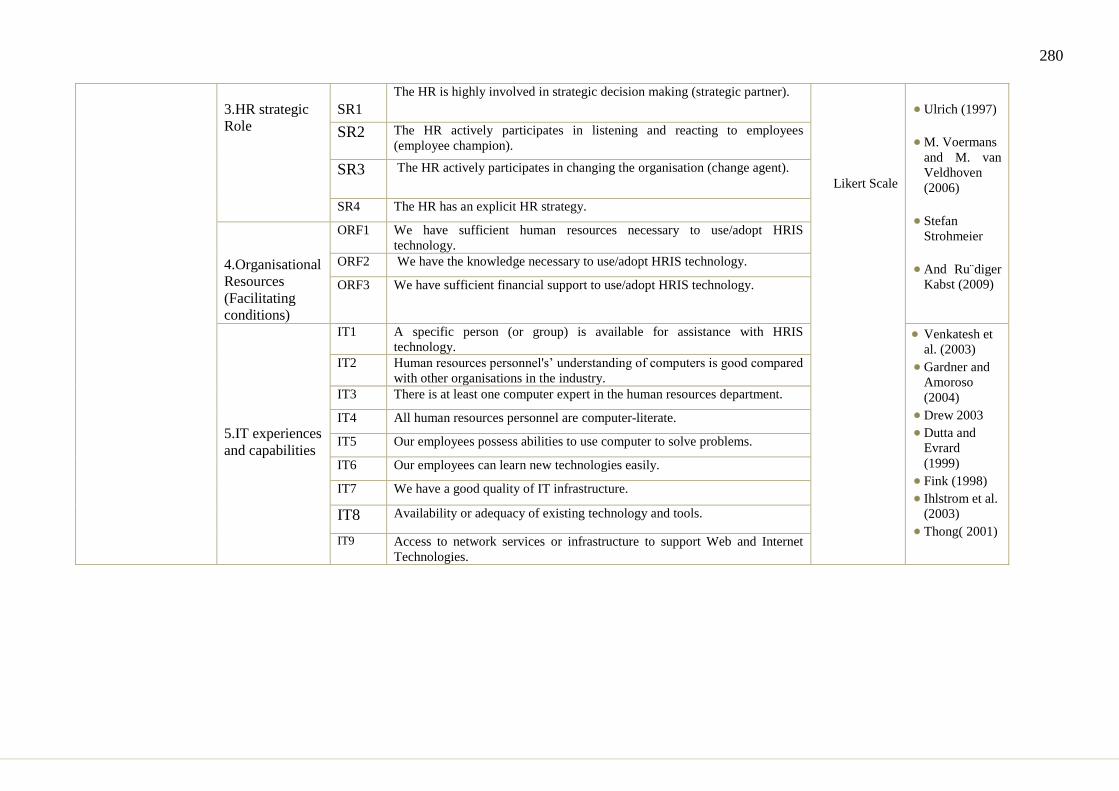
280
3.HR strategic
Role
SR1
The HR is highly involved in strategic decision making (strategic partner).
Likert Scale
Ulrich (1997)
M. Voermans
and M. van
Veldhoven
(2006)
Stefan
Strohmeier
And Ru¨diger
Kabst (2009)
SR2 The HR actively participates in listening and reacting to employees
(employee champion).
SR3 The HR actively participates in changing the organisation (change agent).
SR4 The HR has an explicit HR strategy.
4.Organisational
Resources
(Facilitating
conditions)
ORF1 We have sufficient human resources necessary to use/adopt HRIS
technology.
ORF2 We have the knowledge necessary to use/adopt HRIS technology.
ORF3 We have sufficient financial support to use/adopt HRIS technology.
5.IT experiences
and capabilities
IT1 A specific person (or group) is available for assistance with HRIS
technology. Venkatesh et
al. (2003)
Gardner and
Amoroso
(2004)
Drew 2003
Dutta and
Evrard
(1999)
Fink (1998)
Ihlstrom et al.
(2003)
Thong( 2001)
IT2 Human resources personnel's’ understanding of computers is good compared
with other organisations in the industry.
IT3 There is at least one computer expert in the human resources department.
IT4 All human resources personnel are computer-literate.
IT5 Our employees possess abilities to use computer to solve problems.
IT6 Our employees can learn new technologies easily.
IT7 We have a good quality of IT infrastructure.
IT8 Availability or adequacy of existing technology and tools.
IT9 Access to network services or infrastructure to support Web and Internet
Technologies.
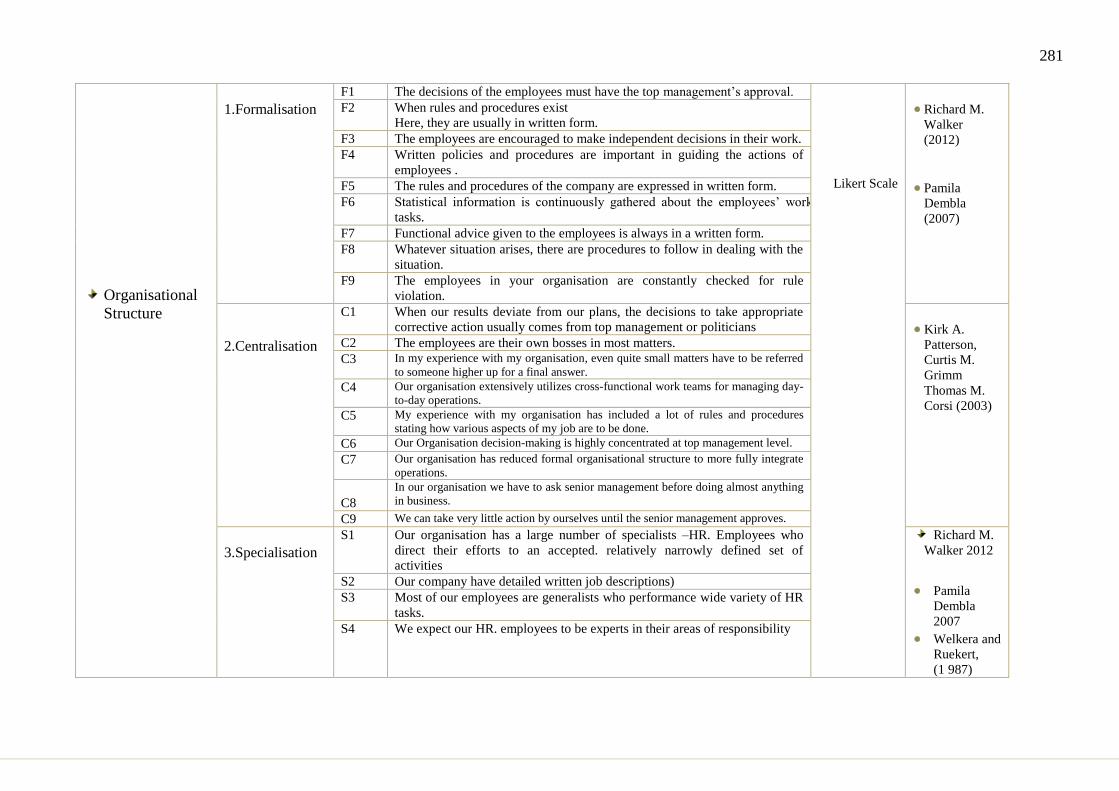
281
Richard M.
Walker
(2012)
Pamila
Dembla
(2007)
Likert Scale
The decisions of the employees must have the top management’s approval. F1
1.Formalisation
Organisational
Structure
When rules and procedures exist
Here, they are usually in written form.
F2
The employees are encouraged to make independent decisions in their work. F3
Written policies and procedures are important in guiding the actions of
employees .
F4
The rules and procedures of the company are expressed in written form. F5
Statistical information is continuously gathered about the employees’ work
tasks.
F6
Functional advice given to the employees is always in a written form. F7
Whatever situation arises, there are procedures to follow in dealing with the
situation.
F8
The employees in your organisation are constantly checked for rule
violation.
F9
Kirk A.
Patterson,
Curtis M.
Grimm
Thomas M.
Corsi (2003)
When our results deviate from our plans, the decisions to take appropriate
corrective action usually comes from top management or politicians
C1
2.Centralisation
The employees are their own bosses in most matters. C2 In my experience with my organisation, even quite small matters have to be referred
to someone higher up for a final answer. C3
Our organisation extensively utilizes cross-functional work teams for managing day-
to-day operations. C4
My experience with my organisation has included a lot of rules and procedures
stating how various aspects of my job are to be done. C5
Our Organisation decision-making is highly concentrated at top management level. C6 Our organisation has reduced formal organisational structure to more fully integrate
operations. C7
In our organisation we have to ask senior management before doing almost anything
in business.
C8 We can take very little action by ourselves until the senior management approves. C9
Richard M.
Walker 2012
Pamila
Dembla
2007 Welkera and
Ruekert, (1 987)
Our organisation has a large number of specialists –HR. Employees who
direct their efforts to an accepted. relatively narrowly defined set of
activities
S1
3.Specialisation
Our company have detailed written job descriptions) S2
Most of our employees are generalists who performance wide variety of HR
tasks.
S3
We expect our HR. employees to be experts in their areas of responsibility S4

282
Premkumar and
Roberts
(1999)
Thompson S.H.
Teo, Ghee
Soon Lim and
Sherin Ann
Fedric(2007)
Likert scale
Top management is likely to consider the adoption of the HRIS applications
as strategically important
TP1
1.Top
management
willingness to
support
Management
Commitment
and Corporate
Culture
Top management enthusiastically supports the adoption of HRIS TP2
Top management has allocated adequate resources for the adoption of HRIS TP3
Top management is aware of the benefits of HRIS TP4
Top management actively encourages human resource personnel to use
HRIS in their daily tasks
TP6
The top management has an open attitude toward technological changes in
HR.
TP7
Our Company's leaders encourage employees to learn new technology in HR TP8
Top management have positive attitudes toward HRIS TP9
Willingness to change culture to meet the requirements of HRIS TP10
top management is likely to invest funds in HRIS applications TP11
Top management in this organisation is not afraid to take risks. TP12
Our company provides supports for employees to learn technology in HR TP13
Martins, E., &
Terblanche, F.
(2003)
Jones et al.
(2005)
Lai Wan Hooi ,
(2006)
Likert scale
The history, value, norms supporting adoption of Innovative technology
such as HRIS applications within the organisations.
OS1
2.Organisation
sharing culture Our organisation values emphasized collaboration and support. OS2
The corporate culture of the Organisation towered innovation
and change.
OS3
In our company, we believe that a new technology in HR achieve efficiency in
managerial process.
OS4
The willingness of the organisation to tolerate risk and failure OS5
Our employees accommodate themselves very quickly to technological
changes.
OS6
HRM plays an important strategic role in the organisation OS7
Availability of multi sources of information, encourage us to use /adopt
HRIS applications.
INT1 3.Intra-
organisation
communication The Quality of communication channel types in our organisation encourage
us use /adopt HRIS applications.
INT2
Our organisation has built database of related technologies in HRIS. INT3
Our vision of HRIS activities is widely communicated and understood
throughout the organisation.
INT4
Employees in our organisation can share knowledge with each other's. INT5

283
The Quality of communication channel types in our organisation encourage
us use /adopt HRIS applications.
INT2
Nagi and Wat
(2004)
Less 25 years
25-30
31-40
41-50
More 50 years
Age
DS1
1.Demographic
characteristics
The Socio-
Demographic
Characteristics of
Decision-Makers
Nagi and Wat
(2004)
Secondary
Post-
secondary
certificate/dipl
oma
Bachelor’s
degree
Master’s
degree
Others
Level of Education
DS2
Nagi and Wat
(2004)
Less than 3
years
3-6 years
7-10 years
11-14 years
More than 14
years
Business Experience
DS3
Thong and
Yap, ( 1995)
Cragg and
King1993Fink
1998;Ihlstrom
et al.(2003)
Thong and
Yap (1996)
Utomo&Dodg
son(2001)
Murphy and
Southey,(
2003)
Likert scale
The CEO's extent of technical and knowledge of IT compared to other
people in similar positions.
STS1
2.Social and
technology skills The CEO's extent social network skills compared to other people in similar
positions.
STS2
The CEO's decision making style for IT adoption tends to be people oriented
rather than work oriented.
STS3
The CEO management’s visibility and exhibited commitment to adoption of
IT applications.
SRS4
The CEO management's actions show support for the use of new technology SRS5
The CEO has the ability to gain consensus on ideas. STS6

284
Independent Variables (Internal Variables)
Ghonakhloo et
al, (2011 )
Dong and Zhu
(2006),
Kim and
Galliers (2004)
Morgan et al.,
(2006)
Nguyen, (2009)
Scott A. Wymer
& Elizabeth A.
Regan( 2007)
Murphy and
Southey (2003)
Al-Dmour and
Shannak,(
2012)
Likert scale
IT solutions availability motivates us to adopt IT applications Ind1
1.Industry IT
supplier
Characteristics
Industry
Characteristics and
Market Structure
External consultant support encourages us to adopt HRIS applications Ind2
Local vendor supports in terms of quality of technical encourage us to adopt
HRIS)
Ind3
Availability and quality of IT infrastructure in local market encourages us to
adopt IT applications
Ind4
The availability of external know-how concerning IT applications is
important to use HRIS in our organisation
Ind5
The cost of internet communications encourages us to use HRIS
applications.
Ind 6
We can usually find help quickly when having questions on how to work
with these applications.
Ind7
We can use specialists hired from outside the organisation to control our
resources during HRIS adoption
Ind8
Technological diffusion in HRIS is quite large in our area of business Ind9
The availability of qualified human resources locally encourages our
organisation to use HRIS.
Ind10
The availability of capital encourages us to extend the use of HRIS. Ind11
Accessibility, usefulness, and cost of external know-how from agencies. Ind12
The extent of change agents’ promotion efforts motivates us to use HRIS. Ind13
The quality of industrial relations encourages our organisation to adopt
HRIS.
Ind14
The quality of local work force encourages our organisation to use IT
applications in HRM.
Ind15
Tan (1997)
Caldeira &
Ward, (2003)
Riemenschneid
er et al., 2003)
Premkumar &
Roberts (1999)
Likert scale
The degree of competition in industrial environmental places pressures on
the firm to adopt this IT
CPS1
2. Competition
pressure The firm needs to utilize HRIS to maintain its competitiveness in the market
CPS2
It is a strategic necessity to use HRIS in the workplace
CPS3
Competitors’ adoption of HRIS places pressure on our organisation to adopt
HRIS
CPS4

285
Thompson S.H.
Teo, Ghee Soon
Lim & Sherin
& Fedric (2007)
Grover (1993)
Our organisation actively keeps track of new and innovative uses of
technology by competitors
CPS5
Venkatesh et al.
(2003)
Gardner and
Amoroso
(2004)
Murphy and
Southey( 2007)
Al-Dmour and
Shannak,
(2012)
Likert Scale
People who influence our organisation behaviour think that we should use
HRIS technology.
SI1
3.Social
Influences(Extern
alities Network)
Social Influences
(Externalities
Network)
People who are important to our organisations think that we should use the
HRIS technology.
SI2
The senior management of this business has been helpful in the use of the
HRIS technology
SI3
In general, the organisation has supported the use of HRIS technology SI4
The desire of organisation to be seen as good corporate citizen socially
responsive in the case of HR employees choice
SI5
The nature of social system in Jordan motivates our organisation to speed
the use of IT applications in HRM.
SI6
Our organisation actively keeps track of new and innovative uses of
technology by competitors
SI7
Scupola,
(2003)
Kapurubandar
a and Lawson
(2008)
Dutta and
Evrard (1999)
Scott A.
Wymer &
Elizabeth A.
Regan (2007)
Al-Dmour
and
Shannak,
(2012)
Likert Scale
The availability of Government security and protection to adopt and use IT
applications.
GP1
4.The
Government
Policies and
Support
Government Policies
and Support The positive attitudes of government toward adoption of IT technology
applications in business.
GP2
Adequate financial aids from government (e.g. tax deduction, tariffs,
financial subsidy) to adopt IT applications.
GP3
Adequate training programs offered by government to the area of IT
applications
GP4
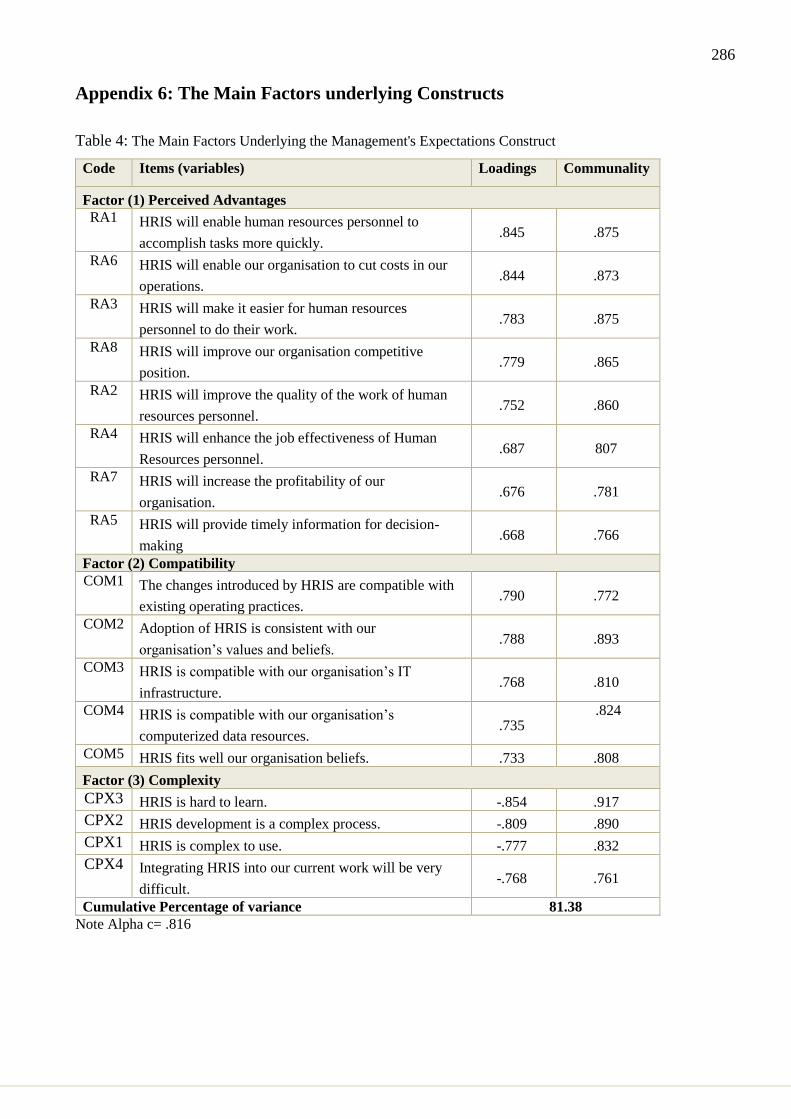
286
Appendix 6: The Main Factors underlying Constructs
Table 4: The Main Factors Underlying the Management's Expectations Construct
Code Items (variables) Loadings Communality
Factor (1) Perceived Advantages
RA1 HRIS will enable human resources personnel to
accomplish tasks more quickly. .845 .875
RA6 HRIS will enable our organisation to cut costs in our
operations. .844 .873
RA3 HRIS will make it easier for human resources
personnel to do their work. .783 .875
RA8 HRIS will improve our organisation competitive
position. .779 .865
RA2 HRIS will improve the quality of the work of human
resources personnel. .752 .860
RA4 HRIS will enhance the job effectiveness of Human
Resources personnel. .687 807
RA7 HRIS will increase the profitability of our
organisation. .676 .781
RA5 HRIS will provide timely information for decision-
making .668 .766
Factor (2) Compatibility COM1 The changes introduced by HRIS are compatible with
existing operating practices. .790 .772
COM2 Adoption of HRIS is consistent with our
organisation’s values and beliefs. .788 .893
COM3 HRIS is compatible with our organisation’s IT
infrastructure. .768 .810
COM4 HRIS is compatible with our organisation’s
computerized data resources. .735
.824
COM5 HRIS fits well our organisation beliefs. .733 .808
Factor (3) Complexity
CPX3 HRIS is hard to learn. -.854 .917
CPX2 HRIS development is a complex process. -.809 .890
CPX1 HRIS is complex to use. -.777 .832
CPX4
Integrating HRIS into our current work will be very
difficult. -.768 .761
Cumulative Percentage of variance 81.38
Note Alpha c= .816

287
Table 5: The Main Factors Underlying the Organisation's Dynamic Capabilities
Code Items (variables) Loadings Communality
Factor (1): IT Experiences and Capabilities
IT2 Human resources personnel's’ understanding of
computers is good compared with other organisations in
the industry.
.863 .836
IT8 Availability or adequacy of existing technology and
tools. .844 .795
IT7 We have a good quality of IT infrastructure. .826 .804
IT9 Access to network services or infrastructure to support
Web and Internet Technologies. .808 .749
IT6 Our employees can learn new technologies easily. .796 .718
IT1 A specific person (or group) is available for assistance
with HRIS technology. .790 .855
IT5 Employees possess abilities to use computer to solve
problems. .788 .7472
IT4 All human resources personnel are computer literate. .588 .626
IT3 There is at least one computer expert in the human
resources department. .480 .533
Factor (2): HR strategic Role
SR2 The HR actively participates in listening and reacting to
employees (employee champion). .864 .866
SR1 The HR is highly involved in strategic decision making
(strategic partner). .820 803
SR3 The HR actively participates in changing the
organisation (change agent). .797
.830
SR4 The HR has an explicit HR strategy. .757 .835
Factor (3): Size and Experience
SZE3 Number of IT technical specialists. .799 .725
SZE1 Number of employees in the organisation. .765 .626
SZE4 Number of f HR employees. .754 .631
SZE2 Number of years in business (experience). .627 .591
Factor (4): Organisational Resources (Facilitating Conditions)
ORF1 We have sufficient human resources necessary to
use/adopt HRIS technology. .757
.812
ORF2 We have the knowledge necessary to use/adopt HRIS
technology. .694
.785
ORF3 We have sufficient financial support to use/adopt HRIS
technology. .637
.7746
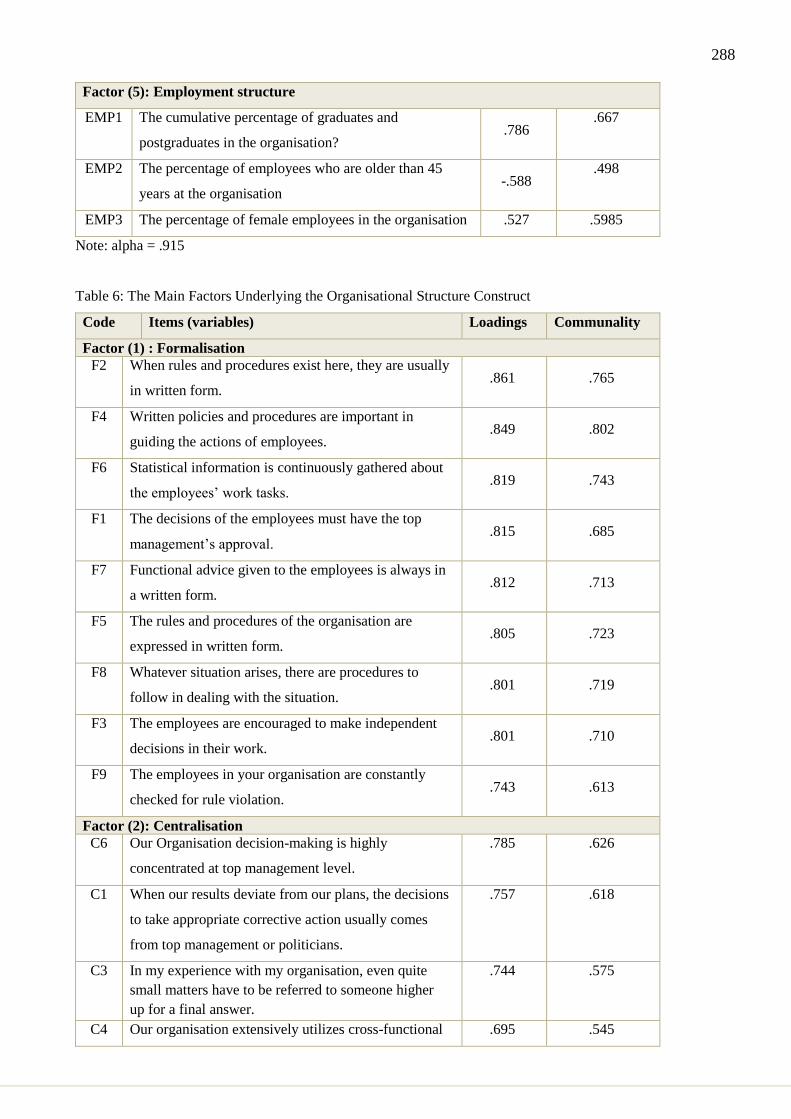
288
Factor (5): Employment structure
EMP1 The cumulative percentage of graduates and
postgraduates in the organisation? .786
.667
EMP2 The percentage of employees who are older than 45
years at the organisation -.588
.498
EMP3 The percentage of female employees in the organisation .527 .5985
Note: alpha = .915
Table 6: The Main Factors Underlying the Organisational Structure Construct
Code Items (variables) Loadings Communality
Factor (1) : Formalisation
F2 When rules and procedures exist here, they are usually
in written form. .861 .765
F4 Written policies and procedures are important in
guiding the actions of employees. .849 .802
F6 Statistical information is continuously gathered about
the employees’ work tasks. .819 .743
F1 The decisions of the employees must have the top
management’s approval. .815 .685
F7 Functional advice given to the employees is always in
a written form. .812 .713
F5 The rules and procedures of the organisation are
expressed in written form. .805 .723
F8 Whatever situation arises, there are procedures to
follow in dealing with the situation. .801 .719
F3 The employees are encouraged to make independent
decisions in their work. .801 .710
F9 The employees in your organisation are constantly
checked for rule violation. .743 .613
Factor (2): Centralisation
C6 Our Organisation decision-making is highly
concentrated at top management level.
.785 .626
C1 When our results deviate from our plans, the decisions
to take appropriate corrective action usually comes
from top management or politicians.
.757 .618
C3 In my experience with my organisation, even quite
small matters have to be referred to someone higher
up for a final answer.
.744 .575
C4 Our organisation extensively utilizes cross-functional .695 .545

289
work teams for managing day-to-day operations.
C5
My experience with my organisation has included a
lot of rules and procedures stating how various aspects
of my job are to be done.
.683 .575
C8 In our organisation we have to ask senior management
before doing almost anything in business.
.676 .481
C7 Our organisation has reduced formal organisational
structure to more fully integrate operations.
.668 .616
C9 We can take very little action by ourselves until the
senior management approves.
.635 .478
C2 The employees are their own bosses in most matters. .536 .456
Factor (3): Specialisation
S3 Most of our employees are generalists who perform
wide variety of HR tasks.
.777 .6118
S4 We expect our HR employees to be experts in their
areas of responsibility.
.731 .697
S2 Our organisation has detailed written job descriptions. .704 .625
S1 Our organisation has a large number of "specialists
HR employees who direct their efforts to an accepted.
.599 .498
Alpha = .934
Table 7: The Main Factors Underlying the Management Commitment and Corporate Culture
Code Items (variables) Loadings Communality
Factor (1): Top management willingness to support
TP4 Top management is aware of the benefits of HRIS. .841 .817
TP1 Top management is likely to consider the adoption of
the HRIS applications as strategically important. .838 .801
TP2 Top management enthusiastically supports the
adoption of HRIS. .836 .819
TP6 Top management actively encourages human
resources personnel to use HRIS in their daily tasks. .834 .807
TP9 Top management has positive attitudes toward HRIS. .832 .805
TP3 Top management has allocated adequate financial
resources for the adoption of HRIS. .822 .814
TP7 The top management has an open attitude toward
technological changes in HR. .817 .805
TP10 Willingness to change culture to meet the
requirements of HRIS. .802
.809
TP8 Our Organisation's leaders encourage employees to .785 .807
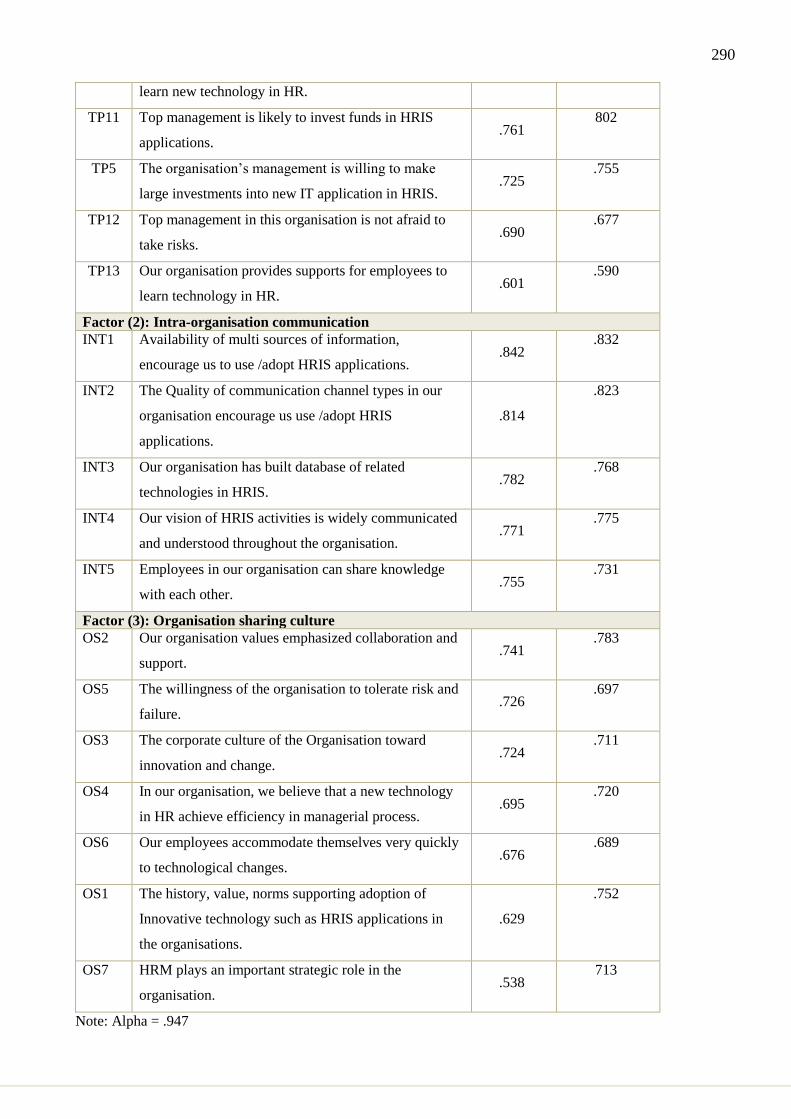
290
learn new technology in HR.
TP11 Top management is likely to invest funds in HRIS
applications. .761
802
TP5 The organisation’s management is willing to make
large investments into new IT application in HRIS. .725
.755
TP12 Top management in this organisation is not afraid to
take risks. .690
.677
TP13 Our organisation provides supports for employees to
learn technology in HR. .601
.590
Factor (2): Intra-organisation communication
INT1 Availability of multi sources of information,
encourage us to use /adopt HRIS applications. .842
.832
INT2 The Quality of communication channel types in our
organisation encourage us use /adopt HRIS
applications.
.814
.823
INT3 Our organisation has built database of related
technologies in HRIS. .782
.768
INT4 Our vision of HRIS activities is widely communicated
and understood throughout the organisation. .771
.775
INT5 Employees in our organisation can share knowledge
with each other. .755
.731
Factor (3): Organisation sharing culture
OS2 Our organisation values emphasized collaboration and
support. .741
.783
OS5 The willingness of the organisation to tolerate risk and
failure. .726
.697
OS3 The corporate culture of the Organisation toward
innovation and change. .724
.711
OS4 In our organisation, we believe that a new technology
in HR achieve efficiency in managerial process. .695
.720
OS6 Our employees accommodate themselves very quickly
to technological changes. .676
.689
OS1 The history, value, norms supporting adoption of
Innovative technology such as HRIS applications in
the organisations.
.629
.752
OS7 HRM plays an important strategic role in the
organisation. .538
713
Note: Alpha = .947

291
Table 8: the Main Factors Underlying the Socio-Demographic Characteristics of Decision-Makers
Construct Measures
Code Items (variables) Loadings Communality
Factor (1) Social and technology skills
STS5 The CEO management's actions show support for the
use of new technology. .911 .833
STS6 The CEO has the ability to gain consensus on ideas. .905 .820
STS4 The CEO management’s visibility and exhibited
commitment to adoption of IT applications. .900 .815
STS2 The CEO's extent social network skills compared to
other people in similar positions. .880 .789
STS1 The CEO's extent of technical and knowledge of IT
compared to other people in similar positions. .855 .764
STS3 The CEO's decision making style for IT adoption
tends to be people oriented rather than work oriented. .789 .665
Note: Alpha =.772
Table 9: the Main Factors Underlying the Industry Characteristics and Market Structure Construct
Measures
Code Items (variables) Loadings Communality
Factor (1) Availability of IT suppliers &Activities
IND1 IT solutions availability motivates us to adopt IT
applications. .846 .732
IND2 External consultant support encourages us to adopt
HRIS applications. .836 .730
IND3 Local vendor supports in terms of quality of technical
encourages us to adopt HRIS. .826 .727
IND7 We can usually find help quickly when having
questions on how to work with these applications. .771 .672
IND4 Availability and quality of IT infrastructure in local
market encourages us to adopt IT applications. .764 .667
IND6 The cost of internet communications encourages us to
use HRIS applications. .746 .634
IND12 Accessibility, usefulness, and cost of external know-
how from agencies. .726 .693
IND8 We can use specialists hired from outside the
organisation to control our resources during HRIS
adoption.
.725 .657
IND10 The availability of qualified human resources locally
encourages our organisation to use HRIS. .716 .664
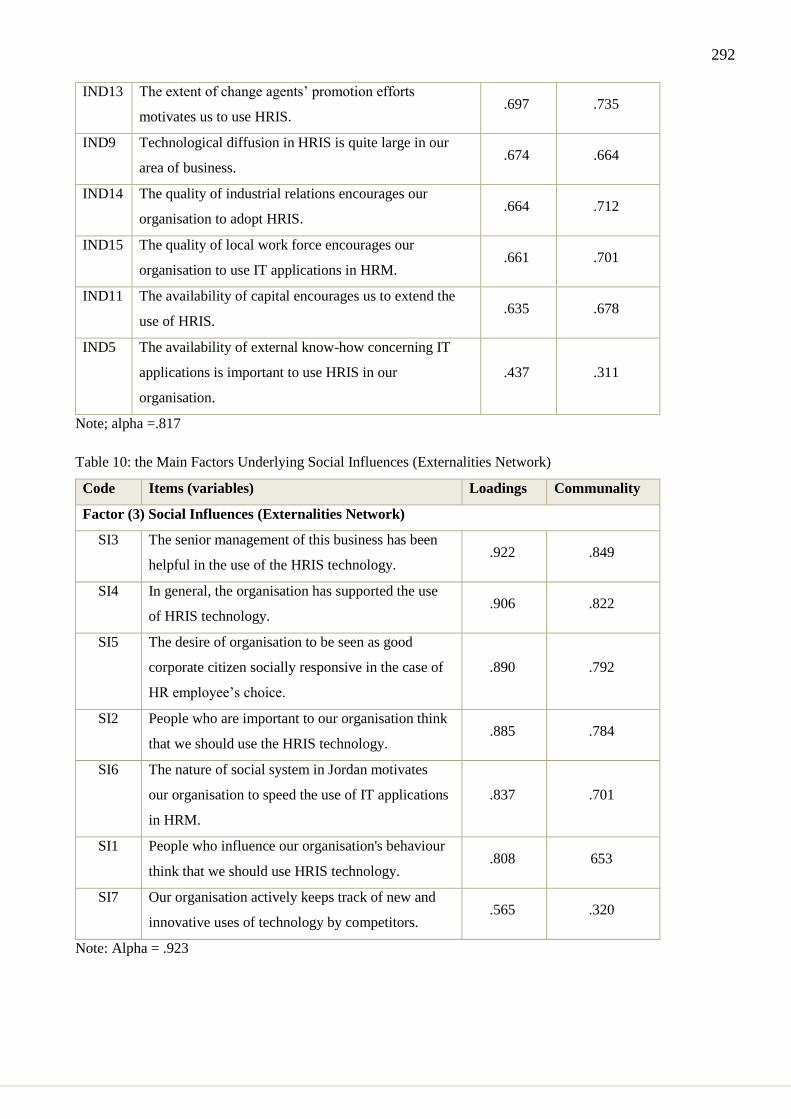
292
IND13 The extent of change agents’ promotion efforts
motivates us to use HRIS. .697 .735
IND9 Technological diffusion in HRIS is quite large in our
area of business. .674 .664
IND14 The quality of industrial relations encourages our
organisation to adopt HRIS. .664 .712
IND15 The quality of local work force encourages our
organisation to use IT applications in HRM. .661 .701
IND11 The availability of capital encourages us to extend the
use of HRIS. .635 .678
IND5 The availability of external know-how concerning IT
applications is important to use HRIS in our
organisation.
.437 .311
Note; alpha =.817
Table 10: the Main Factors Underlying Social Influences (Externalities Network)
Code Items (variables) Loadings Communality
Factor (3) Social Influences (Externalities Network)
SI3 The senior management of this business has been
helpful in the use of the HRIS technology. .922 .849
SI4 In general, the organisation has supported the use
of HRIS technology. .906 .822
SI5 The desire of organisation to be seen as good
corporate citizen socially responsive in the case of
HR employee’s choice.
.890 .792
SI2 People who are important to our organisation think
that we should use the HRIS technology. .885 .784
SI6 The nature of social system in Jordan motivates
our organisation to speed the use of IT applications
in HRM.
.837 .701
SI1 People who influence our organisation's behaviour
think that we should use HRIS technology. .808 653
SI7 Our organisation actively keeps track of new and
innovative uses of technology by competitors. .565 .320
Note: Alpha = .923
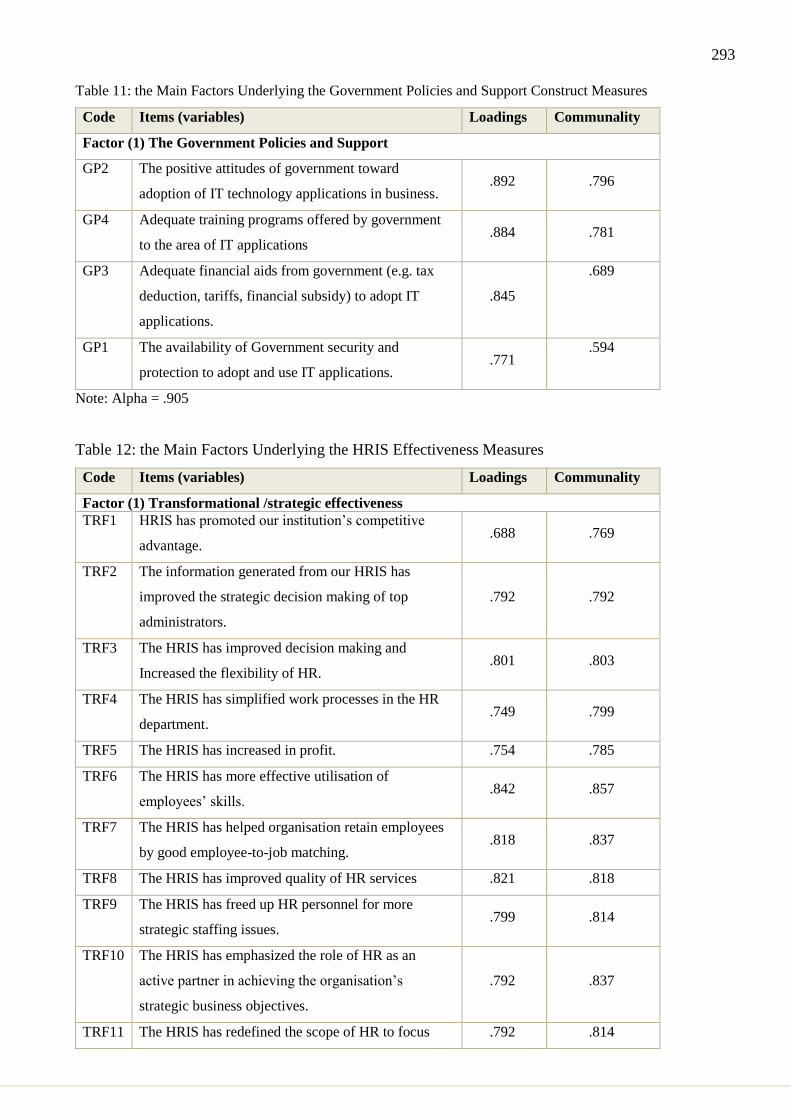
293
Table 11: the Main Factors Underlying the Government Policies and Support Construct Measures
Code Items (variables) Loadings Communality
Factor (1) The Government Policies and Support
GP2 The positive attitudes of government toward
adoption of IT technology applications in business. .892 .796
GP4 Adequate training programs offered by government
to the area of IT applications .884 .781
GP3 Adequate financial aids from government (e.g. tax
deduction, tariffs, financial subsidy) to adopt IT
applications.
.845
.689
GP1 The availability of Government security and
protection to adopt and use IT applications. .771
.594
Note: Alpha = .905
Table 12: the Main Factors Underlying the HRIS Effectiveness Measures
Code Items (variables) Loadings Communality
Factor (1) Transformational /strategic effectiveness
TRF1 HRIS has promoted our institution’s competitive
advantage. .688 .769
TRF2 The information generated from our HRIS has
improved the strategic decision making of top
administrators.
.792 .792
TRF3 The HRIS has improved decision making and
Increased the flexibility of HR. .801 .803
TRF4 The HRIS has simplified work processes in the HR
department. .749 .799
TRF5 The HRIS has increased in profit. .754 .785
TRF6 The HRIS has more effective utilisation of
employees’ skills. .842 .857
TRF7 The HRIS has helped organisation retain employees
by good employee-to-job matching. .818 .837
TRF8 The HRIS has improved quality of HR services .821 .818
TRF9 The HRIS has freed up HR personnel for more
strategic staffing issues. .799 .814
TRF10 The HRIS has emphasized the role of HR as an
active partner in achieving the organisation’s
strategic business objectives.
.792 .837
TRF11 The HRIS has redefined the scope of HR to focus .792 .814
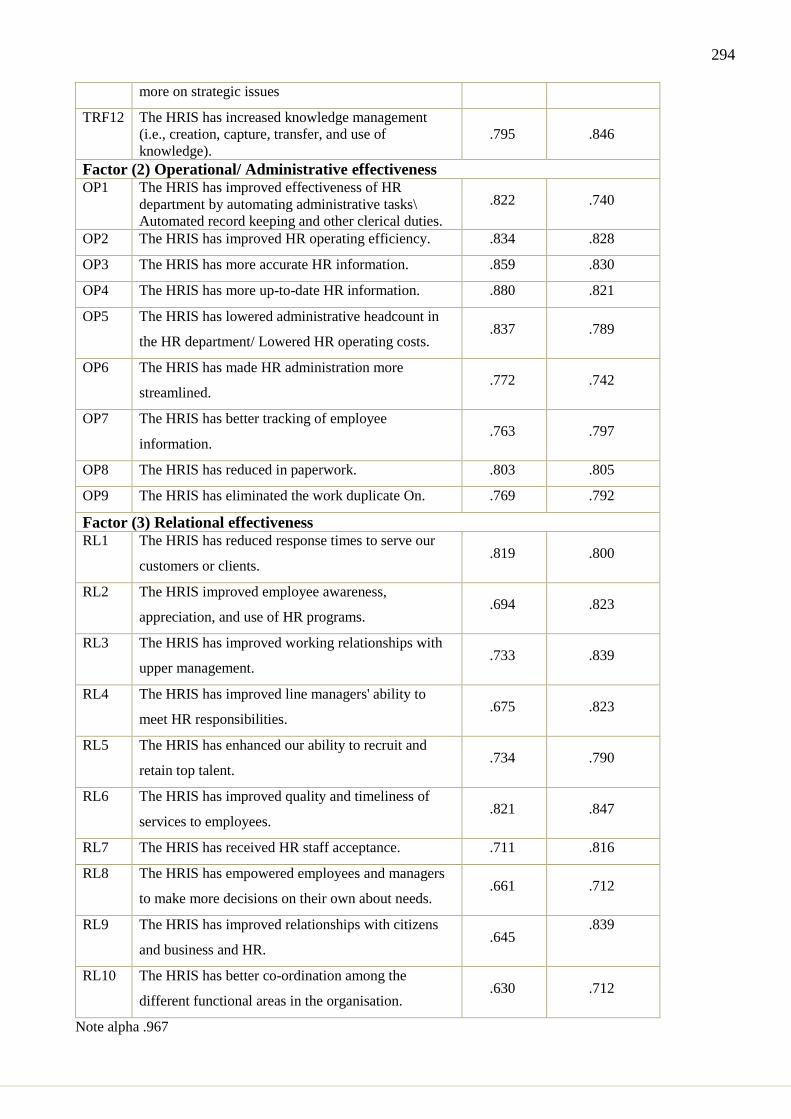
294
more on strategic issues
TRF12 The HRIS has increased knowledge management
(i.e., creation, capture, transfer, and use of
knowledge).
.795 .846
Factor (2) Operational/ Administrative effectiveness
OP1 The HRIS has improved effectiveness of HR
department by automating administrative tasks\
Automated record keeping and other clerical duties.
.822 .740
OP2 The HRIS has improved HR operating efficiency. .834 .828
OP3 The HRIS has more accurate HR information. .859 .830
OP4 The HRIS has more up-to-date HR information. .880 .821
OP5 The HRIS has lowered administrative headcount in
the HR department/ Lowered HR operating costs. .837 .789
OP6 The HRIS has made HR administration more
streamlined. .772 .742
OP7 The HRIS has better tracking of employee
information. .763 .797
OP8 The HRIS has reduced in paperwork. .803 .805
OP9 The HRIS has eliminated the work duplicate On. .769 .792
Factor (3) Relational effectiveness
RL1 The HRIS has reduced response times to serve our
customers or clients. .819 .800
RL2 The HRIS improved employee awareness,
appreciation, and use of HR programs. .694 .823
RL3 The HRIS has improved working relationships with
upper management. .733 .839
RL4 The HRIS has improved line managers' ability to
meet HR responsibilities. .675 .823
RL5 The HRIS has enhanced our ability to recruit and
retain top talent. .734 .790
RL6 The HRIS has improved quality and timeliness of
services to employees. .821 .847
RL7 The HRIS has received HR staff acceptance. .711 .816
RL8 The HRIS has empowered employees and managers
to make more decisions on their own about needs. .661 .712
RL9 The HRIS has improved relationships with citizens
and business and HR. .645
.839
RL10 The HRIS has better co-ordination among the
different functional areas in the organisation. .630 .712
Note alpha .967

295
﴾ فترضى ربك يعطيك ولسوف ﴿
الحمدهلل