red team amanda newman ankit patel bryan cuervo utc engr 329 sept. 14, 2005
Post on 21-Dec-2015
216 views
TRANSCRIPT

Red Team
Amanda Newman Ankit Patel Bryan Cuervo
UTC ENGR 329Sept. 14, 2005

Outline
Process Control Theory Background Steady State/Step Response
Results Conclusions

Systems Identification
M(t) vs. C(t)
The SSOC Operation range
The FOPDT Steady-state gain, response time, dead time

Background – System Parameters
Input M(t) % power to blower motor (%)
Output C(t) Pressure (cm-H2O)

Block Diagram – Pressure System

Pressure System Schematic

TAP TUBING
OUTLETBLOWERMOTOR
VARIABLE SPEEDDRIVE
CIRCUIT CONNECTOR
PRESSURERECORDING
CONTROLLER
DAMPERS
TRANS-DUCER

SSOC Calculations Steady-state response curves Trials at 10% input intervals Sample range taken from steady-
state region (12-15 seconds)

Results – Pressure SystemSteady-State Operation at 90% Input
0
1
2
3
4
5
6
7
8
9
10
0 2 4 6 8 10 12 14 16
Time (s)
Pre
ssu
re (
cm-H
2O)
BJC9-11-05
Sample Range

SSOC - Pressure System
0
2
4
6
8
10
0 20 40 60 80 100
M(t), Input Power(%)
C(t
), P
res
su
re(c
m-H
2O
)
BJC9/7/05
Operational Output
Operational Input

FOPDT PARAMETER CALCULATIONS
Input ranges 10-40%, 40-70%, 70-100%
All “UP” Steps 4 trials per input step range t0 ,T and K
Ave 95% confidence level – Student’s t

Results – Step Response10% Base, 30% Step
0
5
10
15
20
25
30
35
40
45
0 5 10 15 20 25
Time (s)
Inp
ut,
mo
tor
po
we
r (%
)
0
0.02
0.04
0.06
0.08
0.1
0.12
0.14
0.16
0.18
Ou
tpu
t, p
res
su
re (
cm
-H2
O)
Input Output

Step Response - 10% Base, 30% Step
0
5
10
15
20
25
30
35
40
45
0 5 10 15 20 25
Time (s)
Inp
ut,
mo
tor
po
wer
(%
)
0
0.02
0.04
0.06
0.08
0.1
0.12
0.14
0.16
0.18
Ou
tpu
t, p
ress
ure
(cm
-H2O
)
Input Output
ΔM
ΔC
63.2% of ΔC
to
Τ
K=ΔC/ΔM

Parameter Results –Data Sample
K to T(cm-H2O)/% (sec) (sec)
AVE 0.0037 0.65 2.1Student's T ± 0.00006 ± 0.072 ± 0.06
10 - 40% Input Range
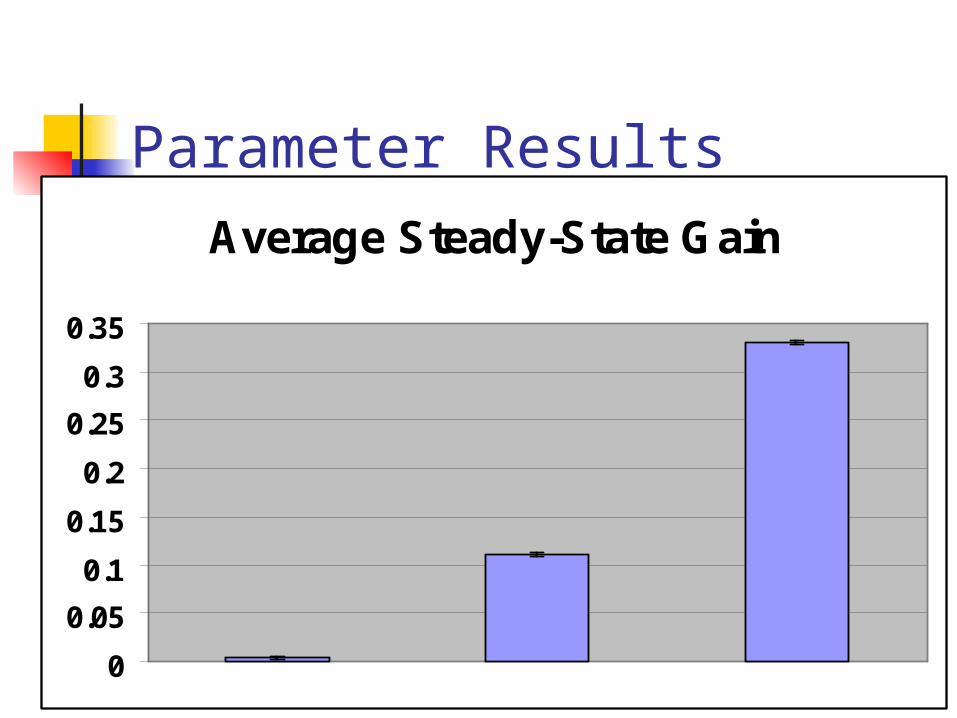
Parameter ResultsAverage Steady-State Gain
0
0.05
0.1
0.15
0.2
0.25
0.3
0.35
10%-40% 40%-70% 70%-100%

Parameter ResultsAverage Response Time
0
0.5
1
1.5
2
2.5
3
10%-40% 40%-70% 70%-100%

Parameter ResultsAverage Dead Time
0
0.2
0.4
0.6
0.8
10%-40% 40%-70%

Summary and Conclusions
The C(t), M(t) relation SSOC
Non-linear 1-10 cm-H2O Operational output range
30%-100% Operational input range

Summary and Conclusions
FOPDT Step Response Parameters Gain – Increases from lower to upper
ranges. Response Time – Significant variance
between ranges. Dead Time – Decreases from lower to
upper ranges.