reducing a companies carbon footprint through energy saving
TRANSCRIPT

Engineering Management Field Project
Reducing a Companies Carbon Footprint through Energy Saving Best Practices at a
Dairy Manufacturing Facility
By
Michael J. Kortan
Fall Semester, 2010
An EMGT Field Project report submitted to the Engineering Management Program and the Faculty of the Graduate School of The University of Kansas
in partial fulfillment of the requirements for the degree of Master’s of Science
____________________________ Herb Tuttle Committee Chairperson
____________________________ Tim Wilcoxon Committee Member ____________________________ Mike Kelly Committee Member Date accepted:____________________________

ii
Table of Contents Page
Table of Contents ii
Acknowledgements iv
Acronyms v
List of Figures vi
Executive Summary 1
Chapter 1 - Introduction
Introduction to Topic 2
Chapter 2 – Literature Review
Current Government Regulations for Greenhouse Gasses 6
Proposed Government Regulations for Greenhouse Gasses 7
Greenhouse Gas Protocol Corporate Standard 8
Industry Best Practices 8
Chapter 3 – Procedures and Methodology
Developing a Vision 9
Kick-off Activity 10
Mapping 11
Benchmarking 13
Focus Activities 16
Implement 17
Employee Involvement 19
Tracking 20
Communication 20

iii
Celebrating 21
Sharing Best Practices 21
Chapter 4 – Results and Conclusions
Conclusions 22
Chapter 5 - Suggestions for Additional Work
Other research to be conducted 24
Reference/Bibliography 25
Appendices A
Appendix A-1 – Perception of responsibility for consumer’ carbon footprint 28
Appendix A-2 - Perception of future responsibility for consumer’ carbon footprint 29
Appendix A-3 – Perception of willingness to pay for produce that contributes
50 percent less GHG emissions 30
Appendices B
Appendix B-1 - Plant Drawings 31
Appendix B-2 – Equipment List 33
Appendix B-3 – Total Monthly Utilities Used for XYZ Company 34

iv
Acknowledgements
I would like to take this opportunity to first thank god for giving me the ability
and drive to pursuit my dreams. I would also like to thank my family; wife Anita, and
daughters Mikayla and Danielle for allowing me the time and understanding to complete
this program. Special thanks to professor Herb Tuttle who I believe has made my
masters’ learning a joy and a pleasure throughout this process by assisting me in growth
both personally and professionally. I would also like to thank my committee members
Mr. Tim Wilcoxon and Mr. Mike Kelly for assisting me in the writing of this field project
and lastly, I would like to thank the entire staff of the EMGT department and the
University of Kansas.

v
Acronyms
CAA Clean Air Act (CAA)
CFCs Chlorofluorocarbons
CO2 Carbon Dioxide
CO2e Carbon Dioxide Equivalent
EPA United States Environmental Protection Agency
GHG Greenhouse Gasses
GHG Protocol Greenhouse Gas Protocol Corporate Standard
GWP Global Warning Potential
HFCs Hydrofluorocarbons
HVAC Heating, Ventilating and Air Conditioning
NASA National Aeronautics and Space Administration
NOAA According to the National Oceanic and Administration
PFCs Perfluorocarbons
P&ID Piping and Instrument Drawings
OEM Original Equipment Manufacturer

vi
List of Figures Page
Figure 1.1 – Greenhouse effect 2
Figure 1.2 - GHG emissions by gas in the U.S 4
Figure 3.1 – Total facility carbon footprint at the XYZ Company facility 14
Figure 3.2 – Facility electrical breakdown of carbon
footprint at the XYZ Company facility 15
Figure 3.3 – Facility natural gas breakdown of carbon
footprint at the XYZ Company facility 15
Figure 3.4 – Facility gasoline breakdown of carbon
footprint at the XYZ Company facility 16
Figure 3.5 – Facility lighting breakdown by fixture of carbon
footprint at the XYZ Company facility. 17
Figure 3.6 – Facility lighting breakdown by fixture with related
avoidance of carbon footprint at the XYZ Company facility. 18
Figure 3.7 – Facility lighting breakdown by sensor area with related
avoidance of carbon footprint at the XYZ Company facility. 19

- 1 -
Executive Summary
Today global warming and the issues that cause it are a high priority to
consumers. They want the companies that provide their products and services to reduce
the global warming gasses in the atmosphere and as such consumers are willing to reward
these companies with increased sales. These global warming gasses are made up of both
naturally occurring and non-naturally occurring gasses. Naturally occurring gasses are
carbon dioxide (CO2 ), methane, nitrous oxide, and ozone gasses while non-naturally
occurring gasses are chlorofluorocarbons (CFCs), hydrofluorocarbons (HFCs), and
perfluorocarbons (PFCs). To accurately measure these gasses in relationship to each
other they will need to be converted into a common measuring unit and the most widely
excepted common unit is the carbon dioxide equivalent (CO2e). There are also several
different ways to look at tracking a company’s production of the CO2e and each way
have a slightly different definition of what CO2e are counted. This paper will use the
Greenhouse Gas Protocol Corporate Standard (GHG Protocol) to insure that we have a
uniform way to identify, track, and compare company’s carbon footprints. The GHG
Protocol only considers the GHG emission in which the company has control over and
such will be counted in the company’s carbon footprint calculations. Using the eleven
step process, as defined in this paper, to reduce a company’s carbon footprint and
introducing some helpful tools that will assist in this process. The XYZ Company
facility found through this process that their greatest area of opportunity was the lighting
of their facility and by installing efficient lighting reduced their carbon footprint by 3.4%
and realized an electrical savings of $ 14,000.00 per year.

Cha
spend
mont
appro
48).
gasse
1.1) i
witho
degre
possi
apter 1 –
In Decem
ding package
ths that woul
opriate thresh
According t
es are gasses
is when thes
out this natur
ees Fahrenhe
ible.
Introdu
mber 2007, th
e in which se
ld require m
holds in all s
to the United
that trap he
e gasses rad
ral occurring
eit lower tha
ction
hen Presiden
et aside mon
andatory rep
sectors of th
d States Envi
at in the atm
iate this heat
g “greenhous
an they are no
- 2 -
nt George W.
ney to develo
porting of gr
e economy o
ironmental P
mosphere and
t back to the
se effect”, te
ow, and life
. Bush signe
op and publi
reenhouse ga
of the United
Protection A
d the greenho
e earth’s surf
emperatures
as we know
ed the Omnib
ish a draft ru
as emissions
d States (Ke
Agency (EPA
ouse effect (
face to warm
would be ab
w it would no
bus Federal
ule within 18
s above
nney 2008,
A) greenhous
(see Figure
m it. So
bout 60
ot be
8
se
- 3 -
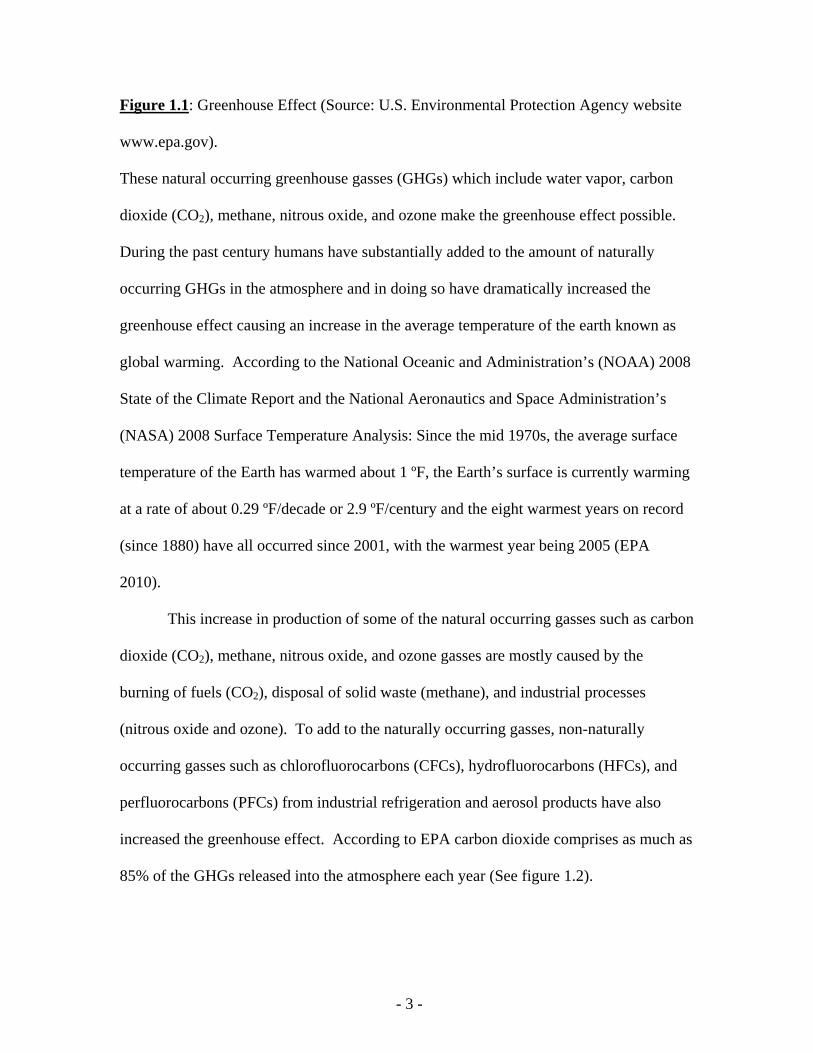
Figure 1.1: Greenhouse Effect (Source: U.S. Environmental Protection Agency website
www.epa.gov).
These natural occurring greenhouse gasses (GHGs) which include water vapor, carbon
dioxide (CO2), methane, nitrous oxide, and ozone make the greenhouse effect possible.
During the past century humans have substantially added to the amount of naturally
occurring GHGs in the atmosphere and in doing so have dramatically increased the
greenhouse effect causing an increase in the average temperature of the earth known as
global warming. According to the National Oceanic and Administration’s (NOAA) 2008
State of the Climate Report and the National Aeronautics and Space Administration’s
(NASA) 2008 Surface Temperature Analysis: Since the mid 1970s, the average surface
temperature of the Earth has warmed about 1 ºF, the Earth’s surface is currently warming
at a rate of about 0.29 ºF/decade or 2.9 ºF/century and the eight warmest years on record
(since 1880) have all occurred since 2001, with the warmest year being 2005 (EPA
2010).
This increase in production of some of the natural occurring gasses such as carbon
dioxide (CO2), methane, nitrous oxide, and ozone gasses are mostly caused by the
burning of fuels (CO2), disposal of solid waste (methane), and industrial processes
(nitrous oxide and ozone). To add to the naturally occurring gasses, non-naturally
occurring gasses such as chlorofluorocarbons (CFCs), hydrofluorocarbons (HFCs), and
perfluorocarbons (PFCs) from industrial refrigeration and aerosol products have also
increased the greenhouse effect. According to EPA carbon dioxide comprises as much as
85% of the GHGs released into the atmosphere each year (See figure 1.2).

emiss
dioxi
most
chang
Figur
Agen
(P&G
impo
globa
their
repor
“Carbon f
sion for whic
ide equivalen
companies i
ge with the i
re 1.2: GHG
ncy website w
According
G), “The vas
rtant” (Wass
al warming,
own opinion
rt from Iowa
footprint” or
ch an organi
nts (CO2e) a
in the United
implementat
G Emissions
www.epa.go
g to Len Sau
t majority of
serman 2008
and carbon f
n of who is r
a State Unive
r GHG emiss
ization is res
as they relate
d States do n
tion of new l
by Gas in th
ov).
uers, Vice Pr
f consumers
8, 49). Toda
footprint. M
responsible a
ersity, Assoc
- 4 -
sion invento
sponsible and
e to global w
not track thei
legislation an
he U.S (Sour
resident Sust
(50-75%) fe
ay’s consume
Many have re
and who sho
ciate Directo
ory is the tota
d is expresse
warming pote
ir carbon foo
nd public ed
rce: U.S. Env
tainability fo
feel environm
ers are extre
esearched thi
ould fix the p
or Rich Pirog
al amount of
ed in terms o
ential (GWP)
otprint, but t
ducation.
vironmental
or Proctor an
mental issues
emely aware
is issue and
problem. In
g, consumers
f GHG
of carbon
). Currently
this will
Protection
nd Gambles
s are
of GHGs,
have formed
a recent
s were asked
y,
d
d

- 5 -
their perception of who was responsible for consumers’ carbon footprint, would they be
willing to pay more for products that emitted half the GHGs, and who should take the
biggest future role in minimizing the carbon footprint of products. The results were 48
percent of the respondents said that manufacturers and processors are responsible for
consumers’ carbon footprint, while 11 percent said government, and only 3 percent said it
was farmers (see Appendix A-1). In the same report when consumers were asked if they
would be willing to pay more for products that emitted half the GHGs, 54 percent said
that they would be willing to pay the same amount, and 29 percent said that they would
be willing to pay 10 percent more (see Appendix A-2). When asked who should take the
biggest future role in minimizing the carbon footprint of product, 45 percent of
respondents said it should be manufacturers, and processors, while 21 percent said it
should be government and only 3 percent said it should be farmers (see Appendix A-3)
(Pirog, 2008, 22-24). From these studies it is evident that today’s consumer wants the
manufacturers to take the first steps in reducing their carbon footprint and thus reducing
global warming. Companies that develop and implement climate change strategies now
will gain a competitive advantage as the economy adjusts, improve the companies’ public
image, and enhance corporate social responsibility. Len Sauers also states that “by 2012,
P&G plans to cut its carbon footprint by as much as 40%” (Wasserman 2008, 49).

- 6 -
Chapter 2 – Literature Review
Introduction
A literature review was conducted through the EPA web site, Google Scholar, and
Wilson Omnifile search engines using the keywords greenhouse gasses, carbon footprint,
and dairy manufacturing and its purpose was to find the current and proposed
government regulations on GHG emissions, a widely acceptable way to record and trace
a company’s GHG emissions, and to find energy saving best practices that would pertain
to a dairy manufacturing facility infrastructure such as: boilers, refrigeration, lighting,
and HVAC.
Current Government Regulations
Global warming and the reduction of carbon dioxide emissions are at the top of
the environmental policy agenda today (Weidema 2008, 4). There are no current laws
that require food manufacturing companies, in particular the dairy industry, to track
and/or report their GHG emissions or company’s carbon footprint at this point. The only
EPA regulation or rule is the mandatory reporting of greenhouse gasses rule. This rule
was prepared in accordance with the FY2008 Consolidated Appropriations Act, which
was signed into law in December 2007. EPA issued the rule pursuant to its authority
under the Clean Air Act (CAA) (EPA, 2007). The mandatory reporting rule was
published in the federal register on October 30, 2009 and thereby the effective date is
December 29, 2009. This rule will apply to fossil fuel suppliers, industrial gas suppliers,
direct GHG emitters, and manufacturers of vehicles. According to the rule these
reporters will begin collecting data on January 1, 2010 and will be required to report their

- 7 -
GHG to EPA on March 31, 2010. There have been no threshold limits or permit
requirements by the EPA at this time in regards to this rule.
Proposed Government Regulations
In Kyoto in 1997, the U.S. government agreed that between 2008 and 2012 it
would limit average annual emission of GHGs to seven percent below 1990 levels
(Fischer 1998, 1). There are currently two theories of how to regulate the GHGs omitted
from the U.S., the first theory is a cap and trade system and the second is a government
taxation system. The cap and trade system would start by issuing permits to the
“upstream” sources (i.e. power plants, steel mills) at the total levels of seven percent
below 1990 levels emissions as required by the protocol. Then these GHG producers
could buy and sell carbon credits that they need or did not use on the open market. A
carbon credit would be equal to one unit of GHG emission or CO2e. This would let the
market fluctuate the price of the carbon credits based on supply and demand. Companies
would have to identify, track and report their GHG emissions to a government agency
such as EPA who would oversee the permits but just to ensure that companies were
properly recording their total GHG emissions inventory and have the proper credits to
cover that amount. A government taxation system would still start with a permit that
would meet the requirements of seven percent below 1990 levels of GHG emissions and
then companies would pay a tax to the government for any GHG emitted over their GHG
emissions permit level. This would be a fixed taxation cost per unit of CO2e or GHG
emitted and would be set by the government through legalization. Companies would still
have to identify, track and report their GHG emissions to the EPA or another government
agency as in the “cap and trade” system but they would also have to pay any additional

- 8 -
fees for violating their permits to the government. These costs would not fluctuate as the
government would have a set cost of the taxation rate and could even set different levels
of cost the higher the emissions went.
Calculating Carbon Footprints
There are several different widely accepted standards for calculating a company’s
carbon footprint but for the purpose of this paper I will use the Greenhouse Gas Protocol
Corporate Standard (GHG Protocol) to monitor and calculate the amounts of GHG
emitted or carbon footprint produced by a company. The GHG Protocol I will also just
focus on the production facility and in particular a dairy manufacturing facility’s direct
emissions but will not include production, packaging materials, or the supply chain. The
GHG Protocol establishes organizational boundaries of where the company’s
responsibilities start and where they end with respect to the carbon footprint that their
product or service has on the environment and global warning.
Industry Best Practices
My research did not find any specific best practices related to the milk industry or
milk processing facilities but the good practice guide series were found that are intended
to provide advice on practical ways of improving the energy efficiency of manufacturing
facilities. This series was produced for United Kingdom’s Department of the
Environment and contains many best practices for a range of topics related to
manufacturing facilities, equipment, project management, and employee training. This
series did contain best practices in facility light, boiler, HVAC, and refrigeration system
in which are common to milk processing facilities.
- 9 -
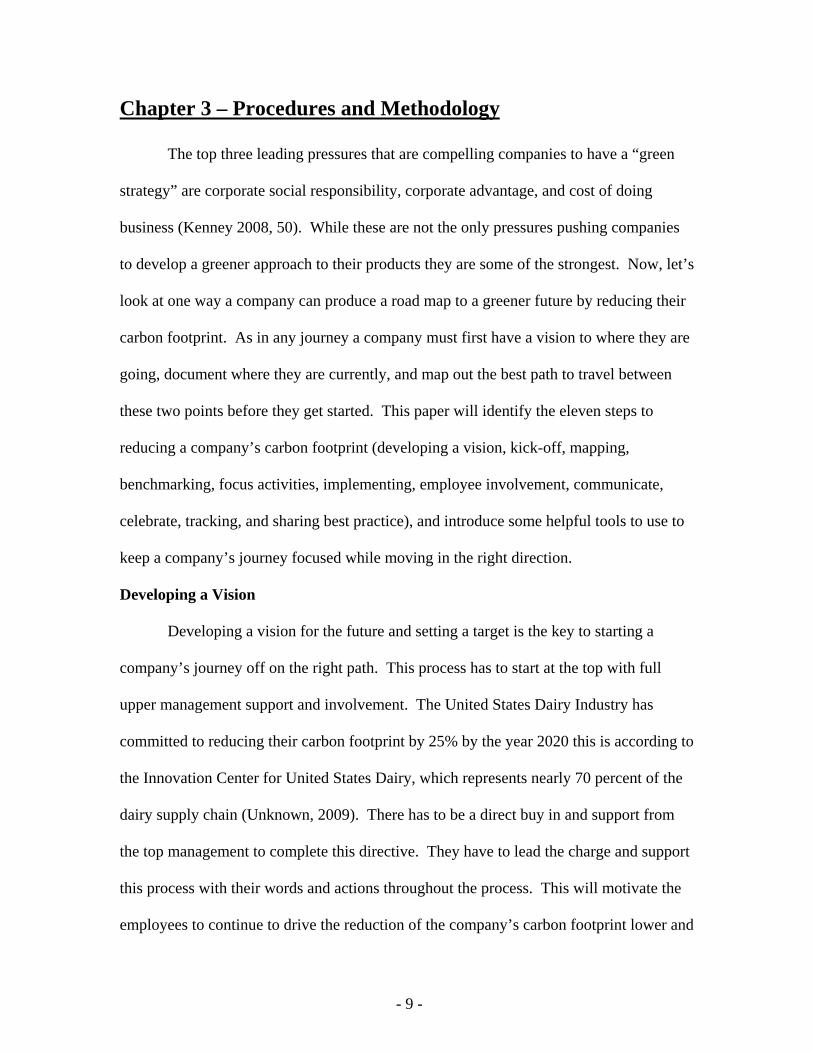
Chapter 3 – Procedures and Methodology
The top three leading pressures that are compelling companies to have a “green
strategy” are corporate social responsibility, corporate advantage, and cost of doing
business (Kenney 2008, 50). While these are not the only pressures pushing companies
to develop a greener approach to their products they are some of the strongest. Now, let’s
look at one way a company can produce a road map to a greener future by reducing their
carbon footprint. As in any journey a company must first have a vision to where they are
going, document where they are currently, and map out the best path to travel between
these two points before they get started. This paper will identify the eleven steps to
reducing a company’s carbon footprint (developing a vision, kick-off, mapping,
benchmarking, focus activities, implementing, employee involvement, communicate,
celebrate, tracking, and sharing best practice), and introduce some helpful tools to use to
keep a company’s journey focused while moving in the right direction.
Developing a Vision
Developing a vision for the future and setting a target is the key to starting a
company’s journey off on the right path. This process has to start at the top with full
upper management support and involvement. The United States Dairy Industry has
committed to reducing their carbon footprint by 25% by the year 2020 this is according to
the Innovation Center for United States Dairy, which represents nearly 70 percent of the
dairy supply chain (Unknown, 2009). There has to be a direct buy in and support from
the top management to complete this directive. They have to lead the charge and support
this process with their words and actions throughout the process. This will motivate the
employees to continue to drive the reduction of the company’s carbon footprint lower and
- 10 -
lower. Reducing the company’s carbon footprint as much as 40 to 50 percent in some
cases by the time they are done. To illustrate this process this paper will use examples
from a dairy manufacturing facility that we will call the XYZ Company facility. At XYZ
Company the top management has set a goal of reducing their carbon footprint by 25%
by the year 2020. As most milk manufacturing facilities have a relatively small number
of employees (10 to 50 employees) and older facilities, some built in the early 1900’s,
there is a lot that they can do to improve their carbon footprint if properly motivated. The
XYZ Company facility has 45 employees, operates a 24 hour per day 6 day a week
operation, the original plant was built in 1936, and has had several additions to the
facility since then. The facility is like most other manufacturing facilities they have all of
the facility systems that you would find in a typical food manufacturing plant such as
facility lighting, ammonia refrigeration, compressed air, boilers, and heating, ventilation
and air conditioning (HVAC) systems.
Kick-Off
The kick-off of this process should be a celebration used to get everyone
motivated and involved. As in any long trip there must be a proper send off to get thing
started on the right foot. Be creative to push the theme of reducing the company’s carbon
footprint. Use such things as green tee shirts, florescent light bulbs for employee’s
homes, or grocery recycle bags to get the employee’s engaged in the carbon reduction
process. This will help get employees involved in management’s vision to lower the
company’s carbon footprint and reinforce the support of the upper management to
accomplish this vision. At the start, management must speak of their dedication to this
process and how they will support the efforts of the employees as they travel through the

- 11 -
long process of reducing the facilities carbon footprint. Management must also speak of
the benefits to both the employees and the company for creating a greener process to
produce their products. It is extremely important to get started with a bang and to get a
lot of enthusiasm from the employees to make this incentive work. At this stage,
employees need to know that this is not just another flavor of the month initiative that
management is implementing and that they are serious about seeing this process through
to the end. At this kick-off meeting it is best if the upper management speaks to both the
group and the individuals personally that make up this effort to reduce their facilities
carbon footprint. Don’t cut it short and involve as many employees of the plant as
possible. In today’s manufacturing world most facilities manufacture their products
around the clock and this makes it extremely difficult to gather all of the employees in
one place at one time. At XYZ Company they had an employee picnic day that involved
not only the employees but also their families. Although company picnics are not unique
at every company this was XYZ Company’s first such event that involved employee’s
families making it special to this facility. The picnic was held on a Saturday to involve
all shifts and had a tremendous turnout. There were games, with “green” prizes, lunch,
and the management speech was kept short but individual talks went on throughout the
event with key employees. Although it was not mandatory to attend the picnic all
employees were encouraged to participate in this activity.
Mapping
Mapping is easy it is just writing down the steps of your process and a short
description of what takes place during that step. Start at the beginning of the process and
write down each step that the process goes through to complete the production of a

- 12 -
company’s product. The easiest way to complete this step is by making a picture that
describes the steps to produce the product. A drawing of the facility will come in handy
to record the steps that make up the company’s process and identify all of the steps that
are taken each time that a product is produced. The map may have to be reviewed several
times before all of the steps are recorded properly and no steps have been omitted or
forgotten. These are usually easy steps that are not normally thought about when
completing the process but they are extremely important to include in the map of the
company’s process. To complete the mapping process use plant layout drawings,
equipment layout drawings, piping and instrument drawings (P&ID) as these documents
will aid in the recording of the company’s process flow. Also use goods receipts such as
for packaging, product materials, natural gas, and electricity to develop what the
company’s inputs are, follow them throughout the process, and also identify all of the
output that leave the facility. Get as many different disciplines involved as possible as
they tend to have a different view of the process than the other. Start to write down the
steps that are taken complete the process that is being map not leaving out any steps no
matter how small. Start at the receiving bay doors (beginning of the process) and
document every step from that point until the product gets to the shipping bay doors (end
of the process) this will provide a great start on the mapping of the process. Also don’t
forget by products of the process such as trash created by the process, cleaning of the
process, and product waste must all be included to gain a complete view of the
company’s process. This will be a living document as it is always changing and evolving
as the company invests in new processes or changes to the current processes. Some
examples of these documents are located in appendix B including the XYZ Company

- 13 -
facility drawing (See Appendix B-1) and the XYZ Company facility’s equipment
inventory (See Appendix B-2). At XYZ Company they used the energy bills such as
electric, natural gas and, gasoline as these are a great place to start with identify the
related facility carbon footprint for their facility. At most location these bills are
especially easy to obtain and will be a great start to find what inputs are for the XYZ
Company facility. Started at where these inputs come into the facility and where they go
but remember limit the search to just one specific area or it will become overwhelming
quickly with steps.
Benchmarking
Benchmarking will start to place a value on each of the steps or inputs that were
identified in the previous mapped step. Gather all of the measurements that can be found
for the process that will be benchmark again keep it to just one process or a well defined
piece of a process. This can include utility bills, supplier’s invoices, equipment OEM
standards, gage measurements, and individual average measurements that can be taken.
Just use the meter readings that are currently in place such as incoming electrical reading
and then follow the flow of the input throughout the facility until the process is
completed. Benchmarking is how the company can gage a progress and identify the
company’s best starting point to reduce its carbon footprint. First assign values to all of
the points that have been identified on the mapping chart. This paper will use the GHG
Protocol to benchmark our carbon footprint and the facility’s total yearly utility usage
broken down into months (See Appendix B-2). Using these utility bills for the monthly
usage rate to start will give us a general sense of monthly usage and trend high usage
areas. These bills will only take the benchmarking so far and usage will have to be
- 14 -
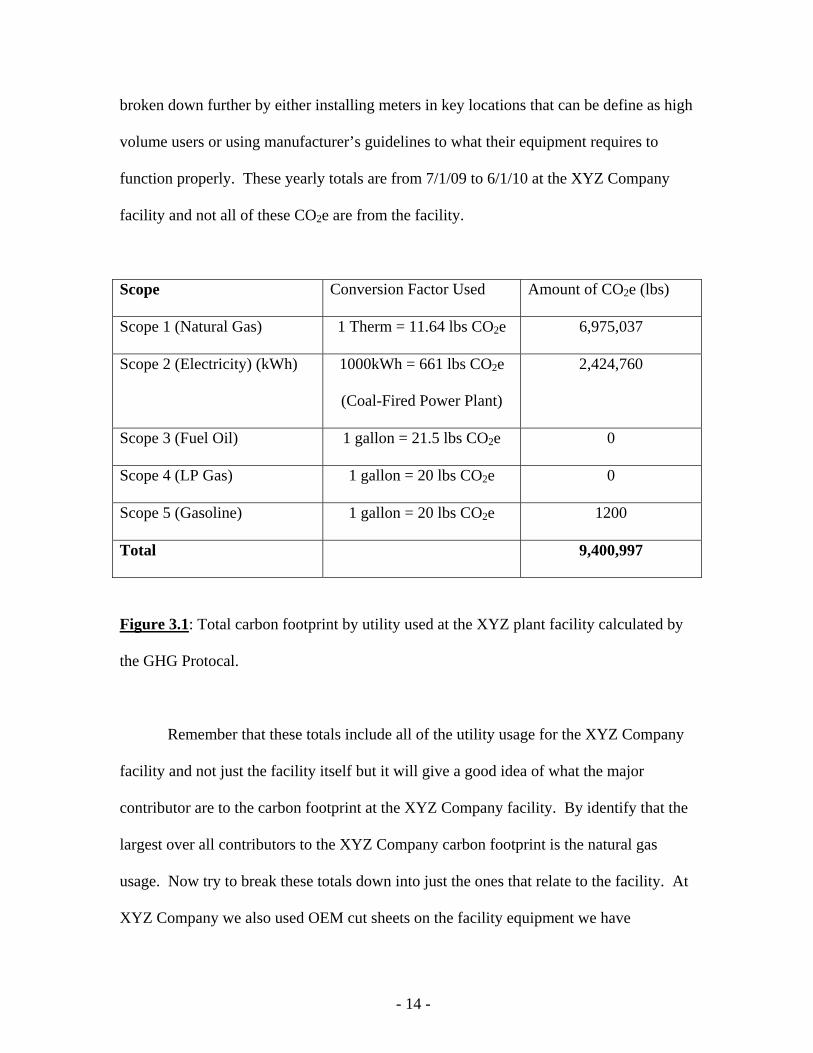
broken down further by either installing meters in key locations that can be define as high
volume users or using manufacturer’s guidelines to what their equipment requires to
function properly. These yearly totals are from 7/1/09 to 6/1/10 at the XYZ Company
facility and not all of these CO2e are from the facility.
Scope Conversion Factor Used Amount of CO2e (lbs)
Scope 1 (Natural Gas) 1 Therm = 11.64 lbs CO2e 6,975,037
Scope 2 (Electricity) (kWh) 1000kWh = 661 lbs CO2e
(Coal-Fired Power Plant)
2,424,760
Scope 3 (Fuel Oil) 1 gallon = 21.5 lbs CO2e 0
Scope 4 (LP Gas) 1 gallon = 20 lbs CO2e 0
Scope 5 (Gasoline) 1 gallon = 20 lbs CO2e 1200
Total 9,400,997
Figure 3.1: Total carbon footprint by utility used at the XYZ plant facility calculated by
the GHG Protocal.
Remember that these totals include all of the utility usage for the XYZ Company
facility and not just the facility itself but it will give a good idea of what the major
contributor are to the carbon footprint at the XYZ Company facility. By identify that the
largest over all contributors to the XYZ Company carbon footprint is the natural gas
usage. Now try to break these totals down into just the ones that relate to the facility. At
XYZ Company we also used OEM cut sheets on the facility equipment we have

- 15 -
identified to get a general energy usage on each piece of facility equipment and what the
manufacturer says it will use. This is a good start to finding the high usage areas for the
facility. When applied this information to the XYZ Company facility equipment and the
numbers below were found. (See Figure 3.2, Figure 3.3, and Figure 3.4).
Scope (Electrical) Conversion Factor Used
(Coal-Fired Power Plant)
Amount of CO2e
Scope 2 (Lighting) 1000kWh = 661 lbs CO2e 269,418
Scope 2 (HVAC) 1000kWh = 661 lbs CO2e 43,626
Scope 2 (Refrigeration) 1000kWh = 661 lbs CO2e 810,737
Total 1,123,781
Figure 3.2: Facility electrical breakdown of carbon footprint at the XYZ Company
facility.
Scope (Natural Gas) Conversion Factor Used Amount of CO2e
Scope 1 (Steam Heating) 1 Therm = 11.64 lbs CO2e 1,314
Scope 1 (Facility Cleaning) 1 Therm = 11.64 lbs CO2e 154,587
Scope 1 (Domestic Hot Water) 1 Threrm = 11.64 lbs CO2e 978
Total 156,879
Figure 3.3: Facility natural gas breakdown of carbon footprint at the XYZ Company
facility.

- 16 -
Scope (Gasoline) Conversion Factor Used Amount of CO2e
Scope 5 (Lawn Equipment) 1 gallon = 20 lbs CO2e 900
Scope 5 (Fire Pump) 1 gallon = 20 lbs CO2e 300
Total 1,200
Figure 3.4: Facility gasoline breakdown of carbon footprint at the XYZ Company
facility.
By using these figures it was found that the electrical usage is the XYZ Company’s
highest usage point for the facility. Remember that these numbers are just estimates and
will not help track the improvements in these areas as it will not provide an accurate
measurement for that purpose.
Focus Activities
Focus activities in the high usage areas that were identified in the benchmarking
part of this process. These are the best place to start to reduce the company’s carbon
footprint, a good place to start researching is best practices that other facilities have use
successfully, and develop quick wins for the company’s carbon footprint reduction
efforts. The next step is to form a focus improvement team to concentrate on the areas
that have been identified in this process and to research industry best practices in this
area. XYZ Company did form a focus improvement team that includes management,
engineering, production employees, and maintenance. As they identified two key areas
to focus activities on and they were the electrical lighting and the freezer/cooler

- 17 -
refrigeration. XYZ Company chose to just focus on the electrical lighting for the facility.
The next step was to breakdown the electrical lighting into smaller area to apply the
team’s focus. In Figure 3.5, there is a breakdown of the electrical lighting usage at the
XYZ Company facility into different types of fixtures. When the team completed this
step it was clear that the team could look at all of the lighting fixtures in the XYZ
Company facility and not be overwhelmed with data. As they researched best practices
and found two areas of great success in reducing other company’s usage. These fixtures
were replaced with energy efficient florescent lighting and the use of motion sensors to
control lighting in unoccupied areas location in the XYZ Company facility. Both of these
best practices appear to fit perfectly with the operations at the XYZ Company facility.
Current Electrical
Lighting
Conversion Factor Used
(Coal-Fired Power Plant)
Amount of CO2e
400 W Metal Halide 1000kWh = 661 lbs CO2e 154,198
HP Sodium 1000kWh = 661 lbs CO2e 128,498
T-12 - 4’ 1000kWh = 661 lbs CO2e 23,606
T-12 – 8’ 1000kWh = 661 lbs CO2e 22,606
Figure 3.5: Facility lighting breakdown by fixture of carbon footprint at the XYZ
Company facility.
Implement
Implement recommendations from the focus improvement efforts. Start slow and
get some easy wins to get the ball rolling. These can be anything that is quick and easy to

- 18 -
complete from steam traps repair, air leaks, or lighting changes anything to get a little
momentum going. At XYZ Company facility it was determined that the install of energy
efficient lighting, in the form of T-5 high efficient fixture to replace the 400 W metal
halide fixtures in the warehouse and freezer/cooler areas. XYZ Company will also install
motion sensors for the new light fixture that have been broken into small zones so that if
a zone is unoccupied the lights will remain off. In Figure 3.6 and Figure 3.7 are the
estimated returns that the team expects to receive by completing these initiatives. It was
concluded that XYZ Company could reduce the warehouse lighting carbon footprint by
as much as 1/5 by using sensors to control the lighting in the freezer/cooler area. Also
identified was the load out and scale areas which were also unoccupied during most of
the day.
Current Electrical
Lighting
Proposed Electrical
Lighting
Current Amount of t
CO2e
Amount of CO2e
Avoided
400 W Metal Halide T-5 Florescent 154,198 21,784
HP Sodium T-5 Florescent 128,498 9,149
T-12 - 4’ T-8 Florescent 23,606 3,939
T-12 – 8’ T-8 Florescent 22,606 4,472
Figure 3.6: Facility lighting breakdown by fixture with related avoidance of carbon
footprint at the XYZ Company facility.

- 19 -
Current Electrical
Lighting
Proposed Electrical
Lighting
Current Amount of t
CO2e
Amount of CO2e
Avoided
400 W Metal Halide Sensors on/off 154,198 30,839
HP Sodium Sensors on/off 128,498 12,416
T-12 - 4’ Sensors on/off 23,606 0
T-12 – 8’ Sensors on/off 22,606 0
Figure 3.7: Facility lighting breakdown by fixture with related avoidance of carbon
footprint at the XYZ Company facility.
Employee Involvement
Employee involvement is extremely important throughout this process.
The quickest way to improve is to get everyone involved and always provide feedback to
keep them involved. Encourage everyone to participate and submit ideas on energy and
carbon reduction ideas. At XYZ Company they have developed an energy team that will
continue to identify both new facility opportunities and to expand this process to include
other plant processes. XYZ Company has started a suggestion box for ideas from the
employees that could save energy, reduce the facility’s carbon footprint and have
implemented an energy talk attached to each monthly safety meeting that is held at the
plant to keep all of the employees engaged in the carbon reduction initiatives.

- 20 -
Tracking
Tracking will allow the carbon reduction initiative to build momentum for the
future. Once the team has identified the areas to target it will have to develop an accurate
way to track the improvements. This is where the installation of meters or similar
devices will allow you to get a true measurement of what is being used in your focused
area. Someone needs to be assigned both to gather the information on a regular schedule
and to trend this data for analysis by the team. This information will also allow
management to do their part in directing the efforts in the right directions and keep
everyone moving in the same direction. When you assign a specific individual to update
the information always allow them the time to complete this task because this
information is extremely important in the efforts to reach your company’s carbon
footprint goal. For XYZ Company we have decided to install meters at our warehouse
lighting panels and track this area closely as we feel this is the greatest area of
improvement. Although we did not install meters at the other locations we continue to
track our total electrical usage on a daily bases as this is still the goal of reducing the total
carbon footprint by 25%.
Communicate
Communicate throughout this process to all involved or effected by the reduction
efforts at the company and post all of the results on a common board that will allow
everyone to get involved and participate in the process. This needed to be updated
frequently at least once a week if not every day. This will help everyone to have the
common targets and help pull everyone together in your efforts to reduce the company’s
carbon footprint. Encourage all of the employees to look frequently at the information

- 21 -
but make it fun. Ask questions about the information for prizes in plant meetings or quiz
employees on the floor for prizes about the information on the boards. This will keep
employees engaged in the process and keep the ideas for carbon reduction coming.
Celebrate
Celebrate your plant’s progress as it doesn’t always take a full blown party just a
thanks works at a monthly safety meeting or just results shared to assure employees that
this is still an ongoing priority with management. Try to mix it up don’t just do the same
thing over and over again. Employees tend to get use to pizza parties and they forget the
original purpose for the party. Also make sure everyone knows the reason that you are
having the party. This would be for hitting a milestone, completion of an improvement
installation, or the completion of benchmarking another process.
Sharing Best Practices
Sharing best practices with others in the organization to help them get started and
watch the ideas come back with even better ideas from other facilities. Although it is a
good idea for the company to develop a best practice form to insure all of the required
information is recorded. This will help all the company’s facilities to benefit from each
other’s learning. This is the documentation step that will allow everyone to improve and
make the company stronger in the market place.
- 22 -
Chapter 4 – Results and Conclusions
By following the basic eleven steps outlined in this field project any company can
reduce their company’s carbon footprint, improve their company’s perception with their
customers, and reduce utility cost in the process. Just remember that this is a never
ending, always evolving process, and there is always opportunity to improve. As the
public continues to push produces to improve their carbon footprint so will the
government bodies that are elected by this same public. The global warming issue will
continue to be a hot topic with consumers and this will push legislators into action. In
our example at XYZ Company they have lowered the total calculated carbon footprint
already be 3.4%, by our estimates as shown in this document, by first identifying our high
usage areas then applying some of the industry’s best practices to reduce the carbon
footprint generation in these areas. As shown above they found that at XYZ Company
electrical lighting and refrigeration were the two greatest areas of usage and they choose
to attack the electrical lighting by installing new technologies in the form of energy
efficient florescent lighting fixture that require less power to produce the same or better
lighting and electrical sensor to control the operation of the unoccupied area lighting.
Some next steps for XYZ Company are to continue to monitor and track the
lighting areas that they have already applied best practices and to continue to apply best
practices to the refrigeration that was also identified to be a high volume usage area.
They also need to apply this methodology to the other processes at the XYZ Company
plant to continue on our path to meeting their goal of 25% reduction of our carbon
footprint by 2020.

- 23 -
Chapter 5 - Suggestions for Additional Work
Some additional work areas that could be explored in this area are production
processes (involving manufacturing equipment, production materials, and packaging
materials), supply chain (i.e. packaging supplies, logistics (truck traffic), raw product,
finished product), share of best practices data bases, and compare different carbon
calculation techniques.
- 24 -
Reference/Bibliography
Energy Efficiency Enquiries Bureau, ETSU, Harwell, Oxforshire, OX11 0RA, 1995
“Good Practice Guide 160 – Electric lighting controls” Crown Publishing, March 1997.
Energy Efficiency Enquiries Bureau, ETSU, Harwell, Oxforshire, OX11 0RA, 1994
“Good Practice Case Study 169 – Energy efficient lighting in factories” Crown
Publishing, June 1994.
Garris, Leah B. 2007 “Four Ways to Shrink Your Building’s Carbon Footprint.”
Buildings 8 (August) 35-38.
Kenney, Brad. 2008. “The What, Why, How and When of Carbon Footprinting.” Industry
Week 5 (May) 48-55.
Fischer, C., Kerr, K., and Toman, M., 1998 “Using Emissions Trading to Regulate U.S.
Greenhouse Gas Emissions: An Overview of Policy Design and Implementation Issues”
Resources for the Future 1998.
Pirog, R., and Rasmussen, R., 2008, Food, Fuel and the Future: Consumer Perceptions of
Local Food, Food Safety and Climate Change in the Context of Rising Prices. September
2008
<http://www.leopold.iastate.edu/pubs/staff/consumer2/report.html>

- 25 -
SETAC Europe LCA Steering Committee (2008): Standardization Efforts to Measure
Greenhouse Gases and ‘Carbon Footprinting’ for Products (Editorial). International
Journal of Life Cycle Assessment, 13, 87-88.
Unknown Arthur, 2009 “Dairy Industry to Cut Milk-related Emissions 25% by 2020.”
Environmental Leader April14, 2009
http://www.environmentalleader.com/2009/04/14/dairy-industry-to-cut-milk-related-
emissions-25-by-2020/
U.S. Environmental Protection Agency. Fact Sheet “What Are Greenhouse Gasses.”
http://www.epa.gov
U.S. Environmental Protection Agency. 2007 Frequently Asked Questions: Mandatory
Reporting of Greenhouse Gases Rule.
http://www.epa.gov/climatechange/emissions/ghg_fag.html#howentities
U.S. Environmental Protection Agency. 2010 Climate Change – Science Temperature
Changes. http://www.epa.gov/climatechange/science/recenttc.html
Wasserman, Todd, 2008 “P&G’s Green Guru Tells Us Why There’s No ‘Green Tide’”
Brandweek 21 (May) 49-50.

- 26 -
Weidema, B., Thrane, M. Christensen, P., Schmidt, J. and Lokke, S. 2008. “Carbon
Footprint: A Catalyst for Life Cycle Assessment.” Journal of Industrial Ecology 12
(February) 3-6.

App
Appe
Cons
Risin
0%
5%
10%
15%
20%
25%
30%
35%
40%
45%
50%
pendices
endix A-1 (S
umer Percep
ng Prices. Se
%
%
%
%
%
%
%
%
%
%
%
Retailers/Supermarke
3%
Perc
A
Source: Pirog
ptions of Loc
ptember 200
etsGovernme
11%
ception of
g, R., and R
cal Food, Fo
08)
ent ManufactuProcess
48%
f Respons
- 27 -
asmussen, R
ood Safety an
urers/sors
Farm
%
3%
sibility for
R., 2008, Foo
nd Climate C
mers M
%
11
Consume
od, Fuel and
Change in th
Me Don
1%
2
er' Carbon
d the Future:
he Context o
n't Know
22%
Footprint
of
Other
2%
ts

Appe
Cons
Risin
0%
5%
10%
15%
20%
25%
30%
35%
40%
45%
endix A-2 (S
umer Percep
ng Prices. Se
%
%
%
%
%
%
%
%
%
%
RetailersSupermark
4%
Source: Pirog
ptions of Loc
ptember 200
s/kets
Governm
21%
Perceptio
g, R., and R
cal Food, Fo
08)
ment ManufacProce
%
45
n of Future
- 28 -
asmussen, R
ood Safety an
cturers/essors
Fa
5%
e Respons
R., 2008, Foo
nd Climate C
armers
3%
ibility for C
od, Fuel and
Change in th
Me
10%
Consumer'
d the Future:
he Context o
Don't Know
15%
Carbon Fo
of
Other
20%
ootprints

Appe
Cons
Risin
0%
10%
20%
30%
40%
50%
60%
endix A-3 (S
umer Percep
ng Prices. Se
%
%
%
%
%
%
%
I'd pay 30%more
2%
Source: Pirog
ptions of Loc
ptember 200
% I'd pay 20%more
5%
Percep
g, R., and R
cal Food, Fo
08)
% I'd pay 10%more
29%
tion of W50
- 29 -
asmussen, R
ood Safety an
% I'd pay thesame amou
54%
illingness0 Percent
R., 2008, Foo
nd Climate C
ent
I'd pay 10%less
3%
s to Pay fot Less GH
od, Fuel and
Change in th
% I'd pay 20%less
1%
or ProducHG Emissi
d the Future:
he Context o
% I'd pay 30%less
4%
ce that Coions
of
% Other
2%
ontributess

App
Facil
pendices
lity Drawing
B
g
- 30 -

Appe
endix B-1 XXYZ Companny facility dr
- 31 -
rawings

- 32 -
Equipment Inventory
Equipment Area Type # of
Units
Energy
Used (Est.)
Lighting Warehouse 400 W Metal Halide 45 129,600
Lighting Butter/Oil Dept Florescent (T-12) 8’ 25 34,200
Lighting Cooler/Freezer/Storage 400 W Metal Halide 36 103,680
Lighting Main Office/Lab Florescent (T-12) 4’ 31 35,712
Lighting Mix room HP Sodium 26 140,400
Lighting Intakes(Old/New)/Scale HP Sodium 10 54,000
HVAC Unit Main Office 10 ton Freon 2 24,000
HVAC Unit Butter/Oil Dept 50 ton Ammonia 1 42,000
Evap Units Cooler/Freezer 20 Ton Ammonia 6 1,226,532
Steam Heater Intakes(Old/New)/Scale Forced Air Steam Coil 7 476
Steam Heater Butter/Oil Dept Forced Air Steam Coil 4 272
HVAC Unit Main Office 10 ton Steam 2 566
Appendix B-2 XYZ Company Facility Equipment Inventory

- 33 -
Cost & Usage Monthly ReportElectric Power (kWh)
Date Volume Cost Unit Cost
7/1/2009 333,920 $ 29,367 $ 0.088
8/1/2009 421,520 $ 42,463 $ 0.101
9/1/2009 302,240 $ 29,927 $ 0.099
10/1/2009 253,120 $ 23,499 $ 0.093
11/1/2009 252,560 $ 20,600 $ 0.082
12/1/2009 244,000 $ 28,048 $ 0.115
1/1/2010 79,040 $ 52,998 $ 0.671
2/1/2010 340,000 $ 32,297 $ 0.095
3/1/2010 271,680 $ 24,462 $ 0.09
4/1/2010 359,040 $ 37,062 $ 0.103
5/1/2010 350,960 $ 42,953 $ 0.122
6/1/2010 460,240 $ 40,296 $ 0.088
Total 3,668,320 $ 403,972 $ 0.11
* All Numbers based on invoices received. Current invoice participation level: 94%. Natural Gas (MMBtu)
Date Volume Cost Unit Cost
7/1/2009 5,460 $ 22,506 $ 4.122
8/1/2009 5,057 $ 20,640 $ 4.081
9/1/2009 3,463 $ 11,594 $ 3.348
10/1/2009 4,070 $ 18,535 $ 4.554
11/1/2009 5,018 $ 28,440 $ 5.668
12/1/2009 6,880 $ 38,923 $ 5.657
1/1/2010 7,337 $ 48,875 $ 6.661
2/1/2010 4,780 $ 30,676 $ 6.418
3/1/2010 5,107 $ 29,170 $ 5.712
4/1/2010 4,465 $ 20,429 $ 4.575
5/1/2010 4,025 $ 18,640 $ 4.631
6/1/2010 4,262 $ 19,766 $ 4.638
Total 59,923 $ 308,193 $ 5.143
* All Numbers based on invoices received. Current invoice participation level: 96%.

- 34 -
Water (MMgal)
Date Volume Cost Unit Cost
7/1/2009 4,243 6,138 1.446592034
8/1/2009 5,025 7,300 1.452825871
9/1/2009 4,628 5,905 1.275942092
10/1/2009 4,261 5,888 1.381781272
11/1/2009 4,812 6,545 1.360241064
12/1/2009 4,812 6,667 1.385573566
1/1/2010 5,890 10,543 1.789988115
2/1/2010 4,269 7,520 1.761543687
3/1/2010 4,064 7,651 1.88269439
4/1/2010 5,623 10,166 1.807883692
5/1/2010 4,325 7,618 1.76139422
6/1/2010 4,701 8,368 1.780116996
Total LP Gas
Date Volume Cost Unit Cost
7/1/2009
8/1/2009
9/1/2009
10/1/2009
11/1/2009
12/1/2009
1/1/2010
2/1/2010
3/1/2010
4/1/2010
5/1/2010
6/1/2010
Total
- 35 -
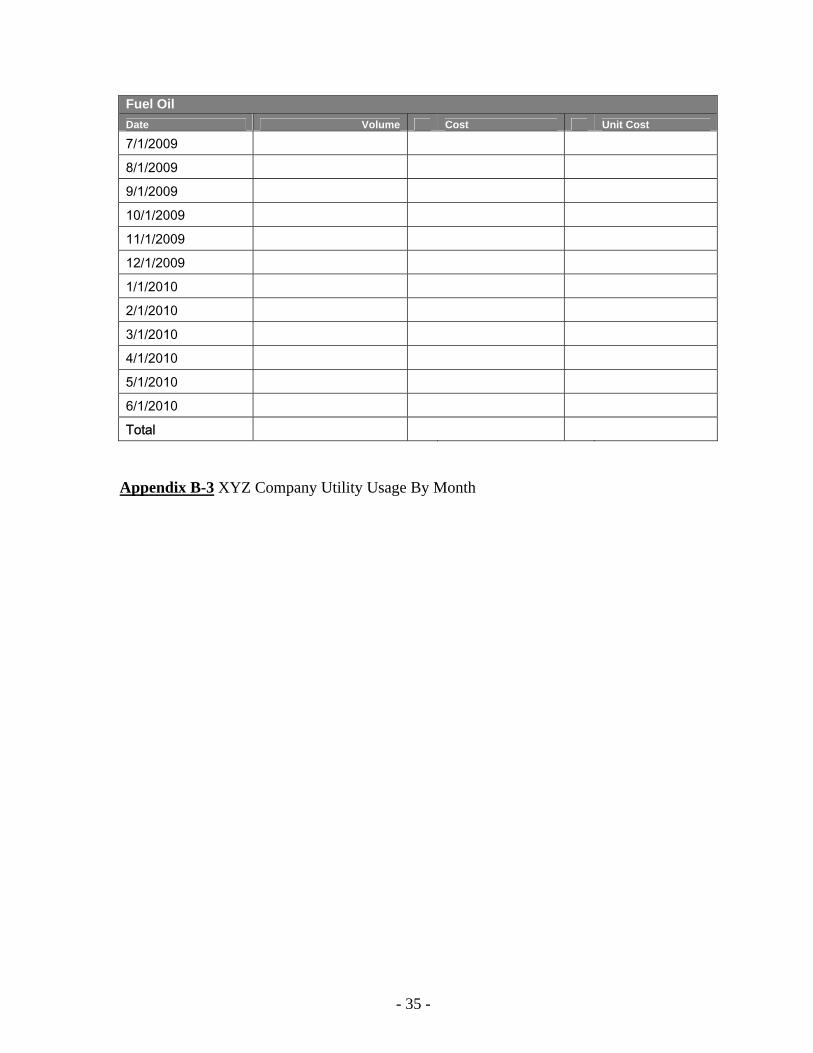
Fuel Oil
Date Volume Cost Unit Cost
7/1/2009
8/1/2009
9/1/2009
10/1/2009
11/1/2009
12/1/2009
1/1/2010
2/1/2010
3/1/2010
4/1/2010
5/1/2010
6/1/2010
Total
Appendix B-3 XYZ Company Utility Usage By Month

- 39 -