regiograph 2017regiograph.gfk.com/fileadmin/user_upload/microsites/regiograph/en/... · regiograph...
TRANSCRIPT

1 © GfK March 2, 2017 | RegioGraph 2017
RegioGraph 2017

2 © GfK March 2, 2017 | RegioGraph 2017
Award-winning geomarketing software
Spot complex regional trends and
relationships
Create presentations using customized
map layouts
Visualize company data on maps
Import all standard data formats
Display data and maps on your
preferred end device

3 © GfK March 2, 2017 | RegioGraph 2017
Drag and drop your data into a map. Highlight your customers according to factors such as turnover, assigned representative and regional affiliation.
© GfK | www.gfk.com/geomarketing | Map created with RegioGraph
Import your company data into maps
customer location by industry
industry A industry B industry C industry D industry F industry E industry F industry G industry H industry I
4 © GfK March 2, 2017 | RegioGraph 2017
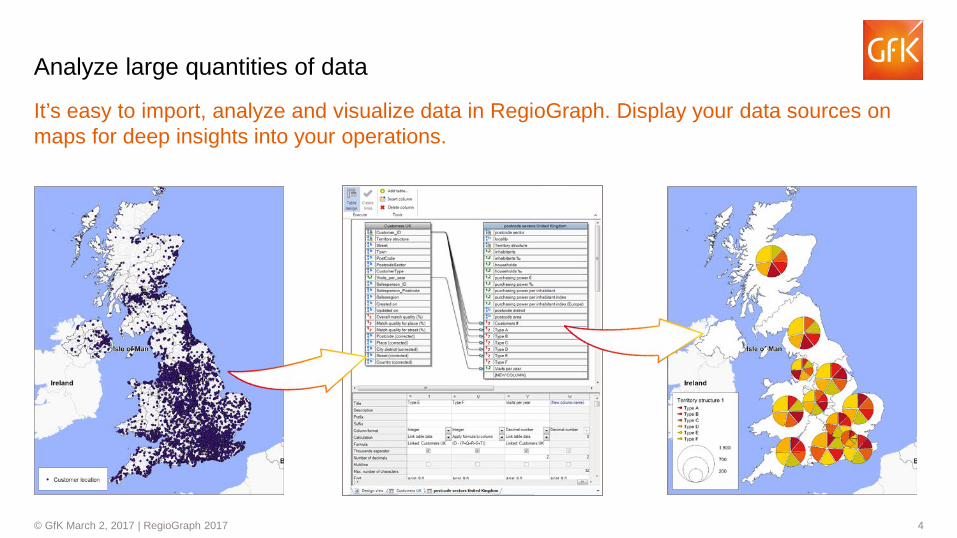
It’s easy to import, analyze and visualize data in RegioGraph. Display your data sources on maps for deep insights into your operations.
Analyze large quantities of data
5 © GfK March 2, 2017 | RegioGraph 2017
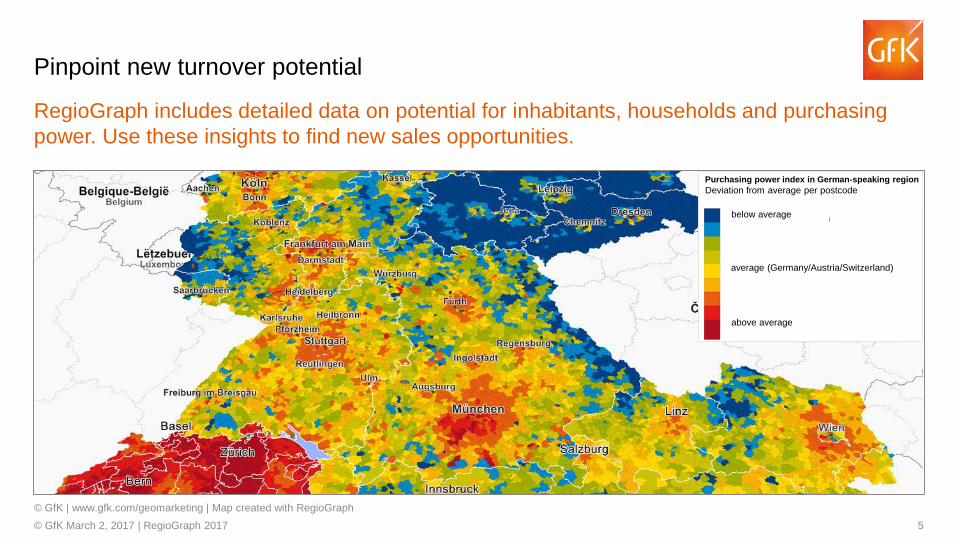
RegioGraph includes detailed data on potential for inhabitants, households and purchasing power. Use these insights to find new sales opportunities.
© GfK | www.gfk.com/geomarketing | Map created with RegioGraph
Pinpoint new turnover potential
Purchasing power index in German-speaking region Deviation from average per postcode
below average
average (Germany/Austria/Switzerland)
above average
6 © GfK March 2, 2017 | RegioGraph 2017
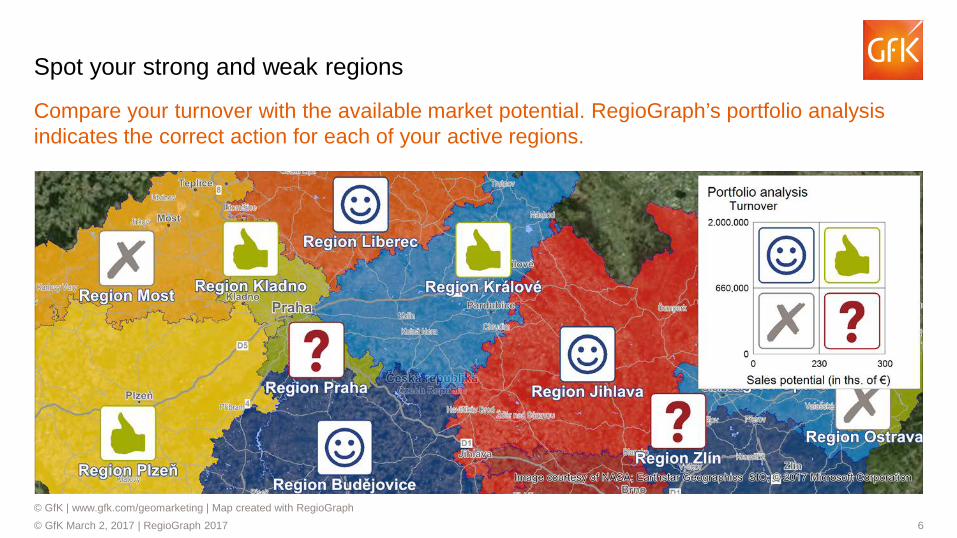
Compare your turnover with the available market potential. RegioGraph’s portfolio analysis indicates the correct action for each of your active regions.
© GfK | www.gfk.com/geomarketing | Map created with RegioGraph
Spot your strong and weak regions
7 © GfK March 2, 2017 | RegioGraph 2017
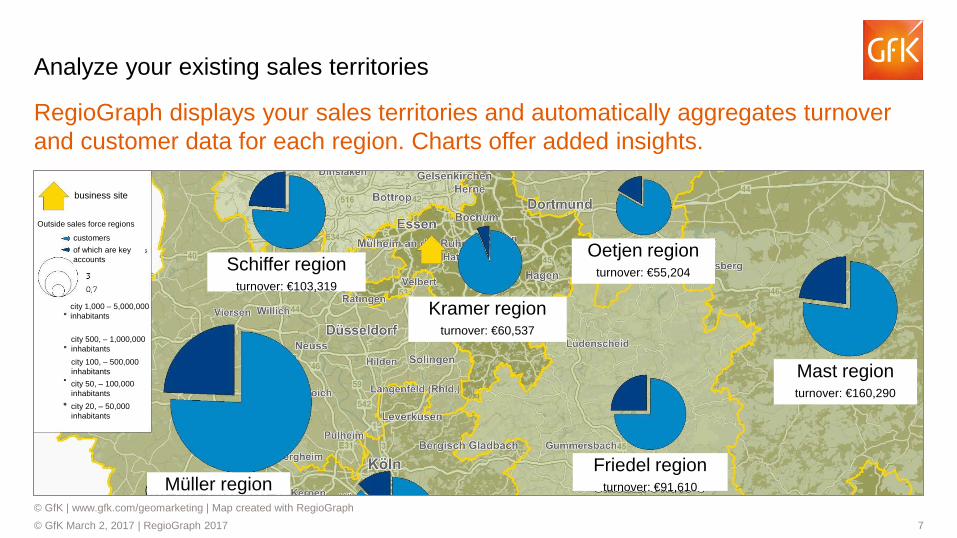
RegioGraph displays your sales territories and automatically aggregates turnover and customer data for each region. Charts offer added insights.
© GfK | www.gfk.com/geomarketing | Map created with RegioGraph
Analyze your existing sales territories
business site
Outside sales force regions
customers of which are key accounts
city 1,000 – 5,000,000 inhabitants
city 500, – 1,000,000 inhabitants city 100, – 500,000 inhabitants city 50, – 100,000 inhabitants city 20, – 50,000 inhabitants
Schiffer region turnover: €103,319
Müller region Friedel region
turnover: €91,610
Mast region turnover: €160,290
Oetjen region turnover: €55,204
Kramer region turnover: €60,537

8 © GfK March 2, 2017 | RegioGraph 2017
Optimize your sales territories
RegioGraph puts your sales territories under the microscope and allows you to optimize according to your chosen criteria, such as workload and accessibility
© GfK | www.gfk.com/geomarketing | Map created with RegioGraph
Generate new territories according to number of customers according to accessibility according to potential, etc.
Optimize territories split and merge territories according to your criteria optimize territories according to accessibility, sales
potential, etc.
Restructure territories When restructuring territories, RegioGraph automatically adjusts customer assignments and aggregated turnover values.
sales member
customer inquiries inside sales (qtr.)
custom-ers
key accounts
turnover (qtr.)
inhabitants
households purchasing
power €
9 © GfK March 2, 2017 | RegioGraph 2017
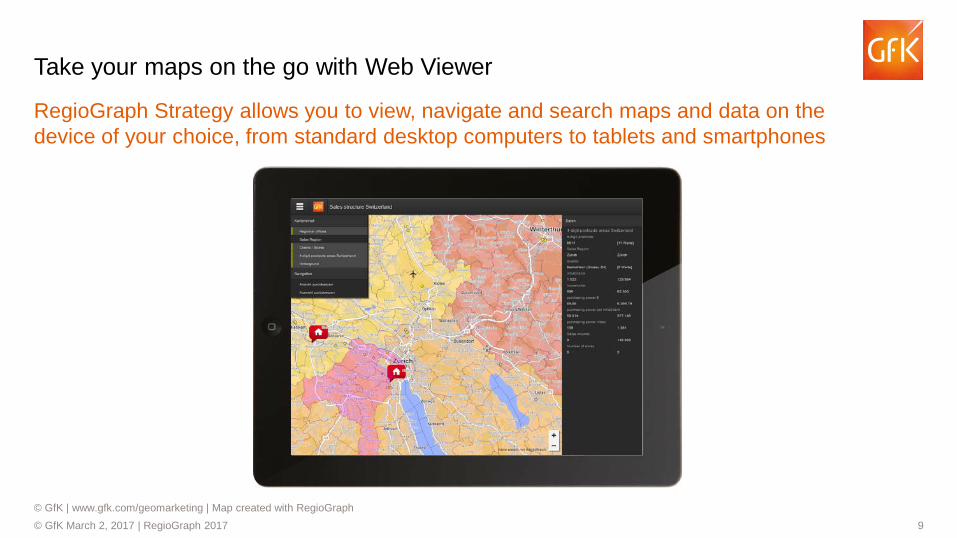
RegioGraph Strategy allows you to view, navigate and search maps and data on the device of your choice, from standard desktop computers to tablets and smartphones
© GfK | www.gfk.com/geomarketing | Map created with RegioGraph
Take your maps on the go with Web Viewer

10 © GfK March 2, 2017 | RegioGraph 2017
RegioGraph Strategy includes street segment-level GfK data on end consumers or D&B address data on business potential
© GfK | www.gfk.com/geomarketing | Map created with RegioGraph
Locate your target group
Business potential in Braunschweig
Location analysis of businesses:
electrical work painting, wallpapering, decorating
Company size (by turnover):
small company
mid-sized company
large company
Number of households
Per-capita purchasing power
below average
average
above average
11 © GfK March 2, 2017 | RegioGraph 2017
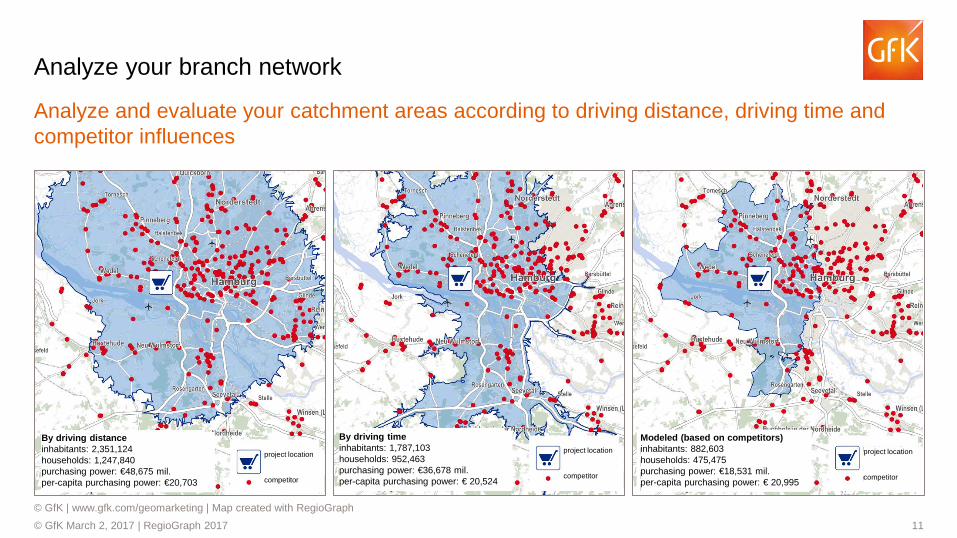
Analyze and evaluate your catchment areas according to driving distance, driving time and competitor influences
© GfK | www.gfk.com/geomarketing | Map created with RegioGraph
Analyze your branch network
By driving distance inhabitants: 2,351,124 households: 1,247,840 purchasing power: €48,675 mil. per-capita purchasing power: €20,703
project location
competitor
By driving time inhabitants: 1,787,103 households: 952,463 purchasing power: €36,678 mil. per-capita purchasing power: € 20,524
project location
competitor
Modeled (based on competitors) inhabitants: 882,603 households: 475,475 purchasing power: €18,531 mil. per-capita purchasing power: € 20,995
project location
competitor

12 © GfK March 2, 2017 | RegioGraph 2017
Create eye-catching reports in RegioGraph Strategy for individual locations or an entire branch network sunterlagen.
© GfK | www.gfk.com/geomarketing | Report created with RegioGraph
Extract concrete results and insight from your data
Create a comprehensive report for a single location or an entire branch network.
Edit the results in RegioGraph or export
them as a PDF.
Market share zones around Westerstr. 34
Potential [retail purchasing power €] by distance to Westerstr. 34
Branch network overview
Table of contents
Branch network analysis

13 © GfK March 2, 2017 | RegioGraph 2017
RegioGraph – New features
RegioGraph 2015/2016 and later RegioGraph 2017 and later:
Web Viewer
IP geocoder
New data import via drag & drop
New territory optimization option: “Generate with minimum values”
A specified minimum value (e.g., no. of customers) determines how many territories are
created.
Improved usability & performance menu ribbons, new navigation
table design view comfortable interface for linking & working with layer tables
Option to use online maps integrated Bing maps and aerial imagery
Location network optimization calculation of optimal location network
Insert grid grid layer for working with granular data
14 © GfK March 2, 2017 | RegioGraph 2017
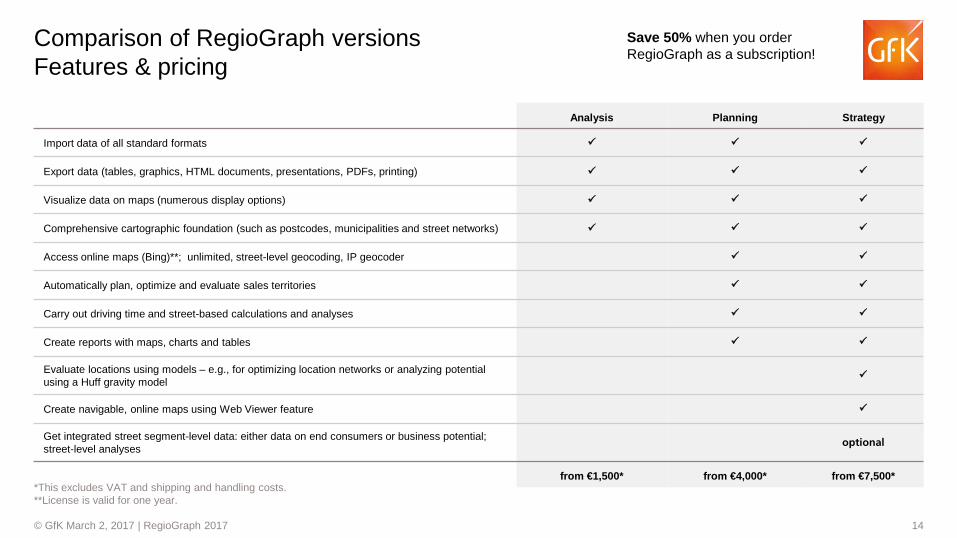
Analysis Planning Strategy
Import data of all standard formats
Export data (tables, graphics, HTML documents, presentations, PDFs, printing)
Visualize data on maps (numerous display options)
Comprehensive cartographic foundation (such as postcodes, municipalities and street networks)
Access online maps (Bing)**; unlimited, street-level geocoding, IP geocoder
Automatically plan, optimize and evaluate sales territories
Carry out driving time and street-based calculations and analyses
Create reports with maps, charts and tables
Evaluate locations using models – e.g., for optimizing location networks or analyzing potential using a Huff gravity model
Create navigable, online maps using Web Viewer feature
Get integrated street segment-level data: either data on end consumers or business potential; street-level analyses optional
from €1,500* from €4,000* from €7,500*
Comparison of RegioGraph versions Features & pricing
Save 50% when you order RegioGraph as a subscription!
*This excludes VAT and shipping and handling costs. **License is valid for one year.

15 © GfK March 2, 2017 | RegioGraph 2017
Questions?
GfK GeoMarketing GmbH | Werner-von-Siemens-Str. 9 Gebäude 6508 | 76646 Bruchsal | Germany
Contact us at T +49 7251 9295 200 or visit regiograph.gfk.com.