regional water supply security assessment - townsville · future water use well-founded secure...
TRANSCRIPT
Department of Energy and Water Supply
Regional Water Supply Security AssessmentTownsville
CS3443_Townsville 10/14
October 2014
This publication has been compiled by the Department of Energy and Water Supply.
© State of Queensland, 2014.
The Queensland Government supports and encourages the dissemination and exchange of its information. The copyright in this publication is licensed under a Creative Commons Attribution 3.0 Australia (CC BY) licence.
Under this licence you are free, without having to seek our permission, to use this publication in accordance with the licence terms.
You must keep intact the copyright notice and attribute the State of Queensland as the source of the publication.
Note: Some content in this publication may have different licence terms as indicated.
For more information on this licence, visit http://creativecommons.org/licenses/by/3.0/au/deed.en.
The information contained herein is subject to change without notice. The Queensland Government shall not be liable for technical or other errors or omissions contained herein. The reader/user accepts all risks and responsibility for losses, damages, costs and other consequences resulting directly or indirectly from using this information.

Regional Water Supply Security AssessmentTownsville

Introduction
Townsville is the largest regional centre in Queensland and, along with many other regional centres, is expected to continue to experience economic and population growth over the coming decades.
The Queensland Government Statistician’s Office (QGSO) estimates the population of Townsville will climb from approximately 190 000 in 2013 to around 300 000 by the early 2030s.
Safe, secure and reliable water supplies are an essential resource for supporting growth, not only providing for the health and wellbeing of the community, but also supporting economic development. Consequently, the Department of Energy and Water Supply (DEWS) and Townsville City Council (Council) have committed to a partnership to investigate and establish a shared understanding of the capabilities of Townsville’s existing raw water supply and its capability to provide for future growth.
Arising from the partnership and building on Council’s 2012 Integrated Water Supply Strategy (IWSS), this Regional Water Supply Security Assessment (RWSSA) provides valuable information to the community and water supply planners about the water supply security for Townsville, and provides a foundation for future
water supply planning. Development of the RWSSA is a key action arising out of WaterQ: a 30-year strategy for the Queensland water sector.
This assessment considers various growth scenarios to determine the timing and magnitude of potential water supply shortfalls under the existing water supply arrangements.
2 | Regional water supply security assessment—Townsville

Townsville’s water supply sources
Townsville has three key sources of water supply, as shown in Figure 1. To the north of Townsville, the Paluma Dam/Crystal Creek system comprises the Paluma Dam, which has a catchment area of 9.8 km2 and a storage capacity of 11 400 ML, and access to streamflows from Crystal Creek. Water from these sources is transported through the Mount Spec pipeline and treated at the Northern Water Treatment Plant (WTP). Council holds 21 571 ML/annum of entitlement from this system.
To the south of Townsville, Ross River Dam stores water before releasing it to the Douglas WTP for treatment. With a catchment area of 750 km2 and a capacity of 233 187 ML, Ross River Dam is Townsville’s primary water source. Council holds a total of 75 000 ML/annum of entitlement from this system.
During extended drought periods, if the water level in Ross River Dam is low (when there is less than 10 per cent of capacity), supplementary water supply is sourced from the Burdekin Haughton Water Supply Scheme (BHWSS) via the Haughton pipeline and pumping station. The pipeline, which currently has a capacity of 130 ML/day, discharges into the upstream end of the Ross River Dam catchment at Toonpan Creek from where water flows about 16 km through the natural system to the dam intake. Council owns 10 000 ML/annum of high priority (HP) water allocation from the BHWSS and also has an agreement with SunWater until June 2020 for access to a further 110 000 ML/annum of medium priority (MP) water allocation.
The total annual allocations available in the BHWSS are 99 998 ML of HP water allocations and 979 594 ML of MP water allocations. SunWater currently holds about 44 000 ML of uncommitted HP water allocations and about 44 000 ML of uncommitted MP water allocations from the scheme which are available for lease.
Figure 1: Townsville’s water supply systemSDRN™©2013 Pitney Bowes Software Pty Ltd.©2013 PSMA Australia Pty Ltd.

Existing water use
Townsville’s reticulation network
The Townsville reticulation network delivers water to a range of users within Council boundaries. These users can generally be grouped into three main types:
• Residential – comprising household water demand for such uses as drinking, cleaning, garden watering;
• Non-residential – water for commercial purposes such as within restaurants, parks and gardens, nurseries, offices; and
• Industrial – for users such as power stations and other major industries.
The network currently supplies approximately 186 000 people, or about 98 per cent of Townsville’s population.
Figure 2 shows Council’s total annual water extractions from Ross River Dam (including water pumped from the BHWSS into Ross River Dam) and the Paluma Dam/Crystal Creek system for the period 2006 to 2013 and annual rainfall over the same period.
The total annual volume of water extracted from all sources to supply Townsville during the period 2006 to 2013 varied between a low of 39 000 ML/annum in 2010 and a high of 58 000 ML/annum in 2013. Over the same period, per capita consumption, including consumption by heavy industry, ranged between 620 L/c/day in 2010 and 860 L/c/day in 2013.
It can be seen that water use was generally lower in wetter years due to reduced outdoor use.
In order to manage water demand during periods of low water availability, Council has a water restriction regime in place which is based on water levels in Ross River Dam. The intent of this regime is to reduce water use and thereby extend the duration of the available water supply.
In addition to supplying residential and associated non-residential uses, the Townsville reticulation network also supplies water to major industries such as SunMetals zinc refinery, Glencore copper refinery, Australian Meat Holdings meatworks and the Mount Stuart and Yabulu power stations.
60 000
50 000
02006 2007 2012
Year2011 2013
10 000
20 000
30 000
40 000
Wat
er e
xtra
ctio
n (M
L/an
num
)
2008 2009 2010
Annu
al ra
infa
ll (m
m)
0
500
1000
1500
2000
2500
4000
Total water extraction
Annual rainfall
Figure 2 Total water extracted by Townsville reticulation network and annual rainfall for Townsville 2006–2013
4 | Regional water supply security assessment—Townsville

Other users of the bulk water supply sources
The Townsville water supply system is supported by three key bulk water supply sources: Paluma Dam/Crystal Creek, Ross River Dam and the Burdekin Haughton Water Supply Scheme.
The first two of these sources were developed for the sole use of Townsville’s reticulated supply. The BHWSS however was developed within the Burdekin River Basin to support significant agricultural and industrial development in addition to population growth. Townsville is one of the many water users within that scheme. Over the last 5 years the BHWSS has supplied between 400 000 ML and 500 000 ML per year in most years, primarily to agricultural users, with the lowest volume of supply some 180 000 ML in 2010.
Urban
The communities of Ayr, Clare, Cungulla, Giru, Home Hill and Millaroo also receive their water supply either directly from the BHWSS or indirectly via groundwater recharge. The combined population of these communities is around 14 000 people (2011) with their total water usage estimated at around 4000 to 5000 ML/annum.
Moranbah, with a population of around 12 350 (2011) and average water use of about 2600 ML/annum, receives some of its water supply from the BHWSS via the Burdekin to Moranbah pipeline from Gorge Weir. The pipeline, which has a capacity of 22 600 ML/annum, is currently used to transport HP water mainly for use in the area’s coal mines.
Agriculture
There is currently no irrigated agricultural activity supplied with water from either Paluma Dam/Crystal Creek or Ross River Dam. There are however small areas of irrigated agriculture within both the Crystal Creek and Ross River catchments but these use unsupplemented water from local watercourses and or groundwater for their supply and do not impact on the water supply for Townsville.
The BHWSS, however, supports a diverse and important agricultural sector, primarily using MP water allocations. In 2010–11 around 38 per cent of the total value of Queensland’s sugarcane production, 36 per cent of the total value of mango production and 35 per cent of the total value of sweet corn production occurred in the scheme area.
Industry and mining
Extensive coal mining occurs in the Bowen Basin. Water is supplied from various sources, including in recent years the BHWSS via the Burdekin to Moranbah pipeline. However, the BHWSS is currently only meeting a small portion of the overall water demand in the Bowen Basin, with total water usage over the last 3 years being around 5000 ML/annum.
Regional water supply security assessment—Townsville | 5

Future water use
Well-founded secure water supply planning requires an understanding of the likely, and possible, changes in water demand into the future. Because Townsville accesses water from the BHWSS in addition to Council’s own Ross River Dam and Paluma Dam/Crystal Creek sources, it is important to understand how water use by the agricultural, mining, and industrial sectors and also other small communities may impact on water availability during critical dry periods.
100 000
90 000
50 0002011 2016 2021
Year2026 2031 2036
60 000
70 000
80 000
Wat
er d
eman
d (M
L/an
num
)
110 000
Low growth projectionMedium growth projection (adopted)High growth projection
Figure 3 Projected total water demand for Townsville’s reticulation network
Townsville’s reticulation network
The population currently serviced by the Townsville reticulation network is about 186 000 people. This is projected to grow to between 220 000 (low growth projection) and 240 000 people (high growth projection) by 2021 and between 280 000 and 350 000 people by 2036.
Figure 3 shows the adopted water demand projection (medium growth projection) for the Townsville reticulation network, as well as projections under high and low population growth scenarios. These demand projections have regard to, among other things, the projected population and assumed per capita consumption. The projections will remain subject to ongoing monitoring of actual population growth and variations in water use trends.
6 | Regional water supply security assessment—Townsville

The water demand projections shown in Figure 3 include the application of an assumed per capita consumption of 745 L/c/day applied to the serviced population forecasts and the addition of a constant 17 ML/day to represent the demand on the reticulation network from heavy industry.
When comparing water demand against the water supply system’s capability it is important to consider demands that reflect water use in critical dry periods (that is, low rainfall conditions leading to higher rates of use, for example additional outdoor watering). This, combined with the water extraction and rainfall information shown in Figure 2, suggests that the proposed 745 L/c/day consumption rate (exclusive of heavy industry demands) is a reasonable water demand to adopt for planning purposes.
Townsville’s role in supporting North Queensland’s mining industry is expected to continue. However, for the foreseeable future Council does not expect any significant expansion in the heavy industry sector and as such its water demand on the reticulated network is assumed to remain roughly constant at around 17 ML/day (approximately 6200 ML/annum).
Other urban communities
The population of Moranbah is projected to grow from around 12 350 at present to between 15 000 and 20 000 by 2021. However, actual growth is likely to be very dependent on the prospects of the local mining industry and, as such, this projection could change quickly.
Population growth in other urban communities supplied by the BHWSS, including Ayr and Home Hill, is projected to be minor with some communities reducing in size. As such, water demand for these communities is expected to remain largely unchanged.
Agriculture
Almost 1 000 000 ML of MP water allocations are available for use from the BHWSS, the majority of which is already associated with existing agricultural activity. Expansion of the agricultural sector is projected into the future, with a number of agricultural development projects already proposed by prospective developers in recent times. Growth in agricultural water demand is expected to be met through improvements in water use efficiency, trading of water allocations—particularly of underutilised water entitlements—and accessing uncommitted water held by SunWater.
Industry and mining
Significant expansion of the coal mining industry is projected to occur across both the Bowen and Galilee basins over the next 20 years. Some of the increase in water demand that will accompany this expansion is expected to be supplied from the BHWSS either from existing allocations owned by the mining companies, accessing uncommitted water allocations currently held by SunWater and or the development of additional water supply infrastructure if needed.
Actual water demands from the BHWSS will be dependent on the timing, location and magnitude of mining developments, the water management practices adopted by mines, and the availability of other suitable water sources.
A proposal was previously investigated supporting future economic growth in the region involving the extraction of up to 60 000 ML/annum from the BHWSS. The Water for Bowen project, which would have supplied water to the Bowen area for industry as well as agriculture, was put on hold after being found to be economically unviable at that time.
A second proposal to develop land for agricultural and industrial purposes around Pentland has also identified the Burdekin River upstream of Burdekin Falls Dam as a potential water source. Investigation of this proposal, including its viability and scale, is currently ongoing. For this assessment, future development of these proposals is considered within the limits of existing entitlements and or unallocated reserves.
Regional water supply security assessment—Townsville | 7
Water supply system capability
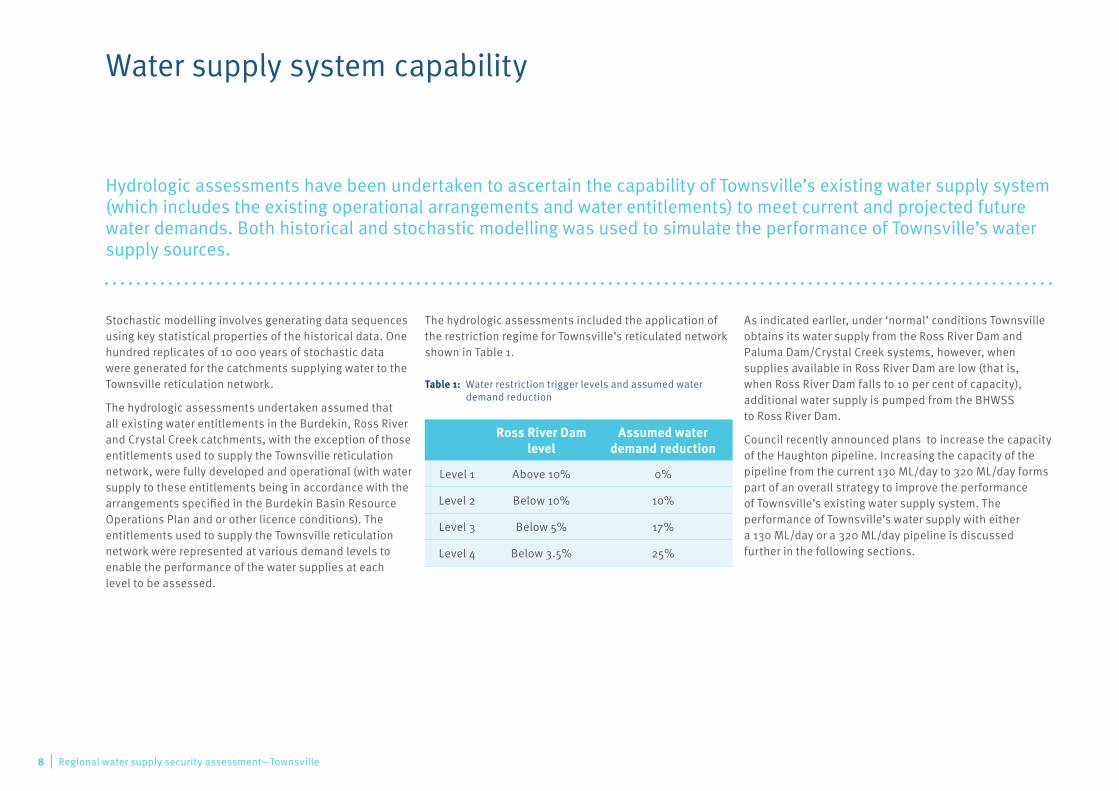
Hydrologic assessments have been undertaken to ascertain the capability of Townsville’s existing water supply system (which includes the existing operational arrangements and water entitlements) to meet current and projected future water demands. Both historical and stochastic modelling was used to simulate the performance of Townsville’s water supply sources.
Stochastic modelling involves generating data sequences using key statistical properties of the historical data. One hundred replicates of 10 000 years of stochastic data were generated for the catchments supplying water to the Townsville reticulation network.
The hydrologic assessments undertaken assumed that all existing water entitlements in the Burdekin, Ross River and Crystal Creek catchments, with the exception of those entitlements used to supply the Townsville reticulation network, were fully developed and operational (with water supply to these entitlements being in accordance with the arrangements specified in the Burdekin Basin Resource Operations Plan and or other licence conditions). The entitlements used to supply the Townsville reticulation network were represented at various demand levels to enable the performance of the water supplies at each level to be assessed.
The hydrologic assessments included the application of the restriction regime for Townsville’s reticulated network shown in Table 1.
Table 1: Water restriction trigger levels and assumed water demand reduction
Ross River Dam level
Assumed water demand reduction
Level 1 Above 10% 0%
Level 2 Below 10% 10%
Level 3 Below 5% 17%
Level 4 Below 3.5% 25%
As indicated earlier, under ‘normal’ conditions Townsville obtains its water supply from the Ross River Dam and Paluma Dam/Crystal Creek systems, however, when supplies available in Ross River Dam are low (that is, when Ross River Dam falls to 10 per cent of capacity), additional water supply is pumped from the BHWSS to Ross River Dam.
Council recently announced plans to increase the capacity of the Haughton pipeline. Increasing the capacity of the pipeline from the current 130 ML/day to 320 ML/day forms part of an overall strategy to improve the performance of Townsville’s existing water supply system. The performance of Townsville’s water supply with either a 130 ML/day or a 320 ML/day pipeline is discussed further in the following sections.
8 | Regional water supply security assessment—Townsville

Regional water supply security assessment—Townsville | 9

Historical performance of Burdekin Falls and Ross River dams
Figure 4 shows simulated storage behaviour for Burdekin Falls and Ross River dams over the period from 1890 to 2004, whilst Figure 5 shows their recorded storage behaviour from 1986, the construction of Burdekin Falls Dam, until 2010. The modelling undertaken to generate the simulated storage behaviour shown in Figure 4 utilised a water demand from Townsville of 60 000 ML/annum, which is currently anticipated to occur by 2016.
As can be seen, the behaviour of both the Burdekin Falls and Ross River dams is dynamic, with significant inflows in both catchments enabling the regular filling of the storages. In a number of periods of extended low flows both storages fall to relatively low levels. These periods of low storage volumes have some correlation, that is, there are a number of occasions that the storage levels in both Ross River Dam and Burdekin Falls Dam are low at the same time, for example, the period 1993 to 1997.
It should be noted that the Burdekin Falls Dam actually fell to about 40 per cent of its capacity in 1993, despite water use in the BHWSS during the early 1990s being much lower than typical water use since that time. The modelling indicated that if Townsville’s water demand had been 60 000 ML/annum at that time, and all other entitlements had also been fully developed and operational, the Burdekin Falls Dam storage may have fallen to about 12 per cent of its capacity.
Figure 4: Simulated historical storage behaviour of the Burdekin Falls and Ross River dams 1890 to 2004 with a 130 ML/day capacity pipeline from the Burdekin Haughton Water Supply Scheme and 60 000 ML/annum demand
1946
1890
1898
Year
1906
1914
1922
1930
1938
1954
1962
1970
1978
1986
1994
2002
0
20
40
60
80
100
120
1400
20
40
60
80
100
120
140
Perc
enta
ge o
f Ful
l Sup
ply
Volu
me
(FSV
)
Burdekin Falls Dam
Ross River Dam
10 | Regional water supply security assessment—Townsville
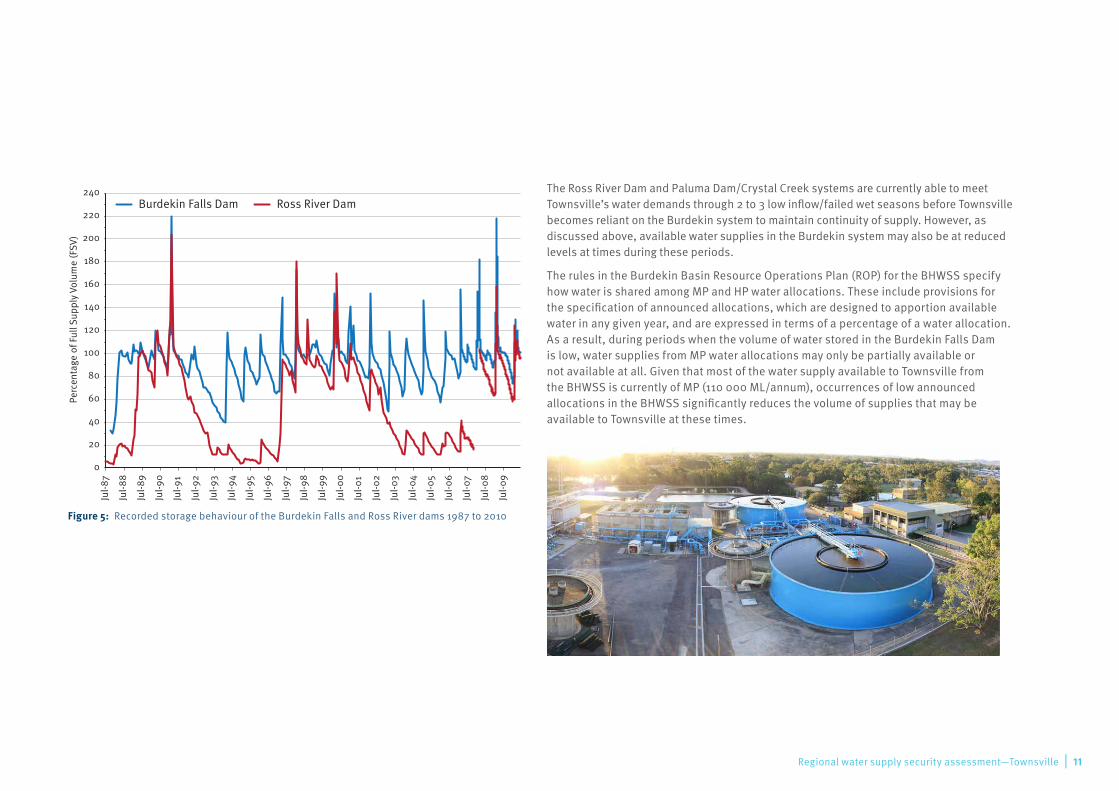
The Ross River Dam and Paluma Dam/Crystal Creek systems are currently able to meet Townsville’s water demands through 2 to 3 low inflow/failed wet seasons before Townsville becomes reliant on the Burdekin system to maintain continuity of supply. However, as discussed above, available water supplies in the Burdekin system may also be at reduced levels at times during these periods.
The rules in the Burdekin Basin Resource Operations Plan (ROP) for the BHWSS specify how water is shared among MP and HP water allocations. These include provisions for the specification of announced allocations, which are designed to apportion available water in any given year, and are expressed in terms of a percentage of a water allocation. As a result, during periods when the volume of water stored in the Burdekin Falls Dam is low, water supplies from MP water allocations may only be partially available or not available at all. Given that most of the water supply available to Townsville from the BHWSS is currently of MP (110 000 ML/annum), occurrences of low announced allocations in the BHWSS significantly reduces the volume of supplies that may be available to Townsville at these times.
Figure 5: Recorded storage behaviour of the Burdekin Falls and Ross River dams 1987 to 2010
0
20
40
60
80
100
120
140
160
180
200
220
240
Jul-8
7
Jul-8
8
Jul-8
9
Jul-9
0
Jul-9
1
Jul-9
2
Jul-9
3
Jul-9
4
Jul-9
5
Jul-9
6
Jul-9
7
Jul-9
8
Jul-9
9
Jul-0
0
Jul-0
1
Jul-0
2
Jul-0
3
Jul-0
4
Jul-0
5
Jul-0
6
Jul-0
7
Jul-0
8
Jul-0
9
Burdekin Falls Dam Ross River Dam
Perc
enta
ge o
f Ful
l Sup
ply
Volu
me
(FSV
)
Regional water supply security assessment—Townsville | 11

Frequency of water restrictions for Townsville
Figure 6 shows the frequency at which the water restrictions described in Table 1 might be triggered with the existing 130 ML/day capacity Haughton pipeline and with a 320 ML/day capacity pipeline.
Figure 6: Frequency of water restrictions
1000
10 000
130 000 50 000 70 000 90 000 110 000 120 00040 000 60 000 80 000 100 000
10
100
Aver
age
recu
rren
ce in
terv
al o
f res
tric
tion
trig
gere
d(1
in X
yea
rs)
Townsville’s water demand (ML/annum)
320 pipe Level 2 Water Restriction320 pipe Level 3 Water Restriction320 pipe Level 4 Water Restriction
130 pipe Level 2 Water Restriction130 pipe Level 3 Water Restriction130 pipe Level 4 Water Restriction
130 ML/day capacity Haughton pipeline
At a demand of 60 000 ML/annum (2016), the trigger for sourcing water from the BHWSS and imposing level 2 water restrictions (i.e. when Ross River Dam falls to less than 10 per cent of its capacity) is anticipated to occur about once in 9 years on average. For this demand it is also estimated that level 3 water restrictions would occur at a frequency of about once in 90 years on average, whilst level 4 water restrictions are estimated to occur at a frequency of about once in 160 years on average.
However, as Townsville’s water demand increases, the frequency at which trigger levels are reached will also increase – for example, when Townsville’s demand increases to about 75 000 ML/annum (currently projected to occur by about 2025), it will be necessary to pump water from the BHWSS more frequently, estimated at about once in 5 years on average. For this demand, level 2 water restrictions are estimated to occur once in 5 years on average and level 4 water restrictions about once in 35 years on average.
320 ML/day capacity Haughton pipeline
Increasing the capacity of the Haughton pipeline to 320 ML/day will reduce the frequency that the various levels of water restrictions might occur under Council’s existing water restriction regime.
At a demand of 60 000 ML/annum level 2 restrictions occur at a frequency of about once in 20 years on average and level 4 restrictions occur about once in 270 years on average.
When Townsville’s water demand reaches 75 000 ML/annum, level 2 restrictions might occur at a frequency of about once in 9 years on average and level 4 water restrictions at a frequency of about once in 110 years on average.
12 | Regional water supply security assessment—Townsville
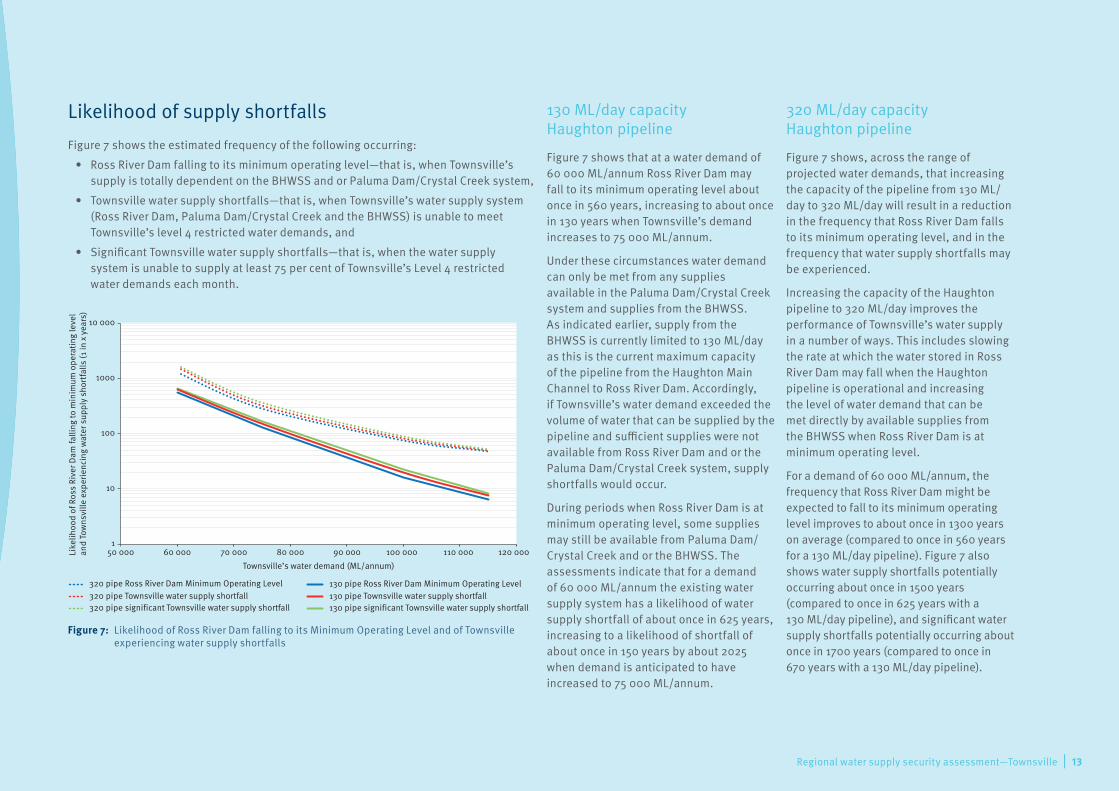
Likelihood of supply shortfalls
Figure 7 shows the estimated frequency of the following occurring:
• Ross River Dam falling to its minimum operating level—that is, when Townsville’s supply is totally dependent on the BHWSS and or Paluma Dam/Crystal Creek system,
• Townsville water supply shortfalls—that is, when Townsville’s water supply system (Ross River Dam, Paluma Dam/Crystal Creek and the BHWSS) is unable to meet Townsville’s level 4 restricted water demands, and
• Significant Townsville water supply shortfalls—that is, when the water supply system is unable to supply at least 75 per cent of Townsville’s Level 4 restricted water demands each month.
Figure 7: Likelihood of Ross River Dam falling to its Minimum Operating Level and of Townsville experiencing water supply shortfalls
1000
10 000
1
10
100
Like
lihoo
d of
Ros
s Ri
ver D
am fa
lling
to m
inim
um o
pera
ting
leve
l an
d To
wns
ville
exp
erie
ncin
g w
ater
sup
ply
shor
tfalls
(1 in
x y
ears
)
Townsville’s water demand (ML/annum)
320 pipe Ross River Dam Minimum Operating Level320 pipe Townsville water supply shortfall320 pipe significant Townsville water supply shortfall
130 pipe Ross River Dam Minimum Operating Level130 pipe Townsville water supply shortfall130 pipe significant Townsville water supply shortfall
50 000 60 000 70 000 80 000 90 000 100 000 110 000 120 000
130 ML/day capacity Haughton pipeline
Figure 7 shows that at a water demand of 60 000 ML/annum Ross River Dam may fall to its minimum operating level about once in 560 years, increasing to about once in 130 years when Townsville’s demand increases to 75 000 ML/annum.
Under these circumstances water demand can only be met from any supplies available in the Paluma Dam/Crystal Creek system and supplies from the BHWSS. As indicated earlier, supply from the BHWSS is currently limited to 130 ML/day as this is the current maximum capacity of the pipeline from the Haughton Main Channel to Ross River Dam. Accordingly, if Townsville’s water demand exceeded the volume of water that can be supplied by the pipeline and sufficient supplies were not available from Ross River Dam and or the Paluma Dam/Crystal Creek system, supply shortfalls would occur.
During periods when Ross River Dam is at minimum operating level, some supplies may still be available from Paluma Dam/Crystal Creek and or the BHWSS. The assessments indicate that for a demand of 60 000 ML/annum the existing water supply system has a likelihood of water supply shortfall of about once in 625 years, increasing to a likelihood of shortfall of about once in 150 years by about 2025 when demand is anticipated to have increased to 75 000 ML/annum.
320 ML/day capacity Haughton pipeline
Figure 7 shows, across the range of projected water demands, that increasing the capacity of the pipeline from 130 ML/day to 320 ML/day will result in a reduction in the frequency that Ross River Dam falls to its minimum operating level, and in the frequency that water supply shortfalls may be experienced.
Increasing the capacity of the Haughton pipeline to 320 ML/day improves the performance of Townsville’s water supply in a number of ways. This includes slowing the rate at which the water stored in Ross River Dam may fall when the Haughton pipeline is operational and increasing the level of water demand that can be met directly by available supplies from the BHWSS when Ross River Dam is at minimum operating level.
For a demand of 60 000 ML/annum, the frequency that Ross River Dam might be expected to fall to its minimum operating level improves to about once in 1300 years on average (compared to once in 560 years for a 130 ML/day pipeline). Figure 7 also shows water supply shortfalls potentially occurring about once in 1500 years (compared to once in 625 years with a 130 ML/day pipeline), and significant water supply shortfalls potentially occurring about once in 1700 years (compared to once in 670 years with a 130 ML/day pipeline).
Regional water supply security assessment—Townsville | 13
Industry and other HP entitlement
As indicated previously, the only use of water from the Ross River Dam and Paluma Dam/Crystal Creek systems is supply through Townsville’s reticulation network. Industrial use of some 17 ML/day is currently provided and this level of demand is projected to continue over the short to medium-term.
Increased water demands by the mining and industry sectors from the BHWSS are expected to be met from existing unused entitlements held by mining companies, uncommitted water held by SunWater, water trading, and development of local supplies.
This is not expected to impact on the performance of Townsville’s existing supply system, however, it may reduce the opportunities for Townsville to acquire future additional HP water allocations.
Agriculture
Overall, although agricultural water use of medium priority allocations from the BHWSS is already large and further expansion is projected in the future, improvements in water use efficiency and the large volume of currently unused water that is available indicates that growth can be met by existing water entitlements.
This is not expected to impact on the performance of Townsville’s existing supply system, however, may reduce the opportunities for Townsville to acquire future additional MP water allocations.
14 | Regional water supply security assessment—Townsville

Moving Forward
The RWSSA represents a collaborative approach between DEWS and Council to establish a shared understanding of the existing security of Townsville’s water supply and its capacity to support future growth.
On the 23 October 2012 Council adopted an Integrated Water Supply Strategy for Townsville. This Strategy identified a number of actions, including the following of particular relevance to this RWSSA:
a. Discussions with Department of Energy and Water Supply with regards to the securing of additional High Priority allocation, which is expected to be exceeded by 2020.
b. Discussions with Department of Energy and Water Supply to ensure they address the long term security of the Burdekin Dam system, which may include the need for stage 2 construction of the Burdekin Falls Dam.
This RWSSA is a first step towards addressing the above actions. This report generally shows that the current water consumption level of Townsville has reached a point where the level of water supply security is reducing over the next 12–15 years from a current 1 in 900 years likelihood of the existing system failing to be able to meet demand, to a less acceptable more frequent likelihood of failure of around 1 in 100 years. Whilst additional improvements to water supply security aren’t required immediately, Council will continue to work collaboratively with relevant Queensland Government agencies to address these issues with the following work proposed to be undertaken in the short term:
1. Determine what is an appropriate level of service for water supply security for Townsville. An acceptable level of likelihood of supply failure will vary for each community. In Townsville’s case it only takes 2–3 failed wet seasons before the city is totally reliant on the Burdekin system. Therefore a higher level of security may be appropriate for Townsville as compared to a city which has a water source that takes 5–10 years to empty due to failed wet seasons. Townsville may not have sufficient time to develop adequate solutions during a drought event.
2. Undertake further water supply security planning to identify what measures are required to ensure adequate water supply security from the Burdekin system, or alternatively consider other water supply options and solutions.
3. Commence the detailed design of the second Haughton pipeline and pumping station from the Haughton Main Channel to Ross River Dam.
4. Investigate opportunities associated with water demand management.
Regional water supply security assessment—Townsville | 15

For more information on the Regional water supply security assessment
please visit www.dews.qld.gov.au