research and scientific development in oic countries · the share of women in total researchers is...
TRANSCRIPT

RESEARCH AND SCIENTIFIC DEVELOPMENT IN OIC COUNTRIES
EXECUTIVE SUMMARY
Research in science and technology is of great importance and key to progress towards a knowledge-based,
or an innovation-driven economy. It promotes better understanding on different aspects of life and helps
to improve the standard of living by creating new knowledge and technological innovation. Today, there
is severe competition among countries to become the most competitive and knowledge-based economy in
the world. Gaining a competitive advantage against other countries, which is of particular importance to
the OIC member countries in catching-up within this competitive world of knowledge economy, depends
on how well they perform in research activities.
This report presents an overview of the current developments in the OIC member countries in the field of
research and development (R&D) and science & technology (S&T). In particular, the following economic
indicators of research and scientific development are examined: Human Resources in R&D, R&D
Expenditures, High Technology Exports, Scientific Publications, and Patent Applications. The current
status of the OIC member countries compared to the rest of the world in terms of research and scientific
development is analyzed using the knowledge and technology indices of the World Bank.
The report concludes with some broad policy recommendations. Most importantly, R&D should be
stimulated through government and private sector initiatives and coordination among OIC countries.
Networking opportunities among the OIC member countries need to be facilitated through programmes
such as the Framework Programmes of the European Union, to support research and technological
development in the Islamic world and to promote joint research initiatives among the member countries.
Additionally, joint research and investment on nanotechnology among the OIC member countries
should be initiated as the pioneers of this new technology will benefit enormously from their early
investment in this area. Higher education and academic research need to be supported through more
government funds. There is also a dire need for promoting and enhancing patent development,
particularly in small and medium-sized enterprises. Last but not least, infrastructure for internet and
other information and communication technologies should be improved to disseminate knowledge and to
take advantage of the young population in OIC member countries.
ORGANISATION OF THE ISLAMIC CONFERENCE
STATISTICAL, ECONOMIC AND SOCIAL RESEARCH AND TRAINING CENTRE FOR ISLAMIC COUNTRIES

1
HUMAN RESOURCES IN RESEARCH & DEVELOPMENT
The availability of abundant and highly qualified researchers is an essential condition to foster innovation and promote the scientific and technological development of a country. However, figures indicate that OIC member countries, on average, fall well behind the world average in terms of researchers per million people: 649 vs. 2,532, respectively.1 The gap is much larger when compared to the EU that has an average of 6,494 researchers per million people and some other developed countries like New Zealand, Japan, and Republic of Korea (see Figure 1).
Figure 1: Researchers per Million People*
Source: UNESCO Institute for Statistics, Data Centre. * Headcount data for the most recent year available.
Figure 1 illustrates the OIC map of distribution of researchers employed in R&D and reveals the following observations:
Only seven of the 29 member countries with available data have more than 1,000 researchers per million people, two of which –Jordan and Tunisia– are above the world average.
Seven member countries have less than 100 researchers per million people, most of which are in Sub-Saharan Africa.
Large disparity exists among the member countries; Jordan has 8,060 researchers per million inhabitants while Niger has merely 53.
WOMEN IN RESEARCH ACTIVITIES
In the last decades, women, with better access to training and education facilities, thanks to the rising awareness on gender in/equality, have become more qualified and motivated to participate in the labour force. Nevertheless, the progress achieved so far in the field of R&D seems unsatisfactory neither globally nor at the OIC level. Women, in the OIC, represent around 26.8% of the total researchers, slightly lower than the world average of 29.5%.2 The gap is larger when compared to the EU and some developed countries like New Zealand and Norway but still the OIC average is higher than that of some other developed countries such as Republic of Korea and Japan (see Figure 2).
1 Figures are the weighted averages for the countries with available data. 2 Aggregate calculations are based on countries with available headcount data –for the most recent year available.
0 2,000 4,000 6,000 8,000 10,000 12,000

2
EU; 34.4
World; 29.5
OIC; 26.8
New Zealand; 43.3
Norw
ay; 37.0
Rep. of Korea; 20.5
Japan; 18.2
Kazakhstan; 53.1
Azerbaijan; 51.1
Kyrgyz Rep.; 47.2
Turkey; 33.9
Tunisia; 42.8
Algeria; 33.9
Kuwait; 33.4
Morocco; 26.2
Iran; 23.9
Saudi A
rabia; 19.5
Jordan; 17.9
Malaysia; 37.1
Indonesia; 29.2
Pakistan; 14.6
Bangladesh; 8.2
Sudan; 40.0
Uganda; 36.9
Gabon; 28.0
Nigeria; 24.4
Burkina Faso; 22.0
Guinea; 17.8
Senegal; 15.6
Mali; 11.8
Gam
bia; 4.8
0
10
20
30
40
50
60
Europe & Central Asia
Middle East & North Africa
Sub‐SaharanAfricaEast Asia & Pacific
South Asia
Figure 2: Women as a Share of Total Researchers (%)* Source: UNESCO Institute for Statistics, Data Centre. * Headcount data for the most recent year available.
With respect to the data demonstrated in Figure 2, the following observations can be drawn:
The share of women in total researchers is above the world average in 10 of the 24 OIC member countries with available data. Seven of them outperform the EU average as well.
According to regional averages, OIC members in Europe & Central Asia and East Asia & Pacific report higher rates of women researchers, often above the world average.
Members in the Middle East, on average, report lower rates of women researchers than those in North Africa. The share of women researchers range from 42.8% in Tunisia to 17.9% in Jordan.
Intra-regional difference is even higher in Sub-Saharan Africa: On one hand, there are countries like Sudan and Uganda where women represent more than 35% of researchers while, on the other hand, there also are countries where women’s share is less than 10% as in the case of Gambia.
Kazakhstan and Azerbaijan are the only member countries that have more women researchers than men. Kyrgyz Republic, Tunisia, and Sudan –all with over 40% women researchers– are also close to achieving gender parity.
EXPENDITURES ON RESEARCH & DEVELOPMENT
R&D INTENSITY
Today, around 80% of the global R&D expenditures is spent by developed countries, of which 33.5% by the USA, 23.5% by the EU, and 13.4% by Japan (Figure 3). The OIC countries account for only 1.8% of the world total Gross Domestic Expenditures on R&D (GERD), or 9.5% of the total GERD of developing countries. Nevertheless, what is more important than the volume of GERD is its weight in the total expenditures or, in other words, in GDP. Accordingly, R&D intensity (GERD as a percentage of GDP) is a widely used indicator of S&T activities. It reflects the innovative capacity of a country in that a higher R&D intensity indicates that relatively more resources are devoted to the development of new products or production processes.
Figure 3: GERD, % of World Total Source: UNESCO Institute for Statistics, Data Centre.
USA33.5%
EU23.5%Japan
13.4%
OIC1.8%
Other Developing
17.6%
Other Developed10.1%

3
In this connection, the OIC Ten-Year Programme of Action to Meet the Challenges Facing the Muslim Ummah in the 21st Century, which was adopted at the Third Extraordinary Session of the Islamic Summit Conference held in Makkah al Mukarramah, Kingdom of Saudi Arabia, in December 2005, calls upon Islamic countries “to encourage research and development programmes, taking into account that the global percentage of this activity is 2% of the Gross Domestic Product (GDP), and request Member States to ensure that their individual contribution is not inferior to half of this percentage” (OIC-TYPOA, 1995, Part 2, Section V, Article 4). Nevertheless, available data show that OIC member countries’ spending on R&D activities is significantly lower than the world average and still far away from the implied target of 1% of GDP by 2015 (Figure 4).
World; 1.78
EU; 1.76
OIC; 0.41
Japan; 3.44
Rep. of Korea; 3.23
New Zealand; 1.22
Tunisia; 1.02
Turkey; 0.74
Pakistan; 0.68
Iran; 0.68
Malaysia; 0.63
Morocco; 0.63
Mozambique; 0.49
Uganda; 0.36
Jordan; 0.33
Sudan; 0.29
Kyrgyz Rep.; 0.25
Egypt; 0.23
Kazakhstan; 0.21
Azerbaijan; 0.18
Burkina Faso; 0.11
Kuwait; 0.10
Senegal; 0.09
Algeria; 0.08
Tajikistan; 0.06
Indonesia; 0.05
Saudi A
rabia; 0.05
Brunei ; 0.04
0.0
0.5
1.0
1.5
2.0
2.5
3.0
3.5
Figure 4: R&D Intensity (%)*
Source: UNESCO Institute for Statistics, Data Centre. * Data for the most recent year available between 2003 and 2007.
Regarding the R&D intensity in the OIC member countries, the situation can be summarized as below:
Among the member countries with available data, Tunisia, the only country to have met the target so far, reports the highest level of R&D intensity (1.02%), followed by Turkey (0.74%) and Pakistan (0.68%), while the lowest spending level is recorded for Brunei (0.04%).
Most of the member countries spend less than 0.5% of GDP on R&D. R&D intensity for the OIC member countries averages 0.41%, which is quite lower than the EU
average of 1.76% and the world average of 1.78% as well as the targeted rate of 1%. Among the few Sub-Saharan members that can provide data, Mozambique, with 0.49% R&D
intensity, is the only country to spend above the OIC average. Considering the figures in some other developed countries like Japan (3.44%) and Republic of
Korea (3.23%), both of which owe their economic development largely to investments in advanced technology, OIC member countries need to allocate much more resources to R&D activities to bridge the gap with developed countries.

4
OIC
Algeria
Azerbaijan
BruneiBurkina Faso
Egypt
Indonesia
Iran
Jordan
Kazakhstan
Kuwait
Kyrgyz Rep.
MalaysiaMorocco
Mozambique
Pakistan
Saudi Arabia
Senegal
Sudan
Tajikistan
Tunisia
Turkey
Uganda
0.0
0.2
0.4
0.6
0.8
1.0
1.2
0.0 0.1 0.2 0.3 0.4 0.5 0.6
GERD as % of GDP, 2007
or latest available year
GERD as % of GDP, 1998 or earliest available year
Figure 5: Trends in R&D Intensity Source: GERD Data: UNESCO Institute for Statistics, Data Centre; GDP data; IMF, World Economic Outlook Database, October 2009.
Figure 5 illustrates the change in R&D intensity between 1998 and 2007 for the OIC member countries for which data are available. Accordingly;
In most of the member countries, R&D intensity remained relatively stable. Tunisia, Turkey, Pakistan, Morocco, and Malaysia managed to significantly increase their R&D
intensity. It was more than doubled in Tunisia and Morocco while the increase in Pakistan was over 6-fold. Accordingly, although Iran, Sudan, and Mozambique had the highest R&D intensity rates in 1998, Tunisia and Turkey outperformed them while Pakistan caught up with Iran by 2007.
Algeria, Azerbaijan, Sudan, and Kuwait reported a significant decrease in their R&D intensity. The average for the OIC countries increased by only 0.14 percentage point in that decade.
Although it is higher than that for the EU members (0.09 percentage point), which already have high R&D intensity, it is still lower than that for the world (0.16 percentage point). The OIC countries cannot reach the world average R&D intensity with such a low rate of improvement in their R&D expenditures.
R&D EXPENDITURES PER CAPITA
“R&D expenditures per capita” is a frequently used indicator to make comparisons among countries in terms of the level of spending on R&D. Accordingly, the following observations can be drawn for OIC countries from Figure 6, which presents data for the change in this indicator in the last decade.
Of the OIC countries with available data, Turkey has the highest R&D expenditures per capita ($95.2), followed by Malaysia ($79.0), Iran ($66.7), and Tunisia ($65.9).
The lowest rates are recorded for Tajikistan, Burkina Faso, Senegal, and Indonesia, all with less than $2 of R&D expenditures per capita.
The average for all OIC countries with available data is calculated as $23.3, which is well below the world average of $194 and the EU average of $524. In Japan, this figure reaches up to $1,155, higher than GDP per capita values of ten OIC countries.
In a decade, from 1998 to 2007, R&D expenditures per capita increased by an average of only $13 for OIC countries, compared to $81 for the world and $193 for the EU, which could be considered as another source and indicator of divergence between OIC countries and the rest of the world with respect to scientific development.
In the same period, Turkey, Tunisia, and Malaysia were the top three countries to have most increased their GERD per capita, $61.5, $47.4, and $46.9, respectively.

5
Seven of the 23 OIC countries with available data reported decline in their GERD per capita. Kuwait, which once had the highest value of $73.8, experienced the sharpest decline in this period so that its GERD per capita fell down to $37.2.
33.7
32.1 39
.3
18.5
73.8
7.3 10
.4
9.0
7.3
1.7
7.7
7.0 11
.8
11.9
6.5
2.5
12.8
2.9
2.8
1.6
1.4
1.3
0.9
95.2
79.0
66.7
65.9
37.2
24.9
23.3
22.8
17.6
17.4
13.4
12.6
11.5
11.2
5.1
5.0
4.8
3.9
2.8
1.6
1.4
1.3
1.2
0
10
20
30
40
50
60
70
80
90
100
1998 or ealiest year available
2007 or latest year available
113
331
721
201 320
194
524
1,155
327
860
0
200
400
600
800
1000
1200
World EU Japan New Zealand
Rep. of Korea
Figure 6: R&D Expenditures per Capita (PPP $)
Source: GERD Data: UNESCO Institute for Statistics, Data Centre; Population data: IMF, World Economic Outlook Database, October 2009.
R&D EXPENDITURES BY SECTOR
Given that GERD is the sum of R&D expenditures of the performing sectors, it is useful to disaggregate it into individual sectors to see how much R&D each sector performs. This sectoral disaggregation is based on the United Nations classification that defines four major sectors of performance: Government, Business Enterprise, Higher Education, and Private Non-Profit. In this respect, Figure 7 presents the distribution of GERD among these sectors in the OIC member countries for which data are available. The figures are based on total available resources, regardless of their source of funds.
As illustrated in Figure 7, sectoral distribution of GERD can be summarized as below:
In most of the OIC member countries (10 out of 17 with available data), more than 50% of GERD is spent by government sector. This share reaches up to 100% in Kuwait and over 90% in Indonesia, Tajikistan, and Brunei Darussalam.
Despite having a share of less than 50%, government sector in Tunisia and Sudan is the dominant sector, spending more on R&D than the other sectors do.
The share of Business Enterprise in GERD is highest in Malaysia with 84.9%. Moreover, in Kazakhstan, Turkey, and Sudan, Business Enterprise accounts for more than one third of the GERD.
GERD of Business Enterprise is not available or at negligible levels in Kuwait, Tajikistan, Brunei Darussalam, Pakistan, Burkina Faso and Senegal.
Higher Education is the leading sector in Senegal, Morocco, and Turkey, accounting respectively for 66.7%, 52.4%, and 48.2% of the total GERD. Furthermore, more than one quarter of the GERD in Pakistan, Iran, Tunisia, and Sudan is also performed by this sector.
The share of R&D expenditures by the Private Non-Profit sector is at a negligible level in all of the member countries except in Uganda (25.0%) and Burkina Faso (21.1%).

6
0
10
20
30
40
50
60
70
80
90
100
Not specified
Private non‐profit
Higher education
Business enterprise
Government
Figure 7: Distribution of GERD by Sector of Performance (%)*
Source: UNESCO Institute for Statistics, Data Centre. * Data for the most recent year available.
R&D EXPENDITURES BY SOURCE OF FUNDS
Figure 8 presents information on the funding sources of R&D in OIC member countries. Source distribution of the GERD has been made again on a sectoral basis as specified above, yet including additionally the funds from abroad.
0
10
20
30
40
50
60
70
80
90
100
Not specified
Abroad
Private non‐profit
Higher education
Business enterprise
Government
Figure 8: Distribution of GERD by Source of Funds (%)*
Source: UNESCO Institute for Statistics, Data Centre. * Data for the most recent year available.
Accordingly, given the data illustrated in Figure 8, the situation in OIC member countries can be summarized by the following observations:

7
In most of the OIC member countries, R&D is mainly financed by the government sector. Out of the 17 member countries for which data are available, 11 countries receive more than %50 of R&D funds from the government.
GERD in Senegal is completely funded by government sector. In Kuwait, Tajikistan, and Brunei Darussalam, the share of government funding is over 90%.
Despite having a share of less than 50%, government sector in Tunisia is the dominant sector, providing more R&D funds than the other sectors. Government’s role in Turkey is also at a significant level since it provides almost half of the funds (47.1%), slightly lower than those provided by business sector.
In Malaysia, government’s share in R&D funding is as low as 5%, which is the lowest rate among all OIC countries with available data.
Business Enterprise in Malaysia accounts for 84.7% of the total R&D funds. In Turkey and Kazakhstan, the business sector is also dominant, providing respectively 48.4% and 44.5% of the total R&D funds.
Higher Education sector in Tunisia provides 30.5% of the total R&D funds, which is the highest rate among all OIC countries with available data. Additionally, sector’s share exceeds 10% in Kazakhstan, Pakistan, and Iran.
Mozambique and Uganda deserve special attention as their R&D funds mostly come from abroad, 65.3% and 50.7% respectively.
HIGH-TECHNOLOGY EXPORTS
High-technology exports (HTE) are products with high R&D intensity, including aerospace, computers, software and related services, consumer electronics, semiconductors, pharmaceuticals, scientific instruments and electrical machinery, which mostly depend on an advanced technological infrastructure and inward FDI in high-tech industries. World high-technology exports are estimated to have reached over $1.7 trillion in 2007. Around 70% of that amount originated from developed countries, of which 33.3% from the EU members, 13.1% from the United States, 7.0% from Japan, and 6.3% from Republic of Korea (Figure 9).
China is the largest exporter of HTE, accounting for almost one-fifth of the world total HTE and two-thirds of the total HTE of developing countries. Confirming the lack of adequate infrastructure and FDI in most of OIC countries, it is observed that all the member countries for which data are available accounted for only 4.3% of the world HTE (Figure 9), or 14.4% of the total HTE of developing countries. Data for OIC countries are illustrated in Figure 10, which yield the following observations:
Malaysia and Indonesia are, by far, the top ranking OIC member countries by high technology exports, together representing 93.5% of the total HTE of the OIC.
With $64.6 billion, Malaysia, on its own, accounts for 86.5% of the total HTE of the OIC. It is also the 9th largest exporter of high-technology products in the world, accounting for 3.7% of the world HTE.
Kazakhstan, with around $1.5 billion of HTE, accounted for 2% of the total HTE of the OIC countries, rendering it the 3rd largest exporter of high-technology products in the OIC.
HTE of the other leading member countries ranges from $100 million to $1 billion. In Sub-Saharan Africa, Benin, Guinea, and Sudan records even less than $30,000 of HTE.
Figure 9: HTE, % of World Total, 2007 Source: World Bank, World Development Indicators (WDI), Online Database.
Rep. of Korea6.3%
Japan7.0%
USA13.1%
EU33.3%
OIC4.3%
China19.3%
Other Developing
6.2%
Other Developed10.5%

8
Cote d’Ivoire, with more than $450 million of HTE, gets far ahead of the other Sub-Saharan members. It also ranked as the 6th largest exporter of high-technology products in the OIC.
Figure 10: High Technology Exports (Million US$)*
Source: World Bank, World Development Indicators (WDI), Online Database. * Data for 2007 or latest available year.
For a better understanding of the importance of HTE to a country, it is useful to look at the share of these exports in its total manufactured exports. Figure 11 presents these shares for 48 member countries for which data are available in a comparative manner to reflect any change over time.
Gabon
Cote d'Ivoire
Kazakhstan
IndonesiaNigerMoroccoBurkina FasoNigeria
Uganda MaliBrunei
TunisiaSurinameIran TurkmenistanAlbania Senegal
Cameroon MozambiqueGambia Kyrgyz Rep.Lebanon AlgeriaAzerbaijanJordan
Sudan
Oman
TurkeyGuyana0
5
10
15
20
25
30
35
40
45
50
55
60
0 2 4 6 8 10 12 14 16 18
2007 or latest yearavailable
2000 or earliest year available
Pakistan, Yemen, Kuwait, Syria, Saudi Arabia, United Arab Emirates, Bangladesh, Comoros, Egypt, Iraq, Benin, Bahrain, Togo, Qatar, Guinea, Maldives (Ranked by decending order of 2007 values)
Malaysia
58 60
Figure 11: High Technology Exports: 2000 vs. 2007 (% of Manufactured Exports)
Source: World Bank, World Development Indicators (WDI), Online Database.
With respect to the data illustrated in Figure 11, the evolution of high technology exports in the OIC member countries during the period 2000-2007 can be summarized as below:
Largest improvements across the OIC are recorded by two Sub-Saharan members, namely Gabon and Cote d’Ivoire, having managed to increase the share of HTE from below 7% to over 30% of their manufactured exports.

9
Kazakhstan also reported relatively high expansion rate in the share of HTE, from 3.9% to 23.2%.
In 16 member countries listed at the bottom of the Figure, HTE continue to account for less than 2% of their manufactured exports. Nevertheless, there were improvements in nine of them though to a limited extent.
Decline in the share of HTE in manufactured exports has also been observed in many countries, particularly in Kyrgyz Republic with 15 percentage points. Overall, there were 22 OIC countries having reported a decline in the share of HTE in their manufactured exports.
Representing over 90% of the total HTE of the OIC, Malaysia and Indonesia have also witnessed a decrease in the share of HTE in their manufactured exports, 7.9 and 4.9 percentage points, respectively. Yet again, Malaysia continues to have the largest share of HTE in manufactured exports (51.7%).
Although the average for OIC countries declined by 10 percentage points to 20.2%, it was still higher than the world average of 18.9%. Nevertheless, when Malaysia, which accounted for about 87% of the total HTE of the OIC, is excluded, the average for OIC countries falls down to 4.1%.
SCIENTIFIC PUBLICATIONS
Academic research is one of the most important components of research activities conducted in a country. To a certain extent, the performance in academic research can be well reflected by the number of scientific articles published in indexed journals. In this regard, the quantity and the growth of the research output, i.e., articles, are indicators commonly used to measure the research performance of a given institution or country. Indeed, such bibliometric indicators have been widely used in national science and technology statistics publications to measure scientific capacity and linkages to world science3 and particularly in national and international rankings of universities.4
PUBLISHED ARTICLES
OIC member countries as a whole published 63,342 articles5 in 2009 in journals that are covered by Science Citation Index Expanded (SCI-EXPANDED), Social Science Citation Index (SSCI), and Arts & Humanities Citation Index (A&HCI), compared to 18,391 articles they published in 2000.6 Although there is an over three-fold increase in a decade, the amount reached is still below those of some individual countries in the world, such as the United States, China, Germany, Japan, and England (Figure 12).
Figures 13 and 14 present information on the contribution of each OIC member country to this output. In this respect, the following observations outline the performance of the OIC member countries in publishing articles:
3 UNESCO Institute for Statistics, “What do bibliometric indicators tell us about world scientific output?”, UIS Bulletin on Science and Technology Statistics, Issue 2, September 2005. 4 For example, Academic Ranking of World Universities by Shanghai Jiao Tong University (SJTU), World University Rankings by the Times Higher Education Supplement (THES), and also the OIC University Ranking make use of the research output as an important indicator in their ranking methodologies. 5 The total reflects the sum of individual OIC countries and it is not refined for internationally co-authored papers. 6 Data are collected from the ISI Web of Knowledge maintained by Thomson Reuters. For further information, see http://isiwebofknowledge.com/
7366 64 63
46
33
24
0
20
40
60
80
Thousands
>100 >100
Figure 12: The Number of Published Articles, 2009 Source: ISI Web of Knowledge [24.03.2010].

10
Production of scientific publications –here articles– in the OIC is heavily concentrated in a few of the member countries.
More than half of the articles (52.7%) originate from only two member countries, Turkey (31.6%) and Iran (21.1%). Together with Egypt (7.0%), Malaysia (6.2%), and Pakistan (5.3%), these countries account for 71.2% of all published articles (see Figure 13).
Some other member countries in the Middle East & North Africa, South Asia, and East Asia & Pacific also perform well while those in Latin America, Sub-Saharan Africa, and Central Asia are generally lagging behind.
There are 10 countries that published less than 20 articles in 2009. These countries are not concentrated in one region but dispersed across regions: for example; from Guyana in Latin America to Somalia in Sub-Saharan Africa, and from Turkmenistan in Central Asia to Maldives in South Asia.
The number of countries having published less than 100 articles is 24. Nigeria stands out as the only Sub-Saharan member to have produced over 1,000 articles
(1,922), the closest ones in the region being Uganda and Cameroon, each with over 450 articles.
Figure 14: Articles Published in International Journals, 2009*
Source: ISI Web of Knowledge [24.03.2010]. * Total number of articles published in journals covered by Science Citation Index Expanded (SCI-
EXPANDED), Social Science Citation Index (SSCI), and Arts & Humanities Citation Index (A&HCI).
THE EVOLUTION OF PUBLICATION OUTCOME
The growth in the number of articles on a per-capita basis reflects a better indicator of productivity in scientific publications as it takes into account the relative size of the population in the countries compared. In this respect, Figure 15 presents data on articles per million people (pmp) in OIC member countries in a manner to reflect the evolution in the last decade of 2000-2009. Accordingly:
0 10 20 30
Thousands
Morocco 1.1 (1.8%)
Algeria 1.4 (2.2%)
Nigeria 1.9 (3.0%)
Saudi Arabia 2.0 (3.2%)
Tunisia 2.2 (3.5%)
Pakistan 3.3 (5.3%)
Malaysia 3.9 (6.2%)
Egypt 4.4 (7.0%)
Iran 13.4 (21.1%)
Turkey 20.0 (31.6%)
Figure 13: Top 10 OIC Countries by the Number of Published Articles, 2009
11
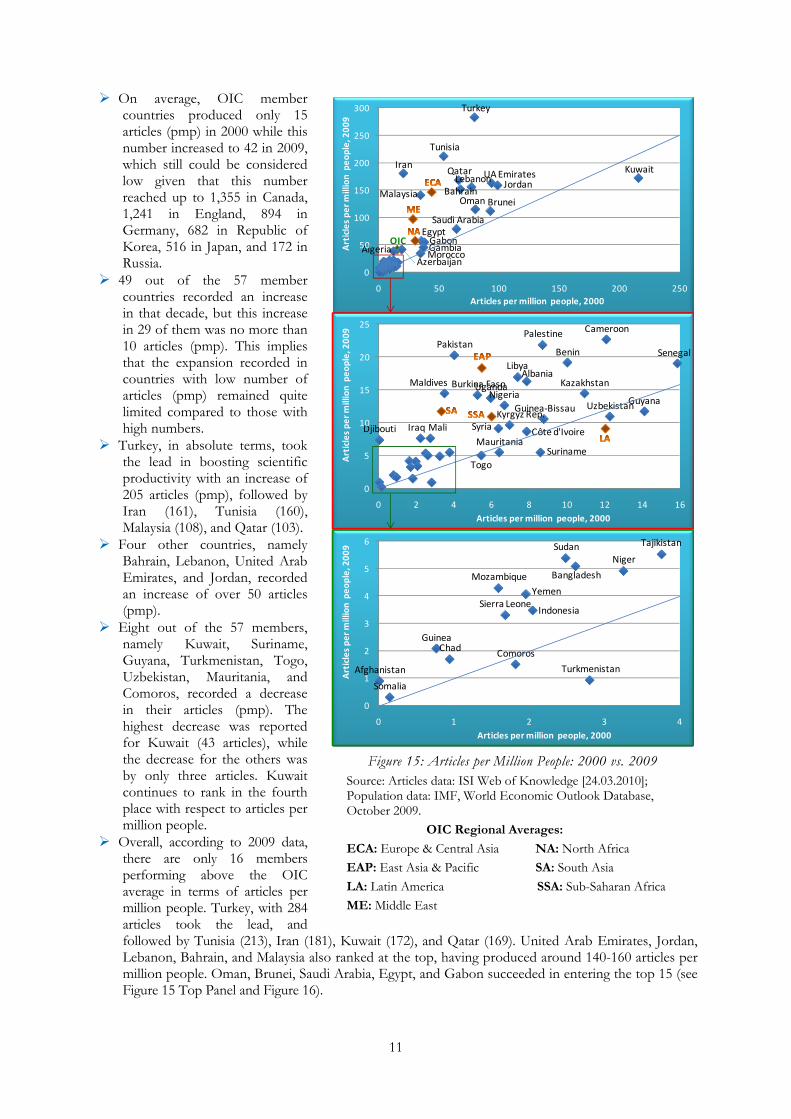
On average, OIC member countries produced only 15 articles (pmp) in 2000 while this number increased to 42 in 2009, which still could be considered low given that this number reached up to 1,355 in Canada, 1,241 in England, 894 in Germany, 682 in Republic of Korea, 516 in Japan, and 172 in Russia.
49 out of the 57 member countries recorded an increase in that decade, but this increase in 29 of them was no more than 10 articles (pmp). This implies that the expansion recorded in countries with low number of articles (pmp) remained quite limited compared to those with high numbers.
Turkey, in absolute terms, took the lead in boosting scientific productivity with an increase of 205 articles (pmp), followed by Iran (161), Tunisia (160), Malaysia (108), and Qatar (103).
Four other countries, namely Bahrain, Lebanon, United Arab Emirates, and Jordan, recorded an increase of over 50 articles (pmp).
Eight out of the 57 members, namely Kuwait, Suriname, Guyana, Turkmenistan, Togo, Uzbekistan, Mauritania, and Comoros, recorded a decrease in their articles (pmp). The highest decrease was reported for Kuwait (43 articles), while the decrease for the others was by only three articles. Kuwait continues to rank in the fourth place with respect to articles per million people.
Overall, according to 2009 data, there are only 16 members performing above the OIC average in terms of articles per million people. Turkey, with 284 articles took the lead, and followed by Tunisia (213), Iran (181), Kuwait (172), and Qatar (169). United Arab Emirates, Jordan, Lebanon, Bahrain, and Malaysia also ranked at the top, having produced around 140-160 articles per million people. Oman, Brunei, Saudi Arabia, Egypt, and Gabon succeeded in entering the top 15 (see Figure 15 Top Panel and Figure 16).
Turkey
Tunisia
Iran KuwaitQatar UA EmiratesJordan
LebanonBahrainMalaysia
Oman Brunei
Saudi ArabiaEgyptGabonGambia
OIC
AzerbaijanAlgeria
Morocco
0
50
100
150
200
250
300
0 50 100 150 200 250
Articles per million people, 2009
Articles per million people, 2000
CameroonPalestinePakistan
Benin SenegalLibya
AlbaniaMaldives KazakhstanBurkina FasoUganda
NigeriaGuyanaUzbekistanGuinea‐Bissau
Kyrgyz Rep.Syria
Côte d'IvoireMaliIraqDjibouti
SurinameMauritania
Togo
0
5
10
15
20
25
0 2 4 6 8 10 12 14 16
Articles per million people, 2009
Articles per million people, 2000
TajikistanSudan
Bangladesh
Niger
Mozambique
Yemen
IndonesiaSierra Leone
GuineaChad
Comoros
TurkmenistanAfghanistan
Somalia
0
1
2
3
4
5
6
0 1 2 3 4
Articles per million people, 2009
Articles per million people, 2000
Figure 15: Articles per Million People: 2000 vs. 2009 Source: Articles data: ISI Web of Knowledge [24.03.2010]; Population data: IMF, World Economic Outlook Database, October 2009.
OIC Regional Averages:
ECA: Europe & Central Asia NA: North Africa
EAP: East Asia & Pacific SA: South Asia
LA: Latin America SSA: Sub-Saharan Africa
ME: Middle East

12
At the other side of the spectrum, there are member countries with even less than one article (pmp), like Afghanistan, Turkmenistan, and Somalia.
Most of the high ranking member countries are located in the Middle East. Articles per million people averaged at 98 in this region in 2009, compared to 28 in 2000.
The average for the members in Europe & Central Asia increased from 44 to 147 in that period. Excluding Turkey, these averages fall down to 11 and 14, respectively.
Except for the Latin American members, the averages for the other regions also increased in the period under consideration (North Africa: from 30 to 58; East Asia & Pacific: from 5 to 18; South Asia: from 3 to 12; and Sub-Saharan Africa: from 6 to 11).
PATENT APPLICATIONS
Intellectual property rights, especially patents, are the key factors contributing to advances in innovation and scientific development. As a product of R&D activities, patents strengthen the link between science and technology, as the outcomes of research translate into new products or services. In this regard, although not all inventions are patented, the quantity of patent applications may be considered as a proxy for the degree of innovative capability in a country. According to statistics from the World Intellectual Property Organization (WIPO), the total number of patent applications around the world in 2008 is estimated to have been 1.85 million, and less than 1% of them were filed in OIC member countries –for which data are available. USA, Japan, China, and Republic of Korea accounted for about 70% of the total patent applications in the world. To shed light on the situation in individual OIC member countries, Table 1 presents statistics on patent applications in countries for which data are available.
Table 1: Patent Applications by Office: Residents and Non-residents*
Country Residents Non Res. Total Year Country Residents Non Res. Total Year
Iran 5,970 557 6,527 2006 Bangladesh 29 270 299 2007
Malaysia 818 4,485 5,303 2008 Syria 124 133 257 2006
Indonesia 282 4,324 4,606 2006 Azerbaijan 222 5 227 2008
Turkey 2,221 176 2,397 2008 Kazakhstan 11 162 173 2008
Egypt 516 1,589 2,105 2007 Kyrgyz Rep. 135 3 138 2008
Pakistan 170 1,375 1,545 2008 Brunei 0 75 75 2008
Morocco 177 834 1,011 2008 Mozambique 18 22 40 2007
Algeria 84 765 849 2007 Yemen 11 24 35 2007
Saudi Arabia 128 642 770 2007 Tajikistan 26 0 26 2006
Jordan 59 507 566 2007 Sudan 3 13 16 2007
Uzbekistan 262 186 448 2008 Uganda 6 1 7 2007
Tunisia 56 282 338 2005 Bahrain 3 2004
Lebanon 316 2006 Burkina Faso 1 0 1 2005 Source: World Intellectual Property Organization, Statistics on Patents, September 2010
* Patent application numbers for the most recent year with available data are considered. Most recent year with available data is indicated in the “Year” column. Numbers of patent applications for most African OIC countries are not provided individually as these countries are members of the African Regional Intellectual Property Organization (ARIPO). Total number of patents filed to ARIPO in 2008 is 435. Resident/non-resident breakdown is not provided for Lebanon and Bahrain.
55
58
80
112
115
142
152
157
159
163
169
172
181
213
284
0 50 100 150 200 250 300
Gabon
Egypt
Saudi Arabia
Brunei
Oman
Malaysia
Bahrain
Lebanon
Jordan
U.A. Emirates
Qatar
Kuwait
Iran
Tunisia
Turkey
Figure 16: Top 15 OIC Countries by Articles Per Million People, 2009

13
In this respect, the following observations can be made to summarize the situation in the OIC member countries:
Patent activity is highest in Iran, Malaysia, and Indonesia. In 2006, total patent applications (by residents and non-residents) amounted to 6,527 in Iran and 4,606 in Indonesia. In 2008, total patent applications amounted to 5,303 in Malaysia.
In most of the OIC countries, applications by non-residents are higher than those filed by residents; in fact, in half of the 26 countries with available data, they account for more than 75% of the total applications. In quantity, they are highest in Malaysia (4,485) and Indonesia (4,324), accounting for, respectively, 85% and 94% of the total applications.
Applications by residents dominate only in eight of the member countries, and, in quantity, they are highest in Iran (5,970) and Turkey (2,221).
KNOWLEDGE AND TECHNOLOGY
Two of the widely used measures of knowledge and technology are the Knowledge Economy Index (KEI) and Knowledge Index (KI), which were developed by World Bank in order to compare the performance of any country with other countries and/or group of countries. The KEI measures to what extent the environment is conducive for knowledge to be used effectively for economic development. It is calculated based on the average of normalized scores of a country on four pillars related to the knowledge economy: Economic Incentive and Institutional Regime, Education, Innovation, Information and Communication Technology. Figure 17 depicts the positions of the top ten OIC member countries vis-à-vis the rest of the world in terms of their performance related to the KEI.
1 2 3 4 5 44 45 48 49 52 61 62 66 68 72 76 80 82 84 900
1
2
3
4
5
6
7
8
9
10
Country rankings
Figure 17: Knowledge Economy Index (KEI) and country rankings, 2009*
Source: World Bank.
* KEI is calculated for 145 countries and 40 OIC members. The index values for the world, EU and OIC are calculated by taking averages of index values for the relevant countries weighted by 2008 populations.
The following observations are made:
The KEI is above the world average in only 12 out of 40 OIC member countries for which the KEI is calculated.
Qatar and UAE are the top two OIC member countries standing only 44th and 45th in the world. Half of the bottom 50 countries for which the KEI was calculated are OIC members. To give a sense of the regional comparison between the OIC and EU, there is only one EU
country with a lower KEI than Qatar and UAE, which are the top two OIC members in terms of the KEI.

14
The other widely used knowledge index, KI, measures a country’s ability to generate, adopt, and diffuse knowledge. The KI is the simple average of the normalized scores of a country on three knowledge economy pillars: Education, Innovation, Information and Communication Technology. The only difference between the KI and KEI is that the former does not take into account economic incentives and institutional regime. Figure 18 depicts the positions of the top ten OIC member countries vis-à-vis the rest of the world in terms of their ability to generate, adopt, and diffuse knowledge.
1 2 3 4 5 44 45 54 56 59 64 70 72 74 76 77 79 81 86 880
1
2
3
4
5
6
7
8
9
10
Country rankingsCountry rankings
Figure 18: Knowledge Index (KI) and country rankings, 2009*
Source: World Bank.
* KI is calculated for 145 countries and 40 OIC members. The index values for the world, EU and OIC are calculated by taking averages of index values for the relevant countries weighted by 2008 populations.
The following observations are made:
The KI is above the world average in only 13 out of 40 OIC member countries for which the KI was calculated.
As in the case of KEI, the United Arab Emirates and Qatar are the top two OIC member countries standing only 44th and 45th in the world in terms of the KI.
22 of the bottom 50 countries for which the KI can be calculated are OIC members.
The OIC member countries perform slightly better when KI is used as opposed to KEI. This indicates that economic incentives (tariffs and non-tariff barriers) and institutional regime (rules and regulations) are two main reasons for OIC members’ poor performance in knowledge and technology.
Innovation Index and Information and Communication Technology (ICT) Index, two components of the KEI and KI, are also important indicators on science and technology. In the rest of this section, these two indices are analyzed for the OIC member countries. Innovation Index is the simple average of the normalized scores on three key variables: Total Royalty Payments and Receipts, Patent Applications Granted by the US Patent and Trademark Office, Scientific and Technical Journal Articles. Figure 19 compares the OIC member countries with the rest of the world in terms of innovation. As seen in Figure 19, the Innovation Index value is above the world average in only five out of 40 OIC member countries for which the index was calculated. Malaysia and the United Arab Emirates are the top two OIC member countries standing only 44th and 46th in the world.

15
1 2 3 4 5 44 46 48 55 61 70 71 73 75 76 77 79 80 86 910
1
2
3
4
5
6
7
8
9
10
Country rankingsCountry rankings
Figure 19: Innovation Index and country rankings, 2009*
Source: World Bank.
* Innovation index is calculated for 146 countries and 40 OIC members. The index values for the world, EU and OIC are calculated by taking averages of index values for the relevant countries weighted by 2008 populations.
ICT Index is the simple average of the normalized scores on three key variables: Telephone, Computer, and Internet Penetrations (per 1,000 people). Figure 20 compares the OIC member countries with the rest of the world with respect to the usage of telephone, computer, and the internet. As seen in Figure 20, the ICT Index value is above the world average in 13 out of 40 OIC member countries for which the index was calculated. The United Arab Emirates and Qatar are the top two OIC member countries standing 21st and 27th in the world. The index value is above the EU average only in the United Arab Emirates.
1 2 3 4 5 21 27 40 41 46 52 63 68 74 75 76 77 79 83 850
1
2
3
4
5
6
7
8
9
10
Country rankingsCountry rankings
Figure 20: Information and Communication Technology (ICT) Index and country rankings, 2009*
Source: World Bank.
* ICT index is calculated for 146 countries and 40 OIC members. The index values for the world, EU and OIC are calculated by taking averages of index values for the relevant countries weighted by 2008 populations.

16
POLICY RECOMMENDATIONS
The primary finding of this report is twofold. First, major indicators on research and scientific development display a large disparity within the OIC member countries. Second, the OIC members, individually or as a group, lag far behind the rest of the world, particularly the developed countries, with a few exceptions. These findings are summarized in this section, and in the light of these findings, some broad policy recommendations are made.
Although the availability of researchers varies considerably among the OIC member countries, most of these countries lag behind the world, with inadequate quantity of researchers employed in R&D activities. Women, as researchers, are underrepresented in R&D activities. On the other hand, the OIC average is only slightly lower than the world average, and many OIC countries have higher shares than even the average for the EU member countries.
R&D intensity is quite low in the OIC countries, with only one country spending more than 1% of GDP on R&D while the world average is around 1.8%. While some countries have recorded significant increases in their R&D intensity in the last ten years, most of them reported stable expenditures on R&D. Although the OIC Ten-Year Programme of Action called upon the member countries to encourage R&D programmes and ensure their individual R&D intensity is not inferior to half of the world average, the OIC countries are still far away from this target and, with the current trends, it seems difficult to meet the Programme target on time. Therefore, there is a dire need for more efforts to be exerted in this area in order to close the gap with the rest of the world. To achieve this, R&D should be stimulated through government and private sector initiatives and coordination among the OIC member countries.
In this regard, networking opportunities among the OIC member countries could be facilitated through projects, similar to the Framework Programmes of the European Union, to support research and technological development in the Islamic world and to promote joint research initiatives among the member countries. Additionally, research joint ventures among companies in OIC member countries could be encouraged as R&D investments are very costly. OIC countries may also take advantage of R&D spillovers by rapidly learning about new technologies developed in other countries and improving them, and by importing technological goods and services from their high-tech trade partners.
An important area for R&D is nanotechnology, which is envisioned by many scientists and researchers as the next major advancement in science and technology (the previous ones being railroad, automobile, and computers). The global market for nanotechnology products is estimated to reach $1 trillion by 2015 (Roco & Bainbridge; NSF, 2001). OIC member countries are at a cross road to be major players of this advancement. It is imperative that these countries jointly initiate joint research and investment on nanotechnology as the pioneers of this new technology will benefit enormously from their early investment in this area. SESRIC has been raising awareness on this important topic in the Islamic world.
Production of scientific articles, which is another important indicator on research and scientific development of a country, is also concentrated in a few of the OIC members. In 2009, the OIC member countries produced more than 63,000 articles, 71% of which originated in five countries. Moreover, the number of articles was less than 100 in 24 OIC member countries. In the last decade, from 2000 to 2009, the number of articles per million people, on average, increased by 27 articles to reach 42, which is still low given that in some countries it exceeds 1,000. In fact, together the 57 OIC member countries produced fewer scientific articles than England in 2009. To close the gap with the rest of the world and among the members, higher education and academic research should be supported rigorously by the governments. Some broad policies that could be undertaken in this regard are:

17
Encouraging the establishment of private colleges, universities, and research centres through funds and financial incentives
Improving living standards for scientists to reduce brain drain from OIC countries to the West and to lead brilliant minds to academic work
Promoting academic research through research grants and lesser teaching loads Encouraging women to attend colleges/universities and removing obstacles that prevent them from
higher education
Available data on 25 OIC member countries indicate that patent applications are below the world average and mostly filed by non-residents, implying that indigenous innovation capability in most of these countries is at low levels. The OIC member countries have no choice but to adopt measures to encourage patenting and technology licensing. In particular, an initiative can be put in place to educate small and medium-sized enterprises about the benefits and regulations of the patent system. Additionally, an OIC level patent system, similar to African Regional Intellectual Property Organization or European Patent Organisation, can be developed to increase incentives for patent application in the Islamic world as being granted patents in a larger geography means higher benefits for patent holders, to foster the establishment of relationships between the members in matters relating to R&D and patents, and to promote exchange of ideas, research, and studies on industrial property matters. Also, steps should be taken to reduce waiting for examination of patents at patent offices.
An important component of scientific development is the infrastructure of internet and other information and communication technologies. This is particularly important in the OIC member countries, which have a high density of youth population. In this context, some policy recommendations can be made. First of all, telecommunication sectors should be liberalized for better products and services in the OIC member countries. Some countries such as Saudi Arabia and Turkey successfully liberalized their telecommunication sectors in the last two decades. However, there is a strong need to speed up the privatization and liberalization of telecommunication sectors in many other OIC member countries. Governments should also promote internet usage through tax reductions on internet services and transferring internet subscription charges from consumers to telecom sector and internet service providers. For more effective use of internet and to improve internet literacy, English as the official language of internet, should be taught to students from early grades. To meet human resource needs in information and technology related sectors, it is important to encourage technology related majors in higher education. Also, infrastructure for wireless network technologies is to be improved for faster diffusion of knowledge.
In parallel with the low R&D intensity and inadequate technological infrastructure, high technology exports of the OIC member countries are quite limited, accounting for only 4.3% of the world high technology exports in 2007 and mostly originating from two members, Malaysia and Indonesia. Moreover, high technology products do not occupy much part in manufactured exports of the OIC member countries, and, with a few exceptions, this situation did not improve significantly over time. It is evident from the data that countries with higher share of high technology exports are also the largest exporters of goods and services. More investments in R&D will spur high technology exports, and hence increase total exports, in the OIC member countries.
Last but not least, given the importance of evidence-based policy making and the role of S&T in the development of countries, national statistical offices of the member countries should give special attention to the collection and dissemination of statistical data on science and technology.

18
REFERENCES
IMF, World Economic Outlook (WEO), Online Database, October 2009. ISI Web of Knowledge, Online Database. OIC-TYPOA, “Ten-Year Programme of Action to Meet the Challenges Facing the Muslim Ummah in the
21st Century”, Third Extraordinary Session of the Islamic Summit Conference, Makkah al Mukarramah - Kingdom of Saudi Arabia, 7-8 December 2005.
Roco M.C., Bainbridge W. eds., 2001. Societal implications of nanoscience and nanotechnology. National Science Foundation Report, 2000.
UNESCO Institute for Statistics, “What do bibliometric indicators tell us about world scientific output?”, UIS Bulletin on Science and Technology Statistics, Issue 2, September 2005.
UNESCO Institute for Statistics, Data Centre. WIPO, Statistics on Patents, September 2010. World Bank, KEI and KI Indexes. World Bank, World Development Indicators, Online Database.

Statistical, Economic and Social Research and Training Centre for Islamic Countries (SESRIC)
Attar Sokak No. 4, 06700 GOP, Ankara, TURKEY
Tel: (90-312) 468 6172 (4 lines) Fax: (90-312) 468 5726 E-mail: [email protected] Web: www.sesric.org