research connection: “cutting edge” transportation safety ...€¦ · 03.02.2010 · related...
TRANSCRIPT

1
Research Connection: “Cutting Edge” Transportation Safety Research
101
Marsh
37~38 m
Jim MisenerCalifornia PATH
February 3, 2010
2
Outline
• Active Safety, Defined• “Leading Edge, High Visibility Research”
– Vehicle-Infrastructure Integration (VII) IntelliDrive (in California)
– Intersection Safety– Networked Traveler – Situational Awareness– (Onboard Monitoring for Trucker Safety)
• Recap

3
Active Safety DefinedSafety Versus Time… (Kosch, 2007)
Foresighted and Active Safety Passive Safety
Information
ForesightedDriving
Active Assistance
Warning andAssistance
Intervention
AutomaticControl
Collision
SafetySystems
EmergencyResponse
Probability for collision
Func
tinal
ity(E
xam
ples
)
Traffic Information Danger Warning Warning at mistakese.g. stop sign
Restraint systems
Airbag
Crash-Cell
911Road conditions
distance, lane changeEmergency brake
Short Range Communication
Broadcast, Cellular Systems
Potential
Source: C2C CC

4
Active Safety Roadmap
Figure adapted from NHTSA IVHS Plan (1992)
SituationalAwarenessOBM
Feedback
Crash Unavoidable

5
What is VII?IntelliDrive (SM)Basic Concept:• All new vehicles will be equipped with DSRC
radios at 5.9GHz, and GPS receivers.• A nationwide, roadway-based communications
network will be created.• Wireless data will be exchanged between the
vehicles and the roadside.• A “Backhaul” network will transport this roadside
data to/from a central location.

6
Vehicle-Infrastructure Cooperation
DSRC Radio
DSRC Radio
On-Board Equipment Vehicle
Sensors
Driver-Vehicle Interface
CICAS SLTA, TSA processor
Infrastructure sensors
Signal controller system
Network Connection to VII and TOC
Driver Infrastructure Interface
Vehicle Intersection
Messages
Infrastructure-CentricSystem
Vehicle-CentricSystem

7
VII California Testbed Details
The Vehicle: Perhaps a dozen
The Infrastructure:• 40 RSE Planned• 12 Installed
VII California VII California TestbedTestbed

8
Status of RSESunday evening, 22 Jul 07
VII California VII California TestbedTestbed
www.viicalifornia.org

9
System Features
• On-board curve prediction and dynamic curvature estimation using existing map (not enhanced high accuracy map)
• Enhance and update map attributes via V-I communication• Feedback and broadcast speed advisory for other vehicles through
V-I communication• Curve prediction example results:
101
Marsh
37~38 m
On-Ramp from Marsh Rd. to SB101 Dynamic curvature estimates using existingcommercial map
-90 -80 -70 -60 -50 -40 -30 -20 -10 0 10
-20
-10
0
10
20
30
40
50
East(m)
Nor
th 37.2 m

10
5th and El Camino Real
www.viicalifornia.org

11
Caltrans/PATH Signal Phase Software: History
• 170 – AB3418 (TSP Project, 2002)– Sniffer (Page Mill, 2006)– Current work with Kai
Leung / BMW
• 2070– NTCIP serial (Turner
Fairbank, 2003; RFS, 2004)– AB3418 (ECR/Fifth, 2007)
• Econolite ASC/3-2100– NTCIP ethernet (World
Congress, 2005)
www.viicalifornia.org

12
CICAS-SLTA (and –TSA)
13
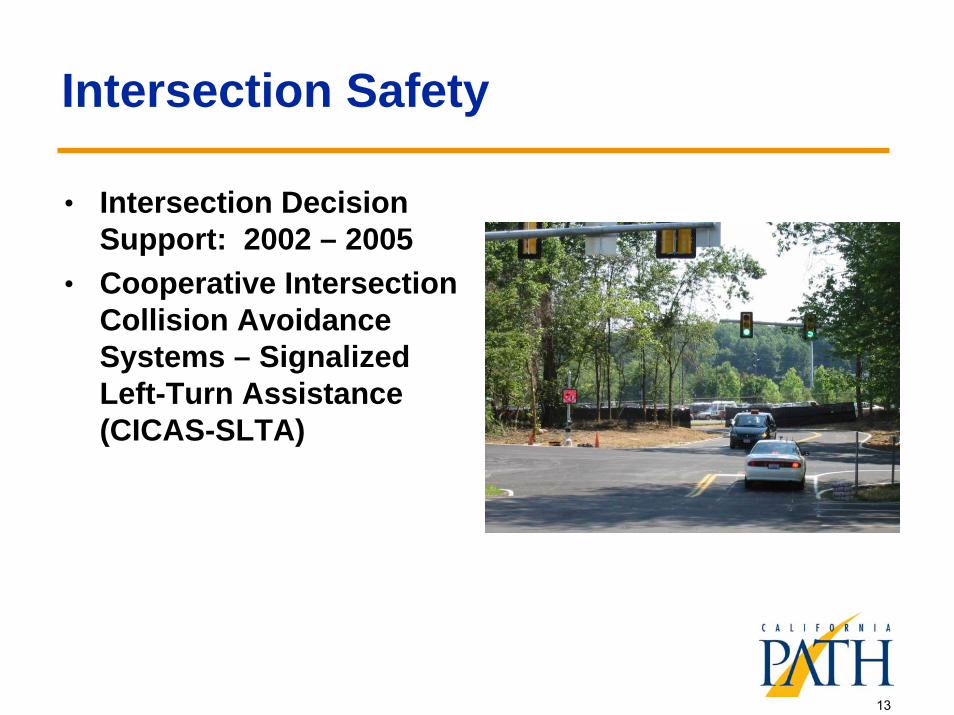
Intersection Safety
• Intersection Decision Support: 2002 – 2005
• Cooperative Intersection Collision Avoidance Systems – Signalized Left-Turn Assistance (CICAS-SLTA)

14
CICAS SIGNALIZED LEFT TURN ASSISTANCE (SLTA) and Traffic SignalAdaptation (TSA)
Task 0. Management
Phase 1. Conduct Detailed
InvestigationTask 1.1 Develop Revised
Test Plan
Task 1.2 Investigate SLTA Gap Acceptance
Task 1.3 Refine TSA
Task 1.4 Develop CICAS Testbed
Phase 2 Assess Technical Feasibility
Task 2.1 Develop and Implement DVI Concepts
Task 2.2 Implement Testbed
Task 2.3 Perform Field Measurements
Task 2.4 Implement and Test SLTA Algorithms
Task 2.5 Implement and Test TSA Algorithms
Task 2.6 Interface with StandardsTask 1.5 Interface with
Standards Task 2.7 Recommendations of Next Steps
Phase 3 Assess Field Deployability
(Optional)
Task 3.1 Conduct SLTA Algorithm Tests
Task 3.2 Conduct TSA Algorithm Tests
Task 3.3 Develop FOT Plan
Task 3.4 Interface with Standards
Task 3.5 Prepare Final Report and Recommendatio
15
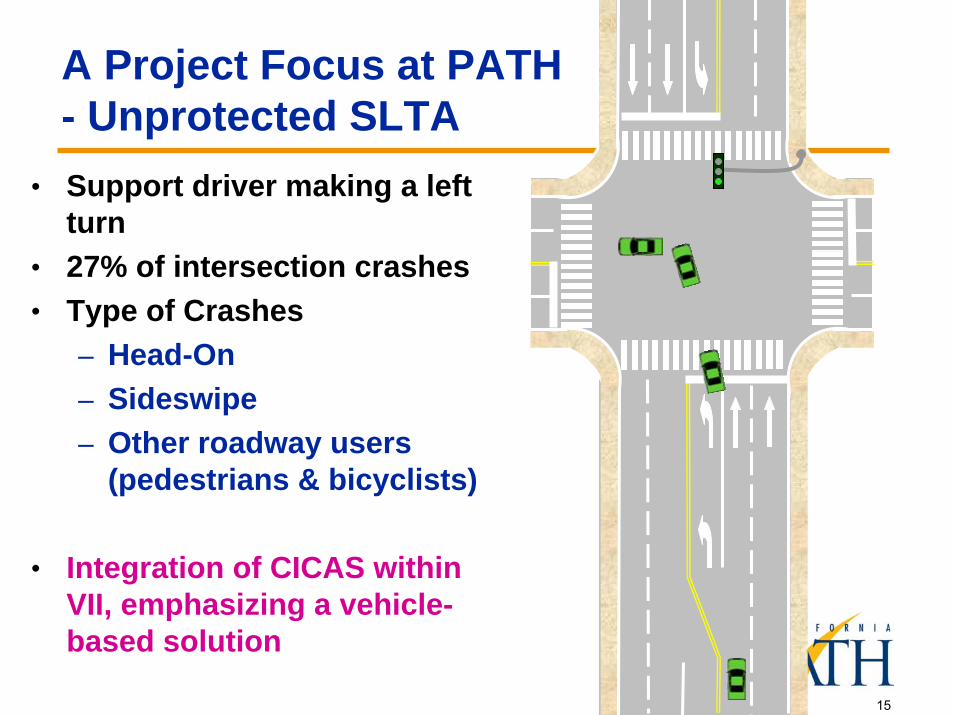
A Project Focus at PATH- Unprotected SLTA
• Support driver making a left turn
• 27% of intersection crashes• Type of Crashes
– Head-On– Sideswipe– Other roadway users
(pedestrians & bicyclists)
• Integration of CICAS within VII, emphasizing a vehicle-based solution

16
Signalized Left Turn Assist

17
CICAS-TSA Objective
RLR
Develop a system that Develop a system that detects a potential RLRdetects a potential RLR--related conflict and related conflict and dynamically extendsdynamically extends the the red clearance phase to red clearance phase to prevent the collisionprevent the collision
Compatible with CAMP Compatible with CAMP CICASCICAS--V: Addresses V: Addresses deployment and/or deployment and/or unequipped carsunequipped cars
Extended red clearance
18
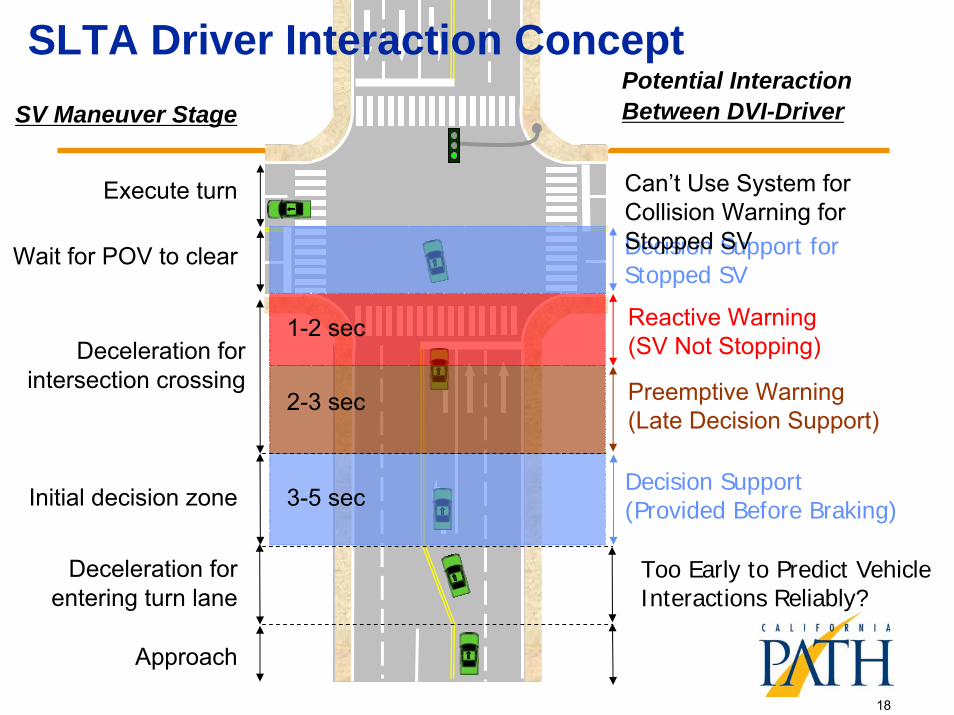
Execute turn
Wait for POV to clear
Deceleration for intersection crossing
Approach
Initial decision zone
Deceleration for entering turn lane
Too Early to Predict Vehicle Interactions Reliably?
Reactive Warning(SV Not Stopping)
Decision Support for Stopped SV
Decision Support(Provided Before Braking)
Preemptive Warning(Late Decision Support)
1-2 sec
2-3 sec
3-5 sec
SLTA Driver Interaction ConceptSV Maneuver Stage
Potential InteractionBetween DVI-Driver
Can’t Use System for Collision Warning for Stopped SV

19
Computer Vision-Based Pedestrian & Bicycle Detection and Tracking

20
Instrumentation Plan for Field Observation
160°Laser Scanner
In-the-Box + All-direction Monitoring
Long-range RadarPOV TrafficMonitoring
Two Radar forMonitoring SV Traffic
Additional Equipment• Video Image Capture• GPS• Data Acquisition Computer• Infrared Camera

21
Warning Algorithms Based on Trailing Buffer
• Trailing buffer is the time difference between– SV departure from POC
(point of conflict), and– POV arrival at POC
• Trailing buffer is– A dynamic value that
varies over time– A meaningful measure
of “closeness to a crash”
– A candidate criteria for warning algorithms

22-6 -5 -4 -3 -2 -1 0 1 2 3 4
0
1
2
3
4
5
6
7
8
9
10
Time r.t. SV at POC(sec)
PO
V T
2I (s
ec)
Representation of Time Gap Acceptance inLTAP-OD Scenarios
• Analysis of SV-POV interactions helps the understanding of driving behaviors and allows the estimation of gap/lag acceptance.
SV Arrival

23
PATH Intelligent Intersection Facility
Traffic Controller Cabinet
60 Meters of 3M Microloops
Embedded Loop Detectors
Signal Poles RadarPoles
Traficon (30’ height)RTMS (18’ height)
POV
SV

24
RFS Instrumented Intersection
• Instrumented for Driving Studies• Prototyping Infrastructure Interfaces• Technology Testbed
• Sensor testing• Signal interface testing• Lighting

25
IDS RFS Intersection Experiments

26
SafeTrip-21: The Connected Traveler

27
• Tell me about my trip– Trip Planner (cell phone with Internet connectivity;
multimodal services– Dynamic Route Advisory
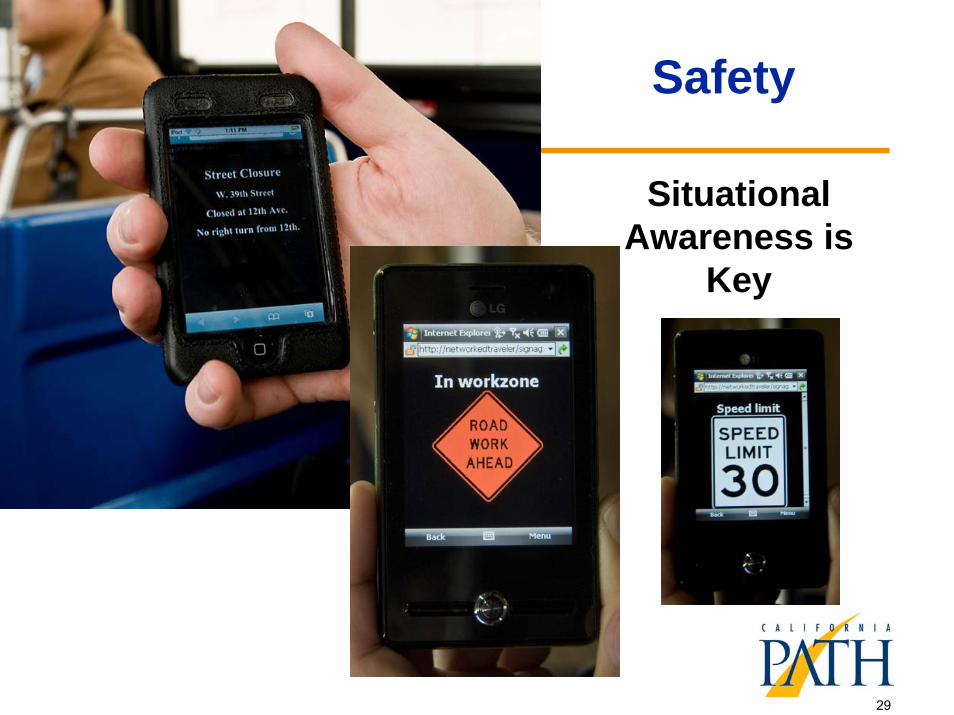
• Tell me about the road– Traffic Signal Countdown (as a safety and information enabler)– Public Signage – Situational Awareness– Pedestrian Assistant (location and other apps)
• Watch out for me!– Heartbeat/watch out for me (confederate driver near the bus;
situational awareness, left/right?)– Pedestrian Assistant (safety apps)
• System Operator / Agency Application– Transit Signal Priority (LCD on bus with signal phase countdown)– Dynamic Passenger Information (On-board display, arrival
countdown, and bus station, arrival time)
Networked Traveler ServicesWe demonstrated these in NYC

28
Milestones
• Demonstration at ITS World Congress November 2008
• Field Test– San Francisco Bay Area– Beginning in October
29
Safety
Situational Awareness is
Key

30
Application 1. Situational AwarenessConcept of Advisory Services
Mapping to the Classic Driving Model Taxonomy
• Strategic – Safety Route Advisory
• Tactical (Primary Focus)– Situational Awareness Advisory
• Control – “Watch out for me!” Active Safety
Alert Latency
Active Safety Situational Awareness Trip Advisory
< 1 sec. 10-60 sec. 2-30 minutes.

31
Coverage Map (1/2):
About 1650 NAVTEQ triggers and more than 520 SpeedInfotriggers in Bay Area.

32
Coverage Map (2/2):

33
Alert AlgorithmDefinitions:
Subject vehicle: Vehicle whose driver receives slow traffic ahead alert
Alert location: Upstream location where traffic is slow
Trigger location: Represented by GPS lat, long, and heading; about one mile (60 seconds of free flow speed) before the alert locationSuppose:
Vs = Speed of the subject vehicleVf = Speed of the vehicles at the alert location
Alert is issued if:1)Vf ≤ 50 mph and2)Vs – Vf ≥ 15 mph and3)Distance between trigger location and subject vehicle location ≤ 500 ft4)Difference between trigger location’s heading and vehicle’s heading ≤ 50 deg

34
Validating End of Congestion Queue Algorithms (in progress)
Observed and fitted slowing distance versus speed for several values of Δv for user 1
• 3000 miles of late summer, early fall “shakedown” testing
– 7 drivers– Analyzed GPS traces
• Time (s) • Latitude (deg)• Longitude (deg)• Speed (mph)• Heading angle (deg)• Altitude (m)• Number of satellites• PDOP[
• Isolated soft braking events– Braking (slowing distance)– Speed before slowdown– Speed differential (post facto speed
data),• Modeled the slowing distance as a third
order polynomial – Speed and speed differential. – Calculated coefficients of the
polynomial• f(driver, traffic, location)
Observed and fitted slowing distance versus speed for
several values of Δv for user 2.

35
Location of Top-Deck S-Curve Trigger Point

36
The ‘Onboard Monitoring System for Commercial Vehicle Safety’ (OBMS)
System Prototype
The ‘Onboard Monitoring System for Commercial Vehicle Safety’ (OBMS)
System Prototype

37
Goal
Effective and lasting behavior change to safer driving behaviors for CMV drivers
– What is unsafe?– How can feedback best be provided?

38
Core Behavioral Monitoring CategoriesCore Behavioral Monitoring Categories
1. Speed Selection2. Following Behavior3. Attention (Inattention)4. Fatigue5. General Safety (Good Driving Practice)
1. Speed Selection2. Following Behavior3. Attention (Inattention)4. Fatigue5. General Safety (Good Driving Practice)

39
Monitoring Apps: SpeedMonitoring Apps: Speed
Speed vs.1. Speed Limit (Violation)2. Traffic Flow3. Curve Speed (Curves Speed & Rollover Warning)4. Road Surface5. Grade6. Hard Acceleration
Real-Time Driver Feedback Elements1. Current Speed2. Recommended Speed3. Risk Factors (Why is that speed recommended?)4. Event Recording in Progress (LED/Icon)

40
Speed Limit
Recommended Speed
HHDD Warning
Factors that may beinfluencing the recommended speed

41
Following Time-Gap& FCW Icons
Following Time-Gap
InfluencingFactors
FD/FCW Looming icons from ACAS
EVT 2 s EVT 1 s

42
Components: Camera Enclosure, Radar & Lidar, Road Surface Condition Monitor, Wheel Angle Sensor (String Pot), Gyro & Accelerometer

43

44
Prototypical Offline Feedback Format

45
Recap
• Summary– Vehicle-Infrastructure Integration (VII)
IntelliDrive (in California)– Intersection Safety– Networked Traveler – Situational Awareness– (Onboard Monitoring for Trucker Safety)
• We have been on the vanguard– Innovation– National spotlight
• Bridges near-term safety problems with potential mid-term safety solutions
