revising the pacific northwest resource adequacy standard resource adequacy technical committee june...
TRANSCRIPT

Revising the Pacific
Northwest Resource Adequacy Standard
Resource Adequacy Technical Committee
June 23, 2011

2
Outline
• Review of Existing Adequacy Standard
• Summary of Methodology Peer Review
• A Simple Example of Adequacy Metrics
• Options for a Revised Standard
June 23, 2011

3
Relevant Terms• Metric – a quantity that can be measured, such as loss-of-
load probability or expected unserved energy.• Measure – a value for a metric. • Threshold – a limiting value for a metric, for example, a
metric with a value greater than a certain threshold would indicate an inadequate resource supply.
• Adequacy Level – this refers to providing a specific amount or level of adequacy, for example, changing the 5% threshold for the LOLP metric would change the level of adequacy provided.
June 23, 2011

4
Current Standard
• Based on probabilistic analysis• Metric used is LOLP• Metric threshold is set at 5 percent for
“physical” adequacy• Threshold for “economic” adequacy
discussed but not defined
June 23, 2011

5
Current Standard
• Five percent LOLP threshold for:– Winter energy– Winter capacity– Summer capacity
• Note: Need to officially add summer energy if we keep this methodology
June 23, 2011

6
Translation to Deterministic Metrics
• Translates the winter energy 5% LOLP into an annual load/resource balance
• This becomes the threshold for the L/R balance• Translates the winter and summer 5% LOLPs into
surplus sustained-peak capability (referred to as the planning reserve margin or PRM)
• These become the thresholds for winter and summer PRM
June 23, 2011
7
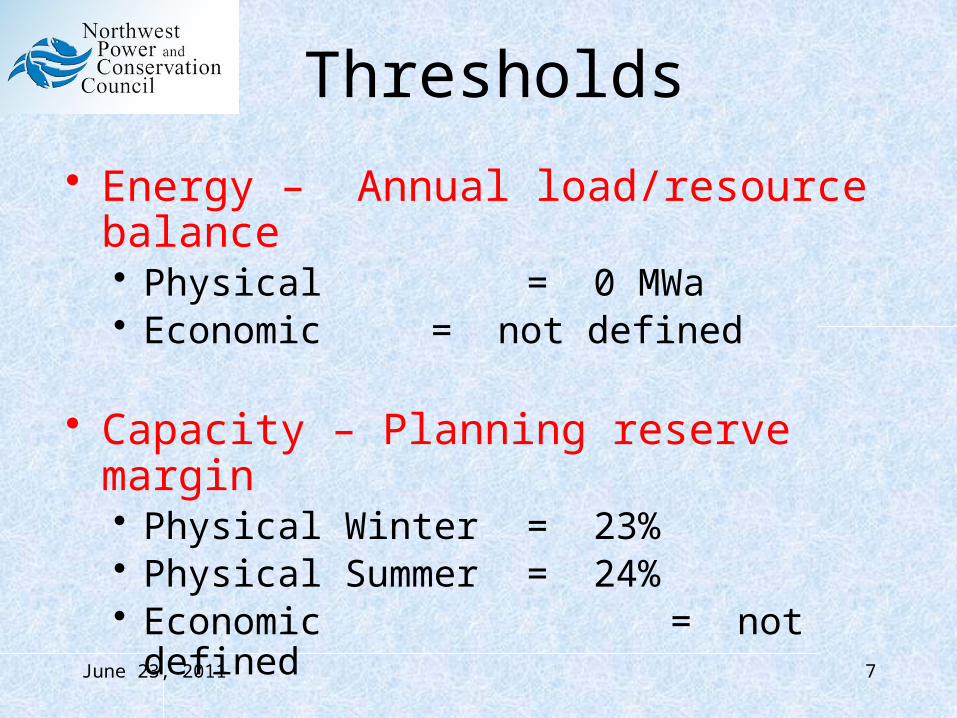
Thresholds
• Energy – Annual load/resource balance• Physical = 0 MWa• Economic = not defined
• Capacity – Planning reserve margin• Physical Winter = 23%• Physical Summer = 24%• Economic = not defined
June 23, 2011

8
Current Energy AssumptionsOut-of-region market (est. from analysis)
• About 200 MWa per yearNon-firm hydro (est. from analysis)
• About 1,100 MWa per yearUncommitted IPPs
• Dispatched as regional resources at market prices and limited by capacity assumptions
Wind• 30 percent of nameplate annually
June 23, 2011
9
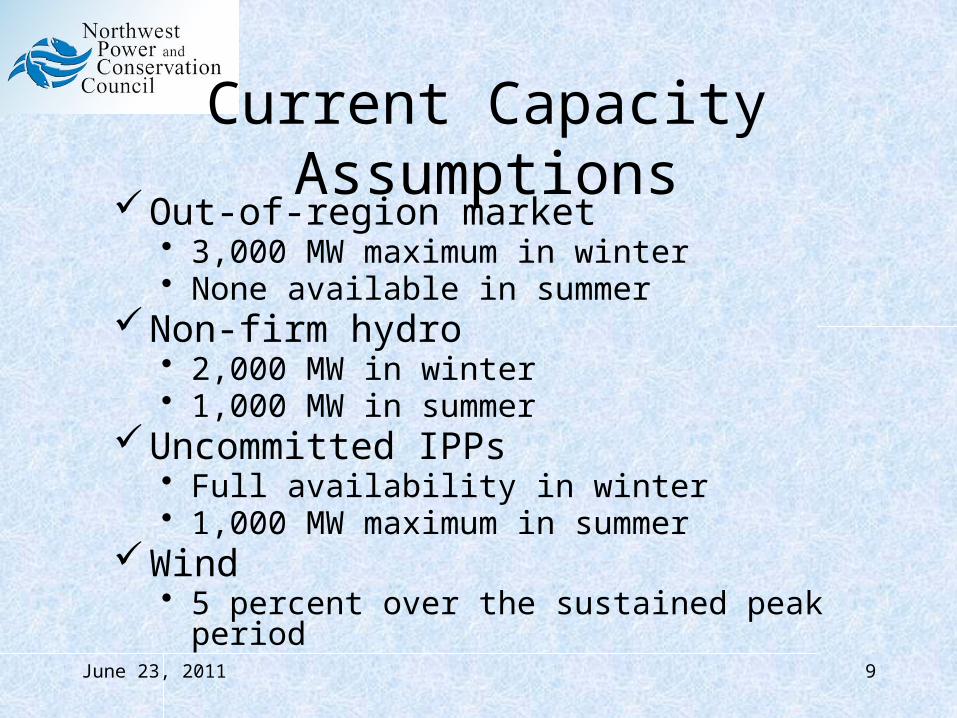
Current Capacity AssumptionsOut-of-region market
• 3,000 MW maximum in winter• None available in summer
Non-firm hydro• 2,000 MW in winter• 1,000 MW in summer
Uncommitted IPPs• Full availability in winter• 1,000 MW maximum in summer
Wind• 5 percent over the sustained peak period
June 23, 2011

10
Methodology Review
June 23, 2011

Primary Purposes of Review
1. Critique the region’s current adequacy assessment methodology
2. Provide an alternative method, if appropriate
3. Suggest ways to incorporate the adequacy measure into our long-term resource planning tools
11June 23, 2011

Critique of Current Method• Generally OK, similar methods are used by many other
regions and countries• Only looks at probability of curtailment• Not clear how threshold is set (currently 5%)• Better if magnitude of curtailment could also be
incorporated• Assessing adequacy separately for energy and capacity
needs is appropriate • But, no need to separate winter and summer periods, i.e.
assess for entire year • Using deterministic metrics is awkward and not needed
12June 23, 2011

Proposed Alternative• Conditional Value at Risk (CVaR)
– The average magnitude of the worst curtailment events in the simulation (say worst 5%)
– Combines probability and magnitude into one measure– Similar to the TVar90 metric used in the Regional
Portfolio Model
• Can be used alone or in conjunction with LOLP and other metrics
13June 23, 2011

CVaR vs. LOLP
CVaR = Avg of 5% worst curtailments (before CR)CVaR = 2400 MW
LOLP = % above 2000 MW thresholdLOLP = 3.3%
14June 23, 2011

One Method of IncorporatingAdequacy into Planning Models
1. Start with a system that is just barely adequate
2. Calculate deterministic measures– Annual load/resource balance – Winter and summer planning reserve margin
3. Values for the “just adequate” case become the minimum adequacy limits
4. Make sure minimum adequacy limits are not violated in planning models
5. We are currently doing this with RPM for the energy metric
15June 23, 2011

An alternative Method
1. Start with a system that is just barely adequate
2. Calculate the CVaR value(s)
3. Make sure the CVaR values are not violated in planning models
4. We are examining ways to do this in the RPM
16June 23, 2011

A simple example of Adequacy Metrics
100 Game simulation system with thermal and hydro
17June 23, 2011

CR1, CR2, CR3 are Contingency Resources
Result: No curtailment but had to use some contingency resources18June 23, 2011

Curtailment
Result: Curtailment after using all contingency resources19June 23, 2011

Curtailment HistogramFirst Few Games
01-
200
201-
400
401-
600
601-
800
801-
1000
0
2
4
6
8
10
Range of Curtailment
Num
ber
of T
imes
20June 23, 2011

Curtailment Histogram100 Games
01-
200
201-
400
401-
600
601-
800
801-
1000
0
10
20
30
40
50
60
70
80
67
149
5 3 2
Range of Curtailment
Num
ber
of T
imes
Used for CVaR Calculation (worst 5%)
Used for LOLPCalculation
21June 23, 2011

Indicates physical limiti.e. keep the lights on
Indicates economic concerns
Keep track of Contingency Resource Use
22June 23, 2011

Summary for Simple Example• LOLP = 33%
(current limit is 5%)• Contingency resources are used a lot
– CR 1 = 87%– CR 2 = 78%– CR 3 = 62%
• Very inadequate supply
23June 23, 2011

24
Options for a New Standard
June 23, 2011

25
Options
1. No change to the standard
2. No change but add a metric to measure the curtailment size and a metric to measure the use of contingency resources (CR)
3. Same as option 2 but replace LOLP with a different metric – does not change the adequacy level
4. Change the adequacy level based on CR dispatch– Define an adequate supply as one in which the likelihood of
CR dispatch is within acceptable levels– Change the LOLP threshold according to provision a) above – Add a metric to measure the size of potential problems.
June 23, 2011

Defining Tolerance for CR Use
Resource Description Tolerance for Use
Firm Hydro and Thermal
From lowest to highest operating cost OK, normal operations
Non-firm In-region and out-of-region markets, surplus hydro, borrowed hydro
OK, normal operations
Contingency 1 Non-declared utility resources (diesel generators, etc.)
Once every 10 years?
Contingency 2 Buy-back provisions on load Once every 10 years?
Contingency 3 More expensive non-declared resources or contract provisions
Once every 15 years?
Emergency Action 1
Governor’s call for conservation Once every 20 years?
Emergency Action 2
Rolling black outs or brown outs Once every 30 years?
26June 23, 2011

Viable Options
• Options 1 and 3 should not be considered
• That leaves options 2 and 4– Option 2 keeps the adequacy level the same– Option 4 changes the adequacy level
27June 23, 2011

28
Option 2
• Keep the 5% LOLP threshold• Calculate key CR dispatch probabilities• Calculate CVaR metric values• CR dispatch and CVaR values are just
additional information – they are not considered in determining the adequacy of the power supply
June 23, 2011

29
Option 4• Calculate dispatch probability for a key CR • Set a threshold for that probability based on
utility experience and/or contractual obligations• Use a system that just meets the CR dispatch
probability threshold to calculate LOLP• That value for LOLP replaces the 5% LOLP
used in the current standard• Calculate CVaR metric value as additional info
June 23, 2011

30
Key Questions
• Should the level of adequacy be changed?• What metric will be used to measure
adequacy?• How will the threshold for that metric be set?• What other information should be provided?
June 23, 2011

31
Other Considerations
• Should we use an annual metric (eliminate the winter and summer assessments)?
• Should we keep the energy and capacity assessments? • Should we base the energy assessment on total annual
curtailment or on worst-event?• Should we base the capacity assessment on single hour
or sustained peak?• Should we keep the deterministic metrics as a part of the
standard?
June 23, 2011

Next Steps• Summer 2011 – Tech Committee
Review options for a new standard Propose a revised adequacy standard
• Late Summer 2011 Steering Committee approval
• Fall 2011 Present new standard to Council Release for public comment
• Winter 2011 Council adoption of new standard
32June 23, 2011