rr-450 - highway construction management › documents › mdot › rr450con_8... · identified and...
TRANSCRIPT

HIGHWAY CONSTRUCTION
MANAGEMENT
FINAL REPORT
ON A RESEARCH PROJECT
CONDUCTED JOINU Y
by the
MICHIGAN DEPARTMENT OF STATE
HIGHWAYS AND TRANSPORTATION State Highways Building
Post Office Box 30050
Lansing, Michigan 48904
and
ROY JORGENSEN ASSOCIATES, INC. Engineering and Management Consultants
Post Office Box 575, Gaithersburg, Maryland 20760
June 1976

ROY JORGENSEN ASSOCIATES, INC.
June 24, 1976
Mr. Gerald J. McCarthy Deputy Director, Michigan Department of
State Highways and Transportation State Highways Building 425 West Ottawa Post Office Box 30050 Lansing, Michigan 48904
Dear Mr. McCarthy:
POST OffiCE BOX 575 GAITHERSBURG, MARYLAND 20760
PHONE: 301/9.48-8190 CABLE: JORGENSEN WASHINGTON D C
We fullx concur in your decision to write this report for top management officials rather than technical specialists. The research was unusually thorough. The results can be, most surely will be, significant to many agencies, with special reference to state transportation and highway departments.
We tried to write the report for easy reading--short, and free from ponderous language. Despite the quantities of data available, we deliberately limited charts and tables to those that make essential points rather than to document the research. Documentation is available to anyone who asks. ·
We also agree that this is a joint report. The project was uniquely successful {as demonstrated by the fact that implementation of the construction management system statewide was well under way before this report was written) because it was carried out jointly by your organization and ours. This summary of the research and its results must, therefore, be a joint effort as well. We particularly appreciate the guidance and reviews obtained from you and your staff.
ctc:~~~.J M. Ed Shaw Director, Mqnpower and
Training Division

, I
PREFACE
The Michigan Deportment of State Highways and Transportation mode excellent
progress toward reducing construction engineering costs during the years 1967 through
1971. Manpower charges, which represent roughly 85 percent of all construction engi
neering costs, were decreased approximately 12 percent despite a 23-percent increase in
the work load (as measured in 1967 dollars). The two changes hod the effect of cutting
construction engineering costs by 29 percent.
Costs still ranged from 8 to 16 percent of contractor payments, averaging 13.
Since the Federal Highway Administration participates only to the extent of 10 percent,
there was need to do one of three things:
• cut costs to the Federal participation level; or
• document the higher costs and move for increased Federal participation; or
<11 accept the Federal rote and pay all additional costs with State funds.
The Deportment elected to solve the problem through controlled research. , The sys
tems approach hod worked well in bringing about preconstruction and maintenance man
agement improvements; it would now be oppl ied to construction.
The project was financed with Highway Planning Research funds under Federal High
way Administration Contract Number 97614 and Department of State Highways and Trans
portation Contract Number 71-0667. Research and development work was initiated in
1971, and completed in 1975.
The construction management system developed through the research is simple, easy
to administer. Its development was complex-but the presentation in this report is de
signed to provide an easy-to-follow synthesis. The first chapter is directed toward the
need for a management system, and the criteria to be met. Each major component of the
final system is then discussed in a separate chapter. Considerations relative to managing
the system are discussed in Chapter Six.

TABLE OF CONTENTS
FOREWORD ooooeeoooeoooooooooooooooo
SUMMARY •••••.•
Chapter One-DEFINING NEED AND CRITERIA
Objectives Defined Costs Documentation for the Objectives Variables Involved System Criteria Summary
Chapter Two-ESTABLISHING THE WORK BASE •.••..•.••
Types of Work Quanti ties of Work Work Load Reductions Productivity Rates Summary
Chapter Three-ESTABLISHING THE PERSONNEL BASE
Capabi I ity Reguirements Levels of Performance Difficulty Personnel Classification Summary
. " . .. .. . .
vii
1 2 4 6
11 12
13
13 15 20 21 24
25
25 28 30 37

... ,.~-·-··-·- "-····-.-
TABLE OF CONTENTS
(Continued)
Chapter Four-MANAGING MANPOWER IN SEASON . . . . . . . 39
Estimating Manpower Needs 39 Adopting Work Schedules 44 Controlling Manpower Utilization 49 Summary 52
Chapter Five-MANAGING MANPOWER YEAR-ROUND
Establishing the Year-Round Force Providing Off-Season Assignments Providing Seasonal Personnel Providing Training Summary
Chapter Six-MANAGING THE SYSTEM
Effects on Management Work Loads Implementation Results Summary
Appendices • .
Appendix A: ACTIVITIES AGAINST WHICH PILOT PROJECTS
55
55 57 61 62 64
67
67 71 72 74
75
CHARGED TIME 75
Appendix B: ABILITY-STATEMENT TITLES 81
Appendix C: PERSONNEL CLASS SPECIFICATIONS
AppendixD: TASKS RANKED BY LEVELS OF PERFORMANCE DIFFICULTY
Appendix E: MANPOWER NEEDS WORK SHEET
Appendix F: DEPARTMENT OFFICIALS DIRECTLY ENGAGED ON THE RESEARCH PROJECT
85
95
101
103
. '
.

FOREWORD
References to who did what in connection with this undertaking are omitted from
the text. Their inclusion, even as footnotes, would unnecessarily campi icate the reading.
Since they are important to understanding why the project was so successful, they are in
cluded here.
Project Organization
This project was carried out as a joint effort of the Department and the Consultant,
as indicated in the organization chart on the next page. (Names and titles of individuals
are included in Appendix F, starting on page 103.)
Deputy-Director-Bureau of Highways
The Deputy Director of Transportation heads up the Bureau of Highways. The Bu
reau consists of eight divisions: Construction, Design, Maintenance, Right-of-Way,
Testing and Research, Traffic and Safety, Route Location and Local Government.
The Deputy Director initiated this project, and served as Project Coordinator and
Chairman of the Advisory Committee. He ensured access to useful data, field testing of
models, adoption of work methods and other improvements, and prompt reviews of rec~
ommendations. He kept things going at the top-management level.
Advisory Committee
The Advisory Committee made recommendations to the Deputy Director, and pro
vided guidance to the project staff. It reviewed and approved all parts of the
TRANSPORTATION LIBRAI'f'f, MICHIGANI>EPT.STATEHlGHWAYSa - i-TRANSPORTATION LANSING, MICH. -

PROJECT ORGANIZATION
Director, Department of State Highways and Transportation
Federal Highway ~- ----- Deputy Director-Bureau of Highways ------- Roy Jorgensen
Administration (Project Coordinator) Associates, Inc.
Construe lion Advisory Committee - ----- fl Deputy Director-Chairman ----------------l Engineer .. lv\anagement Officials I
: Field Project Coordinator I .. I
I I I
District Engineers Task Force Committee- I
f--and Staff System Elements ----- Research Project Staff
Department and
Work Methods ----- Jorgensen Personnel
Improvement Committee
-Laboratory-3 Interstate Construction Projects
Construction lv\anagement Consultant Supervision Research Project
---Pilot Group- Department and Jorgensen
26 Construction Projects Department Supervision
~-
·.;;;::

construction management system: the work base, the personnel classification base, pro
ductivity standards, staffing standards; and manpower management practices, together
with policies and procedures.
The Advisory Committee consisted of the Deputy Director and management officials
having vested interests in final results: a representative of the Bureau of Administration,
the Assistant Deputy Director, the Construction Engineer, the Personnel Officer, the
District Engineer in Jackson, a representative of the Michigan Division of the Federal
Highway Administration, and the Assistant District Construction Engineer, Grand Rapids.
(The Assistant District Construction Engineer at Grand Rapids also served as Field Proj
ect Coordinator-Assistant to the Deputy Director for Departmental supervision of the re
search.)
Research Project Staff
The project staff identified data needs, designed data collections, analyzed find
ings, developed model components of the management system, tested those components,
and developed the final system. It worked closely with the Advisory Committee, the
Work Methods Improvement Commit tee and the various task force commit tees appointed to
deal with individual components.
The "immediate project staff" included Department and Jorgensen personnel specif
ically assigned to carrying out the research and development work. The project manager,
a Jorgensen engineer, and the Field Project Coordinator, a Department engineer, had on
site responsibility. Senior Jorgensen personnel provided guidance based on experience in
olher states. Senior Department officials provided guidance based on Department objec
tives, authority, policies and practices.
The "expanded project staff" included officials and personnel of the Grand Rapids
District-all of whom contributed consistently.
- iii -

Task Force Committee
The Task Force Committee derived its name from the way members are appointed.
Certain members were permanent; others served on short-term bases to participate in mat
ters to which they could contribute specialized expertise.
This committee was active in nearly every phase of research and development. It
identified and classified (1) contractor operations, (2) construction engineering activi
ties, and (3) the knowledge, skills and abilities required by construction engineering
personnel to perform the work well. It ranked activities by levels of difficulty, identi
fied potential work methods improvements, and defined typical staffing and documenta
tion requirements. The committee also assisted in system design, including development
of standard units of measure, productivity rates, and manpower utilization controls.
Work Methods Improvement Committee
The Work Methods Improvement Committee concentrated on making changes in the
ways construction engineering work is done. Each change had to meet two criteria: it
had to be acceptable from a construction quality control standpoint, and it had to reduce
manpower needs. Suggestions for changes were submitted by the project staff, by mem
bers of the committee, and by interested employees.
The Work Methods Improvement Committee has been made a permanent part of the
Department organization. Its members, all operating experts in their respective fields,
represent the Construction, Design, and Testing and Research Divisions.
Research Laboratory
Engineers and employees assigned to projects used for research made consistent
contributions to the research.
- iv -
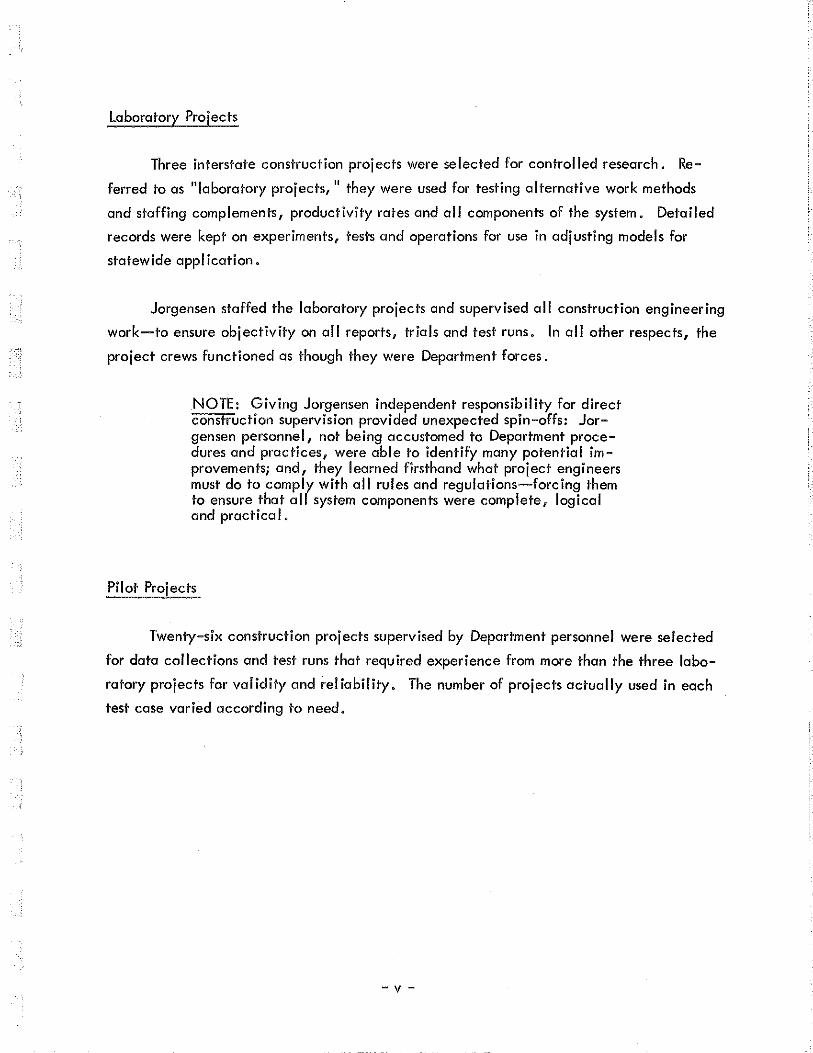
Laboratory Projects
Three interstate construction projects were selected for controlled research. Re
ferred to as "laboratory projects," they were used for testing alternative work methods
and staffing complements, productivity rates and all components of the system. Detailed
records were kept on experiments, tests and operations for use in adjusting models for
statewide application.
Jorgensen staffed the laboratory projects and supervised all construction engineering
work-to ensure objectivity on all reports, trials and test runs. In all other respects, the
project crews functioned as though they were Department forces.
NOTE: Giving Jorgensen independent responsibility for direct construction supervision provided unexpected spin-offs: Jorgensen personnel, not being accustomed to Department procedures and practices, were able to identify many potential improvements; and, they learned firsthand what project engineers must do to compl{ with all rules and regulations-forcing them to ensure that al system components were complete, logical and practical.
Pilot Projects
Twenty-six construction projects supervised by Department personnel were selected
for data collections and test runs that required experience from more than the three labo
ratory projects for validity and reliability. The number of projects actually used in each
test case varied according to need.
- v-
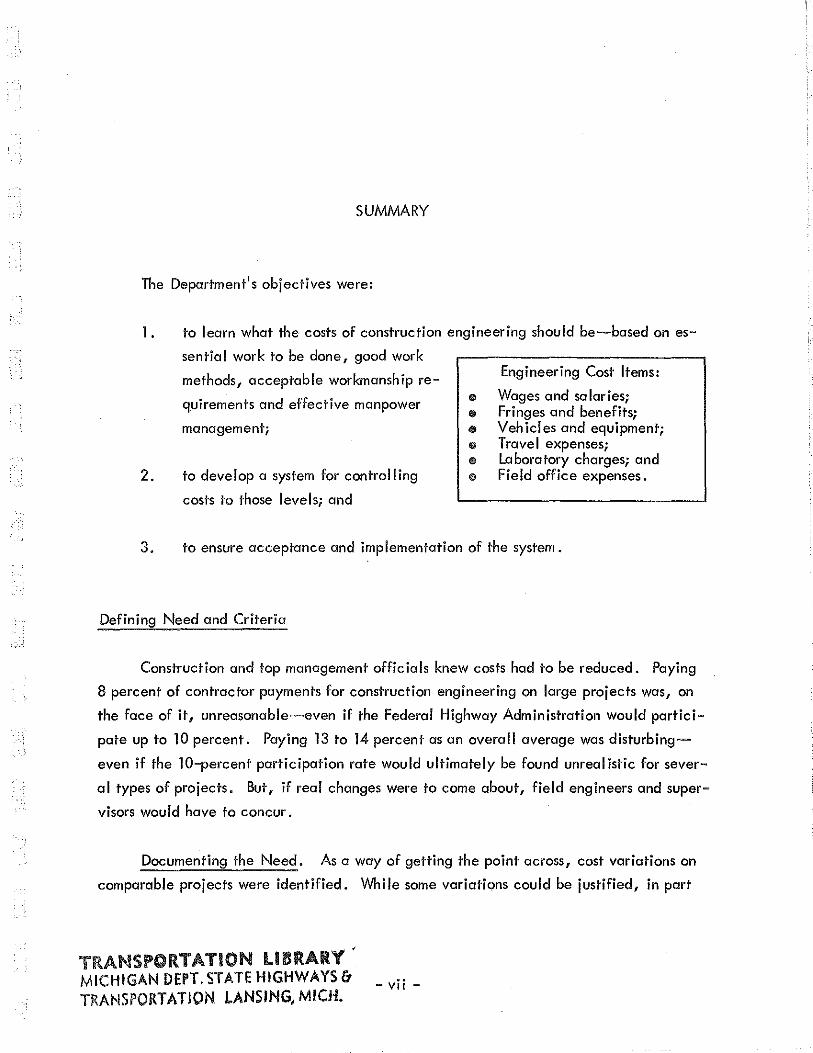
SUMMARY
The Department's objectives were:
1. to learn what the costs of construction engineering should be-based on es
sential work to be done, good work
2.
methods, acceptable workmanship re
quirements and effective manpower
management;
to develop a system for controlling
costs to those levels; and
Engineering Cost Items:
e Wages and salaries; 111 Fringes and benefits; • Vehicles and equipment; e T rave I expenses; o Laboratory charges; and e Field office expenses.
3. to ensure acceptance and implementation of the system.
Defining Need and Criteria
Construction and top management officials knew costs had to be reduced. Paying
8 percent of contractor payments for construction engineering on large projects was, on
the face of it, unreasonable-even if the Federal Highway Administration would partici
pate up to 10 percent. Paying 13 to 14 percent as an overall average was disturbing
even if the 10-percenf· participation rate would ultimately be found unrealistic for sever
al types of projects. But, if real changes were to come about, field engineers and super
visors would have to concur.
Documenting the Need. As a way of getting the point across, cost variations on
comparable projects were identified. While some variations could be justified, in part
TRANSPORTATION LIBRARY' MICHIGAN DEPT. STATE HIGHWAYS & TRANSPORTATION LANSING, MICH.
-vii -

at least, by differences in record-keeping, work
load fluctuations, contractor performance, weath
er conditions, traffic volumes or other circum
stances, the disparities found were too wide for
acceptance by anyone.
The need for a system was clear.
Defining the Criteria. Major justifica
tions for cost variations were used as bases for
defining criteria to be met by the system. It had
to be a construction management system-not de
pendent on other functions (except for off-season
utilization of key personnel) and not dependent
on changes in contractor behavior.
Establishing the Work Base
*
Man-Hours Used Per $10,000 in Contractor Payments:
Project Group A*- 67 Project Group B 90 Project Group C 120 Project Group D 215
Each group included six projects.
System Criteria:
e No changes in planning, programming or design functions;
41 No changes in contractor operations;
41 Costs to be controlled; and
e System to be simple, practical, accepted and supported.
Management systems are designed to get work done-making the work itself the
base of it all.
Identifying Key Activities. Personnel
can charge time to 261 identifiable activities.
Of these, 33 represent about 80 percent of all
direct-work charges. Since manpower represents
nearly 85 percent of all construction engineer
ing costs, the Department could, in effect, con
trol costs simply by controlling 15 percent of
33 Key Activities Represent 80% of the Work Done
..---100% of Activities---~.
the activities. 100% of Work load ----l
Measuring Work loads. If charges to 33 activities were to be controlled, manpower
required to carry out those activities had to be known in advance-planned for, budgeted
-viii -

and provided. Manpower utilization had to
be evaluated in terms of planned utilization
after work was dane.
The 33 work loads were identified,
Wark Measurement Units:
Structure staking- Span lane Earthwork- IO,OOOc.y Bituminous paving- 1,000 tons Concrete paving- 1,000 s.y.
using such readily available values as cubic yards, square yards and tons.
Reducing Work Loads. The 33 key work loads being 80 percent of the base, it
was critical that they represent essential work only, rather than unnecessary stakes, tests,
reports or copies of reports-and never make-work. By cutting back to actual needs on
these activities, the Department could cut back on manpower needs.
Establishing Productivity Rates. Key
work loads must be translated into manpower
needs. While various productivity values can
be used to do this, the simplest and most ef
fective-since manpower rather than equip
ment represents most costs-is man-hours per
work unit.
Steps were taken first to identify cur-
...
...
...
Productivity Rates
Unit of Work
I 0, 000 c. y. earthwork
1,000 tons bituminous paving
1,000 s.y. concrete paving
m -h = man -hours
Rate
12 m-h
20 m-h
6 m-h
rent productivity rates, and then to improve them. Major improvements were attributable
to using proper crew sizes and to reducing stand-by time-whether stand-by time is
charged as stand-by or as office engineering, surveying or inspection.
Establishing the Personnel Base
Inasmuch as work loads and productivity rates must be used to determine manpower
needs, a man-hour of work must represent a certain quantity of work-on the average.
Just as important, a man-hour of time must represent usable time-which can be a prob
lem if the employees have specialized and work loads fluctuate for their specialties.
Employee versatility is a major factor in reducing stand-by time.
- ix -

Evaluating the Existing Classification Plan. While reliable productivity rates are
indispensable to any system of this kind, the
existing personnel classification plan was de-
signed for personnel management-not manpower
management-purposes. It was, in effect,
counterproductive to construction engineering
cost control in that it supported employee spe
cialization rather than versatility-thereby in
creasing stand-by time.
Existing Classification Plan:
Et 14 subprofess ion a I classes;
e Emphasis on employee specialization;
e Based largely on education and experience criteria, plus written tests; and
o Promotions as openings occur.
Designing a New Classification Plan. Analysis of all tasks performed by construc
tion personnel revealed that 78 combinations of knowledge, skills and abilities are re
quired to do the work, These fall into four levels New Classification Plan:
of performance c;lifficulty as far as staking, in
specting and office engineering are concerned,
plus one for assistant project management.
The new plan, based on demonstrated per
formance capabilities, meets all personnel man
agement requirements plus the need to translate
man-hours into average productivity rates.
Managing Manpower In Season
e 5 subprofessiona I classes;
e Emphasis on versatility;
e Based on demonstrated performance capabilities; and
e Promotions to third level as employees qualify.
At this point, the system consisted of the work base and the personnel base. In
season manpower management techniques were required.
Estimating Manpower Needs. Given work load quantities and productivity rates
for 80 percent of the work to be done,
manpower needs can be co leu Ia ted for
any project from start to finish. Major
projects run for two to three years,
making it necessary to estimate con
tractor progress (using the same work
load measures) in one-year increments.
Determining Manpower Needs
Work Load Productivity Manpower Quantity Rate Needs
«& 600,000 c.y. 12 m-h/10,000 720 m-h
e 80,000 tons 20 m-h/1 ,000 1,600 m-h
-x-

Staffing single projects leads to extensive stand-by time; week-to-week work load
fluctuations can be severe. Combining three or more large projects or several of varying
size within a commuting area levels peaks and valleys a great deal-enough so that a few
short-term shifts of personnel between project groups are enough to control stand-by time.
(Department project engineers are responsible for several construction projects.) So,
manpower needs are estimated for groups of contiguous or nearby projects and adjusted at
the district levels to avoid overstaffing.
Checking Manpower Estimates. Needs
estimates are checked three ways:
against total needs for district
wide work loads;
against established guide I ines to
staffing; and
Established Guidelines to Staffing:
StakingInspecting-Office engineeringLeave-taking-
19% 40% 30% I I% ---
100%
Guidelines vary by project type.
against start-to-finish values for each project.
Establishing Shift Schedules, Staking, office engineering and considerable
amounts of inspecting can be carried out on
eight-hour, five-day work schedules. Most con
tractors work more than eight hours per day and
many work more than five days per week, making
it necessary to tailor-make some shifts. Tailoring
can best be done at the project level, using ten
®
• ®
Principal Contractor Shifts:
8.5 hours or more per shift- 81%
I shift per day- 100%
6 shifts per week- 37%
and eight-hour days, five- and four-day weeks, and planned overtime to find the best
combination o
Straight eight-hour days lead to excessive overtime or excessive stand-by time 0
Overtime, since time-and-one-half rates cost the Department only 20 percent more than
straight time, can reduce costs.
-xi -
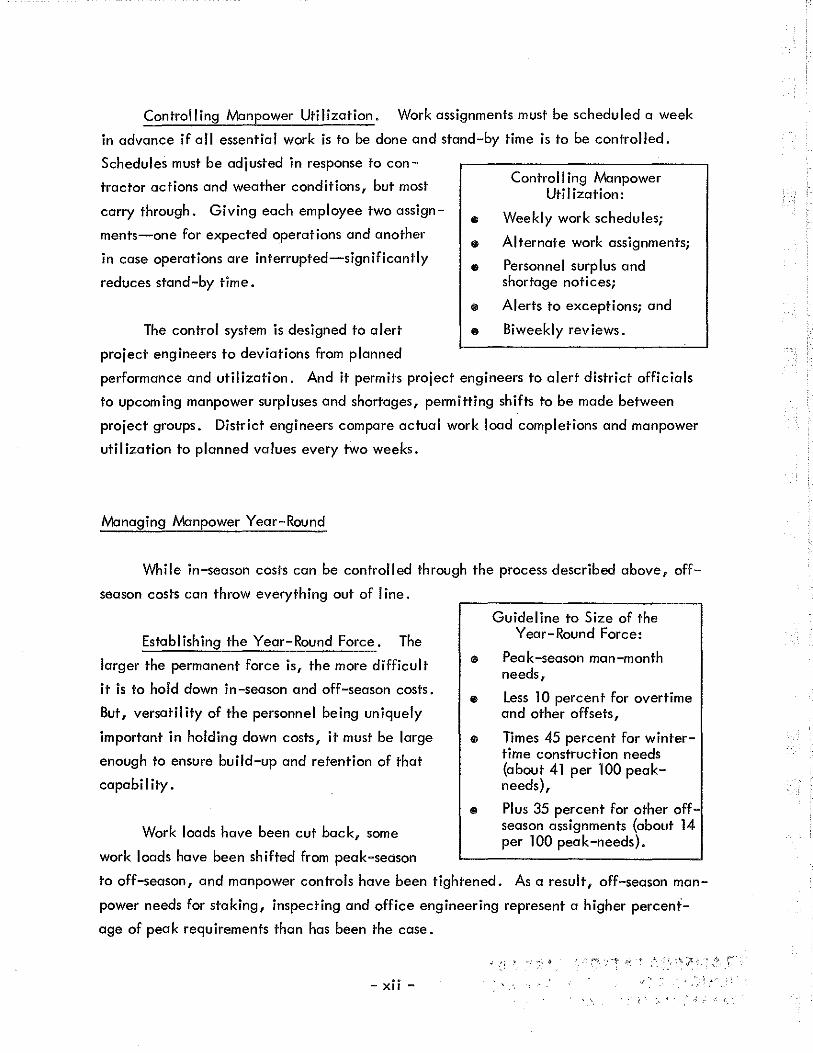
Controlling Manpower Utilization. Work assignments must be scheduled a week
in advance if all essential work is to be done and stand-by time is to be controlled.
Schedules must be adjusted in response to con
tractor actions and weather conditions, but most
carry through. Giving each employee two assign
ments-one for expected operations and another
in case operations are interrupted-significantly
reduces stand-by time.
The control system is designed to alert
project engineers to deviations from planned
Control! ing Manpower Uti I ization:
• Weekly work schedules;
e& Alternate work assignments;
e Personnel surplus and shortage notices;
• Alerts to exceptions; and
e Biweekly reviews.
performance and utilization. And it permits project engineers to alert district officials
to upcoming manpower surpluses and shortages, permitting shifts to be made between
project groups. District engineers compare actual work load completions and manpower
utilization to planned values every two weeks.
Managing Manpower Year-Round
While in-season costs can be controlled through the process described above, off
season costs can throw everything out of line.
Establishing the Year- Round Force. The
larger the permanent force is, the more difficult
it is to hold down in-season and off-season costs.
But, versatility of the personnel being uniquely
important in holding down costs, it must be large
enough to ensure build-up and retention of that
capability.
Work loads have been cut back, some
work loads have been shifted from peak-season
Guideline to Size of the Year-Round Force:
e Peak-season man-month needs,
e less 10 percent for overtime and other offsets,
• Times 45 percent for wintertime construction needs (about 41 per 100 peakneeds),
111 Plus 35 percent for other offseason assignments (about 14 per 100 peak-needs).
to off-season, and manpower controls have been tightened. As a result, off-season man-
power needs for staking, inspecting and office engineering represent a higher percent
age of peak requirements than has been the case.
- xii --1·, ".\

The Department is aiming for 650 year-round employees-as compared with 968 in
1974 and 1,435 in 1967. The reduction will be achieved through attrition-as training
increases versatility. The peak work force was 1,196 in 1974 compared with 1,575 in
1967-despite a 23-percent increase in actual work loads. The number of peak-season
employees wi II vary to fit the actual needs defined by the system.
Establishing Off-Season Assignments. Due primarily to the versatility require
ment, but also to early- and late-season needs, the year-round force must be larger
than the minimum winter requirement. The Department reassigns surplus personnel to
other functions during the off-season. Work loads are scheduled to accommodate these
personnel and keep them fully productive.
Providing Versatile Seasonal Personnel. To keep the year-round force as small as
possible, steps are being taken to increase the versatility of seasonal personnel.
Arrangements have been, and are being, made with engineering schools sa that
students can attend school for six months and work for six months. Schedules are based
on the construction season.
Quick training courses that can be administered at project offices will be provided.
Managing the System
The system is complete, and is being implemented statewide. What does it take
to manage it?
Collecting Essential Data. The 33 work load values are readily available from
contract plans and project records. Productivity standards are known. Personnel classi
fications have been established. No new data are required.
Planning for Project Period. A total project manpower plan is developed in the
central office, as soon as contract quantities are known, usually shortly after advertising
and before letting. The plan includes estimated man-hours by activity and skill level.
TRANSPORTATION LIBRARY MICHIGAN I)EPT. STATE HIGHWAYS & TRANSPORTATION LM~SING, MICH.
- xiii -

M:mpower requirements can be estimated as far into the future as projects can be
described in quantitative terms.
Planning for One Year at a Time. Estimating manpower needs for each construc
tion season is a short-term, slack-time effort.
Can trolling One and Two Weeks at a Time. Work and manpower schedules must
be developed and controlled weekly. Actual work load completions and manpower utili
zation must be compared with planned values every two weeks.
Implementing the System. Project engineers and district officials must be trained
relative to the system, and guided in its initial use. The only real difficulty will come
with weekly scheduling. All persons resist change, and this one represents a change in
habit-not just a concept or approach.
Evaluating Results
Implementation was just getting under way at the close of the research project.
Even so, indications of results are available.
Construction engineers statewide were
fully aware of the research under way, and
were informed of findings, model components
and other developments. Also, all engineers
Average Costs As Percentages of Con tractor Payments
All projects Interstate Secondary
1971 1975
14.0% 13.3 19. 1
10.5% 9.8
15.2
were striving to reduce costs. Results thus far are indicated in the box.
Large projects will always cost less than small ones, but the range will surely be
reduced. It is safe to aim at less than 8 percent for large projects and, say, 12 for most
small ones.
- xiv-

Chapter One
DEFINING NEED AND CRITERIA
Construction management officials have long recognized the need to keep engi
neering costs from being unreasonable. In evaluating requests for additional personnel,
they have also recognized that many variables, most of which appeared unpredictable,
affect manpower needs. They needed a way to: (1) determine in advance, within rea
sonable margins of error, how much it will cost to complete and document construction
surveys and inspections; (2) control costs while construction is under way; and (3) evalu
ate costs after projects have been completed-to find ways of improving the system for
upcoming projects.
This first chapter is directed toward defining research and development objectives,
supporting those objectives with research data, identifying the major variables to be con
sidered, and setting forth criteria to be met by the construction management system.
Objectives
The objectives of this project were to learn what the costs of construction engi
neering should be, develop a system that will result in those costs, and ensure accepta
bility of the system for implementation.
Costs
The costs must be based on completing all work essential to proper staking, in
specting and documenting of contractor operations. Any excess staking, sampling, test
ing, observing, recording, reporting, and even copies of reports had to be dropped.
- 1 -

The costs must also be based on goad work methods and realistic workmanship re
quirements. Unusually time-consuming methods, such as continuously observing contrac
tor operations for compliance with plans and specifications, had to be reevaluated. And,
both overdoing and underdoing of the work being expensive, workmanship requirements
had to be reviewed.
System
Once techniques were developed to identify proper engineering costs, the Depart
ment needed some way to plan and control operations so that they were not exceeded-or
were exceeded by no more than acceptable amounts.
The costs were expected to vary by project type, contractor performance, and other
influences. In fact, it was expected that one system might be required for rural freeway
projects, another for urban freeway projects, a third for primary-system projects, and so
on. (As it turned out, one system meets all these needs.) Regardless of such influences,
the system had to pay off from a planning and contrail ing standpoint.
Acceptability
From the start, design, developmenl· and testing activities had to be carried out in
such a way that the final system would be acceptable to officials and supervisors who fi
nally would be responsible for making it work. Nothing could be done during the re
search that would preclude its implementation. To the contrary, interested personnel
were to be involved in the research, or at least kept informed of progress.
Defined Costs
Construction engineering costs are expressed as percentages of contractor pay-
ments.
- 2 -

Engineering Cost Items
The Department defines construction engineering costs to include:
wages and salaries paid to construction staking, inspection, documentation
and supervisory personnel; 1/
e fringe benefits paid to those personnel;
s travel expenses and vehicle charges;
e project office rentals, equipment and supplies;
e field equipment and supplies; and
e laboratory charges attributable to quality control and post-construction eval
uations.
The Department conducts all surveys, places all stakes, takes all samples and runs
all tests. (Contractors can be charged for restaking caused by their negligence, but this
rarely is done.)
Cost Diversions
In developing the construction management system, the Department was willing to
reassign selected staking and activities from its own crews to those of the contractors
without, of course, relieving the Department of final responsibi I ity for qua I ity control.
Two conditions had to be met: (I) Quality control could not be compromised; and
(2) Total construction costs had to be reduced. (The work could not be shifted simply
to reduce the State's share of construction costs at the expense of Federal aid.)
Clearly, before any such reassignment could be made, the cost of doing the work
under an effective system 6f planning and control had to be determined.
1/ District engineers, assistant district engineers and district office personnel are excluded, as are all headquarters construction personnel.
- 3 -

Documentation for the Objectives
Construction and top management officials knew that costs were too high. Some
large projects were being completed for 8 percent of contractor payments, but the aver
age even on those was 13 percent-placing some well over 13. Knowing that costs were
too high was one thing; documenting the fact so that all concerned officials would agree
was an other.
System Averages
Engineering costs are shown by system and for the construction function as a whole
in Figure 1. 21 Figure 1
CONSTRUCTION ENGINEERING COSTS
Highway Sl::stem 1971 1972 1973 1974 1975
Interstate 13% 13% 13% 11% 10% Primary 14 14 14 12 12 Secondary 19 20 15 15 15 Urban 18 12 16 10 13 Overa II average* 14 13 13 11 10
* The overall averages reflect total contractor payments and total engineering costs-not averages of the system values shown in this table.
The data in Figure 1 show that costs on two of the systems were constant for the
first three years. They ran 13 percent for interstate and 14 for primary projects.
Engineering costs on secondary projects dropped from 19 percent in 1971 to 15 in
1973. Those on the urban system fluctuated between 10 and 18, while the overall aver
age dropped from 18 to 13.
2/ Percentages of contract costs have been used to compare costs among state highway and transportation agencies. These comparisons are invalid. Each cost rating reflects levels of service provided to contractors, methods of accounting, pay rates, expense and relocation provisions, and quality assurance programs-all of which vary from state to state.
-4-
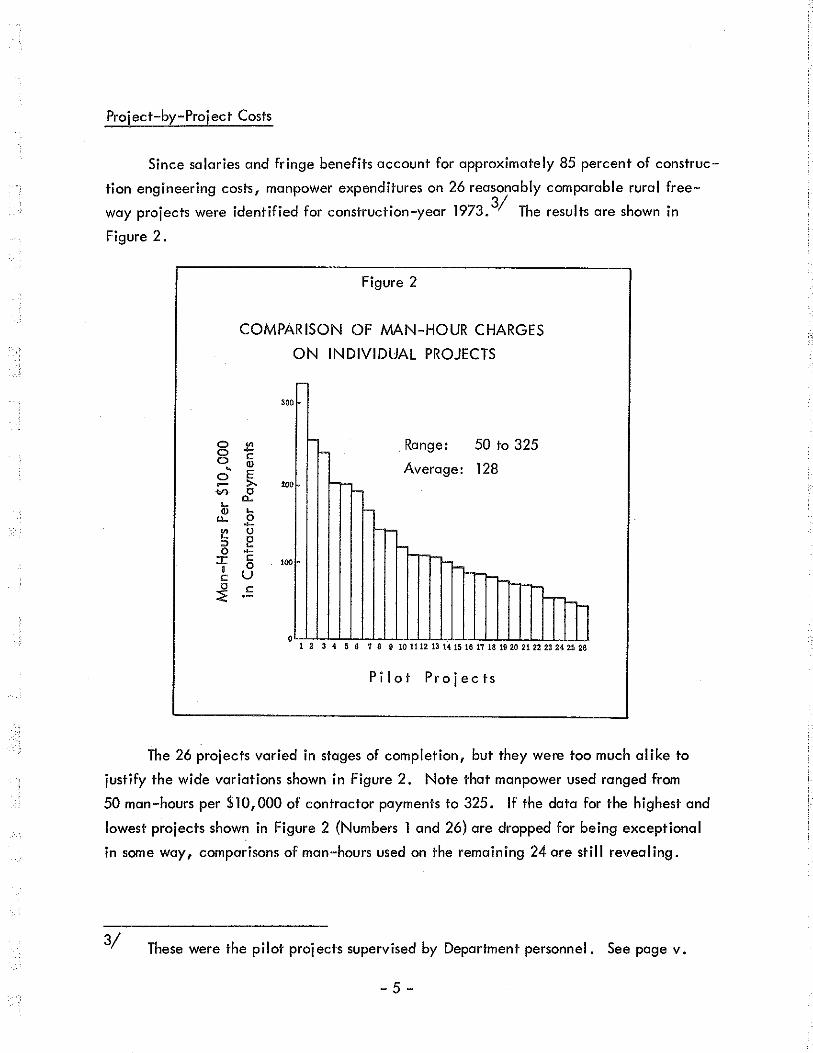
Project-by-Project Costs
Since salaries and fringe benefits account for approximately 85 percent of construc
tion engineering costs, manpower expenditures on 26 reasonably comparable rural free
way projects were identified for construction-year 1973. 3/ The results are shown in
Figure 2.
Figure 2
COMPARISON OF MAN-HOUR CHARGES
ON INDIVIDUAL PROJECTS
... 0 -~ u
"' E 0 -::r:: c I 0 c u ~ c
300
Range: 50 to 325
Average: 128 200 h-
100
l 0 ~1~2~3L<f7,~6~776L9~10~11~1~2~13~14~1~.~16L17~1~8L19~,~0~21L22~2~3L2<L2~.~28
Pi lot Projects
The 26 projects varied in stages of completion, but they were too much alike to
justify the wide variations shown in Figure 2. Note that manpower used ranged from
50 man-hours per $10,000 of contractor payments to 325. If the data for the highest and
lowest projects shown in Figure 2 (Numbers 1 and 26) are dropped for being exceptional
in some way, comparisons of man-hours used on the remaining 24 are still revealing.
3/ These were the pilot projects supervised by Department personnel. See page v.
- 5-

Figure 3
ANALYSIS OF EXPERIENCE ON 24 PILOT PROJECTS
Percent Percent Projects Average* of Total of Lowest
2 through 7 215 44% 320%
8 through 13 120 24 179
14 through 19 90 18 134
20 through 25 67 14 100
* Man-hours per $10,000 payments to contractors.
As shown in Figure 3:
The six highest projects averaged 215 man-hours per $10,000 of contractor
payments as compared with 67 for the six lowest;
The six highest projects used 44 percent of the total manpower spent on the
24 projects as compared with 14 percent for the six lowest; and
The six highest projects used 3.2 times the man-hours spent on the six
lowest.
Clearly, the Department had reason to set the objectives defined earlier in this
chapter.
Variables Involved
In trying to find reasons for wide ranges in construction engineering costs, Depart
ment engineers considered all major variables: daily weather conditions, seasonal weath
er conditions, construction work loads, traffic volumes, contractor performance, project
crew performance, and project characteristics.
-6-

Daily Weather
Contractors must shut down on bad-weather days, thereby increasing engineering
costs. But the number of such days varies only slightly over a four-year period, and the
number is quite predictable. Further, no correlation could be established between num
bers of days lost due to weather and differences in manpower usage on eleven closely
comparable projects. 4/
Season a I Weather
The length of the season can vary by severa I weeks from year to year. And there
can be differences between districts in the north and those in the south.
On the eleven projects, no relationship could be found between the length of
time for project completion and engineering costs. Project K, for example, had the
highest cost per day of contract time but only one other project had fewer calendar days.
Figure 4
CALENDAR DAYS OF
TOTAL CONSTRUCTION TIME
"Construction Season"* Contract Time
"Off Season" Contract Time
Figure 5
AVERAGE FIELD AND OFFICE
ENGINEERING COSTS PER
CALENDAR DAY OF CONSTRUCTION TIME
• . § ~ 1,000 .... 750
t 8
~ -"
0 v 0 t ~
< , z
4/
E 600 0 0 u 0 450 >-8 .!! 300
-" 150 8
B C E F H I J K Project Projech;"
A sample of over 30 completed rural freeway projects was selected for the analysis. It was later reduced to those most comparable.
-7-

While no correlation could be found between high-cost projects and short seasons
or low-cost projects and long seasons, it is clear that short seasons increase costs to some
extent-across the board.
Construction Work Loads
Work loads have fluctuated both in sizes and types of projects. Federal impound
ments and releases caused much of it, but state funding and delays in completing con
tract plans for complex projects contributed as well.
While districts reduced manpower from year to year in compliance with Depart
ment policy, they tended to retain more than needed-to protect themselves against un
known work loads. This may well have been good insurance under the circumstances:
individual employees were specialists in separate phases of the work; there was no way
to train new personnel quickly; and being caught short could cause serious proble!T\S•
But, construction engineering costs increased during cutback years.
Traffic Volumes
The need to carry heavy traffic through construction zones reduces contractor pro
ductivity and increases direct construction costs. It can affect construction engineering
the same way, and in proportion-causing no change in the cost rate.
It can have a reverse effect as well, by increasing contractor payments and de
creasing the percentage of those payments required for construction engineering.
The difference is too small to consider this variable in evaluating engineering
costs.
Contractor Performance
The vast majority of contractors are reasonably uniform from a performance and pro
ductivity standpoint. Under the bidding system, they must be competitive or go out of
business. -8-
-- -- -,~

Certain conf·ractor practices have been particularly expensive in terms of project
staffing without much apparent effect on total contractor payments. For instance, con
tractors frequently promise ta start a specific operation on a particular day, miss that
date and promise another, and miss that one as well. Promised dates on laboratory proj
ects were missed by as much as a year. Or the dates are met-with one scraper instead
of ten.
If staking is completed according to contractor promises, and if inspectors are
standing by during the delays, costs are increased sharply.
On Structure I, in Figure 6, all work was done a year behind schedule but in the
planned numbers of workdays. Inspection costs should have remained the same regard
less of the delays, unless inspectors were assigned before construction was under way.
Doubling the time to complete the substructure on Structure 3 increased inspection costs.
Figure 6
SCHEDULED AND ACTUAL PROJECT PROGRESS
Oct.
Actual Time Aug.
"- -" -., ~ June
• Apr . CJ 0 0
2 Feb. • a. E Actual Tirne 0 Dec. Dec. u ., -c 0 Oct. " Oct. £
"' ., :8 "' A11g. ~ r:::::::J ~ Aug.
CJ June
Scheduled Time June D Apr.
Scheduled Time Apr.
Substructure Steel Superstructure Substructure Steel Superstructure
Structure 1 Structure 3
-9-
Very few contractors cut corners so much that inspection costs are increased. The
few who do must be treated as special cases regardless of any staffing guidelines made
available to project engineers.
Project Personnel Performance
One project crew can include several individuals with extensive experience re
cords and high salaries. Another can be made up largely of new employees, all at the
low ends of their salary ranges. This will have some effect on costs.
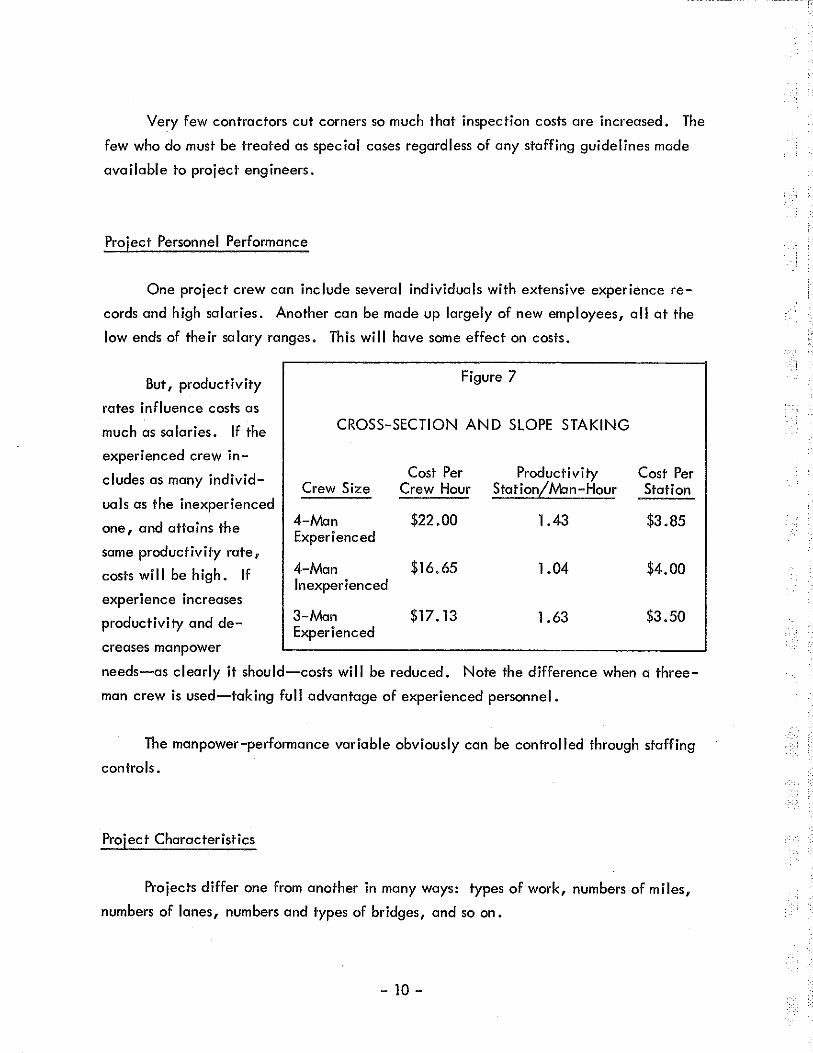
But, productivity
rates influence costs as
much as salaries. If the
experienced crew in
cludes as many individ
uals as the inexperienced
one, and attains the
same productivity rate,
costs wi II be high. If
experience increases
productivity and de-
creases manpower
Figure 7
CROSS-SECTION AND SLOPE STAKING
Cost Per Productivity Crew Size Crew Hour Stationilvlan-Hour
4-lv\an $22.00 1.43 Experienced
4-Man $16.65 1.04 Inexperienced
3-Man $17.13 1.63 Experienced
Cost Per Station
$3.85
$4.00
$3.50
needs-as clearly it should-costs will be reduced. Note the difference when a three
man crew is used-taking full advantage of experienced personnel.
The manpower-performance variable obviously can be controlled through staffing
controls.
Project Characteristics
Projects differ one from another in many ways: types of work, numbers of miles,
numbers of lanes, numbers and types of bridges, and so on.
-10-
f,-'
Eleven projects found to be similar in total construction time and cost were ana
lyzed in depth. All were completed os planned and essentially as scheduled, and all
were accepted by the Department and the Federal Highway Administration.
No correlation could be established between project characteristics and engi
neering costs. A variable that appeared to increase costs on one project seemed to de
crease them on another.
It was known, of course, that engineering costs are relatively high on small jobs
and low on large ones. Signalizing an intersection requires a great deal of inspection
time in relation to the installation cost when compared with a base, grading and surfac
ing project. This variable is so significant that projects must be classified for cost
evaluation purposes.
System Criteria
With due consideration for the experience record on one hand and variable circum
stances on the other, the Department defined criteria to be met by the construction man
agement system. It must:
l. be responsive to fluctuations in annual work programs with respect to num
bers and characteristics of projects;
2. be responsive to current contractor practices;
3. ensure completion of all construction engineering work;
4. control engineering costs overall and by project type-with exceptions for
unusually difficult contractors;
5. be simple, practical and useful at the operating levels to ensure statewide
acceptance and implementation; and
6. be fully supportable to top-management officials of the Department.
The system must be self-contained-not so interlocked with planning and program
ming, design, or contractor controls that it works only under certain conditions.
- 11 -

Summary
The Department knew the need and the major probler!Js in advance. It had reduced
construction manpower and engineering costs year by year. It could have continued the
reductions by squeezing district and project forces until understaffing clearly occurred.
The alternative was to start again, from scratch: identify the work to be done,
the manpower required to do it, and the manpower management approaches that would
get best results. This being the orderly and logical way, having the best potential for
success, the Department cho~e it.
In making the choice, the Department realized two major elements were involved:
system design and system implementation. To ensure acceptance of the final design 1 da
ta were collected to support the need. Those data made it clear to everyone that such
variations as weather conditions, annual construction programs, contractor practices and
crew-level salaries do not justify differences of 30 to 50 percent in construction engi
neering costs-much less differences of 300 percent and more.
The Department made no commitments to final system characteristics. It only had
to pass certain tests: no programming changes, no contractor changes, and no risking of
quality control, but full acceptance by operating and management officials.
- 12 -

Chapter Two
ESTABLISHING THE WORK BASE
Since work loads and their accomplishment represent the sole reason for establish
ing organizations, the work to be done is the base of every management system.
The types of work, quantities of work, and practices that most significantly affect
productivity rates are discussed in this chapter.
Types of Work
All construction engineering activities are responses to contractor operations-either
to service the contractor, ensure compliance with plans and specifications, or document
results for payment purposes, To ensure that all work done by Department personnel meets
one of these needs, activities carried out by contractors were identified first. They were
used to build an inventory of construction engineering activities.
Contractor Activities
The work done by road and bridge contractors was identified and cataloged.
Each contractor operation was described on a separate statement. Each statement
includes:
e a description of the work done;
e references to work that must be done before the contractor activity can begin;
- 13 -
e cross references to contractor activities norma fly under way at the same time;
e a list of equipment used in carrying out the activity; and
e brief descriptions of methods used by the Department to document contractor
progress and completion.
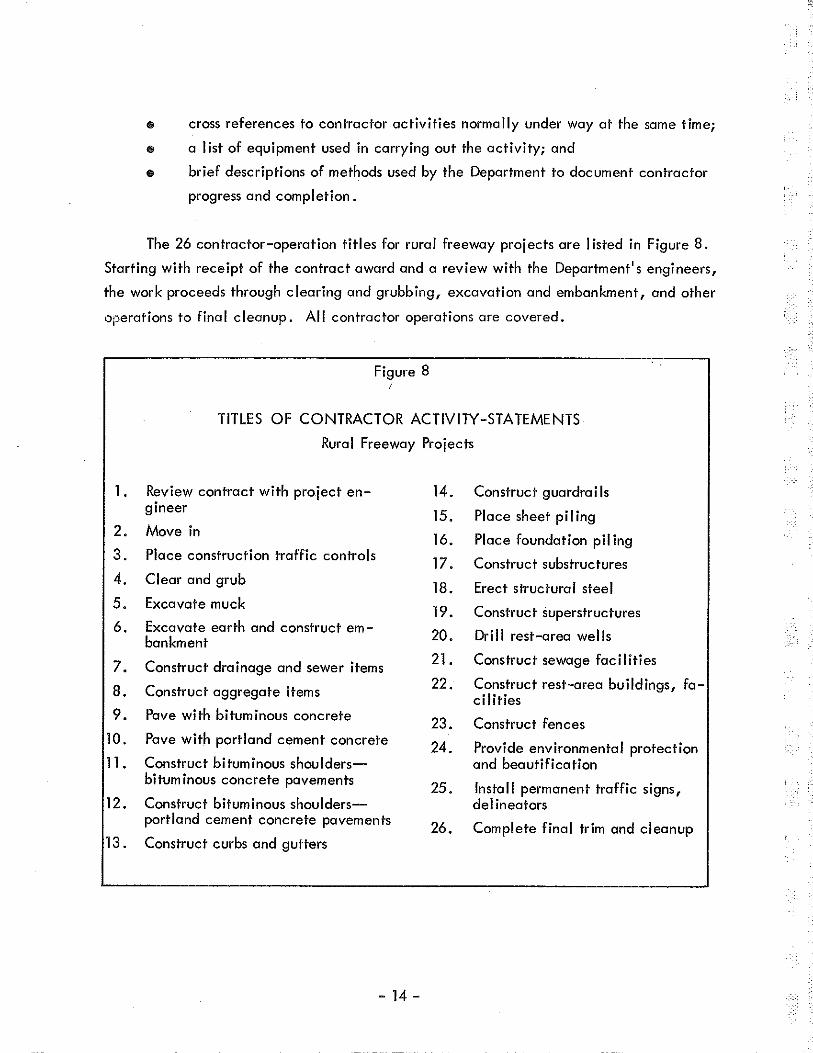
The 26 contractor-operation titles for rural freeway projects are I isted in Figure 8.
Starting with receipt of the contract award and a review with the Department's engineers,
the work proceeds through clearing and grubbing, excavation and embankment, and other
operations to final cleanup. All contractor operations are covered.
1.
2.
3.
4.
5.
6.
7.
8.
9.
10.
11.
12.
13.
Figure 8 I
TITLES OF CONTRACTOR ACTIVITY-STATEMENTS
Rural Freeway Projects
Review contract with project en- 14. Construct guardrails gineer
15. Place sheet piling Move in
16. Place foundation piling Place construction traffic controls
17. Construct substructures Clear and grub 18. Erect structural steel Excavate muck
19. Construct superstructures Excavate earth and construct em- 20. Drill rest-area wells bankment
Construct drainage and sewer items 21. Construct sewage facilities
Construct aggregate items 22. Construct rest-area buildings, fa-cilities
Pave with bituminous concrete 23. Construct fences
Pave with portland cement concrete 24. Provide environmental protection
Construct bi tum incus shoulders- and beautification bitum incus concrete pavements
25. Install permanent traffic signs, Construct bituminous shoulders- del in eaters portland cement concrete pavements
26. Complete final trim and cleanup Construct curbs and gutters
- 14 -

Engineering Activities
The work done by construction engineering forces was described in detail in a sep
arate series of statements. To ensure that the series was complete, individuals observed
work under way on different types of projects at various stages of completion. A panel
of experienced engineers then checked the entire inventory, statement by statement and
task by task. The final inventory included all staking, inspection, office engineering
and project supervision activities, plus such nonproductive time-charge items as stand-by,
hoi idays, vacations, sick leave and compensatory time off.
A typical construction engineering adivity statement, that for moisture density con
trol by mechanical methods, is shown in Figure 9. As will be noted, each work-related
statement contains a description of the work done, a list of the tasks involved, and the
documentation requirements-including the specific forms used.
The total inventory consisted of 261 statements similar to the one shown. To elim
inate unnecessary refinement of the remaining research, 144 were selected for detailed
work load analysis.
Quantities of Work
Work loads must be measured before, during and after performance-for planning,
control, and evaluation purposes. The key activities, those that represent the greater
part of the total work load, were identified through work sam piing.
Work Sampling
The 26 pilot projects were used as a sample for key-activity identification. 5/ In
dividuals on those projects reported time against the 144 activities for a full year. 6/
5/
6/ See the project organization chart, page ii.
The 144 activities, ranked according to man-hour charges, are shown in Appendix A, starting on page 75.
- 15-

Figure 9
TYPICAL ACTIVITY STATEMENT
Moisture-Density Control-Mechanical Methods
Activity Description
Moisture content is measured mechanically-by stove-drying samples or by using
a carbide moisture tester. The four main parts of mechanical density tests are (1) a
one-point proctor (T -99), (2) a one-point Michigan cone test, (3) in-place volume
measurements using volumeters, and (4) sample weighing.
Controlled-density methods are used in all embankments and backfills unless
specified to the contrary.
Tasks
Select test site Take sample Conduct moisture test + Stove dry, or + Carbide tester Conduct one-point proctor Conduct Michigan cone Measure volume
Weigh the sample Record test results Compute in-place density Retest failures Report findings-oral Report findings-written Maintain equipment
Documentation Requirements
e Draft record of results (rough copy of Form 582) e Final record of results (clean copy of Form 582) e Record of retests (Form 582A) e Record of working time, mileage and expense (Form 1187)
/. -" -:
:· f : ''. -~ . ·.-,. .-.; ~-'
- 16 - 'l.';' ' . ,_ .-.,
j--_-

More than 237,000 man-hours were reported, of which 199,000 were charged to
work-related activities. Leaves, holidays and stand-by time accounted for the remaining
hours.
Key Activities
As shown in Figure 10, 30 work-related activities represent 78 percent of the total
construction engineering work load, and 40 represent 87 percent.
Figure 10
DISTRIBUTION OF THE CONSTRUCTION ENGINEERING
WORK LOAD TO WORK-RELATED ACTIVITIES
100
..
..
..
.,
10 20 30 40 50 40 70 80 90 100 110
The Highest 110 Work-Related Engineering Activities
The work load, and costs attributable to getting it done, can be fully controlled
by controlling 30 to 40 activities. Very limited attention needs to be given to the others,
except to ensure that they are done.
TRANSPORTATION liBRARY MICHIGAN DEI"T. STATE HIGHWAYS& TRANSPORTATION LANSING, MICH._. - 17-

It may be useful to state the concept another way:
If all the man-hours spent on utility-relocation inspection had been elimi
nated, 180 man-hours would have been saved; but
A 10-percent reduction in charges to documenting excavation and embank
ment quantities-not the inspection work itself-would have reduced man
power by 2,900 man-hours.
The 33 activities listed in Figure 11 were selected for construction management pur
poses: work load measurement, work methods improvement, staffing control and, through
staffing control, engineering cost contro1. 7/ As can be seen, nine of the 33 are in the
surveying group, sixteen are inspection activities, and seven represent office engineer
ing. The final activity represents project supervision.
Units of Measure
The most important reason for identifying the key activities was to measure the
work loads attributable to them. To repeat, the loads had to be measurable before,
during, and after performance-for planning, control and evaluation purposes.
Typical work measurement units are shown in Figure 12 on page 20. Notice partic
ularly that each work load can readily be measured from data in contract plans, daily
inspection reports and final reports.
71 Work methods improvements extended beyond those on the key I ist-when individuals not on the research staff made promising suggestions, and when staff members had time to explore ways to simplify the work.
- 18 -
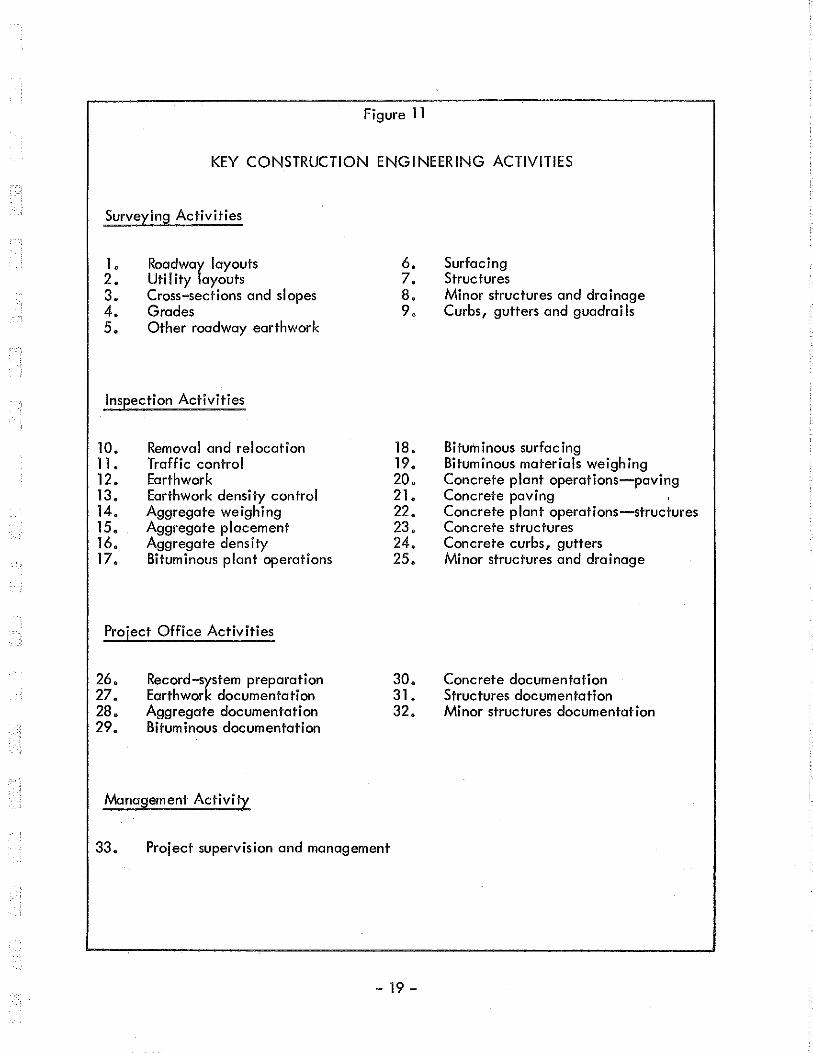
Figure 11
KEY CONSTRUCTION ENGINEERING ACTIVITIES
Surveying Activities
1. 2. 3. 4. 5.
Roadway layouts Uti! ity layouts Cross-sections and slopes Grades Other roadway earthwork
Inspection Activities
10. 11. 12. 13. 14. 15. 16. 17.
Removal and relocation Traffic control Earthwork Earthwork density control Aggregate weighing Aggregate placement Aggregate density Bituminous plant operations
Project Office Activities
26. 27. 28. 29.
Record-system preparation Earthwork documentation Aggregate documentation Bituminous documentation
Management Activity
6. 7. 8. 9.
18. 19. 20. 21. 22. 23. 24. 25.
30. 31. 32.
33. Project supervision and management
- 19 -
Surfacing Structures Minor structures and drainage Curbs, gutters and guadrails
Bituminous surfacing Bituminous materials weighing Concrete plant operations-paving Concrete paving Concrete plant operations-structures Concrete structures Concrete curbs, gutters Minor structures and drainage
Concrete documentation Structures documentation Minor structures documentation

Figure 12
TYPICAL WORK MEASUREMENT UNITS
Activity
Roadway layout staking
Structure staking
Earthwork inspection
Bituminous paving
Portland cement concrete paving
Structure inspection
Earthwork documentation (office)
Bituminous paving documentation (office)
Work Load Reductions
Unit of Measure
Roadway mile
Span lane
10,000 cubic yards
1,000 tons
1 , 000 square yards
Span lone
10,000 cubic yards
1,000 tons
Since the 33 key work loads represent approximately 80 percent of all construction
engineering work done, it was critically important that they represent essential work.
Any reductions among these 33 would reduce manpower needs. Reductions in nonkey
work loads would count as well-but not significantly.
Testing Reductions
Project engineers must decide how many samples to take and tests to run. They
must meet minimum requirements for final acceptance of their work. They must go above
the minimums as necessary to ensure contractor compliance with specifications and to
document results. But, excessive sampling and testing prevailed, with 100 to 150 per
cent over requirements being common. B/ Instructions to density inspectors implied that
as many tests as possible should be taken. Difficult contractors and troublesome opera
tions are few, nowhere near numbers indicated by nonessential work being done (coun
terproductive work, since extra samples and tests add to work loads down the line).
8/ Consistently taking 15 to 20 percent more samples than required may be justified.
- 20-

Requirement Reductions
Analysis of the requirements themselves identified several that could significantly
be reduced. Some examples:
The Department changed from one gradation test per 150 tons to one per
300 tons-cutting a key work load in half;
One bituminous-mix sample is now being sent to the materials laboratory for
every 2, 000 tons instead of one per day;
Certified stone is being accepted whenever project record tests prove the
supplier's quality-control program is good instead of conducting one test per
300 tons; and
Density inspectors are certified, reducing the need for progress-record
tests-and the travel time connected with record tests.
"Watching" Cuts
The category identified as watchings {where inspectors continuously observe con
tractor operations for compliance with plans and specifications) proved particularly prof
itable in terms of work load reductions. Changing from progress inspections to end
result specifications for selected operations reduced man-hour expenditures sharply.
Productivity Rates
Two actions most affect productivity rates: using proper crew sizes, and using
manpower only when productive work can be done.
- 21 -

Proper Crew Sizes
An extra man on a staking crew, a paving-inspection crew or a batch-plant crew
can be justified, within reasonable limits, for training purposes. Unless they ore there
to flag traffic, cut brush, or speed work in unusual areas, fourth and fifth members of
staking crews result in decreased productivity rates. A three-man crew can set more
stakes per man-hour, in most cases, than can a crew of any other size.
Extra men on earthwork, paving, batch-plant and office crews have the same ef
fect-decreased productivity rates and increased costs. Worse, they quickly become
counterproductive through make-work assignments, unnecessarily increasing work loods
in laboratories and offices.
Crew Uti! ization
Of equal importance to crew sizes is crew utilization-keeping personnel on pro
ductive assignments. Some stand-by time is unavoidable on construction, indeed on
many types of work. Assigning manpower to projects when contractor operations are not
yet under way or are closed down (except to set essential stokes or complete records) is
nonproductive. It results in zero productivity rates for the hours charged.
Productivity Standards9/
Productivity rates vary in response to many influences, such as individual capabil
ities, individual efforts, contractor production, weather conditions, terrain, traffic vol
umes and soils conditions. This is unavoidable. Yet most of the work, the vast majority
of it, goes very well, making it possible for project forces to attain reasonable levels of
productivity. More important, the rates are highly predictable-if the same work meth
ods and crew sizes are used.
9/ The term "productivity standards" is used in this report to mean either average rates or ranges of rates. Two examples: 1.5 stations per man-hour, and 3 to 4 moisture-density tests per man-hour.
- 22 -
. -,~
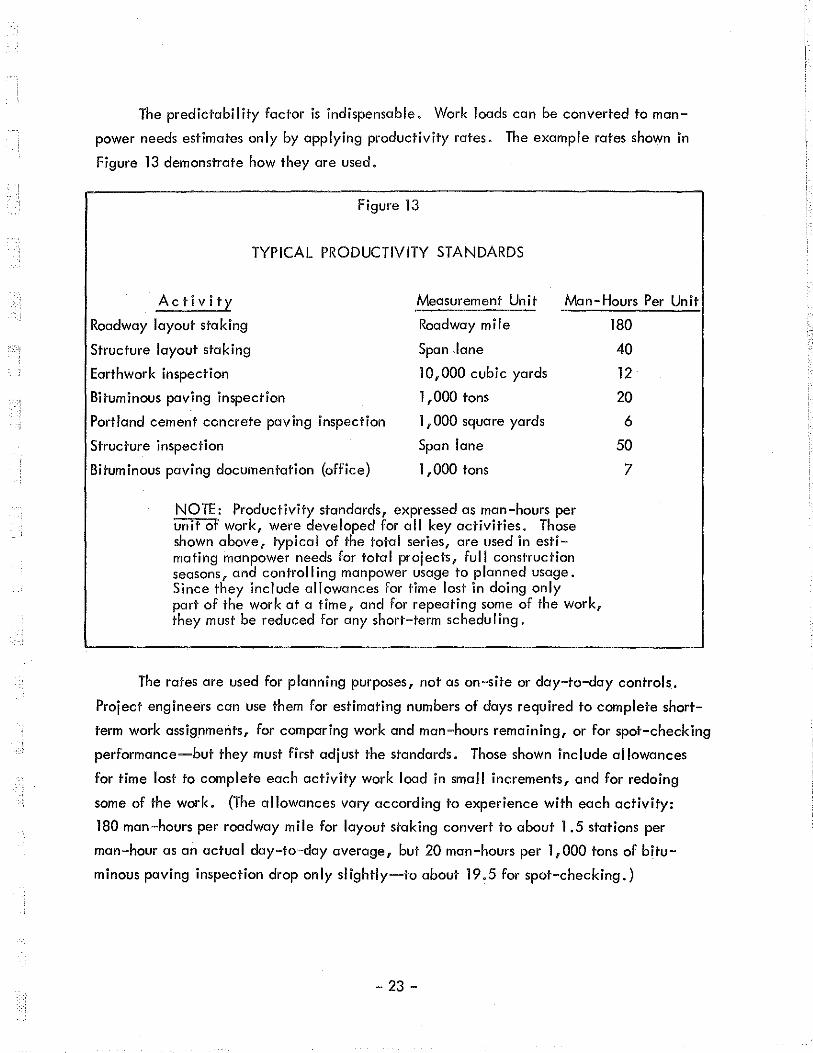
The predictability factor is indispensable. Work loads can be converted to man
power needs estimates only by applying productivity rates. The example rates shown in
Figure 13 demonstrate how they are used.
Figure 13
TYPICAL PRODUCTIVITY STANDARDS
Activity
Roadway layout staking
Structure layout staking
Earthwork inspection
Bituminous paving inspection
Measurement Unit Man-Hours Per Unit
Roadway mile 180
Span ,lane 40
10,000 cubic yards 12
Portland cement concrete paving inspection
Structure inspection
Bituminous paving documentation (office)
1,000 tons
1, 000 square yards
Span lane
1 ,000 tons
NOTE: Productivity standards, expressed as man-hours per unit of work, were developed for all key activities. Those shown above, typical of the total series, are used in estimating manpower needs for total projects, full construction seasons, and control I ing manpower usage to planned usage. Since they include allowances for time lost in doing only part of the work at a time, and for repeating some of the work, they must be reduced for any short-term scheduling.
20
6
50
7
The rates are used for planning purposes, not as on-site or day-to-day controls ..
Project engineers can use them for estimating numbers of days required to complete short
term work assignments, for comparing work and man-hours remaining, or for spot-checking
performance-but they must first adjust the standards. Those shown include allowances
for time lost to complete each activity work load in small increments, and for redoing
some of the work. (The allowances vary according to experience with each activity:
180 man-hours per roadway mile for layout staking convert to about 1.5 stations per
man-hour as an actual day-to-day average, but 20 man-hours per 1,000 tons of bitu
minous paving inspection drop only slightly-to about 19.5 for spot-checking.)
- 23-

Summary
The work itself represents the first part of any management system. In this case:
261 separate activities, including time-off and stand-by charges, were iden
tified;
less than 15 percent of them represent approximately 80 percent of the total
construction engineering work load-and 80 percent of the construction en
gineering costs;
key-activity work loads and work accomplishments can readily be measured
for manpower planning and control purposes;
key-activity work loads can be reduced, thereby reducing manpower needs;
key-productivity rates can be increased, further reducing manpower needs;
and
project engineers can control costs best through crew-size and day-to-day
work assignment controls.
Once the work-base element was complete, it was ready for integration with other
elements-such as personnel management-to create the total construction management
system.
-24-

Chapter Three
ESTABLISHING THE PERSONNEL BASE
Work loads and productivity rates must be interpreted in terms of manpower needs
making the personnel classification element the second major foundation for a construc
tion management system.
Each employee, particularly at the engineering technician levels, must represent
a quantity of work to be produced. Performance capability is one major basis for classi
fying construction engineering technicians; the levels of performance difficulty involved
are the second.
Capability Requirements
Demonstrated capability being essential to proper personnel classification, theca
pabilities required had to be identified and classified.
Task Analysis
Each of the activity statements prepared for work analysis includes task-by-task de
scriptions of the work to be done. These tasks were analyzed to identify capabilities re
quired for their proper performance.
Capability requirements were expressed as indicated by these examples:
"Knowledge of the relationships between contracts, contract plans, specifi
cations, special provisions, change orders and supplemental agreements"; and
- 25-

"Ability to add, subtract, multiply and divide, rounding to two decimal
places"; and
"Ability to conduct a series of moisture-density tests according to specified
d " proce ures.
Notice that no references were made to educational attainments-courses taken,
fields of study completed or diplomas earned. And no references were made to previous
work assignments-prerequisite years of experience, The Department was concerned only
with what individuals must know and be able to do in order to carry out the tasks.
Ability Statements
By analyzing all tasks (not just those pertaining to key activities), the staff com
pleted an inventory of the knowledge and abilities required to perform all construction
surveys, inspections and documentations. The inventory was set forth in a series of ability
statements.
The ability statement covering bituminous paving inspection, shown in Figure 14,
identifies precisely what individuals must be able to do in order to carry out the work.
Note particularly that it is designed almost as a training course out I ine or a certification
examination out I ine.
Statement Series
The final inventory of performance requirements consists of 78 ability statements. 10/
Twenty-six are general in nature, being applicable to most construction engineering per
sonnel. Fifty-two apply only to those individuals responsible for specific assignments.
Essentially all activities require calculating capabilities, for example, while one requires
individuals to know fine-grade inspection procedures.
10/ The complete list of ability-statement titles is included in Appendix B, starting on page 81.
- 26-

Figure 14
TYPICAL ABILITY STATEMENT
Bituminous Paving Inspection
Inspectors must be able:
1. to determine adequacy of base course-
e primed and cured, e grade and cross section, and e absence of depressions and pot holes.
2. to check the adequacy of the contractor's equipment-feeders, flow gates, spreader screws, screed plates, tamper bars and rheostats.
3. to coordinate bituminous plant inspections and operations with street inspections and operations.
4. to lay out, or check, the guideline for spreading operations.
5. to check bituminous materials for texture, consistency and temperature.
6. to identify and suggest solutions for common paving problems-
• cold mix, cold screed, segregation of materials, o improper truck contact with paver, and e improper equipment adjustments.
7. to make yield checks-mat thickness.
8. to make crown checks.
9. to identify and correct improper transverse-joint construction-
111 proper stopping procedures, and Ell cut-joint and feathered-joint construction.
10. to identify and correct improper longitudinal-joint construction.
11. to inspect rolling operations-
o heat-rolling relationships, and e time requirements.
12. to straightedge final surfaces, identify areas needing correction, and .select correction methods.
-27-
Activity-Ability Relationships
The 78 ability statements were cross-referred to the activity statements and sum
marized in personnel classification plans. This tieback ensures that project engineers
have access to the performance requirements for each work assignment.
Levels of Performance Difficulty
As indicated earlier, capability requirements were ranked according to difficulty
of performance to provide the second element of a personnel classification plan.
Criteria for Ranking
Certain tasks must be performed by engineers. State law stipulates registration as
a professional engineer for some; potential consequences of error preclude nonengineer
performance for others. In general, tasks that require innovative application of engi
neering knowledge were reserved for engineers, and those that represent repetitive appli
cations of standard solutions were not.
The nonengineering tasks, toward which this effort was directed, were ranked ac
cording to the relative:
e chances of error;
e costs of error corrections; and
e time required to train an individual from scratch-using modern training
techniques.
Note again the absence of references to education and experience.
-28-
i I
I I
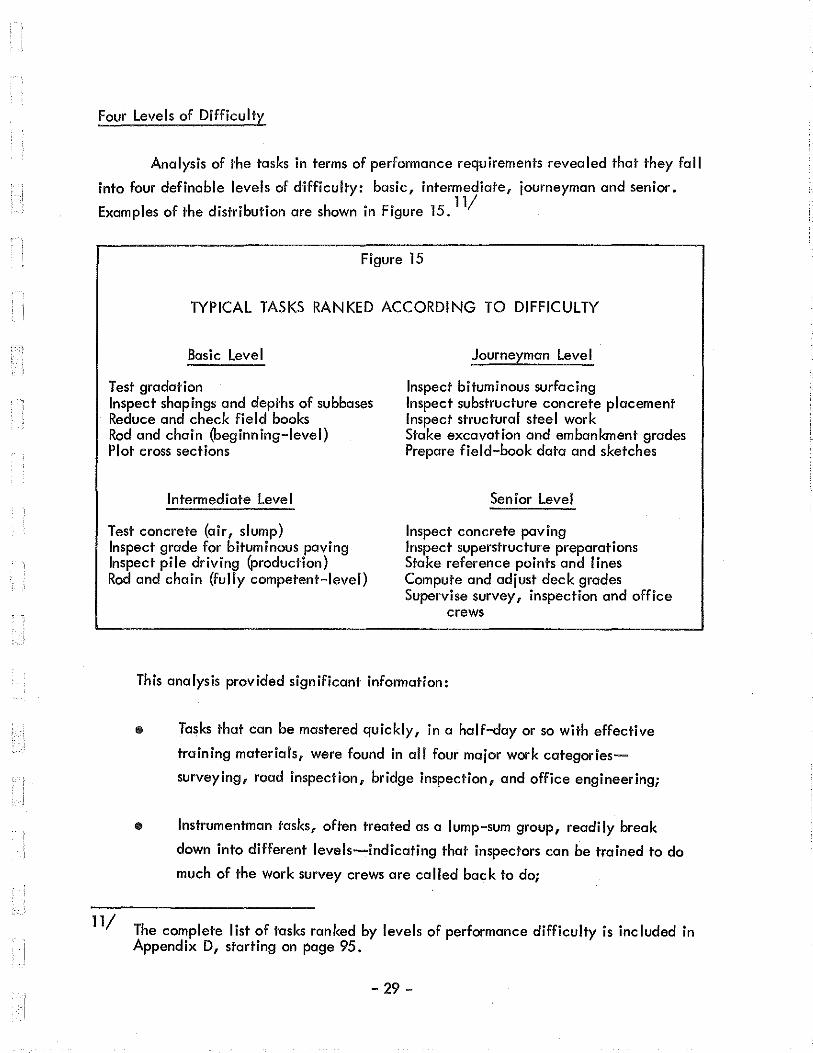
Four Levels of Difficulty
Analysis of the tasks in terms of performance requirements revealed that they fall
into four definable levels of difficulty: basic, intermediate, journeyman and senior.
Examples of the distribution are shown in Figure 15. ll/
Figure 15
TYPICAL TASKS RANKED ACCORDING TO DIFFICULTY
Basic Level
Test gradation
Journeyman Level
Inspect bituminous surfacing Inspect shapings and depths of subbases Reduce and check field books
Inspect substructure concrete placement Inspect structural steel work
Rod and chain (beginning-level) Stake excavation and embankment grades Prepare field-book data and sketches Plot cross sections
Intermediate Level Senior Level
Test concrete (air, slump) Inspect concrete paving Inspect grade for bituminous paving Inspect pile driving (production)
Inspect superstructure preparations Stake reference points and I ines Compute and adjust deck grades Supervise survey, inspection and office
Rod and chain (fully competent-level)
11/
crews
This analysis provided significant information:
Tasks that can be mastered quickly, in a half-day or so with effective
training materials, were found in ail four major work categories
surveying, road inspection, bridge inspection, and office engineering;
lnstrumentman tasks, often treated as a lump-sum group, readily break
down into different levels-indicating that inspectors can be trained to da
much of the work survey crews are ca lied back to do;
The complete list of tasks ranked by levels of performance difficulty is included in Appendix D, starting on page 95.
-29-
Office tasks range from basic to senior in difficulty, permitting greatly in
creased in-season shifts between office and field assignments for improved
manpower utilization; and
Experience on any task eases the training problems on the next one, regard
less of shifts between specialties.
Three Levels of Supervision
While the hands-on tasks fell into four levels of difficulty, supervisory tasks fell
into three-the journeyman- and senior-levels referred to above, plus a level for assis
tant project management.
Personnel Classification
With capability requirements and difficulty ran kings complete, the existing per
sonnel classification plan was analyzed for potential improvements. Since it met the
needs for standard personnel management purposes (selection, placement, salary manage
ment and seniority for retention) but was not well adapted to manpower management, a
replacement plan was developed.
Existing Plan
The existing plan included .fourteen personnel classifications:
o Bituminous Street Inspector-] class;
o Concrete Inspector-] class;
• Engineering Aide-1 class;
e Highway Construction Aide-3 classes;
e Highway Construction lnspector-2 classes;
- 30- ,

e Highway Construction Superintendent-3 classes;
41 Student Engineer Aide-] class; and
e Student Highway Technician-2 classes.
The titles alone make the classification scheme quite clear. Key personnel worked
as specialists-in earthwork, asphalt or concrete, as assistant project engineers or non
licensed project engineers. Aides were classified according to student or nonstudent
status.
Change in Approach
Construction engineering work loads are unique. Roadway projects progress from
clearing and grubbing to excavation and embankment, pipe culvert placement, box cul
vert construction, base construction, surface construction, seeding, sodding and fencing.
Inspection assignments change accordingly. This places a premium on employee versa
tility.
Employees who can perform a wide variety of tasks are worth more to the Depart
ment than specialists who can perform just a few. Specialists must (1) travel to loca
tions where their special capabilities are required, (2) be paid travel time and expenses,
and (3) be paid overtime when their work loads are high-since such specialties are then
in demand. Furthermore, specialists must fill in as well as they can when their special
capabilities are not required, or stand by in nonproductive status until work loads in
their special areas of competence come along. If they were equally competent in several
phases of the work, they could be fully productive on the same group of projects for the
full season.
Clearly, as the percentage of highly versatile personnel within the total force is
increased, the size of the force con be decreased-by reducing stand-by time. De
creases can be effected to the point where the number employed is equal to the number
required for on-site work stations, plus an allowance for absenteeism. Also, as versa
tility increases, instances of working below pay grade must decrease-it being natural
for project engineers to assign their best individuals to the most difficult tasks.
- 31 -

Bases of New Classification Plan
The replacement plan contains five classes (titled "Transportation Construction
Technician I, II, Ill, IV and V") instead of fourteen.12
/
Work loads must be converted into manpower needs in any management system. In
the process, manpower performance capabilities-as represented by both productivity and
versatility-become a major component. The new plan provides for assessing the employ
ee's capabilities on a task-by-task basis. The accumulation of these capabilities deter
mines the level of position for which the individual qualifies.
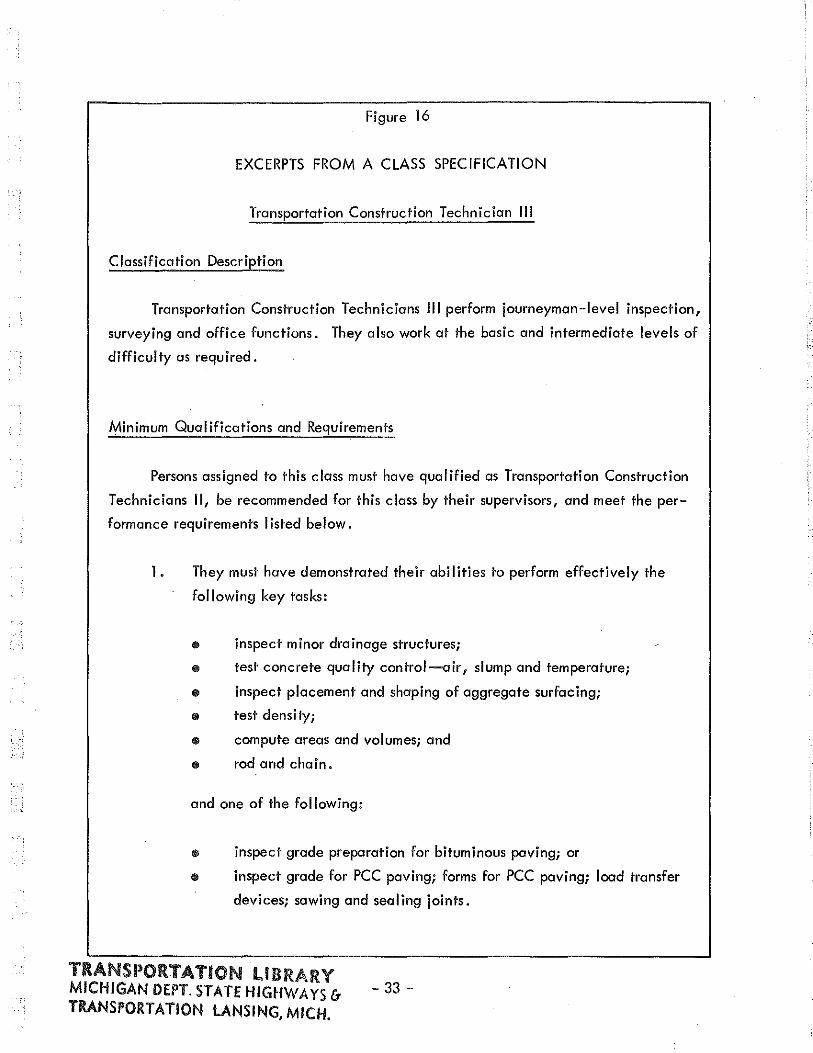
Part of the specification for Transportation Construction Technician Ill is shown in
Figure 16. 13/ Note the detailed listings of tasks (many of which have been omitted from
the figure), and the requirements that appointees be able to do specific levels and vari
eties of work.
Note also that the term "journeyman" is used to indicate the level of work difficul
ty, or level of employee competence. This is done for two reasons: individuals who have
analyzed both tradesman and construction engineering tasks are firmly convinced that the
two groups are reasonably equivalent at this level; and the term itself reflects broad ca
pabilities. Technicians in the first two classes are really helpers.
Minimum experience requirements are included for two classes: six months as a
Technician I before promotion to II, and two years as a Technician IV before promotion
to V.
Promotions to the Technician II and Ill levels can be made as rapidly as individuals
become qualified. Advancements to higher classes can be made only as vacancies be
come available.
12/
13/
At the time of writing, the Michigan Department of Civil Service had yet to approve the replacement plan. Approval was imminent, and implementation was to follow immediately.
The specifications for all five classifications are included in Appendix C, starting on page 85.
- 32 - ' ' . ' ·.r'
'. ~,
Figure 16
EXCERPTS FROM A CLASS SPECIFICATION
Transportation Construction Technician Ill
Classification Description
Transportation Construction Technicians Ill perform journeyman-level inspection,
surveying and office functions. They also work at the basic and intermediate levels of
difficulty as required.
Minimum Qualifications and Requirements
Persons assigned to this class must have qualified as Transportation Construction
Technicians II, be recommended for this class by their supervisors, and meet the per
formance requirements I is ted below.
1. They must have demonstrated their abilities to perform effectively the
following key tasks:
e inspect min or drainage structures;
e test concrete quality control-air, slump and temperature;
e inspect placement and shaping of aggregate surfacing;
e test density;
011 compute areas and volumes; and
011 rod and chain.
and one of the following:
011 inspect grade preparation for bituminous paving; or
e inspect grade for PCC paving; forms for PCC paving; load transfer
devices; sawing and sealing joints.
TRANSPORTATION liBRARY MICHIGAN DEPT. STATE HIGHWAYS & TRANSI'ORTATION LANSING, MICH.
- 33-
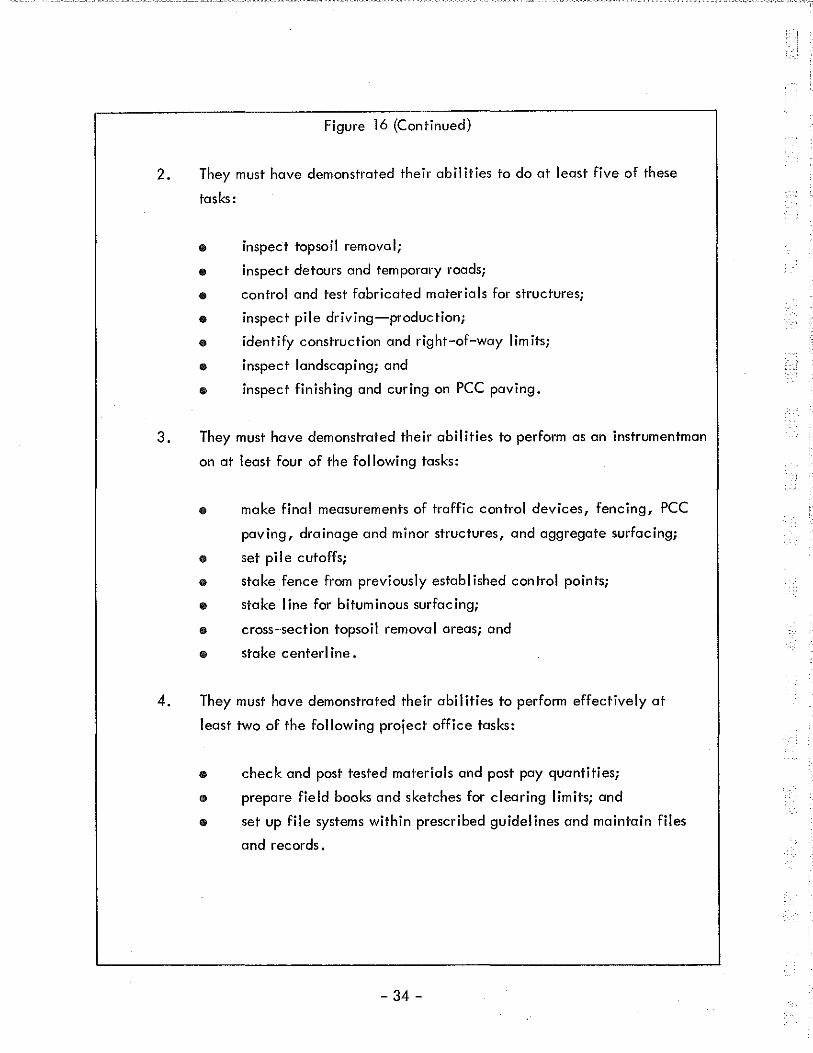
Figure 16 (Continued)
2. They must have demonstrated their abilities to do at least five of these
tasks:
e inspect topsoil removal;
e inspect detours and temporary roads;
e control and test fabricated materials for structures;
e inspect pile driving-production;
e identify construction and right-of-way lim its;
e inspect landscaping; and
e inspect finishing and curing on PCC paving.
3. They must have demonstrated their abilities to perform as an instrumentman
on at least four of the following tasks:
make final measurements of traffic control devices, fencing, PCC
paving, drainage and minor structures, and aggregate surfacing;
e set pile cutoffs;
e stake fence from previously established control points;
e stake line for bituminous surfacing;
e cross-section topsoil removal areas; and
e stake centerline.
4. They must have demonstrated their abilities to perform effectively at
least two of the following project office tasks:
e check and post tested materials and post pay quantities;
e prepare field books and sketches for clearing limits; and
e set up file systems within prescribed guidelines and maintain files
and records.
-34-

The one series of classes is used for both seasonal personnel and permanent, year
round employees.
Manpower Management Characteristics
Position classification plans (where the work to be done is classified, not the indi
vidual who does it) are effective whenever the total number of persons employed is not
affected by productivity rates. A guard must be on each guard post, for example, re
gardless of other considerations. But one Engineering Technician Ill, being versatile and
well trained, may well do the work of two or more Technicians I, making it good man
agement practice to classify the individual rather than the position.
The Department's objective in this regard is illustrated in Figure 17.
The pyramid in Figure 17 represents the traditional concept: The number of em
ployees in each classification decreases as status (reflecting difficulty, responsibility and
salary) increases. (In military terms, there are more privates than corporals, and more
corpora Is than sergeants.)
The pentagon in Figure 17 represents the Department's concept: (1) Transportation
Construction Technician Ill is the key classification-the journeyman level; (2) the larg
er the percentage of the total force that can be advanced to that classification, within
limits, the smaller the total force can be; and (3) Technicians Ill should outnumber Tech
nicians II and I.
Out-of-Class Performance
By the nature of the new plan, employees rarely can work outside of their classi
fications. They can perform any tasks for which they are qualified, from the simplest to
the most difficult, depending on the work to be done and the individuals available to do
it. And an individual's classification is based primarily on the percentage of all tasks
that fall within his or her capability, as distinguished from tasks included in a position
description.
- 35-

Figure 17
DEPICTED CHANGE IN STAFFING PLAN
Old Plan New Plan
ENGINEERS
SENIOR TECHNICIA~S
-----------............ TECHNICIANS Ill
-..,,TECHNICIANS II __
TECHNICIANS I
Pyramid: Technicians I outnumber Technicians II, which outnumber Technicians Ill, which then outnumber their immediate supervisors
Pentagon: Technicians Ill-representing versatile, nonsupervisory personnel, outnumber all other technician groups.
Figure 18
COMPARISON OF TWO PERSONNEL CLASSIFICATION PLANS
i':: ~ ::; u 0: ~
c; w u z <:
" ~
0 ~ ~ w ~
~
0 ~ w
~ ~
0
" r
Posjtion C!assjficgtion 'Plan: Each classification can be depicted as a square, with each square starting on a new base line; employees are expected to work on tasks that fall between certain categories of difficulty, with the average level of difficulty beipg the basis for classific~tion.
~
"' ~ ;! ~
0 w
"' "" r z ~ u M
~ w ~
g
-36-
Employee Classification Plan: Each classification can be depicted as a rectangle, with each rectangle starting on the same base line; employees are expeCted to perform any task within the lim its of their capabilities-with versatility and difficulty being the bases for classification.

This concept is illustrated in Figure 18. The four levels of difficulty (hands-on
tasks) form the vertical axis in the position plan. Percentages of the tasks that make up
the total work load from the vertical axis are in the employee plan.
Summary
Planning involves using productivity rates to convert work loads into manpower
needs. Controlling involves attaining productivity rates that will result in work load
completions with the manpower provided. Manpower management, then, is dependent
upon predictable productivity rates. Management improvements are dependent, to a
great extent, on productivity improvements.
Personnel classification plans must support manpower management. To do that in
the construction engineering field, they must reflect levels of work difficulty plus em
ployee versatility, with considerable emphasis on versatility. The more versatile the
employee force is, with special reference to subprofessionals, the smaller the total force
can be (within limits).
Since versatility is so important, and since the existing classification plan re
flected specialization instead, the Department designed a new plan. In doing so, it
found that five personnel classifications will meet the needs-as against the fourteen
used heretofore. It also found that performance criteria can be used to classify employ
ees-making it possible to interpret productivity rates from personnel classifications.
The Department's personnel classification plan represents the second element of its
construction management system.
-37-
Chapter Four
MANAGING MANPOWER IN SEASON
Managing the construction engineering force during the construction year involves
estimating manpower needs, adopting efficient work schedules, and controlling manpower
utilization while work is under way.
Estimating Manpower Needs
Manpower needs must be estimated once annually, for planning purposes. Estimates
are double- and sometimes triple-checked-as discussed below.
Multiple-Project Estimates
Work loads on any one project fluctuate too much to permit single-project staffing.
Each project would have to be manned for near-peak operations, creating unacceptable
stand-by charges.
Peaks and valleys are leveled considerably when three or more projects are treated
as a unit. They can be leveled somewhat more by including all projects within a district,
and a little more yet by including all those in the State. Leveling reduces manpower
needs, making it tempting to control staffing on a statewide or district-wide basis. In
actual practice, little is gained by going beyond project groupings of three to five major
projects, and costs can quickly be increased by creating sophisticated, computer-based
controls.
-39-

By giving each project engineer a number of projects within a local area, and
holding the engineer accountable for effective manpower utilization, controls and the
costs of controlling can be balanced.
Preliminary Estimates
Figure 19 is an incomplete work sheet for estimating manpower needs, but complete
enough to demonstrate the procedure. 14/
The limited breakdown of activities under "Inspecting" in Figure 19 is indicative.
Each project must be analyzed in terms of:
Figure
14/
1. its current status-new, ready for base construction, ready for surfacing, and
so on;
2. the most probable contractor schedule for the year-based on standard se
quences of work performance and average numbers of weeks or days used to
complete each phase;
3. the work loads attributable to each activity-expressed as miles, sections,
bridges, cubic yards, tons, and square yards;
4. engineering productivity rates-expressed as average man-hours per unit of
work load;
5. the man-months of engineering services required if everything goes according
to plan; and
6. the best distribution of those man-months to the levels of difficulty
indicating the mix of technicians required.
Single-project estimates must be summarized on the work sheet represented by
19.
A copy of the complete work sheet is included in Appendix E, starting on page 101.
-40-
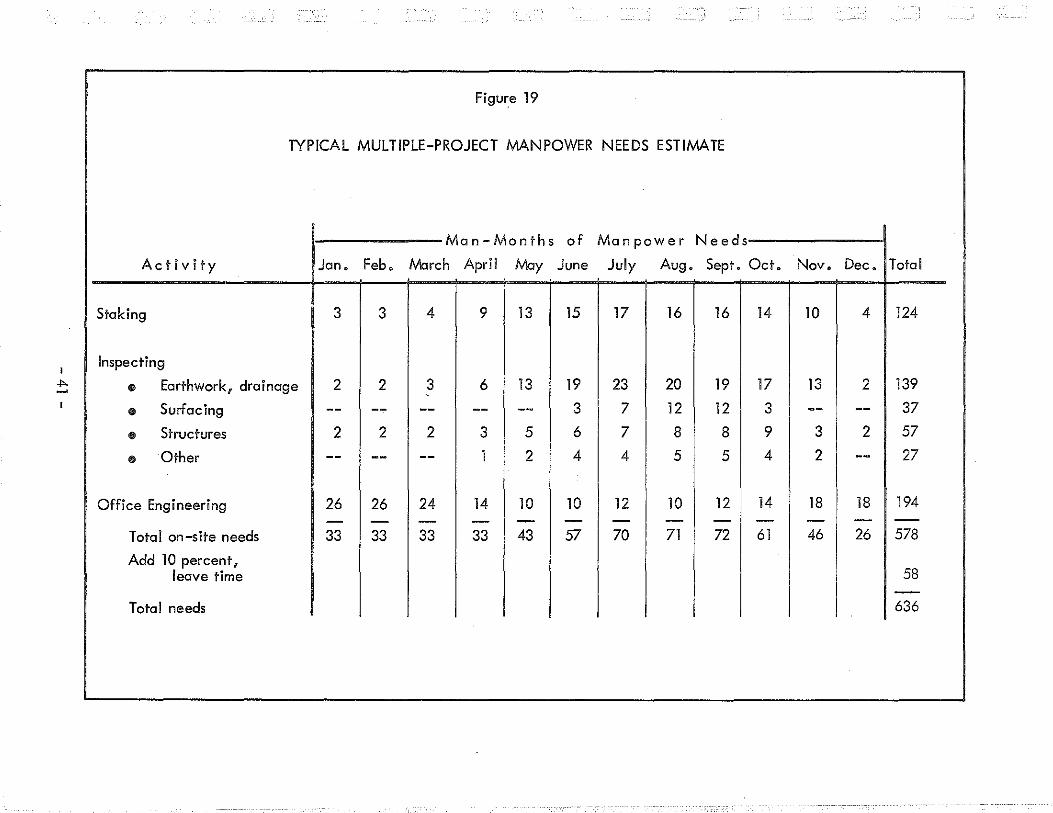
I
""'
Figure 19
TYPICAL MULTIPLE-PROJECT MANPOWER NEEDS ESTIMATE
Man-Months of Manpower Needs
Activity Jan. Feb. March April May June July Aug. Sept. Oct.
Staking 3 3 4 9 13 15 17 16 16 14
Inspecting
* Earthwork, drainage 2 2 3 6 13 19 23 20 19 17 '
$ Surfacing -- -- -- -- -- 3 7 12 12 3
e Structures 2 2 2 3 5 6 7 8 8 9
e Other -- -- -- I 2 4 4 5 5 4
Office Engineering 26 26 24 14 10 10 12 10 12 14 - - - - - - - - - -
Total on-site needs 33 33 33 33 43 57 70 71 72 61
Add 10 percent, leave time
Total needs
Nov. Dec. Total
10 4 124
13 2 139
-- -- 37
3 2 57
2 -- 27
18 18 194 - - -46 26 578
58 -636

Adjusted Estimates
Working with on-site requirements only, the month-by-month estimates must be
adjusted to improve manpower uti I ization. All actual on-site services to the contractors
must be provided-allowing for no changes in values attributable to those services.
To a limited extent, adjustments can be made by advancing and delaying office
engineering activities-without unduly delaying contractor payments. The office staff
should be represented by about 18 man-months in June, for instance (30 percent of the
total requirement), instead of the 10 shown in Figure 19. But engineering students be
come available toward the middle of the month, making it good practice to hold back.
The planned man-months of office engineering can be somewhat below needs throughout
the peak period as long as crew personnel are able to shift between field and office as
signments; rainy days, equipment breakdowns, and mix-ups on materials deliveries will
make additional personnel available.
Overall Guides
Figure 20 shows a typical distribution of man-hours to staking, inspection and of
fice engineering activities. The data reflect experience on the 26 rural freeway projects
in 1973.
The averages for the
year were:
staking-
20 percent;
inspecting-
36 percent;
office engineering-
32 percent; and
leave-taking and
standing by-
12 percent.
Figure 20
TYPICAL DISTRIBUTION OF ENGINEERING
HOURS TO ACTIVITY GROUPS
"' 100 Cl)
~ 90 0
..<: 80 u ~
" 0 I
I c
70
60
50
~ 40 ~
0 30
20
10
Staking
Inspecting
••• 0 ........ •·
Office engineering--,--..,
/ ' r--J ', / \
JFMAMJJASOND
Calendar Months
- 42 -

In view of improvements made in work load controls, work methods and manpower
utilization since those data were collected, the Department adjusted the above values to
use them as guides in estimating manpower needs. The adjusted values currently being
used, and those expected to be reached as further improvements are made, are shown
below.
Current Anticipated Activity Group Guide Guide
Staking 19% 17%
Inspecting 40 46
Office engineering 30 25
Leave-taking, training 11 12
100% 100%
The current and anticipated adjustments seem reasonable in view of overall staff
reductions. The shift from four- to three-man staking crews may have a greater effect
than indicated. And staking work loads will be reduced by limiting the quantities of
staking done before contractors start projects.
Since office engineering served as a make-work activity for surplus personnel, par
ticularly in winter months, and since the numbers of samples taken, tests run, and actual
man-hours charged to inspections are decreasing, office engineering charges should de
crease as we II .
While the percentage of the work load attributable to inspections will increase,
the volumes of inspection work and the numbers of inspectors are expected to drop. In
the cases of staking and office engineering, percentages, volumes and numbers of per
sonnel are expected to drop.
Estimate Checks
Needs estimates can be checked three ways.
- 43 -
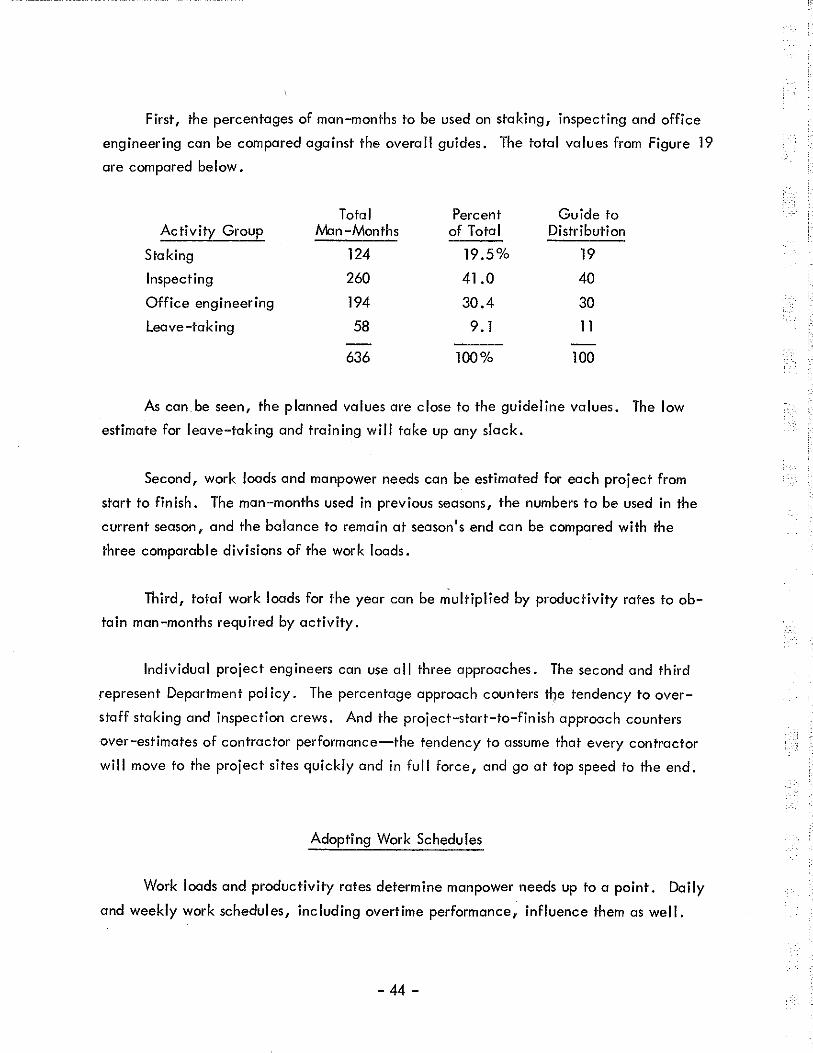
First, the percentages of man-months to be used on staking, inspecting and office
engineering can be compared against the overall guides. The total values from Figure 19
are compared below.
Total Percent Guide to Activity Group M:m-Months of Total Distribution
Staking 124 19.5% 19
Inspecting 260 41.0 40
Office engineering 194 30.4 30
leave-taking 58 9. 1 11
636 100% 100
As can be seen, the planned values are close to the guideline values. The low
estimate for leave-taking and training will take up any slack.
Second, work loads and manpower needs can be estimated for each project from
start to finish. The man-months used in previous seasons, the numbers to be used in the
current season, and the balance to remain at season's end can be compared with the
three comparable divisions of the work loads.
Third, total work loads for the year can be ,;ultiplied by productivity rates to ob
tain man-months required by activity.
Individual project engineers can use all three approaches. The second and third
represent Department pol icy. The percentage approach counters the tendency to over
staff staking and inspection crews. And the project-start-to-finish approach counters
over-estimates of contractor performance-the tendency to assume that every contractor
will move to the project sites quickly and in full force, and go at top speed to the end.
Adopting Work Schedules
Work loads and productivity rates determine manpower needs up to a point. Daily
and weekly work schedules, including overtime performance, influence them as well.
-44-
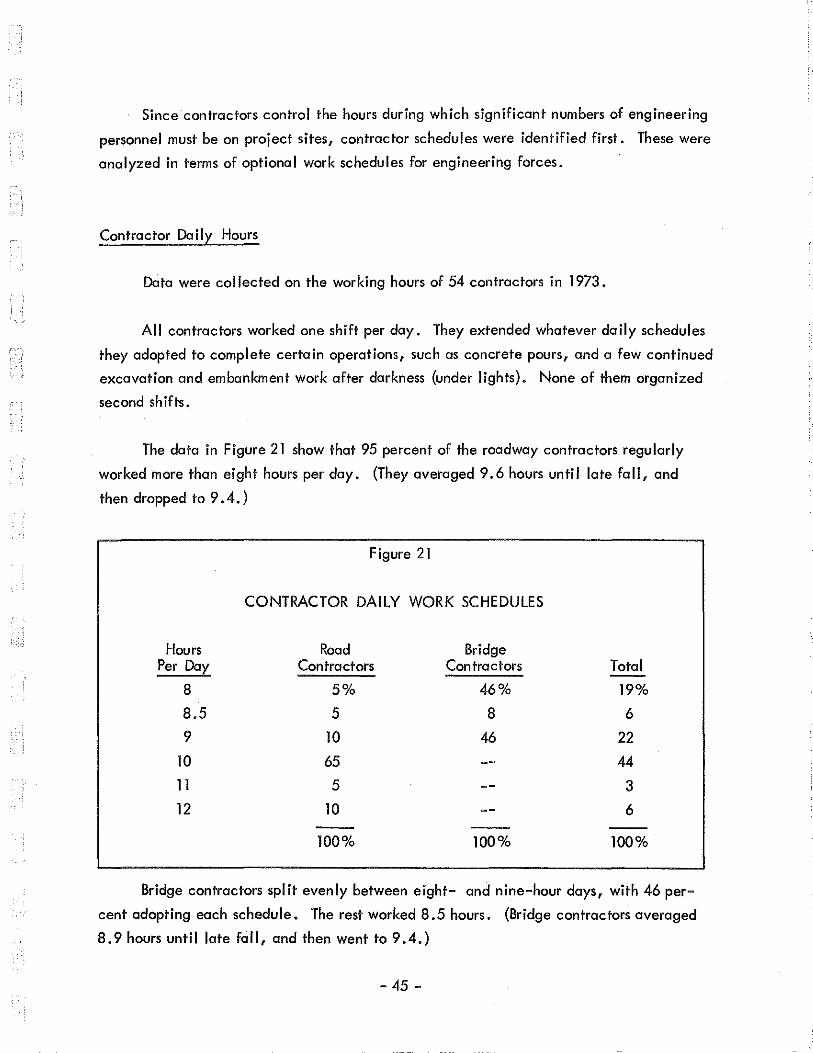
Since contractors control the hours during which significant numbers of engineering
personnel must be on project sites, contractor schedules were identified first. These were
analyzed in terms of optional work schedules for engineering forces.
Contractor Doily Hours
Dota were collected on the working hours of 54 contractors in 1973.
All contractors worked one shift per day. They extended whatever daily schedules
they adopted to complete certain operations, such as concrete pours, and a few continued
excavation and embankment work after darkness (under lights). None of them organized
second shifts.
The data in Figure 21 show that 95 percent of the roadway contractors regularly
worked more than eight hours per day. (They averaged 9.6 hours until late fall, and
then dropped to 9 .4.)
Hours Per Dol
8
8.5
9
10
11
12
Figure 21
CONTRACTOR DAILY WORK SCHEDULES
Road Contractors
5%
5
10
65
5
10
100%
Bridge Contractors
46%
8
46
100%
Total
19%
6
22
44
3
6
100%
Bridge contractors split evenly between eight- and nine-hour days, with 46 per
cent adopting each schedule. The rest worked 8.5 hours. (Bridge contractors averaged
8. 9 hours until late fall, and then went to 9. 4.)
-45-

Ninety-one percent of all contractors worked more than eight hours per day through
out the season .
Contractor Weekly Schedules
Figure 22 shows that 63 percent of the contractors worked five days per week, and
37 percent worked six days-on regular schedules throughout the season.
Days Per Week
5
6
Figure 22
CONTRACTOR WEEKLY WORK SCHEDULES
Road Contractors
52%
48
100%
Bridge Contractors
82%
18
100%
Total
63%
37
100%
Road contractors split almost evenly between five- and six-day schedules. Bridge
contractors favored. five-day weeks. None of them changed the number of days worked
per week after setting a schedule. 15/
Engineering Daily Schedules
In demonstrating how the Department estimates manpower needs earlier in this chap
ter (Figure 20 on page 42), the on-site needs climbed from 33 in M:ly to 43 in June, then
57, 70, 71 and 72. They dropped to 61 in October, 46 in November and 26 in December.
Since the needs were first calculated in man-hours and then converted to man-months,
they actually reflect long workdays put in by the contractors.
15/ One contractor, eliminated from the sample group for this report, actually changed the hours per day and days per week frequently. No pattern of changes could be identified.
-46-
('

For contractor operations on ten-hour and six-day schedules, a number of inspec
tors potentially can work four ten-hour days per week. Similar schedules can be worked
out for five-day operations. Any combination of five employees can consistently provide
four man-days of work daily on a ten-hour, four-day schedule. But, employee versatil
ity is critical to making such schedules work.
Schedules can be put together using only eight-hour days and five-day weeks.
Starting and quitting times vary by individual so they can overlap each other on contrac
tor operations that exceed eight hours per day-which 91 percent do. Obviously, this
results in excess manpower during the overlapping periods.
Overtime Performance
Ten-hour days will not in themselves decrease the total number of man-months re
quired. Exclusive use of eight-hour days will increase the total. Overtime can be used
to decrease the numbers of persons employed, particularly if the eight-hour schedule is
adopted.
The Department pays time-and-one-half for overtime wark. Overtime costs the
Department 20 percent more than straight time. The remaining 30 percent represents
leaves, holidays, insurance premiums and other fringe benefits earned during straight
time hours-that would be earned by any additional personnel employed to avoid over
time performance. In actual practice, these considerations come into play:
Additional personnel must be hired on full-time bases-causing payments for
eight hours plus fringe benefits to avoid two hours of overtime;
Additional personnel increase the problems of in-season manpower utilization,
since the percentage of utilization typically decreases as the number of em
ployees increases;
Additional employees add to the problem of off-season manpower utilization,
since the size of the year-round force increases generally in proportion to in
creases in the peak force;
-47-

Ten-hour straight-time shifts reduce productivity rates on days of rain,
equipment breakdowns and other delays-as against productivity rates for
eight-hour days plus overtime; and
Continuity of inspection is important on many activities, causing some over
time performance even though extra personnel may have been provided to
avoid it.
Unnecessary overtime work should be avoided insofar as possible, in all functions.
Apparently, however, overtime can reduce costs in the construction function.
Compensatory Time
Federal statutes permit payments for overtime work through compensatory time off.
The compensatory time must be taken within the pay period in which it is earned. De
partment pol icy permits employees to opt for compensatory time or cash. Time-and-one
half rates apply either way.
With rainy days, equipment breakdowns and other delays, and with extended days
to complete segments of work under way, the compensatory-time provision can be applied
to reduce costs-to the extent that employees elect to take it.
Tailored Schedules
Staking and office engineering personnel can work five eight-hour days weekly,
with odd exceptions. Since ten percent of the contractors adopt that schedule, and since
results-type inspections can be carried out on that schedule as well, roughly 25 percent
of the inspectors can also work five eight-hour days.
Schedules including four ten-hour days and five eight-hour days plus planned over
time can be tailored to meet remaining needs. The best combination will always depend
on actual contractor schedules. Each project engineer should design that combination
- 48 -

of schedules that will give the best productivity rates. The plan that provides the highest
productivity rates will produce the lowest engineering costs-despite the additional 20
percent it costs for overtime.
In the manpower needs example used earlier in this chapter, the peak numbers of
man-months required can be reduced through overtime payments. Needs that reached
71 and 72 man-months per month can be cut. By combining overtime payments with ten
hour days, actual cash payments can be reduced.
Contrail ing Manpower Utilization
The central office plans total manpower requirements by project. Project engi
neers estimate their seasonal manpower needs and plan their staffing patterns. These are
checked by members of each district engineer's staff, and minor adjustments are made in
the total engineering force-by allowing short-term reassignments of personnel from one
project group to another ta overcome unusual work load fluctuations, for example. Uti
lization must then be controlled to ensure that actual staffing reasonably corresponds to
planned staffing-so that actual engineering costs will be in line with planned costs.
Card System
The maintenance divisions of several highway departments, including Michigan,
have adopted o system of crew-day cards for (1) authorizing work performance, (2) guid
ing maintenance foremen relative to crew sizes, equipment complements and productivity
rates, and (3) reporting work done, manpower and equipment used, and productivity
rates attained. These card systems permit foremen to compare results with planned results
daily.
The Department tested a similar card system for the construction function. It
failed.
While several reasons for failure of the card system can be cited, the main one has
to do with daily work performance. Maintenance crews typically work at only one
-49-TRANSPORTATION liBRARY MICHIGAN DEPT. STATE HIGHWAYS & TRANSPORTATION LANSING, MICH.
activity each day. Construction personnel must often switch from one task to another sev
eral times daily. The card system, a simple tool for maintenance operations, becomes
unwieldy for the construction function.
Weekly Schedules
Research proved that manpower utilization can be controlled effectively without
referring to productivity rat·es-just as effectively as through daily reports and evalua
tions. Planned productivity rates are attained if proper crew sizes are used, if individuals
and crews consistently concentrate on essential tasks, and if they perform no more work
than is necessary. Scheduling the work to be done and the individuals who will do it is
critical.
Figure 23 shows the scheduling system that replaced the crew-day card. These
schedules are posted on Thursdays for the upcoming week. Several items in the figure
deserve special attention:
Each employee is given specific assignments-as against crew-size assign
ments;
Each employee is given primary and secondary assignments-one set to be
done if rontractor operations permit, and the other if weather is bad, equip
ment breaks down, or work is completed ahead of schedule;
Each employee is told how many hours he is expected to work;
A separate schedule is worked out for each project-as against the total
group of projects; and
Each schedule is prepared manually-as compared with computer preparation
of maintenance crew-day cards.
To repeat, the schedules identify the work loads to be completed and the individu
als who will complete them. Productivity rates (adapted from total-project rates) are
-50-

Figure 23
TYPICAL WEEKLY PROJECT SCHEDULE
Week beginning Odober- 7, 197':>- MANPOWER SCHEDULE • Project No: I7DD z-4
Name Primary Activity location Remarks M T w T F s Secondary Activity Location Remarks
.Jbl-l NSON E: a-rl-h wor-k_ r;;;,..,_-ur-c. 7 7 7 7 7 p,;,o) rne.as'-ln=.. entire.- rojed-in sped-ion. -pr-<j ed- c..orn pl e. LUi 1 -:::J?:>l-11'1 SoN Ea-rth wor-k.. Errh;-<1!:.... 3 .3 3 3 3 p<j>e.. pLa.=rn~.r.+- Bh.-s. pu-d~ . ck,...,i,'fri c..orrh-o/ ?~e.c:r
A~r'?:,oJ-e.. h/. "'&:J. Fino/ measure.., E::n-1-/r-c. proj ec:t' DUSON
-pl~e.rrf: 1'2.17 .... 00 to /D ID 10 10 /0 Compi-G-i=:/, tenc.e.. 8h.-s. per ala<[ ln:Spe.c:hon tz.'fo-roo
We.•~h ~~n:.tyk :5c.a.Jc:... __ nne,( n'l~Lomo:., As:;·,:;t olson
AL..VARE:L eo,..~.-!s prl- /0 ID /0 !D ID I!.DI'YI pk:hJ .I fa, c..e.. abov'C1
8 hrs. per d""j
WA 5H 11'/G, 77)1'/ '5u rfo..c.e..- £. 73c/. 1315-t-00 2 8 8 :5= ScJ-.=1 uJe.
1 O'I3RJT::N
:sfa.k.i-n ~ -/7:> 13W -t-OO Pn:fjai-T1 oo 2/p
/<IA..WAt...SI</ W. Bd./2.10 ..-oo /-o 2 8 8 1'$00+-00 z 8 8
.:5e.e Sched.:J;7oOz./,
• In the example schedule above, activity code numbers have been omitted for simplicity.
used to ensure that everyone has enough to do, but the rates are not shown on the sched
ules. The personnel who prepare the schedules soon learn the relationships between work
loads and productivity rates.
The schedule format is essentially immaterial. The need is to identify work assign
ments and personnel, regardless of circumstances that may come up.
Manpower Utilization Reports
Daily reports, also prepared manually, are used to compare actual manpower usage
with planned usage:
Each employee reports hours spent on each activity;
Employee data are posted regularly-hours planned to date, hours spent to
date, and hours remaining for each activity (employee names, dates and
other nonessential data are omitted);
Project engineers are alerted to exceptions-overruns and underruns by activ
ity-and take appropriate actions; and
District engineers confer with project engineers on unusual exceptions. They
provide assistance as needed-particularly when manpower must be shifted
from one project engineer to another to offset major work load fluctuations.
Final biweekly summaries are forwarded to the Construction Division. Data from
randomly selected projects are used, together with corresponding quantities data, to con
firm or adjust productivity rates used to estimate manpower needs.
Summary
No "system" can match dedicated, conscientious, knowledgeable project engineers
in controlling manpower utilization. The principle that authority and responsibility
-52-
should be delegated to the level where all decision-making data are available was con
firmed.
Project engineers estimate manpower needs for the year, develop weekly work
schedules, include bad-weather assignments in those schedules, and compare actual man
hour usage with planned usage while work is under way. Office engineering personnel
alert project engineers to utilization exceptions early enough to permit carrec::tive actions
or deliberate continuation of exceptions based on unusual circumstances.
District engineers are advised of anticipated manpower surpluses and shortages as
weekly schedules are completed, permitting them to shift personnel from one group to
another as required for balancing. They are made aware of exceptions to planned utili
zation every two weeks-in ample time to avoid unnecessary cost overruns. And the Con
struction Division hasdata for periodic evaluations of the produc::tivity standards on which
the entire manpower management system is based.
The entire process will become simpler as time goes on-as work load volumes and
numbers of person·nel are cut back.
-53-

Chapter Five
MANAGING MANPOWER YEAR-ROUND
Manpower expenditures while construction work is under way represent only part of
the construction engineering costs. Expenditures during the off-season-including charges
to projects for off-season stand-by time-represent the rest.
Year-round manpower management involves (I) establishing the size of the year
round force, (2) providing off-season work for surplus personnel in that force, (3) pro
viding seasonal personnel to supplement the farce, and (4) ensuring that both year-round
and seasonal personnel are trained.
Establishing the Year-Round Force
The Department has been reducing the construction engineering force since 1967. 16/
As a result of the research, it has defined how far it intends to go, how it will get there,
and how it will stay there.
Reductions to 1974
As indicated in Figure 24, the total force dropped from 1,575 in 1967 to 1,196 in
1974-24 percent. The actual work load, expressed in numbers of miles, bridges, cubic
yards and tons, increased approximately 23 percent during the period.
16/ Successful efforts actually started in 1964,
-55-

Figure -24
FORCE REDUCTIONS, 1967 THROUGH 1974
Year-Round Percent Seasonal Percent Construction Years Total Personnel of Total Personnel of Total
1967 1,575 1,435 91% 140 9%
1968 11450 1,304 90 146 10
1969 11390 1,249 90 141 10
1970 11247 1 1 135 91 112 9
1971 11253 11078 86 175 14
1972 11320 11043 79 277 21
1973 11304 11004 77 300 23
1974 1 1 196 968 81 228 19
Figure 24 also shows that:
e the permanent force dropped from 1,435 to 968-33 percent;
• the temporary force increased from 140 to 228-63 percent; and
e the percentage of temporaries doubled in the eight-year period.
Minimum Year-Round Force
The Department intends to reduce its year-round force to approximately 650 per
sons, and to supplement that force with roughly 300 seasonal employees. The considera
tions involved in reaching that decision may be useful to other highway agencies.
The man-month needs for the group of projects represented in Figure 19 are re-17/
pea ted on the next page.
17/ Figure 19 can be found on page 41.
-56-

January - 33 man-months; July 70;
February- 33; August 71;
March 33; September- 72; April 33; October 61;
May 43; November- 46; and
June 57; December - 26.
The peak needs can be reduced to about 65 through planned overtime work.
The minimum force could be 33 from a basic needs standpoint. With proper train
ing courses, and with a reasonable number of experienced seasonal employees, the 33
would also be sufficient from the standpoints of performance difficulty and performance
capability. But, four considerations are involved:
1. The need will increase to 43 man-months in May-before engineering stu
dents will be available for seasonal employment;
2. The need will still be at the 61-man-month level in October-after students
have returned to classes;
3. The more versatile the employees are, the smaller the total force can be
and year-round personnel can become highly versatile; and
4. The larger the year-round force is, the more difficult it is to keep engineer
ing costs down.
The size of the peak-season force is determined by the system. The size of the
year-round force is a somewhat arbitrary decision. The Department believes it should be
less than two-thirds of the peak requirement-say, 60 to 65 percent. In the case above,
it should be. about 40-62 percent.
Providing Off-Season Assignments
Actual needs being as low as 33 and the permanent force being roughly 40, provi
sions must be made for effective utilization of 7 employees during winter months.
-57-
:-

Departmental Practice
The Department has assigned construction engineering personnel to other divisions
for many years.
Figure 25 shows that 131 permanent personnel were assigned to nonconstruction
functions during the winter of 1968-1969. The surplus personnel were distributed to more
than five operations, with most being used to supplement the winter maintenance force.
Figure 25
OFF-SEASON PERSONNEL ASSIGNMENTS
1968 to 1972
------------VVinter Period--------------
Division of Assignment
1. Planning
2. Design
o Surveys
e Office
3. Right-of-VVay
4. Testing and Research
5. Maintenance
6. 7.
Field
e Utilities - Permits
Traffic and Safety
Other divisions
Total reassigned
Total year-round force
Percent reassigned
1968-69 1969-70 1970-71
(Numbers of Employees)
8
8
6
11
83
9
14
131
1,304
10%
-58-
72
4
33
21
8
146
1,249
12%
73
4
28
39
145
1, 135
13%
1971-72
46
9
65
24
145
1,078
13%
i

These observations should be made about the data in Figure 25:
As the total construction force decreased, the numbers assigned to other di
visions generally increased;
Maintenance accepted 83 surplus employees in 1968-1969, none in 1969-
1970 because of travel expense restrictions-forcing the construction divi
sion to find other off-season assignments;
Maintenance accepted 28 in 1970-1971 and 65 the following winter-as
parts of the manpower planning element of the maintenance management
system then being installed; and
The number assigned to Design Surveys and Traffic and Safety increased
sharply in 1969-1970 and remained fairly constant in the following years.
Changes in Practice
As can be seen in Figure 26, the Department accelerated off-season reassignments
as research provided additional guidelines. The numbers increased to 185 in 1972-1973,
190 the following year and 269 in the final year. The percentage of the total force re
assigned nearly tripled from 1968-1969 to 1974-1975, partly due to the decrease in total
employment.
More important, the nature of the winter assignments changed: three additional
design squads were established in the districts, for a total of six; Maintenance planned
for winter supplements; and Traffic and Safety worked out ways to reduce its backlogs
with surplus construction employees.
-59-

Figure 26
OFF-SEASON PERSONNEL ASSIGNMENTS
1972 to 1975
1.
2.
3. 4.
Division of Assignment
Planning
Design
• Surveys
• Office
Right-of-Way
Testing and Research
5. Maintenance
6. 7.
Field
Utilities - Permits
Traffic and Safety
Other divisions
Total reassigned
Tota I year-round force
Percent reassigned
Planned Status
-----Winter Period------
1972-73 1973-74 1974-75
(Numbers
26
27
9
86
20
17
185
1,043
18%
of Employees)
30 0
12 39
29
13 17
99
17
19
190
1,004
19%
4
110
22
41
7
269
968
28%
When the total force reaches its final size and configuration, 30 to 35 percent of
the permanent employees will be reassigned during winter months. At that point, staffing
plans will have been worked out to permit actions such as those depicted in Figure 27.
In Figure 27, the design function is shown to include construction engineering per
sonnel from January through March, release those personnel for construction work until
late October, and release regular design personnel for construction assignments during the
- 60-

particularly difficult period from mid-September to late October. Other divisions can
take similar actions.
~ ., ., s Q_
E LU
0
Figure 27
INTEGRATING TWO MANPOWER
MANAGEMENT SYSTEMS
Design Staffing
J FMAMJJASOND
Calendar Months
Providing Seasona I Personnel
Making the reduced permanent force effective depends on providing capable sea
sonal personnel. The Department is taking steps to meet· this need.
Engineering Students
Engineering students make goad seasonal employees, particularly those who return
year after year.
The Department has arranged with engineering schools in Michigan to establish
50-50 cooperative programs. Students attend school six months out of the year and work
- 61 -
for the Department the other six months-with the schedule designed to coincide with the
construction season.
Returning Seasonals
Several nonstudent seasonals have returned for construction engineering assignments
year after year. They have been trained as specialists, largely through experience.
Most of them now will be given formal training to increase their versatility.
Nonengineering Student Seasonals
Thirty-five percent of the work done falls into the beginning level of performance
difficulty. Personnel can be trained to carry out each task in a half-day or less.
Short-term employees, students from nonengineering schools particularly, can read
ily be employed and trained to fill out any project staff. They cannot be as productive or
versatile as engineering students or returning seasonals, thereby decreasing productivity
rates. But, relative salaries are low and individuals can be laid off as work loads de-
crease.
Permanent Intermittent
Permanent intermittent employees are on call at the convenience of the Depart
ment. They have no regular schedules. They work when needed and are paid only for
the hours worked. The Department has had success in offering this type of employment
to housewives and others seeking short-term seasonal work. Tasks performed are usually
routine lower levels of difficulty such as gradation testing and weighing.
Providing Training
Seasonal personnel must be trained for beginning- and intermediate-level tasks.
- 62-

The year-round force must be capable of performing a wide variety of construction
engineering tasks. They must be able to accept staking, inspection and office engineer
ing assignments. Some of them should also be able to carry out planning, design, right
of-way, traffic engineering and maintenance assignments.
Short Courses
The Department has provided a great deal of training over the years, primarily
through workshops conducted during winter months. It is taking steps to provide each
project engineer with specific courses to meet on-site needs. The new courses will de
pict work methods and workmanship requirements on colored slides, and explain the steps
on cassette tapes. Workbooks will include sketches and steps for reference purposes. In
some cases, such as moisture-density testing, trainees will perform simulated work as part
of the training.
Once the series is available, project supervisors will assign personnel to training
tasks in the same way they are assigned to production tasks. Each employee will train
himself (or herself), subject to periodic checks for progress, performance and any needed
assistance.
Seasonal personnel must be trained quickly, in the field, with limited expenditures
of supervisory time. They need to know specific work methods and workmanship require
ments only-as distinct from theories, historical information or research results.
Advanced Training
Year-round personnel will take the short courses as well. Whereas seasonal em
ployees may take only one or two, year-round personnel will be expected to take them
all. And they will take them in relatively specific sequences. In-depth courses will be
developed to complete each work methods series.
Final design of the total training program is incomplete, but advanced workshops
are contemplated covering .tasks that involve (1) making decisions when severa.l
-63-
alternatives are available, (2) public relations, environmental considerations, and safe
ty factors, (3) project management-including the construction management system, and
(4) staking.
Summary
Reducing off-season construction manpower involved, among other things, reducing
the year-round force and reassigning some of that force to other divisions. The Depart
ment had taken steps in both these directions for several years-quite successful steps.
From that viewpoint, the Department needs only to estimate its wintertime needs and lay
off the rest.
But, there are other considerations-a major one in particular: If the peak-season
force is to be limited to reasonable numbers, it must include a significant percentage of
versatile personnel. Some versatility can be gained through repeated seasonal employ
ment, supplemented by effective training, but not enough to keep the total payroll in
bounds.
Since efforts were taken to reduce peak work loads and improve productivity rates,
peak manpower needs were being reduced-from 1,575 in 1967 to 1,196 in 1974. The
question to be resolved is, "How many should be employed year-round?"
The peak-season need represents on-site and off-site manpower when work sched
ules and overtime are used to best advantage. Stopping overtime work could itself rep
resent a manpower cut of nearly 10 percent.
With the work management refinements, it was found that construction work loads
during winter months can run 45 percent of peak volumes. Early-season loads can jump
30 to 40 percent from there-another 75 to 85 percent later. That being the case, it
seems best to employ approximately 60 to 65 percent of peak needs on a year-round ba
sis and assign surplus personnel to other divisions.
-64-

All division directors would prefer to staff their organizations independently,
Everything is easier when that is done-but expensive. Developing work schedules and
staffing plans to accommodate peaks and valleys in other divisions takes extra time, at
tention and management skill. Even so, other divisions can schedule work loads to ab
sorb surplus construction personnel.
Another major factor is represented by the seasonal force. The more versatile those
personnel are, the smaller both the year-round and the seasonal forces can be. To in
crease seasonal versatility, the Department is arranging cooperative programs with engi
neering universities. Students attend school six months and work for the Department six
months, with the Department getting first choice in scheduling the work section.
The Department is also taking steps to provide quick on-site training for seasonal
personnel.
-65-
Chapter Six
MANAGING THE SYSTEM
The construction management system consists of many parts, 37 of which are iden
tified in Figure 28. Treating them as individual items first and then as components
according to systems-approach technology-simplifies research and development work.
The parts and components are so interrelated that none of them can function proper
ly without the others. Improving any one can improve the operation of several others.
With a system such as this one, improvements must simplify rather than complicate.
Obviously, if work loads and staffing are reduced, and if manpower is provided in the
numbers required to do the work without strain, the total operation is easier to manage.
The effects of the new system on management work loads are evaluated first below.
Implementation concerns are discussed in the second section, and potential results in the
third.
Effects on Management Work Loads
Parts of the management system are represented by one-time efforts, all others rep
resent periodic management work loads.
-67-
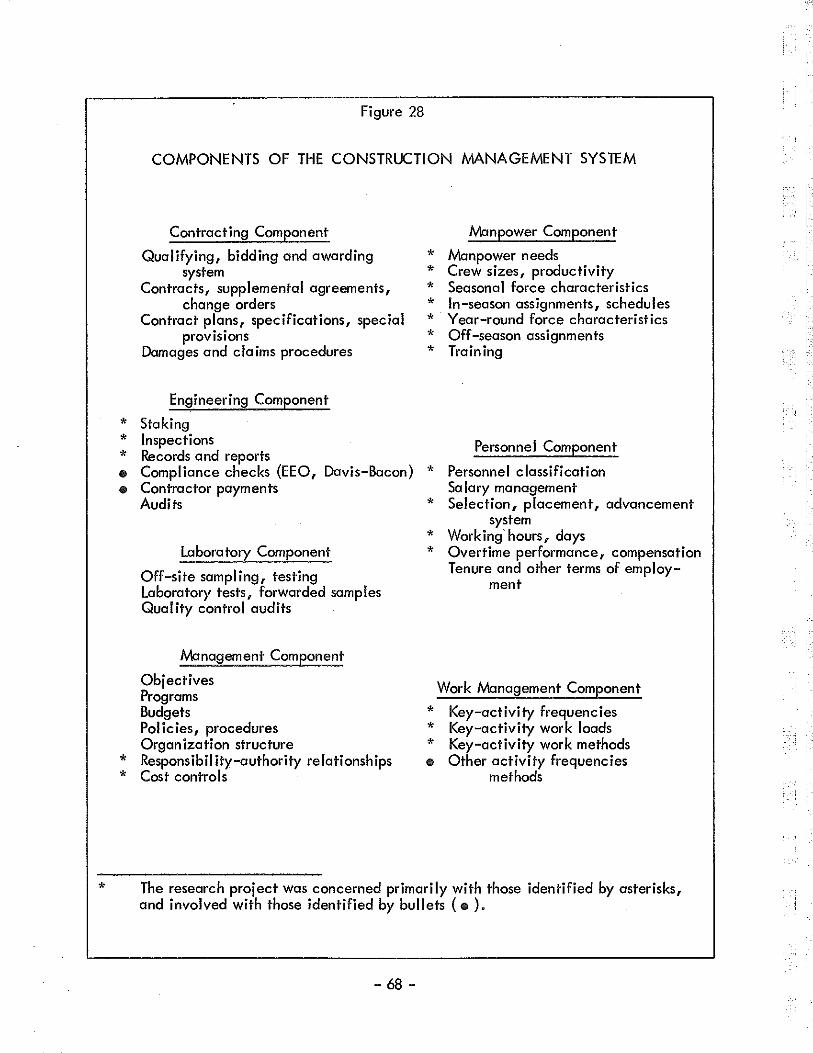
*
Figure 28
COMPONENTS OF THE CONSTRUCTION MANAGEMENT SYSTEM
Contracting Component
Qualifying, bidding and awarding system
Contracts, supplemental agreements, change orders
Contract plans, specifications, special provisions
Damages and cia ims procedures
Engineering Component
* Staking * Inspections * Records and reports e Compliance checks (EEO, Davis-Bacon) e Contractor payments
Audits
La bora tory Component
Off-site sampling, testing Laboratory tests, forwarded samples Quality control audits
Management Component
Objectives Programs Budgets Policies, procedures Organization structure
* Responsibility-authority relationships * Cost controls
Manpower Component
* Manpower needs * Crew sizes, productivity * Seasonal force characteristics * In-season assignments, schedules * Year-round force characteristics * Off-season assignments * Training
Personnel Component
* Personnel classification Salary management
* Selection, placement, advancement system
* Working' hours, days * Overtime performance, compensation
Tenure and other terms of employment
Work Management Component
* Key-activity frequencies * Key-activity work loads * Key-activity work methods e Other activity frequencies
methods
The research project was concerned primarily with those identified by asterisks, and involved with those identified by bullets (e).
-68-
,.; .. ;

One-Time Efforts
Parts that can be used as they are for several years certainly add nothing to man
agement work loads.
Work analysis identified the key activities and measurement units, making it easy
to estimate full-project and annual work loads. Work analysis also provided requirements
of levels of difficulty for the performance-based personnel classification plan.
Development of the new training program represents a one-time effort in most re
spects as well. The types of courses contemplated for work methods and workmanship
training will be similar to manuals-available for use as needed.
Annual Items
Certain management actions must be taken once annually regardless of how they
are done. Orderly procedures, adopted statewide, simplify the work for headquarters
and district officials, and possibly for project engineers as well.
Work loads must be estimated in terms of miles, bridges, cubic yards, tons and
square yards-at the start of each project and at times adjusted at the beginning of each
year. They must be converted into manpower needs for each total project and, once
each year, for each group of projects and each district. And manpower needs must be
adjusted to reflect daily and weekly working hours, plus planned overtime performance.
Most guesswork, except that associated with estimating contractor progress, has
been eliminated from this process, reducing the discussions that would otherwise take
place to resolve differences of opinion between project engineers, district engineers and
headquarters officials.
- 69-

Weekly Efforts
Project engineers must schedule increments of work to be done, including job-site
training, by project and activity. They must schedule individuals to carry out each work
load, and designate working hours for each assignment. And they must provide alterna
tive assignments for days on which contractors fail to make the primary assignments worth
while. (Secondary assignments can be carried over from week to week until they are
completed, of course.) The schedules must be changed during the week-but most will
hold.
This type of scheduling simply replaces another-that of making assignments every
day or several times daily. Since careful planning a week at a time reduces manpower
needs, it reduces the management work load. It also reduces day-to-day frustrations.
Biweekly Efforts
Project engineers must compare actual manpower expenditures with planned ex
penditures at least every two weeks. They can arrange to check exceptions to planned
utilization as they occur, but day-to-day fluctuations are of very limited significance.
District engineers are expected to review exceptions to planned manpower utiliza
tion every two weeks. Acceptable explanations for most exceptions accompany the re
ports, but a small percentage justifies conferences with the project engineers. Shifting
personnel from one project force to another, always a district-level responsibility, can
now be done with confidence that one crew is short while another has extra personnel
particularly since both project engineers want to keep costs down.
-70-
Intermittent Efforts
Productivity rates hove been developed for 33 activities only; additional rates will
be of no value. 18/ The 33 rates, being critical to manpower needs determinations, must
be checked at least once each year. Random samples of data are sufficient.
Since crew sizes, work frequencies and work methods severely affect productivity
rates, they must be reviewed every few years. A permanent work methods committee has
been established for this purpose.
Manpower management objectives should be reviewed at least every two years.
Four- or five-year construction programs provide work load data from which the overall
size of the year-round and seasonal forces can be calculated. The potential for off
season assignments to nonconstruction functions should be evaluated at the same time.
Implementation
Formal implementation of the system began on rural freeway projects in 1974. Im
plementation-with standards to cover all major types of projects-will be completed in
1976.
Two major concerns relative to implementing the program are whether or not it will
be accepted, and the extent to which staff development is required for its effective op
eration.
Acceptance of the System
Everyone resists change, including those specifically responsible for designing, de
veloping and implementing management improvements. Other research has shown, and
this project confirmed, that resistance to change largely represents resistance to the
18/ Rates have been developed for five additional activities, making a total of 38. The five are used as needed.
- 71 -
unknown and the impractical. In this instance, extensive and continuous participation by
representatives of all levels of construction management precluded any surprises to those
affected. Participation also ensured that the system would be logical, complete and
practical. Field tests eliminated the need for most adjustments during implementation.
Since major parts of the system have been implemented without unusual problems,
acceptance of the system is certain. Weekly scheduling represents the only known prob
lem, and it is being overcome. Weather conditions, contractor operations and contractor
progress are unknowns, making it difficult to schedule work and manpower in advance.
But habit is the major obstacla-the habit of scheduling day to day, even hour to hour.
Habits being far more difficult to change than procedures, the Department continues to
improve the scheduling forms-and to replace one habit with another.
Staff Development
All construction engineers and project managers must be trained relative to system
objectives and technology. While most of them understand the workings in general, and
several understand it in full detail, all need to know the concept on which it is based.
They particularly need to know relationships among crew sizes, work frequencies, work
methods, productivity rates and final costs.
While one-day workshops plus I imited assistance during initial stages of implemen
tation are essential, the system soon becomes standard operating procedure.
Results
It is too early to tell what the final results will be, but not too early to evaluate
indications.
-72-
Construction Engineering Costs
Average engineering costs on all road systems dropped from 14 percent of contrac
tor payments in 1971 to 13.4 percent in 1973, ond to 10.5 percent in 1975. Costs on in
terstate projects dropped from 13.3 to 9.8 percent during the same period, and on sec
ondary projects from 19.1 to 15.2.
Costs on the three engineering projects used for laboratory testing averaged 9. 0
percent of contractor payments. 19/ This rate was achieved despite the research charac
teristics of the projects and pre-system practices for most of the research period.
As manpower becomes versatile, and as productivity rates increase, it can be ex
pected that average construction engineering costs will drap below 9 percent. They may
range from, say, 6 percent on large projects to 12 or 13 on sma II ones.
Staffing Controls
Pressures are on to reduce payrolls in all state agencies.
The Department is in a position to document construction manpower needs with work
load, productivity and performance data. No organization can be expected to do more
work than it is capable of doing. And no organization should expect to have more man
power than it needs.
The system should ensure that a balance will be reached to the satisfaction of
everyone-Departmental management, budget review officers, the Governor and the leg
islature.
19/ The 9. 0-percent rate represents actual salaries paid plus Department-level overhead charges, plus Testing and Research Division charges, vehicles, supplies and other items.
-73-

Summary
This project was directly involved with 19 out of 37 parts of the total construction
management system, and indirectly involved with 3 others. Most of them had to do with
work to be done in the field, manpower management and personnel management.
System development was a one-time effort. Its refinement must be continuous
but largely in short, annual increments. System management involves annual, weekly
and biweekly efforts: annual planning of work loads and manpower needs; weekly sched
uling of work assignments; biweekly evaluations of manpower utilization; and annual
evaluations of results.
Design and development of the system were complex undertakings, requiring nu
merous special reports for data collection and a wide variety of pilot runs. Management
of the system is relatively simple-simpler than the old way.
Responsibility has been delegated to the levels where decisions can best be made
where responses· to contractor actions can be immediate.
-74-
I
'

;--:: j;:
Appendix A
ACTIVITIES AGAINST WHICH PILOT PROJECTS CHARGED TIME
This list of 141 activities was used to identify the 33 that represent upwards of [..]
eighty percent of the work load. They are shown in rank order of man-hour charges. No
time was charged to three activities.
Percent of Cumulative Rank Activity Man-Hours Percent
Office engineering, excavation and embankment 12. 1 12. 1
2 Annual leaves 5.4 17.5
3 Final trim and cleanup inspection 3.8 21.3
4 Project inspection supervision 3.5 24.8
5 Office engineering, other reports 2.9 ·27 .7
6 Stake clay grades 2.8 30.1
7 Holidays 2.7 33.2
8 Stake I ine and grade 1 PCC surfacing 2.7 35.9
9 Density testing, embankments 2.7 38.6 10 Staking cross-sections and slopes 2.5 41.1 11 Concrete placement inspection, PCC surfacing 2.3 43.4 12 Office engineering, construction reports 2.3 45.7 13 Sick leaves 2.2 47.9 14 Excavation and embankment inspection 2. 1 50.0 15 Office eng ineeririg, structures 2. 1 52. 1 16 Slope inspections, shaping and grade 2. 1 54.2 17 Office engineering, documentation 1.9 56.1 18 Staking earthwork 1.9 58.0 19 Inspecting other grading operations 1.8 59.8 20 Office engineering, establish and maintain files 1.7 61.5 21 Stand-by, weather reasons 1.6 63.1
-75-
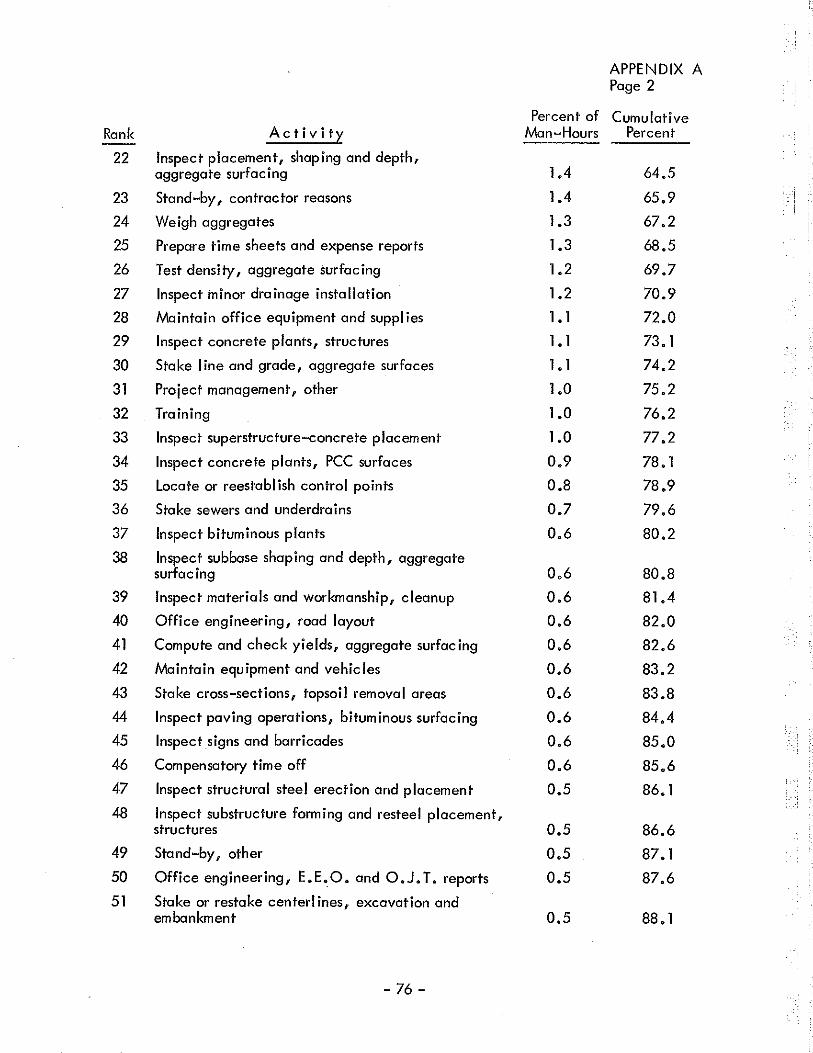
APPENDIX A Page 2
Percent of Cumulative Rank Activity Man-Hours Percent
22 Inspect placement, shaping and depth, aggregate surfacing 1.4 64.5
23 Stand-by, contractor reasons 1.4 65.9 --1
24 Weigh aggregates 1.3 67.2
25 Prepare time sheets and expense reports 1.3 68.5
26 Test density, aggregate surfacing 1.2 69.7
27 Inspect in in or drain age insta II at ion 1.2 70.9
28 Maintain office equipment and supplies 1.1 72.0
29 Inspect concrete plants, structures 1.1 73. I
30 Stake line and grade, aggregate surfaces 1.1 74.2
31 Project management, other 1.0 75.2
32 Training I .0 76.2
33 Inspect superstructure-concrete placement 1.0 77.2
34 Inspect concrete plants, PCC surfaces 0.9 78. I
35 Locate or reestablish control points 0.8 78.9
36 Stake sewers and underdrains 0.7 79.6
37 Inspect bituminous plants 0.6 80.2
38 Inspect subbase shaping and depth, aggregate surfacing 0.6 80.8
39 Inspect materials and workmanship, cleanup 0.6 81.4
40 Office engineering, road layout 0.6 82.0
41 Compute and check yields, aggregate surfacing 0.6 82.6
42 Maintain equipment and vehicles 0.6 83.2
43 Stake cross-sections, topsoil removal areas 0.6 83.8
44 Inspect paving operations, bituminous surfacing 0.6 84.4
45 Inspect signs and barricades 0.6 85.0
46 Compensatory time off 0.6 85.6
47 Inspect structural steel erection and placement 0.5 86. I
48 Inspect substructure forming and resteel placement, structures 0.5 86.6
49 Stand-by, other 0.5 87 .I
50 Office engineering, E.E.O. and O.J. T. reports 0.5 87.6
51 Stake or restake center! ines, excavation and embankment 0.5 88.1
-76-

APPENDIX A Page 3
I I Percent of Cumulative
Rank Activity Man-Hours Percent
52 Stake fences 0,5 88.6
,-:--' 53 Stake substructure lines and establish grades 0.5 89.1
i. 1 54 Stake guardrails 0.4 89.5
55 Inspect forms, materials and equipment, concrete surfacing 0.4 89.9
56 Take fino I measurements, concrete surfacing 0.4 90.3
57 Contractor relations 0.4 90.7
58 Inspect slope protection, structures 0.4 91.1
59 Test density, structures 0.4 91.5
60 Test density, minor drainage structures 0.4 91.9
61 Inspect substructure-concrete placement 0.4 92.3
62 lnspec t topsoil, grading 0.3 92.6
63 Office engineering, aggregate surfacing 0.3 92.9
64 Office engineering, clearing, grubbing and tree removal 0.3 93.2
65 Travel time 0.3 93.5
66 Office engineering, concrete surfacing 0.3 93.8
67 Stake cuI verts 0.3 94.1
68 Office engineering, drainage structures 0.3 94.4
69 Supervise project surveys 0.3 94.7
70 Stake curbs and gutters 0.3 95.0
71 Check grade preparations and conditions, bituminous surfacing 0.3 95.3
72 Check grades, concrete surfacing 0.3 95,6
73 Personnel management and training 0.2 95.8
74 Staking, miscellaneous roadway layouts 0.2 96.0
75 Inspect project cleanup, structures 0.2 96.2
76 Take beam elevations and lay out lines and grades, structure decks 0.2 96.4
77 Stake bridge layouts 0.2 96.6
78 Inspect major drainage structures 0.2 96.8
79 Conduct gradation analyses 0.2 97.0
80 Inspect demolitions and removals 0.2 97.2
81 Inspect detours and temporary roads 0.2 97.4
-77-

APPENDIX A Page 4
Percent of Cumulative Rank Activity Man-Hours Percent
82 Take final measurements, right-of-way fence o. 1 97.5
83 Office engineering, bituminous surfacing o. 1 97.6
84 Stake for final measurements, culverts and drainage o. 1 97.7
85 Consult and assist other projects, divisions or personnel o. 1 97.8
86 Stake or restake center! ines, road layouts o. 1 97.9
87 Stake culverts and drainage, other 0.1 98.0
88 Office engineering, cleanup 0. 1 98.1
89 Office engineering, traffic maintenance o. 1 98.2
90 Inspect piling operations, structures o. 1 98.3
91 Coordinate with other divisions o. 1 98.4
92 Leave without pay o. 1 98.5
93 Stake miscellaneous bridge layouts o. 1 98.6
94 Stake sign locations o. 1 98.7
95 Stake other structure o. 1 98.8
96 Stake to establish reference points or lines, bridges o. 1 98.9
97 Inspect utilities relocations 0.1 99.0
98 Public relations o. 1 99.1
99 Stake rights-of-way, road layouts o. 1 99.2
100 Other paid leave o. 1 99.3
101 Stake traffic controls 0.1 99.4
102 Office engineering, bridge layout o. 1 99.5
103 Conduct gradation analyses, minor drainage structures o. 1 99.6
104 Inspect protective treatments, structures o. 1 99.7
105 Control density, major drainage structures o. 1 99.8
106 Stake lines, bituminous surfacing o. 1 99.9
107 Inspect lighting, traffic maintenance o. 1 100.0
108 Stake sewage facility locations, rest areas
109 Conduct gradation analyses, structures
110 Stake rest areas
111 Inspect excavation, structures
112 Office engineering, rest areas
113 Test density, utilities relocation
- 78-
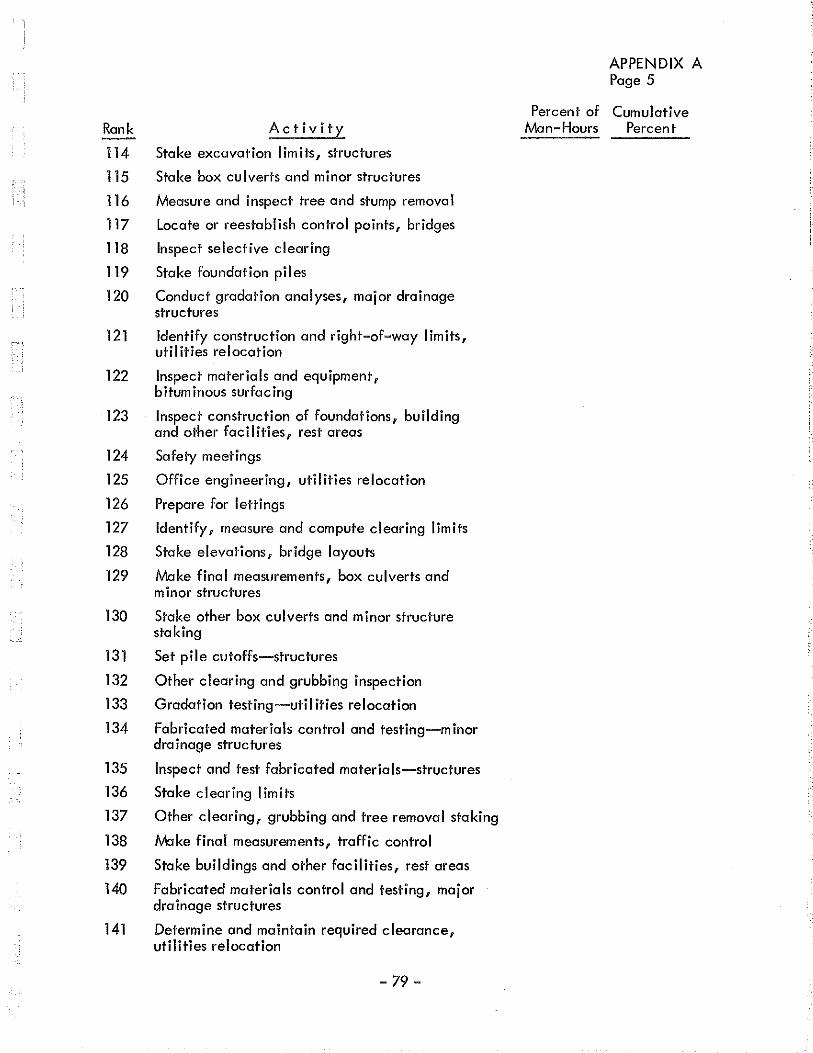
Rank
114 115 116 117 118 119 120
121
122
123
124 125
126 127 128
129
130
131
132 133 134
135 136 137
138 139 140
141
Activity
Stake excavation limits, structures
Stake box culverts and minor structures
Measure and inspect tree and stump removal
Locate or reestablish control points, bridges
Inspect selective clearing
Stake foundation piles
Conduct gradation analyses, major drainage structures
Identify construction and right-of-way limits, utilities relocation
Inspect materials and equipment, bituminous surfacing
Inspect construction of foundations, building and other facilities, rest areas
Safety meetings
Office engineering, utilities relocation
Prepare for lettings
Identify, measure and compute clearing limits
Stake elevations, bridge layouts
Make final measurements, box culverts and min or structures
Stake other box culverts and minor structure staking
Set pile cutoffs-structures
Other clearing and grubbing inspection
Gradation testing-uti I ities relocation
Fabricated materials control and testing-minor drainage structures
Inspect and test fabricated materials-structures
Stake clearing limits
Other clearing, grubbing and tree removal staking
Make final measurements, traffic control
St·ake buildings and other facilities, rest areas
Fabricated materials control and testing, major drainage structures
Determine and maintain required clearance, utilities relocation
-79-
APPENDIX A Page 5
Percent of Cumulative Man-Hours Percent

Appendix B
ABILITY-STATEMENT TITLES
Genera I Knowledge and Abi! ity Statements
Statement Number
2
3
4
5
6
7
8
9
10
11
12
13
14
15
16
17
18
Statement Title
Orientation:
Department orientation
Construction orientation
Contractor orientation
Property owner orientation
Reading, Documentation and Interpretation:
Terminology and nomenclature
Source documents and manua Is
Contract plan reading
Project documentation and sketches
Communications I
Construction drafting
Mathematics:
Mathematics I
Mathematics II
Mathematics Ill
Mathematics IV
Mathematics V
Survey:
Survey I
Survey II
Survey Ill
- 81 -
TRANSPORTATION liBRARY MICHIGM~ tlEf'T. STATE HIGHWAYS & TRANSPORTATION LANSING, MICH.

Statement Number
19
20
21
22
23
24
25
26
Statement Title
Management:
Communications II
Communications Ill
On-site training
Formal training
Project safety
Supervision
Project management
Residency management
APPENDIX B Page 2
Specific Ability Statements
27
28
29
30
31
32
33
34
35 36
37
38
39
40
41
42
43
44
Utilities, clearing and grubbing:
Utilities relocation inspection
Clearing, grubbing and tree removal inspection
Selective clearing inspection
Excavation and embankment:
Swamp excavation and backfill inspection
Topsoil removal inspection
Excavation and embankment inspection
Culverts, sewers and drainage structures inspection
Aggregate construction:
Borrow area inspection
Aggregate yield inspection
Aggregate shaping, placing and compacting inspection
Surfacing:
Fine grading inspection
Priming and sealing inspection
Bituminous paving inspection
Portland concrete forming inspection
Load transfer devices and steel placement inspection
Portland concrete paving inspection
Portland concrete joints and sealing inspection
Portland concrete finishing inspection
- 82-
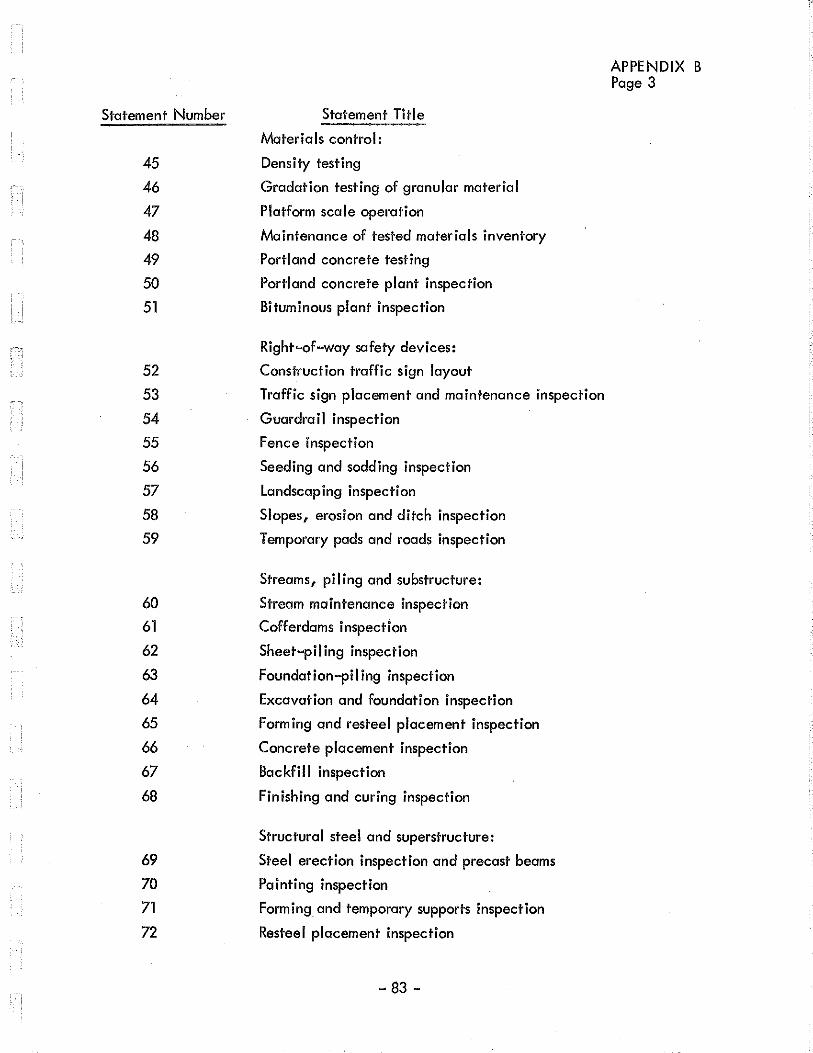
i ! ,_ i
Statement Number
45
46
47 48
49
50
51
52 53
54
55
56
57
58 59
60 61
62
63
64
65
66
67
68
69 70
71
72
Statement Title
Materials control:
Density testing
Gradation testing of granular material
Platform scale operation
Maintenance of tested materials inventory
Portland concrete testing
Portland concrete plant inspection
Bituminous plant inspection
Right-of-way safety devices:
Construction traffic sign layout
Traffic sign placement and maintenance inspection
Guardrail inspection
Fence inspection
Seeding and sodding inspection
Landscaping inspection
Slopes, erosion and ditch inspection
Temporary pads and roads inspection
Streams, piling and substructure:
Stream maintenance inspection
Cofferdams inspection
Sheet-piling inspection
Foundation-pi! ing inspection
Excavation and foundation inspection
Forming and resteel placement inspection
Concrete placement inspection
Backfill inspection
Finishing and curing inspection
Structural steel and superstructure:
Steel erection inspection and precast beams
Painting inspection
Forming and temporary supports inspection
Resteel placement inspection
-83-
APPENDIX B Page 3
Statement Number
73
74
75
76
77
78
Statement Title
Concrete placement inspection
Finishing and curing inspection
Rest areas:
Water well inspection
Sewage facilities inspection
Site preparation inspection
Buildings inspection
-84-
APPENDIX B Page 4

Appendix C
PERSONNEL CLASS SPECIFICATIONS
Transportation Construction Technician I
Classification Description
Transportation Construction Technicians I perform basic inspection, surveying and
office work. This is the beginning-level classification.
Work performed will normally be at the basic and intermediate levels of difficulty.
Employees in this class exercise their basic capabilities in field construction activities as
assigned.
Minimum Qualifications and Requirements
Persons classified as Transportation Construction Technicians I will meet there
quirements identified below. They will:
1. be. able to read, write and speak the English language;
2. be 18 years of age, or be a high school graduate;
3, be able to make basic mathematical calculations including adding, sub
tracting, multiplying and dividing whole, fractional and decimal numbers,
and to apply recognized rules of rounding and rules of logic to arithmetic
progressions;
- 85-

APPENDIX C Page 2
4. be able and willing to work irregular hours, work outdoors and move about
the Stole as required by the work; and
5. possess a valid Michigan driver's license.
-86-
-, ~·
' . \

Transportation Construction Technician II
Classification Description
APPENDIX C Page 3
Transportation Construction Technicians II perform assigned inspection, surveying
and office work elements. Assignments normally represent basic, intermediate and jour
neyman levels of difficulty.
Minimum Qualifications and Requirements
Employees assigned to this class must have been employed as Transportation Con
struction Technicians I for at least six months, be recommended by their supervisors, and
meet the performance requirements listed belowo
1 o They must have demonstrated their abilities to:
8 test gradation;
ED serve as a beginning-level rodman; and
8 reduce and check field-book notes.
2. They must have demonstrated ability to do at least four of the following
tasks:
8 weigh materials (platform scales);
e inspect protective treatments (structures);
8 inspect structure painting;
011 inspect fence construction;
e inspect portland concrete joints (pre-pour), dowels (spacing, level,
coating) and resteel placements;
e inspect subbase shaping and depth of aggregate surfacing;
e inspect tree and stump removal;
e plot cross sections; and
e check weigh tickets and sheets.
- 87-

Transportation Construction Technician Ill
Classification Description
APPENDIX C Page 4
Transportation Construction Technicians Ill perform journeyman-level inspection,
surveying and office functions. They also work at the basic and intermediate levels of
difficulty as required.
Minimum Qualifications and Requirements
Persons assigned to this class must have qualified as Transportation Construction
Technicians II, be recommended for this class by their supervisors, and meet the perfor
mance requirements listed below.
1. They must have demonstrated their abilities to perform effectively the fol
lowing key tasks:
o inspect minor drainage structures;
1111 test concrete quality control-air, slump and temperature;
111 inspect placement and shaping of aggregate surfacing;
• test density;
e compute areas and volumes; and
• rod and chain.
and one of the following:
e inspect grade preparation for bituminous paving; or
1111 inspect grade for PCC paving; forms for PCC paving; load transfer de
vices (after pour); sawing and sealing joints.
2, They must have demonstrated their abilities to do at least five of these tasks:
e inspect topsoil removal;
111 inspect structure cleanup and joints;
-88-

e inspect guardrail;
<~& inspect sodding;
e inspect detours and temporary roads;
e control and test fabricated materials for structures;
e inspect pile driving-production;
e inspect demolition or removal items;
e inspect selective clearing;
e inspect seeding, mulching and fertilizing;
e inspect erosion control;
111 identify construction and right-of-way I im its;
e inspect maintenance of traffic control devices;
APPENDIX C Page 5
111 inspect rest area materials-certifications, documentation and storage;
111 check equipment against shop drawings for proper type;
111 inspect final project cleanup after punch list;
e inspect landscaping; and
• inspect finishing and curing on PCC paving.
3. They must have demonstrated their abilities to perform as an instrumentman
on at least four of the following tasks:
make final measurements of traffic control devices, fencing, PCC
paving, drainage and minor structures, and aggregate surfacing;
e set pile cutoffs;
o stake fence from previously established control points;
011 stake guardrail;
e stake line for bituminous surfacing;
111 cross-section topsoil removal areas;
111 stake center! ine; and
e stake clearing limits.
4. They must have demonstrated their abilities to perform effectively at least
two of the following project office tasks:
e prepare volume sheets;
<~& check and post tested materials and post pay quantities;
- 89-

e prepare field books and sketches for clearing limits;
APPENDIX C Page 6
e review requirements for special programs and prepare reports such as
E,E.O. and O.J. T.; and
set up file systems within prescribed guidelines and maintain files and
records.
-90-

Transportation Construction Technician IV
Classification Description
APPENDIX C Page 7
Transportation Construction Technicians IV perform senior-level inspection, sur
veying and office functions.
Minimum Qualifications and Requirements
Persons are appointed to positions in this class only when vacant positions are
available.
To be considered for appointments to this class, individuals must be qualified as
Transportation Construction Technicians Ill, be recommended by their supervisors, and
meet the performance requirements I isted below.
1. They must have demonstrated their abilities to perform effectively the fol
lowing tasks:
inspect portland cement concrete plans and maintain materials quality
control;
e inspect bituminous surfacing;
e inspect bituminous plants and maintain materials quality control;
• prepare field books and sketches for minor drainage structures, struc
tures, earthwork and grades, and curb and gutter; and
compute and check aggregate surfacing.
and one of the following:
inspect substructure and parapet-wall concrete placement, substructure
and parapet-wall farming, and steel placement; or
inspect headwalls, box culverts, curbs, gutters, or major drainage
structures.
- 91 -

APPENDIX C Page 8
2. They must have demonstrated their abilities to perform effectively as an in
strumentman on the following surveying tasks:
e stake excavation and embankment grades;
o cross-section and slope stake; and
o stake rights-of-way for road layout.
and one of the following:
stake substructure lines and grades, foundation piles and structure
excavation limits; or
stake curbs and gutters, sewers, underdrains, pipe culverts, box cul
verts, and minor structures.
3. They must have demonstrated ability to perform effectively at least two of
the following tasks:
e identify, measure and compute clearing limits;
e inspect rest-area well location, development and testing;
o inspect utilities relocation;
o inspect rest-area sewage facilities;
e inspect structure I steel erection;
o inspect dewatering operations and cofferdams; and
o inspect temporary and placements of traffic control devices.
-92-
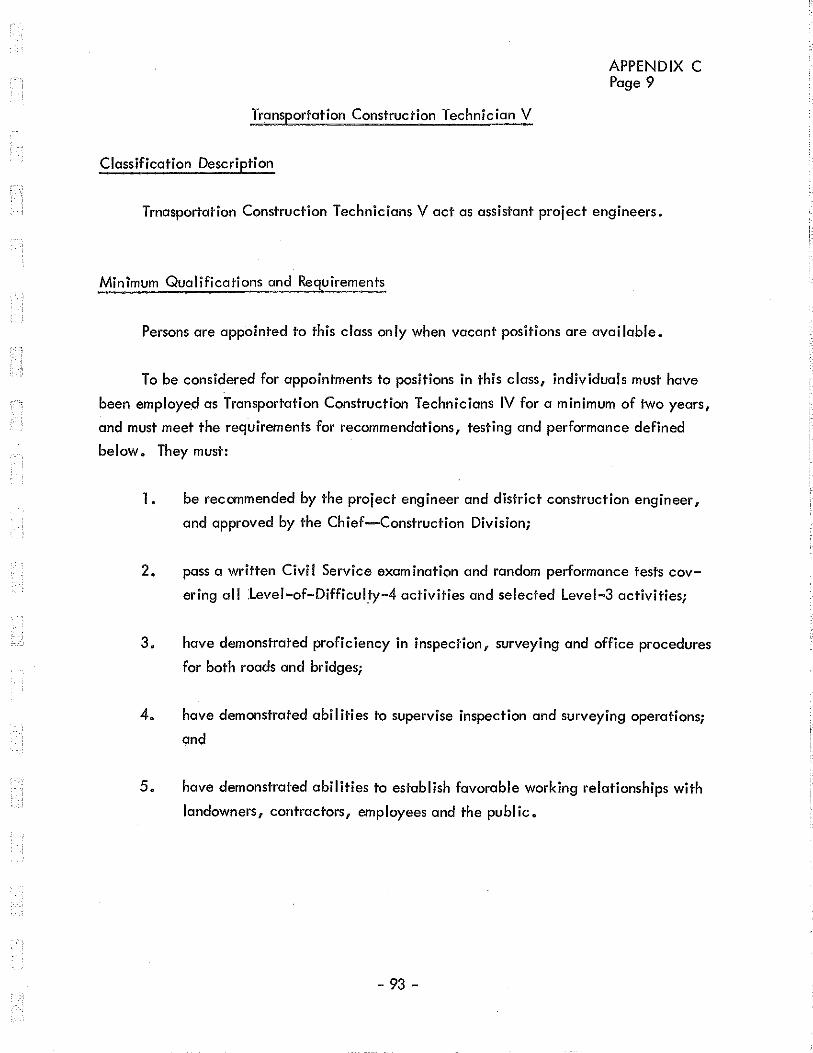
Transportation Construction Technician V
Classification Description
APPENDIX C Page 9
Trnasportation Construction Technicians V act as assistant project engineers.
Minimum Qualifications and Requirements
Persons are appointed to this class only when vacant positions are available.
To be considered for appointments to positions in this class, individuals must have
been employed as Transportation Construction Technicians IV for a minimum of two years,
and must meet the requirements for recommendations, testing and performance defined
below. They must:
1. be recommended by the project engineer and district construction engineer,
and approved by the Chief-Construction Division;
2. pass a written Civil Service examination and random performance tests cov
ering all :Level-of-Difficul_ty-4 activities and selected Level-3 activities;
3. have demonstrated proficiency in inspection, surveying and office procedures
for both roads and bridges;
4. have demonstrated abilities to supervise inspection and surveying operations;
and
5. have demonstrated abilities to establish favorable working relationships with
landowners, contractors, employees and the public.
- 93 -
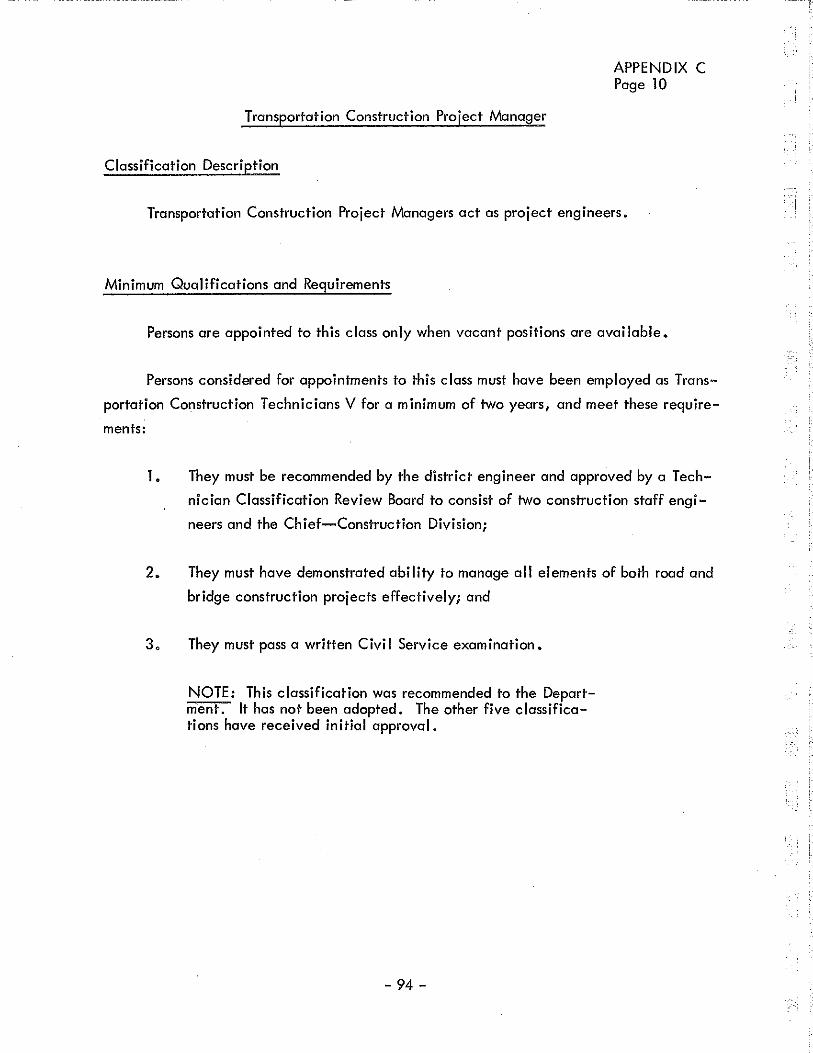
Transportation Construction Project Manager
Classification Description
APPENDIX C Page 10
Transportation Construction Project Managers act as project engineers.
Minimum Qualifications and Requirements
Persons are appointed to this class only when vacant positions are available.
Persons considered for appointments to this class must have been employed as Trans
portation Construction Technicians V for a minimum of two years, and meet these require
ments:
1. They must be recommended by the district engineer and approved by a Tech
nician Classification Review Board to consist of two construction staff engi
neers and the Chief-Construction Division;
2. They must have demonstrated ability to manage all elements of both road and
bridge construction projects effectively; and
3. They must pass a written Civil Service examination.
NOTE: This classification was recommended to the Department. It has not been adopted. The other five classifications have received initial approval.
-94-
---- .... L

Appendix D
TASKS RANKED BY LEVELS OF PERFORMANCE DIFFICULTY
In spec ti on:
2
3
4
5
6
7
8
Stoking:
9
Office Engineering:
10
11
12
Inspection:
13
14
Basic-Level-of-Difficulty Tasks
Test gradation
Weigh materials (platform scales)
Inspect protective treatments (structures)
Inspect structure painting
Inspect fence
Inspect portland concrete joints (pre-pour), dowels (spacing, level, coating) and resteel placements
Inspect subbase shaping and depth of aggregate surfacing
Inspect tree and stump removal
All beginning-level rodman tasks
Reduce and check field books
Plot cross sections
Check weigh tickets and sheets
Intermediate- Leve 1-of-Difficul ty Tasks
Inspect minor drainage structures
Test for concrete quality control-air, slump and temperature
- 95-

15
16
17
18
19
20
21
22
23
24
25
Inspect grade preparation for bituminous paving
APPENDIX D Page 2
Inspect laad transfer devices for portland cement concrete paving (after pour), sawing, sealing; grade for PCC paving; and forms for PCC paving
Inspect placement and shaping of aggregate surfacing
Test density
Inspect topsoil removal
Inspect structure cleanups and joints
Inspect guardrail
Inspect sodding
Inspect detours and temporary roads
Control and test fabricated materials for structures
Inspect pile driving (production)
26 Inspect demolition or removal items
27 Inspect selective clearing
28 Inspect seeding, mulching and fertilizing
29 Inspect erosion controls
30 Identify construction and right-of-way limits
31 Inspect maintenance of traffic control devices
32 Inspect rest-area materials-certification, documentation and storage; sheck equipment against shop drawings for proper types
33 Inspect final project cleanups after punch list
34 Inspect finishing and curing on PCC paving
Rodding and Chaining:
36 All rodman and chainman tasks
lnstrumentman Tasks:
37
38
39
40
41
42
Make final measurements of traffic control devices, fences, portland cement concrete paving, drainage and minor structures, and aggregate surfaces
Set pile cutoffs
Stake fence from previously established control points
Stake guardrails
Stake lines for bituminous surfacing
Cross-section topsoil removal areas
-96-
. i
' _-_-I
·:

43
44
Office Engineering:
45
46
47 48
49
50
Inspection:
51
52
53
54
55
56 57
58
59
60
61
62
lnstrumentman Work:
63
64
Stake centerlines
Stake clearing I im its
Compute areas and volumes
Prepare volume sheets
APPENDIX D Page 3
Check and post tested materials and post pay quanti ties
Prepare field books and sketches for clearing limits
Review requirements for special programs and prepare reports such as E. E • 0. and 0. J. T.
Set up file system within prescribed guidelines and maintain files and records
Journeyman-Leve !-of-Difficulty Tasks
Inspect substructure concrete placement, substructure forming and steel placement, parapet wa lis
Inspect headwalls, box culverts, curbs, gutters, major drainage structures
Inspect portland cement concrete plants and maintain materials quality control
Inspect bituminous surfacing
Inspect bituminous plants and maintain materials quality control
Identify, measure and compute clearing limits
Inspect rest-area well locations, development and testing
Inspect uti I ities relocations
Inspect rest-area sewage facilities
Inspect temporary and permanent traffic control signs and traffic control devices
Inspect structural steel erections
Inspect dewatering operations and cofferdams
Stake substructure lines and grades, foundation piles, structure excavation limits
Stake curbs and gutters
-97-

65
66
67
68
69
70
71
72
73
74 75
76
77
Office Engineering:
78
79
Inspection:
80
81
82
83
84
lnstrumentman Work:
85 86 87
88
Stake sewers and underdrains
Stake culverts, box culverts and minor structures
Stake excavation and embankment grades
Cross-section and stake slopes
Stake rights-of-way for road or bridge layout
Stake buildings and rest-area facilities
Stake sheet-pile layouts
Stake sign locations
APPENDIX D Page 4
'Stake lines and grades for portland cement concrete paving
Stake lines and grades for aggregate surfacing
Stake sewage facilities
Stake bridges for construction controls
Stake utility relocations
Prepare field-book data and sketches for minor drainage structures, structures, earthwork and grades, curbs and gutters, sewage facilities, utilities relocations and rest-area facilities
Compute and check aggregate surfacing
Senior-Level-of-Difficulty Tasks
Inspect foundations, buildings and related rest-area facilities
Inspect superstructure preparations and resteel placements, forming and concrete placements
Inspect portland cement concrete paving
Inspect grading
Inspect test-pile driving
Establish structure reference points and lines
Establish beam elevations
Lay out deck I ines and grades
Locate or reestablish control points for road or bridge layouts
- 98-

Office Engineering:
89
90 91
92
Supervision:
93
94 95 96
97
98
99
100 101
Project Management:
102
103
104 105
106
107 108 109 110
111
112
113
114
115
Compute and adjust deck grades
Determine final pay quantities
APPENDIX D Page 5
Prepare field books and sketches for horizontal and vertical control and right-of-way
Prepare construction reports-biweekly progress reports, estimates, recommendations, record of days charged
Staking crews
Inspection personnel
Office personnel
Scheduling
Controlling
Personnel, policies and procedures
Communications, written and oral
Reference sources and priorities
Chain of authority and responsibility
All types of construction projects
Limited project responsibility without direct supervision for short periods, or small jobs
Contractor relations
Public relations
Employee relations
Leadership and motivation
Landowner relations
All project documentation requirements
All project survey requirements
All project inspection requirements
All record system requirements
All field elements, construction management system
Problem-solving
Field-design evaluations and changes
- 99-

Appendix E
MANPOWER NEEDS WORK SHEET
The work sheet shown on the next page is used in estimating manpower needs on
each project, and then each group of projects supervised by one engineer. A summary
sheet is used for compiling district-wide and statewide needs,
Note that total man-months needed from start to finish on each project are shown
first, needs for the current year are detailed by month, and the balance to complete the
project in coming years is shown in the final column.
- 101 -

------ Starting Date:
26 Concrete plant for
OFFICE ENG
Planned Total
Project
ANNUAL STAFFING PLAN FOR ____ _
APPENDIX E Page 2
Prepared by:------Estimated Comp etion Date:______ Date: _____ _
Used to Date
Balance !Jan.! Feb. " ioec. Total
Balance to

Coordinators
Appendix F
DEPARTMENT OFFICIALS DIRECTLY ENGAGED
ON THE RESEARCH PROJECT
Project Coordinator: Gerald J. McCarthy
Field Project Coordinator: Roger Vander Meulen
Advisory Committee
Gerald J. McCarthy, Deputy Director-Highways, Chairman
lorry Beckon, Administrator-Computer Services Division
Thomas J. Clark, Manager-Management Methods Section
Max N. Clyde, Assistant Deputy Director-Highways
Robert J. Hamill, Personnel Manager
John G. Hautala, Chief-Bureau of Operations
Richard C. Mastin, District Engineer-Jackson
William A. Sawyer, Engineer of Construction
Robert R. Scraver, District Engineer-Jackson
Ralph Souchek, Manager-Systems Analysis Section
AI Steger, Area Engineer-Federal Highway Administration
Roger Vander Meulen, Assistant District Construction Engineer-Grand Rapids
- 103 -

Task-Force Committee
APPENDIX F Page 2
Roger Vander Meulen, Assistant District Construction Engineer-Grand Rapids,
Chairman
Gerald J. Casey, Assistant District Construction Engineer-Kalamazoo
William C. Gustafson, Construction Office Manager-Lansing
Clyde 0. Maylath, Resident Engineer-Districts 5 and 7
David W. Miller, Project Engineer-District 5
Noel Smith, Project Engineer-Metro
John VandenBerg, District Office Engineer-Grand Rapids
Robert A. Welke, Project Engineer-District 7
Construction Work Methods Improvement Committee
Gerald J. Casey, Constructi011 Staff Engineer, Chairman
Paul Baumgartner, District Materials Engineer-District 6
Dwight A. Bell, Design Supervising Engineer
Keith Ferguson, Highway Construction Superintendent-District 8
Noel Smith, Project Engineer-Metro District
Roger Vander Meulen, Assistant District Construction Engineer-Grand Rapids
Robert A. Welke, Project Engineer-District 7
"'
- 104-I
'