rs and gis
TRANSCRIPT
IMAGE ENHANCEMENT
Er. Prem Ranjan M.Tech.(SWE)
Roll No.- 01/SWE/2015
OverviewIntroductionImage enhancement
Contrast enhancement Linear contrast stretching Non Linear contrast stretching

Image EnhancementDefinition: It is the process of improving the
visual quality of the image by manipulating the gray levels of the pixels for a specific application.
Processing of image to bring out specific features of an image.
Highlight certain characteristics of image.

Contrast Enhancement Contrast is the difference in colour that makes an object (or its
representation in an image or display) distinguishable.
Contrast enhancement or stretching : Stretching the gray levels in an image to increase the contrast between the features.
Used to increase the dynamic range of gray levels in the image
Example:Number of gray levels possible in an 8-bit system = 256 (0 to 255).The image pixel values are stretched to use the entire gray level range i.e. from
0 to 255.

Contrast Enhancement
1. Linear Contrast Enhancement
2. Non-Linear Contrast Enhancement
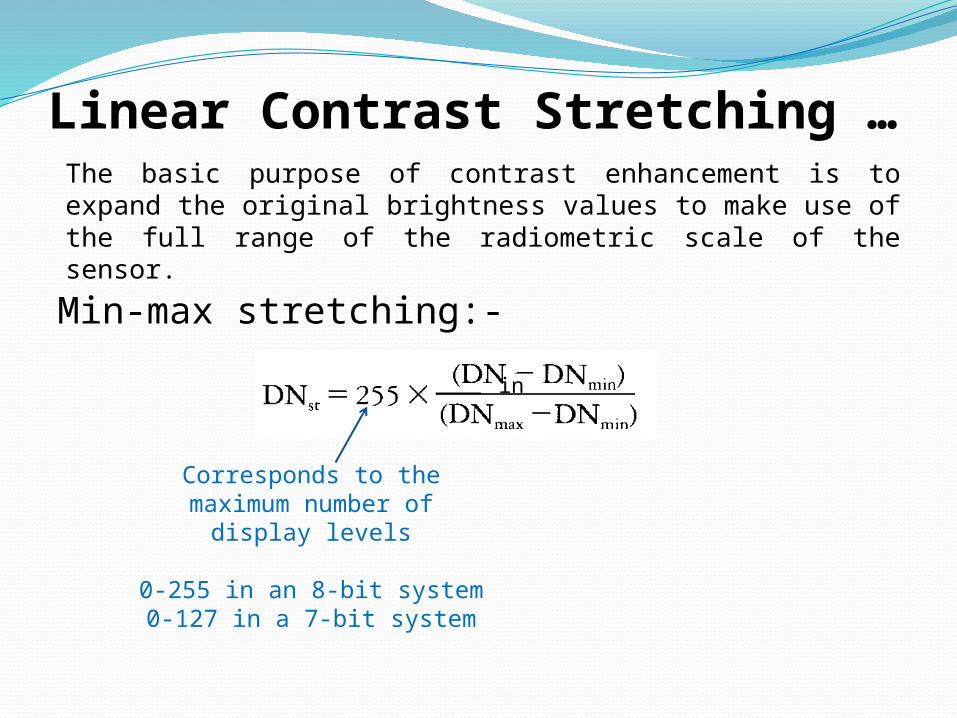
Linear Contrast Stretching …
Min-max stretching:-
Corresponds to the maximum number of display
levels
0-255 in an 8-bit system0-127 in a 7-bit system
in
The basic purpose of contrast enhancement is to expand the original brightness values to make use of the full range of the radiometric scale of the sensor.

Landsat TM Band-5 image and Histogram
Displayed in an 8-bit systemImage is vagueDN values range from 60-1580-59 and 159-255 are not utilized
DN values are stretched to 0-255Contrast is improvedLight tones appear lighterDark tones appear darker
Linearly stretched Landsat TM Band-5 image and Histogram
Linear Contrast Stretching…

Non-linear Contrast StretchingDN values are not stretched linearly to
uniformly occupy the entire display range.Histogram-equalized stretch
Piece-wise linear stretch
Logarithmic, Power law or Gaussian stretch

Histogram-Equalized Stretch Image Histogram a graphical representation of the brightness value that
comprise an image. The brightness value are displayed along x-axis and frequency of occurrence of each these values on y-axis of the graph.
DN values are enhanced based on their frequency in the original image
DN values corresponding to the peaks of the histogram are assigned to a wider range
More display levels to the higher frequency region gives better information enhancement
Original histogram Adjusted histogramTransformation

Histogram-Equalized Stretch… DN values are enhanced based on their frequency in the original
image
Example: Enhancement in an 8-bit display system
k
j
jst N
nDN
0
255
DNst = Enhanced DN valuenj = Number of pixels having DN values in the jth range, in the input imagek = Maximum number of DN ranges in the input imageN = Total number of pixels in the input image
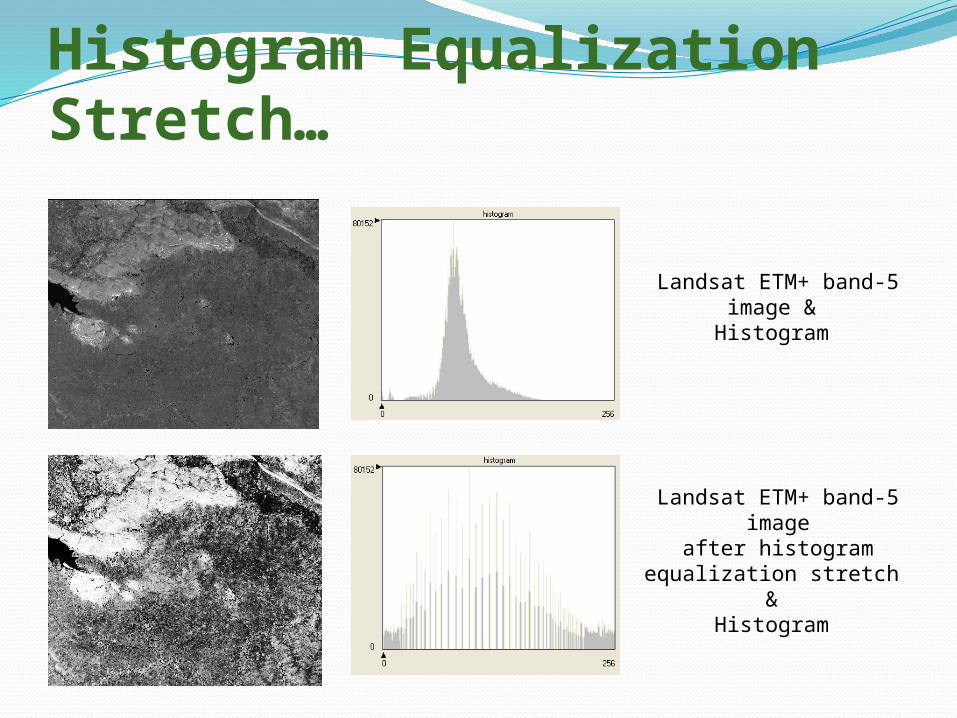
Histogram Equalization Stretch…
Landsat ETM+ band-5 image &
Histogram
Landsat ETM+ band-5 image
after histogram equalization stretch
& Histogram
Most of the image enhancement procedures are subjective, due to which a procedure well suited to one application or one user, may not be suitable to another application for another user.
“ One man’s enhancement is another man’s noise.”

Thank You!!!